Embed Size (px)
Citation preview

Bayesian Re-analysis of the Challenger O-ring Data
by
Coire J. Maranzano
The Johns Hopkins University
Applied Physics Laboratory
11100 Johns Hopkins Rd
Laurel, Maryland 20723-6099, USA
and
Roman Krzysztofowicz
University of Virginia
Department of Systems Engineering and Department of Statistics
P.O. Box 400747
Charlottesville, Virginia 22904—4747, USA
Research Paper RK—0501
http://www.faculty.virginia.edu/rk/
June 2005
Revised June 2006, March 2007, November 2007, March 2008
Published in Risk Analysis, 28(4), 1053—1067, 2008

2
ABSTRACT
A Bayesian forecasting model is developed to quantify uncertainty about the postflight
state of a field-joint primary O-ring (not damaged or damaged), given the O-ring temperature
at the time of launch of the space shuttle Challenger in 1986. The crux of this problem is the
enormous extrapolation that must be performed: 23 previous shuttle flights were launched
at temperatures between 53 ◦F and 81 ◦F, but the next launch is planned at 31 ◦F. The
fundamental advantage of the Bayesian model is its theoretic structure, which remains correct
over the entire sample space of the predictor and which affords flexibility of implementation.
A novel approach to extrapolating the input elements based on expert judgment is presented;
it recognizes that extrapolation is equivalent to changing the conditioning of the model
elements. The prior probability of O-ring damage can be assessed subjectively by experts
following a nominal-interacting process in a group setting. The Bayesian model can output
several posterior probabilities of O-ring damage, each conditional on the given temperature
and on a different strength of the temperature effect hypothesis. A lower bound on, or
a value of, the posterior probability can be selected for decision making consistently with
expert judgment, which encapsulates engineering information, knowledge, and experience.
The Bayesian forecasting model is posed as a replacement for the logistic regression and
the nonparametric approach advocated in earlier analyses of the Challenger O-ring data. A
comparison demonstrates the inherent deficiency of the generalized linear models for risk
analyses that require (i) forecasting an event conditional on a predictor value outside the
sampling interval, and (ii) combining empirical evidence with expert judgment.
KEY WORDS: Bayesian forecasting; Subjective probability; Subjective extrapolation; Lo-
gistic regression; O-rings; Risk analysis; Failure probability.

3
TABLE OF CONTENTS
ABSTRACT . . . . . . . . . . . . . . . . . . . . . . . . . . . . . . . . . . . . . . . . . . . . . . . . . . . . . . . . . . . . . . . . . . . . . . . 2
1. INTRODUCTION . . . . . . . . . . . . . . . . . . . . . . . . . . . . . . . . . . . . . . . . . . . . . . . . . . . . . . . . . . . 5
2. BAYESIAN FORECASTING MODEL . . . . . . . . . . . . . . . . . . . . . . . . . . . . . . . . . . . . 8
2.1 Bayesian Approach . . . . . . . . . . . . . . . . . . . . . . . . . . . . . . . . . . . . . . . . . . . . . . . . . . . . . . . . . 8
2.2 Variates and Samples . . . . . . . . . . . . . . . . . . . . . . . . . . . . . . . . . . . . . . . . . . . . . . . . . . . . . . . 9
2.3 Prior Probability . . . . . . . . . . . . . . . . . . . . . . . . . . . . . . . . . . . . . . . . . . . . . . . . . . . . . . . . . . 10
2.4 Conditional Density Functions . . . . . . . . . . . . . . . . . . . . . . . . . . . . . . . . . . . . . . . . . . . . . 10
2.5 Posterior Probability . . . . . . . . . . . . . . . . . . . . . . . . . . . . . . . . . . . . . . . . . . . . . . . . . . . . . . 12
2.6 Informativeness of the Predictor . . . . . . . . . . . . . . . . . . . . . . . . . . . . . . . . . . . . . . . . . . . 13
2.7 Sensitivity Analyses . . . . . . . . . . . . . . . . . . . . . . . . . . . . . . . . . . . . . . . . . . . . . . . . . . . . . . . 14
2.8 Misapplication of Expert Judgment . . . . . . . . . . . . . . . . . . . . . . . . . . . . . . . . . . . . . . . . 16
3. COMPARISON OF APPROACHES . . . . . . . . . . . . . . . . . . . . . . . . . . . . . . . . . . . . . . 17
3.1 Generalized Linear Models . . . . . . . . . . . . . . . . . . . . . . . . . . . . . . . . . . . . . . . . . . . . . . . . .17
3.2 Comparison of the Structures . . . . . . . . . . . . . . . . . . . . . . . . . . . . . . . . . . . . . . . . . . . . . . 18
3.3 Comparison of the Forecasts . . . . . . . . . . . . . . . . . . . . . . . . . . . . . . . . . . . . . . . . . . . . . . . 20
4. BAYESIAN FORECAST VIA SUBJECTIVE EXTRAPOLATION . . . 22
4.1 Re-assessing Prior Probability . . . . . . . . . . . . . . . . . . . . . . . . . . . . . . . . . . . . . . . . . . . . . 22
4.2 Re-estimating Conditional Density Functions . . . . . . . . . . . . . . . . . . . . . . . . . . . . . . 25
4.3 Re-examining the Forecast . . . . . . . . . . . . . . . . . . . . . . . . . . . . . . . . . . . . . . . . . . . . . . . . . 27
5. COMPARISON OF PERSPECTIVES . . . . . . . . . . . . . . . . . . . . . . . . . . . . . . . . . . . . 29
5.1 Lower Bounds on the Forecast Probability . . . . . . . . . . . . . . . . . . . . . . . . . . . . . . . . . 29
5.2 Extreme Realizations . . . . . . . . . . . . . . . . . . . . . . . . . . . . . . . . . . . . . . . . . . . . . . . . . . . . . . 30
5.3 Subjective Assessments . . . . . . . . . . . . . . . . . . . . . . . . . . . . . . . . . . . . . . . . . . . . . . . . . . . . 31
6. CLOSURE . . . . . . . . . . . . . . . . . . . . . . . . . . . . . . . . . . . . . . . . . . . . . . . . . . . . . . . . . . . . . . . . . . . 32
6.1 Risk Assessment Paradigm. . . . . . . . . . . . . . . . . . . . . . . . . . . . . . . . . . . . . . . . . . . . . . . . .32
6.2 Bayesian Forecasting Model. . . . . . . . . . . . . . . . . . . . . . . . . . . . . . . . . . . . . . . . . . . . . . . .33
6.3 Extrapolation Problem . . . . . . . . . . . . . . . . . . . . . . . . . . . . . . . . . . . . . . . . . . . . . . . . . . . . 33

4
ACKNOWLEDGMENTS . . . . . . . . . . . . . . . . . . . . . . . . . . . . . . . . . . . . . . . . . . . . . . . . . . . . . . . 35REFERENCES . . . . . . . . . . . . . . . . . . . . . . . . . . . . . . . . . . . . . . . . . . . . . . . . . . . . . . . . . . . . . . . . . . 36TABLES . . . . . . . . . . . . . . . . . . . . . . . . . . . . . . . . . . . . . . . . . . . . . . . . . . . . . . . . . . . . . . . . . . . . . . . . . . 39FIGURES . . . . . . . . . . . . . . . . . . . . . . . . . . . . . . . . . . . . . . . . . . . . . . . . . . . . . . . . . . . . . . . . . . . . . . . . 42

5
1. INTRODUCTION
The Presidential Commission on the Space Shuttle Challenger Accident (1986) estab-
lished that the loss of the space shuttle Challenger on 28 January 1986 occurred because
"a combustion gas leak through the right Solid Rocket Motor aft field joint initiated at or
shortly after ignition eventually weakened and/or penetrated the External Tank initiating
vehicle structural breakup". Engineers at Morton Thiokol, the makers of the solid rocket
motors, and experts at the National Aeronautics and Space Administration (NASA) debated
the possibility of field-joint failure due to primary and secondary O-ring failure the night
before the ill-fated launch. The point of contention was the effect of the temperature at the
time of launch on the O-ring performance. The engineers were in disagreement about the
implication of data from 23 previous shuttle launches on the thermal distress to the field-joint
primary O-rings. Despite some objections, at the conclusion of their discussion the engineers
at Morton Thiokol transmitted a facsimile to NASA stating that "temperature data [are]
not conclusive on predicting primary O-ring blowby". On the morning of 28 January 1986
the estimated temperature of the primary O-rings on the Challenger solid rocket motors was
31 ◦F (−0.6 ◦C). This was 22 ◦F (12.2 ◦C) lower than the minimum temperature recorded
in all previous shuttle launches [◦C = (◦F − 32)5/9]. The Presidential Commission on the
Space Shuttle Challenger Accident (1986) found that "a careful analysis of the flight history
would have revealed the correlation of O-ring damage in low temperature".
The Challenger disaster has thus become a paradigm for improving risk analysis of the
space shuttle (Paté-Cornell and Dillon, 2001). In particular, Dalal et al. (1989) present a
procedure for assessing the probability of catastrophic failure at launch due to a failure of

6
at least one of the six field joints. A key input is the probability of primary O-ring damage,
conditional on the temperature at the time of launch. They calculate this probability at 31◦F
using logistic regression and, admitting uncertainty about the logistic regression parameter
estimates, they also construct a 90% bootstrap confidence interval around the calculated
probability. But as Lavine (1991) points out, this approach presumes that the logistic
regression is the correct model whereas, in fact, it is possible to fit the Challenger O-ring
data equally well using other model forms from the class of generalized linear models. He
shows that these other models provide vastly different probabilities of O-ring damage at 31
◦F. Dalal and Hoadley (1991) defend the generalized linear models by stating that a detailed
analysis should involve experts who would assign a probability to each of the possible models
and then combine the response probabilities.
Lavine (1991) correctly identifies the problem of determining the probability of O-ring
damage at 31 ◦F as an extrapolation problem. Assuming a monotone relation between
probability and temperature, he computes nonparametric bounds on the probability of O-
ring damage at 31 ◦F; these bounds give the interval [1/3,1]. Yet, his suggestion of using
the lower bound of 1/3 as the probability of O-ring damage at 31 ◦F in a risk assessment
falls short of providing a theoretically justified forecast. First, the proposed approach does
not extract all information from data and ignores expert judgment. Second, the proposed
lower bound on the probability underestimates the risk of the catastrophic failure.
When it is recognized that in order to solve this forecasting-extrapolation problem, the
empirical evidence from previous shuttle flights must be combined with subjective input
from experts, Bayesian approach is not only structurally optimal, but also practically ad-

7
vantageous. The purpose of this paper is to present a Bayesian forecasting model for the
probability of primary O-ring damage, conditional on the temperature at the time of launch,
and to compare that model with the generalized linear models and nonparametric approach
advocated in earlier risk analyses of the Challenger O-ring data.
In Section 2, the Bayesian forecasting model is developed; its elements (a prior proba-
bility and two conditional distribution functions) are estimated from O-ring data recorded
in 23 shuttle flights prior to the Challenger accident. A sensitivity analysis is performed on
the input elements. In Section 3, the Bayesian forecasting model and the logistic regression
model are compared in terms of their structures and forecasts. In Section 4, the subjective
extrapolation is presented, which is a novel approach born out of the recognition that ex-
trapolation in the sample space of the predictor is equivalent to changing the conditioning of
the model elements; methodologies are formulated for re-assessment of the prior probability
through expert judgment and re-estimation of the conditional distribution functions based
on a pre-posterior sample; Bayesian forecasts are made. In Section 5, the classical per-
spectives of previous studies on the estimation of a lower bound on the forecast probability,
qualification of data points as "extremes", and subjective assessment of engineering input
are re-examined from the Bayesian perspective.

8
2. BAYESIAN FORECASTING MODEL
2.1 Bayesian Approach
Bayesian decision theory provides a coherent framework for making decisions under un-
certainty. Derived from axioms, which constitute the principles of rationality and utilitarian
ethics (Harsanyi, 1978), the mathematical representation of a decision problem consists of (i)
a forecasting model, which quantifies uncertainty about a predictand – the variate whose
realization affects the decision outcome and is uncertain at the decision time, (ii) a utility
model, which quantifies the decision maker’s preferences on a set of possible outcomes, and
(iii) a decision procedure, which determines the optimal decision and the value of informa-
tion. This paper focuses on the development of a Bayesian forecasting model. The adjective
Bayesian connotes here a class of approaches established by engineers in connection with sig-
nal detection (e.g., Sage and Melsa, 1971) and sensor fusion (e.g., Hoballah and Varshney,
1989), by psychologists in connection with human information processing (e.g., Schum et
al., 1966), by statisticians in connection with uncertainty assessment and expert compari-
son (e.g., DeGroot, 1988), by operations researchers in connection with forecast combining
(e.g., Bordley, 1986), and by system scientists in connection with forecast processing for de-
cision making (e.g., Krzysztofowicz, 1983). These decision-oriented Bayesian approaches to
modeling “forecast uncertainty” differ from various inference-oriented Bayesian approaches,
pursued mainly by statisticians, which focus on assessing parameter, model, and sampling
uncertainties and which aim at solving statistical estimation or inference problems. Of
course, the comprehensive Bayesian approach would consider all types of uncertainty si-
multaneously. While a theoretic formulation is straightforward, a practical solution is not

9
due to complexity. Therefore, focusing the Bayesian approach on the dominant source of
uncertainty associated with a given decision problem is a reasonable trade-off – a proven
engineering way of coping with complexity.
2.2 Variates and Samples
After each shuttle flight, the primary O-ring at each of the six field joints on the two
solid rocket motors was inspected for damage. (See Dalal et al. (1989) for a schematic
of the field joint and the function of a primary O-ring.) Let W be the predictand – a
binary variate serving as an indicator of the post-flight state of the primary O-ring. For
each primary O-ring inspected, let W = 1 indicate the existence of damage, and W = 0
indicate no damage. A realization of W is denoted w, where w ∈ {0, 1}. Let X be the
predictor – a continuous variate whose realization x is used to forecast W. Here X denotes
the temperature at the time of launch, which is the sole predictor of W . The sample space
of X considered herein is an interval of temperature values relevant to the shuttle launch.
Postflight O-ring inspection records exist from 23 shuttle flights prior to the Challenger
launch. From these records, the joint sample {(x,w)} of 23 × 6 = 138 realizations is
extracted. Of the 138 realizations, nine indicate primary O-ring damage. (See Dalal et al.
(1989) for the primary O-ring thermal distress data and a discussion of independence.)
The Bayesian approach gathers prior information and then revises it based on information
extracted from the joint sample, via Bayes theorem, to obtain the posterior probability of
O-ring damage, W = 1, conditional on a realization of the temperature, X = x. In order
to apply Bayes theorem, it is necessary to assess the prior probability g and to model the
conditional density functions f0, f1; these tasks are separate and distinct.

10
2.3 Prior Probability
Let g = P (W = 1) denote the prior probability of O-ring damage. This probability could
have been assessed subjectively by the Morton Thiokol experts. An assessment methodology
which could have been used, and which offers insight into the interpretation of g, is presented
in Section 4.1. For the initial analysis, the prior probability is estimated from the joint
sample of 138 realizations. The relative frequency estimate of g is 9/138 = 0.0652.
2.4 Conditional Density Functions
Let fw denote the density function of the predictor X, conditional on the hypothesis that
the event is W = w (w = 0, 1). Let Fw denote the corresponding conditional distribution
function defined for all x by
Fw(x) = P (X ≤ x|W = w), w = 0, 1. (1)
Many approaches are available for modeling directly f0 and f1. The parametric approach
described below focuses on modeling F0 and F1 because the distribution functions are more
stable than the density functions (fw is a derivative of Fw), and the task of estimating and
selecting a model that fits best the data may be posed objectively and solved automatically.
The joint sample {(x,w)} is used to construct the empirical distribution functions of
the temperature at the time of launch X, conditional on the post-flight state of the O-ring
W = w (w = 0, 1). As can be seen in Figure 1, the two empirical conditional distribution
functions are separated and thereby imply a dependence between X and W . (The number
of O-rings damaged in each launch is plotted against the temperature in Figure 8.) Figure 1
reveals also an artifact of the sampling procedure: even though X is a continuous variate, its

11
empirical conditional distribution functions (especially F0) have steps because each shuttle
flight generates six independent realizations w at the same temperature x. Being an artifact,
the steps can be smoothed out through parametric modeling.
The conditional distribution functions F0, F1 are modeled parametrically. The parame-
ters are estimated using the appropriate subsample (129 realizations for F0 and 9 realizations
for F1). For each F0 and F1, a parametric distribution function is selected from a catalogue
including the exponential, Weibull, inverted Weibull, log-Weibull, log-logistic, kappa, and
Pareto distribution families. The best-fit distribution function is found by selecting the dis-
tribution family and the parameter values that minimize the maximum absolute difference
between the parametric distribution function and the empirical distribution function. The
conditional distribution functions F0, F1 are also subject to the logical constraint that the
likelihood ratio L(x) = f1(x)/f0(x) is a strictly decreasing function of x. This constraint
ensures that the posterior probability of O-ring damage (defined in Section 2.5) is a strictly
increasing function of x, as dictated by engineering knowledge. As a result of the constrained
optimization, the parametric model for F0 is log-Weibull, and the parametric model for F1
is Weibull. Figure 1 shows the estimated conditional distribution functions, F0 and F1, and
the estimates of the parameters; the parameters are defined below.
The corresponding conditional density functions, f0 and f1, are plotted in Figure 2. The
parametric model for f0 is log-Weibull
f0(x) =β0
α0(1− x− η0)
µln(1− x− η0)
α0
¶β0−1exp
"−µln(1− x− η0)
α0
¶β0#, x < η0;
(2)
and the parametric model for f1 is Weibull

12
f1(x) =β1α1
µ−x− η1
α1
¶β1−1exp
"−µ−x− η1
α1
¶β1#, x < η1; (3)
where αw is the scale parameter (αw > 0), βw is the shape parameter (βw > 0), and ηw is the
shift parameter (−∞ < ηw < ∞). The shift parameter is the upper bound of the sample
space; thus −∞ < x < ηw.
At the time of forecasting, the decision maker knows the realization of the temperature
X = x and calculates the likelihood fw(x) of the O-ring state W = w for w = 0, 1. Thus
(f0, f1) constitutes the family of likelihood functions, which encapsulates the informativeness
of the predictor X for forecasting the predictandW. The informativeness of the predictor X
may be visualized by judging the degree of separation between the two conditional density
functions f0, f1 (see Figure 2); loosely speaking, the informativeness increases with the degree
of separation between f0 and f1.
2.5 Posterior Probability
The posterior probability π = P (W = 1|X = x) of O-ring damage, W = 1, conditional
on the temperature at the time of launch, X = x, comes from Bayes theorem
π =f1(x)g
f1(x)g + f0(x)(1− g). (4)
Equation (4) can also be written in terms of (1− g)/g, the prior odds against event W = 1,
and f0(x)/f1(x), the likelihood ratio against event W = 1:
π =
∙1 +
1− g
g
f0(x)
f1(x)
¸−1. (5)
The posterior probability π quantifies the updated uncertainty about the realization of the
predictand W, conditional on the realization of the predictor X = x.
13
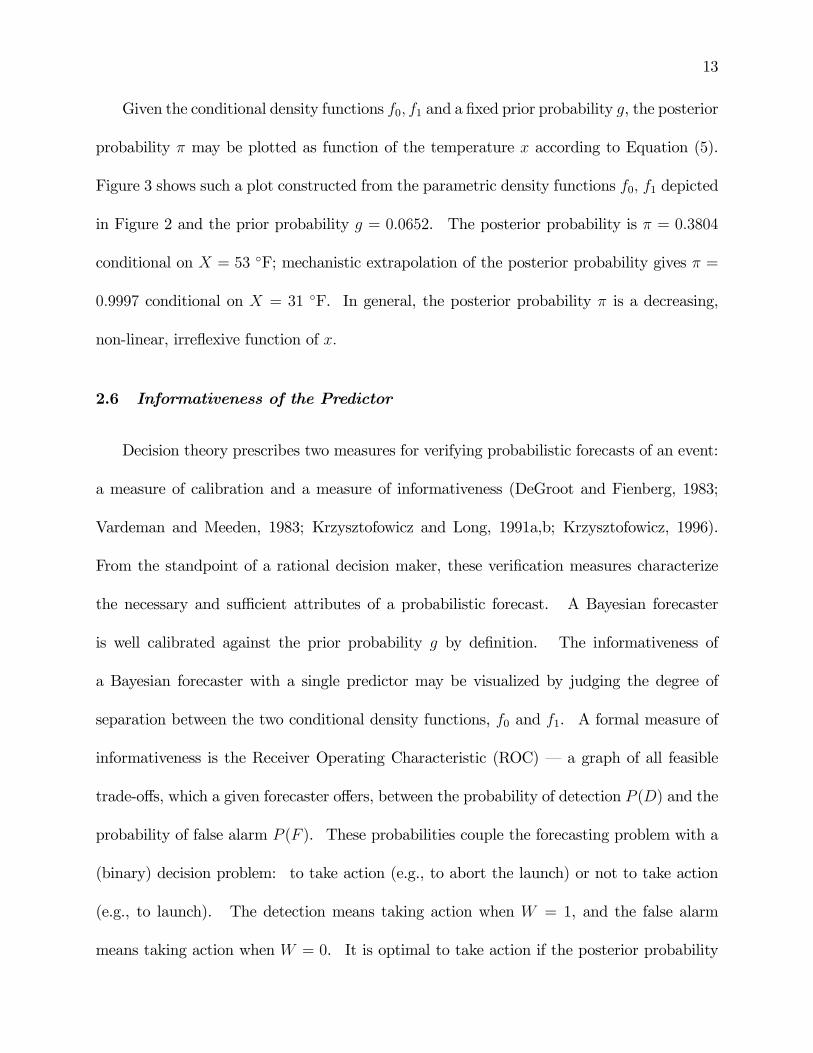
Given the conditional density functions f0, f1 and a fixed prior probability g, the posterior
probability π may be plotted as function of the temperature x according to Equation (5).
Figure 3 shows such a plot constructed from the parametric density functions f0, f1 depicted
in Figure 2 and the prior probability g = 0.0652. The posterior probability is π = 0.3804
conditional on X = 53 ◦F; mechanistic extrapolation of the posterior probability gives π =
0.9997 conditional on X = 31 ◦F. In general, the posterior probability π is a decreasing,
non-linear, irreflexive function of x.
2.6 Informativeness of the Predictor
Decision theory prescribes two measures for verifying probabilistic forecasts of an event:
a measure of calibration and a measure of informativeness (DeGroot and Fienberg, 1983;
Vardeman and Meeden, 1983; Krzysztofowicz and Long, 1991a,b; Krzysztofowicz, 1996).
From the standpoint of a rational decision maker, these verification measures characterize
the necessary and sufficient attributes of a probabilistic forecast. A Bayesian forecaster
is well calibrated against the prior probability g by definition. The informativeness of
a Bayesian forecaster with a single predictor may be visualized by judging the degree of
separation between the two conditional density functions, f0 and f1. A formal measure of
informativeness is the Receiver Operating Characteristic (ROC) – a graph of all feasible
trade-offs, which a given forecaster offers, between the probability of detection P (D) and the
probability of false alarm P (F ). These probabilities couple the forecasting problem with a
(binary) decision problem: to take action (e.g., to abort the launch) or not to take action
(e.g., to launch). The detection means taking action when W = 1, and the false alarm
means taking action when W = 0. It is optimal to take action if the posterior probability
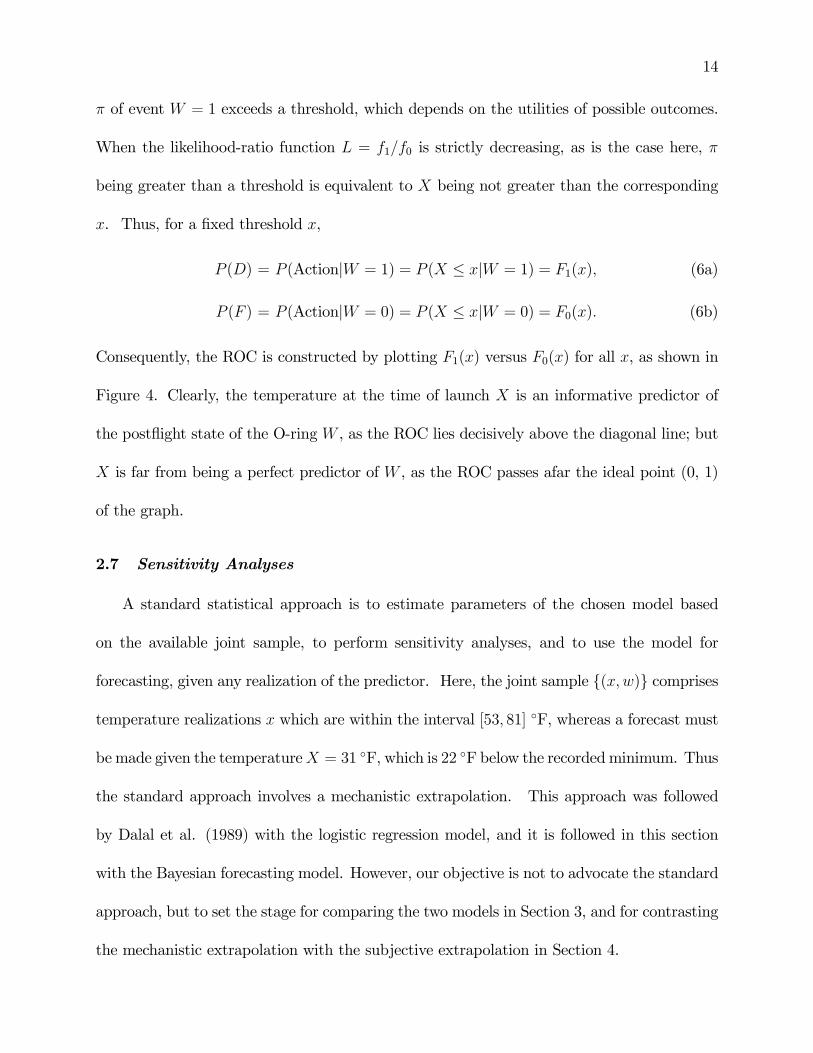
14
π of event W = 1 exceeds a threshold, which depends on the utilities of possible outcomes.
When the likelihood-ratio function L = f1/f0 is strictly decreasing, as is the case here, π
being greater than a threshold is equivalent to X being not greater than the corresponding
x. Thus, for a fixed threshold x,
P (D) = P (Action|W = 1) = P (X ≤ x|W = 1) = F1(x), (6a)
P (F ) = P (Action|W = 0) = P (X ≤ x|W = 0) = F0(x). (6b)
Consequently, the ROC is constructed by plotting F1(x) versus F0(x) for all x, as shown in
Figure 4. Clearly, the temperature at the time of launch X is an informative predictor of
the postflight state of the O-ring W , as the ROC lies decisively above the diagonal line; but
X is far from being a perfect predictor of W , as the ROC passes afar the ideal point (0, 1)
of the graph.
2.7 Sensitivity Analyses
A standard statistical approach is to estimate parameters of the chosen model based
on the available joint sample, to perform sensitivity analyses, and to use the model for
forecasting, given any realization of the predictor. Here, the joint sample {(x,w)} comprises
temperature realizations x which are within the interval [53, 81] ◦F, whereas a forecast must
be made given the temperatureX = 31 ◦F, which is 22 ◦F below the recordedminimum. Thus
the standard approach involves a mechanistic extrapolation. This approach was followed
by Dalal et al. (1989) with the logistic regression model, and it is followed in this section
with the Bayesian forecasting model. However, our objective is not to advocate the standard
approach, but to set the stage for comparing the two models in Section 3, and for contrasting
the mechanistic extrapolation with the subjective extrapolation in Section 4.

15
By perturbing the prior probability g and re-calculating the posterior probability π, the
analyst can examine the sensitivity of the forecast at any temperature X = x to the prior
uncertainty. Herein, π is re-calculated using four different values of g, while retaining f0, f1
shown in Figure 2. Table I reports the values of g and the values of π, conditional on
X = 53 ◦F or X = 31 ◦F. Figure 5 shows the plot of π versus x for each value of g. At 53
◦F, the lowest temperature recorded in all previous launches (and the minimum temperature
recommended for launch of the Challenger by some Morton Thiokol engineers), the posterior
probability π is very sensitive to the prior probability g. At 31◦F, the posterior probability
π is essentially insensitive to the prior probability g.
To determine the posterior probability π at temperature 31 ◦F, requires an extrapola-
tion of the conditional distribution functions F0, F1 below the lowest recorded temperature.
Because the subsample {(1, x)} is much smaller than the subsample {(0, x)}, the estimate of
F1 is of primary concern. Figure 1 reveals that the objectively estimated parametric model
for F1 passes through the uppermost point on the empirical distribution function at 53 ◦F.
The analyst might worry that the left tail of F1 is too heavy and thus inflates the posterior
probability of O-ring damage at 31 ◦F. Therefore, a sensitivity analysis is performed using
two alternative parametric models for the left tail of F1. The models are shown in Figure
6 with their parameter values. Table II reports the values of the posterior probability π,
conditional on X = 53 ◦F or X = 31 ◦F, calculated from each of the three extrapolations of
the left tail of F1 and the prior probability g = 0.0652. Figure 3 compares the three plots
of π versus x. The main conclusion is that, given the prior probability g = 0.0652, each of
the three parametric models for the left tail of F1 yields a posterior probability π between

16
0.33 and 0.38 at 53 ◦F and between 0.95 and 1.0 at 31 ◦F.
2.8 Misapplication of Expert Judgment
On the eve of the Challenger launch, the Morton Thiokol experts tried to assess, directly
and wholistically, the effect of temperature on O-ring performance. Their reasoning followed
the standard statistics approach (as epitomized by regression), which trains the expert’s mind
on the dependence of the predictand W on the predictor X. The approach was derailed by
two mistakes, one leading to the next. First, the display of data (with axes like those in
Figure 8) excluded the sixteen points having ordinates zero. Second, the U configuration of
the seven points having ordinates one or two led to the wrong inference that "temperature
data [are] not conclusive on predicting" the O-ring damage.
In a sense, the experts tried to perform subjectively the inferential task that within
the Bayesian forecasting model is performed objectively by constructing the conditional
distribution functions F0, F1. The correct display of data (like Figure 1) makes it immediately
apparent that X is informative for predicting W . The graph of the ROC (like Figure 4)
provides a formal confirmation.
Thus when data are analyzed with the participation of experts, as was the case on
the eve of the Challenger launch, Bayesian reasoning offers unique advantages. It trains
the expert’s mind on the two distribution functions of temperature, conditional on every
possible state of O-ring, so that no part of the data can be ignored. It frames the task
of diagnosing the temperature effect clearly and simply: judge the separation of the two
conditional distribution functions.

17
3. COMPARISON OF APPROACHES
A comparison between the Bayesian forecasting model and the logistic regression model
is presented next. It highlights the flexibility of the Bayesian approach and identifies fun-
damental deficiencies of the generalized linear models.
3.1 Generalized Linear Models
The first-order generalized linear model for a binary response to a single predictor rests
on the assumption that the response probability ψ and the realization of a predictor x are
related through the equation
k(ψ) = b0 + xb1, (7)
where b0 and b1 are coefficients and k is a link function (McCullagh and Nelder, 1989). The
link function transforms the linear (possibly unbounded) sum b0 + xb1 into a number in the
bounded interval (0, 1). Several options are available for the link function k including the
logistic function (logit), the inverse standard normal function (probit), the complementary
log-log function, and the log-log function. The logistic link function is
k(ψ) = ln [ψ/(1− ψ)] . (8)
Dalal et al. (1989) state that the generalized linear model with the logistic link is an
appropriate statistical model for the probability of primary O-ring damage ψ, conditional on
the temperature at the time of launch x. Using the logistic link and solving for the response
probability ψ gives the logistic regression
ψ = {1 + exp [−(b0 + xb1)]}−1 , (9)

18
with the interpretation ψ = P (W = 1|X = x). To estimate the coefficients, Dalal et al.
(1989) fit the logistic regression to the 23 data points shown in Figure 8 and found b0 = 5.085
and b1 = −0.1156. The response probability ψ is plotted as a function of temperature x,
according to Equation (9), in Figure 3. The response probability is ψ = 0.2608 when x = 53
◦F, and ψ = 0.8178 when x = 31 ◦F.
3.2 Comparison of the Structures
The Bayesian forecasting model (5) provides the correct theoretic structure for the rela-
tion between the posterior probability π and the predictor realization x. The actual shape
of this function is dictated by the models for the conditional density functions f0, f1 and the
prior probability g. The posterior probability can be an irreflexive function of the predictor
realization (example: Figure 3). The informativeness of the predictor X depends on the
degree of separation between the conditional density functions f0 and f1. Within the inter-
val of recorded realizations, the degree of separation between f0 and f1 is dictated directly
by the sample (assuming that the parametric models for F0 and F1 fit well to the empirical
conditional distribution functions). Outside the interval of recorded realizations, the degree
of separation between f0 and f1 depends on the tails of the parametric models for F0 and
F1 (example: Figure 1). The structure of the Bayesian forecasting equation (5) enables
the analyst to methodically assess the sensitivity of the posterior probability to changes
in the informativeness of the predictor (by changing the shape of one or both parametric
conditional distribution functions F0, F1) and to changes in the prior uncertainty about the
predictand (by changing the prior probability g). Both kinds of changes are meaningful to
an expert because they can be related directly to the sample.
19
In a generalized linear model (7), the shape of the relation between the response prob-
ability ψ and the predictor realization x is dictated by the link function and the linear
(systematic) component. The logistic function (8) imposes the sigmoid shape, which has a
reflexivity property. To wit, the response probability ψ(x) is reflexive about the location
parameter −b0/b1: that is, ψ(x) = 1− ψ(−2b0/b1 − x) for any x.
The discriminating power of the logistic regression lies solely in the magnitude of the
sum b0+x1b1: a unit change in the temperature increases the log odds on O-ring damage by
the amount b1. This imposed linear relationship does not allow for a meaningful sensitivity
analysis on the informativeness of the predictor X for forecasting the predictandW : changes
to the slope b1 or to the intercept b0 do not necessarily correspond to changes in the degree
of separation between the conditional density functions f0 and f1. Moreover, changes in the
coefficients b0, b1 are not meaningful to an expert because they cannot be related directly to
the sample.
To further contrast the Bayesian model and the logistic regression, the log-odds of π and
ψ are plotted as functions of x in Figure 7. The logistic regression simply assumes that the
response log-odds function is linear throughout the entire sample space of the predictor. The
Bayesian model makes no assumption about the shape of the posterior log-odds function; it
lets the data mold this shape (through the conditional distribution functions F0, F1). It
turns out that the posterior log-odds is not a linear function of x, not even within the range
of recorded realizations. This result contradicts the conclusion of Dalal et al. (1989, section
3.4) that there is "no quadratic or other non-linear relationship" between the logit transform
of the response probability ψ and the temperature x.

20
3.3 Comparison of the Forecasts
The Bayesian posterior probability and the logistic response probability appear similar
within the interval of temperatures at which previous shuttle launches took place (see Figure
3). Between 55 ◦F and 75 ◦F, the posterior probability π and the response probability ψ
cross twice, and the linearity assumption imposed on the log odds may seem reasonable (see
Figure 7). However, there are important differences in details. The posterior probability
π has an almost constant value of about 0.035 between 71 ◦F and 81 ◦F; this accurately
reflects a constant risk implied empirically by the eight flights with zero O-rings damaged
and the one flight with two O-rings damaged (see Figure 8) – the empirical probability is
2/(9 × 6) = 0.037. The response probability ψ, restricted by its sigmoid shape, decreases
steadily between 71 ◦F and 81 ◦F. This difference between the Bayesian model and the
logistic model is depicted further by plotting the expected number of damaged O-rings per
shuttle flight predicted by each model vis-a-vis the actual number of damaged O-rings in
each of the 23 shuttle flights (see Figure 8).
Below 53 ◦F, the plots of the posterior probability π and the response probability ψ
take different shapes, and the two models produce different probabilities at the critical tem-
perature of 31 ◦F. The Bayesian model does not assume, à priori, any functional form for
the posterior probability π. The posterior probability, at any temperature, depends on the
value of g and the shapes of f0, f1, which are dictated by all data. The logistic model works
differently. Because the logistic regression is reflexive about −b0/b1 = 43.99 ◦F, and there
are no data below 53 ◦F, it is the fit of the model at 56.98 ◦F that dictates the probability of
O-ring damage at 31◦F: P (W = 1|X = 31) = 1− P (W = 1|X = 56.98). Consequently, the
logistic regression predicts that the expected number of damaged O-rings at 31◦F is equal

21
to six minus the expected number of damaged O-rings at 56.98 ◦F. The functional form of
the response probability ψ at temperatures below 43.99 ◦F is simply a reflection of the fitted
sigmoid function above 43.99 ◦F. There is no theoretical, empirical, or judgmental basis for
this imposed functional form of the response probability ψ at temperatures below the value
of the location parameter.
The generalized linear model with other link functions, such as the probit or the comple-
mentary log-log (see Lavine, 1991, Figure 1), suffer from the same maladies that the logistic
regression model does: they have the same linear systematic component, assume an arbitrary
form of the response probability ψ over the sample space of the predictor, and consequently
output an arbitrary value of the response probability at 31 ◦F.

22
4. BAYESIAN FORECAST VIA SUBJECTIVE EXTRAPOLATION
The crux of this forecasting problem is the enormous extrapolation that must be per-
formed in the sample space of the predictor X: relative to the interval [53, 81] ◦F, which
comprises all recorded realizations of X, the realization X = 31 ◦F is an outlier. Therefore,
mechanistic extrapolations are presumptuous. Lavine (1991, p. 920) argues that "sensible
extrapolations to 31 ◦F must be based on engineering considerations". Herein, the authors
argue that sensible extrapolations to 31 ◦F require (i) a forecasting model with a correct
theoretic structure, and (ii) expert judgment (which includes engineering considerations).
Given the Bayesian forecasting model (5), the extrapolation problem is decomposed
naturally into two tasks: the extrapolation of the prior probability g, and the extrapolation of
the conditional density functions f0, f1. This section presents formal methods for harnessing
expert judgment to accomplish each task.
4.1 Re-assessing Prior Probability
On the eve of the Challenger launch, a three-hour conference of Morton Thiokol and
NASA experts was conducted to discuss the possibility of O-ring failure due to low tem-
perature. A conference like this one provided an appropriate forum for assessing the prior
probability g. The experts had (i) information about the extreme temperature being fore-
casted for the launch time, (ii) knowledge of the physical properties and the engineering
design of the field joints, and (iii) experience from testing O-ring performance at different
temperatures. Given a suitable Bayesian methodology, the experts had the capacity to
assess the prior probability of primary O-ring damage.
The assessment methodology could be structured as a nominal-interacting group process

23
lead by a facilitator and consisting of five phases.
1. Preparatory Phase. Definition of the forecasting problem, presentation of available
information, and explanation of the assessment protocol (as detailed below).
2. Nominal Phase. Individual assessment of the prior probability g by each expert, in a
group setting but in silence.
3. Interaction Phase. Roundtable presentation by each expert of the assessed g and the
rationale; next a structured discussion: the experts voice their questions and comments,
and debate their opinions. The ultimate objective of this phase is to reach a group
consensus on the value of g; but it is not a requirement.
4. Reconciliation Phase. Individual reconciliation of the assessed g by each expert, in a
group setting but in silence.
5. Aggregation Phase. Algorithmic aggregation of the reconciled individual assessments
via the median rule (an analog to the majority rule when a group must choose a
cardinal number from a set): the group prior probability is taken to be the median of
the individual prior probabilities.
The nominal-interacting process for group assessment of some quantity was first proposed
by Van de Ven and Delbecq (1971) and Delbecq and Van de Ven (1971), and since then
explored in many experimental studies (e.g., Gustafson et al., 1973). The present assessment
methodology emerged through various experiments conducted by the second author. All
this research has demonstrated high effectiveness of the combined nominal and interacting
processes for group problem solving.

24
To assess an individual prior probability in Phase 2, each expert would follow the same
protocol. This protocol consists of three steps and prescribes the reasoning process.
Step 1. Recall that all 23 previous launches of the shuttle took place when the tempera-
ture was within the interval [53, 81] ◦F. Based on postflight inspection records, the relative
frequency of O-ring damage is
9
23× 6 =9
138' 10
150.
That is, of 150 O-rings used in 25 flights, 10 get damaged on average.
Step 2. Consider an enlarged interval of temperature, say [30, 81] ◦F. Now imagine that
future launches of the shuttle will take place when the temperature is within the interval
[30, 81] ◦F. In your judgment, will the relative frequency of O-ring damage
(D) decrease below 10/150, or
(S) remain about the same, 10/150, or
(I) increase above 10/150?
Step 3. If your answer in Step 2 is S, then report 10/150 to the group. If your answer
in Step 2 is either D or I, then assess the relative frequency of O-ring damage you expect in
the next 25 launches of the shuttle. Report your estimate to the group.
Here is a brief justification of the above protocol. First, the prior probability g of
event W = 1 must not be conditional on any particular realization X = x of the predictor.
Consequently, the expert’s judgment must not focus on the particular temperature being
forecasted for the next launch, x = 31 ◦F, and on the dependence between that particular
temperature and the O-ring performance. Second, the forecasted temperature of 31 ◦F,
being 22 ◦F below the minimum recorded in all previous shuttle launches, implies that

25
the forecasting problem includes an extrapolation problem. For the assessment of the
prior probability, this extrapolation problem involves: (i) the enlargement of the sampling
interval of the predictor from the interval [53, 81] ◦F to the interval [30, 81] ◦F, and (ii) the
corresponding extrapolation of the prior probability. This extrapolation can be formalized
by explicitly conditioning the prior probability on an interval of X. The sample from the 23
previous flights yields the relative frequency estimate of the prior probability g0 = P (W =
1|X ∈ [53, 81]); so g0 = 9/123 = 0.0652. What is needed for the current forecast is the
prior probability g = P (W = 1|X ∈ [30, 81]); this is the probability that must be assessed
subjectively by an expert.
Without the possibility of applying the assessment methodology retrospectively, we do
not know the value of g. However, based on the nature and strength of concerns expressed
by some Morton Thiokol engineers at the pre-launch conference, it can be ascertained that
had our Bayesian assessment methodology been applied, these experts would have answered
I in Step 2, indicating that P (W = 1|X ∈ [30, 81]) > P (W = 1|X ∈ [53, 81]). Consequently,
the group prior probability would be at least 0.0652. This number may thus be viewed as
a lower bound on g.
4.2 Re-estimating Conditional Density Functions
It was argued that the prior probability g estimated from the joint sample may be
viewed as being conditional on the event X ∈ [53, 81] ◦F. The same argument applies to the
conditional distribution functions F0, F1 estimated in Section 2.4 – each may be viewed as
being conditional on the event X ∈ [53, 81] ◦F. A mechanistic extrapolation of F0 and F1 to
a slightly wider interval, say [48, 81] ◦F, may be plausible, but stretching the extrapolation

26
to the interval [30, 81] ◦F is presumptuous.
Following the argument from Section 4.1, F0 and F1 would be conditioned on the event
X ∈ [30, 81] ◦F if data from at least one laboratory experiment or actual launch at or near
30 ◦F were included in the joint sample. Whereas such data will be available after the next
flight, if it is launched at 31 ◦F, the forecast must be made before the flight. To overcome
this impediment, we propose a strategy that parallels the Bayesian pre-posterior analysis in
its reasoning: contemplate every possible outcome of the experiment and, conditional on
the hypothesis that this outcome is obtained, re-estimate F0, F1 and re-calculate π at x = 31
◦F. Next examine the results and draw inferences.
This pre-posterior extrapolation is implemented as follows. The outcome of the next
launch at 31 ◦F is the number of O-rings damaged n, where n ∈ {0, 1, 2, 3, 4, 5, 6}. For every
n, five steps are performed.
Step 1. The joint sample {(x,w)} of 138 realizations is augmented by six realizations
of the form (31, w), with n realizations having w = 1 and 6− n realizations having w = 0.
Step 2. New relative frequency of O-ring damage is estimated:
9 + n
(23 + 1)× 6 =9 + n
144.
Step 3. New empirical distribution functions ofX are constructed, conditional onW = 0
and W = 1.
Step 4. New parametric models for F0, F1 are estimated, and new models for f0, f1 are
obtained.
Step 5. The posterior probability π at x = 31 ◦F is calculated using the new parametric
models for f0, f1 and the assessed prior probability g.

27
4.3 Re-examining the Forecast
The results conditional on n = 0, 1 indicate that these outcomes would be inconsistent
with the temperature effect hypothesis: each outcome yields a likelihood-ratio function
L = f1/f0 which is not strictly decreasing on the interval [30, 53] ◦F. The result conditional
on n = 6 is π = 1.0000 at x = 31 ◦F. (This is not surprising, given the results presented in
Section 2.5, because outcome n = 6 makes the left tail of F1 heavy and does not alter F0.)
The results conditional on n = 2, 3, 4, 5 are shown in Figure 9 (a plot of π versus x) and are
reported in Table III (values of π at x = 31 ◦F).
The lower bound on the posterior probability π at 31 ◦F is obtained if one (i) assumes
the temperature effect hypothesis is true in its weakest form (whereby the outcome n = 2
of the launch at 31 ◦F replicates the outcome of the launch at 53 ◦F), and (ii) accepts the
relative frequency of O-ring damage as the prior probability. This lower bound is 0.53.
The posterior probability π at 31 ◦F is between 0.64 and 0.78 if (i) the number of O-rings
damaged during a launch at 31 ◦F is n = 3 (the outcome which is not extreme, given that
two O-rings were damaged during a launch at 53 ◦F), and (ii) the prior probability g assessed
by experts is between 0.0833 and 0.1500 (the values which are modest, given that the lowest
bound on g is 0.0652).
The main conclusion is threefold: (i) Given the joint sample from the 23 previous launches
at temperatures between 53 ◦F and 81 ◦F, it suffices to contemplate every possible outcome
of an additional launch at 31 ◦F in order to rationalize possible extrapolations of the con-
ditional distribution functions F0, F1. (ii) These pre-posterior extrapolations, together with
the subjectively assessed prior probability, allow the experts to calculate the values of the

28
posterior probability π conditional on every possible outcome n, and to infer the lower bound
on π. (iii) The experts can meaningfully interpret every value of π because they can associate
it (via outcome n) with their judgment of the strength of the temperature effect at 31 ◦F.

29
5. COMPARISON OF PERSPECTIVES
5.1 Lower Bounds on the Forecast Probability
The lower bound of 0.53 on the probability of O-ring damage at 31 ◦F inferred through
the subjective extrapolation of the elements of the Bayesian model contrasts with the non-
parametric lower bound of 0.33 obtained by Lavine (1991). Interestingly, according to the
sensitivity analysis reported in Table II, 0.33 may be viewed as the lower bound on the
probability of O-ring damage at 53◦F. This difference in inferences merits an explanation.
To compute the lower bound, Lavine (1991) assumes that probability decreases monoton-
ically with temperature (which is plausible), estimates nonparametrically the probability of
O-ring damage at 53◦F, and takes that probability as the lower bound on the probability
at 31 ◦F. He argues that this lower bound is "the most that can be" inferred from data
"without more engineering input"; he does not explain what engineering input would be
needed to tighten his lower bound.
What is really needed, even before one begins analyzing data and eliciting input from
engineers, is a theoretic formulation of the forecasting problem. Herein it means deriving an
expression for P (W = 1|X = x). The result is the Bayesian forecasting model (5). Given
that model, the analyst can use whatever data and engineering input are available to carry
out the tasks of extracting information from data, eliciting input from engineers, extrapolat-
ing model elements (g, f0, f1) outside the interval of recorded realizations, and forecasting.
Not surprisingly, the inferred lower bound on the posterior probability is tighter than the
bound obtained through a linear-horizontal extrapolation afforded by the nonparametric
approach.

30
5.2 Extreme Realizations
Dalal et al. (1989) examine the influence of data on the response probability. They dub
the launch at 75◦F with two O-rings damaged an "extreme point". Then they show that
removing the data point from the launch at 75 ◦F and re-estimating the logistic regression
increases the response probability at 31 ◦F. Lavine (1991) goes on to show that removing
the data point from the launch at 53 ◦F (also with two O-rings damaged) and re-estimating
the logistic regression decreases the response probability at 31 ◦F. Whereas this type of
influence analysis is common, it is mechanistic: it does not reveal a causal explanation of
change in the response probability unless there exists an engineering reason for removing a
data point or for treating it specially. In the absence of an engineering reason, is there a
statistical reason? Here again the Bayesian perspective diverges from the classical one.
The empirical conditional distribution functions shown in Figure 1 do not suggest that
either the launch at 53 ◦F or the launch at 75 ◦F (each with two O-rings damaged) is an
outlier in any sense. To justify this statement, consider the empirical distribution function
of X, conditional on W = 1. It shows four steps with two realizations aligned vertically, or
nearly so, at temperatures 53, [57, 58], 70, 75 ◦F. There is no way of detecting from this plot
alone whether the two realizations in each pair were recorded in one launch or in two launches
(assuming the difference between 57 ◦F and 58 ◦F is practically irrelevant). Overall, none
of the four steps distinguishes itself from the others, and the empirical distribution function
appears rather smooth (considering that it is constructed from nine realizations only). Thus
from the Bayesian perspective (wherein a data sample is summarized by two conditional
distribution functions), there is no reason to label any of the data points "extreme" or

31
"outlier" and to treat it specially. And unlike the leave-one-out sensitivity analysis, the
Bayesian analysis focuses directly on the crux of the forecasting problem: the extrapolation
of the conditional distribution functions below 53 ◦F, while using all data points at hand.
5.3 Subjective Assessments
An expert cannot meaningfully assess a probability of an event or a distribution function
of a variate unless the event or the variate is familiar and the expert possesses information,
knowledge, and experience relevant to the assessment. This fact renders the formulation
prescribed by Dalal and Hoadley (1991) unworkable. For they propose to develop a variety
of models for the response probability (in essence, arbitrary extrapolations of the response
probability below 53 ◦F) and then "to work intensely with the engineers and to spread the
à priori probabilities over a variety of models". This raises two questions. What basis
(information, knowledge, experience) would an expert on solid rocket motors have to assess
the probability of a sigmoid function (or some other arbitrary function) being the true form
of the response probability below 53 ◦F? How could a Bayesian expert, who knows that
none of the generalized linear models is correct theoretically, assign probability other than
zero to any of the models?
In our Bayesian approach, explained in Section 4.1, the expert is asked to subjectively
assess a probability of the event that has physical and familiar interpretation: the relative
frequency of O-ring damage expected in the next 25 launches to take place when the tem-
perature is in the interval [30, 81] ◦F. Then the expert’s assessment is integrated seamlessly
with the empirical evidence from previous flights through Bayes theorem.

32
6. CLOSURE
6.1 Risk Assessment Paradigm
In a broad sense, risk analysis aims to determine the probabilities of adverse events and
the values of consequences resulting from these events and alternative decisions in order to
provide a scientific basis for rational choice in face of uncertainty. The Challenger disaster
offers a paradigm for risk analysis in space exploration that has three general characteristics.
1. The consequence of a catastrophic failure of a mission is well known, but the probability
of a catastrophic failure is an unknown of formidable complexity: it depends on
the multitude of design and operation decisions, it varies with environmental states,
and it is conditional on expert’s understanding of multiple physical relations between
observable quantities (which serve as predictors) and the random quantities (which
define failure modes).
2. With the multitude of possible failure modes, it is vital to identify the ones that are
dominant under the environmental state prevailing at the time of the operation. Before
the Challenger launch, the engineers correctly identified the dominant predictor of a
possible catastrophic failure: the temperature of the O-ring. But they lacked a tool
for assessing the probability of failure. The lesson is that risk forecasting models for
dominant failure modes under all possible environmental states should be developed
beforehand, so that they can be used on short notice during operations when the
particular states are identified.
3. The probability of a catastrophic failure is not static but dynamic: it may shift

33
dramatically in short time from near-zero to near-one (as it does in Figure 3) because
of a change in the environmental state (here the temperature), which is not necessarily
an extreme event by itself. Therefore, the forecasting model should have the structure
and the flexibility to reliably quantify the risks at both “tails” of the probability space,
and to reliably predict the shifts.
6.2 Bayesian Forecasting Model
The re-analysis of the Challenger O-ring data illustrates two fundamental advantages of
the Bayesian approach to forecasting a binary predictand.
1. Bayes theorem provides the correct theoretic structure for the forecasting model. The
posterior probability π as a function of the predictor realization x can take any form,
which depends on the conditional density functions f0, f1 (ultimately on the data
sample) and on the prior probability g (ultimately on expert judgment).
2. The Bayesian reasoning trains the expert’s mind on the two conditional distribution
functions (which summarize the data sample) and frames the task of diagnosing the
dependence between the predictor and the predictand clearly and simply (as judging
the separation of two functions).
6.3 Extrapolation Problem
When a forecast must be made conditional on a new extreme realization of the predictor
that lies far outside the sampling interval, the problem involves an extrapolation. The
Bayesian approach to such a problem offers four advantages.

34
1. Bayes theorem provides the theoretic structure for the forecasting model that is cor-
rect over the entire sample space of the predictor, within the sampling interval and
outside it.
2. The extrapolation problem is recognized, and formulated explicitly, as the problem
of changing the conditioning of the model elements, g, f0, f1, from conditioning on an
event defined by the prior sampling interval to conditioning on an event defined by a
pre-posterior sampling interval (which includes the new extreme realization).
3. The extrapolation problem is decomposed naturally into two tasks: (i) the re-assessment
of the prior probability g through expert judgment (which encapsulates engineering in-
formation, knowledge, and experience), and (ii) the re-estimation of the conditional
distribution functions based on a pre-posterior joint sample (which includes realiza-
tions recorded after previous flights and contemplated from one additional flight).
4. The pre-posterior extrapolations, conditional on every possible outcome of the addi-
tional experiment, allow the analyst to calculate the values of the posterior probability
from which the lower bound may be inferred. Moreover, the experts can meaningfully
interpret every value of the posterior probability because they can associate it with
their judgment of the strength of the temperature effect.
The alternative approaches to this forecasting-extrapolation problem are shown to be
naive (nonparametric lower bound on the forecast probability), or ad-hoc (logistic regression),
or unworkable (spread the à priori probabilities over a variety of generalized linear models).

35
ACKNOWLEDGMENTS
This material is based upon work supported by the National Science Foundation under
Grant No. ATM—0135940, and by the Metropolitan Washington Chapter of the Achievement
Rewards for College Scientists Foundation.

36
REFERENCES
Bordley, R.F., 1986: Linear combination of forecasts with an intercept: a Bayesian approach,
Journal of Forecasting, 5, 243—249.
Dalal, S.R., E.B. Fowlkes, and B. Hoadley, 1989: Risk analysis of the space shuttle: pre-
Challenger prediction of failure, Journal of the American Statistical Association, 84(408),
945—957.
Dalal, S.R., and B. Hoadley, 1991: Comment, Journal of the American Statistical Associa-
tion, 86(416), 921—922.
DeGroot, M.H., 1988: A Bayesian view of assessing uncertainty and comparing expert opin-
ion, Journal of Statistical Planning and Inference, 20, 295—306.
DeGroot, M.H., and S.E. Fienberg, 1983: The comparison and evaluation of forecasters, The
Statistician, 32, 12—21.
Delbecq, A.L., and A.H. Van de Ven, 1971: A group process model for problem identification
and program planning, The Journal of Applied Behavioral Science, 7(4), 466—492.
Gustafson, D.H., R.K. Shukla, A.L. Delbecq, and G.W. Walster, 1973: A comparative study
of differences in subjective likelihood estimates made by individuals, interacting groups,
delphi groups, and nominal groups, Organizational Behavior and Human Performance,
9, 280—291.
Harsanyi, J.C., 1978: Bayesian decision theory and utilitarian ethics, American Economic
Review, 68, 223—228.

37
Hoballah, I.Y., and P.K. Varshney, 1989: Distributed Bayesian signal detection, IEEE Trans-
actions on Information Theory, IT-35(5), 995—1000.
Krzysztofowicz, R., 1983: Why should a forecaster and a decision maker use Bayes theorem,
Water Resources Research, 19(2), 327—336.
Krzysztofowicz, R., 1996: Sufficiency, informativeness, and value of forecasts, in Proceedings
of the Workshop on the Evaluation of Space Weather Forecasts, pages 103—112, Boulder,
Colorado, Space Environment Center, NOAA.
Krzysztofowicz, R., and D. Long, 1991a: Forecast sufficiency characteristic: construction
and application, International Journal of Forecasting, 7(1), 39—45.
Krzysztofowicz, R., and D. Long, 1991b: Beta likelihood models of probabilistic forecasts,
International Journal of Forecasting, 7(1), 47—55.
Lavine, M., 1991: Problems in extrapolation illustrated with space shuttle O-ring data,
Journal of the American Statistical Association, 86(416), 919—921.
McCullagh, P., and J.A. Nelder, 1989: Generalized Linear Models, Chapman and Hall, Boca
Raton, 2nd ed.
Paté-Cornell, E., and R. Dillon, 2001: Probabilistic risk analysis for the NASA space shuttle:
a brief history and current work, Reliability Engineering and System Safety, 74(3),
345—352.

38
Presidential Commission on the Space Shuttle Challenger Accident, 1986: Report of the Pres-
idential Commission on the Space Shuttle Challenger Accident, Vol. 1, Washington,
D.C.
Sage, A.P., and J.L. Melsa, 1971: Estimation Theory with Applications to Communications
and Control, Chapter 5: Decision Theory, McGraw-Hill, NewYork.
Schum, D.A., I.L. Goldstein, and J.F. Southard, 1966: Research on a simulated Bayesian
information-processing system, IEEE Transactions on Human Factors in Electronics,
HFE-7, 37—48.
Van de Ven, A.H., and A.L. Delbecq, 1971: Nominal versus interacting group processes
for committee decision-making effectiveness, Academy of Management Journal, 14,
203—212.
Vardeman, S., and G. Meeden, 1983: Calibration, sufficiency, and domination considerations
for Bayesian probability assessors, Journal of the American Statistical Association, 78
(384), 808—816.

39
Table I: Posterior probability π of O-ring damage, calculated using the conditional density
functions f0, f1 shown in Figure 2 and five values of the prior probability g.
Prior Posterior Probability π
Probability g x = 31 x = 53
0.0100 0.9982 0.0816
0.0500 0.9997 0.3165
0.0652a 0.9997 0.3804
0.1000 0.9998 0.4944
0.1500 0.9999 0.6083
a Relative frequency estimate.

40
Table II: Posterior probability π of O-ring damage, calculated using three different parametric
models for F1, with the prior probability equal to the relative frequency estimate (the lowest
bound on the subjective prior probability): g = 0.0652.
Parametric Model for F1: Posterior Probability π
Weibull, η1 = 84 x = 31 x = 53
α1 = 23.25, β1 = 2.14b 0.9997 0.3804
α1 = 22.52, β1 = 2.46 0.9983 0.3723
α1 = 21.72, β1 = 2.78 0.9588 0.3339
b Objective fit.

41
Table III: Posterior probability π of O-ring damage, conditional on the temperature at the
time of launch being x = 31 ◦F, calculated using the conditional density functions f0, f1
obtained through a pre-posterior extrapolation.
Number of Prior Posterior
O-rings damaged Probability Probability
n g π
2 0.0764 0.5283
0.1000 0.6007
0.1500 0.7050
3 0.0833 0.6447
0.1000 0.6893
0.1500 0.7789
4 0.0903 0.7266
0.1000 0.7484
0.1500 0.8253
5 0.0972 0.7976
0.1000 0.8026
0.1500 0.8659
42
LIST OF FIGURES
1. Empirical distribution functions and fitted parametric distribution functions Fw of the
temperature at the time of launch, X, conditional on the post-flight state of the O-ring,
W = w (no damage, w = 0; damage, w = 1).
2. Conditional density functions f0, f1 corresponding to the fitted parametric distribution
functions F0, F1 shown in Figure 1.
3. Probability of O-ring damage, as a function of the temperature at the time of launch
x: the posterior probability π calculated using the conditional density functions f0, f1
shown in Figure 2 and the prior probability g = 0.0652 (thick solid line); the posterior
probabilities π calculated using two alternative extrapolations of the left tail of F1
shown in Figure 6 and the prior probability g = 0.0652 (thin solid lines); the response
probability ψ calculated from the logistic regression (broken line).
4. Receiver Operating Characteristic (ROC) of the Bayesian forecaster of O-ring damage
constructed from the conditional distribution functions F0, F1 shown in Figure 1.
5. Posterior probability π of O-ring damage calculated using the conditional density func-
tions f0, f1 shown in Figure 2, for four values of the prior probability g.
6. The empirical distribution function of the temperature at the time of launch, X, condi-
tional on the O-ring being damaged,W = 1 (squares); the objectively fitted parametric

43
distribution function F1 (thick solid line); two alternative parametric models for the
left tail of F1 (thin broken lines).
7. The log odds on the O-ring damage obtained from four probabilities: the posterior
probability π calculated using the conditional density functions f0, f1 shown in Figure
2 and the prior probability g = 0.0652 (thick solid line); the posterior probabilities π
calculated using two alternative extrapolations of the left tail of F1 shown in Figure
6 and the prior probability g = 0.0652 (thin solid lines); the response probability ψ
calculated from the logistic regression (broken line).
8. The expected number of damaged O-rings per shuttle flight calculated using the prob-
abilities shown in Figure 3; the points are the actual numbers of O-rings damaged in
each of the 23 flights before the Challenger disaster.
9. Posterior probability π of O-ring damage calculated using the conditional density func-
tions f0, f1 obtained through a pre-posterior extrapolation (contemplating an experi-
ment at x = 31 ◦F in which n O-rings are damaged) and the prior probability g equal
to the relative frequency estimate.

44
30 40 50 60 70 80Temperature x [°F]
0.0
0.1
0.2
0.3
0.4
0.5
0.6
0.7
0.8
0.9
1.0
Pro
babi
lity
P(X
≤ x
| W
= w
) Empirical (w = 1)Weibull (w = 1)
α1 = 23.25, β1 = 2.14, η1 = 84
α0 = 3.11, β0 = 10.56, η0 = 90
Empirical (w = 0)Log-Weibull (w = 0)
Figure 1: Empirical distribution functions and fitted parametric distribution functions Fw of
the temperature at the time of launch, X, conditional on the post-flight state of the O-ring,
W = w (no damage, w = 0; damage, w = 1).

45
30 40 50 60 70 80Temperature x [°F]
0.00
0.01
0.02
0.03
0.04
0.05
0.06
0.07
Den
sity
f w(x
)
w = 0w = 1
Figure 2: Conditional density functions f0, f1 corresponding to the fitted parametric distri-
bution functions F0, F1 shown in Figure 1.

46
30 40 50 60 70 80Temperature x [°F]
0.0
0.1
0.2
0.3
0.4
0.5
0.6
0.7
0.8
0.9
1.0
Pro
babi
lity
P(W
= 1
| X
= x
)
πψ
Figure 3: Probability of O-ring damage, as a function of the temperature at the time of
launch x: the posterior probability π calculated using the conditional density functions f0,
f1 shown in Figure 2 and the prior probability g = 0.0652 (thick solid line); the posterior
probabilities π calculated using two alternative extrapolations of the left tail of F1 shown in
Figure 6 and the prior probability g = 0.0652 (thin solid lines); the response probability ψ
calculated from the logistic regression (broken line).

47
0.0 0.1 0.2 0.3 0.4 0.5 0.6 0.7 0.8 0.9 1.0Probability of False Alarm P(F)
0.0
0.1
0.2
0.3
0.4
0.5
0.6
0.7
0.8
0.9
1.0
Pro
babi
lity
of D
etec
tion
P(D
)
Figure 4: Receiver Operating Characteristic (ROC) of the Bayesian forecaster of O-ring
damage constructed from the conditional distribution functions F0, F1 shown in Figure 1.

48
30 40 50 60 70 80Temperature x [°F]
0.0
0.1
0.2
0.3
0.4
0.5
0.6
0.7
0.8
0.9
1.0
Pos
terio
r Pro
babi
lity
π =
P(W
= 1
| X
= x
)
g = 0.01g = 0.05g = 0.10g = 0.15
Figure 5: Posterior probability π of O-ring damage calculated using the conditional density
functions f0, f1 shown in Figure 2, for four values of the prior probability g.

49
30 40 50 60 70 80Temperature x [°F]
0.0
0.1
0.2
0.3
0.4
0.5
0.6
0.7
0.8
0.9
1.0
Pro
babi
lity
P(X
≤ x
| W
= 1
)
Weibull, η1 = 84 α1 = 23.25, β1 = 2.14α1 = 22.52, β1 = 2.46α1 = 21.72, β1 = 2.78
Empirical
Figure 6: The empirical distribution function of the temperature at the time of launch, X,
conditional on the O-ring being damaged,W = 1 (squares); the objectively fitted parametric
distribution function F1 (thick solid line); two alternative parametric models for the left tail
of F1 (thin broken lines).

50
30 40 50 60 70 80Temperature x [°F]
-5-4-3-2-10123456789
Log
Odd
s
ln(π/(1 − π))ln(ψ/(1 − ψ))
Figure 7: The log odds on the O-ring damage obtained from four probabilities: the posterior
probability π calculated using the conditional density functions f0, f1 shown in Figure 2 and
the prior probability g = 0.0652 (thick solid line); the posterior probabilities π calculated
using two alternative extrapolations of the left tail of F1 shown in Figure 6 and the prior
probability g = 0.0652 (thin solid lines); the response probability ψ calculated from the
logistic regression (broken line).

51
30 40 50 60 70 80Temperature x [°F]
0
1
2
3
4
5
6
Exp
ecte
d N
umbe
r of D
amag
ed O
-ring
s Actual Numbern points coincideBayesianLogistic
3 2
2
2
n
Figure 8: The expected number of damaged O-rings per shuttle flight calculated using the
probabilities shown in Figure 3; the points are the actual numbers of O-rings damaged in
each of the 23 flights before the Challenger disaster.

52
30 40 50Temperature x [°F]
0.0
0.1
0.2
0.3
0.4
0.5
0.6
0.7
0.8
0.9
1.0
Pro
babi
lity
P(W
= 1
| X
= x)
n = 2n = 3n = 4n = 5
Figure 9: Posterior probability π of O-ring damage calculated using the conditional density
functions f0, f1 obtained through a pre-posterior extrapolation (contemplating an experiment
at x = 31 ◦F in which nO-rings are damaged) and the prior probability g equal to the relative
frequency estimate.