Embed Size (px)
Citation preview
© BAUER AG, D-86529 Schrobenhausen11-5-13 IR-Presentation_AnalystConference_Q12011
BAUER Aktiengesellschaft
Foundation works in Jakarta, Indonesia
Group Presentation First Quarter 2011
© BAUER AG, D-86529 Schrobenhausen11-5-13 IR-Presentation_AnalystConference_Q12011 2
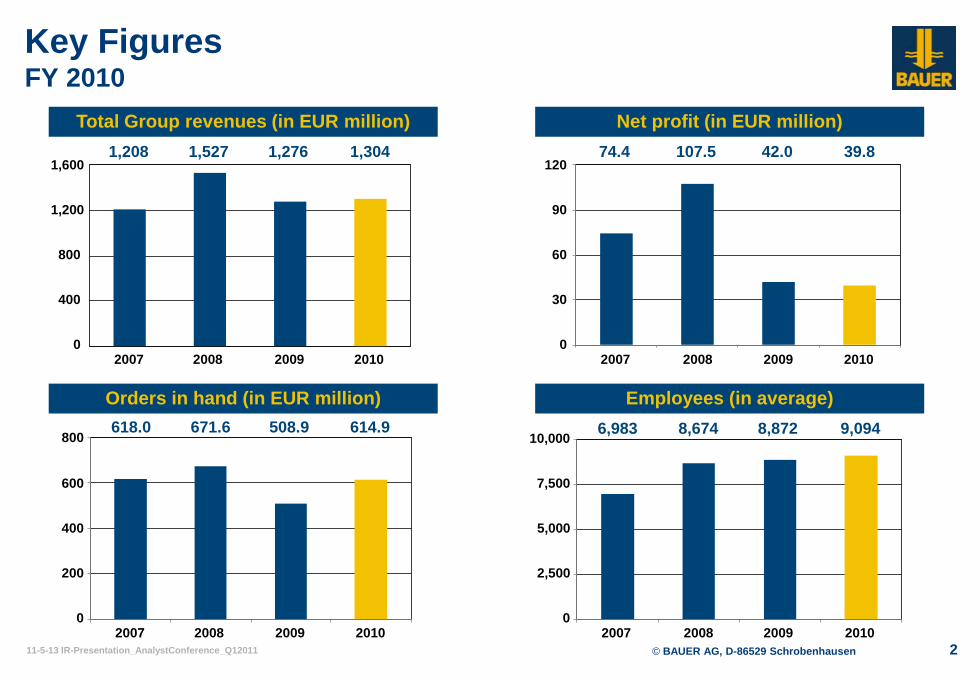
Total Group revenues (in EUR million)1,208 1,527 1,276 1,304
2007 2008 2009 2010
1,600
1,200
800
400
0
2007 2008 2009 2010
Orders in hand (in EUR million)618.0 671.6 508.9 614.9
800
600
400
200
0
Net profit (in EUR million)74.4 107.5 42.0 39.8
2007 2008 2009 2010
120
90
60
30
0
Key FiguresFY 2010
2007 2008 2009 2010
Employees (in average)6,983 8,674 8,872 9,09410,000
7,500
5,000
2,500
0
© BAUER AG, D-86529 Schrobenhausen11-5-13 IR-Presentation_AnalystConference_Q12011 3
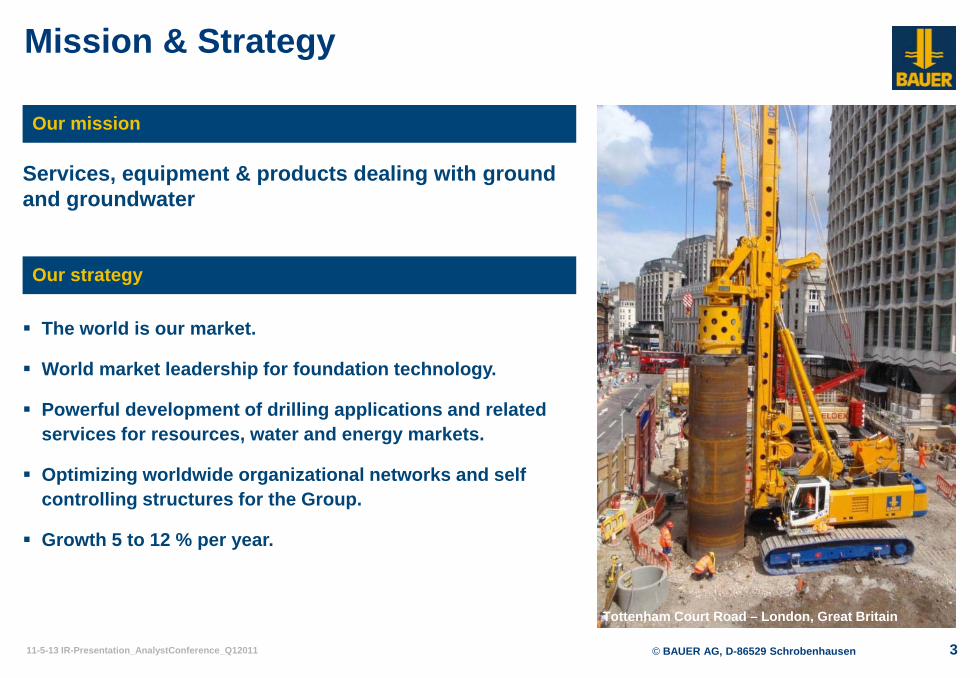
Mission & Strategy
Services, equipment & products dealing with ground and groundwater
Our mission
Our strategy
The world is our market.
World market leadership for foundation technology.
Powerful development of drilling applications and related services for resources, water and energy markets.
Optimizing worldwide organizational networks and self controlling structures for the Group.
Growth 5 to 12 % per year.
Tottenham Court Road – London, Great Britain
© BAUER AG, D-86529 Schrobenhausen11-5-13 IR-Presentation_AnalystConference_Q12011 4
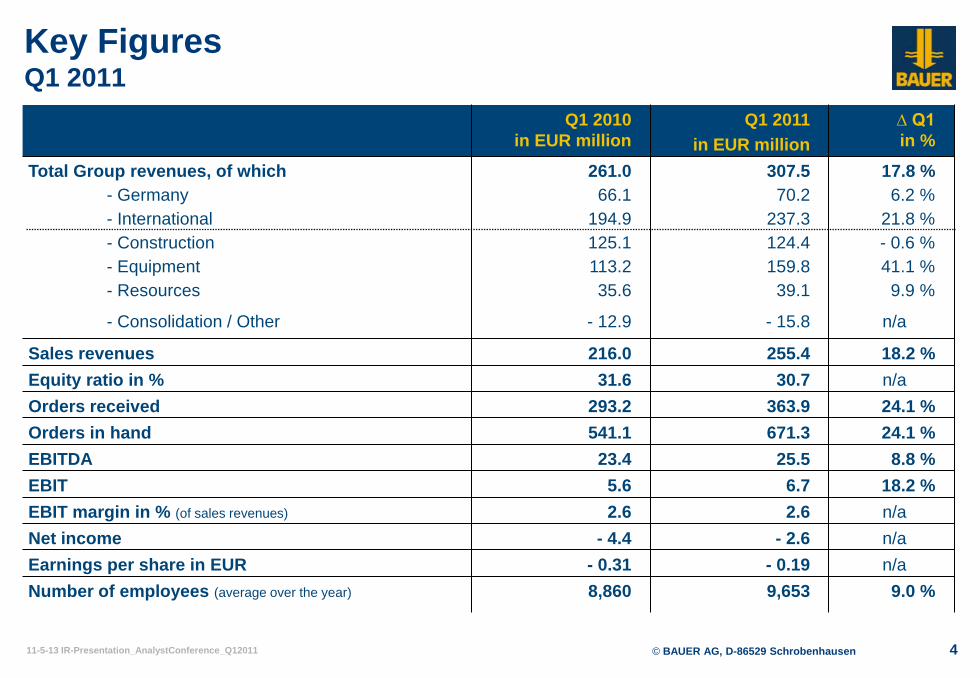
Key FiguresQ1 2011
Q1 2010in EUR million
Q1 2011in EUR million
∆ Q1 in %
Total Group revenues, of which- Germany- International- Construction- Equipment- Resources
- Consolidation / Other
261.066.1
194.9125.1113.235.6
- 12.9
307.570.2
237.3124.4159.8
39.1
- 15.8
17.8 %6.2 %
21.8 %- 0.6 %41.1 %9.9 %
n/a
Sales revenues 216.0 255.4 18.2 %Equity ratio in % 31.6 30.7 n/aOrders received 293.2 363.9 24.1 %Orders in hand 541.1 671.3 24.1 %EBITDA 23.4 25.5 8.8 %EBIT 5.6 6.7 18.2 %EBIT margin in % (of sales revenues) 2.6 2.6 n/aNet income - 4.4 - 2.6 n/aEarnings per share in EUR - 0.31 - 0.19 n/aNumber of employees (average over the year) 8,860 9,653 9.0 %

© BAUER AG, D-86529 Schrobenhausen11-5-13 IR-Presentation_AnalystConference_Q12011 5
Contents
Regional breakdown of Revenues3
Overview BAUER Group1
BAUER market environment 2
p. 6
p. 13
p. 15
Financials4
5 Guidance 2011
6 Appendix
p. 17
p. 25
p. 26
© BAUER AG, D-86529 Schrobenhausen11-5-13 IR-Presentation_AnalystConference_Q12011 6
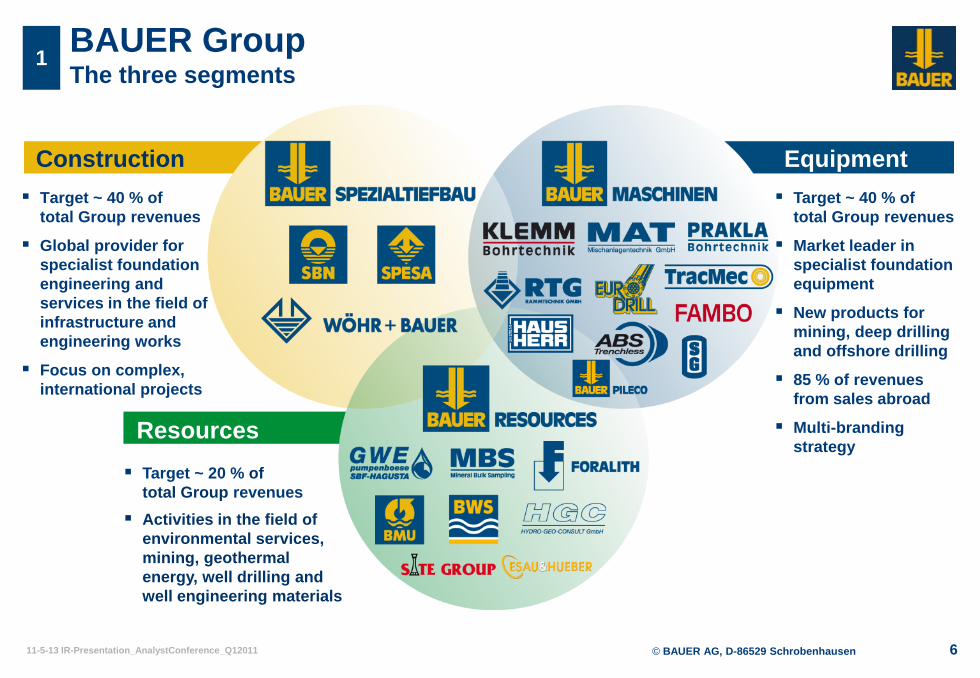
Resources
Construction Equipment
1 BAUER GroupThe three segments
Target ~ 40 % of total Group revenues
Market leader in specialist foundation equipment
New products for mining, deep drilling and offshore drilling
85 % of revenues from sales abroad
Multi-branding strategy
Target ~ 40 % of total Group revenues
Global provider for specialist foundation engineering and services in the field of infrastructure and engineering works
Focus on complex, international projects
Target ~ 20 % of total Group revenues
Activities in the field of environmental services, mining, geothermal energy, well drilling and well engineering materials
© BAUER AG, D-86529 Schrobenhausen11-5-13 IR-Presentation_AnalystConference_Q12011 7
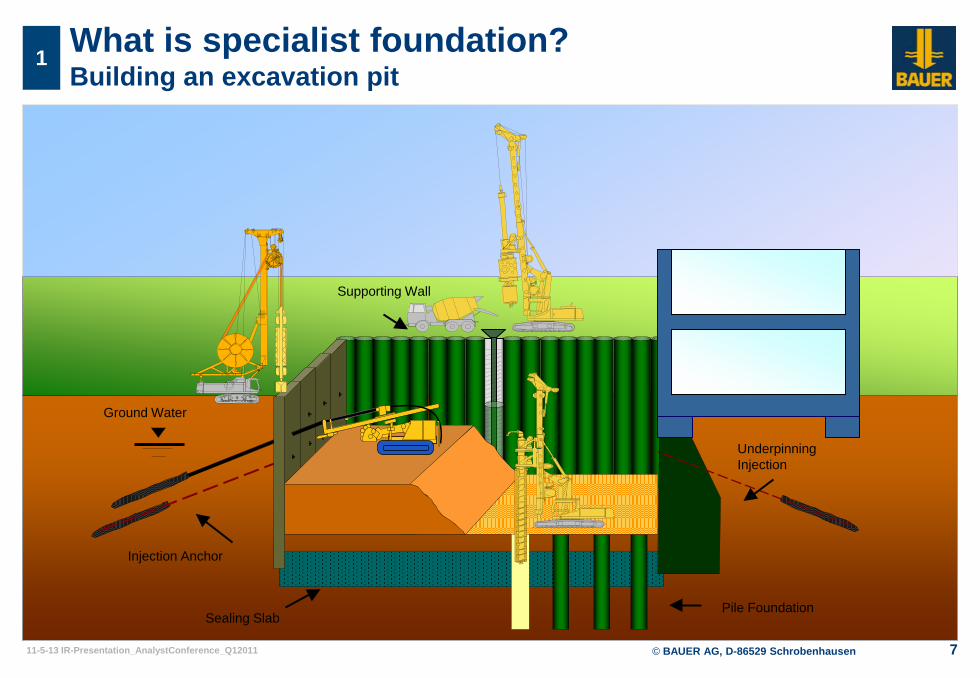
What is specialist foundation?Building an excavation pit
1
Ground Water
Injection Anchor
Sealing Slab
Supporting Wall
UnderpinningInjection
Pile Foundation
© BAUER AG, D-86529 Schrobenhausen11-5-13 IR-Presentation_AnalystConference_Q12011 8
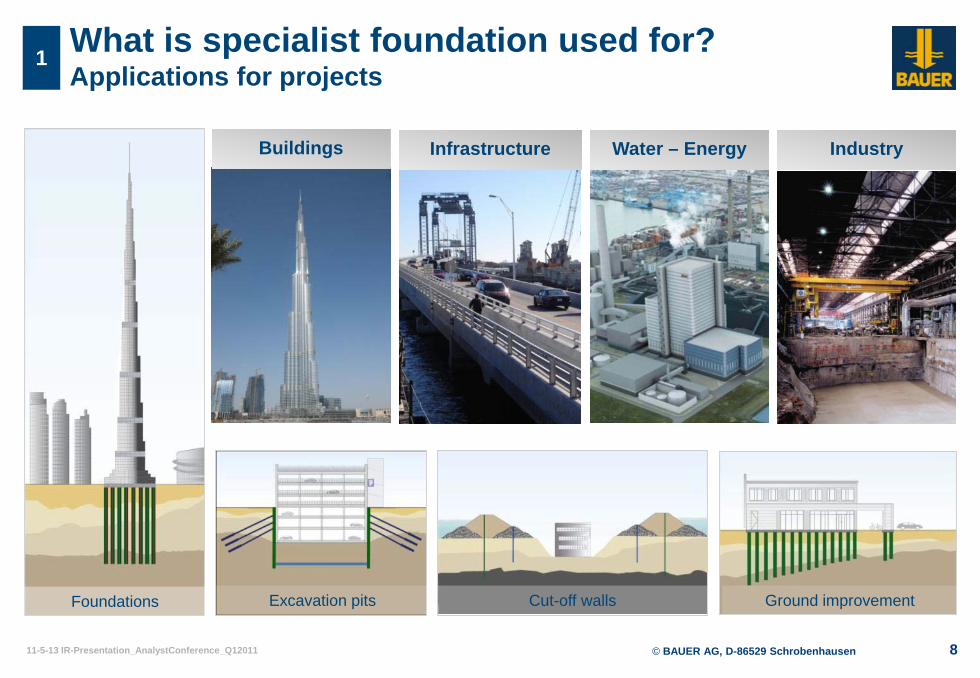
What is specialist foundation used for?Applications for projects
1
Foundations Cut-off wallsExcavation pits
Buildings Infrastructure Water – Energy Industry
Ground improvement
© BAUER AG, D-86529 Schrobenhausen11-5-13 IR-Presentation_AnalystConference_Q12011 9
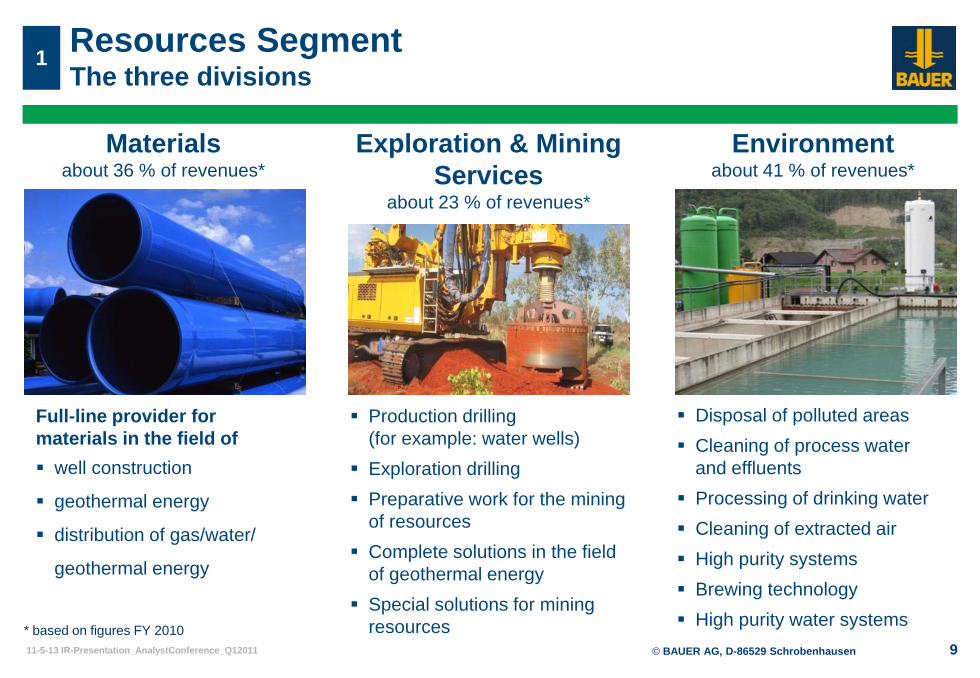
Resources SegmentThe three divisions
1
Environmentabout 41 % of revenues*
Exploration & Mining Services
about 23 % of revenues*
Materialsabout 36 % of revenues*
Full-line provider formaterials in the field of well construction
geothermal energy
distribution of gas/water/
geothermal energy
Production drilling (for example: water wells)
Exploration drilling Preparative work for the mining
of resources Complete solutions in the field
of geothermal energy Special solutions for mining
resources
Disposal of polluted areas Cleaning of process water
and effluents Processing of drinking water Cleaning of extracted air High purity systems Brewing technology High purity water systems
* based on figures FY 2010
© BAUER AG, D-86529 Schrobenhausen11-5-13 IR-Presentation_AnalystConference_Q12011
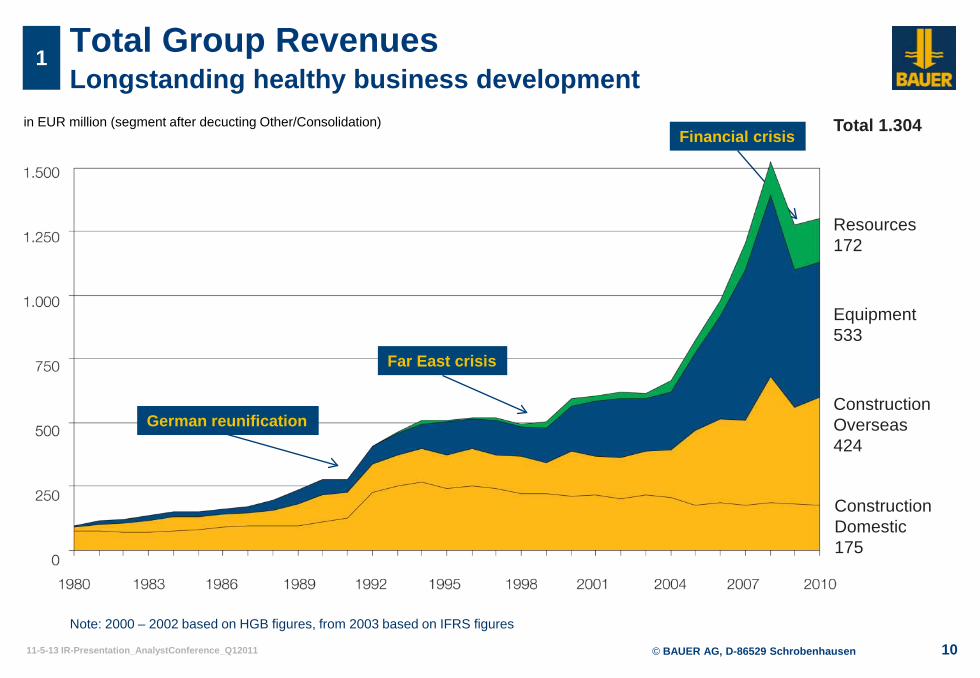
in EUR million (segment after decucting Other/Consolidation)
10
1
Note: 2000 – 2002 based on HGB figures, from 2003 based on IFRS figures
Resources172
Equipment533
ConstructionOverseas424
Total 1.304
ConstructionDomestic175
Total Group RevenuesLongstanding healthy business development
German reunification
Far East crisis
Financial crisis
© BAUER AG, D-86529 Schrobenhausen11-5-13 IR-Presentation_AnalystConference_Q12011 11
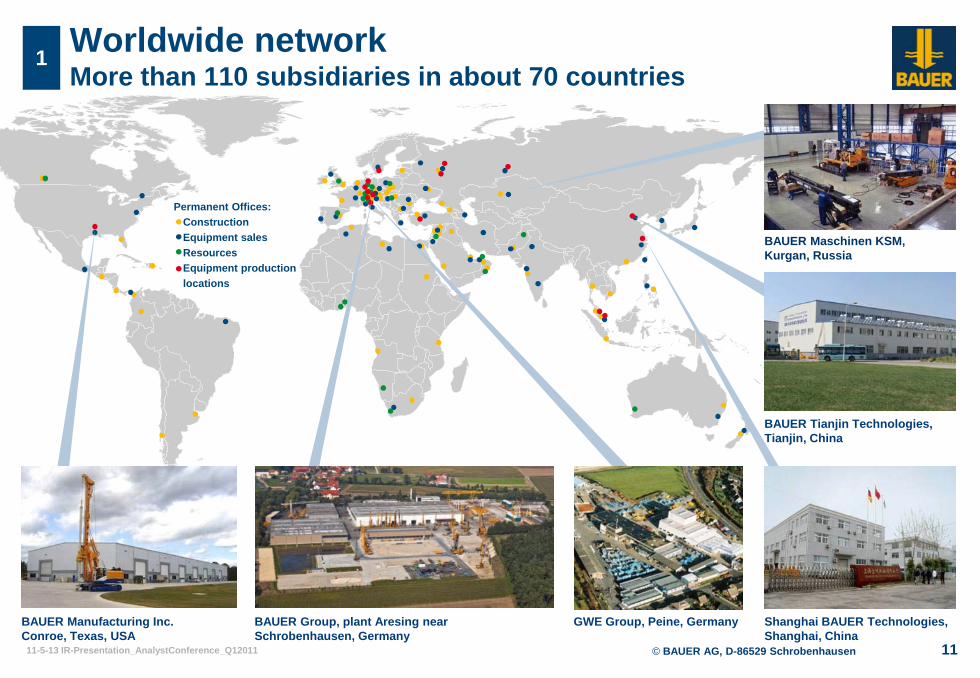
Worldwide networkMore than 110 subsidiaries in about 70 countries
1
BAUER Manufacturing Inc.Conroe, Texas, USA
GWE Group, Peine, Germany
BAUER Maschinen KSM, Kurgan, Russia
Shanghai BAUER Technologies, Shanghai, China
BAUER Tianjin Technologies, Tianjin, China
BAUER Group, plant Aresing near Schrobenhausen, Germany
Permanent Offices:Construction Equipment salesResourcesEquipment production locations
© BAUER AG, D-86529 Schrobenhausen11-5-13 IR-Presentation_AnalystConference_Q12011 12
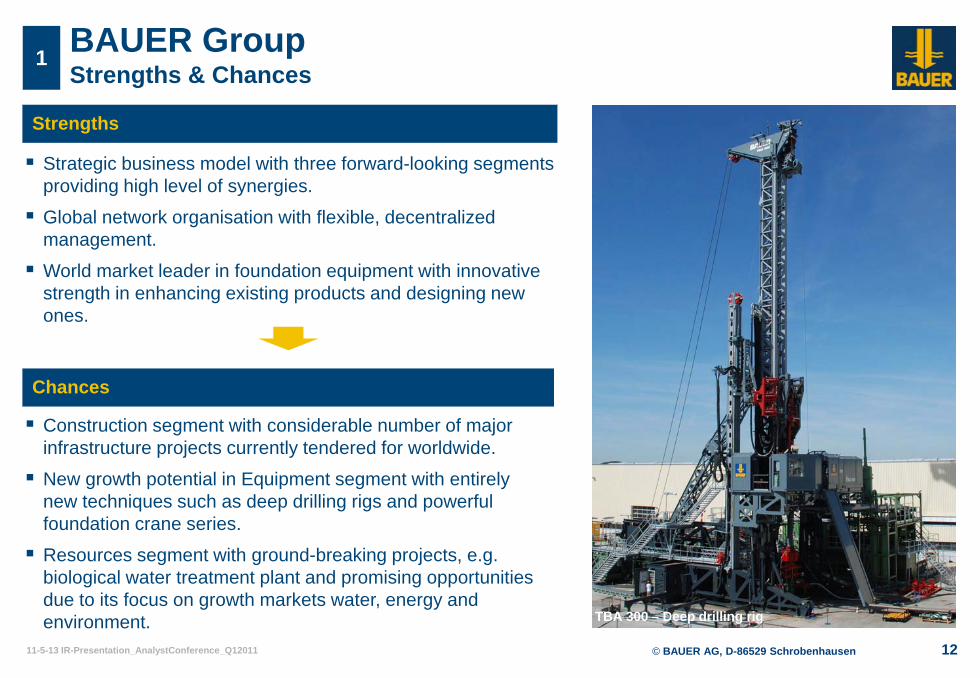
1 BAUER GroupStrengths & Chances
Strategic business model with three forward-looking segments providing high level of synergies.
Global network organisation with flexible, decentralized management.
World market leader in foundation equipment with innovative strength in enhancing existing products and designing new ones.
Strengths
Chances
Construction segment with considerable number of major infrastructure projects currently tendered for worldwide.
New growth potential in Equipment segment with entirely new techniques such as deep drilling rigs and powerful foundation crane series.
Resources segment with ground-breaking projects, e.g. biological water treatment plant and promising opportunities due to its focus on growth markets water, energy and environment. TBA 300 – Deep drilling rig
© BAUER AG, D-86529 Schrobenhausen11-5-13 IR-Presentation_AnalystConference_Q12011
+
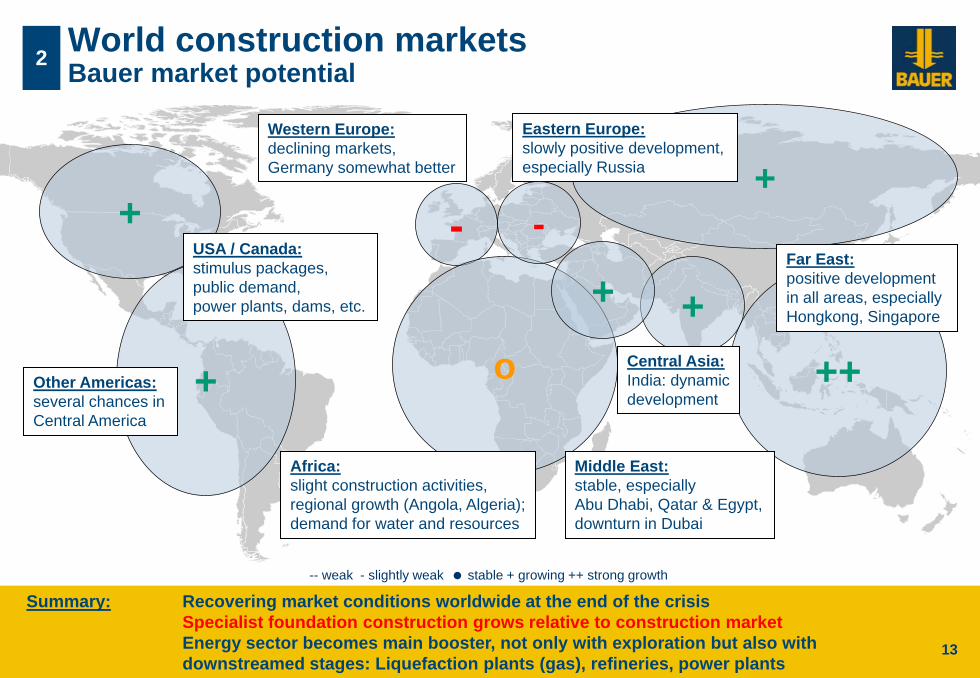
World construction marketsBauer market potential2
13
-
Western Europe:declining markets, Germany somewhat better +
+++
Far East:positive development in all areas, especially Hongkong, Singapore
+Other Americas:several chances in Central America
o
Africa:slight construction activities, regional growth (Angola, Algeria); demand for water and resources
Summary: Recovering market conditions worldwide at the end of the crisisSpecialist foundation construction grows relative to construction marketEnergy sector becomes main booster, not only with exploration but also withdownstreamed stages: Liquefaction plants (gas), refineries, power plants
Middle East:stable, especiallyAbu Dhabi, Qatar & Egypt,downturn in Dubai
Eastern Europe:slowly positive development, especially Russia
Central Asia:India: dynamic development
USA / Canada:stimulus packages,public demand,power plants, dams, etc.
13
-- weak - slightly weak stable + growing ++ strong growth
-
+
© BAUER AG, D-86529 Schrobenhausen11-5-13 IR-Presentation_AnalystConference_Q12011 14
Market environmentOrders & Currency risks
2
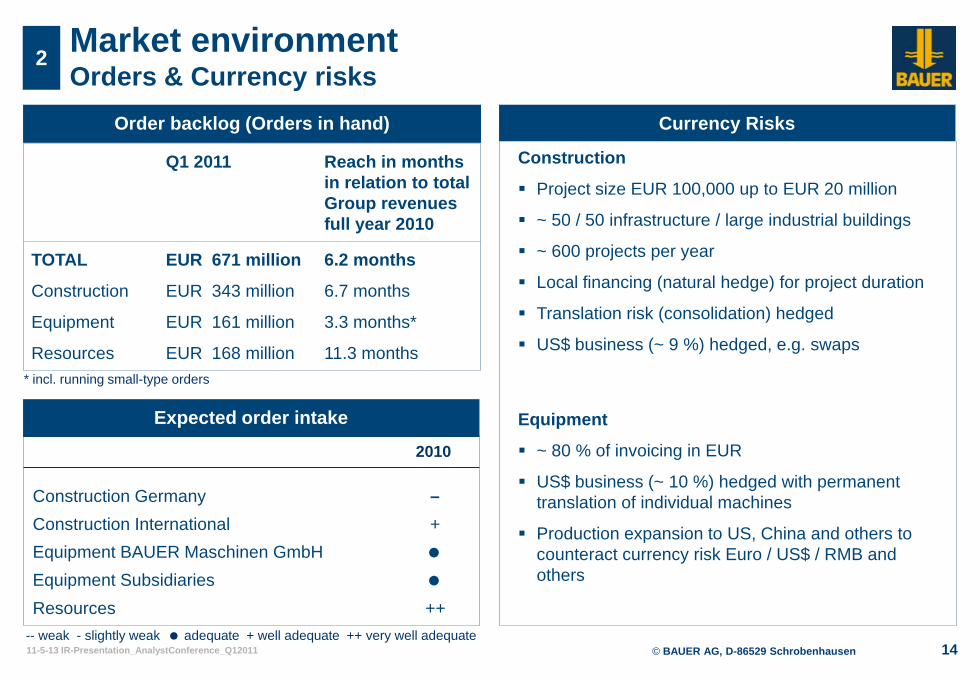
Order backlog (Orders in hand) Currency Risks
Expected order intake
2010
Construction Germany –Construction International +Equipment BAUER Maschinen GmbH
Equipment Subsidiaries
Resources ++-- weak - slightly weak adequate + well adequate ++ very well adequate
Q1 2011 Reach in monthsin relation to total Group revenues full year 2010
TOTAL
Construction
Equipment
Resources
EUR 671 million
EUR 343 million
EUR 161 million
EUR 168 million
6.2 months
6.7 months
3.3 months*
11.3 months* incl. running small-type orders
Construction
Project size EUR 100,000 up to EUR 20 million
~ 50 / 50 infrastructure / large industrial buildings
~ 600 projects per year
Local financing (natural hedge) for project duration
Translation risk (consolidation) hedged
US$ business (~ 9 %) hedged, e.g. swaps
Equipment
~ 80 % of invoicing in EUR
US$ business (~ 10 %) hedged with permanent translation of individual machines
Production expansion to US, China and others to counteract currency risk Euro / US$ / RMB and others
© BAUER AG, D-86529 Schrobenhausen11-5-13 IR-Presentation_AnalystConference_Q12011 15
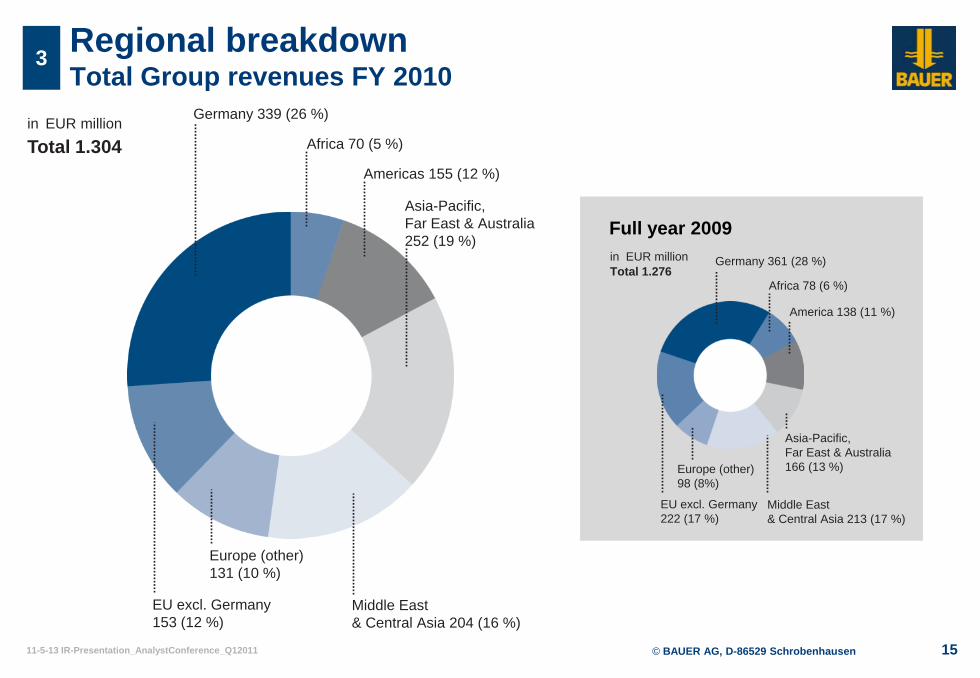
3 Regional breakdownTotal Group revenues FY 2010
in EUR million
Total 1.304
in EUR million
Africa 78 (6 %)
America 138 (11 %)
Asia-Pacific,Far East & Australia166 (13 %)
Middle East& Central Asia 213 (17 %)
Germany 361 (28 %)
EU excl. Germany222 (17 %)
Europe (other)98 (8%)
Total 1.276
Full year 2009
Africa 70 (5 %)
Americas 155 (12 %)
Asia-Pacific,Far East & Australia 252 (19 %)
Middle East & Central Asia 204 (16 %)
Germany 339 (26 %)
EU excl. Germany153 (12 %)
Europe (other)131 (10 %)
© BAUER AG, D-86529 Schrobenhausen11-5-13 IR-Presentation_AnalystConference_Q12011 16
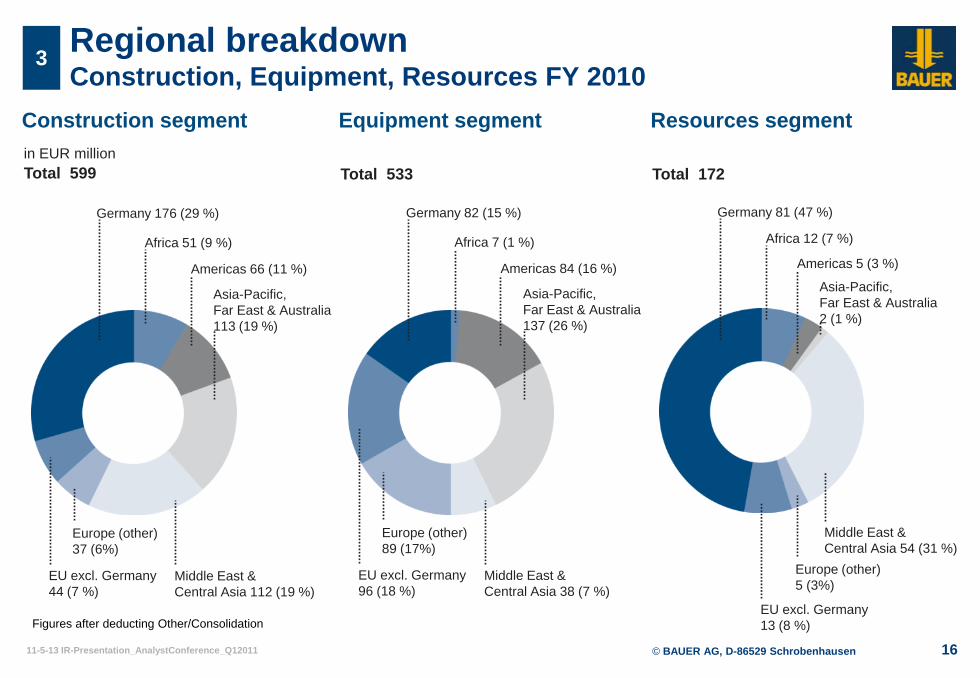
3 Regional breakdown Construction, Equipment, Resources FY 2010
Figures after deducting Other/Consolidation
Construction segment Equipment segment Resources segmentin EUR millionTotal 599 Total 533 Total 172
Africa 51 (9 %)
Americas 66 (11 %)
Asia-Pacific,Far East & Australia 113 (19 %)
Middle East &Central Asia 112 (19 %)
Germany 176 (29 %)
EU excl. Germany44 (7 %)
Europe (other)37 (6%)
Africa 7 (1 %)
Americas 84 (16 %)
Asia-Pacific,Far East & Australia 137 (26 %)
Middle East &Central Asia 38 (7 %)
Germany 82 (15 %)
EU excl. Germany96 (18 %)
Europe (other)89 (17%)
Africa 12 (7 %)
Americas 5 (3 %)
Asia-Pacific,Far East & Australia 2 (1 %)
Middle East & Central Asia 54 (31 %)
Germany 81 (47 %)
EU excl. Germany13 (8 %)
Europe (other)5 (3%)
© BAUER AG, D-86529 Schrobenhausen11-5-13 IR-Presentation_AnalystConference_Q12011 17
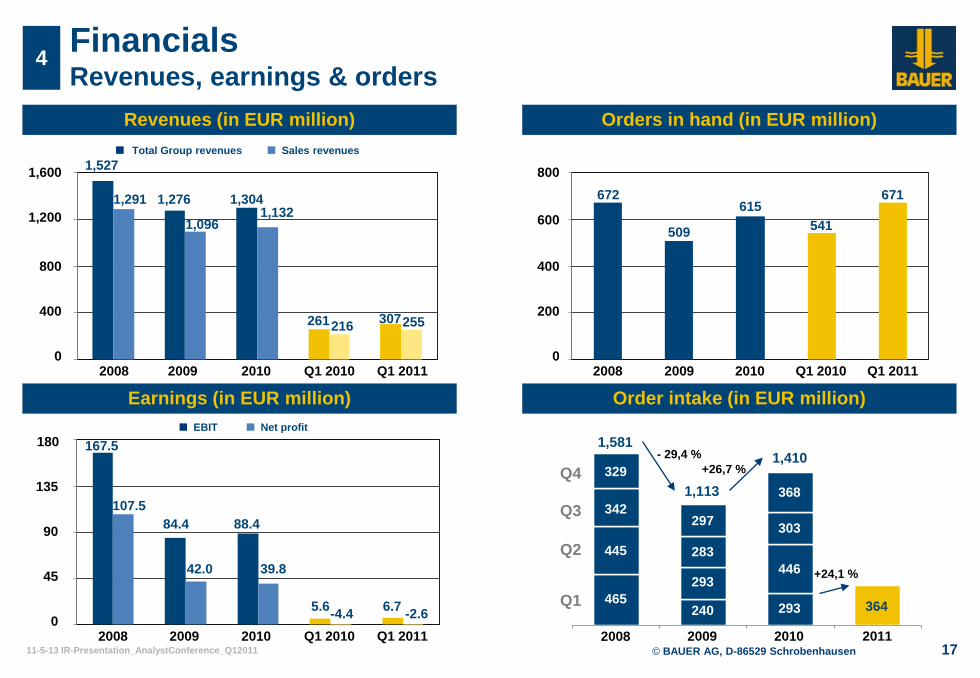
Revenues (in EUR million)
Earnings (in EUR million)
FinancialsRevenues, earnings & orders
4
1,276
1,096
2010 Q1 2010
1,600
1,200
800
400
0
261
1,132
Total Group revenues Sales revenues
84.4
42.0
2010
180
135
90
45
0
88.4
39.8
EBIT Net profit
Orders in hand (in EUR million)
509
2010
800
600
400
200
0
615
Order intake (in EUR million)
Q1
Q2
Q3
Q4
2009
297
283
293
240
1,113
2009
1,527
1,291
2009
107.5
167.5
2009
672
2008
465
445
342
329
1,581- 29,4 %
2008
2008
2008
2010
303
446
293
368
1,410+26,7 %
Q1 2011
1,304
307216 255
5.6-4.4 6.7 -2.6Q1 2010 Q1 2011
Q1 2010 Q1 2011
541
671
364
2011
+24,1 %
© BAUER AG, D-86529 Schrobenhausen11-5-13 IR-Presentation_AnalystConference_Q12011 18
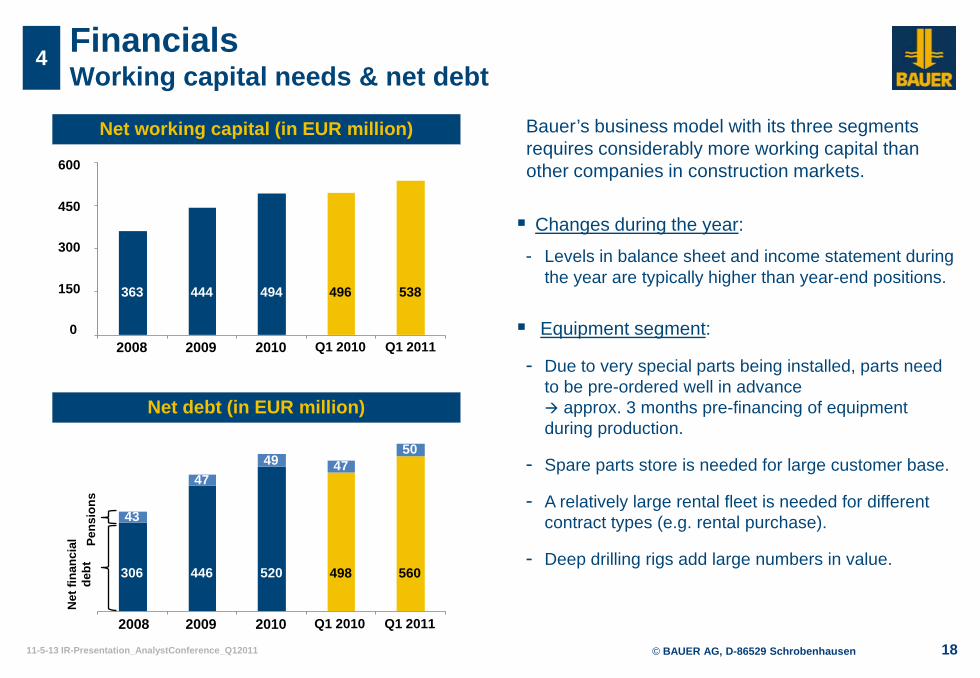
FinancialsWorking capital needs & net debt
4
Net debt (in EUR million)
2008 2009 2010
306
Net
fina
ncia
l de
btPe
nsio
ns
43
446 520
4749
Bauer’s business model with its three segments requires considerably more working capital than other companies in construction markets.
Changes during the year:
- Levels in balance sheet and income statement during the year are typically higher than year-end positions.
Equipment segment:
- Due to very special parts being installed, parts need to be pre-ordered well in advance approx. 3 months pre-financing of equipment during production.
- Spare parts store is needed for large customer base.
- A relatively large rental fleet is needed for different contract types (e.g. rental purchase).
- Deep drilling rigs add large numbers in value.
Net working capital (in EUR million)
2008 2009 2010
363 444 494
600
450
300
150
0
496 538
498 560
4750
Q1 2010 Q1 2011
Q1 2010 Q1 2011
© BAUER AG, D-86529 Schrobenhausen11-5-13 IR-Presentation_AnalystConference_Q12011 19
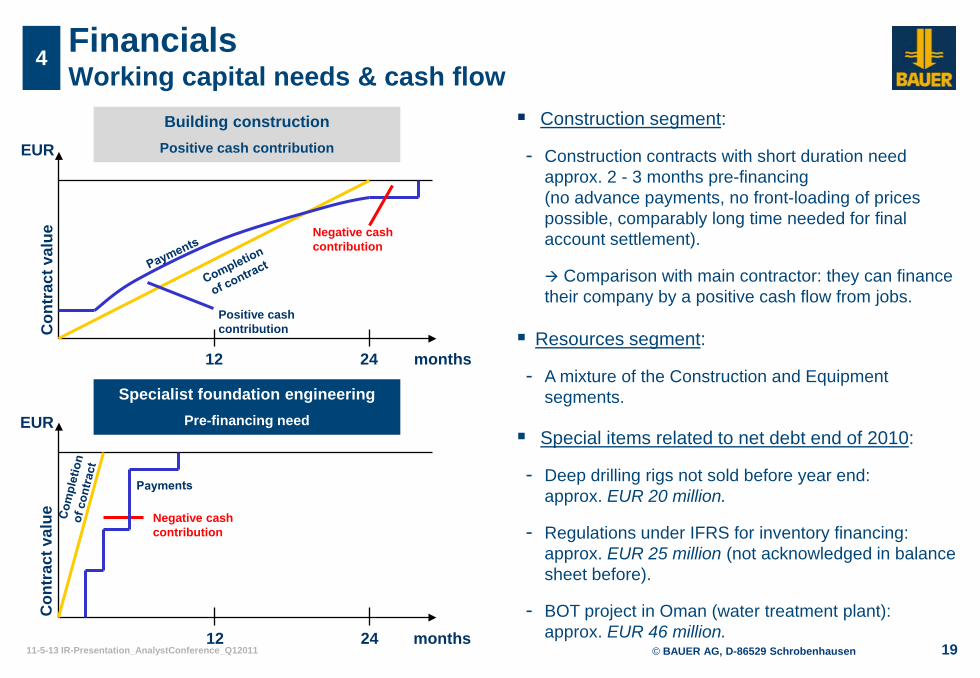
Building constructionPositive cash contribution
Specialist foundation engineeringPre-financing need
Financials Working capital needs & cash flow
4
EUR
12 24 months
Positive cash contribution
Negative cash contribution
Con
trac
t val
ue
EUR
Negative cash contribution
12 24 months
Con
trac
t val
ue
Construction segment:
- Construction contracts with short duration need approx. 2 - 3 months pre-financing(no advance payments, no front-loading of prices possible, comparably long time needed for final account settlement).
Comparison with main contractor: they can finance their company by a positive cash flow from jobs.
Resources segment:
- A mixture of the Construction and Equipment segments.
Special items related to net debt end of 2010:
- Deep drilling rigs not sold before year end:approx. EUR 20 million.
- Regulations under IFRS for inventory financing: approx. EUR 25 million (not acknowledged in balance sheet before).
- BOT project in Oman (water treatment plant):approx. EUR 46 million.
© BAUER AG, D-86529 Schrobenhausen11-5-13 IR-Presentation_AnalystConference_Q12011 20
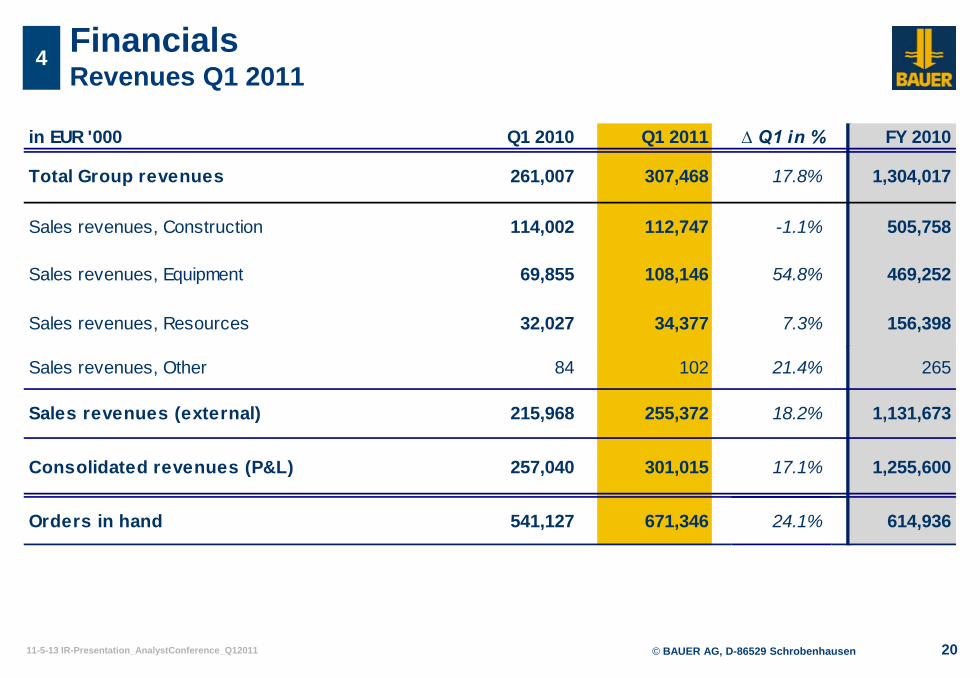
FinancialsRevenues Q1 2011
4
in EUR '000 Q1 2010 Q1 2011 ∆ Q1 in % FY 2010
Total Group revenues 261,007 307,468 17.8% 1,304,017
Sales revenues, Construction 114,002 112,747 -1.1% 505,758
Sales revenues, Equipment 69,855 108,146 54.8% 469,252
Sales revenues, Resources 32,027 34,377 7.3% 156,398
Sales revenues, Other 84 102 21.4% 265
Sales revenues (external) 215,968 255,372 18.2% 1,131,673
Consolidated revenues (P&L) 257,040 301,015 17.1% 1,255,600
Orders in hand 541,127 671,346 24.1% 614,936
© BAUER AG, D-86529 Schrobenhausen11-5-13 IR-Presentation_AnalystConference_Q12011 21
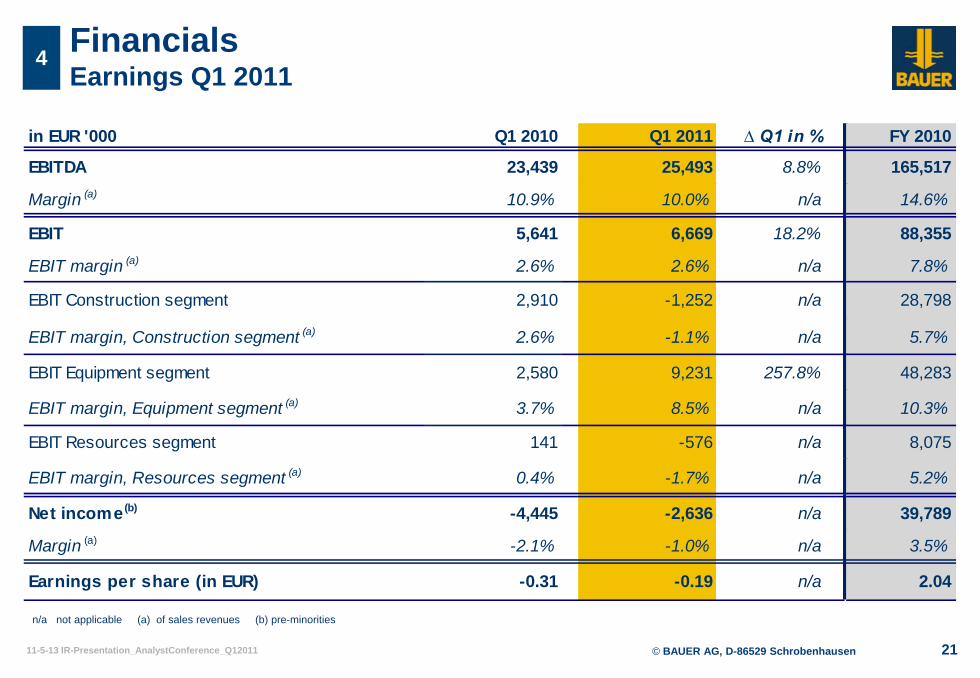
FinancialsEarnings Q1 2011
4
n/a not applicable (a) of sales revenues (b) pre-minorities
in EUR '000 Q1 2010 Q1 2011 ∆ Q1 in % FY 2010
EBITDA 23,439 25,493 8.8% 165,517
Margin (a) 10.9% 10.0% n/a 14.6%
EBIT 5,641 6,669 18.2% 88,355
EBIT margin (a) 2.6% 2.6% n/a 7.8%
EBIT Construction segment 2,910 -1,252 n/a 28,798
EBIT margin, Construction segment (a) 2.6% -1.1% n/a 5.7%
EBIT Equipment segment 2,580 9,231 257.8% 48,283
EBIT margin, Equipment segment (a) 3.7% 8.5% n/a 10.3%
EBIT Resources segment 141 -576 n/a 8,075
EBIT margin, Resources segment (a) 0.4% -1.7% n/a 5.2%
Net income(b) -4,445 -2,636 n/a 39,789
Margin (a) -2.1% -1.0% n/a 3.5%
Earnings per share (in EUR) -0.31 -0.19 n/a 2.04
© BAUER AG, D-86529 Schrobenhausen11-5-13 IR-Presentation_AnalystConference_Q12011 22
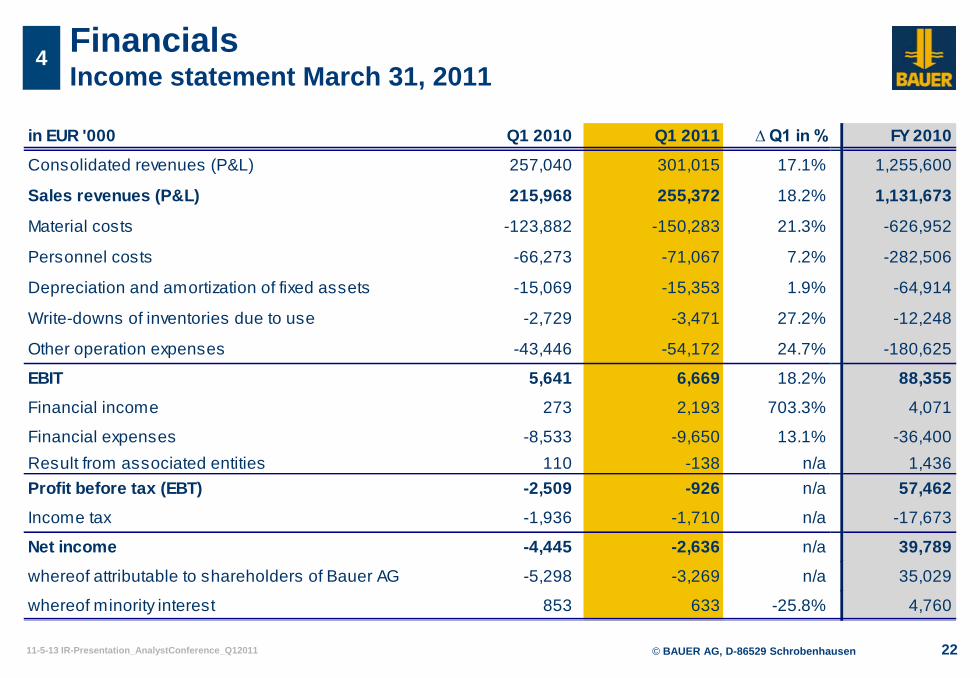
FinancialsIncome statement March 31, 2011
4
in EUR '000 Q1 2010 Q1 2011 ∆ Q1 in % FY 2010
Consolidated revenues (P&L) 257,040 301,015 17.1% 1,255,600
Sales revenues (P&L) 215,968 255,372 18.2% 1,131,673
Material costs -123,882 -150,283 21.3% -626,952
Personnel costs -66,273 -71,067 7.2% -282,506
Depreciation and amortization of fixed assets -15,069 -15,353 1.9% -64,914
Write-downs of inventories due to use -2,729 -3,471 27.2% -12,248
Other operation expenses -43,446 -54,172 24.7% -180,625
EBIT 5,641 6,669 18.2% 88,355
Financial income 273 2,193 703.3% 4,071
Financial expenses -8,533 -9,650 13.1% -36,400Result from associated entities 110 -138 n/a 1,436Profit before tax (EBT) -2,509 -926 n/a 57,462
Income tax -1,936 -1,710 n/a -17,673
Net income -4,445 -2,636 n/a 39,789
whereof attributable to shareholders of Bauer AG -5,298 -3,269 n/a 35,029
whereof minority interest 853 633 -25.8% 4,760
© BAUER AG, D-86529 Schrobenhausen11-5-13 IR-Presentation_AnalystConference_Q12011 23
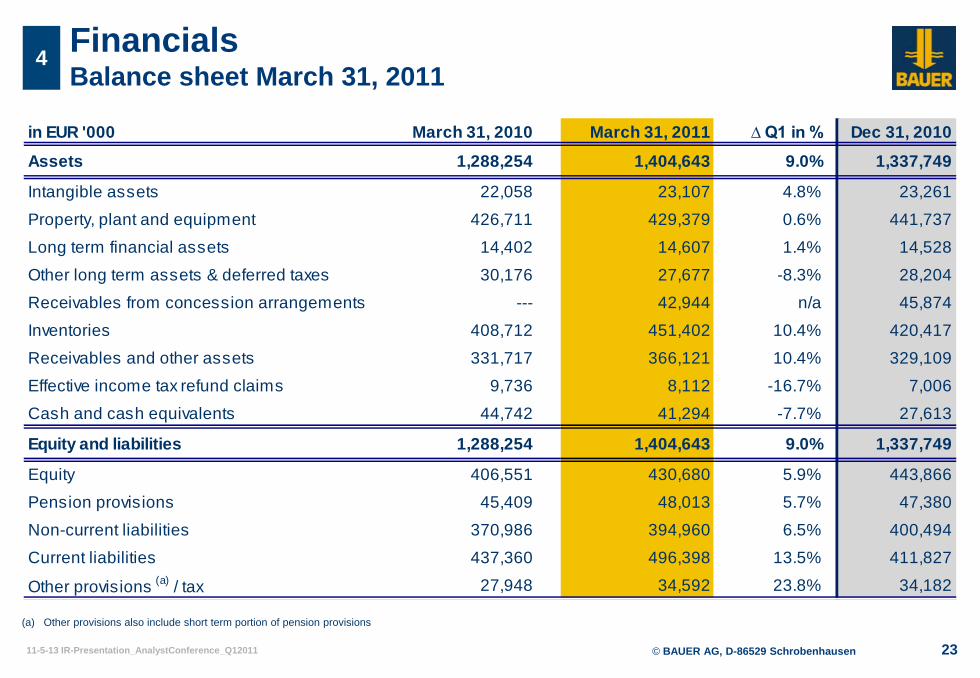
Financials Balance sheet March 31, 2011
4
(a) Other provisions also include short term portion of pension provisions
in EUR '000 March 31, 2010 March 31, 2011 ∆ Q1 in % Dec 31, 2010
Assets 1,288,254 1,404,643 9.0% 1,337,749
Intangible assets 22,058 23,107 4.8% 23,261
Property, plant and equipment 426,711 429,379 0.6% 441,737
Long term financial assets 14,402 14,607 1.4% 14,528
Other long term assets & deferred taxes 30,176 27,677 -8.3% 28,204
Receivables from concession arrangements --- 42,944 n/a 45,874
Inventories 408,712 451,402 10.4% 420,417
Receivables and other assets 331,717 366,121 10.4% 329,109
Effective income tax refund claims 9,736 8,112 -16.7% 7,006
Cash and cash equivalents 44,742 41,294 -7.7% 27,613
Equity and liabilities 1,288,254 1,404,643 9.0% 1,337,749
Equity 406,551 430,680 5.9% 443,866
Pension provisions 45,409 48,013 5.7% 47,380
Non-current liabilities 370,986 394,960 6.5% 400,494
Current liabilities 437,360 496,398 13.5% 411,827
Other provisions (a) / tax 27,948 34,592 23.8% 34,182
© BAUER AG, D-86529 Schrobenhausen11-5-13 IR-Presentation_AnalystConference_Q12011 24
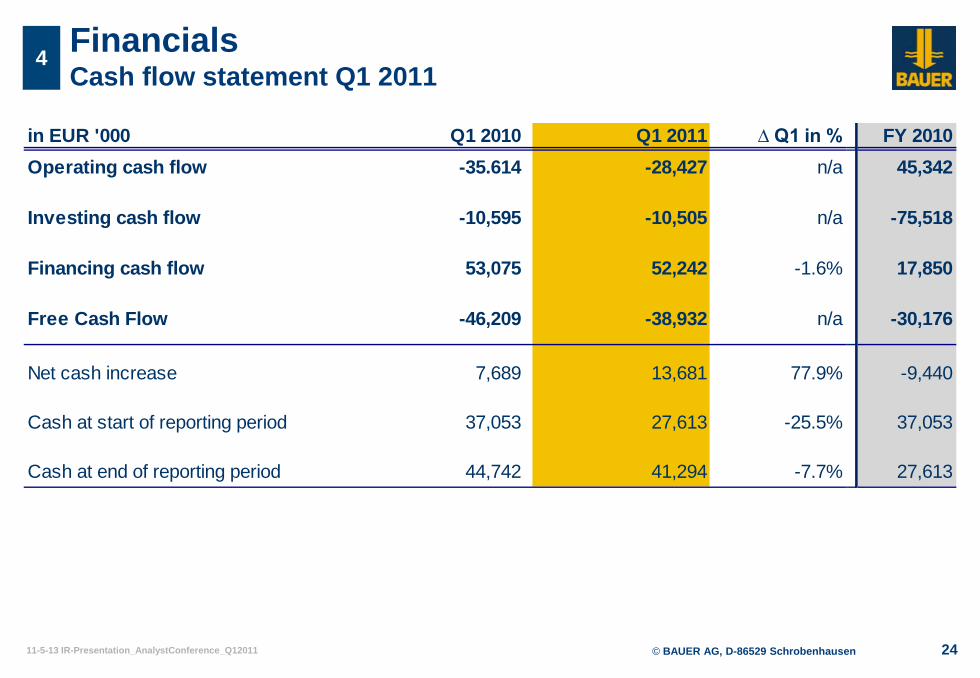
FinancialsCash flow statement Q1 2011
4
in EUR '000 Q1 2010 Q1 2011 ∆ Q1 in % FY 2010Operating cash flow -35.614 -28,427 n/a 45,342
Investing cash flow -10,595 -10,505 n/a -75,518
Financing cash flow 53,075 52,242 -1.6% 17,850
Free Cash Flow -46,209 -38,932 n/a -30,176
Net cash increase 7,689 13,681 77.9% -9,440
Cash at start of reporting period 37,053 27,613 -25.5% 37,053
Cash at end of reporting period 44,742 41,294 -7.7% 27,613
© BAUER AG, D-86529 Schrobenhausen11-5-13 IR-Presentation_AnalystConference_Q12011 25
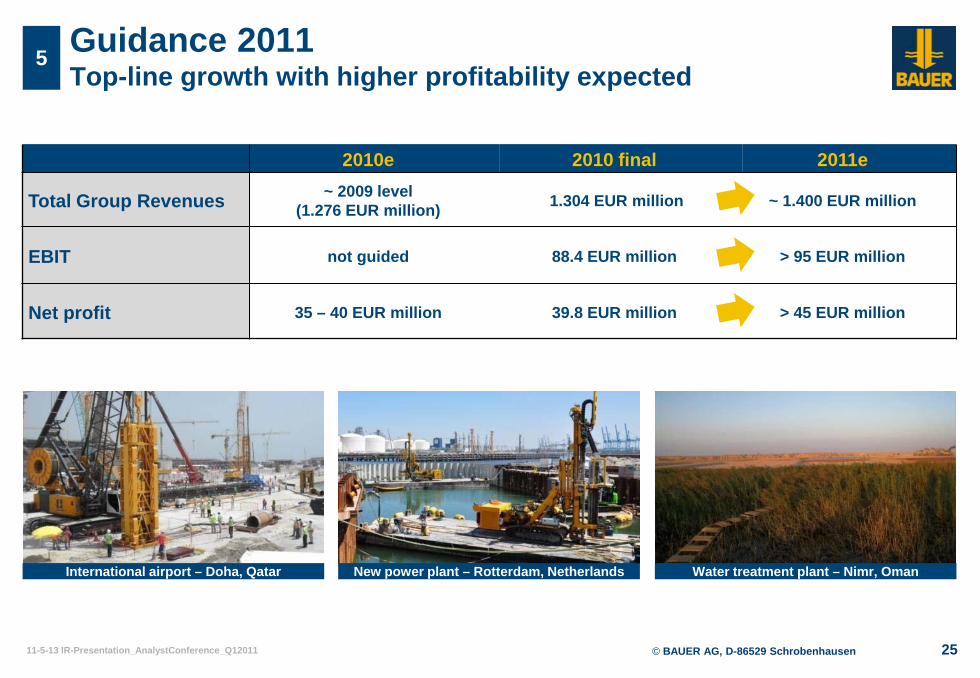
Guidance 2011Top-line growth with higher profitability expected
5
2010e 2010 final 2011e
Total Group Revenues ~ 2009 level (1.276 EUR million) 1.304 EUR million ~ 1.400 EUR million
EBIT not guided 88.4 EUR million > 95 EUR million
Net profit 35 – 40 EUR million 39.8 EUR million > 45 EUR million
International airport – Doha, Qatar New power plant – Rotterdam, Netherlands Water treatment plant – Nimr, Oman
© BAUER AG, D-86529 Schrobenhausen11-5-13 IR-Presentation_AnalystConference_Q12011 26
Appendix
Equipment programmeC
Resources projectsD
History of BauerA
E Market environment Germany
F BAUER share
Construction projectsB
p. 27
p. 29
p. 34
p. 39
p. 42
p. 43
G Key Figures Time Line p. 45
© BAUER AG, D-86529 Schrobenhausen11-5-13 IR-Presentation_AnalystConference_Q12011 27
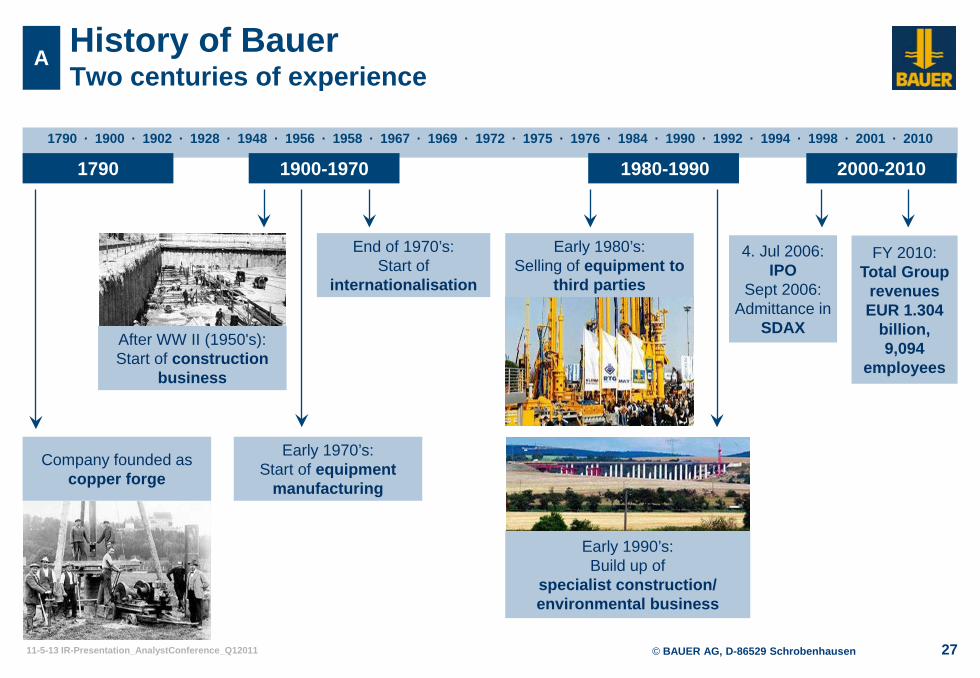
1790 · 1900 · 1902 · 1928 · 1948 · 1956 · 1958 · 1967 · 1969 · 1972 · 1975 · 1976 · 1984 · 1990 · 1992 · 1994 · 1998 · 2001 · 2010
History of BauerTwo centuries of experience
End of 1970’s:Start of
internationalisation
Early 1990’s:Build up of
specialist construction/ environmental business
FY 2010:Total Group
revenues EUR 1.304
billion, 9,094
employees
4. Jul 2006:IPO
Sept 2006:Admittance in
SDAX
A
Early 1970’s:Start of equipment
manufacturing
Company founded as copper forge
After WW II (1950's):Start of construction
business
Early 1980’s:Selling of equipment to
third parties
1790 1900-1970 1980-1990 2000-2010
© BAUER AG, D-86529 Schrobenhausen11-5-13 IR-Presentation_AnalystConference_Q12011 28
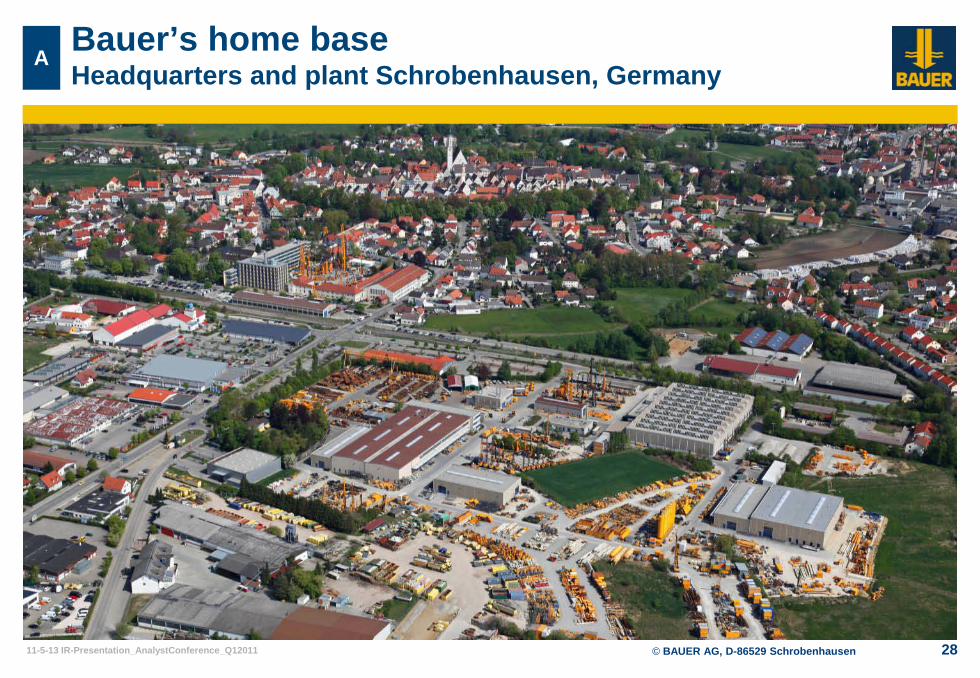
A Bauer’s home baseHeadquarters and plant Schrobenhausen, Germany
© BAUER AG, D-86529 Schrobenhausen11-5-13 IR-Presentation_AnalystConference_Q12011 29
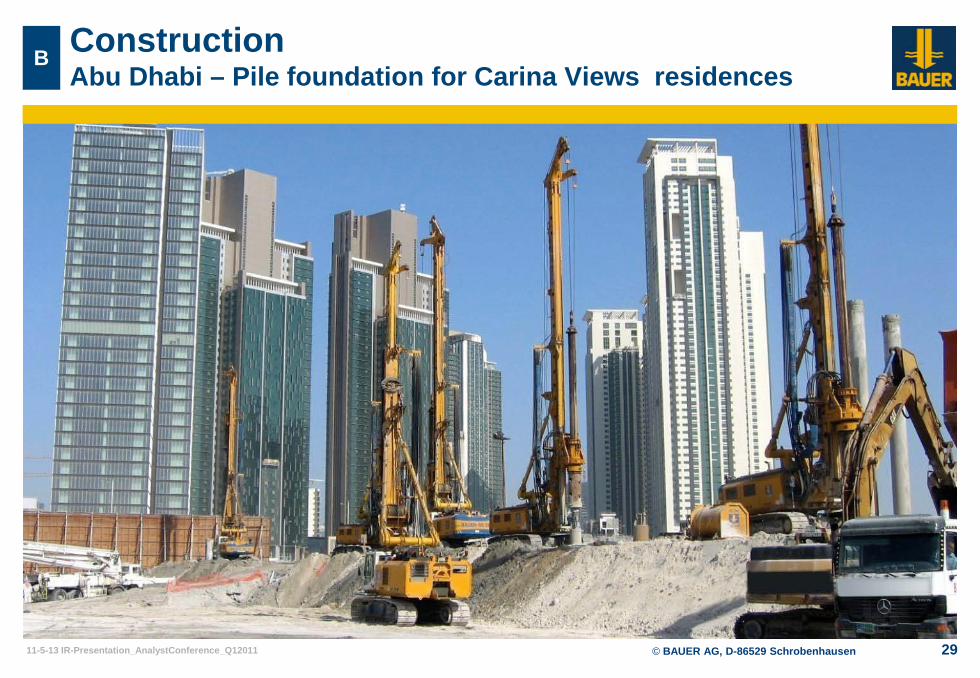
ConstructionAbu Dhabi – Pile foundation for Carina Views residences
B
© BAUER AG, D-86529 Schrobenhausen11-5-13 IR-Presentation_AnalystConference_Q12011 30
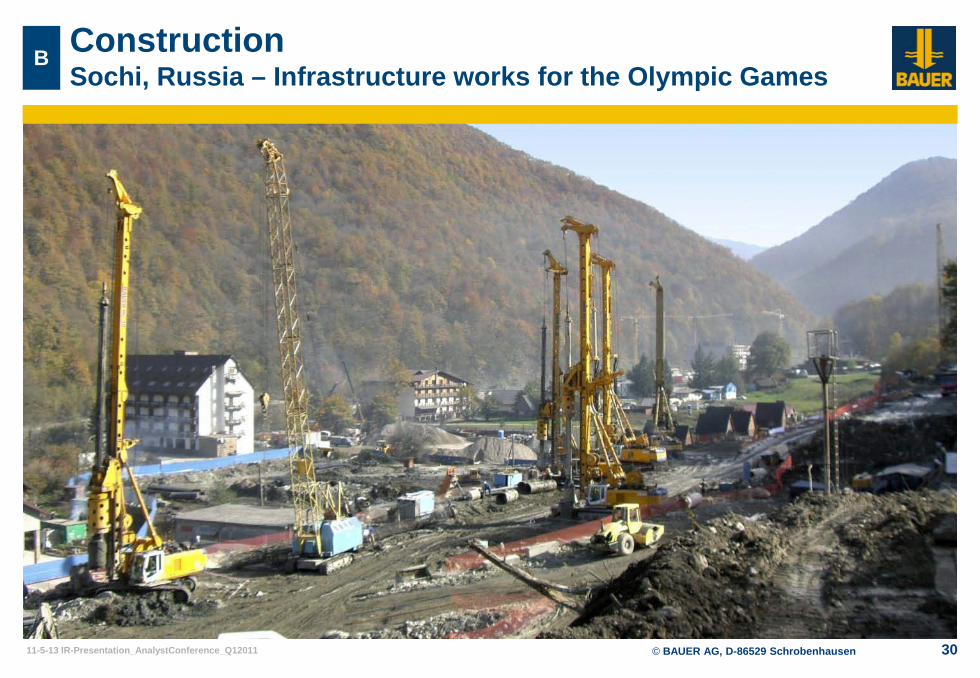
ConstructionSochi, Russia – Infrastructure works for the Olympic Games
B
© BAUER AG, D-86529 Schrobenhausen11-5-13 IR-Presentation_AnalystConference_Q12011 31
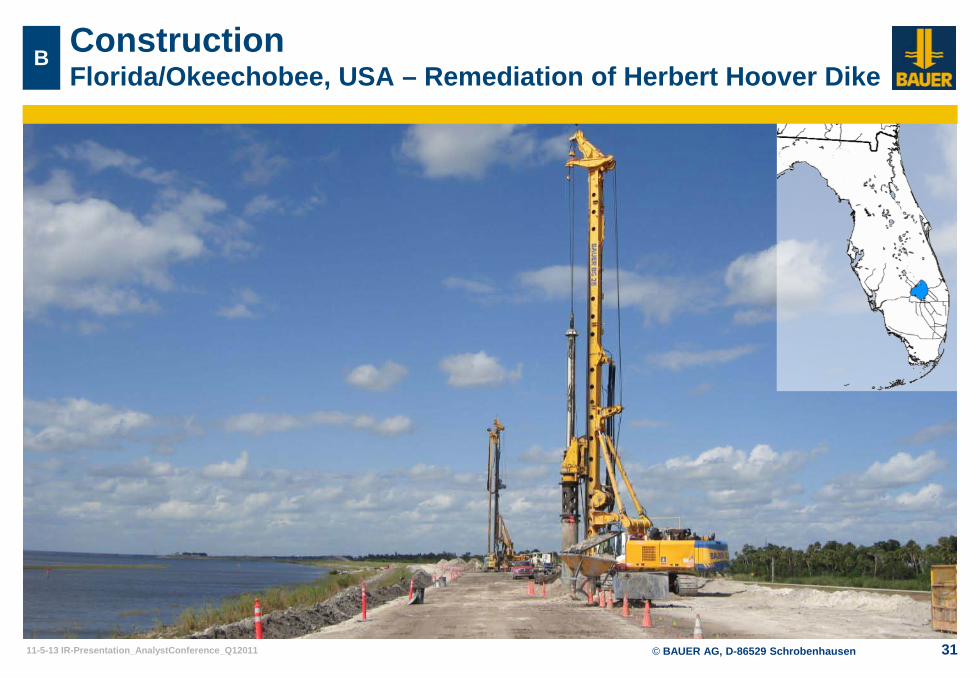
B ConstructionFlorida/Okeechobee, USA – Remediation of Herbert Hoover Dike
© BAUER AG, D-86529 Schrobenhausen11-5-13 IR-Presentation_AnalystConference_Q12011 32
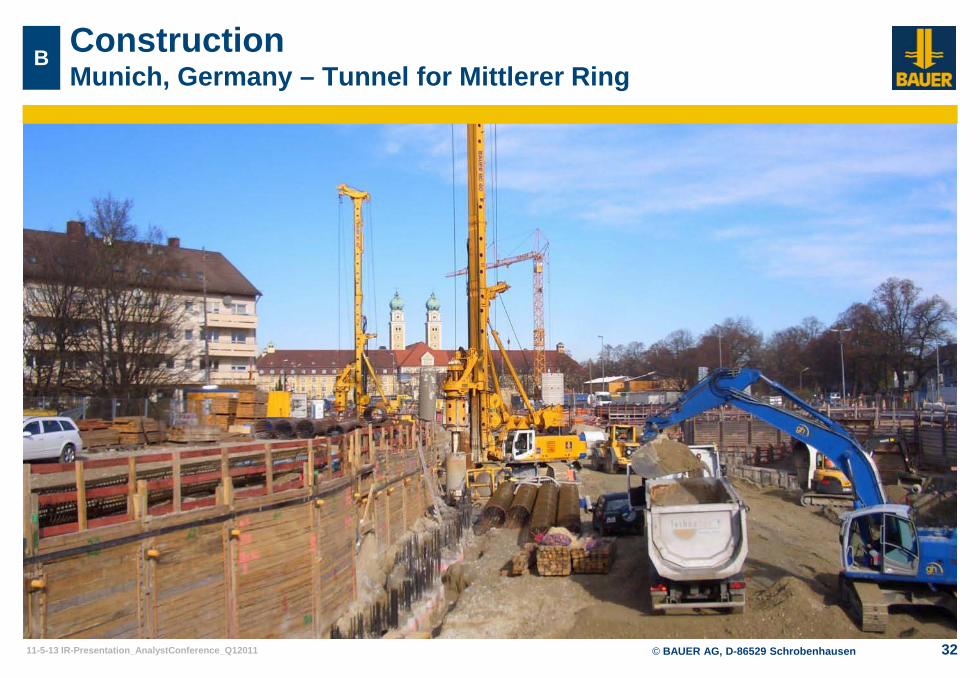
ConstructionMunich, Germany – Tunnel for Mittlerer Ring
B
© BAUER AG, D-86529 Schrobenhausen11-5-13 IR-Presentation_AnalystConference_Q12011 33
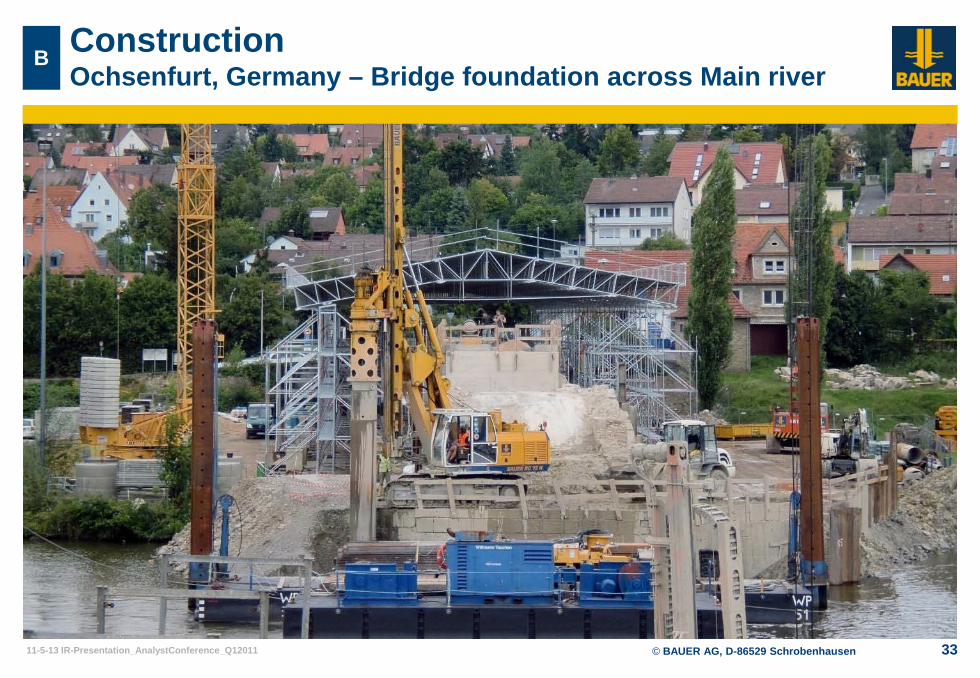
ConstructionOchsenfurt, Germany – Bridge foundation across Main river
B
© BAUER AG, D-86529 Schrobenhausen11-5-13 IR-Presentation_AnalystConference_Q12011 34
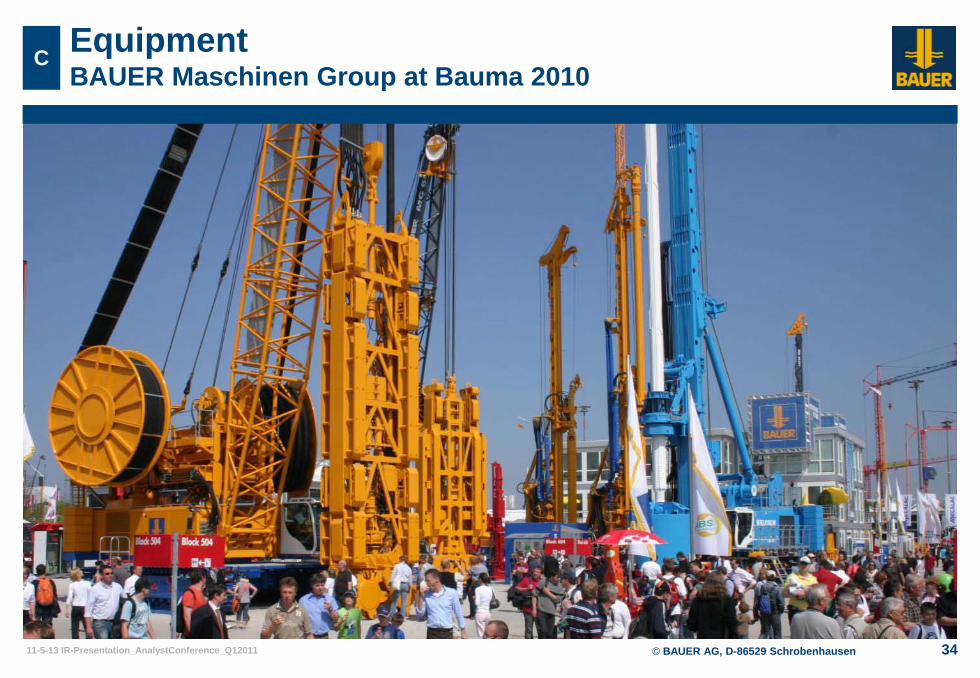
EquipmentBAUER Maschinen Group at Bauma 2010
C
© BAUER AG, D-86529 Schrobenhausen11-5-13 IR-Presentation_AnalystConference_Q12011 35
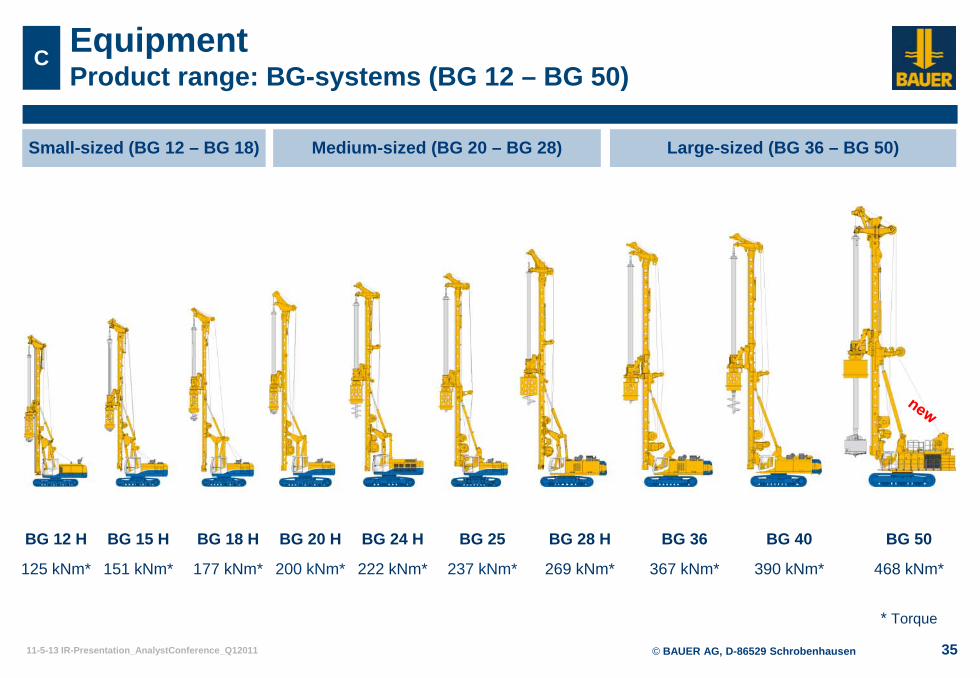
EquipmentProduct range: BG-systems (BG 12 – BG 50)
C
Small-sized (BG 12 – BG 18) Medium-sized (BG 20 – BG 28) Large-sized (BG 36 – BG 50)
* Torque
BG 12 H BG 15 H BG 18 H BG 20 H BG 24 H BG 28 H BG 36 BG 40
125 kNm* 151 kNm* 177 kNm* 200 kNm* 222 kNm* 269 kNm* 367 kNm* 390 kNm*
BG 50
468 kNm*
BG 25
237 kNm*
© BAUER AG, D-86529 Schrobenhausen11-5-13 IR-Presentation_AnalystConference_Q12011 36
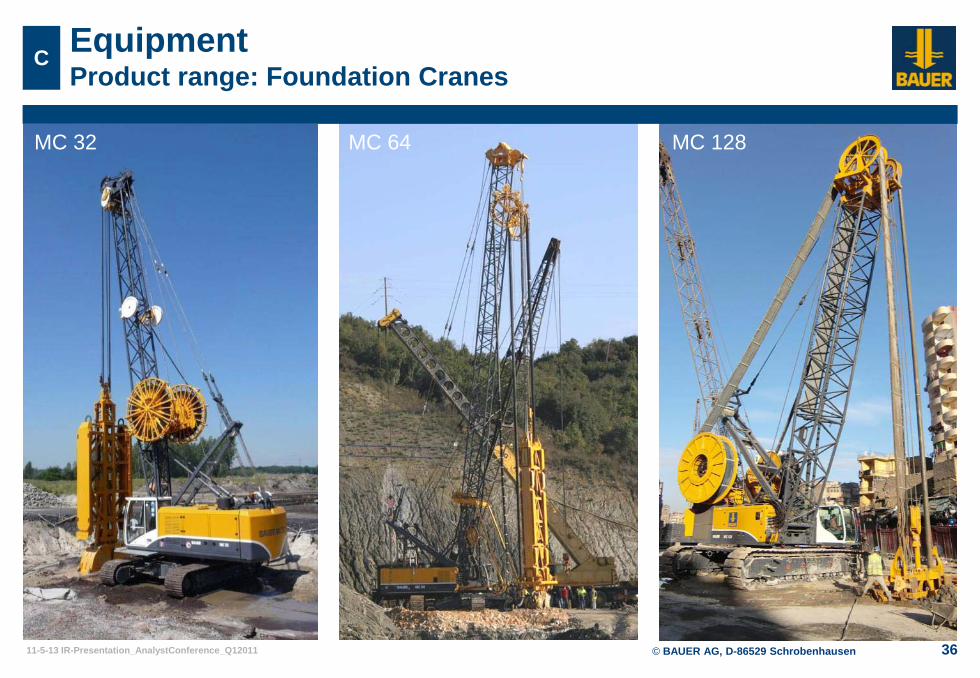
C EquipmentProduct range: Foundation Cranes
MC 128MC 64MC 32
© BAUER AG, D-86529 Schrobenhausen11-5-13 IR-Presentation_AnalystConference_Q12011 37
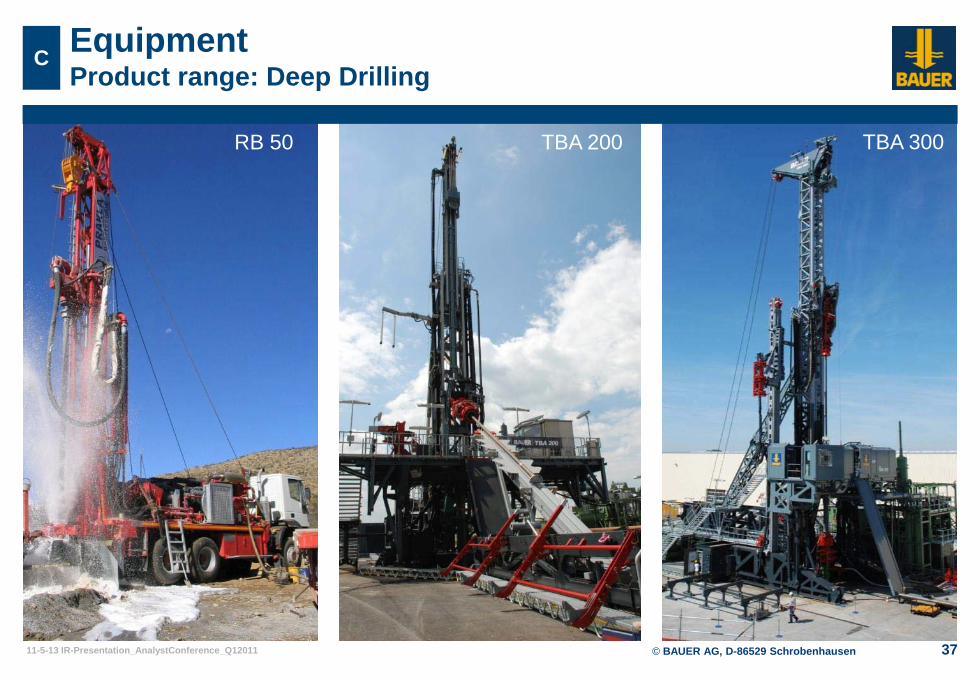
C EquipmentProduct range: Deep Drilling
RB 50 TBA 200 TBA 300
© BAUER AG, D-86529 Schrobenhausen11-5-13 IR-Presentation_AnalystConference_Q12011 38
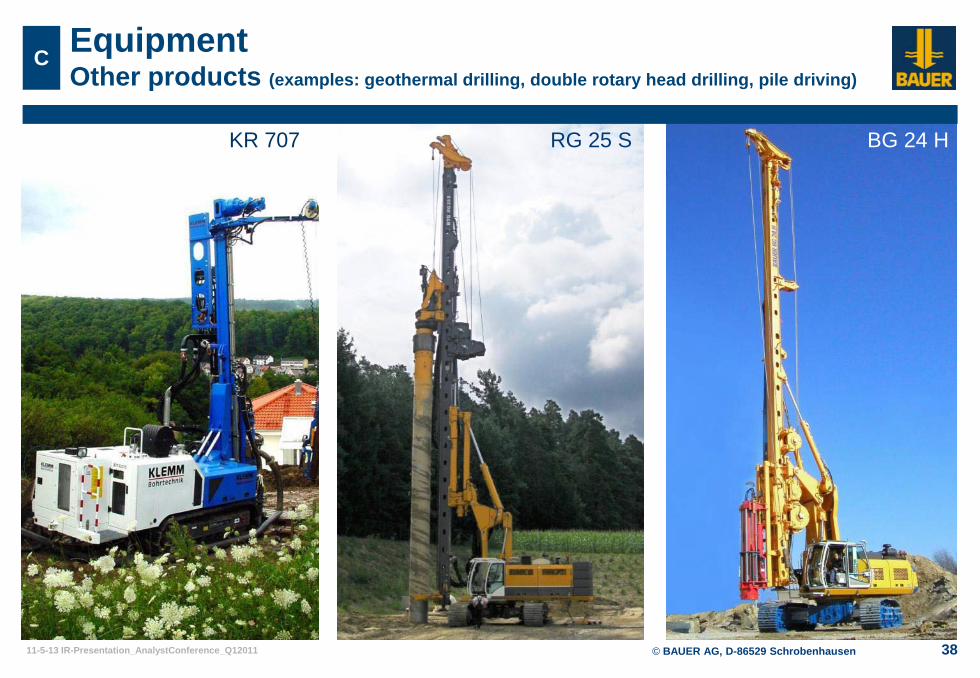
C EquipmentOther products (examples: geothermal drilling, double rotary head drilling, pile driving)
KR 707 RG 25 S BG 24 H
© BAUER AG, D-86529 Schrobenhausen11-5-13 IR-Presentation_AnalystConference_Q12011 39
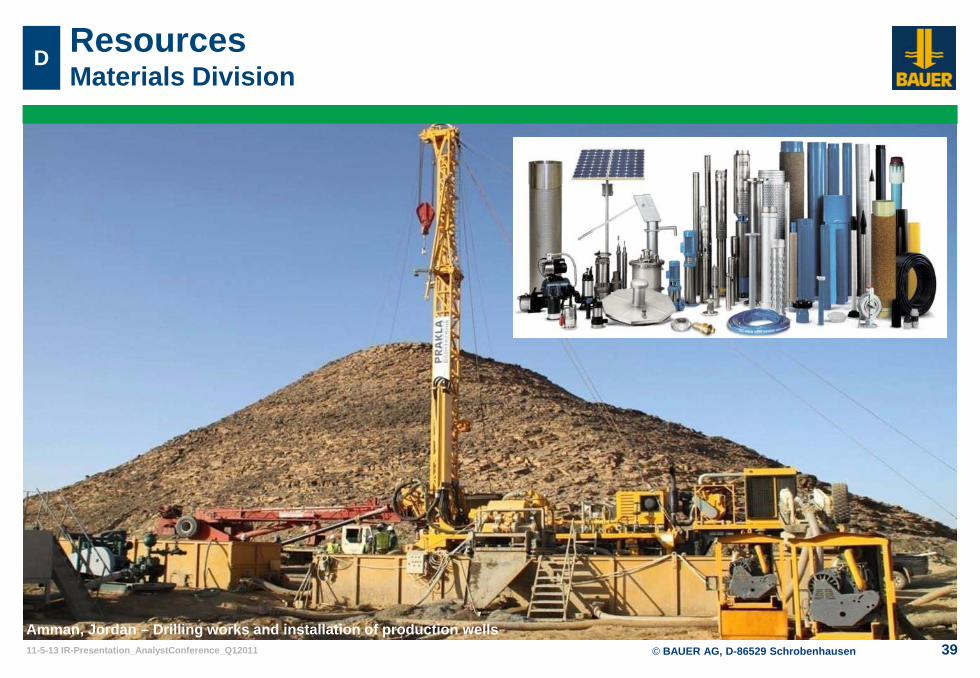
ResourcesMaterials Division
D
Amman, Jordan – Drilling works and installation of production wells

© BAUER AG, D-86529 Schrobenhausen11-5-13 IR-Presentation_AnalystConference_Q12011 40
ResourcesExploration and Mining Services Division
D
Canada - Highland Valley Copper Mine Jordan - Oil drilling rig
Canada – Diavik Mine
© BAUER AG, D-86529 Schrobenhausen11-5-13 IR-Presentation_AnalystConference_Q12011 41
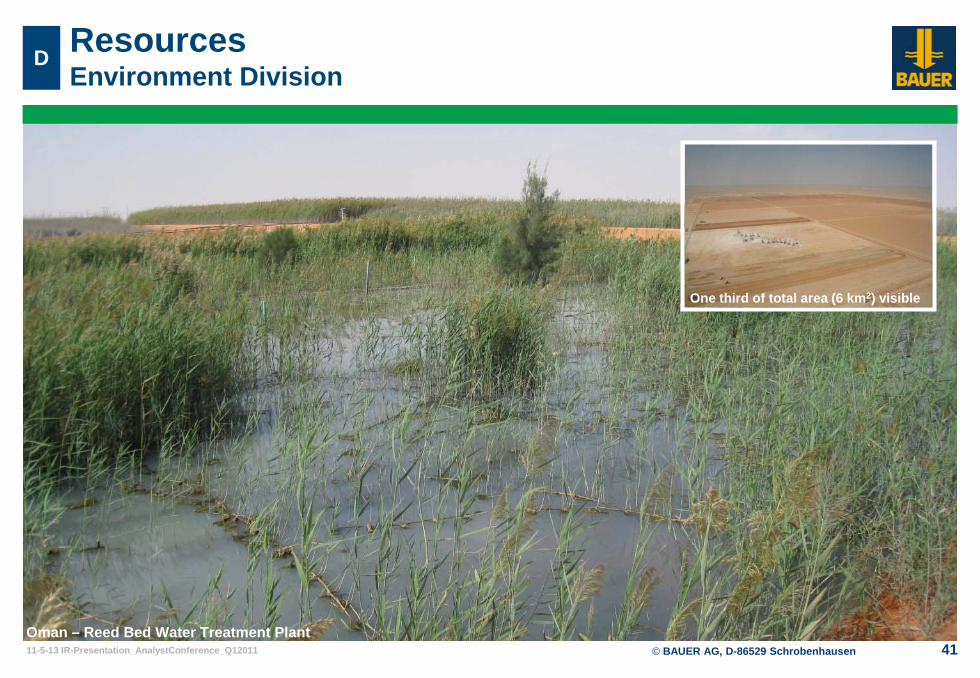
ResourcesEnvironment Division
D
Oman – Reed Bed Water Treatment Plant
One third of total area (6 km2) visible
© BAUER AG, D-86529 Schrobenhausen11-5-13 IR-Presentation_AnalystConference_Q12011 42
West-Germany
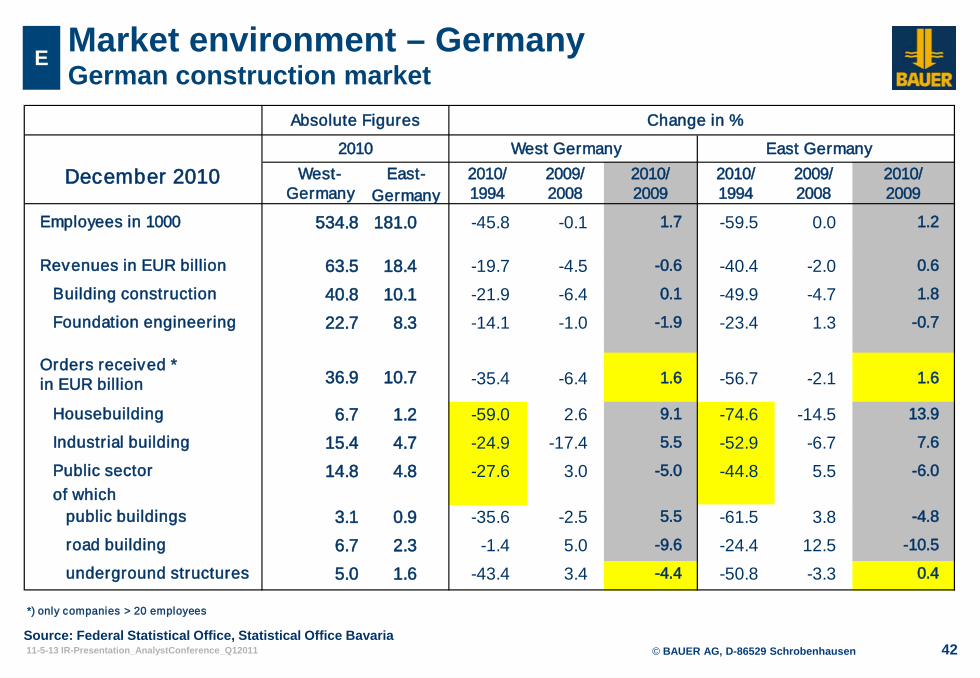
Employees in 1000 534.8 181.0 -45.8 -0.1 1.7 -59.5 0.0 1.2
Revenues in EUR billion 63.5 18.4 -19.7 -4.5 -0.6 -40.4 -2.0 0.6
Building construction 40.8 10.1 -21.9 -6.4 0.1 -49.9 -4.7 1.8
Foundation engineering 22.7 8.3 -14.1 -1.0 -1.9 -23.4 1.3 -0.7
Orders received *in EUR billion
Housebuilding 6.7 1.2 -59.0 2.6 9.1 -74.6 -14.5 13.9
Industrial building 15.4 4.7 -24.9 -17.4 5.5 -52.9 -6.7 7.6
Public sectorof which
public buildings 3.1 0.9 -35.6 -2.5 5.5 -61.5 3.8 -4.8
road building 6.7 2.3 -1.4 5.0 -9.6 -24.4 12.5 -10.5
underground structures 5.0 1.6 -43.4 3.4 -4.4 -50.8 -3.3 0.4
*) only companies > 20 employees
Absolute Figures
2010
-5.0 -44.814.8 4.8 5.5 -6.0-27.6 3.0
-2.1
2009
1.6-35.4
1994
1.6
2008
-6.4 -56.736.9 10.7
2009December 2010 2009/ 2010/
1994 2008East-
Germany2010/ 2010/
Change in %
West Germany East Germany2009/2010/
Market environment – GermanyGerman construction market
E
Source: Federal Statistical Office, Statistical Office Bavaria
© BAUER AG, D-86529 Schrobenhausen11-5-13 IR-Presentation_AnalystConference_Q12011 43
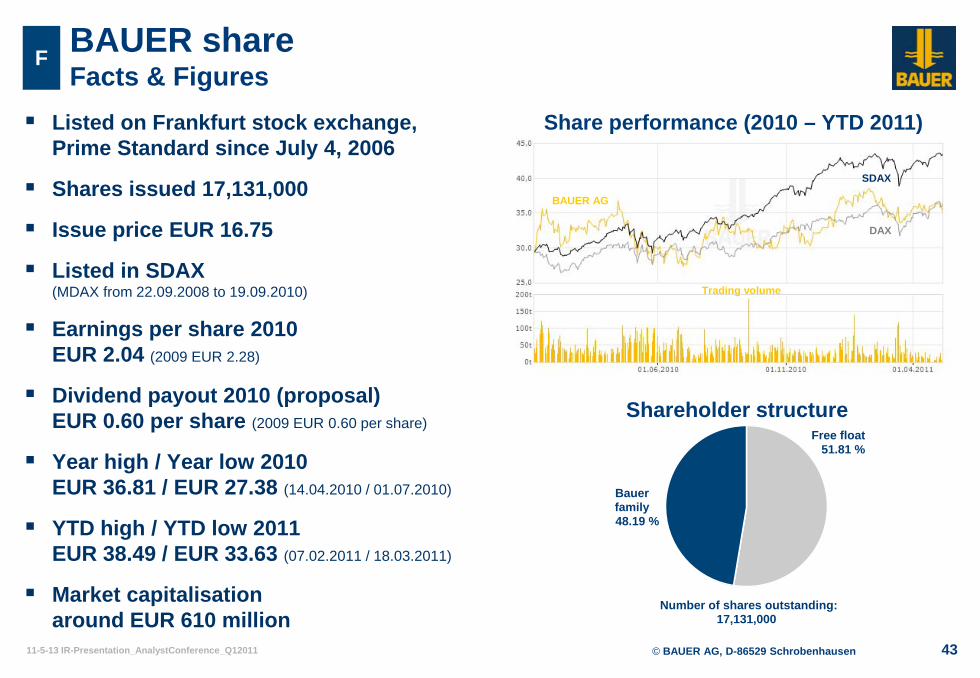
BAUER shareFacts & Figures
F
Bauerfamily48.19 %
Free float51.81 %
Number of shares outstanding:17,131,000
Listed on Frankfurt stock exchange, Prime Standard since July 4, 2006
Shares issued 17,131,000
Issue price EUR 16.75
Listed in SDAX(MDAX from 22.09.2008 to 19.09.2010)
Earnings per share 2010 EUR 2.04 (2009 EUR 2.28)
Dividend payout 2010 (proposal)EUR 0.60 per share (2009 EUR 0.60 per share)
Year high / Year low 2010EUR 36.81 / EUR 27.38 (14.04.2010 / 01.07.2010)
YTD high / YTD low 2011EUR 38.49 / EUR 33.63 (07.02.2011 / 18.03.2011)
Market capitalisation around EUR 610 million
Shareholder structure
Share performance (2010 – YTD 2011)
SDAX
DAX
Trading volume
BAUER AG
© BAUER AG, D-86529 Schrobenhausen11-5-13 IR-Presentation_AnalystConference_Q12011 44
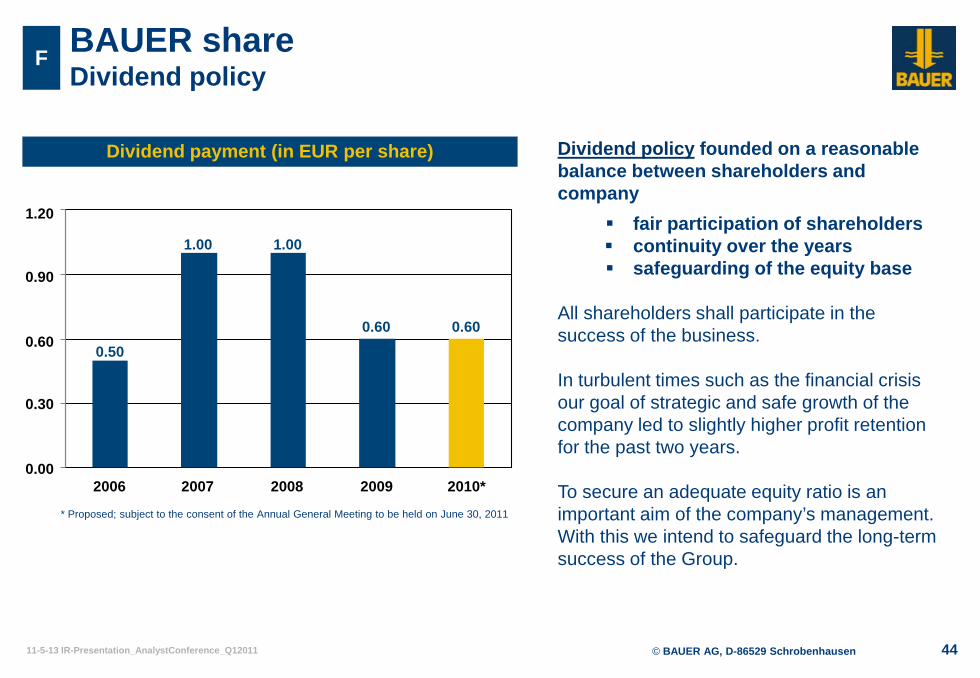
BAUER shareDividend policy
F
2009
Dividend payment (in EUR per share)
2010*200820072006
0.30
0.00
0.60
0.90
1.20
0.50
1.00 1.00
0.60 0.60
* Proposed; subject to the consent of the Annual General Meeting to be held on June 30, 2011
Dividend policy founded on a reasonable balance between shareholders and company
fair participation of shareholders continuity over the years safeguarding of the equity base
All shareholders shall participate in the success of the business.
In turbulent times such as the financial crisis our goal of strategic and safe growth of the company led to slightly higher profit retention for the past two years.
To secure an adequate equity ratio is an important aim of the company’s management. With this we intend to safeguard the long-term success of the Group.
© BAUER AG, D-86529 Schrobenhausen11-5-13 IR-Presentation_AnalystConference_Q12011 45
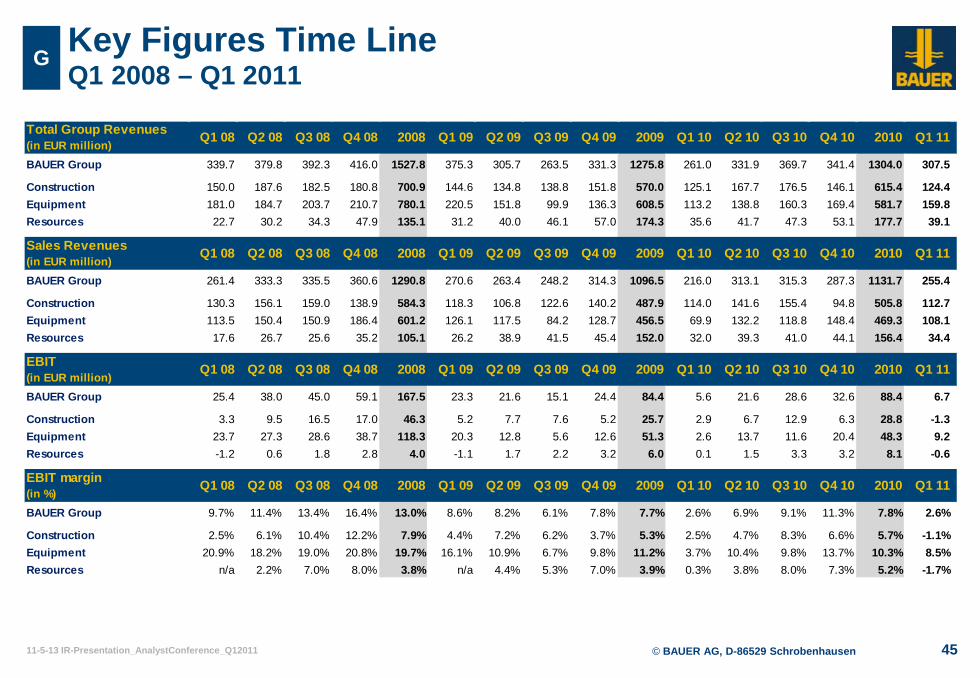
G Key Figures Time LineQ1 2008 – Q1 2011
Total Group Revenues(in EUR million)BAUER Group 339.7 379.8 392.3 416.0 1527.8 375.3 305.7 263.5 331.3 1275.8 261.0 331.9 369.7 341.4 1304.0 307.5
Construction 150.0 187.6 182.5 180.8 700.9 144.6 134.8 138.8 151.8 570.0 125.1 167.7 176.5 146.1 615.4 124.4Equipment 181.0 184.7 203.7 210.7 780.1 220.5 151.8 99.9 136.3 608.5 113.2 138.8 160.3 169.4 581.7 159.8Resources 22.7 30.2 34.3 47.9 135.1 31.2 40.0 46.1 57.0 174.3 35.6 41.7 47.3 53.1 177.7 39.1
Sales Revenues(in EUR million)BAUER Group 261.4 333.3 335.5 360.6 1290.8 270.6 263.4 248.2 314.3 1096.5 216.0 313.1 315.3 287.3 1131.7 255.4
Construction 130.3 156.1 159.0 138.9 584.3 118.3 106.8 122.6 140.2 487.9 114.0 141.6 155.4 94.8 505.8 112.7Equipment 113.5 150.4 150.9 186.4 601.2 126.1 117.5 84.2 128.7 456.5 69.9 132.2 118.8 148.4 469.3 108.1Resources 17.6 26.7 25.6 35.2 105.1 26.2 38.9 41.5 45.4 152.0 32.0 39.3 41.0 44.1 156.4 34.4
EBIT(in EUR million)BAUER Group 25.4 38.0 45.0 59.1 167.5 23.3 21.6 15.1 24.4 84.4 5.6 21.6 28.6 32.6 88.4 6.7
Construction 3.3 9.5 16.5 17.0 46.3 5.2 7.7 7.6 5.2 25.7 2.9 6.7 12.9 6.3 28.8 -1.3Equipment 23.7 27.3 28.6 38.7 118.3 20.3 12.8 5.6 12.6 51.3 2.6 13.7 11.6 20.4 48.3 9.2Resources -1.2 0.6 1.8 2.8 4.0 -1.1 1.7 2.2 3.2 6.0 0.1 1.5 3.3 3.2 8.1 -0.6
EBIT margin(in %)BAUER Group 9.7% 11.4% 13.4% 16.4% 13.0% 8.6% 8.2% 6.1% 7.8% 7.7% 2.6% 6.9% 9.1% 11.3% 7.8% 2.6%
Construction 2.5% 6.1% 10.4% 12.2% 7.9% 4.4% 7.2% 6.2% 3.7% 5.3% 2.5% 4.7% 8.3% 6.6% 5.7% -1.1%Equipment 20.9% 18.2% 19.0% 20.8% 19.7% 16.1% 10.9% 6.7% 9.8% 11.2% 3.7% 10.4% 9.8% 13.7% 10.3% 8.5%Resources n/a 2.2% 7.0% 8.0% 3.8% n/a 4.4% 5.3% 7.0% 3.9% 0.3% 3.8% 8.0% 7.3% 5.2% -1.7%
Q1 11
Q1 11
Q4 09 2009 Q1 10 Q2 10 Q3 10 Q4 10
Q3 10 Q4 10
Q1 08 Q2 08 Q3 08 Q4 08 2008 Q1 09 Q2 09 Q3 09
Q2 09 Q3 09 Q4 09 2009 Q1 10 Q2 10Q1 08 Q2 08 Q3 08 Q4 08 2008 Q1 09
Q2 10 Q3 10 Q4 10Q1 08 Q2 08 Q3 08 Q4 08 2008 Q1 09 Q2 09 Q3 09 Q4 09 2009 Q1 10
2009 Q1 10Q3 09 Q4 09 Q2 10 Q3 10 Q4 10Q1 08 Q2 08 Q3 08 Q4 08 2008 Q1 09 Q2 09
2010
2010
2010
2010
Q1 11
Q1 11
© BAUER AG, D-86529 Schrobenhausen11-5-13 IR-Presentation_AnalystConference_Q12011 46
Investor RelationsBAUER Aktiengesellschaft Tel.: +49 8252 97-1918 BAUER-Straße 1 Fax: +49 8252 97-2900 86529 Schrobenhausen [email protected] Germany www.bauer.de
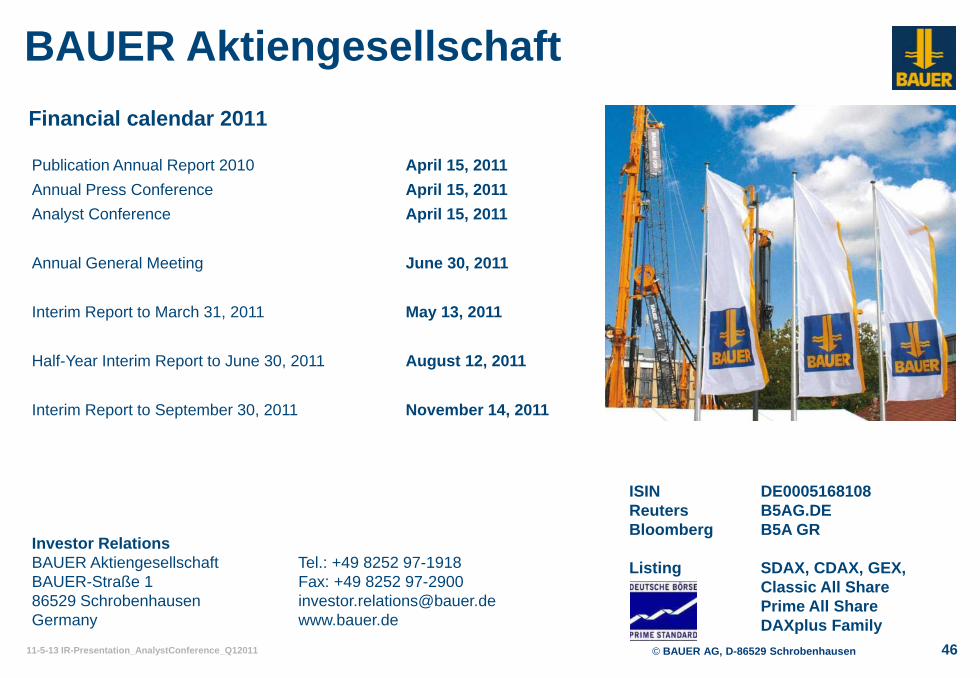
BAUER AktiengesellschaftFinancial calendar 2011
Publication Annual Report 2010 April 15, 2011Annual Press Conference April 15, 2011Analyst Conference April 15, 2011
Annual General Meeting June 30, 2011
Interim Report to March 31, 2011 May 13, 2011
Half-Year Interim Report to June 30, 2011 August 12, 2011
Interim Report to September 30, 2011 November 14, 2011
ISIN DE0005168108Reuters B5AG.DEBloomberg B5A GR
Listing SDAX, CDAX, GEX,Classic All SharePrime All ShareDAXplus Family
© BAUER AG, D-86529 Schrobenhausen11-5-13 IR-Presentation_AnalystConference_Q12011 47
Disclaimer
This presentation contains forward-looking statements. Forward-looking statements are statements that are not historical facts, including statements about our beliefs, intentions, expectations, predictions and the assumptions underlying them.
These statements are based on factors as they are currently available to the management of BAUER AG and therefore speak only as of the date they are made. We assume no liability to update publicly or conform any of them to future events or future developments.
Forward-looking information is subject to various known and unknown risks and un-certainties, which could lead to material differences between the actual future results, financial situation, development or performance of the BAUER Group and those factors contained in any forward-looking statement. In view of these uncertainties, no assurance can be given that these forward-looking statements will prove accurate and correct, or that anticipated and projected future results will be achieved and we caution you not to place undue reliance on these forward-looking statements.


![DRAGONBALL HEROES GALAXY MISSION HG8-C HG8-CP HG8 … · hg8-cp [c hgb-41 hgb-si [r] ñ—yy5jr. hg8-1s[r hg8-4s[ur1 hg8-ss[sr1 hgb-17 [r] hg8-27[c hgb-47[ hgb-s7[c] hgb-33[c] hg8-34[c]](https://img.pdfslide.us/doc/110x75/602cd1c131776364a4551daf/dragonball-heroes-galaxy-mission-hg8-c-hg8-cp-hg8-hg8-cp-c-hgb-41-hgb-si-r-ayy5jr.jpg)