Embed Size (px)
Citation preview
Bathymetric Data Management
Sujan Dahal Anni KarhunenChristian KoskiLaura LeponiemiSanna MakkonenLucky OgegeTeemu SaloriuttaWoong ShinHuang Ye
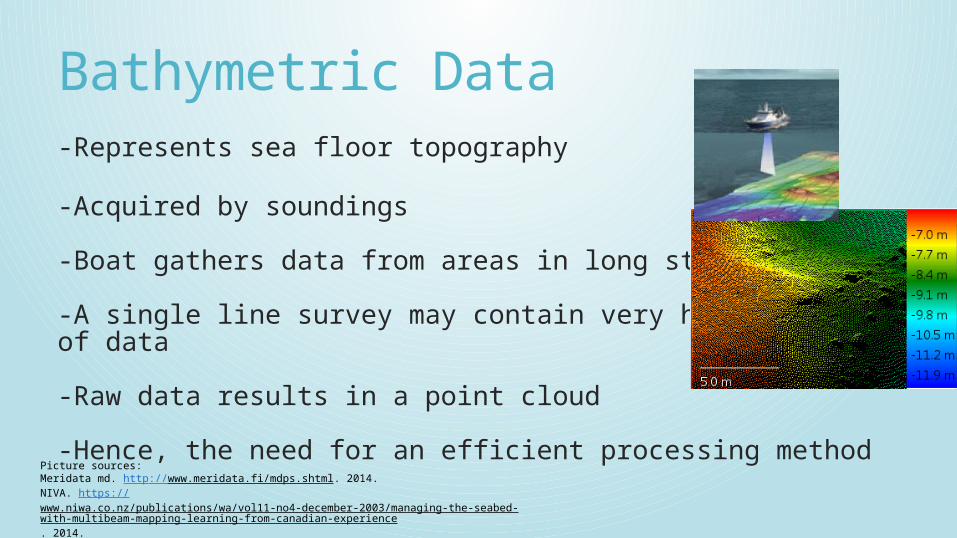
Bathymetric Data-Represents sea floor topography
-Acquired by soundings
-Boat gathers data from areas in long strips
-A single line survey may contain very high amount of data
-Raw data results in a point cloud
-Hence, the need for an efficient processing methodPicture sources: Meridata md. http://www.meridata.fi/mdps.shtml. 2014.NIVA. https://www.niwa.co.nz/publications/wa/vol11-no4-december-2003/managing-the-seabed-with-multibeam-mapping-learning-from-canadian-experience. 2014.
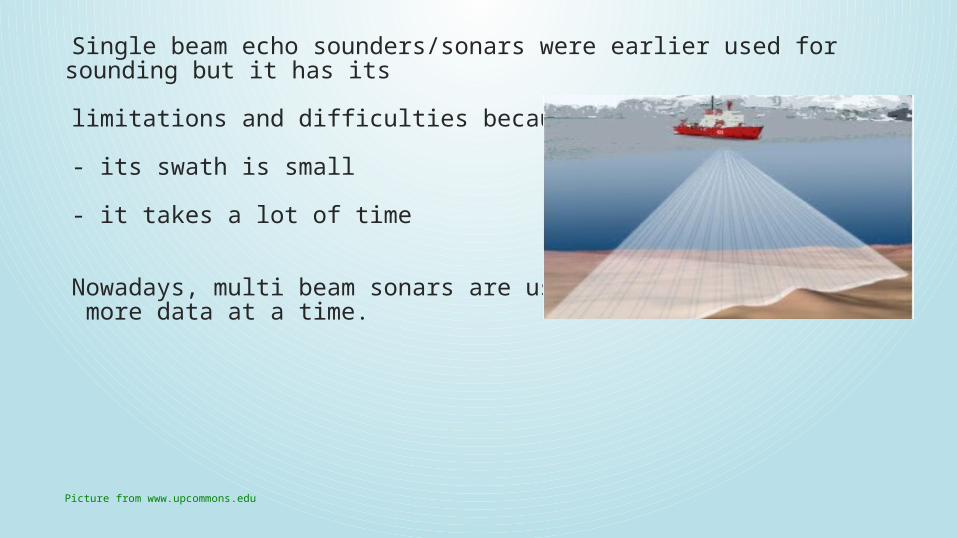
Single beam echo sounders/sonars were earlier used for sounding but it has its
limitations and difficulties because,
- its swath is small
- it takes a lot of time
Nowadays, multi beam sonars are used to acquire more data at a time.
Picture from www.upcommons.edu
Bathymetric DataWith the data a file is included that contains the following information:- sound velocity profile- sea level changes- statistical testing
results- + other information
about the data
Data includes (amongst other things): - ping- angle- heave- roll- pitch- date/time- quality indicator
Tidal Observations/Corrections
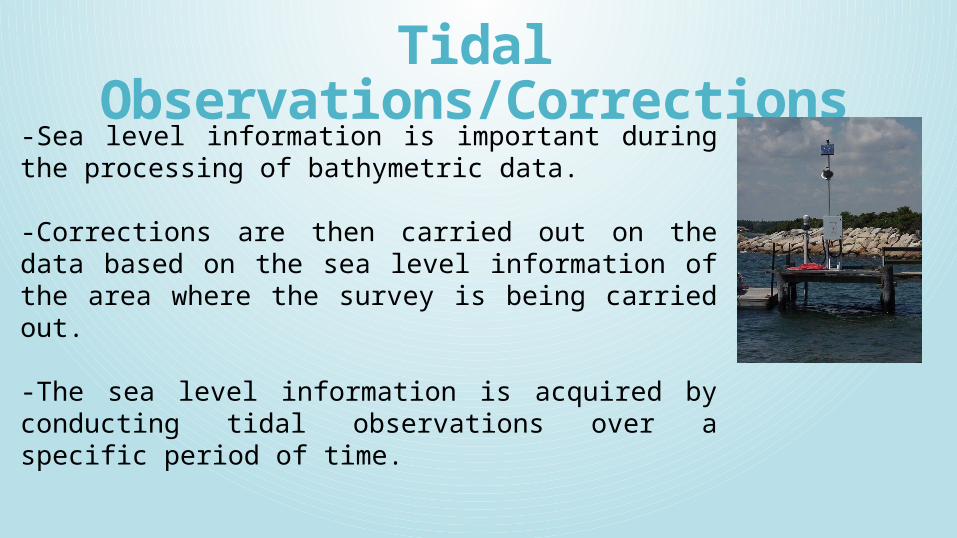
-Sea level information is important during the processing of bathymetric data.
-Corrections are then carried out on the data based on the sea level information of the area where the survey is being carried out.
-The sea level information is acquired by conducting tidal observations over a specific period of time.
Data Moved into SystemData files are large -> takes a lot of time to convert them into right format
Surface is visualized in the system
Options for viewing the data include: - point cloud / surface model - thematic colors (depth, etc) - contour lines
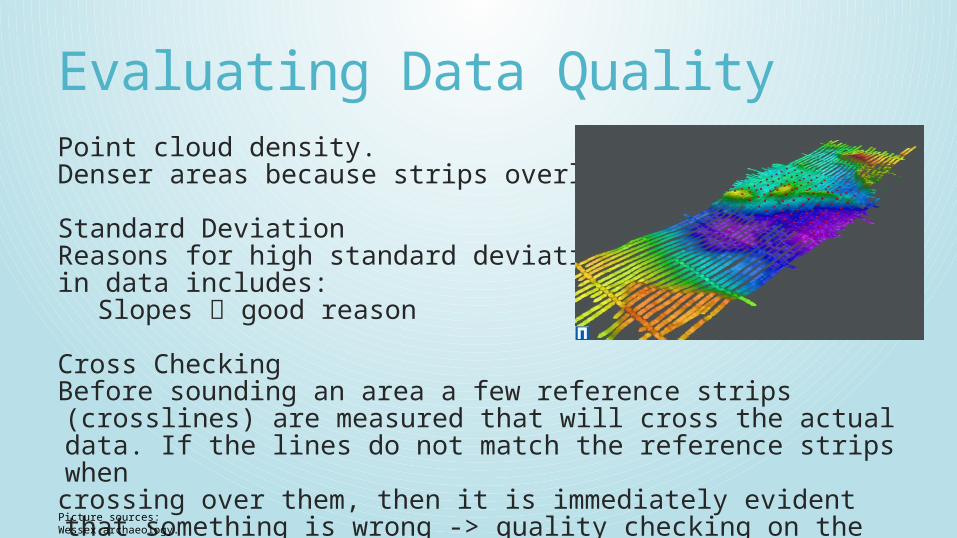
Evaluating Data QualityPoint cloud density.Denser areas because strips overlap
Standard DeviationReasons for high standard deviation in data includes: Slopes good reason
Cross CheckingBefore sounding an area a few reference strips (crosslines) are measured that will cross the actual data. If the lines do not match the reference strips when crossing over them, then it is immediately evident that something is wrong -> quality checking on the fly.
Picture sources: Wessex archaeology. http://www.wessexarch.co.uk/system/files/images/grab_bath.preview.jpg. 2014
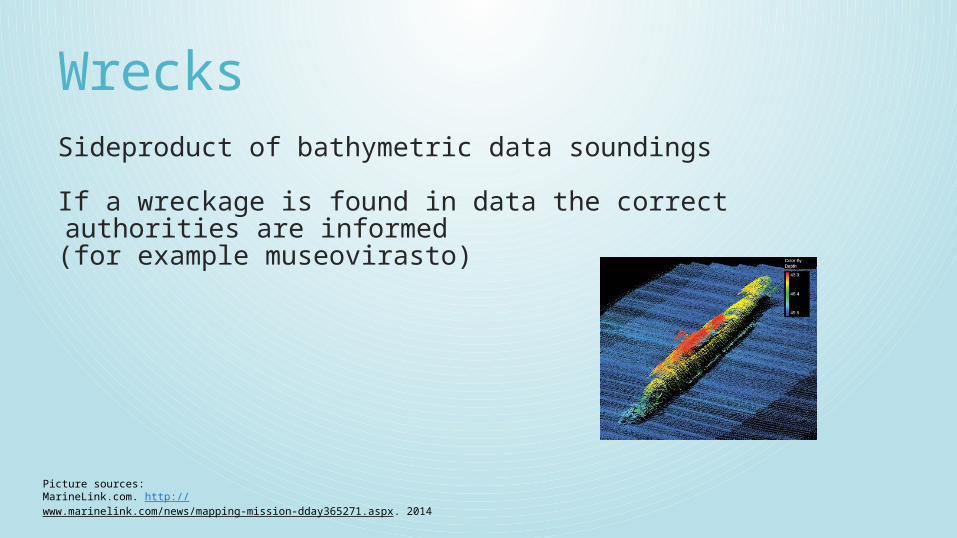
WrecksSideproduct of bathymetric data soundings
If a wreckage is found in data the correct authorities are informed(for example museovirasto)
Picture sources: MarineLink.com. http://www.marinelink.com/news/mapping-mission-dday365271.aspx. 2014
Data Editing- The massive amount of data obtained from sounding will require technologies that efficiently process the information
- Some organizations now use sophisticated software that can handle large amounts of data and even integrate it with other software so it can be processed on different platforms for further analysis
- The Fledermaus software is an example of such software used internationally by various organizations and governments
-Non-sense points can be deleted either individually or whole clusters at a time.
Data Editing - Fledermaus with ArcGIS can be used for quality assurance and checking.
- By using ArcGIS, operators can identify areas of overlapping data from adjacent lines.
- Editing is often already done by the data provider.
Technologies of bathymetric data processing 1. CARIS Bathy DataBASE – bring bathymetry source data together with background files and imagery.
2. CARIS GIS Professional – effective spatial analysis tool that permits the creation of digital paper charts to IHO standards and also a management for coastal zone mapping and analysis.
3. CARIS HIPS & SIPS – HIPS is used to process large bathymetric datasets, while SIPS will process side scan sonar imagery and multibeam backscatter data.
4. CARIS Notebook – it allows to quickly transfer digital field survey data to cartographers.
5. HYPACK – most widely used tool for surveying, collecting, processing, reducing data and generating final products.
6. QPS – offers a seamless data flow from different hardware sensors. Not only independent of sensor manufacturer, but also hardware independent.


![Disease Trajectory Maps...by Karhunen and Loeve and is also referred to as the Karhunen-Loeve expansion [Watanabe, 1965]. While numerous variants of FPCA have been proposed, the one](https://img.pdfslide.us/doc/110x75/5f85408cde5db01557455879/disease-trajectory-maps-by-karhunen-and-loeve-and-is-also-referred-to-as-the.jpg)