Embed Size (px)
Citation preview
Batelaan, O., De Smedt, F. and Triest, L., 2002, A methodology for
mapping regional groundwater discharge dependent ecosystems.
In: Schmitz, G.H. (Ed.), Proceedings of Third International Conference
on Water Resources and Environment Research,
Dresden, Germany, 22-25 July, Volume II, pp. 311-315.
O. Batelaan and F. De Smedt,
Department of Hydrology and Hydraulic Engineering
L. Triest,
Department of Biology
Vrije Universiteit Brussel, Pleinlaan 2, 1050 Brussels, Belgium.
Tel: x-32-2-6293039
Fax: x-32-2-6293022
Email: [email protected]
http:\\homepages.vub.ac.be\˜batelaan
Lakustrine and wetland ecosystems O. Batelaan et al.
A Methodology for Mapping Regional Groundwater Discharge Dependent Ecosystems
O. Batelaan and F. De Smedt, Department of Hydrology and Hydraulic EngineeringL. Triest, Department of Biology
Vrije Universiteit Brussel, Pleinlaan 2, 1050 Brussels, Belgium.
ABSTRACT
The relation between groundwater recharge and discharge is one of the most important aspects in the protectionof ecological valuable areas. Knowledge of groundwater systems is therefore a pre-requisite for up-to-date inte-grated land and water management. A methodology is presented for assessing the relative importance of differentrecharge-discharge systems, with respect to the ecological status or development. This methodology is applied toa land-use planning project in the Grote-Nete basin, Belgium. Discharge regions are delineated on basis of theirsimulated spatial discharge contiguity, position in the landscape and alkalinity of the plant habitat. Field mappingof phreatophytic vegetation verified the simulated discharge areas. It is shown that the discharge clusters are signif-icantly different in discharge intensity and alkalinity. The integration of the hydrological modelling and vegetationmapping proves to be advantageous in revealing some of the ecological differences in the catchment.
1 INTRODUCTION
Main objectives of modern land planning are the protection of ecologically valuable areas and land-use insupport of integrated water management. Special attention should be given to the effect of land-use changes onthe hydrological cycle and the protection of groundwater systems, especially discharge and recharge areas (deRidder, 1998). In discharge areas often groundwater discharge, seep or spring wetlands have developed (Mitschand Gosselink, 2000). These are from ecological point of view very valuable wetlands, since they mostly have analmost permanent shallow water table, and a constant lithotrophic water quality. Discharge areas occur in that partof the drainage basin where the net saturated flow of groundwater is directed upward towards the water table. Inthese areas the groundwater level is at or near the surface. On the other hand, recharge areas occur where the netsaturated flow of groundwater is directed away from the water table (Freeze, 1969).
2 METHODOLOGY
A methodology is presented for characterizing discharge and recharge areas making use of hydrological mod-eling and vegetation mapping within a GIS framework. The methodology consists of the following components:(a) Groundwater flow modelling to obtain the groundwater head distribution as well as to identify groundwaterdischarges (location and fluxes); (b) Calibration of the groundwater model with head data and river discharge; (c)Mapping of phreatophytic vegetation for identification of shallow groundwater table conditions and for checkingthe groundwater modelling results; (d) Delineation of regions of discharge areas with similar topographical, hydro-logical and ecological characteristics, based on numerical model results and vegetation mapping; (e) Identificationof recharge areas associated with a discharge region, using particle tracking; (f) Statistical grouping of differentrecharge-discharge systems into clusters; (g) A GIS procedural interface to embed the previous steps in a structuredway and to increase the efficiency of analysis.
2.1 Groundwater modeling
In order to simulate recharge and discharge areas, the MODFLOW model code (Harbaugh and McDonald,1996) has been modified slightly as follows. The flow in the phreatic groundwater layer is simulated in steady stateusing following equation:
∇(T ∇h)+ R−D±Q = 0 (1)
where ∇ is the divergence or gradient operator [L−1], h the groundwater head [L], T the transmissivity [L2/T ]which depends upon h, R the recharge [L/T ], D the groundwater discharge [L/T ], and Q the interactions with theunderlying groundwater layers or the effects of pumping wells [L 3/T ]. However, this equation cannot be solvedbecause both h and D are unknown. Therefore, the area is divided into either recharge or discharge areas; inrecharge areas D is zero and the groundwater head can be calculated with Eq. 2, whereas in discharge areas h isknown and D can be calculated as:
D = ∇(T ∇hD)+ R±Q (2)
311
Lakustrine and wetland ecosystems O. Batelaan et al.
where hD [L] is the groundwater drainage or seepage level, which can be derived from topography and the presenceof discharge features as springs, ditches, marches, rivulets, etc. Hence, the procedure consists of determining in aniterative way the position of recharge and discharge areas using the equations given above, such that everywhereh ≤ hD. In order to achieve this with the MODFLOW model, a SEEPAGE package has been developed (Batelaanand De Smedt, 1998).
The spatial variation in the recharge due to distributed land-use, soil type, slope, groundwater level, meteorolog-ical conditions, etc. can be significant and should be accounted for. Hence, a quasi-physically based methodologyfor estimation of the long-term average spatial patterns of surface runoff, actual evapotranspiration and groundwa-ter recharge was developed; this methodology has been termed WetSpass (Water and Energy Transfer between Soil,Plants and Atmosphere, under quasi Steady State) (Batelaan et al., 2001). The surface runoff is calculated fromthe slope, soil type, land-use and precipitation intensity ratio. The evapotranspiration is calculated from potentialevapotranspiration, soil moisture storage capacity and soil cover and the groundwater recharge is estimated fromthe seasonal water balance. The model has been integrated with Arc/Info (Asefa et al., 1999) and ArcView (Bate-laan et al., 2001). The calibration of the MODFLOW and WetSpass models is based on comparison of observedand calculated groundwater levels as well as on the surface and groundwater balance of the basin.
2.2 Vegetation mapping and groundwater system analysis
The aim is to use particular plant species as groundwater discharge indicators. Phreatophytes or groundwaterplants are taxa that occur exclusively in or are largely limited to the sphere of influence of the water table (Londo,1988). Hence, a concise vegetation (phreatophytes) mapping can be performed as an indication of the occurrenceof groundwater discharge in the valleys. These results can be used for verification of the groundwater model.
Ellenberg (1991) defined six indicator values for more than 1750 vascular plants species with respect to theirhabitat for Middle European locations. The wetness (F-value) and acidity (R-value) indicators are regarded to bethe most useful indicators for characterisation of groundwater discharge areas with phreatophytes. The R-valueranges from 1, highly acidic, to 9, highly alkaline conditions. The F-value ranges from 1, dry, to 12, very wethabitat conditions. Hill et al. (1999) redefined the indicators for British conditions.
A list of 23 phreatofytic plant species has been identified on basis of a literature study and regional field knowl-edge (Londo, 1988, Ellenberg, 1991, Hill et al., 1999). For the study area a vegetation mapping was performed,consisting of checking the occurrence or abundance and spatial extent of the 23 phreatophytes at different loca-tions in the valleys of the Grote-Nete Basin. Besides the point vegetation mapping the Biological Evaluation Map(BEM) (Rombouts and Delafaille, 2000, Berten and Hermans, 2000) was also used. De Baere (1997) defined foreach vegetation mapping unit of the BEM an alkalinity indicator, which ranges from 1 very acidic environment(pH about 4) to 5 slightly basic (pH higher than 7) and a trophic level indicator, which ranges between 1 for a veryoligothrophic environment to 5 for a very nutrient rich environment.
A next step is the delineation of wetland or discharge regions with ’similar’ characteristics. Basis for thedelineation is the contiguity of the simulated discharge areas, topographical and landscape ecological position ofthe discharge area and the similarity of the vegetation types, as given by the adjusted Ellenberg indicator values.The particle tracking code MODPATH (Pollock, 1994) is used to post-process the results of the groundwater flowmodel, and to delineate the recharge areas.
A relative comparison of the different recharge-discharge groundwater systems is required in order to increaseour knowledge on the relationship between regional groundwater and phreatophytes. Cluster analysis with ground-water flow and ecological status parameters is used to aggregate the different recharge-discharge systems into areduced number of significantly different types of systems. Since cluster analysis requires a relatively extensiveset of parameters, it is also investigated if a similar grouping of systems can be obtained with a reduced number ofparameters.
3 APPLICATION AND DISCUSSION
The study area is located about 60km north-east of Brussels and is 293km 2 in size. It covers a major part of theGrote-Nete Basin and is part of the Central Campine region. The region shows a moderate rolling landscape cutby the Grote Nete River and her many tributaries, resulting in very slightly elevated interfluves and broad swampyvalleys (Wouters and Vandenberghe, 1994). The topography ranges from 14 to 65m. The average precipitationin the area ranges from 743 to 800mm/y. The dominant soil type is sand, though in the valleys there is alsosandy loam, loamy sand and silty loam. The land-use types in the area are: 30% crop/mixed farming, 18%deciduous forest, 12% coniferous forest, 15% grasslands, 5% heather, 2% open water and about 18% built-uparea. The transmissivity of the aquifer system increases from about 1000m 2/d in the west of the area to about3000m2/d in the east of the area, groundwater extraction totals 66580m 3/d. Boundary conditions for the steady
312

Lakustrine and wetland ecosystems O. Batelaan et al.
ÑÑÑ
Ñ
ÑÑÑ
Ñ
Ñ
Ñ
ÑÑ
Ñ
Ñ
Ñ
ÑÑÑÑÑ
Ñ
Ñ
Ñ
Ñ
ÑÑ
ÑÑ
ÑÑ
Ñ
Ñ
Ñ
Ñ
Ñ
Ñ
Ñ Ñ
Ñ
#
#
#
#
## ##W
N
S198
200
202
204
206
208
210
212
214
198
200
202
204
206
208
210
212
214 222220218216214212210208206204202200198196194192190188
186 188 190 192 194 196 198 200 202 204 206 208 210 212 214 216 218 220 222
186
N
44424038363432
-50-100
-200-150
#
S
0-50
-100-150-200
2030405060
EW
N S
Groundwater level (m)6 - 1515 - 2525 - 3535 - 45
45 - 5555 - 60No Data
Project boundaryDischarge areas
Base aquifer
#
Topography
#
Topography
#
Groundwater level
#
$m
$m
$ km
$ km
15 20 25 30105
2 4 6 8#
Grote NeteAsdonk brook
#
Molse Nete
#
Molse Nete #
Grote Nete
#
Grote Nete
Rivers
2 0 2 km
N
W E
Clay of Boom
Groundwater levelBase aquifer
Clay of Boom
PiezometerÑ
km
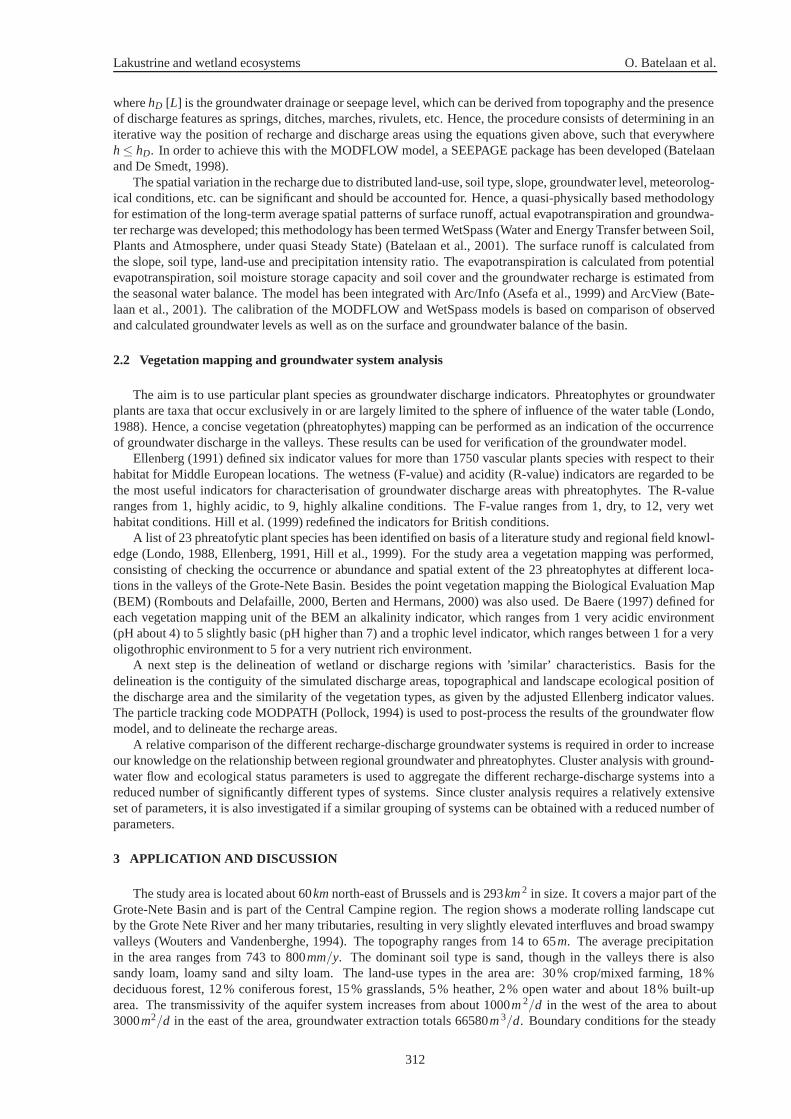
Figure 1: Simulated groundwater levels, discharge areas and north-south and west-east profiles over the ground-water system in the land planning project area Grote Nete
state groundwater model were taken from a regional flow model for Dijle, Demer and Nete basins (Batelaan etal., 1996). The WetSpass calculated recharge varies between, −375 and 408mm/y, with an average of 282mm/y.The negative and low recharge values occur in the river valleys, and are due to shallow groundwater tables andhigh transpiration by the vegetation. On average the recharge in the valleys is about 60mm/y lower than in theinterfluves.
Fig. 1 shows the resulting calculated groundwater heads, discharge areas and a north-south and west-east profileof the groundwater system. Most discharge areas appear as bands of 500m wide along the main water coursesin the area. The average discharge intensity is 4mm/d. Calibration of the model on basis of 38 piezometers(Fig. 1), results in a good agreement: a correlation coefficient of 0.99, a root mean square error of 0.45m and amean absolute error of 0.35m. Analysing 10 years of river discharge data from a station downstream of the areagives an average specific discharge of 328.5mm/y. Comparing this to the sum of the WetSpass simulated surfacerunoff (43.4mm/y) and baseflow from the groundwater model, given by the coupled WetSpass simulated recharge(279.2mm/y), results in a water balance error of less than 2%.
At 193 locations in the visited valleys of the Grote-Nete basin, 564 times phreatophytic indicators are mapped.Plant species Lysimachia vulgaris and Lythrum salicaria occur most abundantly, respectively in 75% and 54% ofthe locations. They show a broad response curve to environmental factors, hence they appear to be not exclusivelyselective with respect to indicating groundwater discharge conditions. Klijn and Witte (1999) emphasized thatalthough phreatophytes are fairly reliable as indicators for groundwater discharge, the whole abiotic environmentalcontext should be taken into account. Typical mapped vegetation types are Alder brook forests and mesotrophicmeadows. Alder brook forest is characterised by discharge indicators such as Solanum dulcamara at 41 locations,Equisetum fluviatile at 33 locations, Scirpus sylvaticus at 14 locations, and Caltha palustris at 3 locations. Themesotrophic meadows have a high abundance of the discharge indicator Lychnis flos-cuculi at 26 locations.
Within the study area of Grote-Nete, 79% of the mapped phreatophytic plant locations are found to lie withindischarge areas as simulated by the groundwater model. Most of these locations correspond to medium or highdischarge areas. The remaining 21% or 41 plant locations fall outside the simulated discharge zones. Most ofthese ’mismatches’ can be explained as a result of scale limitations of the simulated results and uncertainty inthe phreatophyte mapping. In the upper reaches of the valleys the mapped phreatophyte R-values are generallylower than in the downstream parts of the valleys, where the average R-value is about 7. This relatively high valueshows that the quality of the water available for the plants is becoming clearly more alkaline in the downstreamlocations. On one hand, this can be explained by local groundwater discharge systems in the upper reaches, whichfeed plants with relatively local infiltrated water of atmotrophic quality (with low R-values). On the other hand,the downstream locations are most likely linked to much larger recharge-discharge systems, resulting in a more
313
Lakustrine and wetland ecosystems O. Batelaan et al.
218
34
56
78 9 10
11
12
13
14
1516
17
1
190 195 200 205 210 215 220
190 195 200 205 210 215 220
200
205
210
200
205
210
km
Nkm2 0 2 4
LEGENDProject boundary
Discharge clusterRiver
10 - 50 year
Discharge area 10 yearand <
50 - 100 year 100 year>No Data
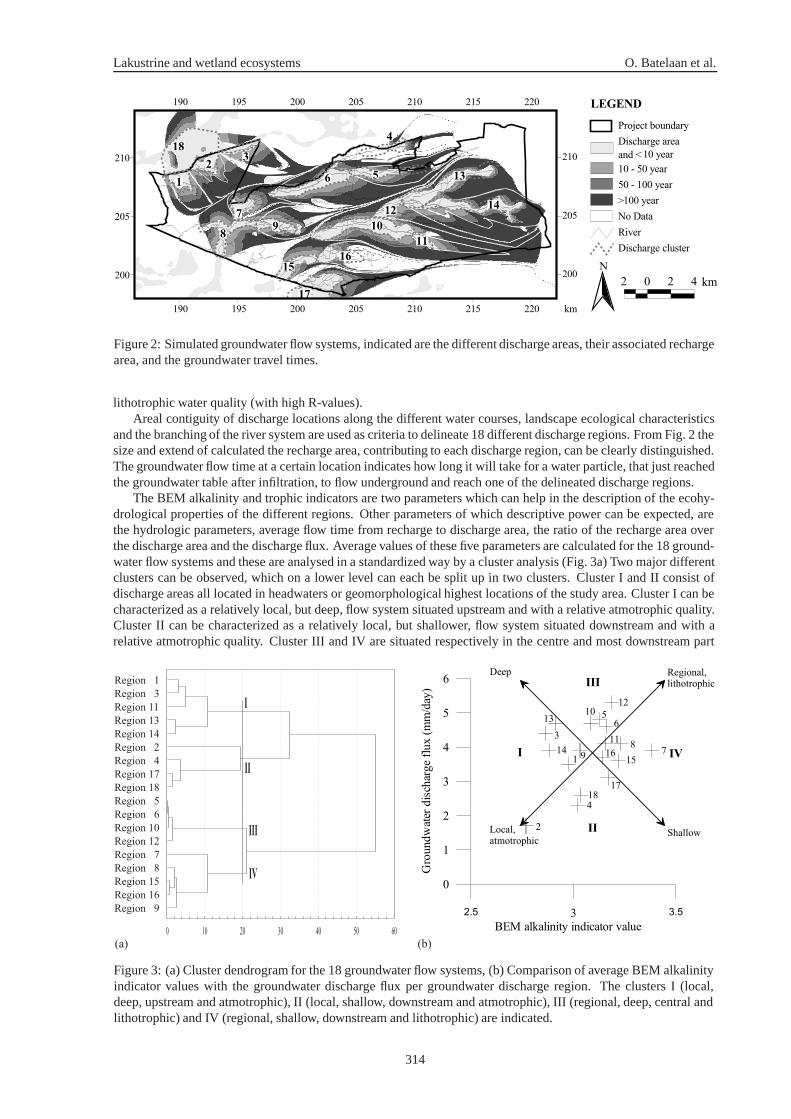
Figure 2: Simulated groundwater flow systems, indicated are the different discharge areas, their associated rechargearea, and the groundwater travel times.
lithotrophic water quality (with high R-values).Areal contiguity of discharge locations along the different water courses, landscape ecological characteristics
and the branching of the river system are used as criteria to delineate 18 different discharge regions. From Fig. 2 thesize and extend of calculated the recharge area, contributing to each discharge region, can be clearly distinguished.The groundwater flow time at a certain location indicates how long it will take for a water particle, that just reachedthe groundwater table after infiltration, to flow underground and reach one of the delineated discharge regions.
The BEM alkalinity and trophic indicators are two parameters which can help in the description of the ecohy-drological properties of the different regions. Other parameters of which descriptive power can be expected, arethe hydrologic parameters, average flow time from recharge to discharge area, the ratio of the recharge area overthe discharge area and the discharge flux. Average values of these five parameters are calculated for the 18 ground-water flow systems and these are analysed in a standardized way by a cluster analysis (Fig. 3a) Two major differentclusters can be observed, which on a lower level can each be split up in two clusters. Cluster I and II consist ofdischarge areas all located in headwaters or geomorphological highest locations of the study area. Cluster I can becharacterized as a relatively local, but deep, flow system situated upstream and with a relative atmotrophic quality.Cluster II can be characterized as a relatively local, but shallower, flow system situated downstream and with arelative atmotrophic quality. Cluster III and IV are situated respectively in the centre and most downstream part
Region 1
Region 3
Region 11
Region 13
Region 2
Region 14
Region 17
Region 4
Region 18
Region 5
Region 6
Region 10
Region 12
Region 7
Region 8
Region 15
Region 16
Region 9
I
II
IV
III
0 10 20 30 40 6050
32.5 3.5
BEM alkalinity indicator value
0
1
2
3
4
5
6
Gro
und
wat
erd
isch
arge
flu
x(m
m/d
ay)
2
418
17
114
15
11
16 78
9
13
3
12
6510
I
II
III
IV
Regional,lithotrophic
Local,atmotrophic
Deep
Shallow
(a) (b)
Figure 3: (a) Cluster dendrogram for the 18 groundwater flow systems, (b) Comparison of average BEM alkalinityindicator values with the groundwater discharge flux per groundwater discharge region. The clusters I (local,deep, upstream and atmotrophic), II (local, shallow, downstream and atmotrophic), III (regional, deep, central andlithotrophic) and IV (regional, shallow, downstream and lithotrophic) are indicated.
314
Lakustrine and wetland ecosystems O. Batelaan et al.
of the study area. Cluster III is a regional, deep and relatively lithotrophic groundwater system, discharging in thecentral part of the study area, while cluster IV is also a regional and relatively lithotrophic system, but shallowerand situated more downstream.
In order to simplify the qualitative analysis of the differences between groundwater systems in relation to theirecohydrologic and hydrologic characteristics, we select the most important hydrologic parameter, i.e. the seepageflux, and the most important ecohydrologic parameter, i.e. the alkalinity indicator. The four different clusters canbe identified again, as shown in Fig. 3b with some small deviations in the centre of the graph where the differencesbetween the groundwater systems are less obvious. The delineation of the clusters in the graph is rather striking.It shows that on basis of these two parameters important significant ecohydrological differences in the recharge-discharge groundwater systems can be revealed.
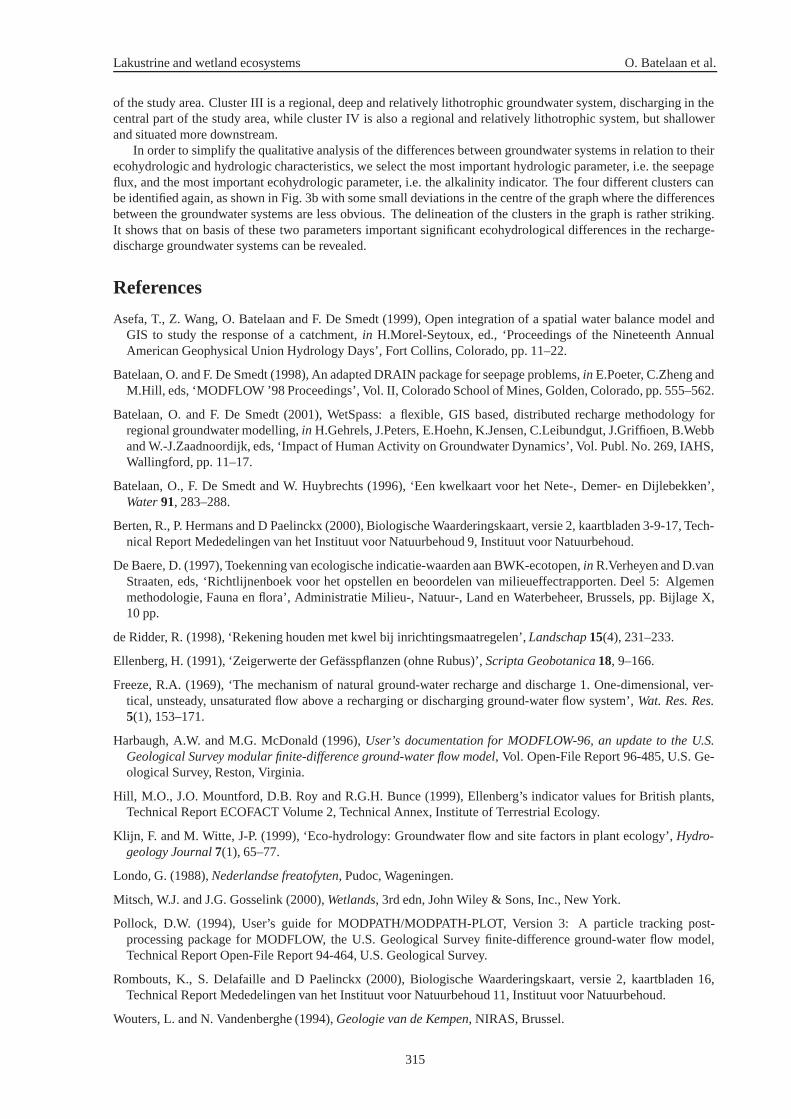
References
Asefa, T., Z. Wang, O. Batelaan and F. De Smedt (1999), Open integration of a spatial water balance model andGIS to study the response of a catchment, in H.Morel-Seytoux, ed., ‘Proceedings of the Nineteenth AnnualAmerican Geophysical Union Hydrology Days’, Fort Collins, Colorado, pp. 11–22.
Batelaan, O. and F. De Smedt (1998), An adapted DRAIN package for seepage problems, in E.Poeter, C.Zheng andM.Hill, eds, ‘MODFLOW ’98 Proceedings’, Vol. II, Colorado School of Mines, Golden, Colorado, pp. 555–562.
Batelaan, O. and F. De Smedt (2001), WetSpass: a flexible, GIS based, distributed recharge methodology forregional groundwater modelling, in H.Gehrels, J.Peters, E.Hoehn, K.Jensen, C.Leibundgut, J.Griffioen, B.Webband W.-J.Zaadnoordijk, eds, ‘Impact of Human Activity on Groundwater Dynamics’, Vol. Publ. No. 269, IAHS,Wallingford, pp. 11–17.
Batelaan, O., F. De Smedt and W. Huybrechts (1996), ‘Een kwelkaart voor het Nete-, Demer- en Dijlebekken’,Water 91, 283–288.
Berten, R., P. Hermans and D Paelinckx (2000), Biologische Waarderingskaart, versie 2, kaartbladen 3-9-17, Tech-nical Report Mededelingen van het Instituut voor Natuurbehoud 9, Instituut voor Natuurbehoud.
De Baere, D. (1997), Toekenning van ecologische indicatie-waarden aan BWK-ecotopen, in R.Verheyen and D.vanStraaten, eds, ‘Richtlijnenboek voor het opstellen en beoordelen van milieueffectrapporten. Deel 5: Algemenmethodologie, Fauna en flora’, Administratie Milieu-, Natuur-, Land en Waterbeheer, Brussels, pp. Bijlage X,10 pp.
de Ridder, R. (1998), ‘Rekening houden met kwel bij inrichtingsmaatregelen’, Landschap 15(4), 231–233.
Ellenberg, H. (1991), ‘Zeigerwerte der Gefasspflanzen (ohne Rubus)’, Scripta Geobotanica 18, 9–166.
Freeze, R.A. (1969), ‘The mechanism of natural ground-water recharge and discharge 1. One-dimensional, ver-tical, unsteady, unsaturated flow above a recharging or discharging ground-water flow system’, Wat. Res. Res.5(1), 153–171.
Harbaugh, A.W. and M.G. McDonald (1996), User’s documentation for MODFLOW-96, an update to the U.S.Geological Survey modular finite-difference ground-water flow model, Vol. Open-File Report 96-485, U.S. Ge-ological Survey, Reston, Virginia.
Hill, M.O., J.O. Mountford, D.B. Roy and R.G.H. Bunce (1999), Ellenberg’s indicator values for British plants,Technical Report ECOFACT Volume 2, Technical Annex, Institute of Terrestrial Ecology.
Klijn, F. and M. Witte, J-P. (1999), ‘Eco-hydrology: Groundwater flow and site factors in plant ecology’, Hydro-geology Journal 7(1), 65–77.
Londo, G. (1988), Nederlandse freatofyten, Pudoc, Wageningen.
Mitsch, W.J. and J.G. Gosselink (2000), Wetlands, 3rd edn, John Wiley & Sons, Inc., New York.
Pollock, D.W. (1994), User’s guide for MODPATH/MODPATH-PLOT, Version 3: A particle tracking post-processing package for MODFLOW, the U.S. Geological Survey finite-difference ground-water flow model,Technical Report Open-File Report 94-464, U.S. Geological Survey.
Rombouts, K., S. Delafaille and D Paelinckx (2000), Biologische Waarderingskaart, versie 2, kaartbladen 16,Technical Report Mededelingen van het Instituut voor Natuurbehoud 11, Instituut voor Natuurbehoud.
Wouters, L. and N. Vandenberghe (1994), Geologie van de Kempen, NIRAS, Brussel.
315