Embed Size (px)
Citation preview
Batas, Anastasios (2018) Protein trafficking and autophagy in the moulting
cycle of C. elegans. PhD thesis.
https://theses.gla.ac.uk/8856/
Copyright and moral rights for this work are retained by the author
A copy can be downloaded for personal non-commercial research or study,
without prior permission or charge
This work cannot be reproduced or quoted extensively from without first
obtaining permission in writing from the author
The content must not be changed in any way or sold commercially in any
format or medium without the formal permission of the author
When referring to this work, full bibliographic details including the author,
title, awarding institution and date of the thesis must be given
Enlighten: Theses
https://theses.gla.ac.uk/

1
Protein trafficking and autophagy in the
moulting cycle of C. elegans.
A thesis submitted to the INSTITUTE OF MOLECULAR, CELL AND SYSTEMS
BIOLOGY
For the degree of DOCTOR OF PHILOSOPHY
by Anastasios Batas
College of Medical, Veterinary and Life Sciences Institute of Molecular, Cell and Systems
Biology University of Glasgow
January 2018

2
Abstract
Endosomal trafficking and autophagy are two fundamental processes of eukaryotic cell
biology, from unicellular organisms such as yeast to multicellular metazoans such as
C.elegans and Humans. Both processes are involved in a diverse number of physiological
processes and implicated in a number of pathologies. A recent study has exhibited a
mutation on the SM protein Vps45 as a cause of severe congenital neutropenia in humans.
The same mutation in yeast causes defects in endosome to vacuole trafficking in
S.cerevisiae as well as a temperature sensitive lethality at the non-permissive temperature.
A null allele of vps-45 in C.elegans results in developmental arrest during the highly
secretory phase of moulting in a similar temperature conditional manner to yeast and
defects in yolk protein trafficking. The work presented in this thesis aims to provide basic
understanding in an animal model of the impact of loss of Vps45 function that might be
informative of the reason for the death of the highly secretory neutrophil cells under the
absence of a functional Vps45 protein. The vps-45 and unc-51 mutants as well as a novel
unc-51 vps-45 double mutant where possible, were characterised for lifespan, duration of
post- embryonic development as well as moulting duration. Reduced embryonic viability,
reduced lifespan as well as delays in the moulting process were identified. Data suggested
that both autophagy and protein trafficking play a role in C.elegans development through
unc-51 and vps-45 respectively.
In addition to this, the seam cells of both the vps-45 and unc-51 defective C.elegans were
observed during the moult using an autophagy marker. An increase in autophagic activity
during the moult was observed, which was more pronounced in the case of the vps-45
mutant. As such the obtained data suggest autophagy and endosomal trafficking play an
important role in the moulting process.
Following up to previous work conducted in our lab in yeast defective for Vps45
trafficking which exhibited increased sensitivity to oxidative stress, the redox state of the
vps-45 and unc-51 animals as well as their sensitivity to oxidative stress was assessed
using a set of ER and cytosolic GFP markers and killing assays. Both the vps-45 and unc-
51 mutants showed a higher sensitivity to oxidative stress, with the unc-51 exhibiting the
more pronounced phenotype overall. These results came in agreement with the shorter
lifespan phenotypes exhibited by both mutants in the previous experiments, possibly as a
result of accumulation of ROS, as well as the severe defects of the double mutant.

3
Finally, a suppressor identified for the moulting death of the vps-45 mutant was
characterized for a set of phenotypes, in order to exclude suppression of any of the other
phenotypes identified for the vps-45 mutant. Furthermore, the suppressor was identified as
being autosomal and recessive and as thus an SNP full genome sequencing technique was
employed, which gave rise to two suppression loci in two different chromosomes, along
with two different subpopulations corresponding to these loci which exhibited different
growing patterns.

4
Contents
Abstract .................................................................................................................................. 2
List of Tables ...................................................................................................................... 8
List of Figures .................................................................................................................... 9
Acknowledgements .............................................................................................................. 14
Authors Declaration ............................................................................................................. 15
Abbreviations ....................................................................................................................... 16
Measurements ...................................................................................................................... 19
Chapter 1: Introduction ........................................................................................................ 21
1.1 An introduction to C. elegans ..................................................................................... 21
1.1.1 C. elegans embryonic development ..................................................................... 22
1.1.2 C. elegans post-embryonic development ............................................................. 23
1.1.3 C. elegans cuticle ................................................................................................. 24
1.1.4 Expression of cuticle collagen genes ................................................................... 26
1.1.5 Molting................................................................................................................. 26
1.1.6 The seam cells and their role in C. elegans development and molting ................ 27
1.1.7 C. elegans genetics ............................................................................................... 29
1.1.8 Next generation sequencing ................................................................................. 31
1.1.9 RNAi .................................................................................................................... 34
1.2 The endocytic pathway ............................................................................................... 34
1.2.1 SM proteins and SNARE complexes ................................................................... 36
1.2.2 The SM protein Vps45 ......................................................................................... 39
1.2.3 Loss of VPS45 as a cause for Neutropenia .......................................................... 40
1.2.4 VPS-45 and its role in C. elegans ........................................................................ 41
1.3 Autophagy .................................................................................................................. 42
1.3.1 The cytoplasm to vacuole targeting pathway ...................................................... 43
1.3.2 Induction of autophagy by the mTORC1 pathway .............................................. 44
1.3.3 Induction of autophagy and autophagosome assembly ...................................... 45
1.3.4 Fusion of the autophagosome and the lysosome ................................................. 48
1.3.5 Autophagy in C. elegans ...................................................................................... 49
1.3.6 Autophagy an endocytic trafficking in molting ................................................... 50
1.3.7 Autophagy in Disease .......................................................................................... 50
1.4 Project aims ................................................................................................................ 51
Chapter 2: Materials and Methods ....................................................................................... 53
2.1 Solutions and media ................................................................................................... 53
2.2 Other Materials ........................................................................................................... 55

5
2.2.1 Electrophoresis Markers ...................................................................................... 55
2.3 Methods ...................................................................................................................... 56
2.3.1 E.Coli OP50 bacteria culturing ............................................................................ 56
2.3.2 Nematode culture in solid media ......................................................................... 56
2.3.3 Nematode Handling ............................................................................................. 57
2.3.4 Freezing and thawing nematode stocks ............................................................... 59
2.3.5 Decontamination of C. elegans stocks ................................................................. 59
2.3.6 Nematode synchronous cultures .......................................................................... 59
2.3.8 C. elegans crosses ................................................................................................ 61
2.3.9 Routine microscopy ............................................................................................ 61
2.3.10 Quantification of whole body C. elegans fluorescence ..................................... 62
2.3.11 C. elegans lysis and genomic DNA extraction ................................................. 63
2.3.12 C. elegans lysis and genomic DNA extraction for full genome sequencing .... 63
2.3.13 Quantitation of DNA ......................................................................................... 64
2.3.14 Preparation of samples for full genome sequencing .......................................... 64
2.3.15 Restriction endonuclease digestion of DNA fragments ..................................... 64
2.3.16 Polymerase chain reaction (PCR) ..................................................................... 65
2.3.17 DNA Gel electrophoresis .................................................................................. 74
2.3.18 Detecting the ER redox state of nematodes using a 96-well plate reader......... 74
2.3.19 Scoring C. elegans adult lifespan ...................................................................... 76
2.3.20 Scoring C. elegans viability under oxidative stress ........................................... 76
2.3.21 Quantifying GFP expression under oxidative stress ......................................... 76
2.3.22 RNAi of C. elegans by bacterial feeding method .............................................. 77
2.3.23 Western blots ..................................................................................................... 78
2.3.24 Immunolocalisation of C. elegans proteins........................................................ 80
2.4 Graphs and statistical analysis .................................................................................... 81
Chapter 3: Phenotypic characterisation and comparison of vps-45 (tm246) and unc-51
(e369) mutants and identification of a functional relationship between autophagy and the
endosomal trafficking pathway in C. elegans molting. ........................................................ 82
3.1 Overview and aims ..................................................................................................... 82
3.2 The vps-45 (tm246) endosomal trafficking mutant at 25°C exhibiting defects in
molting. ............................................................................................................................. 85
3.3 The vps-45 (tm246) and unc-51 (e369) mutant strains exhibit embryonic lethality
during development .......................................................................................................... 85
3.4 The autophagy defective unc-51 (e369) mutant strain does not die by molting when
cultured at 25°C ................................................................................................................ 87
3.5 The unc-51(e369) V; vps-4 5(tm246) X double homozygotic mutant exhibits a
synthetic effect ................................................................................................................. 88

6
3.6 Genetic analysis of the unc-51(e369) vps-45(tm246) double homozygotic mutant .. 94
3.7 Size comparison of the vps-45 (tm246), unc-51 (e369) and unc-51 (e369) V; vps-45
(tm246) X double mutant ................................................................................................. 99
3.8 Phenotypic analysis of internal and cuticular structures of vps-45 (tm246), unc-51
(e369) and unc-51 (e369) V; vps-45 (tm246) X mutants ............................................... 100
3.9 Characterisation of the moult and intermoult periods on vps-45 (tm246) and unc-51
(e369) mutants ................................................................................................................ 108
3.10 Determination of lifespan for vps-45 (tm246) and unc-51 (e369) mutants ........... 113
3.11 Chapter summary ................................................................................................... 116
Chapter 4: The role of autophagy and protein trafficking during embryonic development
and molting ........................................................................................................................ 118
4.1 Overview and aims ................................................................................................... 118
4.2 Introduction of the LGG-1::GFP and AJM-1::GFP markers in unc-51 (e369) and
vps-45 (tm246) backgrounds .......................................................................................... 120
4.3 LGG-1 accumulates in the seam cells during molting ............................................. 121
4.4 Assessment of the retention of the LGG-1 autophagy marker in the seam cells in vps-
45 (tm246) and unc-51 (e369) mutants .......................................................................... 130
4.5 Assessment of the autophagy levels in the seam cells of wild type, vps-45 (tm246)
mutant and unc-51 (e369) mutant C. elegans ................................................................. 134
4.6 LGG-1 is expressed in the seam cells in C. elegans embryos at the 3 fold stage and is
retained for longer in the unc-51 (e369) mutant post-hatch ........................................... 138
4.7 LGG-1 expression in the seam cells and seam cell division are two distinct processes
........................................................................................................................................ 145
4.8 vps-45 (tm246) and unc-51 (e369) mutant embryos demonstrate higher levels of
LGG-1 marker at the 3-fold stage .................................................................................. 147
4.9 vps-45 (tm246) and unc-51 (e369) mutants exhibit higher levels of expression of the
LGG-1 protein outside of the molt ................................................................................. 149
4.10 Chapter summary ................................................................................................... 151
Chapter 5: Investigating oxidative imbalances and resistance to oxidative stress in unc-51
(e369) and vps-45 (tm246) mutants ................................................................................... 153
5.1 Overview and aims ................................................................................................... 153
5.2 The roGFP ER3 marker and its introduction in the vps-45 (tm246) and unc-51 (e369)
mutant backgrounds ....................................................................................................... 155
5.3 The roGFP ER3marker can detect changes in ER redox state in C. elegans ........... 157
5.4 Assessing the survival of vps-45 (tm246) and unc-51 (e369) mutants under oxidative
stress ............................................................................................................................... 162
5.5 Assessing the oxidative response of vps-45 (tm246) and unc-51 (e369) mutants
under oxidative stress ..................................................................................................... 165
5.6 Chapter summary ..................................................................................................... 176

7
Chapter 6: Characterisation and identification of the vps-45 (tm246) molting death
suppressor ........................................................................................................................... 178
6.1 Overview and aims ................................................................................................... 178
6.2 Characterization of the svp (ij117) vps-45 (tm246) suppressed mutant .................. 178
6.3 svp (ij117) suppresses the vps-45 (tm246) moulting death at 25°C ......................... 179
6.4 The suppressor does not change the body size of vps-45 (tm246) mutants ............. 179
6.5 The svp (ij117) suppressor allele does not supress embryonic lethality .................. 181
6.6 Characterisation of the molt and intermoult periods on the IA773 strain ................ 183
6.7 Determination of lifespan for the IA773 strain ........................................................ 188
6.8 The svp (ij117) suppressor follows a recessive and autosomal inheritance pattern . 191
6.9 Introduction of the vps-45 (tm246) deletion allele and svp (ij117) suppressor, into
‘Hawaiian’ genetic background for whole genome sequencing analysis ....................... 195
6.10 Next generation sequencing analysis of the svp (ij117) vps-45 (tm246) supressed
mutants in Hawaiian background ................................................................................... 197
6.11 Identification of candidate suppressors for the vps-45 (tm246) moulting arrest.... 202
6.12 Testing of the candidate genes for suppression of the vps-45 (tm246) using RNAi
........................................................................................................................................ 203
6.13 Identification of two different genetic subpopulations within the vps-45 (tm246)
supressed lines ................................................................................................................ 206
6.14 A second linkage area on chromosome V suggest the existence of a second
suppressor for the vps-45 (tm246) molting arrest .......................................................... 209
6.15 At least two phenotypic sub-populations exist within the 40 supressed sequencing
lines exhibiting different growth patterns ...................................................................... 212
6.16 Chapter summary ................................................................................................... 214
Chapter 7: Discussion ........................................................................................................ 216
7.1 Characterisation and identification of the vps-45 (tm246) molting death suppressor
........................................................................................................................................ 218
7.2 Phenotypic characterisation of unc-51 (e369), vps-45 (tm246) and unc-51(e369) vps-
45 (tm246) synthetic lethal double mutant .................................................................... 220
7.3 Autophagy is developmentally regulated during molting and is required for the
survival of vps-45 (tm246) mutants. .............................................................................. 223
7.4 Investigating oxidative imbalances and resistance to oxidative stress in unc 51 (e369)
and vps-45 (tm246) mutants ........................................................................................... 226
7.5 Concluding remarks and future work ....................................................................... 230
References .......................................................................................................................... 232
Appendices ......................................................................................................................... 255

8
List of Tables
Table 2.1: List of C.elegans strains used in this study ......................................................... 57
Table 2.2: Components of general mix used for digestion of DNA .................................... 65
Table 2.3: List of the primers used in this study for the detection of mutant alleles and
Hawaiian and Bristol SNPs ................................................................................................. 66
Table 2.4: Components of general mix used for PCR amplification using two primers ... 68
Table 2.5: Components of the mix used for PCR amplification of the vps-45 allele and the
mutant vps-45 (tm246) allele, using two forward and one reverse primers in a single
reaction ................................................................................................................................ 69
Table 2.6: Primers used for the distinction of Hawaiian and Bristol sequences in C.elegans
on chromosomes I and IV ................................................................................................... 71
Table 2.7: Primers used for the distinction of Hawaiian and Bristol sequences in C.elegans
on several regions of chromosome II .................................................................................. 72
Table 2.8: Primers used for the distinction of Hawaiian and Bristol sequences in C.elegans
on several regions of chromosome V .................................................................................. 73
Table 2.9: Settings used by the plate reader for the detection of the redox state of the
roGFP marker in nematodes................................................................................................. 75
Table 2.10: List of RNAi strains used in this study ............................................................ 77
Table 3.1: Table 3.1: Table of progeny from five IA900 parents ..................................... 97
Table 3.2: Table of showing the number of double mutant progeny dying during larval
development ........................................................................................................................ 98
Table 4.1: Analytical tables of the onset of LGG-1 expression during the molt for
individual C.elegans for each strain .................................................................................. 131
Table 6.1: Inheritance pattern of the svp (ij117) suppressor allele ................................... 193
Table 6.2: List of candidate suppressors retrieved from sequencing results for the
C.elegans Chromosome II ................................................................................................. 204
Table 6.3: Visual representation of homozygosity of Bristol (red) or Hawaiian (green)
sequences of each of the suppressed lines for Chromosome II ......................................... 208

9
Table 6.4: Visual representation of homozygosity of Bristol (red) or Hawaiian (green)
sequences of each of the suppressed lines for chromosome V .......................................... 211
Appendix 6: Table showing the concentration of each sample from the 40 sequencing lines
genomic isolates, as it was quantified from the gel pictures .............................................. 262
Appendix 9: Table showing the concentration of each sample from the genomic isolates, as
it was quantified from the gel pictures for the second round for full genome sequencing
............................................................................................................................................ 266
List of Figures
Figure 1.1: Major changes in body appearance of C.elegans during embryonic
development ........................................................................................................................ 23
Figure 1.2: C.elegans larval development .......................................................................... 24
Figure 1.3: Schematic of an adult C.elegans cuticle depicting its multi-layered structure 25
Figure 1.4: Position of the seam cells in the hypodermis of C.elegans ............................. 28
Figure 1.5: Schematic of the arrangement of the seam cells in an adult C.elegans with
respect of the hypodermis and the cuticle ........................................................................... 29
Figure 1.6 Schematic depicting the chromosomal recombinations that can occur between
the wild type Bristol strain and the highly polymorphic Hawaiian strain .......................... 33
Figure 1.7: Schematic representation of the endosomal system ......................................... 36
Figure 1.8: Schematic representation of the SNARE and SM proteins in membrane fusion
during protein trafficking .................................................................................................... 38
Figure 1.9: Depiction of the steps for the initiation of autophagy and formation of
autophagosome .................................................................................................................... 43
Figure 1.10: Regulation of autophagy in mammals ............................................................ 45
Figure 3.1: DIC microscopy, moulting arrest of IA757 animals when cultured at 25°C ... 86
Figure 3.2: Progeny of young adult C.elegans which were hatched 48h hours after egg
laying as a percentage of total number of eggs laid ........................................................... 89
Figure 3.3: Survival of C.elegans after 120 hours of culturing, from L1 arrest at 25°C. .. 90

10
Figure 3.4: PCR samples run on 2% agarose gels for the detection of unc-51 (369) and vps-
45 (tm246) alleles ................................................................................................................. 92
Figure 3.5: Cuticular defects of the vps-45(tm246) unc-51(e369) double homozygotic
hermaphrodite ..................................................................................................................... 93
Figure 3.6: DIC microscopy of unc-51 (e369) vps-45 (tm246) double homozygotic
animals at various larval stages ........................................................................................... 95
Figure 3.7: Length comparison of wild type, IA757, CB369 strains and unc-51 (e369) vps-
45 (tm246) double mutant ................................................................................................. 101
Figure 3.8: DIC microscopy, of the pharynx of adults cultured at 15°C ........................ 102
Figure 3.9: DIC microscopy, of intestine of adult animals cultured at 15°C .................... 103
Figure 3.10: DIC microscopy, of adult cuticular alae (white arrows) ............................... 104
Figure 3.11: Immunolocalisation of C.elegans DPY-7 cuticular collagen ....................... 106
Figure 3.12: Immunoslocalisation of DPY-7 cuticular collagen, in vps-45 (tm246) mutants
during moulting arrest when cultured at 25°C .................................................................. 107
Figure 3.13: Moulting profiles of N2 , IA757, CB369 strains during the L1-L2 molt at
15°C .................................................................................................................................. 109
Figure 3.14 Duration of moult and development time to adulthood for N2, IA757 and
CB369 strains .................................................................................................................... 111
Figure 3.15 Developmental stage of N2, IA757, CB369 animals in cultures after 72h of
development, from L1 arrest at 15°C ................................................................................ 113
Figure 3.16 Lifespan of adult N2, IA757 and CB369 C.elegans at 15°C and 25°C ........ 115
Figure 4.1: UV microscopy DA2123 L1 larvae before (24 hours), during (27 and 30
hours) and after (31 hours) of the L1-L2 moult .............................................................. 126
Figure 4.2: UV microscopy of IA903 animals before (24 hours), during (26 and 28 hours)
and after (31 hours) the L1-L2 moult ............................................................................... 127
Figure 4.3: UV microscopy of IA888 larvae before (25 hours), during (29 and 35 hours)
and after (36 hours) of the L1-L2 moult. ........................................................................... 128
Figure 4.4: UV microscopy of IA897 L1 larvae before (25 hours), during (29 and 31 hours)
and after (34 hours) of the L1-L2 moult .......................................................................... 129

11
Figure 4.5: Average time of retention of LGG-1 in the seam cells after the end of the moult
............................................................................................................................................ 133
Figure 4.6: Overall levels of LGG-1::GFP in N2, IA888 and IA897 adult C.elegans. ... 135
Figure 4.7: Representative images of DIC and UV (200ms) images of coma stage, two-fold
and three-fold stage embryos along with hatching embryos of DA2123[adIs2122 [lgg-
1p::GFP::lgg-1 rol-6(su1006)]] strain ............................................................................. 141
Figure 4.8: Representative images of DIC and UV (200ms) images of coma stage, two-fold
and three-fold stage embryos along with hatching embryos of wild type IA903 [adIs2122
[lgg-1p::GFP::lgg-1 rol-6(su1006)]; jcIs1 [ajm-1::GFP unc-29(+) rol-6(su1006)] IV
]strain ................................................................................................................................. 142
Figure 4.9: Representative images of DIC and UV (200ms) images of coma stage, two-fold
and three-fold stage embryos along with hatching embryos of IA888 [adIs2122 [lgg-
1p::GFP::lgg-1 rol-6(su1006)]; vps-45 (tm246) X] strain. 63x magnification. ................ 143
Figure 4.10: Representative images of DIC and UV (200ms & 100ms exposure) images of
coma stage, two-fold and three-fold stage embryos along with hatching embryos of IA897
[adIs2122 [lgg-1p::GFP::lgg-1 rol-6(su1006)]; unc-51 (e369) V] strain ........................ 144
Figure 4.11: DIC and UV images of L1 larvae seam cells, 5 hours post hatching .......... 146
Figure 4.12: Total levels of LGG-1::GFP in 3 fold DA213, IA888 and IA897 embryos . 148
Figure 4.13: Overall levels of LGG-1::GFP in N2, IA888 and IA897 adult C. elegans .. 150
Figure 4.14: Representative images of DIC and UV (200ms) images of coma stage, two-
fold and three-fold stage embryos along with hatching embryos of IA897 strain ............ 142
Figure 4.15: Total levels of LGG-1::GFP in 3 fold DA213, IA888 and IA897 embryos . 144
Figure 4.16: DIC and UV images of L1 larvae seam cells, 5 hours post hatching ........... 145
Figure 5.1: The roGFP ER3 marker .................................................................................. 151
Figure 5.2: Western blot of roGFP ER3 protein resolved on a 10% tricine gel .............. 157
Figure 5.3: Test of roGFP ER3 oxidation state in C.elegans ............................................ 160
Figure 5.4: roGFP oxidation state in TP198, IA881 and IA880 strains ............................ 161
Figure 5.5: Survival fractions of wild type C.elegans over 4 hour time period under the
influence of 0, 0.1, 0.5, 1 and 5mM hydrogen peroxide ................................................... 163

12
Figure 5.6: Survival fractions of N2, IA757 and CB369 C.elegans over a 4 hour time
period under the influence of 1mM and 5mM hydrogen peroxide ................................... 164
Figure 5.7: Assessment of oxidative response in CF1553, IA887 and IA896 strains using
the SOD-3::GFP marker .................................................................................................... 170
Figure 5.8: Assessment of oxidative response in wild type, vps-45 (tm246) and unc-51
(e369) strains using the GST-4::GFP marker .................................................................... 172
Figure 5.9: Assessment of oxidative response in wild type, vps-45 (tm246) and unc-51
(e369) strains using the GCS-1::GFP marker ................................................................... 174
Figure 6.1: Assessment of the moulting death of the suppressed vps-45 (tm246) mutant at
25°C .................................................................................................................................. 180
Figure 6.2: Length measurement of the suppressed vps-45 (tm246) mutant .................... 182
Figure 6.3: Embryonic lethality assessment of the IA773 strain ..................................... 184
Figure 6.4: Moulting profiles of wild type N2, IA757, IA773 during the L1-L2 moult at
15°C .................................................................................................................................. 185
Figure 6.5: Moulting duration and development time characterisation of the IA773 strain
............................................................................................................................................ 187
Figure 6.6: Developmental stage of N2, IA757, IA773 strains after 72h of development,
from L1 arrest, at 15°C ................................................................................................... 189
Figure 6.7: Life span of N2, IA757, IA773 C.elegans at 15°C and 25°C ....................... 190
Figure 6.8: Representative gel for detection of vps-45 (tm246) allele .............................. 196
Figure 6.9: Representative PCR for the detection of “Hawaiian” and “Bristol” DNA . 198
Figure 6.10: Cloudmap results as retrieved by the analysis of the full genome sequencing
data obtained by the Galaxy software for the identification of the svp (ij117) suppressor
allele .................................................................................................................................. 195
Figure 6.11: Survival fraction of animals under a period of 6 days, under the influence of
RNAi for each of the candidate suppressor genes ............................................................ 205
Figure 6.12: Detection of Hawaiian and Bristol SNPs across the C.elegans chromosome II.
............................................................................................................................................ 207

13
Figure 6.13: Detection of Hawaiian and Bristol SNPs across the C.elegans chromosome V
............................................................................................................................................ 210
Figure 6.14: Two sub populations exhibiting different growth phenotypes within the
isolated Hawaiian svp (ij117) suppressed lines prepared for the sequencing experiment
............................................................................................................................................ 213
Appendix 1: Moulting profiles of wild type (N2), vps-45 (tm246) (IA757), unc-51 (e369)
(CB369) strains during the L1-L2 moult at 15°C ............................................................. 256
Appendix 2: Moulting profiles of adult wild type (N2), vps-45 (tm246) strain (IA757), svp
(ij117) strain (IA773) during the L1-L2 moult at 15°C .................................................... 257
Appendix 3: Average percentage of animals at a specific developmental stage for each
strain after 72 hours of culturing at 15°C 258
Appendix 4: 40 homozygotic lines for the vps-45(tm246) after cross with the Hawaiian
strain verified by PCR ....................................................................................................... 259
Appendix 5: Genomic isolates of the 40 suppressed lines for the vps-45 (tm246) moulting
death at 25°C, after treatment with RNAse ....................................................................... 260
Appendix 7: Sample pools prior to final mix for full genome sequencing ....................... 263
Appendix 8: Genomic isolates of the 35 suppressed lines for the vps-45 (tm246) moulting
death at 25°C excluding the five slow growing lines, after treatment with RNAse ......... 264
Appendix 10: Sample pools prior to final mix for the second round of full genome
sequencing ......................................................................................................................... 267

14
Acknowledgements
I would like to thank my supervisors, Dr. lain Johnstone and Prof. Nia Brynat, for giving
me the opportunity to perform this study and for their help and support throughout the
course of the project. I am also grateful to my assessors Prof. Sireen Davis and Prof. Neil
Bulleid for their helpful discussion and advise. I would also like to thank Prof. Gwyn
Gould and his group for their help and support throughout this project.
I would like to acknowledge Prof. Tony Page (University of Glasgow, Glasgow, UK) for
the kind gift of the strain TP198 as well as the cosmid clones he provided. Dr. Graham
Hamilton (Glasgow Polyomics, University of Glasgow, Glasgow UK) for his help with the
analysis of the full genome sequencing data.
Special thanks to my lab buddy Alexandra Kaupisch for her advice and help in the lab and
the amazing and compulsory «stress relief» days and nights out.
I would also like to thank Kati Batista. Vielen Dank für die schöne Zeit, das viele Lachen,
die Ü Eier und die Unterstützung.
I would also like to express my gratitude to Evdokia Michalopoulou for tolerating me all
these years. Ευδοκάκι μου δεν θα είχα φτάσει ως εδώ αν δεν ήσουν εσύ, σε ευχαριστώ για
την υποστήριξη, καθώς και τη Δέσποινα Ασλάνογλου για τις αμέτρητες ώρες
ψυχανάλυσης. Επίσης να πω ένα μεγάλο ευχαριστώ στη Στεφανία, τη Χρύσα και το
Λευτέρη, για τα όμορφα διαλείμματα από το χάος του Διδακτορικού. Ακόμη θα ήθελα να
ευχαριστήσω φίλο μου Χάρη Μπαρκαγιάννη που με στήριζε όλα αυτά τα χρόνια και με
«έπρηζε» να γυρίσω πίσω.
Τέλος, θέλω να ευχαριστήσω την οικογένειά μου. Σας ευχαριστώ πολύ για την
υποστήριξη σε όλη τη διάρκεια του Διδακτορικού. Αυτή η διατριβή είναι αφιερωμένη σε
εσάς, σας ευχαριστώ που με βοηθήσατε να φτάσω ως εδώ. Σας αγαπώ πολύ!

15
Authors Declaration
I declare that the work presented in this thesis has been carried out by me, unless otherwise
cited or acknowledged. It is entirely of my own composition and has not, in whole or in
part, been submitted for any other degree.
Anastasios Batas
January 2018

16
Abbreviations
ATG autophagy related gene
Act ACTin
BO3 Borate
BSA bovine serum albumin
CaCl2 calcium chloride
C.elegans Caenorhabditis elegans
CGC Caenorhabditis Genetic Centre
COG conserved oligomeric complex
Col Collagen related mutant
Cvt cytoplasm-to-vacuole targeting
Dic microscopy Differential interference contrast microscopy
dH2O distilled water
ddH2O double distilled water
DABCO 1,4-diazabicyclo octane
DIC differential interference contrast
DNA deoxyribonucleic acid
Dpy dumpy
dNTP deoxyribonucleotide
dsRNA Double stranded RNA
DTT ditiothreitol dTTP
E.coli Escherichia coli
EtOH ethanol
ECM extracellular matrix
EDTA ethylenediamine tetra-acetic acid
EGTA ethylene glycol-bis(β-aminoethyl ether)-N,N,N',N'-tetraacetic acid
EMS ethyl methasulfonate
ER endoplasmic reticulum
F1 first filial generation
F2 second filial generation
17
F3 third filial generation
GCS gamma GlutamylCysteine Synthetase related gene
GFP green fluorescent protein
GST Glutathione S transferase related gene
HOPS Homotypic fusion and protein sorting
H2O Water
H2O2 hydrogen peroxide
Ifb Intermediate Filament, B
Ifo Intermediate Filament Organize
IgG Immunoglobulin G
IPTG Isopropyl β-D-1-thiogalactopyranoside
KCl Potassium Chloride
KH2PO4 Monopotassium phosphate
K2HPO4 Dipotassium phosphate
KOH Potassium hydroxide
LAMP Lysosome-associated membrane protein
LB Lysogeny broth
LC3 microtubule-associated protein 1 light chain 3
LGG LC3, GABARAP and GATE-16 related gene
Lin abnormal cell LINeage
Lon long
L1-4 larval 1-4 stages
MEF Mouse embryonic fibroblast
MgSO4 Magnesium sulphate
Mlt MoLTing defective
MVB multivesicular body
NaCl sodium chloride
NaOH sodium hydroxide
NaOCl sodium hypoclhoride

18
NEM N-Ethylmorpholine
NGM nematode growth media
NP-40 nonyl phenoxypolyethoxylethanol
Nuo NADH Ubiquinone Oxidoreductase
PAGE polyacrylamide gel electrophoresis
PAS Phagophore assembly site/ pre-autophagosomal structure
PBS phosphate buffered saline
PBST PBS tween
PCR polymerase chain reaction
Peel Paternal-effect Epistatic Embryonic Lethal
PI3K Phosphoinositide 3 -kinase
PI(3)P Phosphatidylinositol 3-phosphate
Ptc PaTChed family
PtdIns phosphatidylinositol
Rabs-5 Rabenosyn 5
RFB Ruvkuv Finney Buffer
RNA Ribonucleic acid
RNAi RNA- mediated interference
mRNA messenger RNA
S.cerevisiae Saccharomyces cerevisiae
SOD superoxide dismutase related gene
SNARE soluble NEM sensitive factor attachment protein receptor
SNP single nucleotide polymorphism
Snt SyNapTotagmin
SWLB single worm lysis buffer
TBE Tris borate buffer
TE Tris-EDTA
Tlg target-SNARE of the late Golgi compartment protein
TORC target of rapamycin complex
TTB Tris-Triton Buffer

19
t-SNARE target-SNARE
ULK1 unc-51 Like Autophagy Activating Kinase 1
UNC uncoordinated movement related gene
UPR Unfolded protein response
UTR untranslated region
UV ultraviolet
UVRAG UV radiation resistance-associated gene
VAMP Vesicle associated membrane proteins
Vha Vacuolar H ATPase
VPS Vacuolar protein sortin related gene
v-SNARE vesicle-SNARE
WLB worm lysis buffer
w/v weight per volume
zeel Zygotic Epistatic Embryonic Lethal
ZNF Zinc Finger Nuclease
Measurements
bp base pair
cm centimetre
g gram
h hour
Kb kilobase
Kda kilodalton
L litre
M Molar
ml millilitre
mM millimolar
ng nanogram

20
nm nanometre
rpm revolution per minute
sec second
V volt
μg microgram
μm micromolar
μl microliter
°C degree centigrade
% per cent

Anastasios Batas 2017 Chapter 1
Chapter 1: Introduction
Autophagy is a cellular housekeeping mechanism which plays an important role in energy
homeostasis and cell viability (Reggiori & Klionsky 2002). Studies have associated
autophagy and embryonic development in the past along with apoptosis (Agnello et al.
2015). Biogenesis of autophagosomal membranes is aided by machinery in the endocytic
system, including SNARE (soluble NSF-attachment protein receptors) and SM
(Sec1/Munc18) proteins. While it is clear that SM proteins play an important role in
regulating SNARE-mediated membrane fusion, their mechanism of action is not well
understood. It is, however well-documented that they function in homotypic fusion of
membranes in the endocytic system, being required for exocytosis, endocytosis and
lysosomal/vacuolar delivery (Gengyo-Ando et al. 2007; Solinger & Spang 2014; Zhu et al.
2015; Wartosch et al. 2015). Loss of SM protein function can result in a multitude of
defects. For example, it has been shown that neutrophil cells with impaired action of the
SM protein VPS45 undergo rapid apoptosis (Vilboux et al. 2013; P. Stepensky et al. 2013).
Furthermore, in Caenorabditis elegans (C. elegans) knockout of the vps-45 gene resulted
in defects during early embryonic and post embryonic development (Gengyo-Ando et al.
2007). Like other SM proteins, Vps45 is perhaps best characterised for its regulation of
SNARE-mediated membrane traffic; via Syntaxin 16 in mammalian cells, Tlg2 in yeast
and SYN-16 in C. elegans (Bryant & James 2001; Gengyo-Ando et al. 2007; Struthers et
al. 2009; Shanks et al. 2012)). Collectively, numerous studies on Vps45 in various systems
have implicated a role for the SM protein in endosomal membrane traffic, autophagy and
entry into apoptosis. In this project, I sought to use the model organism Caenorhabditis
elegans to investigate relationships between endosomal trafficking and autophagy in the
development of this small multi-cellular model animal.
1.1 An introduction to C. elegans
C. elegans is a small, free-living, transparent nematode approximately 1.2 millimetres
(mm) in length (Brenner 1974). C. elegans has been used as a model organism for
developmental and genetic studies and consequently a wide variety of mutants have been
described to date and are broadly categorised based on the phenotype they exhibit

Anastasios Batas 2017 Chapter 1
22
(Hodgkin 2005). Some of these phenotypes include: uncoordinated (Unc), roller (Rol),
dumpy (Dpy), small (Sma) and long (Lon). Uncoordinated phenotypes range in severity
from paralysis to small abnormalities in movement. Roller mutants rotate around their
longitude axis during motion whereas dumpy and small mutants are typically shorter and
wider than their wild type counterparts, respectively. On the other hand, long mutants are
longer and thinner than wild type nematodes.
C. elegans can exist in two sexual forms, either as males or self-fertilizing hermaphrodites
[reviewed in (Zarkower 2006)]. Hermaphrodites are the predominant sexual form. Self-
fertilizing hermaphrodites can be used to readily generate homozygotic strains.
Heterozygosity can be introduced to homozygotic mutant strains via mating with
appropriate genotype males.
C. elegans embryogenesis takes normally approximately 16 hours under standard
laboratory conditions (20°C). This can be faster at higher temperatures (25°C) or slower at
lower (15°C) temperatures (Byerly et al. 1976). After hatch larvae develop through four
larval stages (L1-L4) before reaching the adult stage. Each larval stage ends with the
shedding of the exoskeleton and the production and secretion of the new one. An egg-to-
egg developmental cycle takes approximately 3.5 days at 20°C [(Brenner 1974; Singh &
Sulston 1978)]. Under starvation conditions, L2 larvae enter an alternative stage termed the
dauer. The animal can survive at this stage for many months, and they exhibit higher
resistance to environmental and chemical stresses due to an altered metabolism (KLASS &
HIRSH 1976; Cassada & Russell 1975; Dalley & Golomb 1992; Vanfleteren & De Vreese
1995) .
1.1.1 C. elegans embryonic development
Embryogenesis in C. elegans can be subdivided in two stages, cellular proliferation and
organogenesis/morphogenesis (Sulston et al. 1983). Proliferation takes roughly 5.5-6 hours
under standard laboratory conditions. The first phase of proliferation occurs in the uterus,
lasting 2.5-3 hours, with the remainder of this stage taking place outside the parent’s body.
During proliferation, the embryonic founder cells are generated during the first phase, with
cell divisions and gastrulation taking place during the second phase [(Sulston et al. 1983),
reviewed in (Bucher & Seydoux 1994)]. At the organogenesis/morphogenesis stage the
terminal differentiation of cells occurs, and animals and acquire their final, elongated form.

Anastasios Batas 2017 Chapter 1
23
During this second embryogenesis stage, the embryo goes through several distinct
morphological changes which themselves can be subdivided into four stages: the comma
stage, the 1.5-fold, the 2-fold and the 3-fold stage. Morphogenesis lasts approximately 10
hours. At the end of embryogenesis, the general body morphology of the animals is
established and does not change during post embryonic development (Figure 1.1) (Sulston
et al. 1983).
Figure 1.1: Major changes in body appearance of C. elegans during embryonic development. C. elegans
goes through the second part of embryonic development with the elongation of the embryo starting with the
comma stage, and proceeding to the 1.5-fold, 2-fold and 3-fold stages. At the 3-fold stage elongation stops.
The worm hatches as the L1 larva after the cuticle has secreted.
1.1.2 C. elegans post-embryonic development
C. elegans is a eutelic organisms, this means that wild type (N2) adult hermaphrodites
contain a constant number of somatic cells, in this case 959, once cell division has stopped
and maturity is reached (Sulston et al. 1983). From that point on, both the number and the
position of the cells remain unchanged, and C. elegans growth is achieved via enlargement
of the cells.

Anastasios Batas 2017 Chapter 1
24
After embryonic development, C. elegans proceeds through the four larval (L) stages, L1
to L4, before reaching adulthood. The end of each of the four larval stages is defined by
shedding of the old cuticle and synthesis of the new one, a process termed moulting. A new
cuticle is synthesised five time during the lifespan of the animal, once in the embryo and
subsequently at the end of each of the four larval stages prior to moulting (Singh & Sulston
1978) (Figure 1.2). The cuticle is composed predominantly of collagen proteins; cuticle
protein synthesis peaks during each moult, and is much reduced during the inter-moult
period (Cox, Kusch, et al. 1981; Cox, Staprans, et al. 1981).
Figure 1.2: C. elegans larval development.
C. elegans proceed through four larval stages (L1 to L4) prior to reaching adulthood. The cuticle is
synthesised five times during development and is shed four times during this time. Egg-to-egg duration in
wild type N2 nematodes grown at 20°C is approximately 3 days. Worms arrest development at the L1 stage
under scarcity of nutrients. Under stress worms take an alternate developmental path at the L2 stage by
moulting into the dauer larva. Upon removal of the stressful conditions worms moult straight to the L4 larva
and continue development normally.
1.1.3 C. elegans cuticle
The cuticle is an exoskeleton which encloses the body of all nematodes. The major
component of the extracellular matrix which forms the cuticle is collagen. The cuticle is
composed of six layers: the epicuticle, external cortical, internal cortical, intermediate
(median), fibrous and basal layers. The median layer is considered to be fluid

Anastasios Batas 2017 Chapter 1
25
filled and contains columns of filamentous material, termed struts, which connect the
cortical and basal layers by fibres with a particular arrangement. The fibrous layer
comprises two sublayers of fibres that spiral around the animal in opposite directions. The
basal layer has a loosely organised fibrillar appearance (Figure 1.3). The cortical or outer
layer exhibits a striped pattern, formed from circumferential ridges called annuli. Annuli
are present in all developmental stages (Cox, Staprans, et al. 1981; Peixoto et al. 1997).
Figure 1.3: Schematic of an adult C. elegans cuticle depicting its multi-layered structures.
Scheme representing the different layers that constitute the cuticle: cortical (which includes the epicuticle,
external and internal cortical), intermediate, fibrous, and basal along with the struts of the median layer
Reproduced from (Johnstone, 1994), permission granted from the publisher.
Cuticle components are synthesised by an underlying hypodermal cell layer, known as the
hypodermis surrounding the animal’s body (Cox, Staprans, et al. 1981; Johnstone 1994).
The cytoplasm of the hypodermal cells exhibits smooth appearance during the inter-moult
period (Singh & Sulston 1978), and a granular appearance during each moult. This
granularity reflects an increased formation of Golgi bodies, likely to aid processing and
secretion of new cuticle. After the end of each moult, the increase of intracellular
membranes and vesicles, observed during the pre-moult period, is rapidly cleared (Singh &
Sulston 1978). The molecular mechanisms underlying this clearance of secretory apparatus
after each period of new cuticle synthesis have not been established, but are pertinent to
research presented in this thesis. The apical membrane of the hypodermal cells secretes
the components of the new cuticle. During the period of the synthesis and secretion of the
Anastasios Batas 2017 Chapter 1
26
new cuticle, actin filaments are organised circumferentially around the body of the animal.
They are disbanded after the end of each moult (Costa et al. 1997). This actin localisation
corresponds to invaginations forming on the apical membrane of the hypodermal cells and
subsequently form the furrows which intervene the annuli. The cuticular collagens DPY-7
and DPY-10 both localise within or just beneath the annular furrows and are required for
their continued persistence (McMahon et al. 2003).
1.1.4 Expression of cuticle collagen genes
Cuticle collagen genes are expressed periodically during cuticle secretion; initially at the
end of embryogenesis, and subsequently during each moult period of C. elegans post-
embryonic development. Depending on precisely when individual collagen genes are
expressed during the cuticle synthesis period (in post-embryonic development termed
lethargus) they can be classified as early, intermediate or late expression, based on mRNA
peak abundance, for instance dpy-2, dpy-3, dpy-7, dpy-8 and dpy-10 genes are early
expressed whereas dpy-5 and dpy-13 genes are intermediate expressed. It is possible that
the reason for this temporal expression of genes is that different substructures of the cuticle
are synthesized at different times hence the requirement for the expression of the genes
associated with them at those appropriate times (Johnstone & Barry 1996).
1.1.5 Moulting
Moulting is the process in the development of C. elegans during which, after the secretion
and synthesis of the new culticle, the old cuticle is shed. Moulting can, itself, be divided
into three stages: lethargus, apolysis and ecdysis (Singh & Sulston 1978). During lethargus
there is a gradual decrease in general activity and feeding of the worm, until the animal
essentially stops moving altogether. The second stage is apolysis, defined by the separation
of the old cuticle from the new cuticle. Finally, during ecdysis the worm starts moving
again and rapidly rotates around its longitidual axis to loosen the old cuticle. The worm
breaks the old cuticle and emerges from it, leaving it behind to complete the process.
It is not entirely clear how the moulting process and the cuticle synthesis is controlled,
however there is evidence suggesting cholesterol and steroid hormones are involved
(Yochem et al. 1999; Kuervers et al. 2003; Matyash et al. 2004; Frand et al. 2005).

Anastasios Batas 2017 Chapter 1
27
Furthermore, RNAi screens have identified 159 genes involved in moulting, which include
transcription factors, secreted peptides, transmembrane proteins, proteases and peroxidases
(Frand et al. 2005). Furthermore, it seem probable that the endosomal system must be
involved in some way in the moulting process, either during the secretion of the cuticle or
during the apolysis or the ecdysis by trafficking the appropriate molecules to the basal
membrane or the cuticle to aid the process.
1.1.6 The seam cells and their role in C. elegans development and moulting
Epidermal cells assemble early in embryonic development into three rows on either side of
the worm’s body. As such, they can be subdivided into dorsal, lateral and ventral
depending on their position (Sulston et al. 1983). During embryogenesis, the dorsal and the
anterior and posterior ventral cells fuse and form several large cytoplasmic masses which
enclose the nuclei of the individuals cells that gave rise to them termed the syncytia
(Podbilewicz & White 1994). The central cells in the ventral row don’t fuse, and neither do
the lateral cells. The lateral cells give rise to seam cells which exhibit stem cell-like
features in that they continue to divide and differentiate asymmetrically as larval
development proceeds, giving rise to one daughter cell that will continue to proliferate
carrying the stem like features, and a second daughter that ceases to proliferate and will
differentiate to a specific cell type [reviewed in (Brabin & Woollard 2012)]. In the newly
hatched animals, seam cells are arranged as ten bilateral pairs (H0-H2, V1-V6 and T)
(Figure 1.4). Seam cells can divide both assymetrically and symmetrically; following
symmetric divisions, the two daughter cells differentiate and fuse with the hyp7
syncytium, whereas the daughter cells resulting from symmetric divisions maintain their
stem-cell-like characteristics and contribute to the increase in number of seam cells. This
symetric division takes place in the second larval stage and increases the number of the
seam cells from 10 to 16 pairs (division of V1-V4,V6 and T). During larval development,
between the L2 and L4 moults, the seam cells divide (at the end of each moult) generating
an anterior daughter cell which subsequently fuses with the hyp7, and a posterior daughter
cell which divides again at the end of the next moult. At the end of the final moult (L4-
adult), the 16 seam cells stop dividing and fuse together to form a single longitudinal
syncytium (Sulston & Horvitz 1977; Singh & Sulston 1978)

Anastasios Batas 2017 Chapter 1
28
Seam cells exhibit increased biosynthetic activity at the end of each moult (Sulston &
Horvitz 1977; Singh & Sulston 1978), and likely play a role in the secretion of cuticular
components such as dpy-5 and col-19 (Thein et al. 2003) and other secreted molecules
required for the moult. Additionally, seam cells are responsible for correct formation of
the cuticle alae at the adult stage. The alae are positioned over the seam cells at the two
sides of the C. elegans body mirroring the underlying seam syncytia (Figure 1.5). Mutants
defective for seam cell fusion at the adult stage exhibit alae irregularities (Shemer et al.
2004). Finally in male animals the V5 and V6 seam cells generate daughters cells that give
rise to the male sensory rays instead of the alae (Hunter et al. 1999; Waring et al. 1990).
Figure 1.4: Position of the seam cells in the hypodermis of C. elegans.
A) Cartoon of an L1 larvae depicting the positioning of each of the 10 seam cells along the length of the
animal prior to their division. B) Cartoon of Dorsal view of an L1 larvae showing the pair of seam cells body
along the length of the animal.
A)
Β)

Anastasios Batas 2017 Chapter 1
29
Figure 1.5: Schematic of the arrangement of the seam cells in an adult C. elegans with respect of the
hypodermis and the cuticle. The seam cells are embedded in the hypodermis and are organised in a
syncytium. The cuticular alae of the adult animals are formed in accordance to the position of the seam cells.
1.1.7 C. elegans genetics
The wide range of genetic tools available for studies using C. elegans make it a very
attractive model organism. Its appeal was further increased after its genome was fully
sequenced and annotated in 1998 (C. elegans Sequencing Consortium 1998). C.elegans
exhibit a low level of genetic diversity as a result of their ability to self-reproduce
(Hodgkin & Doniach 1997). Molecular polymorphism has been studied in a number of
natural isolates collected worldwide. Isolates originate from North America, Australia and
Western Europe from where the N2 (Bristol) reference strain originates. The CB4856
isolate which was first identified in Hawaii (Termed the Hawaiian strain) and closely
related to the N2 isolate(Hodgkin & Doniach 1997) in particular has been previously used
in SNP (single nucleotide polymorphism) (Minevich et al. 2012) mapping.
C.elegans can reproduce through self-fertilisation. All animals carry 5 pairs of autosomal
chromosomes (LGI-LGV) and one pair of sex determining chromosome (LGX).
Hermaphrodites carry two copies of the X chromosome, whereas males have only one X
Seam cell
syncytium
Hypodermis
Alae
Cuticle

Anastasios Batas 2017 Chapter 1
30
chromosome. During self-fertilisation, hermaphrodites first produce sperm and then their
oocytes through meiotic divisions. In a population, hermaphrodites cannot cross-fertilize,
as such males are required for outcrossing. Males can be produced by non-disjunction of
the X chromosome at meiosis in hermaphrodite animals. Spontaneous non-disjunction of
the X chromosome occurs at a low rate in laboratory conditions as a result of genetic
variation even in the cases of higher brood production [(Hodgkin & Doniach 1997),
reviewed in (Zarkower 2006)]. The rate of X chromosome non-disjunction can be
increased via alteration of environmental factors such as increased temperature. After
crossing of the N2 males with N2 hermaphrodites, the early generations will produce a
50% frequency of males. That frequency is reduced in subsequent generations due to low
mating abilities of the N2 males as well as the ability of hermaphrodites to self-reproduce
prior to/ or without mating with males. However, in the case of the CB4856 strain the
males exhibit a higher mating ability (Hodgkin 1983; Hodgkin & Doniach 1997; Chasnov
& Chow 2002; Cutter et al. 2003).
The advantages of the above methods of reproduction are apparent when it comes to
maintaining mutants. Homozygotic hermaphrodite mutants that are viable and fertile can
be maintained as homozygous stocks since the parents produce genetically identical
offspring. With lethal mutations or mutations causing sterility, which are recessive as well
it is possible to be maintained in a heterozygotic state. As such only 25% of the offspring
population will die, and thus making it possible to analyse these mutants.
A common way of generating C. elegans mutants is through treatment with ethyl
methanesulfonate (EMS), a strong mutagen that can commonly produce G to A and C to T
transitions, and less commonly other point mutations and deletions (Brenner 1974). For
targeted gene conversion and deletions transposon based methods are utilised either by
insertions or by excisions. G4 DNA induced deletion mutagenesis which utilises the G-
quadruplex DNA secondary structure can also be used for generation of deletions. A range
of other chemicals as well as radiation has also been utilised for the generation of mutants
(Kutscher & Shaham 2014). Recently more modern methods have been developed to
generate C. elegans mutants. These are the Zinc finger nucleases (ZNFs) (Kim et al. 1996)
and the CRIPSR/Cas system methods (Friedland et al. 2013).
After a mutant has been isolated, the specifics of its gene function can be investigated
through the phenotypes manifested on the animals that carry it. There are two approaches

Anastasios Batas 2017 Chapter 1
31
to this. The forward genetic approach involves identifying the said mutant phenotype first
and proceeding to the characterisation and mapping of the mutation in order to identify the
exact gene producing these phenotypes. This used to be quite a lengthy and difficult
process requiring several steps of crossing between the mutant strain and the Hawaiian
strain and then SNP testing via PCR. This has been made much simpler with the potential
of producing more accurate and much faster results through next generation sequencing
[(Bazan & Hillers 2011; Minevich et al. 2012), reviewed in (Fay 2013)]. After the
annotation of the C. elegans genome it has become possible, to follow an alternative
approach; the reverse genetics approach going from a gene sequence to characterising the
mutant phenotype.
1.1.8 Next generation sequencing
As previously mentioned, next generation sequencing is a fast and cost effective method to
identify genetic mutations in organisms such as C. elegans. The use of single nucleotide
polymorphisms (SNPs) is the most commonly used mapping strategy in C. elegans. SNPs
can function as genetic markers for two- and three-factor mapping in order to measure
recombination across whole chromosomes and hence identify the position of the phenotype
causing mutation [reviewed in (Fay 2013)]. Commonly this strategy employs DNA
sequence polymorphisms between the wild-type C. elegans Bristol strain (N2) and the
closely related Hawaiian strain (CB4856) (Hodgkin & Doniach 1997). The Hawaiian SNPs
in general display no phenotype and as a result, mutations which do cause an associated
phenotype, even a subtle one, can be mapped via the utilisation of the SNPs (Bazan &
Hillers 2011; Wicks et al. 2001).
Traditional mapping involves a cross set up between the mutant isolate and the
polymorphic strain of the same species. For instance, a mutation in a strain with Bristol
genetic background is crossed with the wild type Hawaiian polymorphic strain. In the F1
generation all of the progeny will be heterozygotic for the mutation as well as the
Hawaiian SNPs. In the subsequent F2 generation 25% of the progeny will be homozygotic
for the mutation causing allele. In this case, that 25% will display the mutant phenotype.
SNPs in this case will be distributed approximately equally at 50% Hawaiian/ Bristol
across most of the genome due to the random recombination that occurs between the
chromosomes during meiosis. However, this ratio will tend towards 0% for Hawaiian
polymorphisms near the mutation. The reason for this difference is that SNPs which are

Anastasios Batas 2017 Chapter 1
32
physically close to the causal mutation are linked to it, and hence are much less likely to
take part in a chromosomal recombination event compared to others which are further
away. As such the region which carries a long stretch of parental SNPs, in this case Bristol,
will incorporate the genetic mutation in question. This method is very time consuming as it
requires several strains to be checked for SNP in question via PCR (Williams et al. 1992;
Wicks et al. 2001).
The first stage of the above method involves identification of the relevant chromosome,
and a rough position of the gene of interest. In the second stage, a more specific
positioning of the gene of interest is identified and he aim is to identify the interval
between two SNPs on which the mutation is located. PCR can be used for the amplification
of the SNP is followed by digestion with the appropriate enzyme. Depending on the
combination of bands acquired in the end after the electrophoresis the on whether they are
of Bristol or Hawaiian origin can help in assessing whether recombination has not
occurred hence the region is linked or not, to the mutation (Wicks et al. 2001).
With the aid of deep genome sequencing technologies however the process of gene
mapping and identification can be considerably sped up. The basic principle is the same as
in the traditional SNP mapping method with the only difference being that instead of
performing PCR, restrictions enzyme digestions and finally gel electrophoresis to identify
each SNP individually, all of them can be identified as once (Figure 1.6). The method was
initially tested in Arabidopsis thaliana for the identification of a non-synonymous codon
change that caused slow growth and different pigmentation of the leaves (Schneeberger et
al. 2009). The method has since then, been adapted and applied for the identification of
mutations in C. elegans (Doitsidou et al. 2010a; Minevich et al. 2012).

Anastasios Batas 2017 Chapter 1
33
Figure 1.6: Schematic depicting the chromosomal recombinations that can occur between the wild type
Bristol strain and the highly polymorphic Hawaiian strain.
The reference strain (N2) is shown in blue, the polymorphic Hawaiian strain (CB4856) in yellow and the
presence or absence of a mutation by the red diamond shape. In the F1 progeny all progeny will be
heterozygotic for the Hawaiian sequences. At the F2 and subsequent generation Hawaiian DNA will be
equally represented across the genome of the animals if no mutation is present. If a mutation is present, the
area surrounding it should remain Bristol (blue).Adapted from (Minevich et al. 2012).

Anastasios Batas 2017 Chapter 1
34
1.1.9 RNAi
In 1998, it was discovered that the injection of double stranded RNA (dsRNA) in C.
elegans can lead to degradation of the corresponding mRNA. This process was termed
RNA interference or RNAi (Fire et al. 1998). Since the full genome sequencing and
annotation of the C. elegans genome RNAi is being used as a complementary approach to
the creation of genetic knockouts. Other methods, apart from injection of dsRNA in adult
worm gonads, include soaking the worms in dsRNA solutions (Tabara et al. 1998) or by
feeding worms with E.coli expressing the desired dsRNA (Timmons et al. 2001). The latter
two can be done in worms of any stage, however it is important to keep in mind that
depending on the stage the animals will be fed can produce different phenotypes.
1.2 The endocytic pathway
Endocytosis is the process by which a portion of a cell’s plasma membrane invaginates to
form a vesicle that buds off into the cytoplasm facilitating transport of extracellular
material including nutrients, and cell surface components into the cell via the endocytic
system. The initial vesicle that buds from the cell surface forms, engulfing the material to
be internalised in the process. These vesicles fuse with the early/sorting endosomes which
can subsequently mature to late endosomes. The internalised material in the early
endosomes, can be delivered back to the plasma membrane via the recycling endosome, or
can be targeted to the vacuole/lysosome for degradation to the lysososomes via the late
endosomes. [reviewed in (Elkin et al. 2016)] (Figure 1.7). As with all membrane
trafficking pathways in eukaryotic cells, fidelity of fusion of vesicles with the appropriate
target organelle is critical. Proteins required for proper regulation of membrane trafficking
are conserved between different trafficking steps and also between all eukaryotes (from
yeast to humans). Like all trafficking pathways membrane fusion in the endocytic pathway
involves SNARE (soluble N-ethylmaleimide-sensitive factor attachment protein receptor),
SM (Sec1/Munc18), Rab and tethering proteins. Tethering complexes such as CORVET
(class C core vacuole/endosome tethering), HOPS (Homotypic fusion and protein sorting),
or COG (conserved oligomeric complex) act , in the tethering/connection of the endosomal
vesicle and the target membrane (Jiang et al. 2014; Solinger & Spang 2014; Seals et al.
2000; Solinger & Spang 2013; Yen et al. 2010). Each of the tethering complexes appears
to be involved in fusions at different parts of the endocytic system. The CORVET complex
acts as a tethering factor for the fusion of the endocytic vesicles with the early endosomes

Anastasios Batas 2017 Chapter 1
35
(Solinger & Spang 2013; Solinger & Spang 2014), the HOPS complex regulates the fusion
of mature endosomes and autophagosomes to lysosomes (Solinger & Spang 2014; Jiang et
al. 2014). Finally COG is thought to act mainly in Golgi retrogate trafficking, ER to Golgi
transport as well as during the formation of autophagosomes as a membrane tethering
factor (Yen et al. 2010; VanRheenen et al. 1998; Bruinsma et al. 2004; Zolov & Lupashin
2005; VanRheenen et al. 1999). SNARE/SM protein complexes mediate the fusion of the
vesicle and target organelle. SNARE proteins provide the force for the membrane fusion
via their association into SNARE complexes and SM proteins interact with SNARE
proteins to regulate the formation of these complexes [reviewed (Jahn & Scheller 2006)] as
described below (Section 1.2.1). Finally, Rab GTPases mediate the transport and correct
targeting of vesicles through the endocytic system, as well as the fusion of the membranes
via direct interaction with tethering complexes or via indirect interaction with SNARES
through their effectors (Nielsen et al. 2000; Simonsen et al. 1999).
Other pathways that intersect with the endocytic system, include the exocytic pathway
(delivering both previously endocytosed material through recycling endosomes (Ward et
al. 2005) and newly synthesized material (Futter et al. 1995; Ang et al. 2004; Chen et al.
1998; Harsay & Schekman 2002) to the plasma membrane, the autophagic pathway
(Ganley et al. 2011; Jiang et al. 2014; Itakura & Mizushima 2010), and the Cytoplasm to
vacuole trafficking (Cvt) pathway in yeast (Baba et al. 1997; Scott et al. 1996) (Figure
1.7).

Anastasios Batas 2017 Chapter 1
36
Figure 1.7: Schematic representation of the endocytic system.
Endosomes form at the plasma membrane and can target cargo protein for degradation to the lysosome by
fusing with it. Autophagy/Cvt vesicles are formed at the PAS and transfer their respective cargo
(Macromolecules, organelles, enzymes) to the lysosome. De novo synthesized proteins are secreted through
the secretory pathway which can intersect with the endocytic system at the early endosomes. The
Tlg2/Syntaxin 16 SNARE localises at the early endosome and the TGN. Vps45 is required for the transfer of
cargo proteins between the TGN and the endosomal system.
1.2.1 SM proteins and SNARE complexes
SM (Sec1/Munc18) proteins regulate the assembly of SNARE (soluble N-ethylmaleimide-
sensitive factor attachment protein receptor) complexes which are central to membrane
trafficking in all eukaryotes. SNARE proteins are localised on vesicle membranes and the
membranes of target organelles, and form complexes via their carboxy (C) termini
(Bennett et al. 1992; Séron et al. 1998; Gurunathan et al. 2000). Formation of SNARE
complexes between cognate SNAREs on opposing lipid bilayers is the minimal
requirement for membrane fusion [reviewed in (Jahn & Scheller 2006)].
SNARE proteins are evolutionary conserved with their defining characteristic being the
cytosolic SNARE motif (Jahn & Südhof 1999; Lin & Scheller 2000). Most SNAREs are

Anastasios Batas 2017 Chapter 1
37
C-terminally tail anchored membrane proteins [reviewed in.(Hong, 2005; Sudhof et al,
2009)]; ~60-70 amino acid residue stretch containing a heptad repeat. A functional
SNARE core complex, forms when four SNARE motifs are arranged in a tight, parallel
helical bundle. This paralleled arrangement requires one arginine- SNARE (R-SNARE)
and three glutamine SNARES (Qa, Qb, Qc SNAREs) (Weimbs et al. 1997; Antonin et al.
2002). This classification of the SNARE proteins depends on their amino acid contribution
(glutamine or arginine) to the ionic layer (termed “0” layer) of the SNARE complex
(Fasshauer et al. 1998). In general R SNAREs are anchored on the vesicle membrane (v-
SNAREs) and the Q-SNAREs on the membrane of the target organelle (t-SNAREs)
(Sudhof & Rothman 2009).
Syntaxins are a subfamily of SNARE proteins, usually Qa SNAREs, that carry an N-
terminal domain, the Habc domain, that autonomously folds into a three-helix bundle. This
Habc domain can bind to the syntaxin’s SNARE motif , an interaction that inhibits SNARE
complex formation (Hanson et al. 1995; Burkhardt et al. 2008). This state is termed ‘the
closed conformation’. When the Habc domain is not bound at the C-terminus and the
SNARE is in its open conformation, the SNARE domain is accessible and can form the
SNARE complex along with the other three snare domains of the cognate snare proteins
(Dulubova et al. 2002). The open and closed conformations of the syntaxin SNARE
proteins is regulated by Sec1/Munc-18 (SM) proteins. One example of such regulation of
SNARE proteins is the case of Vps45 and its binding partner Tlg2/Syntaxin 16 in yeast and
mammals (Dulubova et al. 2002; Yamaguchi et al. 2002).
The Sec1/Munc18 (SM) family of proteins regulates membrane fusion via association with
distinct subsets of SNAREs. Although the mechanism of action for SM protein regulation
is not clear, it is certain that these proteins are universally required for functional SNARE
complex assembly (Carr & Rizo 2010). SM proteins have an arch-shaped structure (Misura
et al. 2000) and can interact with SNAREs in three distinct modes. The first mode, which
was originally characterised via the interaction of syntaxin1a and the neuronal SM protein
Sec1. In this mode, the SM protein binds all four helices of the SNARE protein (3 Helices
from the Habc domain and 1 helix for the SNARE motif) and bring them together in a
bundle. As such the syntaxin adopts a closed conformation and cannot form the SNARE
complex require for the membrane fusion (Figure 1.8A) (Dulubova et al. 1999; Misura et
al. 2000). In the second mode, the SM protein binds to the N-terminus of the syntaxin at a
specific peptide sequence, thus allowing for the syntaxin to adopt an open conformation
(Figure 1.8B). At this point the three remaining helices of the

Anastasios Batas 2017 Chapter 1
38
Figure 1.8: The different binding modes of SM proteins with syntaxins
A) The SM protein binds the four-helix bundle composed of the syntaxins own Habc N-terminal
domain resulting in the closed conformation of the syntaxin. B) The SM protein binds to the N-peptide
present at the Habc domain allowing for association of the t-SNAREs with the v-SNARE. C) SM
protein binding SNARE complex consisting of the three t-SNAREs and the v-SNARE which will guide
the fusion of the membranes. Adapted from (Jahn & Südhof 2003).
t-SNARE can form a complex with the single helical v-SNARE which is stabilised by
the ‘’clasping’’ of all four helices by the SM protein, similar to how it would
previously clasp the four helix bindle of the ‘’closed ‘’ conformation syntaxin (Figure
1.8C) (Yamaguchi et al. 2002; Dulubova et al. 2002).
As the SNARE complex has now formed it can bring the two membranes (vesicle and
target membrane) together in close proximity, and provide the force for the fusion.

Anastasios Batas 2017 Chapter 1
39
1.2.2 The SM protein Vps45
Vps45 was originally identified through genetic screens for yeast defective in vacuolar
protein sorting (vps mutants) (Robinson et al. 1988), and has been shown to be essential for
delivery of proteins from the trans Golgi network (TGN) into the endosomal system
(Cowles et al. 1994; Piper et al. 1994).
In Saccharomyces cerevisiae, the Sec1/Munc-18 protein Vps45 activates the Syntaxin Tlg2
by facilitating a change in its conformation from closed to open. Once Tlg2 is in its open
conformation it can form a functional SNARE complex with its binding partner t-SNAREs
Tlg1, Vti1 and the v-SNARE Snc2 (Bryant & James 2001; Carpp et al. 2007). Vps45 binds
directly to Tlg2, as well as to the v-SNARE, Snc2, and the assembled SNARE complex
(Carpp et al. 2007; Furgason et al. 2009). Vps45 is required for the stable expression and
function of its Tlg2 in yeast (Bryant & James 2001).
As mentioned above, Vps45, and the SNARE complex whose assembly it regulates,
mediates traffic from the TGN through the endosomal system, and was originally
identified as being required for the biosynthetic pathway in yeast. It is also required for the
endocytic, autophagic pathways as well as the autophagy-related Cvt (Section 1.3.1)
pathway. However the actual mechanism of this regulation is still unknown (Brickner et al,
2001; Ohashi and Munro, 2010; Nair and Klionsky, 2011).
Furthermore, Vps45 was originally reported to regulate membrane traffic through the
syntaxin Pep12 (Burd et al. 1997; Webb et al. 1997), but no physical interaction has ever
been identified (Bryant & James 2001), and the significance of the functional interactions
demonstrated remain to be fully understood.
Vps45 yeast mutants belong to the class D group, one of the six groups (A-F) of vps
mutants as classified based on the morphology of their vacuoles. The class D group
mutants, exhibit defective segregation of the vacuole from the mother cells to the budding
daughter cells. This classification further suggest the existence of 6 separate processes
which when disrupted result in the miss sorting of vacuolar hydrolase carboxy peptidase Y
(CPY) (Raymond et al. 1992). Unlike most vps mutants, vps45 mutant yeast have a
significantly longer doubling time compared to wild type strains and are temperature
sensitive for growth. Importantly, this is an unusual case of temperature sensitivity in that
null alleles are temperature sensitive meaning that the function of vps45 is not essential for

Anastasios Batas 2017 Chapter 1
40
growth at low temperature, but it is at high temperatures. Of note here is the observation
that mutations in VPS genes encoding proteins with which Vps45 interacts and/or function
in the same specific trafficking step (class D Vps proteins) do not share these growth
phenotypes (Shanks et al. 2012).
1.2.3 Loss of VPS45 as a cause for Neutropenia
Severe congenital neutropenia is a group of genetic disorders which show great
heterogeneity. Among all of them however, the common denominator is the increased
susceptibility of neutrophil precursors to undergo apoptosis. Neutrophils are part of the
initial line of immune defense of most mammals against invading pathogens such as
bacteria. In humans they represent 40%-60% of the white blood cells and they exist in
healthy adults in a resting state ready to be activated. When in this state, the cells are
prevented from secreting any of their toxic intracellular components which can potentially
damage host tissue. Upon infection neutrophils are activated and migrate to the site of
infection where they attack and phagocyte pathogens. After this is complete they can act as
antigen presenting cells for T-cells and also secrete a large number of inflammatory
mediators such as chemokines and cytokines which attract more immune cells to the site
(Fielding et al. 2008; Wright et al. 2010). Patients with neutropenia suffer recurring
infections as a result of the reduction in neutrophil population.
Recently a loss of function mutation (Thr224Asn) in the Sec1/Muc18 protein (SM protein)
VPS45 in humans was identified as a cause for neutropenia. It is proposed that disruption
of the VPS45 function in neutrophils could result in a perturbed delivery of cargo from the
TGN to the endosomal system, which could be blocking the earlier secretory pathway and
result to ER stress which would eventually trigger apoptosis (P. Stepensky et al. 2013). A
similar model through which neutropenia can develop has been reported in patients with
mutations in the ELA2 gene, which encodes for neutrophil elastase (NE) (Grenda et al.
2007). In this case ER stress develops from the accumulation of misfolded NE protein (P.
Stepensky et al. 2013; Benson et al. 2003; Grenda et al. 2007; Grenda et al. 2009), which
would activate the UPR response and eventually apoptosis [(Grenda et al. 2007; Grenda et
al. 2009),reviewed in (Ron 2002)]. Further to this, previous experiments by members of
our lab have demonstrated that yeast cells harbouring the analogous mutation (T238N)
exhibit higher sensitivity to H2O2 mediated killing (Cowan, 2014), suggesting possibly a

Anastasios Batas 2017 Chapter 1
41
sensitivity to oxidative stress as a result of a pre-existing ER stress (Plaisance et al. 2016;
Malhotra & Kaufman 2007a; Harding et al. 2003).
1.2.4 VPS-45 and its role in C. elegans
A similar temperature sensitive behaviour to that identified in Vps45 yeast mutants
(section 1.2.1) is associated with a null allele of vps-45 Caenorabditis elegans. The vps-45
gene is located on the X-chromosome of the C. elegans genome. Strains carrying a deletion
at the vps-45 gene are viable at 15°C but die during the moult when cultured at 25°C.
When the same mutant is cultured at 15°C it can survive and moult through to adulthood,
but with a small body size phenotype. Furthermore, a role of VPS-45 was identified for the
uptake of the yolk protein YP170, by the oocytes in C. elegans. The process was disrupted
in mutants at the non-permissive temperature. Additionally, a defect at the transport of
cargo from the endosomes to lysosomes was identified. As previously stated, in yeast
Vps45 directly interacts with Tlg2 and functionally interacts with Pep12 and their
orthologues syntaxin 13 and syntaxin 16 in mammals. Similarly in C. elegans VPS-45 has
also been shown to interacts with the C. elegans orthologues SYN-13 in co-IP experiments
and SYN-16 in co-IP and yeast-two hybrid experiments. Single and double knockouts of
those two syntaxins in C. elegans exhibited none of the above described phenotypes
suggesting that their binding to VPS-45 is not essential for its function or might not be
acting on the same endocytic pathway (Gengyo-Ando et al. 2007).
On the other hand, VPS-45 does physically interact with Rabenosyn- 5 (RABS-5), which is
the effector of the tethering factor RAB-5, both in mammals and in C.elegans (Nielsen et
al. 2000; Gengyo-Ando et al. 2007) is generally believed, that Rab GTpase proteins such
as Rab5 are responsible for specific tethering and docking reactions and SM proteins such
Vps45 are what drives the fusion of the two membranes (Mayer & Wickner 1997; Zerial et
al. 1999; Nielsen et al. 2000). No interaction has been identified between VPS-45 and
RAB-5. In addition to this, rabenosyn-5 (rabs-5) mutants, were no different than the vps-45
suggesting an interaction between the two molecules in a RAB-5 mediated homotypic
fusion. Experiments in C. elegans demonstrated that the murine orthologue (VPS45) is
functionally interchangeable with vps-45 and can rescue the defects caused by its deletion.
However, the yeast orthologue had no such effect. As such it is speculated, that VPS-45
has evolved in multicellular organisms to gain additional endocytic functions due to the
higher complexity exhibited in their transport pathways (Gengyo-Ando et al. 2007).

Anastasios Batas 2017 Chapter 1
42
1.3 Autophagy
Autohagy is a vital cellular process involving the degradation of intracellular components
such as proteins and organelles. Autophagy can be subdivided to macroautophagy,
microautophagy and chaperone-mediated autophagy. Macroautophagy and
microautophagy can engulf large structures in a selective and non-selective manner. On the
other hand, chaperone mediated autophagy can only degrade soluble protein and in a
selective way. All three autophagic mechanisms include the use of membrane organelles
for the transfer of intracellular cargo to be degraded to the lysosome [reviewed in
(Mizushima et al. 2008)].
It has been demonstrated that autophagy can act both as a cytoprotective mechanism as a
well as a deleterious one. The pathway has been shown to aid in the survival of yeast under
starvation conditions (Tsukada & Ohsumi 1993). Induction of autophagy in Drosophila
through overexpression of the autophagy regulator Atg1 can lead to cell death (Scott et al.
2007). On the other hand, in C. elegans lacking bec-1, which is the mammalian
orthologue of beclin1 and the yeast ATG6 and mice lacking beclin 1 or ATG5, display
increased numbers of apoptotic cells in embryonic tissue (Takacs-Vellai et al. 2005; Qu et
al. 2007). This suggests that tight control of autophagy is a requirement to promote cell
survival. Mutations in a variety of genes related to autophagy demonstrate the importance
of this pathway in a number of physiological processes and pathologies (Section 1.3.6).
The first step in this process is the formation of the membranes for these organelles termed
phagophores or isolation membrane. The proposed site for the formation of the phagophore
is the phagophore assembly site/pre-autophagosomal structure (PAS) in yeast (Kirisako et
al. 1999; Suzuki et al. 2001; Kim et al. 2002) where the autophagic machinery colocalises.
In other eukaryotes multiple sites of autophagosome assembly have been identified such as
the ER, the Golgi, mitochondria and the plasma membrane (Lamb et al. 2013), however
the current consensus is that the autophagosomes arise from the omegasome, an omega
shape compartment of the ER where autophagy regulators ULK1, ATG14 and PI(3)P are
localised (Itakura & Mizushima 2010; Matsunaga et al. 2010; Axe et al. 2008; Karanasios
et al. 2013).
The phagophore/isolation membrane has a crescent like shape. This is then elongated to
enclose and assimilate the cytosolic cargo. Subsequently the autophagosome fuses with the

Anastasios Batas 2017 Chapter 1
43
lysosome to form the autolysosome, where degradation of the cytosolic content takes
place [reviewed in (Mizushima 2007)] (Figure 1.9).
Figure 1.9: Depiction of the steps for the initiation of autophagy and formation of autophagosome.
Autophagy is initiated at a pre-autophagosomal structure (PAS) by the formation of the phagophore/isolation
membrane. This membrane expands and engulfs cytosolic components in the process. The two leading edges
of the isolation membrane fuse, resulting in the formation of a double-membrane vesicle termed the
autophagosome. Fusion between the autophagosome and the lysosome results in the formation of the
autolysosome. The contents of the autolysosome are subsequently degraded by the proteolytic enzymes and
recycled by the cell.
1.3.1 The cytoplasm to vacuole targeting pathway
The cytoplasm to vacuole targeting (Cvt) pathway is a constitutively active biosynthetic
pathway which is responsible for the transport of hydrolase emzymes, such as
aminopeptidase I (ApeI) to the yeast vacuole (equivelant of the lysosome in higher
organisms) under nutrient rich conditions [reviewed in (Khalfan & Klionsky 2002)]. The
Cvt pathway utilizes, to a great extent the same molecular machinery as autophagy, and as
a result it is considered to be an autophagy related pathway (Baba et al. 1997; Scott et al.
1996). However, unlike autophagy it is constitutively active, whereas autophagy is
inducible under stress or starvation. Cvt vesicles, much like autophagic vesicles arise from
the PAS (Suzuki et al. 2002; Kim et al. 2002), however they have a much smaller size of
140-160 nm (Kim et al. 2002) compared to 400-900 nm for the autophagosomes
(Takeshige et al. 1992).

Anastasios Batas 2017 Chapter 1
44
1.3.2 Induction of autophagy by the mTORC1 pathway
The key regulator of autophagy in yeast is the Atg1 kinase. ULK1 and UNC-51 are its
orthologues in mammals and C.elegans respectively. The action of the Atg1 kinase is
explained in detail in section 1.3.3. In mammals the target of rapamycin complex (TORC)
is known to regulate autophagy via the ULK1 kinase (J. Kim et al. 2011).
The mammalian target of rapamycin or mechanistic TOR (mTOR ) is a highly conserved
serine/threonine kinase which interacts with a multitude of signals such as amino acid
levels, growth factors and oxygen in order to coordinate cell growth and regulate metabolic
homeostasis (Laplante & Sabatini 2012). In mammals two mTOR complexes exist,
mTORC1 and mTORC2. It is mTORC1 that has been shown to be sensitive to both growth
factors and nutrients which is essential for the activation of the mTORC1 kinase (Jewell et
al. 2013), whereas mTORC2 has been shown to be sensitive only by growth factors and
has been shown to control their flux via the Akt/PKB (Protein KINASE B) pathway in
mitochondrial associated ER membranes (Betz et al. 2013).
It is widely accepted that mTORC1 acts as repressor of autophagy in eukaryotes. It has
been shown that just the inhibition of mTORC1 is enough to induce autophagy even when
there is abundance of nutrients both in yeast and mammalian cells (Noda & Ohsumi 1998;
Kanazawa et al. 2004; Thoreen et al. 2009).
The ULK1/Atg1/UNC-51 complex (Section 1.3.3) is supressed by mTORC1which in turn
represses autophagy. Suppression of the ULK1 results in the inhibition of autophagy and is
conserved across eukaryotes. In mammalian cells the ULK1-ATG13-FIP200 complex
(ATG1-ATG13-ATG17 in yeast) is formed regardless of the nutrient status (Kamada et al.
2000; Mizushima & Klionsky 2007).
The mTORC1 inhibits the ULK1 kinase activity, by phosphorylating the ATG13 and
ULK1 subunits of the ULK1 complex. Inhibition of mTORC1 binding, allows ULK1 to
autophosphorylate and in turn further phosphorylates its binding partners ATG13 and
FIP200 and thus activating the kinase complex under starvation (Figure 1.10) (J. Kim et al.
2011) which in turn recruit the rest of the components for the formation of the

Anastasios Batas 2017 Chapter 1
45
autophagosome. Similarly in yeast the ATG genes have been demonstrated to act
downstream of TOR (Ohsumi 2000; Kamada & Ohsumi 2010).
Figure 1.10: Regulation of autophagy in mammals.
Phosphorylation by mammalian-TOR complex 1 (mTORC1) of ULK1 inhibits ULK1 and initiation of
autophagy. Amino acid starvation or rapamycin treatment causes dissociation of mTORC1 and ULK1 can
phosphorylate and activate FIP200 allowing formation of the phagophore at the phagophore assembly
site/pre-autophagosomal structure (PAS).
1.3.3 Induction of autophagy and autophagosome assembly
The autophagosome is a double membrane organelle which required for the sequestering of
cargo destined for degradation in cells as part of the autophagic process. The
autophagosomal membrane is rich in lipids and poor in proteins since it only has one
specialised function which is the delivery of cytosolic components to the lysosome/vacuole
(Baba et al. 1995) where the two fuse and the autophagosome is degraded rapidly(Suzuki
et al. 2002). Autophagy related protein (Atg) are the main regulators and components in
the formation of the autophagosome and can be classified into six functional groups i) the
Atg1 kinase complex (Atg1-Atg13-Atg17-Atg29-Atg31), ii) Atg9, iii) the class II
phosphatidylinositol (PI)3P- kinase complex (Atg6/Vps30-Atg14-Vps15-Vps34), iv) The
PI(3)P- binding Atg2-Atg18 complex, v) the Atg12 conjugation system (Atg12-Atg5-
Atg16) and finally vi) the Atg8 conjugation system with the involvement of
phosphatidylethanolamine (Atg8-PE) (Suzuki et al. 2007; Suzuki & Ohsumi 2007). The
formation of the autophagosome can be subdivided into two steps the nucleation which can

Anastasios Batas 2017 Chapter 1
46
form a minimum size autophagosome, termed the phagophore or isolation membrane, and
the expansion to achieve a normal size organelle (Abeliovich et al. 2000; Biazik et al.
2015). The Atg2-Atg18 complex, the Atg12 conjugation system the PI(3)P kinase complex
are involved in the nucleation step, whereas Atg8-PE is required for expansion [reviewed
in (Suzuki & Ohsumi 2007)].
Studies in yeast have provided the hierarchy through which the protein acts in the PAS for
the formation of the autophagosome. Atg17 is essential for the recruitment of the rest of
the Atg protein to the PAS. In the absence of Atg17 localisation of downstream Atg to the
PAS protein is abolished (Suzuki et al. 2007). Atg17 forms a complex with Atg29 and
Atg31 (Kabeya et al. 2009) and subsequently recruit Atg1-Atg13 to the PAS via the direct
interaction of Atg17 and Atg13 (Kabeya et al. 2005). The formation of complexes
between Atg1-Atg13 and Atg17-Atg29-Atg31 is what gives Atg1 its kinase
activity(Kabeya et al. 2005; Ohsumi 2000). The PI(3)P kinase complex is subsequently
recruited via direct interaction of between its own Atg14 and Atg13 from the Atg1 kinase
complex (Jao et al. 2013). The complex then acts in the initial recruitment to the PAS via
recruitment of Atg8-PE and the Atg12 conjugation system and Atg2-Atg18 complex. Atg9
is recruited via a direct interaction with Atg11 (He et al. 2006) which can form complexes
with Atg1 kinase complex via Atg17 (Yorimitsu & Klionsky 2005). Atg11 however, has
been identified to operate exclusively in the Cvt pathway in yeast via the interaction of
autophagy receptors (Kim et al. 2001; Kamber et al. 2015) and it is unclear if a component
is present in the autophagic pathway.
The mammalian homologue of Atg1, known as ULK1, also form a complex at the
initiation of autophagy in mammals termed the ULK1 complex. It has been shown to
mediate localisation of Atg9 in an AMPK (Adenosine monophosphate-activated protein
kinase) dependent manner (Young et al. 2006; Mack et al. 2012). Atg-8 is subsequently
recruited by Atg9 (Suzuki & Ohsumi 2007; Suzuki et al. 2001). The Atg12 conjugation
system subsequently localises to the developing autophagosome where it facilitates the
correct localisation and lipidation of Atg8 to aid in the expansion of the autophagosomal
membrane (Hanada et al. 2007; Nakatogawa et al. 2007). Furthermore ATG9 has been
shown to function in aiding in the transport of membranes from the PAS to non-PAS
structures, a process required for the expansion of the phagophore membrane and the
formation of the autophagosome in yeast (Reggiori et al. 2004; Yen et al. 2007; Reggiori &
Klionsky 2006).

Anastasios Batas 2017 Chapter 1
47
A similar mechanism has been identified in mammals. The formation of ULK1
(mammalian homologue of yeast Atg1) complex puncta is one of the first events to occur
as part of autophagy initiation (Itakura & Mizushima 2010; Kuroyanagi et al. 1998;
Mizushima et al. 1998; Yan et al. 1998). There is evidence to suggest that ULK1/Atg1 is
recruited before any of the other ATG proteins and as such acts as the initiation for the
maturation of the phagophore. ULK1 is required for recruitment of VPS34 to the
phagophore (Itakura & Mizushima 2010; Koyama-Honda et al. 2013). VPS34 forms a
complex along with VPS15, Beclin-1 and ATG14 forming the mammalian PI(3)P
complex. The complex is recruited to the phagophore where it phosphorylates
phosphatidylinositols (PtdIns), thus producing PtdIns(3)P (Matsunaga et al. 2010; Fan et
al. 2011; Koyama-Honda et al. 2013; Itakura & Mizushima 2010). Phosphorylation of
PtdIns results in the stabilisation of ULK1 at the omegasome which are membrane
extensions of the ER within which some autophagosomes form (Karanasios et al. 2013;
Matsunaga et al. 2010; Biazik et al. 2015). At the same time as the ULK1 complex forms
the ATG12-ATG5-ATG16 complex also forms with the aid of the ubiquitin like
conjugation system which requires the action of ATG7 and ATG10 (Geng & Klionsky
2008). The ATG12-ATG5-ATG16 complex is required for the conjugation of LC3 to
phosphatidylethanlamine (Kabeya et al. 2000). LC3 is the mammalian homologue of the
yeast Atg8 (and C. elegans LGG-1) and is required for the expansion of the phagophore
membrane (Kabeya et al. 2000; Tanida et al. 2002; Meléndez et al. 2003; Kirisako et al.
1999). LC3-phosphatidylethanolamine is considered to play an important role in aiding the
closure of the expanding autophagosomal membrane during the formation of the
autophagosome from the phagophore (Fujita et al. 2008). Finally, ATG9 takes part in the
autophagosome formation however it is not a stable component of the membrane (Orsi et
al. 2012; Itakura & Mizushima 2010), acting as a mediator for the trafficking of
membranes from non-PAS to PAS structures similar to yeast (Orsi et al. 2012).
Many of the genes regulating the formation of the autophagosome have orthologues in C.
elegans [reviewed in (Meléndez & Levine 2009)], such as bec-1 which is the orthologue of
the yeast ATG6 and unc-51 which is the C. elegans orthologue of ATG1.In some cases
multiple orthologues for certain genes have been identified as in the case of lgg-1 and lgg-
2, both of which are orthologues of the yeast ATG8. It has been shown however, that only
lgg-1 has a role in autophagy (Meléndez et al. 2003). It is believed that general mechanism
remains the same in C. elegans with a number of the C. elegans homologues exhibiting the

Anastasios Batas 2017 Chapter 1
48
same functions in autophagy as in yeast (Meléndez et al. 2003; Matsuura et al. 1997; Tian
et al. 2009; Yang & Zhang 2011).
1.3.4 Fusion of the autophagosome and the lysosome
The newly formed autophagosome must travel to the lysosome and fuse with it to deliver
its cargo for degradation. It is believed that the mature autophagosome is characterized by
the absence of the proteins involved in the autophagy initiating machinery from the outer
membrane via Atg4 dependent deconjugation of Atg8-PE as it has been demonstrated in
yeast (Yu et al. 2012; Nair et al. 2012; Kirisako et al. 1999). After arrival of the
autophagosome, it is believed to fuse with the lysosome via the action of Rab7 in
conjunction to the HOPS tethering complex (Ganley et al. 2011).
It is probable that the recruitment of Rab7 is mediated by Rab conversion. Rab5 has
previously been associated with the initiation of autophagy under the absence of growth
factors (Dou et al. 2013). As a result Rab5 could be part of the mature phagosome
membrane. It is possible that the Rab5 could recruit the HOPS complex in the
autophagosome and under the action of the VPS39 subunit, which acts as guanine
exchange factor (GEF), activate Rab7 which will result in the replacement of Rab5 in the
membrane [(Poteryaev et al. 2010) reviewed in (Stenmark 2009)]. PI(3)P is also important
for the Rab5-Rab7 conversion and is catalysed by the action of the phosphoinositide 3 -
kinase (PI3K) VPS34 (Gillooly et al. 2000; Shin et al. 2005; Poteryaev et al. 2010).
VPS34 itself can form a complex with the UV radiation resistance-associated gene
(UVRAG). UVRAG can also bind VPS16 which is part of the HOPS complex.
Furthermore, the protein Rubicon which negatively regulates VPS34 by binding to
UVRAG, has been shown to inhibit endosomal and autophagosome fusion to lysosomes. It
is interesting that an activated Rab7 promote dissociation of Rubicon and UVRAG, which
allows the second to bind to HOPS and in turn further activate Rab7 and promote fusion of
membranes (Sun et al. 2010; Liang et al. 2008). The SNARE proteins that have been
shown to function in the fusion of the autophagosome and the lysosome are VAMP8 and
Vtib (Furuta et al. 2010), along with VAMP3 and VAMP7 (Fader et al. 2009).
Furthermore, In addition to this the Q-SNARE Syntaxin 17 has been shown to be
recruited to the autophagosome and act exclusively in autohagosome fusion as its loss only
disrupts the autophagosomal fusion and not the endosomal fusion with the lysosome.

Anastasios Batas 2017 Chapter 1
49
Further to this, it has been shown to interact with the Q-SNARE SNAP-29 and the R-
SNARE VAMP8. (Itakura et al. 2012).
After the autophagosome and the lysosome have fused, the inner membrane of the
previously independent autophagosome along with its cargo is degraded by hydrolases.
Monomeric units of the degraded macromolecules are exported to the cytosol for reuse
(Mizushima 2007).
1.3.5 Autophagy in C. elegans
The autophagic machinery appears to be implicated with endosomal trafficking (Djeddi et
al. 2012). In an early publication on the process of moulting in C. elegans, a rapid loss of
secretory membranes immediately after secretion of a new cuticle and subsequent
completion of moulting was described (Singh & Sulston 1978). Although the molecular
basis of this rapid reduction in intercellular membranes inside hypodermal seam cells is not
known, the possibility that this is by autophagy is a reasonable hypothesis.
Autophagy was previously explained in detail with regards to its molecular mechanism in
yeast and mammalian cells. However, as it is a highly conserved process amongst
organisms, understanding this process in those organisms can also aid our knowledge in
other organisms such as C. elegans. UNC-51 is the C. elegans ortholog of the yeast Atg1.
Atg1 is required for the induction of autophagy through its association with Atg13
(Kijanska et al. 2010). The unc-51 mutants are paralyzed (uncoordinated phenotype) and
exhibit developmental problems, namely a smaller body size. The smaller body size in
unc-51 mutants can be attributed to cells having a decreased size (Aladzsity et al. 2007).
They also exhibit defective formation of LGG-1, (orthologue of the mammalian LC3
protein) punctae which act as a marker of autophagy (Meléndez et al. 2003; Aladzsity et al.
2007; Sato et al. 2011). Additionally, silencing of the gene through RNAi has resulted in
animals with reduced levels of autophagy (Cheng et al. 2013). Finally it is possible, as
hypothesized in this work, that autophagy contributes to the removal of membranes from
the old cuticle as well as structures that appear during the molt, such as Golgi Bodies, but
are no longer required after its completion (Singh & Sulston 1978).

Anastasios Batas 2017 Chapter 1
50
1.3.6 Autophagy an endocytic trafficking in molting
It has been previously demonstrated that, unc-51; dpy-10 and vps-45 dpy-10 double
mutants are both synthetically lethal (Cowan, 2014). Considering DPY-10 is a secreted
collagen component of the cuticle this points to some possible link between the processes
of autophagy, endocytic trafficking and moulting. In addition to this VPS-45 defective
mutants in yeast have been shown to exhibit defects in selective autophagy accompanied
by the accumulation of clusters of autophagosomes (Chen et al. 2014). In addition to this,
Tlg2 which is stabilized by Vps45 (Bryant & James 2001), has been proposed to play a
role in the recruitment of Atg9 in the PAS in yeast (Abeliovich et al. 1999; Nair et al.
2011; Ohashi & Munro 2010).Thus possibly suggesting that components of the endocytic
pathway could be also be having an effect in moulting through autophagy.
1.3.7 Autophagy in Disease
A multitude of human diseases have been associated with autophagy. Among others these
include, cancer, neurodegenerative diseases, cardiovascular and metabolic diseases.
Autophagy has been shown to be associated with cancer, as well as the effect of potential
therapeutic approaches on the disease. In several human cancers altered expression of
autophagy proteins has been observed. For instance, ATG5 expression is up-regulated in
prostate carcinomas (Kim et al. 2011), and it has generally been shown that autophagy can
promote survival of cancer cells (Degenhardt et al. 2006). Additionally chromosomal
abnormalities in autophagy genes have often been observed in human cancers (Levine &
Kroemer 2008). Furthermore, elevated levels of autophagy have been identified in human
tumours. Autophagy levels have been shown to increase in response to chemotherapy in
mouse tumour cells (Ladoire et al. 2012).
Neurodegenerative diseases such as Alzheimer’s and Huntington’s, commonly involve
accumulation of protein aggregates. Increased aggregates are formed with increasing age.
Autophagy can remove such aberrant protein aggregates, and deregulation of the
autophagic process could be one of the contributing factors of the disease along for the

Anastasios Batas 2017 Chapter 1
51
causative mutations for the disease (Ma et al. 2010; Goedert et al. 2010). It has been shown
that in mice deficient for the autophagic process, age dependent neurodegenerative
diseases have been promoted via the increased accumulation of protein aggregates (Hara et
al. 2006).
Finally, autophagy can affect metabolism since through the process itself several
metabolites are produced such as lipids and amino acids (Rubinsztein et al. 2012).
Increased levels of autophagy under exercise further support this idea. Experiments in
mouse models have shown that increased autophagy as a result of exercise can have
protective effects against glucose intolerance (He et al. 2012).
In all cases, it is suggested that diseases can arise as a result of autophagic impairment. As
such in all of the above cases autophagy can be considered a pro survival process.
1.4 Project aims
Endocytosis and autophagy are both important cellular processes promoting the survival of
cells through homeostasis. Disruption of either of these processes can result in severe
pathologies. Both processes have been previously investigated in yeast and C. elegans. A
link between autophagy and endosomal trafficking has also been suggested in yeast via the
involvement of the COG tethering complex and Tlg2 (Yen et al. 2010). During molting in
C. elegans synthesis and secretion of the new stage specific cuticle takes place. The
cuticular components are synthesized and secreted by the hypodermal cells, at the end of
each larval stage accompanied by the synthesis peak of cuticle proteins. Synthesis of these
cuticular proteins is highly reduced during the intermoult periods (Johnstone & Barry
1996). This oscillation in the synthesis of the cuticular proteins and their secretion
coincides with the appearance of dense Golgi structures during the moult, followed by the
rapid disappearance of these Golgi after moulting is completed (Singh & Sulston 1978). As
a result, one of the aims of this project is to investigate and identify how the disruption of
endosomal trafficking and autophagy affects C. elegans in their development, with a focus
on the moulting/cuticle synthesis processes. Initially, the endosomal trafficking defective
vps-45 mutant and the autophagy defective unc-51 mutant were phenotypically
characterised and compared for moulting and developmental defects. In addition to this,
autophagy in these mutants was quantified during the moulting process and during
embryonic development.

Anastasios Batas 2017 Chapter 1
52
Mutation in vps-45 have been shown in to be a cause for severe congenital neutropenia in
humans, this in addition to data previously collected in our lab (Cowan, 2014) where yeast
carrying an analogous mutation of vps-45 exhibited high sensitivity to H2O2 led to the
investigation of the sensitivity of vps-45 and unc-51 mutants to oxidative stress.
Finally, to further elucidate the role of endosomal trafficking and more specifically vps-45
in the moulting process of C. elegans and previously isolated suppressed strain carrying the
null mutation investigated in this project was characterised phenotypically and full genome
sequencing was employed in order to identify the gene responsible for the suppression.
.

Anastasios Batas 2017 Chapter 2
53
Chapter 2: Materials and Methods
Unless stated otherwise, all chemicals and reagents used in this study were
purchased from BioRad Laboratories Ltd. (Hemel Hempstead, UK), Fisher
Scientific Ltd. (Loughborough, UK), Invitrogen Ltd. (Paisley, UK), Melford
Laboratories Ltd. (Suffolk, UK), Qiagen Ltd. (Crawley, UK), Roche Diagnostics
Ltd. (Burgess Hill, UK), Sigma-Aldrich Ltd. (Poole, UK) and VWR Prolabo
(Lutterworth, UK).
Enzymes and reagents used for molecular biology were purchased from New
England Biolabs Ltd. (Hitchin, UK), Promega Ltd. (Southampton, UK), Roche
Diagnostics Ltd. (Burgess Hill, UK), and Yorkshire Bioscience Ltd. (York, UK).
Bacterial [Escherichia coli (E.coli)], and nematode [C. elegans] growth media
components were purchased from ForMedium™ (Norfolk, UK) and Melford
Laboratories Ltd. (Suffolk, UK).
2.1 Solutions and media
Ampicillin sodium salt: 100 mg/ml in dH2O Stock solution. 100μg/ml working
solution.
BO3 buffer (Borate buffer) (40x): 618 mg H3BO3, 5 ml 1m NaOH, ddH2O to 10
ml. Adjust pH to 9.2.
Bleach solution: NaOCl 12ml, 5M KOH 5ml, dH2O to 100ml
C. elegans Freezing solution: S-Basal + 30% Glycerol(v/v)
IPTG: 1M stock in sterile H2O. Stored at -20°C
LB agar: 10g bacto-tryptone, 5 g bacto-yeast extract, 5 g NaCI and 15 g agar in 1
L of dH2O, pH adjusted to 7.5 by the addition of HCl and/or NaOH,.and
autoclaved. If required, antibiotics were added to the cooled medium before
aseptically pouring onto 9 cm plates. Unused plates were stored at 4°C for short
periods.

Anastasios Batas 2017 Chapter 2
54
LB (L-broth): 10g bacto-tryptone, 5 g bacto-yeast extract, 5 g NaCI, dH20 to 1 L.
pH adjusted to 7.0 with NaOH. Sterilised by autoclaving (121°C at 15 psi for 15
minutes).
Microscopy Mounting solution: For 100 ml of solution, 50 μl glycerol, 10 μl
DABCO and 40 μl 1 x PBS were mixed by vortex. Made fresh before use.
M9 buffer (10x) : 30 g KH2PO4, 60 g Na2HPO4, 50 g NaCI, 1 ml 1 M MgSO4 in
1 L dH2O. Mixed and autoclaved.Nematode growth medium (NGM) agar: 0.3%
NaCI, 0.25% of Bacto-peptone, 1.7% agar, 0.0005% cholesterol (1 ml of 5 mg/ml
stock in EtOH), in dH2O. Autoclaved and, after the medium cooled, the following
solutions were added using sterile technique: 400μl of 1M CaCl2, 400μl of 1 M
MgSO4 and 10 mL of 1 M potassium phosphate pH 6.0, prior to pouring petri
plates.
Phosphate buffered saline (PBS): 800 g NaCl, 20 g KCl, 144 g Na2HPO4 · 2H2O, 24 g
KH2PO4, 8L of dH2O, pH 7.4
PBST: 1x PBS and 0.2% Tween-20.
Potassium phosphate buffer (1M, pH 6): obtained by mixing 13.2 ml of 1 M
KH2PO4 and 86.8 ml of 1M K2HPO4 to reach pH 6.0 in a 100ml solution.
Ponceau S solution: (0.1% (w/v) Ponceau S, 5% (v/v) acetic acid)
RFB (Ruvkun Finney Buffer) (2x): 1.6 ml 1M KCl, 80μl 5M NaCl, 0.4ml 0.5M
EGTA, 0.6 ml 0.5M PIPES (pH 7.4), 0.1 ml spermidine, 5ml Methanol, 2.22 ml
ddH2O
Streptomycin sulfate salt: 12.5 mg/ml in dH2O 12.5 µg/ml
S-Basal buffer: 0.1M NaCl, Potassium Phosphate pH 6.0 0.05M, Cholesterol
5μg/ml
Single worm lysis buffer (SWLB): 50 mM Tris-HCl pH 8.0, 100 mM NaCl, 50
mM EDTA, 1% SDS, 30 mM , 100 μg/ml proteinase K. Buffer was freshly made
just before use.
Streptomycin sulfate: salt 12.5 mg/ml in dH2O 12.5 µg/ml stock solution, 12.5 µg/ml
working solution.

Anastasios Batas 2017 Chapter 2
55
TTB (Tris-Triton Buffer): 1 ml 1M Tris HCl, p H7.4, 100 μl Triton-X-100, 20 μl 0.5M
EDTA, ddH2O to 10 ml
TE buffer: 10 mM Tris and 1mM EOTA in dH2O. pH7.5.
10 x Tris borate buffer (TBE): 465.2 g TRIS base and 205.2 g boric acid dissolved
in 4 L of dH2O by stirring. Then 14.88 g of EDTA added and mixed. The working
solution was 1x TBE.
2.2 Other Materials
2.2.1 Electrophoresis Markers
DNA markers:
NEB (New England BioLabs) 100bp DNA Ladder, 500μg/ml (Lot: 1081504)
BIO-RAD EZ Load 1 kb Molecular Ruler, 500 μl, 0.08 μg/μl, #1708355
Protein markers:
BIO-RAD Precision Plus Protein Standards # 161-0373
Antibodies:
Primary antibodies
anti-DPY-7 Mouse monoclonal antibody 1:100 in PBST (McMahon et al., 2003)
GFP Antibody (FL) rabbit polyclonal IgG 1:200 in PBST Santa Cruz
Biotechnologies (sc-8334)
Anastasios Batas 2017 Chapter 2
56
Secondary antibodies
Donkey anti rabbit 800 1:10 000 in LI-COR blocking buffer 1:1 PBST infrared
dye-labelled secondary antibodies against rabbit IgG from donkey LICOR
Biosciences (926-32213) used for western blotting.
Alexa Fluor Fluorophore conjugated whole IgG from goat 1:200 Invitrogen Ltd.
488 anti-rabbit used for immunolocalisation.
2.3 Methods
2.3.1 E. coli OP50 bacteria culturing
LB agar with streptomycin (12.4 mg/ml) was used for streaking of isolated
colonies of E. coli OP50 bacteria (Uracil auxotroph). A single OP50 colony each
time was used to inoculate 50 ml batches of liquid medium containing 1g LB, and
H2O up to 50 ml. 50 μl of streptomycin (stock: 12.4 mg/ml) was also added to the
liquid media prior to inoculation. Sigma LB broth was made in batches of 50 ml
(1 g LB in 50ml of LB). Inoculated medium was left overnight in room
temperature to grow and was then subsequently stored at 4°C for up to two
months (Stiernagle 2006).
2.3.2 Nematode culture in solid media
Nematodes were grown on solid Nematode growth medium (NGM). 400 ml volumes of
NGM were made containing 1.2 g NaCl, 6.8 g agar, 1 g peptone, 0.4 ml cholesterol
(stocks: 5 mg/ml in EtOH), and H2O to 390 ml. To this, 0.4ml 1M CaCl2, 0.4 ml 1M
MgSO4, and 10 ml 1M potassium phosphate (pH 6.0) were added into the medium before
pouring the plates. 200 μl of OP50 inoculated LB broth were spread on each NGM agar
plates. Plates were left overnight in room temperature to produce a thin lawn of OP50. On
occasions where synchronous cultures were needed the bacteria were spread using a glass
spreader under sterile conditions for the medium (5.5 cm diameter) and large petri dishes
(9cm diameter). A drop of 200μl liquid culture OP50 was added to large petri dishes (9cm)
and 50μl added to the medium (5.5cm) petri dishes in all other occasions. 15μl of OP50

Anastasios Batas 2017 Chapter 2
57
liquid culture was added in the small (3cm diameter) petri dishes in all cases (Stiernagle
2006).
2.3.3 Nematode Handling
Individual animals were manipulated with a worm pick, which consists of a piece
of platinum wire with a flattened, arrow-shaped end, sealed into a broken Pasteur
pipette. The platinum wire cools quickly when flamed, allowing sterilisation of
the pick on a Bunsen burner between worm transfers. For handling, large amounts
of animals, agar chunks were cut out from old NGM cultures and transfer onto
fresh, seeded plates with the aid of a sterilised scalpel. N2 Bristol and most other
strains were maintained in a 20°C incubator (Stiernagle 2006). Temperature
sensitive mutants were also placed at 15°C or 25°C according to their
characteristics and the aims of the study. Strains carrying the vps-45 (tm246)
allele in particular had to be regularly tested for lethality at 25°C since it was
proven that it was very easily supressed after a long culturing.
C. elegans strains used in
the experiments
Description
N2 C. elegans wild isolate (Bristol)
CB4856 C. elegans wild isolate (Hawaiian)
IA757 vps-45 (tm246)
IA773 svp (ij117) -suppressor of vps-45 (tm246)
TP198 kaIs6 [pADW0083 (pdi-2prom::roGFP-ER3::phy-1
unc-119(+))]
CB369 unc-51 (e369)
LD1171 ldIs3 [gcs-1p::GFP rol-6(su1006)]
CF1553 muIs84 [(pAD76) sod-3p::GFP rol-6(su1006)]
CL2166 dvIs19 [(pAF15)gst-4p::GFP::NLS] III

Anastasios Batas 2017 Chapter 2
58
DA2123 adIs2122 [lgg-1p::GFP::lgg-1 rol-6(su1006)]
SU93 jcIs1 [ajm-1::GFP unc-29(+) rol-6(su1006)] IV
IA880 kaIs6 [pADW0083 (pdi-2prom::roGFP-ER3::phy-1
unc-119(+))];unc-51 (e369) V
IA881 kaIs6 [pADW0083 (pdi-2prom::roGFP-ER3::phy-1
unc-119(+))];vps-45 (tm246) X
IA882 vps-45 (tm246) in Hawaiian background (back cross
with CB4856)
IA887 muIs84 [(pAD76) sod-3p::GFP rol-6(su1006)]; vps-45
(tm246) X
IA888 adIs2122 [lgg-1p::GFP::lgg-1 rol-6(su1006)]; vps-45
(tm246) X
IA889 ldIs3 [gcs-1p::GFP rol-6(su1006)]; vps-45 (tm246) X
IA890 dvIs19 [(pAF15) gst-4p::GFP::NLS] III; vps-45
(tm246) X
IA896 muIs84 [(pAD76) sod-3p::GFP rol-6(su1006)]; unc-51
(e369) V
IA897 adIs2122 [lgg-1p::GFP::lgg-1 rol-6(su1006)]; unc-51
(e369) V
IA898 ldIs3 [gcs-1p::GFP rol-6(su1006)]; unc-51 (e369) V
IA899 dvIs19 [(pAF15) gst-4p::GFP::NLS] III; unc-51 (e369)
V
IA900 unc-51(e369)/unc-51 (e369) V; vps-45(tm246)/+
IA903 adIs2122 [lgg-1p::GFP::lgg-1 rol-6(su1006)]; jcIs1
[ajm-1::GFP unc-29(+) rol-6(su1006)] IV
Table 2.1: List of C. elegans strains used in this study

Anastasios Batas 2017 Chapter 2
59
2.3.4 Freezing and thawing nematode stocks
The wild-type and mutant strains can be stored indefinitely in liquid nitrogen (-
196°C). Two large (9cm) petri dishes of the desired strain for storing were left to
grow close to starvation with the purpose of having populations mainly
constituted by L1 larvae. At this stage nematodes are most likely to survive the
freezing. Each plate was then washed with 3 ml of M9 buffer to make three or
four 0.5 ml aliquots to which an equal volume of freezing solution was added.
Tubes were mixed and immediately placed in a polystyrene box at -70°C. After at
least a day, one tube was thawed and plated as a tester and the remainder of the
tubes were passed to two different liquid nitrogen tanks (Stiernagle 2006).
2.3.5 Decontamination of C. elegans stocks
Contamination of cultures by fungi, yeast, or undesirable bacteria happened
occasionally. This problem could be rectified by transferring individual C. elegans
onto a fresh plate, at which point they were allowed to move before repeating the
operation at least one more time. Yeast and bacteria could also be removed by
treatment with alkaline hypochlorite solution, as eggs are resistant to bleach. C.
elegans treated with bleach solution and subjected to vortexing are fragmented
and eggs are harvested (section 2.3.5.1) (Stiernagle 2006).
2.3.6 Nematode synchronous cultures
2.3.6.1 Harvesting nematode eggs
Nematodes were washed off NGM plates using S-Basal buffer (into a 15ml tube).
C. elegans were left to form a pellet in the tube for 5 minutes on the bench. The

Anastasios Batas 2017 Chapter 2
60
excess buffer was removed. Bleach solution was added to about 20x the volume
of the worm pellet. Samples were vortexed several times during 5-minute
incubation. They were checked under the microscope for release of eggs and
fragmentation of adult bodies. If the nematodes did not fragment and mostly
dissolve, the amount of alkaline hypochlorite solution was doubled, and
incubation time was doubled for another 3 minutes. Samples were centrifuged at
1000xg for 5 minutes, to pellet eggs. Bleach solution was removed. Eggs were
washed 3 times with centrifugation using S-basal buffer (Stiernagle 2006).
2.3.6.2 Synchronous cultures in liquid media
Embryos were transferred in a sterile 2L flask containing 60 ml of S-basal buffer
plus MgSO4 and CaCl2. The low volume of buffer was used in order to achieve a
high surface to volume ratio so that animals would get enough oxygen. Embryos
hatching would arrest at the L1 stage (Kaplan & Baugh 2016). After 24 hours all
of the larvae were in sync for the wild type strain. For the vps-45 (tm246)/IA757
and unc-51 (e369)/CB369 mutants larvae were in sync after 48 hours (Stiernagle
2006).
2.3.6.3 Synchronous cultures in solid media
NGM plates with 100μl of OP50 bacteria evenly spread across the surface of the
agar were used. The desired number of L1 arrested larvae were added onto each
plate. When cultured this way, wild type C. elegans remained in synchrony
throughout their development to adulthood.
2.3.7 Observation of nematodes during the molt
Synchronised L1 larvae in liquid cultures were obtained and were seeded on
NGM plates with an evenly spread lawn of OP50 bacteria, as previously described
in material methods (section 2.3.6). All mutants were cultured in the NGM petri
dishes until they entered lethargus at which point they started moulting. At this
stage they were accounted for or they were transferred on slides to be observed

Anastasios Batas 2017 Chapter 2
61
under the high magnification microscope (section 2.3.8). Cultures were observed,
and images were acquired at several points during the moult, from the onset of
lethargus until ecdysis (end of moult) depending on the aim of the experiment.
2.3.8 C. elegans crosses
5-10 L4 or young adult males and 1 L4 or young adult hermaphrodite were placed
on a NGM plate for each mating. A ratio of approximately 50% males to
hermaphrodites at the F1 generation suggested that that the cross was successful.
Animals from the parental generation were transferred from their original plate to
a fresh plate after 24-48 hours of egg laying depending on the needs of the
experiment. When accurate counting of progeny was needed transfer of the
parents was repeated one more time. This way the entire brood of one adult could
be followed and counted if necessary. Thus, numbers of F1 progeny were more
easily scored for each cross. Animals were counted separately for each plate of
each cross and were then summed up. For each successful cross single F1
hermaphrodites were picked and transferred to new plates and were left to self-
reproduce. Depending on the aim of the experiment the animals from the F2
generation were either further crossed or transferred to new plates in order to
produce the F3 generation. All proceeding generations were monitored for the
desired phenotype (Fay 2013). All procedures were done near the bunsen flame to
maintain sterile conditions. In cases were genotyping was required at any of the
crossing stages, C. elegans were lysed for DNA for PCR analysis, as described
below.
2.3.9 Routine microscopy
C. elegans on NGM plates were visualised with Zeiss stereo dissecting microscopes. The
handling of transgenic animals expressing GFP was carried out with a Stemi SV-6 Zeiss
microscope with fluorescence attachment. For closer examination of nematodes, specimens
were collected and placed on 2% agarose pads on standard glass microscope slide. They
were prepared with, 10 ml of 2% Agar, containing 0.2% sodium-azide. Sodium azide was

Anastasios Batas 2017 Chapter 2
62
used to anesthetize the animals and stop them from moving. Agar was heated, to molten,
then 30 μl was added to the centre of a microscope slide and a second slide placed on top
to create a “sandwich” of agar which was allowed to set. Slides were separated so the agar
pad was on one of the two slide. C. elegans were transferred onto the agar pad and a 5 μl
drop of S-Basal (0.1M NaCl, 0.05M potassium phosphate buffer (pH 6.0), 1ml/ L
cholesterol) was added to prevent nematodes from drying. A cover slip was placed and the
animals were observed using an Axioskop 2 microscope (Carl Zeiss, Jena, Germany)
equipped with Normaski optics at 10X, 63X and 100 magnification with a 0.63X or 1X
reducing lens depending on the requirements of the experiment. The camera used was a
Hamatsu Orca C4742-95 digital camera (Hamatsu Photonic, Hamatsu City, Japan).
Openlab 4.0.2 software (Improvision, Coventry, United Kingdom) was used to capture
pictures of the srains. Images were processed using the ImageJ software
(https://imagej.nih.gov/ij/).
2.3.10 Quantification of whole body C. elegans fluorescence
Images from the microscope were manipulated using ImageJ software (Schneider
et al. 2012). The worm was outlined on the picture of interest using any of the
drawing/selection tools (i.e. rectangle, circle, polygon or freeform). AREA,
INTEGRATED DENSITY and MEAN GRAY VALUE were selected to be
measured for each image. “Measure” was selected from the analyse menu. A
different region was selected on the same image next or close to the C. elegans
that had no fluoresce. This was the background measurement. The steps were
repeated for all pictures and the corrected total worm fluorescence (CTCF) was
calculated using the following formula
CTCF = Integrated Density – (Area of selected worm X Mean fluorescence of
background readings) (McCloy et al. 2014)
The value obtained was divided by the total selection area to correct for the difference in
size between individual animals.

Anastasios Batas 2017 Chapter 2
63
2.3.11 C. elegans lysis and genomic DNA extraction
The same method was used for single C. elegans genomic lysates as well as preps
which required a larger number of animals. In the first instance, a single worm
was picked from each plate and was placed in a sterile 0.5 ml tube with 12.5 μl
single worm lysis buffer. Samples were incubated at -70°C for 10 minutes to
freeze-fracture. They were then removed and put for 1 hour at 60°C for lysis,
followed by 15 minutes at 95°C for proteinase K inactivation. Samples were
stored at -20°C as DNA for PCR.
For lysates from multiple animals, C. elegans were washed off plates in sterile
H2O and were transferred to a sterile 1.5 ml tube. They were left to sediment for 5
minutes or until an obvious worm pellet could be formed. Most of the supernatant
was removed using a pipette without disturbing the pellet. 1 ml of H2O was added
at this stage to wash the nematodes. C. elegans were left again to sediment for 5
minutes and the supernatant was removed. Single worm lysis buffer was added at
approximately five times the volume of the C. elegans pellet. Same incubation
times and temperatures as described above. EDTA was added to the sample to 10
mM final concentration to preserve DNA for multiple uses. Lysis was carried out
at the same temperatures as described above. Samples were then diluted 4-fold in
TE and were frozen at -20°C as DNA for PCR.
2.3.12 C. elegans lysis and genomic DNA extraction for full genome sequencing
The DNeasy Blood and Tissue kit from Qiagen (Cat No. 69504) was used to
extract pure genomic DNA for full genome sequencing. A modified protocol of
the kit was used. Nematodes were washed of their plates and were gathered in
1.5ml Eppendorf tubes, until a C. elegans pellet of 100μl was collected. 180μl of
buffer ATL were added with 20μl of proteinase K provided by the kit. The kit
protocol was followed from step 2 onward. After purification samples were
treated with 2.5μl RNAse 30mg/ml + TRIS pH 7.5 mixed at a ratio of 1:4.
Samples were incubated for 30 minutes at 37°C. All samples were passed through
the column a second time to remove the enzyme.

Anastasios Batas 2017 Chapter 2
64
2.3.13 Quantitation of DNA
The following methods were used to estimate the concentration of DNA in
samples. For approximate estimations, a percentage of the sample was
electrophoresed in an agarose gel with size standards at known concentrations. A
comparison of fluorescent intensity after ethidium bromide staining permitted an
estimation of the DNA concentration of the sample. For accurate quantifications,
the Nanodrop system was employed.
2.3.14 Preparation of samples for full genome sequencing
Pure DNA was isolated from all the required lines as described on section 2.3.10.
DNA was quantified as on section 2.3.11. Samples were mixed in equal amounts
based on that in one master mix and were sent for sequencing. About 100 ng of
DNA were required for the sequencing procedure. Sequencing was carried out
using the illumina technology.
2.3.15 Restriction endonuclease digestion of DNA fragments
DNA digestion reactions were prepared in 200μl Eppendorf tubes and in a total
volume of 10 μl. These were routinely incubated for 2-4 hours or overnight at
37°C depending on the activity of the enzyme. DNA fragments were analysed by
agarose gel electrophoresis (refer to section 2.3.15). An example of all the
components included in a standard single restriction endonuclease digest is shown
in table 2.2.
Component Volume (μl)
DNA sample 5
10X Buffer 1
dH2O 3
Anastasios Batas 2017 Chapter 2
65
Table 2.2: Components of general mix used for digestion of DNA
2.3.16 Polymerase chain reaction (PCR)
2.3.16.1 Design of primers for PCR
Primers for PCR were designed using the Vector NTI software (ThermoFisher
scientific). A collection of the primers used in this study is shown on table 2.2
General characteristics of the desired primers were 15-22 nucleotides in length,
and a melting temperature of 55°C-65°C, as well as GC content of 40%-60%.
Oligonucleotide primer pairs were designed to amplify desired DNA sequences by
PCR. All primers used in this study are listed in Table 2-. Primers were
synthesised by Yorkshire Bioscience Ltd. and were routinely diluted to 50
picomoles (pmol) in TE buffer prior to storage at -20°C. The PCR reaction mix
was typically made up to a total volume of 20 μl in a 0.2 ml thin-walled PCR tube.
Taq DNA polymerase combined with its buffer was used. All PCR products were
analysed by agarose gel electrophoresis (described in section). Where required
the PCR products were digested with the appropriate enzyme. An example of a
standard PCR mix used in this study is shown in Table 2.3. In the case of the vps-
45 (tm246) primers a 50μl mix was prepared as shown on table 2.4.
Restriction enzyme 1
Final volume 10
Primer name Primer Sequence (5'-3')
vps-45 TM246 sense 2 ATAGGGACAGAAGGACCGC
vps-45 TM246 anti sense 2 AAGCTGCGAAACACTCTCTA
vps-45 WT sense GAGCCAAGATTCAGCCAGT
roGFP forward GTGCGTGGAGAGGGAGAGGG
roGFP reverse TGTAGAGTTCATCCATTCCG
unc-51 Forward AGGTCCCGTTTGCTG TAC TC

Anastasios Batas 2017 Chapter 2
66
unc-51 Reverse TCGTGACTTGACTTTTCGCCT
Chromosome ID Forward ATCATTCTCCAGGCCACGTTAC
Chromosome ID Reverse CTGAACTAGTCGAACAAACCCC
Chromosome IVE Forward ACGAAAAATCACAGAGCGGG
Chromosome IVE Reverse AATCAACAACGGACGACGAG
Chromosome IIA Forward CGGAGATAGTCTCGTGGTACTG
Chromosome IIA Reverse CAGTCATGCTCCAAACATTCTC
Chromosome IIB Forward TCCATCTTCGCAATCAGATTTC
Chromosome IIB Reverse AACGTACTGCTTCCCATGCTC
Chromosome IIC Forward TCATCTGTCGAGTGCTTTTG
Chromosome IIC Reverse CGATCGCTCAAATGGTTG
Chromosome IID Forward TTCTCACAACTTCTTTTCCAAG
Chromosome IID Reverse TTCACTATTTCCCTCGCTGG
Chromosome IIE Forward TAGGAAAGTTGTGTCCACCTGG
Chromosome IIE Reverse TGATGACTCCTTCTTCAGCTGC
Chromosome IIF Forward GATTCGGAATGGGTGTTG
Chromosome IIF Reverse TCTTGAATGCGTGGTGTG
Chromosome VA Forward TGTAGGGCGAGTAACCAAGC
Chromosome VA Reverse CCGCACTTCCTTCAGAAATG
Chromosome VB Forward ATTGATCCCATGATCTCGG
Chromosome VB Reverse AATCGCTACTTCCGATAACTTC
Chromosome VC Forward ATCAATCACATGATGCCGT
Chromosome VC Reverse TTTCAGCTAGACCTCCCATG
Chromosome VD Forward GGCGGAAAGCAATTTCTATC
Chromosome VD Reverse AGCTGCAACCAACACTGCTC
Chromosome VE Forward GCTTTGGAGACATTGAGCCGTG

Anastasios Batas 2017 Chapter 2
67
Table 2.3: List of the primers used in this study for the detection of mutant alleles and
Hawaiian and Bristol SNPs.
2.3.16.2 Detection of TM246 null vps-45 (tm246) mutant and wild type vps-45
alleles
For the detection of the vps-45 (tm246) allele a 50μl reaction was prepared as
shown on table unlike the standard reactions of the other primers (Table 2.4). The
vps-45 (tm246) mutant allele carries a 1178bp deletion compared to the wild type
vps-45 allele. Vps-45 WT sense primer along with the vps-45 (tm246) anti sense
2 primer produce an amplified 629bp fragment of WT DNA. On the other hand,
vps-45 (tm246) sense 2 primer along with vps-45 (tm246) anti sense 2 produces a
480bp fragment of the mutant allele. There is no amplification of a mutant allele
when the Vps-45 WT sense primer along with the vps-45 (tm246) anti sense 2
primer for a wild type strain, nor is there amplification of the wild type allele
when vps-45 (tm246) sense 2 primer along with vps-45 (tm246) anti sense 2 are
combined for a IA757 strain.
The PCR routine used, was as follows:
• 1 cycle of initial denaturation at 94°C for 3 minutes.
• 35 cycles of denaturation at 94°C for 30 seconds, annealing at 50°C for 30
seconds, extension at 72°C for 2 minutes.
• 1 cycle of final annealing at 50°C for 2 minutes.
• 1 cycle of final extension at 72°C for 4 minutes
Chromosome VE Reverse ATGCTCTTCACATTTTCCTGG

Anastasios Batas 2017 Chapter 2
68
Table 2.4: Components of general mix used for PCR amplification using two primers.
Component Volume (μl)
DNA lysate 1
dNTPs (2 mM) 2
10x Taq buffer 2
MgSO4 (25 mM) 1
Forward primer 1
Reverse primer 1
Taq polymerase 0.5
dΗ2Ο 14.5

Anastasios Batas 2017 Chapter 2
69
Table 2.5: Components of the mix used for PCR amplification of the vps-45 allele and the
mutant vps-45 (tm246) allele, using two forward and one reverse primers in a single reaction.
2.3.16.3 Detection of the unc-51 (e369) allele
The unc-51 (e369) allele has a single point mutation at the 5 untranslated region
(UTR) of the unc-51 gene (Ogura et al. 1994). The CAG to TAG substitution
changes the cut site of the restriction enzyme PvuII. Thus, the enzyme can no
longer cut the mutated region allowing for identification of the mutant allele
through digestion of the amplified PCR fragment. A standard PCR mix was used
to amplify the region. Enzyme digestion was carried out as described on 2.3.15.
As such the wild type allele, would produce two band (330bp, 51bp) and the
mutated allele a single band (851bp), (Table 2.8).
Component Volume (μl)
DNA lysate 5
dNTPs (2 mM) 5
10x Taq buffer 5
MgSO4 (25 mM) 2.5
Vps-45 WT sense (20μΜ) 2.5
vps-45 (tm246) sense 2 primer (20μΜ) 2.5
Vps-45 (tm246) anti-sense primer (20μΜ) 2.5
Taq polymerase 0.5
dΗ2Ο 24.5

Anastasios Batas 2017 Chapter 2
70
The PCR routine used, was as follows:
• 1 cycle of initial denaturation at 94°C for 2 minutes.
• 35 cycles of denaturation at 94°C for 20 seconds, annealing at 58°C for 30
seconds, extension at 72°C for 40 seconds.
• 1 cycle of final extension at 72°C for 5 minutes.
•
2.3.16.4 Detection of Bristol N2 or Hawaiian CB4856 genome
A combination of PCR amplification and enzyme digestions was also employed in
order to identify the presence of Hawaiian or Bristol DNA utilising the SNP
which would create or erase restriction endonuclease cut sites (Bazan & Hillers
2011). The primers along with the enzymes used to detect between Hawaiian and
Bristol DNA across chromosomes I, II, IV and V of the C. elegans genome are
shown on table. A standard PCR reaction mix was used as described on section
2.3.14. After amplification, each sample was digested with the appropriate
restriction enzyme as shown on tables 2.5, 2.6, 2.7.
• 1 cycle of initial denaturation at 94°C for 2 minutes.
• 35 cycles of denaturation at 94°C for 20 seconds, annealing at 60°C for 30
seconds, extension at 72°C for 40 minutes.
• 1 cycle of final extension at 72°C for 10 minutes.

Anastasios Batas 2017 Chapter 2
71
Table 2.6: Primers used for the distinction of Hawaiian and Bristol sequences in C. elegans on Chromosomes I and IV. The enzymes in each can
recognise a specific base sequence on the DNA. The number of restriction sites available changes depending on SNP of the Hawaiian and the Bristol DNA. The restriction
fragments generated in each genome are indicated and are in bp.
Chromosome I, IV
primers
SNP
Cosmid
Map position Primer sequence (5'-3') Restriction enzyme
N2 restriction
fragments CB4856 restriction fragments
ID
T07D10 13.6 F:ATCATTCTCCAGGCCACGT
TAC Ndel 594 300,294
R:CTGAACTAGTCGAACAAA
CCCC
IVE
D2096 3.8 F:ACGAAAAATCACAGAGCG
GG EcoRI 648,326 852
R:AATCAACAACGGACGACG
AG

Anastasios Batas 2017 Chapter 2
72
Table 2.7: Primers used for the distinction of Hawaiian and Bristol sequences in C. elegans on several regions of Chromosome II. The enzymes in each can
recognise a specific base sequence on the DNA. The number of restriction sites available changes depending on SNP of the Hawaiian and the Bristol DNA. The restriction
fragments generated in each genome are indicated and are in bp.
Chromosome II primers
SNP Cosmid Map position Primer sequence (5'-3') Restriction enzyme
N2 restrictions
fragments
CB4856 restriction
fragments
IIA T25D3 -17.9 F:CGGAGATAGTCTCGTGGTACTG Dral 336, 93 288, 93, 48
R:CAGTCATGCTCCAAACATTCTC
IIB R52 -14.5 F:TCCATCTTCGCAATCAGATTTC Alul 368 203, 165
R:AACGTACTGCTTCCCATGCTC
IIC M03A1 -4 F:TCATCTGTCGAGTGCTTTTG Taql 291,81,80 210, 81, 80, 70
R:CGATCGCTCAAATGGTTG
IID F37HB 3.3 F:TTCTCACAACTTCTTTTCCAAG Taql 572, 112, 15 382, 190, 112, 15
R:TTCACTATTTCCCTCGCTGG
IIE Y38F1 13.6 F:TAGGAAAGTTGTGTCCACCTGG HinfI 449 288, 160
R:TGATGACTCCTTCTTCAGCTGC
IIF Y51HI 20.9 F:GATTCGGAATGGGTGTTG Taql 482 340, 142
R:TCTTGAATGCGTGGTGTG

Anastasios Batas 2017 Chapter 2
73
Table 2.8: Primers used for the distinction of Hawaiian and Bristol sequences in C. elegans on several regions of Chromosome V. The enzymes in each can
recognise a specific base sequence on the DNA. The number of restriction sites available changes depending on SNP of the Hawaiian and the Bristol DNA. The restriction
fragments generated in each genome are indicated and are in bp
Chromosome V primers
SNP Cosmid Map position Primer sequence (5'-3') Restriction enzyme N2 restrictions fragments CB4856 restriction fragments
VA Y38C9B -20.0 F:TGTAGGGCGAGTAACCAAGC BamHI 318 268,50
R:CCGCACTTCCTTCAGAAATG
VB H10D18 -7.9 F:ATTGATCCCATGATCTCGG SspI 436 263,173
R:AATCGCTACTTCCGATAACTTC
VC F57F5 3.6 F:ATCAATCACATGATGCCGT Hpy188III 578 326,252
R:TTTCAGCTAGACCTCCCATG
VD F57G8 10.0 F:GGCGGAAAGCAATTTCTATC DraI 528 272,256
R:AGCTGCAACCAACACTGCTC
VE F48F5.2 25.0 F:GCTTTGGAGACATTGAGCCGTG Hpy188III 439 258,181
R:ATGCTCTTCACATTTTCCTGG

Anastasios Batas 2017 Chapter 2
74
2.3.17 DNA Gel electrophoresis
Agarose gel of 1-2% w/v were prepared in 1x TBE. Approximately 100 ml of 1-
2% agarose gel were cast into the gel tank with 5 μl Ethidium Bromide. The gel
was left to solidify. A 1kb or 100bp ladder from NEB or BIO-RAD was used
depending on the desired DNA fragments in each case. 10 μl of ladder (premixed
with 6x loading dye) were added to the first well. The appropriate amount of
loading dye was added to each sample for a final dilution of 1/6. 10 μl from each
reaction were then loaded on to the gel. Gels were run for approximately 45
minutes at 100V. Gels were viewed using the Chemidoc XRS System (Bio Rad)
and were captured using a camera attached to it.
2.3.18 Detecting the ER redox state of nematodes using a 96-well plate reader
The PHERASTAR FS 96-well plate reader (BMG Labtech) was used to read the
fluorescence of the transgenic strains. Approximately, 1000 larvae synchronised
at the L4 stage on petri dishes. Animals were washed off NGM plates into a
sterile 15ml tube. C. elegans were washed twice using S-basal. C. elegans were
then prepared in a volume of 100 μl and added onto the 96-wel plate. The plate
was used using the plate reader with the settings as shown on table 2.8. The plate
reader would excite the protein at 390nm and 460nm and receive emission spectra
at 520nm. If a higher emission was obtained from the excitation of 390nm the
protein was in an oxidised state, whereas if the emission from the 460nm
excitation then more protein would be in the reduced state. For each strain
carrying the roGFP ER3 marker, its equivalent parental non-fluorescent one was
used as a blank control to subtract background fluorescence, using the Pherastar
software (BMG Labtech). In the case of unc-51 (e369) mutant which could not
retain synchrony when cultured from L1 arrest, the same procedure as above was
followed, with the only difference being that a mixture of animals was obtained,
the vast majority of which were at the L3 and L4 stages. Animals were cultured at
15°C throughout.
For comparisons at 25°C, synchronous L1 larvae were cultured at 15°C until they
reached the L4 stage and were then shifted to 25°C for a further 12 hours culture
prior to loading on the 96-well plate for the reading on the plate reader.

Anastasios Batas 2017 Chapter 2
75
Table 2.9: Settings used by the plate reader for the detection of the redox state of the roGFP
marker in nematodes
Well scan settings
No. of flashes per scan point: 50
Scan mode: matrix scan
Scan matrix dimension: 5 × 5
Scan width [mm]: 5
Optic settings
No.
Optic
module Excitation Emission Gain
1 FI 390 520 390 520 1200
2 FI 460 520 460 520 1200
Optic settings
Focal height [mm]: 4,2
General settings
Bottom optic used
Settling time [s]: 0,2
Reading direction:
bidirectional, vertical left to right, top to
bottom
Target temperature [°C]: monitoring
Anastasios Batas 2017 Chapter 2
76
2.3.19 Scoring C. elegans adult lifespan
C. elegans were cultured to adulthood in asynchronous cultures. 50 young adult
were picked from each strain, before producing any eggs, and were transferred for
each strain to a new plate. The plate was then put to the appropriate temperature
for culturing (15°C or 25°C). The number of alive animals was counted every 24
hours until the number of alive C. elegans reached zero.
2.3.20 Scoring C. elegans viability under oxidative stress
Oxidative stress was induced using Hydrogen peroxide (H2O2). M9/ H2O2-
containing solution was prepared, with a final concentration H2O2 ranging from 0-
1mM. For this protocol. 40μl of buffer was added to each well of a 96-well plate.
5-8 nematodes were transferred to each well and viability was scored hourly. For
each sample, a total of 12 wells was used. For each condition the experiment was
repeated three times (Possik & Pause 2015).
2.3.21 Quantifying GFP expression under oxidative stress
Oxidative stress was by preparing a hydrogen peroxide solution as described on
3.8.2. Larvae were synchronised as described on 2.3.6. Approximately 100
Synchronised L1 larvae were transferred to NGM plates seeded with OP50. They
were cultured until they REACHED the L4/early adult stage. C. elegans were
washed off the plate with M9 buffer into an Eppendorf tube. All samples were
washed 3 times in M9 buffer. Each sample was made up in 100μl of M9 buffer +
1mM H2O2 and transferred to a 24-well plate. An equivalent negative control for
each sample was include were nematodes would remain in M9 buffer without the
addition of H2O2.
C. elegans were left in the solution for 1 hour. Worm from each well were
transferred to an 15ml Eppendorf tube, washed twice with M9 buffer. Sodium
azide was added at a final concentration of 10mM. 30μl of each sample were

Anastasios Batas 2017 Chapter 2
77
placed on a microscope slide. A cover slip was place on the sample and the
nematodes were observed under the microscope as described on section 2.3.7.
2.3.22 RNAi of C. elegans by bacterial feeding method
Single colony of the HT115 bacteria expressing the vector with the desired gene
was picked from the plates and a 10ml L-broth with 100 μg/ml Ampicillin was
inoculated. Cultures were grown overnight at 37°C with shaking. L-agar plates
containing 100 μg/ml Ampicillin and 12.5 μg/ml Tetracycline. Bacteria were
grown overnight at 37°C (Ahringer 2006). The list of RNAi cosmid clones used is
shown on table 2.10.
Cosmid name Gene
F35H10.4 vha-5
F49C12.13 vha-17
R12A1.2 snt-5
F10C1.2 ifb-1
Y110A2AL.8 ptc-3
W08F4.6 mlt-8
C09H10.3 nuo-1
M03F4.2 act-4
F42C5.10 ifo-1
C07A9.2 BUD31 homolog
K10B2.1 lin-23
F27C1.8 dpy-5
C44C1.4 vps-45
RNAi empty vector
Table 2.10: List of RNAi bacterial strains used in this study.
Cosmid code and the corresponding gene name are shown.

Anastasios Batas 2017 Chapter 2
78
2.3.22.1 Agar plates for C. elegans feeding of RNAi expressing bacterial strains
Larvae were synchronised as described on section 2.3.6 Synchronised L1 animals
were placed on NGM plates +Amp +IPTG with the desired RNAi expressing
strain spread on the plate. Larvae were left to grow to the desired stage.
2.3.23 Western blots
2.3.23.1 Preparation of C. elegans whole animal lysates for detection of the
roGFP ER3 protein
C.elegans whole animal lysates were prepared for SDS-PAGE (section 2.3.1) and
immunoblot analysis (sections 2.3.3 and 2.3.4) as follows. Nematodes were
synchronised to the L4 stage. 20 animals were picked per lysate. Nematodes were
left on to crawl on an unseeded late to get rid of excess OP50 bacteria. The
animals were then transferred to a 1.5ml Eppendorf tube with 500μl of 20mM
NEM/0.1% Tween. Samples were pelleted by centrifugation in the bench top
microfuge for 3 minutes at 200rpm. Supernatant was then removed leaving 20μl
of the buffer. 20μl of Novex Tricine SDS Sample Buffer (2x) were added.
Samples were frozen on dry ice and were then transferred to -80°C for 30 minutes
if they are to be used on the same day or can be stored for up to two weeks.
Samples were heated at 95°C directly from -80°C followed by incubation at room
temperature for 5 minutes. Each sample was split into two 20μl samples, and b-
mercaptoethanol was added to 5% to one of the two split samples as a reducing
agent. All samples (with and without reducing agent) were further boiled for an
extra 5 minutes before loading.

Anastasios Batas 2017 Chapter 2
79
2.3.23.2 SDS-polyacrylamide gel electrophoresis
Proteins were resolved according to their electrophoretic mobility using
discontinuous sodium dodecyl sulphate polyacrylamide gel electrophoresis (SDS-
PAGE) as described previously (Laemmli, 1970). Novex 10%, 12 well, Tricine
Protein Gels, of 1.0mm of thickness were transferred to a XCell SureLock Mini-
Cell Electrophoresis unit and submerged in 1x Novex Tricine SDS running buffer.
15μl of the non-reducing samples and 10μl of the reducing samples were loaded,
with one well left empty between the non-reduced and reduced samples during the
loading. The gels were transferred to an XCell SureLock Mini-Cell
Electrophoresis unit and submerged in 1x Novex Tricine SDS running buffer.
Gels were run at 125V for 1 hour 45 minutes. BioRad all blue precision plus
protein standard was routinely included in the analysis. Resolved proteins
contained within the gel were subjected to immunoblot analysis (described in
sections).
2.3.23.3 Western blot transfer
For antibody staining, proteins were transferred to nitrocellulose membrane
(BioTrace™, pore size 0.2µm). Protein samples were resolved by SDS-PAGE as
described on 2.3.20.2. The membrane gel and filter papers were soaked in SDS-
PAGE transfer buffer (25 mM Tris-HCl, 192 mM glycine, 20% (v/v) methanol).
Membrane and gel were sandwiched between 2 sheets of filter paper and 4
transfer sponges, soaked in transfer buffer then housed in BioRad mini Protean III
trans-blot system transfer cassettes. The cassette was immersed in transfer buffer
and transfer was achieved by applying 100V for 1 hour.
2.3.23.4 Immunological detection of proteins
Following transfer, nitrocellulose membranes were stained with Ponceau S
solution (0.1% (w/v) Ponceau S, 5% (v/v) acetic acid) to assess transfer
efficiency. Membranes were blocked for 45 minutes in either 5% made up in

Anastasios Batas 2017 Chapter 2
80
PBST (85 mM NaCl, 1.7 mM KCl , 5 mM Na2HPO4, 0.9 mM KH2PO4, 0.1%
(v/v) Tween-20). Primary antibody was diluted 1/1000 in 5% PBST and applied
to membranes overnight at 4°C with rotation. Membranes were then washed three
times for 10 minutes in PBST. The secondary antibody was applied for one hour
at room temperature with rotation. Membranes were washed a further three times,
twice in PBST and blots were visualised using infra-red imaging (LICOR).
Secondary antibodies were labelled with infrared dye (LI-COR Biosciences Ltd).
To minimise bleaching of the image signal when using the LICOR system
secondary antibodies and subsequent wash steps were all completed under dark
conditions.
2.3.24 Immunolocalisation of C. elegans proteins
C. elegans embryos, larvae or adults of similar developmental age were washed
off a petri dish with an excess of M9 buffer and were collected in a 1.5ml
Eppendorf tube. The animals were washed 5 times in M9 buffer and the once with
RFB (Section 2.1) +2% formaldehyde. Finally, 1ml of RFB +2% formaldehyde
was added in the tube. Tubes were place to freeze in a dry-ice/ethanol bath. They
were subsequently transferred to ice/ice water bath for 3.5 hours with an
occasional inversion. After incubation in the ice bath, samples were washed once
in TTB and were subsequently put in TTB +1% b-mercaptoethanol at 37°C with
gentle agitation for 1 hour. Samples were washed once with B03 buffer. To pellet
the nematode at this stage mild centrifugation was used (800rpm), followed by
addition of BO3 buffer/10mM DTT at 37°C with gentle agitation for 15 minutes.
Samples were washed once again in BO3 buffer and were then incubated in BO3
buffer/0.3% (v/v) H2O2 at room temperature with gentle agitation for 15 minutes.
Nematodes were washed again in BO3 buffer and were spun down to pellet them,
and were put in PBS-T with 0.02% sodium azide. At this stage, the samples could
be stored overnight at 4°C or at -20°C for longer storage. Supernatant was
removed and 100μl of PBS-T 1% milk was added, and animals were incubated for
1 hour at 4°C for blocking. Supernatant was removed and samples were incubated
in PBS-T 1% milk plus the primary antibody for 4 hours at room temperature or
overnight at 4°C. C. elegans were then washed three times, for 20 minutes at each
wash, in PBS-T. The animals were incubated in 100μl of secondary antibody in

Anastasios Batas 2017 Chapter 2
81
PBS-T 1% milk at 4°C overnight. Samples were washed once again three times in
PBS-T. Supernatant as removed. 100μl of mounting solution (50% (v/v) glycerol
in PBS) were added in the tube. 30μl of the solution were placed on a polylysine
coated slide and an 18 mm x 18 mm coverslip was gently lowered over the sample
with a scalpel blade to prevent the formation of air bubbles. Excess mounting
solution was carefully removed from around the coverslip edge. Specimens were
visualised using a Zeiss Axioskop 2 MOT microscope equipped with a HBO100
illuminator (Carl Zeiss, Germany). Images were captured and processed for
presentation as described in section 2.3.7.
2.4 Graphs and statistical analysis
Calculations were performed using the Microsoft Excel 2016 software (Microsoft), Graphs
and statistical analysis were done using the Graphpad Prism 7 software (Graphpad).

Anastasios Batas 2017 Chapter 3
82
Chapter 3: Phenotypic characterisation and comparison of vps-45
(tm246) and unc-51 (e369) mutants and identification of a functional
relationship between autophagy and the endosomal trafficking
pathway in C. elegans molting.
3.1 Overview and aims
In this chapter, the main aim is to analyse the developmental phenotypes of the IA757
strain, genotype, vps-45 (tm246), assess similarities and differences with the CB369 strain,
genotype unc-51(e369), to identify and assess any functional overlaps between endosomal
trafficking and autophagy. Phenotypic analysis of the mutant was performed using
Normaski microscopy and immunolocalization of the DPY-7 cuticle collagen utilising the
DPY7-5a monoclonal antibody (McMahon et al. 2003).The IA757 strain carries a deletion
at the vps-45 gene, of 1178bp in length extending from the promoter to the fourth exon and
hence can be considered a null allele. Thus, animals homozygotic for the deletion are not
able to produce a functional VPS-45 protein. The original paper describing the mutation,
(Gengyo-Ando et al. 2007) shows defects in trafficking proteins during embryonic
development. More specifically, in the IA757 strain oocytes have been shown to be unable
to properly uptake yolk proteins as demonstrated by a vitellogenin::EGFP reporter.
Furthermore, defective endocytosis was also observed in the pseudocoelom. Both
phenotypes were only observed at the developmentally non-permissive temperature of
25°C, however it is not specified on whether the protein trafficking defects are persistent
and to what degree in the permissive temperature of 15°C. Moreover, it was reported that
the mutant demonstrates developmental defects when cultured at 25°C but was reported to
develop relatively normally when grown at 15°C. Animals grown at the non- permissive
temperature arrested their development at various stages, mostly though at the L1 stage.
Additionally, they were often found encased in their old cuticle, suggesting defects during
the ecdysis stage of moulting. Both phenotypes where absent from animals cultured at
15°C. Furthermore, animals showed an inverse correlation of body length with increasing
temperature. Finally, an enlarged gut lumen was observed for the IA757 strain independent
of the culturing temperature (Gengyo-Ando et al. 2007). Given that this is a deletion allele

Anastasios Batas 2017 Chapter 3
83
and presumed genetic null, the reasons behind its temperature sensitive behaviour are not
explained. Presumably for whatever reason, the key biological process to which functional
VPS-45 protein contribute can work relatively effectively without VPS-45 at lower
permissive temperatures but not at the higher and non-permissive one.
During moulting a substantial amount of protein is secreted which forms the new cuticle.
The expression of the cuticular collagens is subject to spatial and temporal regulations.
These genes are expressed in the hypodermis and only at specific developmental time
points, once in the embryo prior to hatching and four more times at the end of each larval
stage before the moult. As such the hypodermis goes through an oscillation of highly
secretory and non-secretory phases in accordance to the expression of the cuticular genes
[(Frand et al. 2005), reviewed in (Johnstone 2000)]. During this highly secretory phase the
seam cells of the hypodermis acquire a highly granular appearance. This granularity is a
result of the accumulation of densely accumulated Golgi bodies, from which vesicles bud
off and move to the cell surface where the components of the cuticle are deposited. These
Golgi bodies are rapidly removed during lethargus and before the animals go through
ecdysis (Singh & Sulston 1978). It is possible that endocytic pathway and autophagy play
key roles in moulting, collagen biogenesis and maybe the mechanisms responsible for this
rapid turnover of the Golgi bodies at the end of each moult. Development and autophagy in
C. elegans have been linked in the past (Sato et al. 2014). However, autophagy has not
previously been investigated in relation to the moulting process itself.
An example of how an autophagic defect can affect C. elegans development, involves the
implication of the UNC-51 kinase. UNC-51 is part of the complex which initiates
autophagy through the formation of the phagophore. unc-51 (e369) mutants which show
reduced autophagy exhibits a dumpy body phenotype (dpy) and an uncoordinated
movement phenotype (unc). The uncoordinated phenotype is a result of defective axon
development (Ogura, Wicky, Magnenat, Tobler, Mori, Müller, et al. 1994) whereas the
smaller size of the animals has been attributed to smaller cell size (Aladzsity et al. 2007).
Despite that however, many C. elegans genes with a dpy mutant phenotype are known to
encode components of the cuticle or enzymes associated with collagen/cuticle assembly
(Johnstone, 2000; McMahon et al., 2003). Thus, based on this aspect of the unc-51 (e369)
phenotype and the fact that a substantial number of the unc-51 alleles also exhibit this
phenotype (http://www.wormbase.org/species/c_elegans/gene/WBGene00006786#0c-
9ga4-10), it is possible that cuticle synthesis and/or moulting is affected by the reduced
levels of autophagy caused by the unc-51 (e369) mutation. Thus, although unc-51 mutants

Anastasios Batas 2017 Chapter 3
84
are able to mouult, they do have the dpy phenotype associated with cuticle synthesis
defects so it can be assumed that unc-51 and by extension autophagy, is also involved in
the moulting process.
Furthermore, since VPS-45 plays such an important role in the endocytic pathway by
facilitating the accurate and appropriate fusion of vesicles with the membrane of
appropriate target organelles, it is possible that loss of VPS-45 function might result in an
excess of aberrant vesicles/organelles which are the result of inaccurate and inappropriate
membrane fusion events. Hence, in order for the cell to survive under such conditions, it
might require the aid of autophagy for the degradation of these aberrant structures.
Furthermore, in the case of highly secretory cells, such as the seam cells and the
hypodermis, the loss of VPS-45 could apply an extra burden to these cells if vesicle
targeting was less accurate than when VPS-45 function is present in the wild type, and as a
result produced aberrant structures that need to be degraded through autophagy.
It can therefore be hypothesized, that the vps-45 C. elegans mutant might have a greater
requirement for autophagy than the wild type in order to survive, with autophagy being
required to recycle aberrant vesicles and secretory components which where miss-targeted
as a result of defective vesicle fusion. Finally, Tlg2 which is the binding partner of Vps45
and is stabilized by an interaction with VPS45 as shown in yeast (Bryant & James 2001).
Tlg2 has been previously shown to regulate autophagy (Abeliovich et al. 1999; Ohashi &
Munro 2010; Nair et al. 2011) thus potentially also implicating vps-45 in the regulation of
autophagy, via the stabilisation of Tgl2. As a result, it is interesting to assess if any
similarities between the phenotypes exhibited by the two mutants exist and to test for
genetic interactions such as synthetic lethality. Additionally, it is possible that any
identification of previously unknown moulting defects in the unc-51 (e369) mutant that
would be similar to the vps-45 mutant could indicate a functional relationship between the
two genes and processes.
As such this study, along with the IA757 strain, the CB369 strain which carries the unc-51
(e369) mutations and has reduced levels of autophagy, was studied. Each of the strains was
observed to identify any delays in the completion of the moult and/or the life cycle
compared to the wild type strain.
Furthermore, a double mutant was constructed to further investigate the possible
involvement of the two processes in the development of the nematode. Phenotypic
characterisation of the double mutant could help assess the type and levels of genetic

Anastasios Batas 2017 Chapter 3
85
interaction between the two genes and as such provide additional information regarding
their role in the larval and embryonic development of the animal.
3.2 The vps-45 (tm246) endosomal trafficking mutant at 25°C exhibiting defects
in moulting.
Animals homozygotic for the vps-45 (tm246) allele (IA757), were cultured at the non-
permissive temperature of 25°C in order to replicate the previously described moulting
defects. When C. elegans were grown at the non-permissive temperature (25°C), many
demonstrated cuticular defects thought to be associated with moulting defects. Larvae
often got stuck in the cuticle (Figure 3.1 A-C). It appears that animals have a problem
completing the moult, and more specifically during the ecdysis process as they are often
found encased in the old cuticle. In the occasion where larvae were able to complete the
moult a subset of nematodes was found to have parts of the old cuticle still attached to its
body, around the head restricting part of the pharynx, suggesting an incomplete ecdysis
(Figure 3.1 D,E). These phenotypes are consistent with other moulting defects observed in
C. elegans, for example those associated with growth under low cholesterol conditions; an
exogenous source of cholesterol is a requirement for the moult and proper development in
C. elegans (Yochem et al. 1999; Hieb & Rothstein 1968; Kuervers et al. 2003; Frand et al.
2005).
3.3 The vps-45 (tm246) and unc-51 (e369) mutant strains exhibit embryonic
lethality during development
As previously discussed (Section 3.1) the vps-45 (tm246) mutant (IA757), shows defective
protein trafficking of yolk components by the oocytes. In cultures for the vps-45 (tm246)
strain unhatched eggs were often encountered. It can be speculated that such a defect could
potentially result in defects during embryonic development and potentially embryonic
lethality. Furthermore, unc-51 (e369) mutant (CB369) has been previously shown to
produce dead embryos (Erdélyi et al. 2011). In this case, I was interested in investigating
the embryonic lethality of the vps-45 (tm246) mutant, as well as compare it to that of unc-
51 (e369) in a temperature dependent manner.

Anastasios Batas 2017 Chapter 3
86
Figure 3.1: DIC microscopy, moulting arrest of IA757 animals when cultured at 25°C.
A-C) IA757 animals at various stages stuck in the old cuticle (arrows), with the head of the animal slightly
retracted (white arrowheads). D-E) Different focal points of moulting animals with old cuticle restricting its
body post moult (black arrowheads). Scale bars represent 5μm.
A) B)
C) D)
E)

Anastasios Batas 2017 Chapter 3
87
As such, the embryonic lethality for each of the mutants was scored, in both the permissive
(15°C) and non-permissive temperatures (25°C) for the vps-45 (tm246) moulting death
phenotype. The vps-45 (tm246) mutant exhibited higher embryonic lethality than both wild
type and unc-51 (e369) mutant at 15°C. However, a substantial number of the wild type N2
embryos also died at this temperature and this frequency was similar to the frequency
observed for the unc-51 (e369) mutant. As mentioned above the embryonic lethality for the
unc-51 (e369) animals has been previously reported however the culturing temperature
was not reported (Erdélyi et al. 2011). Certainly, here we found no difference between the
rates of embryonic death at 15°C between the wild type N2 and unc-51 mutant strain and
hence conclude that the loss of unc-51 function at this temperature does not contribute to a
higher frequency of embryonic lethality than in the wild type.
The average embryonic lethality of the vps-45 (tm246) mutant was almost triple (30.5%) of
that shown by the wild type and unc-51(e369) mutants (9.7% and 10.7% respectively)
(Figure 3.2 A). Additionally, it should be noted that lower embryonic lethality was
observed for the wild type and unc-51(e369) mutant when they were cultured at 25°C. This
suggest that the lower temperature of 15°C is not an optimal temperature for C. elegans
embryonic development. The vps-45 (tm246) mutant on the other hand maintained the
same levels of embryonic lethality in both temperatures. More specifically the wild type
strain only showed an average embryonic death of only 2.05%r and the vps-45 and unc-51
mutants exhibited an embryonic death of 30% and 6.7% respectively (Figure 3.2 B). This
suggest that along with the moulting death the vps-45 mutant at the non-permissive
temperature exhibits problems during its embryonic development as well. In contrast to the
moulting death phenotype however, this lethality extends to the permissive temperature of
15°C. Additionally, unc-51 (e369) also showed higher embryonic lethality than the wild
type at 25°C however not to the same extent as the vps-45 (tm246) strain.
3.4 The autophagy defective unc-51 (e369) mutant strain does not die by
moulting when cultured at 25°C
The vps-45 (tm246) and unc-51 (e369) mutants were tested for arrest during the molt and
subsequently death at 25°C. Embryos from each of the strains were acquired by subjecting
worms to standard bleach treatment and harvesting the eggs in S-Basal to produce
synchronous L1 larvae (Chapter 2, section 2.3.6). 50-60 synchronous L1 larvae for each

Anastasios Batas 2017 Chapter 3
88
strain were seeded on NGM plates and were left to grow over a period of 120 hours at
25°C. Three plates were prepared for each strain. For the wild type strain 98.33% of the
animals survived on average. Similarly, the unc-51 exhibited an average survival of 98.5%
after 5 days of development for L1 arrest. By contrast, for the vps-45 mutants, only 14.17%
of the original inoculate was still alive (Figure 3.3). In all cases, the larvae had developed
to the adult stage.
Thus, under the condition used the unc-51 mutants did not display larval lethality or any
lethality attributable to moulting defects with survival indistinguishable from wild type.
Thus, while loss of VPS-45 function which reduces the fidelity of vesicle trafficking and
causes defects in endosomal recycling results in lethality associated with moulting in C.
elegans at elevated culture temperatures (25°C), impairment of autophagy caused by the
unc-51 (369) allele does not.
3.5 The unc-51(e369) V; vps-4 5(tm246) X double homozygotic mutant exhibits
a synthetic effect
Although the unc-51(e369) mutation does not mimic the moulting defect caused by the
vps-45 (tm246) null allele, the possibility of a genetic interaction between these two genes
was further investigated by construction of the double mutant carrying both mutant alleles.
For the cross, initially 10 wild type males were crossed with a single homozygotic unc-51
(e369) hermaphrodite (CB369). The unc-51(e369) allele is recessive to wild type and
hence outcrossed F1 males are phenotypically wild type. A successful cross was assessed
by the ratio of male/hermaphrodite worms in the progeny, (if the ratio was close to 50%
the cross was considered successful) as well as the phenotype of the progeny. After a
successful cross, outcrossed progeny were heterozygotic for the unc-51(e369) allele which
is recessive to wild type, and hence easily identified. From this F1 generation, 20 males
were isolated and transferred to a plate with a single vps-45 (tm246) homozygotic
hermaphrodite (IA757) for mating. The resulting progeny of this cross produced two
genotypes unc-51(e369)/+ V; vps-45(tm246)/+ X and +/+ V; vps-45(tm246)/+ X.
For construction of the double homozygote it is the former of these two genotypes that was
required. Hence virgin F2 hermaphrodites were selected and were clonally transferred to
fresh NGM petri dishes and were left to produce progeny for 24 hours before being
removed from the plates.

Anastasios Batas 2017 Chapter 3
89
N2
IA757
CB
369
0
1 0
2 0
3 0
4 0
5 0
E m b ry o n ic le th a lity a t 1 5 C
S tra in
Em
bry
on
ic l
eth
ali
ty (
%)
N 2 IA 7 5 7 C B 3 6 9
0
1 0
2 0
3 0
4 0
5 0
E m b ry o n ic le th a lity a t 2 5 C
S tra in
Em
bry
on
ic l
eth
ali
ty (
%)
Figure 3.2: Progeny of young adult C. elegans which were hatched 48h hours after egg laying as a
percentage of total number of eggs laid. A) Average embryonic lethality (± SD) of the progeny of single
animals cultured at 15°C. N2 (n=10), IA757 (n=11), CB369 (n= 10). Tukey's multiple comparisons test. N2
vs. IA757, p = 0.0030. N2 vs. CB369, p= 0.9834. IA757 vs. CB369, p = 0.0047. B) Average embryonic
lethality (+SD) of C. elegans cultured at 25°C. N2 (n=10), IA757 (n= 10), CB369 (n= 11). Tukey's multiple
comparisons test. N2 vs. IA757, p <0.0001. N2 vs. CB369, p= 0.5255. IA757 vs. CB369, p <0.0001.
A)
B)

Anastasios Batas 2017 Chapter 3
90
N2
IA757
CB
369
0
5 0
1 0 0
S u rv iv a l 1 2 0 h o u r s f ro m L 1 s y n c h ro n y
S tra in
Su
rv
iva
l(%
)
Figure 3.3: Assessment of the molting death of the vps-45 (tm246) mutant at 25°C.
Plates inoculated with 50-60 L1 larvae for each strain. Alive C. elegans were scored after 120 hours of
development. Experiments were done in triplicates for each of the N2, IA757 and CB369 strains. Αverage
survival (%) ± SD is shown. Tukey’s multiple comparison test: N2 vs IA757 p<0.0001. IA757 vs CB369
p<0.001.
The F3 broods of these cloned F2 parents were scored for the segregation of homozygotes
for unc-51(e369) as indicated by ~25% with the unc phenotype. This identified broods
derived from F2 parents of the required double heterozygotic genotype unc-51(e369)/+ V;
vps-45(tm246)/+ X.
Unc F3 progeny were cloned to fresh NGM plates and left to lay eggs. At this stage, these
F3 unc-51(e369) animals are a mix of 25% +/+, 50% vps-45(tm246)/+ and 25% vps-
45(tm246)/ vps-45(tm246) on chromosome X. After egg laying, the F3 Unc parents were
removed and the resulting progeny was left to develop at the permissive temperature
(15°C) in order to avoid losing any homozygotic vps-45(tm246) animals. At this stage F4
animals which exhibited a new phenotype (different from either parental strain), namely
Unc and very much smaller dumpy body compared to the parental CB369 strain, were
identified in a proportion of the cultures.
**** ****

Anastasios Batas 2017 Chapter 3
91
At 15°C (the permissive temperature for the vps-45 moulting death), the newly isolated
mutant animals exhibited a very severe dumpy phenotype with a smaller overall body size
compared to the unc-51 (e369) mutant and a wrinkled cuticle near the head (Figure 3.5).
However, the rest of the cuticular structures, such as alae and the annular furrows appeared
to be forming normally (Figure 3.5). The double mutants also exhibited an uncoordinated
phenotype which appeared to be more severe to that observed in unc-51 (e369) animals.
The homozygotic double mutant was much less mobile than the unc-51 (e369) mutant,
since after several days of culturing each position on the petri dish was mostly unchanged
as observed by the trail left on the bacterial lawn.
It was considered most likely that this new phenotype was the unc-51(e369) V; vps-
45(tm246) X double mutant. However, on first attempt it was impossible to generate a
brood from these animals as they died before reproducing. To confirm the genotype very
small unc animals were picked for single worm PCR to verify that they carried both unc-51
(e369) and vps-45 (tm246) alleles in a homozygotic state (Figure 3.4). Animals which
exhibited a normal size unc phenotype were also subjected to single worm PCR to identify
how the heterozygotic state of the vps-45 (tm246) allele could potentially be affecting the
phenotype of the animals in an unc-51 (e369) homozygotic background.
The DNA from these animals was initially amplified for the detection of the unc-51 (e369)
allele. Animals carrying the mutant unc-51 allele produced a 381bp amplified fragment on
the gels after digestion with PvuII (section 2.3.15.4) whereas the wild type animals
produced two bands of 330bp and 51bp (Figure 3.4A). As demonstrated on Figure 3.4A,
all samples (1-3) produced a single 381bp band after amplification verifying that the
animals where homozygotic for the unc-51 (e369) allele, as already expected due to the
Unc phenotype. The same samples where then tested via PCR for the vps-45 (tm246)
allele. DNA from wild type animals produced a 629bp band whereas for vps-45 mutants
animals produced a 480bp band (Figure 3.4B).
Animals which where heterozygotic for the vps-45 (tm246) allele produced both bands
(Figure 3.4B). Of the three previously identified unc-51 (369) homozygotic samples,
sample 1, which exhibited a phenotype similar to the parental unc-51 (e369) mutant was
heterozygotic for the vps-45 (tm246) allele whereas samples 2,3, which exhibited the very
small Dpy body and Unc phenotype, were homozygotic (Figure 3.4B). As a result, sample
1 had the unc-51(e369)/unc-51 (e369) V; vps-45(tm246)/+ X and samples 2 and 3 had the
unc-51 (e369) V; vps-45(tm246) X genotype. The former can normally reach adulthood
and develop to a phenotype indistinguishable from the unc-51 (e369) mutant, suggesting
that a single copy of the mutant vps-45 (tm246) allele does not affect body size of the unc-
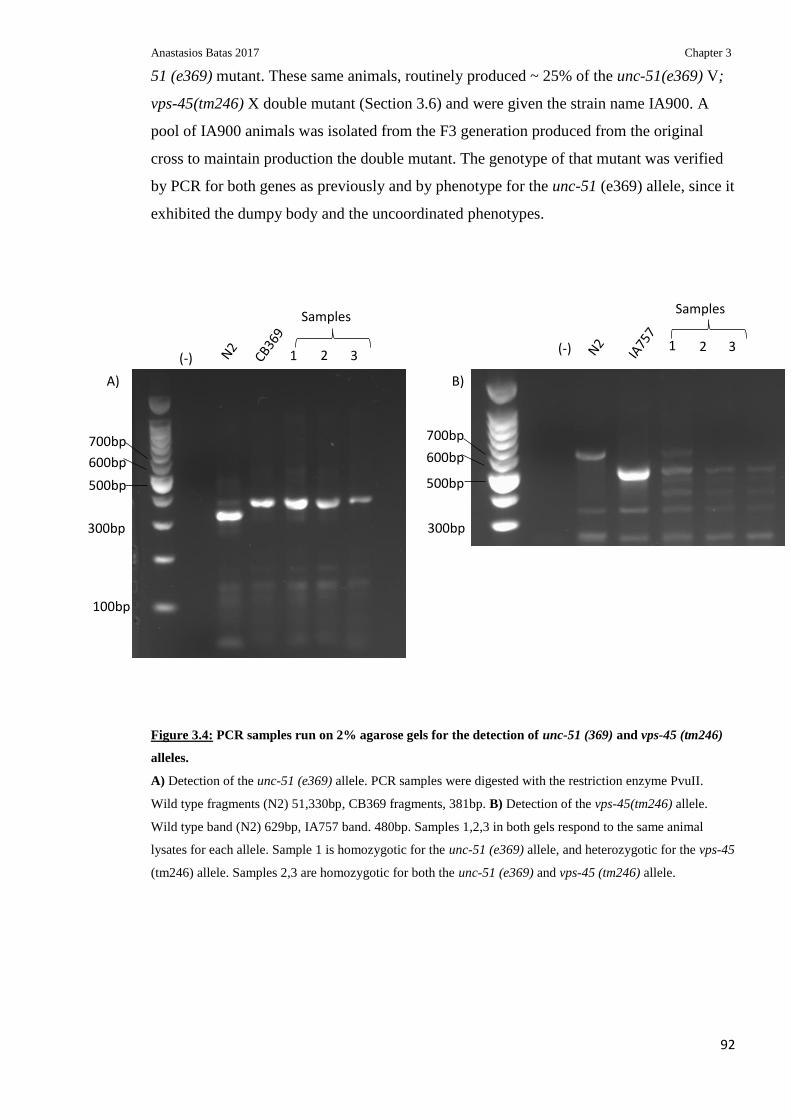
Anastasios Batas 2017 Chapter 3
92
51 (e369) mutant. These same animals, routinely produced ~ 25% of the unc-51(e369) V;
vps-45(tm246) X double mutant (Section 3.6) and were given the strain name IA900. A
pool of IA900 animals was isolated from the F3 generation produced from the original
cross to maintain production the double mutant. The genotype of that mutant was verified
by PCR for both genes as previously and by phenotype for the unc-51 (e369) allele, since it
exhibited the dumpy body and the uncoordinated phenotypes.
Figure 3.4: PCR samples run on 2% agarose gels for the detection of unc-51 (369) and vps-45 (tm246)
alleles.
A) Detection of the unc-51 (e369) allele. PCR samples were digested with the restriction enzyme PvuII.
Wild type fragments (N2) 51,330bp, CB369 fragments, 381bp. B) Detection of the vps-45(tm246) allele.
Wild type band (N2) 629bp, IA757 band. 480bp. Samples 1,2,3 in both gels respond to the same animal
lysates for each allele. Sample 1 is homozygotic for the unc-51 (e369) allele, and heterozygotic for the vps-45
(tm246) allele. Samples 2,3 are homozygotic for both the unc-51 (e369) and vps-45 (tm246) allele.
(-) 1 2 3
300bp
500bp
600bp
700bp
(-) 1 2 3
300bp
500bp
600bp
700bp
B) A)
100bp
Samples Samples

Anastasios Batas 2017 Chapter 3
93
Figure 3.5: Cuticular defects of the vps-45 (tm246) unc-51(e369) double homozygotic hermaphrodite.
Different focal point of head from adult hermaphrodite. Arrow heads point to the wrinkles on its cuticle.
Scale bars represent 100μm

Anastasios Batas 2017 Chapter 3
94
3.6 Genetic analysis of the unc-51(e369) vps-45(tm246) double homozygotic
mutant
The percentage segregation of the double mutant and its Mendelian pattern of inheritance
was tested. The IA900 animals were no different from the unc-51 mutant in terms of body
size and movement when observed from a stereo- dissecting microscope. A single IA900
parent verified for its genotype by PCR was left to egg lay. Every 24 hours the eggs were
clonally transferred to new NGM plates and were left to develop. Developing larvae were
scored on whether they showed the dumpy body and uncoordinated movement phenotypes
of the unc-51 mutant or the completely paralyzed very small body phenotype of the unc-
51(e369) vps-45(tm246) double mutant.
Commonly, IA900 progeny were identified that arrested in early larval developmental
stages and then died (Figure 3.6). The early larval death was observed at 60% of the double
homozygotic progeny (Table 3.2). The stage of the larvae was verified by observing the
shape of the developing germ lines. This phenotype of early larval death had not been
previously observed for either of the two single mutants cultured at 15°C. Moreover, these
animals took longer to develop than the rest of the progeny of the parental strain. As such
these were also classified as double mutants. Eggs that did not hatch were accounted for in
each case. The progeny of the animals which did not have the double mutant phenotype
was also scored and were classified as heterozygotic for the vps-45 (tm246) allele, and
hence same as the IA900 strain or homozygotic for the wild type vps-45, therefore being
the same as the CB369 strain based on their own progeny (Figure 3.6, Table 3.2). The
progeny of all IA900 adults observed is summarised on Table 3.1. Overall the double
mutants account for approximately 27% of the total progeny consistent with the expected
Mendelian frequency of segregation. Additionally, the average embryonic lethality from an
IA900 adult was 13.12% at 15°C (Table 3.1), a small but overall insignificant increase
compared to the individual embryonic lethality previously exhibited by each of the
individual mutants (section 3.2).
This would suggest there is no additive effect from each of the individual mutations, unc-
51 (e369) and vps-45 (tm246), regarding embryonic lethality. As a result, it was considered
that the same frequency of embryonic death should exist in the progeny of IA900 mutant
for any of the allelic combinations of the unc-51 (e369) and vps-45 (tm246) mutant alleles.
As a result, only the alive progeny was analysed to assess at what percentage the double
mutants segregate in the progeny.

Anastasios Batas 2017 Chapter 3
95
Figure 3.6: DIC microscopy of unc-51 V; (e369) vps-45 (tm246) X double homozygotic animals at
various larval stages.
10x (A, C, E, G), and 63x (B, D, F, H) lenses. Scale bars represent 100μm and 10μm in each case
respectively. A-F) Animals died by larval arrest at various stages white arrows point at the germline of each
animal. G-H) Adult hermaphrodite, with an underdeveloped germline for its age (white arrow).
A
)
B
)
C
)
D
)
G
)
H
)
E
)
F
)

Anastasios Batas 2017 Chapter 3
96
By Mendelian rules of segregation, 25% of the progeny would have an unc-51 (e369)
genotype with uncoordinated and dumpy phenotype, 50% would have an unc-51 (e369)
homozygotic vps-45 (tm246) heterozygotic genotype (IA900) with a Dpy and Unc
(DpyUnc) phenotype and 25% would have the unc-51 (e369) V; vps-45 (tm246) X
genotype with a very severe Dpy and Unc phenotype with a very small body size.
Therefore a 3:1 ratio of the very small dumpy and severe uncoordinated double mutant
phenotypes would be expected. A χ2 test showed that the observed values are significantly
different from the expected values of the Mendelian model of segregation with a p value of
0.1 (Table 3.1).

Anastasios Batas 2017 Chapter 3
97
Progeny classification of IA900 parent Parent 1 Parent 2 Parent 3 Parent 4 Parent 5 Parent 6 Total observed
Expected values
DpyUnc animals 8 9 6 8 6 8 45 48.75
Double mutant 4 5 3 3 2 3 20 16.25
Dead embryos 2 1 2 2 1 2 10 -
Total progeny 14 15 11 13 9 13 75 -
Total progeny excluding dead embryos 12 14 9 11 8 11 65
65
Average Dead
embryos
Dead embryos (%) 14.28571429 6.666666667 18.18181818 15.38461538 11.11111111 15.38461538 13.5024235
Table 3.1: Table of progeny from five IA900 parents.
Genotype of the parents was deduced from their progeny. Progeny was classified as DpyUnc animals, based on phenotype resembling the unc-51 (e369) mutant including both CB369
and IA900 animals. Double mutant for the vps-45 (tm246) unc-51 (e369) homozygote based on dead larvae, severe dumpy adults and dead embryos for the unhatched eggs The
observed and expected total values based on mendelian segregation are shown, excluding the dead embryos class. χ2 =. 1.153846154, suggesting no great deviation of the observed
values from the expected ones at p= 0.1 and df=1. Percentage of dead embryos for each individual progeny is shown along with the average percentage.
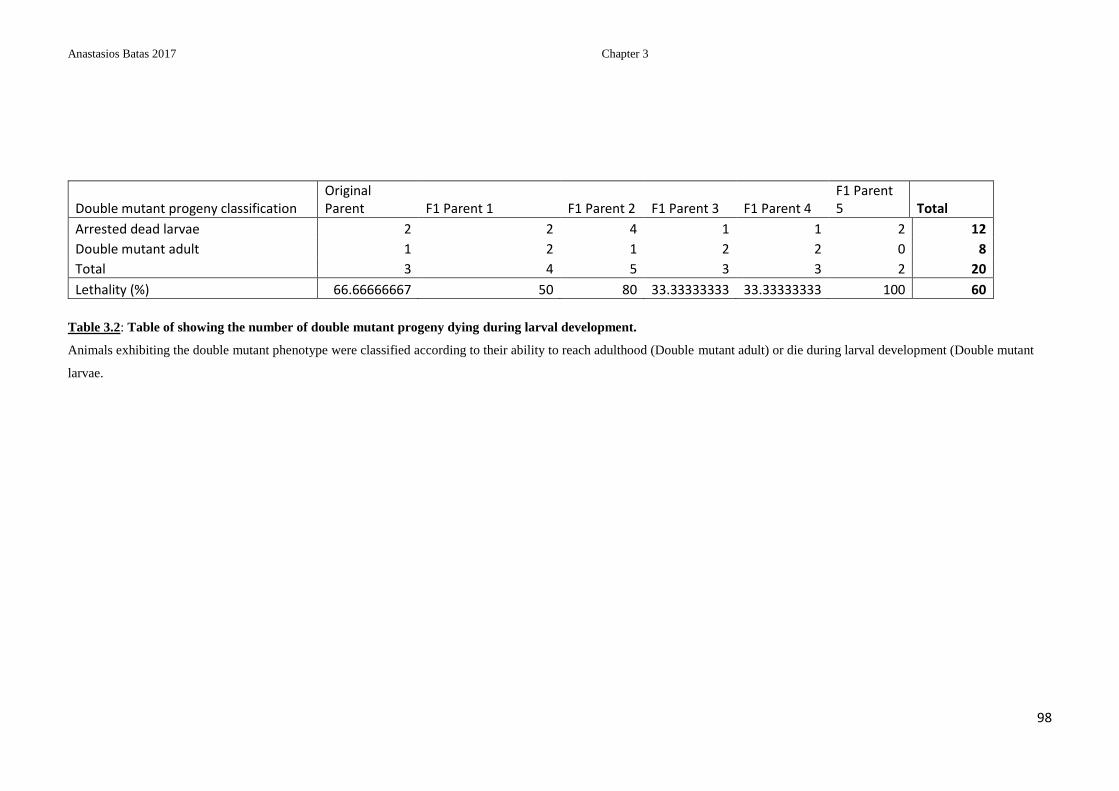
Anastasios Batas 2017 Chapter 3
98
Table 3.2: Table of showing the number of double mutant progeny dying during larval development.
Animals exhibiting the double mutant phenotype were classified according to their ability to reach adulthood (Double mutant adult) or die during larval development (Double mutant
larvae.
Double mutant progeny classification Original Parent F1 Parent 1 F1 Parent 2 F1 Parent 3 F1 Parent 4
F1 Parent 5 Total
Arrested dead larvae 2 2 4 1 1 2 12
Double mutant adult 1 2 1 2 2 0 8
Total 3 4 5 3 3 2 20
Lethality (%) 66.66666667 50 80 33.33333333 33.33333333 100 60

Anastasios Batas 2017 Chapter 3
99
3.7 Size comparison of the vps-45 (tm246), unc-51 (e369) and unc-51 (e369) V;
vps-45 (tm246) X double mutant
The unc-51 (369) vps-45 (tm246) was measured for the length of its body and was
compared to the individual single mutants that produced it. The double mutant had a much
smaller body size when compared to the single homozygotic mutants from which it
originated as well as the wild type. For the wild type and the single mutant 10 adult
hermaphrodites were measured. For the double mutant, due to the difficulty in acquiring
viable adults only two animals were measured. Only a small number of the double mutant
was observed with DIC microscopy and pictures could be acquired. Only a small number
of the double mutant animals could survive and develop to adulthood and from those a
substantial number ruptured while handling the nematodes with the platinum wire pick or
after addition of S-basal buffer on the slides potentially suggesting defective cuticle
structure. Most animals (~60%) in the case of the double mutant were found dead in earlier
stages of development (Table 3.2). Adult wild type C. elegans cultured at 15°C has an
average length of 1211μm. The vps-45 (tm246) and unc-51 (e369) animals have an average
length of 1048μm and 819μm respectively. By contrast, the unc-51 (369) vps-45 (tm246)
double mutant had a size of 330μm (Figure 3.6). Going over the data one can argue, that a
more than additive effect is present in the double mutant in regard to the length of the
animals.
More specifically the vps-45 (tm246) mutant has an average size of 1048μm, which is ~
86.5% of the wild type length (1211 μm). The unc-51 (e369) mutant has an average length
of 819 μm which corresponds to 67.6% of the original length. If the two genes had an
additive effect towards the length of the double mutant, then the animals would have a size
of 58.5% of the wild type length (67.6% of 86.5%). As a result, the expected length of
these mutants would be 708.5 μm. However, the observed size of the unc-51 (e369) V;
vps-45 (tm246) X double mutant is 330 μm which translates to approximately 27.2% of the
wild type length (Figure 3.7). That is almost twice as severe as the expected phenotype,
suggesting a more than additive effect with respect to body length. However, as most
animals of this genotype died during larval development and most adults ruptured during
transfer to slides, the actual phenotype of the double mutant is much more severe than this
size of two intact adults suggests. Also, it proved impossible to breed from this genotype,
so the true genetic interaction is one of synthetic lethality.

Anastasios Batas 2017 Chapter 3
100
The interaction between the two gene can be classified as negative epistasis, the extreme
case of which would be synthetic lethality. This aggravating interaction suggest that the
two genes are operating in different pathways but also exhibit some compensating
function, possibly in the post embryonic development of the animals (St Onge et al. 2007).
3.8 Phenotypic analysis of internal and cuticular structures of vps-45 (tm246), unc-51 (e369) and unc-51 (e369) V; vps-45 (tm246) X mutants
To further identify differences between the double and the single mutants in terms of both
the cuticle structure as well as the internal organs Nomarski microscopy was employed.
The three strains wild type (N2), vps-45 (tm246) mutant (IA757) and unc-51 (e369) mutant
(CB369) all showed normal development of the buccal cavity, whereas the unc-51(e369)
V; vps-45 (tm246) X double mutant shows a collapsed pattern of the buccal cavity
structure, which appears to be, which appears to be due to the shorter body size of the
animals (Figure 3.8). The animals could feed and pharyngeal pumping was observed along
with shuttle movement of the mouth. However, the animal did not exhibit any other
movement beyond that.
Additionally, closer observation of the intestine showed that vps-45 (tm246) and unc-51
(e369) both have an enlarged intestinal lumen compared to the wild type strain. The
enlarged lumen could be a result of incomplete digestion due to defective secretion of
digestive enzymes or due to other structural problems with the intestinal cells, like
enlarged cells. As a result, it is no surprise that, in the case of the double mutant an
enhanced phenotype is observed severe as the intestinal lumen seems to be enlarged along
with high amounts of undigested bacteria inside (Figure 3.9).
Structures of the cuticle where more closely observed in order to identify any defects on
the surface of the cuticle that would indicate problematic formation of the structure in vps-
45 (tm246) and unc-51 (e369) and the double mutant. In all cases the adult alae were
observed and it was demonstrated that they can normally form despite defects in protein
trafficking, autophagy or both. In the case of the double mutant the annular furrows are
easily visible on the cuticle suggesting that in general even the double mutant exhibits
normal major structural features of the cuticle when it is able to survive the early larval
death, as observed by light microscopy (Figure 3.10).

Anastasios Batas 2017 Chapter 3
101
Figure 3.7: Length comparison of wild type, IA757, CB369 and unc-51 (e369) V; vps-45 (tm246) X
double mutant.
A-D) DIC images of adult N2, IA757, CB369 and the synthetic double mutant vps-45 (tm246) unc-51 (e369).
Scale bars represent 100μm. E) Average length (+SD) of each strain at the adult stage when cultured at 15°C.
N2 (n=10), IA757 (n=11), CB369 (n=11), double mutant (n=2). Tukey’s multiple comparisons test: N2 vs
IA757, p=0.0004. N2 vs CB369 P<0.0001. IA757 vs CB369 p<0.001.
E)
**** ****
***
A) B)
C) D)
N2
IA757
CB
369
do
ub
le m
uta
nt
0
5 0 0
1 0 0 0
1 5 0 0
Le
ng
th (
m)

Anastasios Batas 2017 Chapter 3
102
Figure 3.8: DIC microscopy, of the pharynx of adults cultured at 15°C.
A) N2 B) IA757 C) CB369 D) vps-45 (tm246) unc-51(e369) double mutant. White arrows point to the
pharyngeal bulb. It is severally mislocalised in the vps-45 (tm246) unc-51(e369) double mutant. Scale bar
represent 100μm
A) B)
C) D)

Anastasios Batas 2017 Chapter 3
103
Figure 3.9: DIC microscopy, of intestine of adult animals cultured at 15°C.
Double headed arrows show borders of the intestinal lumen. A) N2- normal development of the intestine.
B) IA757- enlarged intestinal lumen. C) CB369- enlarged intestinal lumen D) unc-51(e369) vps-45 (tm246)
double mutant, collapsed intestinal lumen.
A) B)
C) D)

Anastasios Batas 2017 Chapter 3
104
Figure 3.10: DIC microscopy, of adult cuticular alae (white arrows).
C. elegans were cultured at 15°C. Normal pattern of the alae for all strains. A) N2 B) IA757 C) CB369 D) unc-
51(e369) vps-45 (tm246). Scale bars represent 10μm.
A) B)
C) D)

Anastasios Batas 2017 Chapter 3
105
Immunolocalisation was employed in order to better visualise the annular furrows during
normal development as well as during the moulting death of the vps-45 (tm246) mutant.
The cuticular component which was stained was the DPY-7 collagen, since the antibodies
were readily available in our lab. DPY-7 is one of the cuticular collagens and it localizes in
the annuli. An anti-DPY-7 primary antibody was used which can bind to the cuticular
collagen DPY-7. The DPY-7 protein is detected within the cuticle in circumferential bands
or stripes which are continuous except over the lateral sides of the animal when the alae are
present. These stripes correspond to the evenly spaced indentations or furrows that define
the annuli of the cuticle. A IgG conjugated fluorophore secondary antibody was used to
visualise the structures under UV light. In all cases when the strains were cultured at the
permissive temperature (15°C) (Figure 3.11) the furrows were normally formed as part of
the cuticle. No antibody staining could be performed for the unc-51 (e369) V; vps-45
(tm246) X double mutant due to the low number of animals being produced at each
generation from the IA900 strain however the annular furrows were previously visualised
with DIC microscopy and appear to be forming normally (Figure 3.5).
For the vps-45 (tm246) mutant strain the staining was repeated at the non-permissive
temperature (25°C), to identify any potential defects in the formation of the cuticle during
the moulting arrest. After treatment with the antibodies, animals which were unable to
complete the moult and were encased in their cuticle or showed other cuticular defects,
such as incomplete cuticle shedding were identified and observed (Figure 3.12). It appears
that the moulting death is not a result of a defective cuticular structure as it appears to have
properly formed annular furrows similar to the wild type. The new cuticle appeared to be
forming in a normal way underneath the old one, with the new annular furrows mirroring
the structure of the old ones. This potentially suggest that both vps-45 and unc-51 are not
explicitly necessary for the cuticle to be deposited and structured properly and are required
for the shedding and completion of the moulting process. Thus, the vps-45 (tm246)
temperature sensitive death is most likely a result of problems caused during the later
stages of the moult, namely the ecdysis, after the deposition and formation the new cuticle
has been completed.

Anastasios Batas 2017 Chapter 3
106
Figure 3.11: Immunoslocalisation of C. elegans DPY-7 cuticular collagen.
Mouse monoclonal primary antibody, Alexa Fluor 488 Fluorophore conjugated whole IgG from goat 1:200
secondary antibody. 63x magnification. No difference between strains in the pattern of the annular furrows.
A) N2 ,B) IA757, C) CB369 respectively.
C)
A)
B)

107
Figure 3.12: Immunoslocalisation of DPY-7 cuticular collagen, in vps-45 (tm246) mutants during moulting arrest when cultured at 25°C. Alexa Fluor 488 Fluorophore
conjugated whole IgG from goat 1:200 secondary antibody. 63x Magnification. A) Old cuticle partially shed, parts of it constricting the worm body. B,C) Larvae encased in the old cuticle
at the end of the moult . Both the old and new cuticle annular furrows are visible.
A) B) C)
Anastasios Batas 2017 Chapter 3
108
3.9 Characterisation of the moult and intermoult periods on vps-45 (tm246)
and unc-51 (e369) mutants
To further investigate this idea of defective exit of the mutant animals from the moult as a
cause of death for the vps-45 (tm246) mutant (IA757), L1 larvae were observed throughout
the duration of their moult to the L2 stage along with the unc-51 (e369) mutant (CB369)
and wild type (N2) strains for comparison. Moulting for the wild type strain at 15°C started
at 22 hours from seeding the plates with L1 arrested animals. At this point the number of
larvae on each plate that were in lethargus was counted for each of the strains.
Characteristic trait for the lethargic state was the lack of movement and more importantly
the stopping of the pharyngeal pumping(Singh & Sulston 1978). The stopping of the
pharyngeal pumping was proven very useful in the case of the unc-51 (e369) mutant which
exhibited an uncoordinated movement phenotype which made it difficult to assess whether
larvae where in a lethargic state (lack of movement) or not. The experiment was repeated
three times. Data showed that both the vps-45 (tm246) and unc-51 (e369) mutants had a
delayed entry into the moult of roughly 2 hours when compared to the wild type. The first
lethargic animals for these two strains were observed 1-2 hours later than the wild type
strain (Figure 3.14A). The vps-45 (tm246) population appeared to remain in the lethargic
state for longer than the wild type in general and required approximately 11-12 hours to
exit the moulting state completely compared to approximately 10 hours for the wild type
strain. Additionally, it appears that on average the same number of animals were in
lethargus at the same time at the peak of the moult, (Figure 3.13 A) at approximately 60%
of the total population for both vps-45 (tm246) and wild type animals. Thus, suggesting
that the vps-45 (tm246) mutant requires longer to complete the moult. The unc-51 (e369)
mutant population generally required longer than wild type to exit the moult. However,
with a much smaller number of larvae being in a lethargic state at the peak of the moult
(40%). Consequently, individual animals were most likely not taking longer to moult as
was the case with the vps-45 (tm246) mutant, but different larvae were starting the
moulting process at different time points (Figure 3.13 A).

Anastasios Batas 2017 Chapter 3
109
0 5 1 0 1 5 2 0
0
2 0
4 0
6 0
8 0
1 0 0
T im e (h )
% l
eth
arg
ic a
nim
als
N2
IA 7 5 7
C B 3 6 9
N2
IA757
CB
369
0
1
2
3
4
S tra in n a m e
Av
era
ge
mo
ltin
g t
ime
pe
r a
nim
al
(h
)
Figure 3.13: Molting profiles of N2, IA757, CB369 strains during the L1-L2 moult at 15°C. A)
Percentage of moulting animals at hourly intervals (± SD) for the duration of the moult. Average of three
experiments for each strain. B) Average time required for each strain go through the moult as the product of
the calculation of the average area under the curve (±SD) for each moulting graphs obtained from the
triplicate experiments of each strain tested. Tukey's multiple comparisons test. N2 vs. IA757, p= 0.0901.
N2 vs. CB369, p= 0.7311. IA757 vs. CB369, p= 0.2407.
A)
B)

Anastasios Batas 2017 Chapter 3
110
Both the vps-45 (tm246) and unc-51 (e369) populations start moulting later compared to
wild type (1 hour later). and take longer to complete the moult, at 14 hours and 15 hours
respectively when compared to 10 hours of the wild type strain (Figure 3.14). Additionally,
the synchrony of the animals moulting was expressed as a measure of the breadth of the
curve and the height of its peak. If synchrony through the moult was perfect, the
population would move from 0% lethargic to 100% lethargic instantaneously and stay at
that state until the end of the moult at which point it would reach 0% again in perfect
synchrony. Such a perfectly synchronous population would produce a rectangular graph.
A high and narrow peak indicates a better synchrony (though still imperfect) whereas a low
and broader peak indicates a less synchronised moulting population. Therefore, the area
under the curve can act as product which expresses the measure of the total time taken by
the population (or average for each animal) to get through lethargus. If the area under the
curve is greater in one case than another, then in that case the animals should be taking
longer to go through the moult. The area under the curve was measured for each of the
individual experiments for each of the strains (Appendix 1) and the average area was
plotted for each (Figure 3.13B). Despite no significant differences the data once again
suggest that vps-45 (tm246) does stay in lethargus longer (2.67 hours) than the wild type
and unc-51 (e369), both of which seem to require approximately the same amount of time
to go through the moult (2.05 and 2.24 hours respectively) (Figure 3.13B).
To verify this, individual animals were observed under the microscope from their entry
into lethargus (stop of movement and pharyngeal pumping) until the moment they exit
lethargus (onset of movement and the start of ecdysis). Results demonstrated that wild type
and unc-51 (e369) animals require approximately 6 hours to complete the moult whereas
vps-45 (tm246) animals requires approximately 8 hours to go through the same process
(Figure 3.14).
Since the differences in moulting between all three strains were established a new question
arose regarding how the animals behave in the intermoult periods. Observing through these
periods was difficult due to the variability between each of the strains compared to the wild
type strain, and especially for unc-51 (e369) mutants which exhibits severe asynchrony at
later larval stages. However, the behaviour of each of the strains during the intermoult
stages could be inferred by how fast each of the animals can reach adulthood from L1
arrest, as well as how synchronous or asynchronous animals are when they reach that
stage.

Anastasios Batas 2017 Chapter 3
111
It has been previously shown that wild type C. elegans requires approximately 60 hours to
reach adulthood from hatch at 16°C, 44 hours at 20°C and 30 hours at 25°C . A similar
inverse correlation between time and temperature is also observed for the intermoult
periods (Byerly et al. 1976). As a result, in agreement to this all the mutants in this study
required longer to reach the adult stage at the lower temperature of 15°C.
N2
IA757
CB
369
0
5 0
1 0 0
1 5 0
H o u rs to a d u lth o o d
S tra in
Tim
e (
ho
urs
)
N2
IA757
CB
369
0
2
4
6
8
1 0
S tra in
Tim
e (
ho
urs
)
D u ra tio n o f m o lt
Figure 3.14 Duration of moult and development time to adulthood for N2, IA757 and CB369 strains.
A) Average development time (± SD) for >50% the population to reach adult stage for N2 (n=5), IA757
(n=4), CB369 (n=4) C. elegans when cultured at 15°C. Tukey’s multiple comparison test N2 vs IA757,
P<0.0001. N2 vs CB369, P<0.0001. IA757 vs CB369, P=0.002. B) Average time (+SD) for the completion
of moult at the L1-L2 when cultured at 15°C, N2 (n=12), IA757 (n=10), CB369 (n=10). Tukey’s multiple
comparison test N2 vs IA757, P<0.0001. N2 vs CB369, P=0.4188. IA757 vs CB369, P<0.0001.
A)
B)

Anastasios Batas 2017 Chapter 3
112
The wild type, could reach the adult stage after approximately 100 hours of development
when cultured at 15°C whereas vps-45 (tm246) and unc-51 (e369) mutants require 125 and
136 hours respectively to reach the same developmental stage in 50% of their total
population. The condition of 50% of the animals to have reached the adult stage was
introduced due to the asynchrony observed for the unc-51 (e369) mutant. The
developmental stage for all larvae was scored for all strains after 72 hours of development
from L1 arrest. While the wild type strain had already reached the L4 stage by that time,
the vps-45 (tm246) strain was one stage behind at the L3 stage. On the other hand, for the
unc-51 mutant a mixed population was obtained. Most the animals, were at the L2 stage
(65%) and the rest at the L3 (20%) and at the L4 stage (15%) (Figure 3.15, Appendix 3).
The above data collectively present some interesting conclusions. Firstly, vps-45 mutants
appear to remain in lethargus for longer than the wild type strain, potentially due to a
delayed exit from the moult. It can be speculated that this delayed exit from the moult is
what causes the moulting death at the non-permissive temperature. The loss of a functional
VPS-45 could potentially result in ineffective and less accurate vesicle targeting than in the
wild type, resulting in the requirement for autophagy for the removal of these aberrant
membranes. As previously described (section 3.1) autophagy is possibly also required for
the removal of the membranes forming the Golgi bodies in the hypodermis during the
moult. As such it is possible that the increased requirement of autophagy for the clearance
of the extra material originating from defective endosomal fusions, causes a delayed
removal of these Golgi bodies in the vps-45(tm246) mutant background hence resulting in
the delayed exit from the moult. In this case, the population in general remains in
synchrony (Figure 3.15). Furthermore, under the assumption that each moult stage take the
same amount of time throughout C. elegans development, as it is demonstrated by the
temporal expression of moulting related genes during the moult (Johnstone & Barry 1996),
it is easy to infer that in the case of the vps-45 mutant the intermoult period also last longer
than wild type. These animals require 2 extra hours to proceed through each moult, which
means that they require 8 extra hours to go through all moulting stages and reach the adult
stage at 108 hours. However, it does so at 126 hours, requiring an extra 18 hours which are
most likely a result of prolonged intermoult periods. On the other hand, the unc-51 (e369)
mutant although it can complete the moult in the same amount of time as the wild type
strain, it exhibits asynchrony at the onset of the moult after larvae where synchronised and

Anastasios Batas 2017 Chapter 3
113
a similar effect was observed in later developmental stages. Along with the asynchrony a
great delay in development was observed when compared to the wild type strain. The
above could suggest that the vps-45 (tm246) undergoes a lengthier moulting process and
has longer intermoult periods whereas the unc-51 (e369) mutant, potentially only exhibits
the prolonged intermoult period phenotypes, taking longer to enter the next moult after it
has recovered from the previous one. Furthermore, the asynchrony suggests variable entry
into the next moult. This can potentially be attributed to the very limited capacity of the
unc-51 mutant to initiate and carry out autophagy.
Figure 3.15: Developmental stage of N2, IA757, CB369 animals in cultures after 72h of development,
from L1 arrest at 15°C.
IA757 and CB369 appear to be at the L3 and L4 stage for the majority of the population. N2 strain is at the
L4 stage. IA757 and CB369 lose synchrony during development. Average of three experiments for each
strain.
3.10 Determination of lifespan for vps-45 (tm246) and unc-51 (e369) mutants
This difference in the moulting entry as well as the duration of the moult for vps-45
(tm246) and unc-51 (e369) mutants raised the question about how the two mutants
compare after they have completed all larval moults and reached adulthood. As a result,
their lifespan was compared. Young adult C. elegans for each strains were transferred to
NGM plates and
0 20 40 60 80 100 120
N2
IA757
CB369
% of worms at each developmental stage after 72h, from synchrony
L4 L3 L2 L1

Anastasios Batas 2017 Chapter 3
114
were cultured at the permissive and non-permissive temperatures. At 15°C the wild type
population exhibited a median survival of 17 and reached 100% lethality on day 36. The
vps-45 and the unc-51 mutants exhibited a median survival of 6 and 5 days respectively.
Both had no more surviving animals after 17 days. The adult lifespan of the unc-51(e369)
V; vps-45 (tm246) X double mutant was not assessed due to the limited number of animals
available.
At 25°C the wild type had a much reduced lifespan compared to 15°C, which agrees with
previously published data suggesting that a colder environment increases C. elegans
longevity (Zhang et al. 2015). In the case of the wild type the median survival was 6 days
and no animals were alive after 13 days Both of the mutants tested followed this pattern of
having a longer lifespan at the lower temperature (Figure 3.16). The vps-45 (tm246) mutant
had a reduced lifespan compared to both other strains, as opposed to the data described
above where the unc-51 (e369) and vps-45 (tm246) had a similar lifespan. The vps-45
mutant had a median survival of 3 days and no more animals were alive after 7 days. The
unc-51 mutant had a median survival of 5 days and had no more surviving animals after 11
days. This suggests that vps-45 (tm246) animals exhibit defects in the non-permissive
temperature extend beyond the molt and larval development defects (Figure 3.16).

Anastasios Batas 2017 Chapter 3
115
0 1 0 2 0 3 0 4 0
0
5 0
1 0 0
L ife s p a n a t 1 5 °C
D a y s e la p s e d
Pe
rc
en
t s
urv
iva
lN2
IA 7 5 7
C B 3 6 9
0 5 1 0 1 5
0
5 0
1 0 0
L ife s p a n a t 2 5 °C
D a y s e la p s e d
Pe
rc
en
t s
urv
iva
l
N2
IA 7 5 7
C B 3 6 9
Figure 3.16 Lifespan of adult N2, IA757 and CB369 C. elegans at 15°C and 25°C. 3 populations of 50
young adults where observed for each of the strain. A) Survival of adult C. elegans at 15°C. Log rank test for
comparison of the curves. N2 vs IA757, p<0.0001. N2 vs CB369, p<0.0001. IA757 vs CB369, p= <0.0001 B)
Survival of adult C. elegans at 25°C. Log rank test for comparison of the curves. N2 vs IA757, p<0.0001. N2
vs CB369, p=0.008. IA757 vs CB369, p<0.0001. P values <0.017 are considered significant as determined by
the Bonferroni method for threshold determination.
A)
B)

Anastasios Batas 2017 Chapter 3
116
3.11 Chapter summary
In this chapter, the phenotypes of the vps-45(tm246) mutants (IA757) and unc-51(e369)
mutant (CB369) strains were identified and compared in terms of size, embryonic lethality,
internal organ structures, longevity and cuticle structures. The initial data by Gengyo-Ando
et al,,which suggested that there is a defect in Yolk protein accumulation in addition to my
data demonstrating embryonic lethality could suggest that incomplete protein trafficking of
the yolk proteins is responsible for the reduced viability of embryos during early
development in vps-45 mutants (Gengyo-Ando et al. 2007). Furthermore, it appears that
there is almost no lethality for the unc-51 (e369) mutant after the hatch at 25°C (98.33%
survival), unlike the vps-45 (tm246) mutant, which exhibited a very high lethality at the
non-permissive temperature (14.17% survival), as a result of moulting arrest (Figure 3.3).
Part of the reason for the lethality in both embryonic and post embryonic lethality for the
vps-45 mutant could be due to the fact that C. elegans also need to secrete their first cuticle
prior to hatching as well as at each of the subsequent moults. A subset of embryos dies
during that period. Since this is the first time a cuticle is being synthesized there would be
no previous cuticle, or parts of it, to be removed and as such if autophagy plays a role in
that process it wouldn’t be required during that stage.
A unc-51 (e369) V; vps-45 (tm246) X double homozygotic mutant was constructed and a
synthetic lethal phenotype was identified. In order to keep generating the synthetically
lethal double mutant which could not be cultured, a vps-45 (tm246) heterozygotic, unc-51
(e369) homozygotic mutant (strain IA900), was utilised and the double mutant was
isolated each time from its progeny. The newly identified synthetic lethal mutant was
characterised and compared to the single mutants. Data demonstrated that IA900 animals
segregated close to 25% progeny which were very sick exhibiting severe morphological
defects, or they died at earlier larval stages before reaching adulthood (approximately 60%
lethality) even at the permissive temperature of 15°C (Tables 3.1, 3.2).
The general morphology of the cuticle in all mutants was identified to be similar to the
wild type cuticle. As a result, it was assumed that any differences should exist in the
moulting process itself. As a result, both, vps-45 and unc-51 mutants were characterised in
terms of the moulting process and their overall development in order to identify traits that
would establish a connection between autophagy and the moulting defects exhibited by the
vps-45 (tm246) mutant. It was demonstrated that both mutants show differences in terms of

Anastasios Batas 2017 Chapter 3
117
development compared to wild type. In short, vps-45 (tm246) animals required longer to
complete the moult, a defect which extended a delay in the overall development of the
mutants. On the other hand, unc-51 (e369) animals required the same amount of time to
moult as the wild type strain, however the overall population took longer to moult, and had
increased asynchrony in its population after a few days of development. Suggesting, that
there could be a delay in the development in the intermoult periods. For both mutants, the
reason for the delay in development could be attributed to the clearance of the membranes
at the end of each moult in the hypodermis (Singh & Sulston 1978), in each case however
for different reason. The vps-45 (tm246) mutant required longer to complete the moult
possibly as a result of increased requirements for autophagy to clear a greater number of
cellular material from the inefficient vesicle fusion along with the Golgi bodies that are
formed in the hypodermis at the moult. The unc-51 (e369) mutant on the other hand by
default exhibits much lower levels of autophagy (Ogura, Wicky, Magnenat, Tobler, Mori,
Müller, et al. 1994) and as such would take longer to exit the last stage of the moult
because at the last stage of the moult it would take longer to start the ecdysis because of the
delayed removal of the Golgi bodies. This claim could be further enforced by the fact that
the double mutant exhibited a synthetic lethality. Finally, both mutants exhibited a shorter
lifespan compared to the wild type, possibly due to an increased oxidised state of the cells
because of the accumulation of cellular material because of the endocytic and autophagy
defects in each mutant respectively or maybe other aspects of general fitness.

Anastasios Batas 2017 Chapter 4
118
Chapter 4: The role of autophagy and protein trafficking during
embryonic development and moulting
4.1 Overview and aims
As analysed on Chapter 3 the unc-51 (e369) V; vps-45 (tm246) X double homozygotic
mutant animals exhibit a synthetic lethality. The double homozygous mutants were derived
by selfing of hermaphrodites of the strain IA900 which is a non-balanced heterozygote for
unc-51 (e369)/+ V and homozygotic for vps-45 (tm246) X. The double homozygotic
progeny were paralyzed and with a much smaller body size when compared to CB369
animals. Almost all of these animals display a larval lethality and a very small proportion
reach adult but do not produce broods. The homozygotic strain cannot be maintained
(Sections 3.3 and 3.6).
Considering that each mutation by itself produces under certain conditions viable animals,
the synthetic lethally might indicate some interaction between the two processes within
which these genes function during the development of the organism. Since both CB369
and IA757 exhibit cuticle synthesis and/or moulting defects (dumpy body and moulting
death respectively), it can be theorised that both processes (VPS-45 mediated endosomal
recycling and UNC-51 induced autophagy) are important but not on their own essential for
cuticle biogenesis and/or moulting. However, that the organism cannot survive when both
are lost simultaneously possibly indicates a level of interaction between these two discrete
functions.
Autophagy is a catabolic process in which lysosomes degrade intracytoplasmic contents
transported in double-membraned autophagosomes. Autophagosomes are formed by the
elongation and fusion of phagophores, which can be derived from pre-autophagosomal
structures coming from the plasma membrane and other sites like the endoplasmic
reticulum and mitochondria (Lamb et al. 2013; Biazik et al. 2015). One of the first events
in autophagy is the formation of the phagophore, a double membrane that encloses cellular
components during macroautophagy [(Abeliovich et al. 2000; Biazik et al. 2015), reviewed
in (Mizushima 2007; Meléndez & Levine 2009)]. Formation of the phagophore is initiated

Anastasios Batas 2017 Chapter 4
119
by the activity of the ATG1 kinase (orthologues ULK1 in mammals and UNC-51 in C.
elegans) (Meléndez et al. 2003; J. Kim et al. 2011).
Therefore, UNC-51 is essential for the initiation of autophagy in C. elegans. The LC3/Atg8
protein is commonly used as an autophagy marker for the detection of autophagosomes
involved in the expansion of the autophagosome membrane [reviewed in (Suzuki &
Ohsumi 2007)]. The phosphatidyl-ethanolamine (PE)-conjugated form of this protein is
recruited to the maturing autophagosome during the elongation process and is attached by
the PE to both the inner and outer membranes of the formed autophagosome. This process
occurs downstream of and is regulated by the activation of the ATG1/UNC-51 kinase. The
PE conjugated form of LC3/Atg-8 bound to the outer membrane of the maturing
autophagosome is released by removal of the conjugated PE whereas the LC3/Atg-8 bound
to the inner membrane remains as part of the autophagosomes during the fusion with the
lysosome where it is degraded along with the autophagosome and its components marking
the end of the autophagic process.(Huang et al. 2000; Tanida et al. 2005). As a result, it is a
useful marker for the detection of the autophagosomes and the quantification of the levels
of autophagy. C. elegans has two orthologues of LC3/ Atg8, namely LGG-1 and LGG-2
(Meléndez et al. 2003) and a LGG-1::GFP fusion has been used as a marker for autophagy
in C. elegans (Meléndez et al. 2003; Aladzsity et al. 2007). The protein is expressed in a
number of tissues in a diffuse pattern under normal conditions. Upon occasions where
autophagy is required the expression levels of the proteins rise and distinct punctate
structures are formed, corresponding to the autophagosomes carrying LGG-1 on their
membranes (Meléndez et al. 2003; Aladzsity et al. 2007).
Furthermore, it has been previously reported that autophagy is observed in the seam cells
of the C. elegans during its development (Aladzsity et al. 2007). Autophagy has been
shown to play an important role in the early developmental stages as well as the
subsequent developmental stages such as the dauer larva. More specifically mutation in the
autophagy gene bec-1 causes early embryonic death as well as larval arrest (Meléndez et
al. 2003). Additionally, a number of autophagy genes including unc-51 and bec-1 have
been implicated with normal dauer morphogenesis as well as the regulation of normal cell
size and subsequently body size in C. elegans (Meléndez et al. 2003; Aladzsity et al.
2007). Furthermore, the seam cells are known to play an important role in the development
of the animal as well as cuticle biogenesis and the formation of the cuticular structures
such as the alae as discussed previously (Section 1.1.6). It is therefore possible that during
the moult where the seam cells are extremely active in secretion of collagen and other

Anastasios Batas 2017 Chapter 4
120
components of the cuticle, that autophagy might play a role. To investigate the potential
involvement of autophagy in the seam cells during and after moulting, an LGG-1::GFP
fusion protein was used to identify the patterns of the autophagic process in seam cells
through moulting in the vps-45 (tm246) and unc-51 (e369) mutant backgrounds and
identify any deviation from normal patterns. In order to achieve this, a transgenic strain
DA2123 was employed which carries an LGG-1::GFP transgene in an integrated array
together with the rol-6 (su1006) marker which causes a roller (rol) phenotype. This
marker was utilised for easier selection during the crosses to introduce the GFP marker in
the vps-45(tm246) and unc-51(e369) mutant backgrounds. The higher accumulation of the
marker in a diffuse cytoplasmic pattern within cells of certain tissues or at specific
developmental stages could be the results of an increased requirement for autophagy and
thus might potentially help identify specific tissues where increased autophagy is required.
On activation of autophagy the diffuse cellular localised LGG-1::GFP forms discrete
puncta believed to be formed autophagosomes (Meléndez et al. 2003; Aladzsity et al.
2007). This activation is believed to require the function of the Atg1/UNC-51 kinase. The
subsequent disappearance of the marker after a developmental process is completed, in this
case moulting, would suggest that a period of raised rate of autophagy has terminated.
To verify that an observed elevated expression of the LGG-1 marker was indeed in the
seam cells an epithelial junction GFP marker AJM-1::GFP, was utilised. AJM-1 localizes
in the periphery of the of the seam cells and controls the integrity of a distinct apical
subdomain of epithelial junctions in C. elegans (Köppen et al. 2001).
4.2 Introduction of the LGG-1::GFP and AJM-1::GFP markers in unc-51 (e369)
and vps-45 (tm246) backgrounds
To introduce the LGG-1::GFP autophagy marker in the mutant backgrounds of interest,
IA757 and CB369 respectively, were crossed with the DA2123 strain which carries
expressing the LGG-1::GFP transgene. For the construction of the IA888 strain, genotype
adIs2122 [lgg-1p::GFP::lgg-1 rol-6(su1006)]; vps-45 (tm246) X ], 10 DA2123 LGG-
1::GFP males were crossed with a single IA757 hermaphrodite. The success of the cross
was assessed by the ratio of males to hermaphrodites as well as the presence of GFP
expression in the F1 hermaphrodites. The F1 hermaphrodites were transferred clonally to
new plates and were left to egg lay. The F2 worms were transferred clonally and left to lay

Anastasios Batas 2017 Chapter 4
121
eggs for 12 hours. The F2 parents were then lysed for single worm PCR genotyping of vps-
45 and the F3 broods that were derived from homozygotic vps-45 (tm246) parents were
kept.
In order to check the zygosity of the LGG-1::GFP transgene (adIs2122) the F3 broods
were observed under the microscope and scored for 100% GFP expression. The strain
IA888 thus selected is homozygotic for both the vps-45 (tm246) allele and the integrated
adIs2122 transgene. The strain was further checked again for LGG-1:GFP homozygosity
by the phenotype of its progeny, in which case 100% of the progeny demonstrated the
roller phenotype confirming the genotype.
A similar approach was followed for the creation of the IA897 transgenic strain, genotype
adIs2122 [lgg-1p::GFP::lgg-1 rol-6(su1006)]; unc-51 (e369) V ]. In this case however
the UNC phenotype was followed and the same approach with the GFP phenotype of the
progeny was used.
Finally for the construction of the of the IA903 double marker strain, genotype adIs2122
[lgg-1p::GFP::lgg-1 rol-6(su1006)]; jcIs1 [ajm-1::GFP unc-29(+) rol-6(su1006)] IV , 10
SU93, genotype jcIs1 [ajm-1::GFP unc-29(+) rol-6(su1006)] IV , males were crossed
with a single DA2123 hermaphrodite, genotype adIs2122 [lgg-1p::GFP::lgg-1 rol-
6(su1006)]. A ~50% ratio of males to hermaphrodites indicated a successful cross. F1
hermaphrodites were transferred clonally to fresh NGM plates and were left to reproduce.
Animals which exhibited the roller phenotype were selected and were once again clonally
transferred. F2 adult animals were left to egg lay and their progeny was collected as eggs
and observed with fluorescent microscopy. In the case were 100% of the eggs was
expressing both markers the parent and its progeny were kept as the new double marker
IA903 strain.
4.3 LGG-1 accumulates in the seam cells during moulting
LGG-1 localisation was observed and compared in the DA2123, IA888 and IA897 strains
specifically focusing on changes between moulting and non-moulting periods of
development in the three strains. As discussed in detail below, it was observed that LGG-
1::GFP fluorescence increases to high levels in the seam cells (relative to the rest of the
anatomy), and that this accumulation is very dynamic between inter-moult, lethargus and

Anastasios Batas 2017 Chapter 4
122
moulting/post-moult periods. This observation raises the question of a developmentally
regulated involvement of autophagy in cuticle biogenesis or moulting. Seam cells in C.
elegans are localized in the hypodermis, they exhibit stem cell-like features as they have
the ability to continue to divide and give rise to new cells capable of differentiating at each
larval moult [(Sulston & Horvitz 1977; Singh & Sulston 1978) reviewed in (Brabin &
Woollard 2012)]. Furthermore, larval development during the periods of cuticle synthesis
prior to each moult, in periods of development described as lethargus the seam cells are
highly secretory as evident by the formation of a large amount of Golgi bodies and they
appear to be responsible for the secretion of significant quantities cuticular components
(Sulston & Horvitz 1977; Singh & Sulston 1978). Synthesis of cuticular components is not
restricted specifically to the seam cells of the hypodermis, but in the various hypodermal
syncytia also, however high levels of expression of the LGG-1::GFP was observed
specifically within the seam cells and not in the remainder of the hypodermis or in other
tissues.
As discussed above, LGG-1 and its mammalian orthologue LC3 have been used in
multiple studies of autophagy. LGG-1/LC3 is believed to in part drive the maturation
process and LGG-1/LC3- PE proteins bound to the internal part of the autophagosome
membrane remain there during the fusion with the lysosome making it an excellent marker
for the appearance and disappearance of autophagosomes. With the LGG-1::GFP marker,
the generally uniform diffuse cytoplasmic localisation changes and distinct GFP puncta are
observed under conditions where autophagy is believed to be actively induced, these
puncta representing autophagosomes (Aladzsity et al. 2007; Meléndez et al. 2003).
In a preliminary study of the behaviour of the LGG-1::GFP during moulting in seam cells,
synchronised L1 larvae in liquid cultures were obtained and were seeded on NGM plates as
previously described in material methods (section 2.3.6). All strains were cultured on the
NGM petri dishes until they started moulting at which point the were transferred onto
slides to be observed under the high magnification microscope (section 2.3.9). Images
were acquired at several points during the moult, from the onset of lethargus until beyond
ecdysis (Figure 4.1).
The normal wild type pattern of expression of the LGG-1::GFP marker was observed in the
DA2123 strain. An intense accumulation of the LGG-1::GFP in a diffuse localisation
throughout the seam cells was observed at the onset of lethargus at 27 hours post L1 larval
arrest (Figure 4.1). By contrast there is no visible accumulation of LGG-1::GFP before the
onset of lethargus at 24 hours post L1 arrest (Figure 4.1) or even prior to that. The

Anastasios Batas 2017 Chapter 4
123
fluorescence microscopy used here could not rule out a possible low level of expression of
this marker in other tissues or at other developmental times. However, the seam cell
expression during lethargus is very evident and clearly different from anything in the rest
of the animal’s anatomy.)
At ~30 hours post L1 arrest towards the end of the L1 lethargus the seam cells undergo a
cell division (Figure 4.1) and at this time the appearance of the LGG-1::GFP localisation
changed. Whereas earlier in lethargus it is evenly and diffusely distributed throughout the
seam cells, at the end of lethargus when the seam cells can be observed to divide, discrete
foci of LGG-1::GFP become apparent. These foci have previously been proposed to be
autophagosomes. Finally, after 31 hours when the seam cells have divided and the
nematodes have finished the moult and shed their cuticle the LGG-1::GFP is not visible in
the seam cells anymore (Figure 4.1).
Thus the LGG-1::GFP marker is developmentally regulated in at least two distinct ways in
C. elegans development; firstly via changes to its abundance and secondly by its
conversion from a diffuse probably cytoplasmic pattern of localisation into discrete foci. It
accumulates in a homogenous diffuse manner throughout seam cells during the period of
lethargus; this probably represents the unmodified inactive version of the protein. Late in
lethargus when the seam cells divide, it then forms discrete puncta within seam cells,
believed to represent active autophagosomes. Finally, shortly after completion of the moult
the LGG-1::GFP accumulation in seam cells is lost. This is consistent with the completion
of an active period of autophagy specifically in seam cells at the end of a moulting cycle.
This in turn is consistent with the possible involvement of autophagy in some aspect of
cuticle synthesis/moulting. One possible function could be the removal of secretory
apparatus at the end of cuticle synthesis. Cuticle synthesis and moulting in C. elegans is an
example of developmentally regulated protein secretion from the seam cells and other
components of the hypodermis. In the intermoult periods there are relatively low numbers
of Golgi bodies and membranous structures associated with protein secretion in the seam
cells. At the onset of lethargus there is a radical change with extensive accumulation of
Golgi and vesicles which after moulting is complete rapidly disappear (Sulston & Horvitz
1977; Singh & Sulston 1978). Thus, seam cells switch between secretory and non-
secretory phases between each period of lethargus and subsequent inter-moult. Possibly
autophagy has a role in removing secretory apparatus at the end of each moult returning
the cells to their non-secretory phase.

Anastasios Batas 2017 Chapter 4
124
This experiment was repeated with the IA903 strain, which carried both LGG-1::GFP and
AJM-1::GFP to verify that the accumulated LGG-1::GFP is indeed localised in the seam
cells. The pattern was similar to the DA2123 strain. Lethargus started at 25-26 hours of
development after inoculation of the synchronised L1 larvae. At 24 hours before the onset
of lethargus the seam cells show no expression of the LGG-1::GFP marker. At 26 hours
and the onset of lethargus and the moult, the seam cells are expressing the LGG-1::GFP
marker and diffuse GFP is clearly visible in the seam cells. The AJM-1::GFP marker is
clearly visible as it surrounds the seam cells (Figure 4.2).
A similar experiment was conducted using the IA888 and IA897 strains in order to identify
any potential difference in the autophagic process during the moult in vps-45 (tm246) and
unc-51 (e369) mutant backgrounds respectively.
For the vps-45 (tm246) mutant (IA888) a similar absence of LGG-1 accumulation was
observed prior to the onset of lethargus shown at 25 hours of development from L1 arrest
(Figure 4.3). Lethargus started at 29 hours of development (slightly delayed relative to the
wild type) and the LGG-1::GFP marker was observed to accumulate in seam cells at the
onset of lethargus as it did for the wild type strain (Figure 4.3). Once again, a similar
punctate pattern was observed to develop during the seam cell division, which took place
at 35 hours of development post L1 arrest in this strain, compared to 30 hours in the wild
type. Finally, no seam cell expression of the LGG-1::GFP marker was observed after the
end of the moult at 36-37 hours (Figure 4.3). These results suggest that a loss of vps-45
function does not affect the autophagy process in seam cells as assessed with the LGG-
1::GFP marker. Although the moulting period is extended in the mutant vps-45 background
taking on average 8 hours to complete compared to 4 hours in the wild type, the behaviour
of the LGG-1::GFP displays approximately the same relationships to the stage of lethargus
as in the wild type. The loss of vps-45 function delays completion of moulting, the timing
of the seam cell division and the alterations to the accumulation of LGG-1::GFP in a
similar manner and extent. Coordination of these processes is therefore retained.
In the case of the unc-51 (e369) mutant (IA897) strain where, no LGG-1::GFP
accumulation is observed in the seam cells of the animals before the onset of lethargus.
Lethargus started at 29 hours at which point LGG-1 has accumulated in the seam cells
(Figure 4.4) in a similar pattern of accumulation to the two other strains. For the unc-51
mutant the seam cell division was observed at ~31 hours post L1 arrest at which point the
LGG-1::GFP appears predominantly diffuse and with fewer visible punctate foci of GFP
by comparison to the two other strains. At 34 hours at which point the moulting has
Anastasios Batas 2017 Chapter 4
125
completed and the pharyngeal pumping has started, diffuse localisation of LGG-1::GFP
remains visible although less intense than in the previous time points of 29 and 31 hours
(Figure 4.4). Thus while in the wild type the LGG-1::GFP accumulation is lost by one hour
after the seam cell division (and moulting is complete), in the unc-51 mutant moulting
takes approximately three hours post seam cell division to complete and the LGG-1::GFP
although reduced in abundance after 3 hours, is still detectable. Thus LGG-1::GFP in the
unc-51 mutant background is retained longer after seam cell division than in the wild type.
Additionally, in the unc-51 mutant there is also a more visible GFP fluorescence in several
other tissues of the body of the animal than is seen for either the wild type (DA2123) or the
vps-45 mutant (IA888). Thus loss of Atg1/UNC-51 function appears to extend the period
of accumulation of LGG-1::GFP in the seam cells associated with moulting and cause a
general increase in various other tissues, although not to the same levels of normal
accumulation in seam cells during the moult.
Collectively it appears that in all three strains, the seam cells follow the same basic pattern
of inducing expression and accumulation of the LGG-1::GFP autophagy marker during the
moult, and loss of its accumulation at the end of the moulting process. Although the
general pattern is similar, there are specific differences. In the case of the unc-51 mutant
there is a delay to the loss of LGG-1::GFP accumulation within seam cells after moulting
is completed; loss takes approximately 1 hour in the wild type and approximately 3 hours
in the unc-51 mutant as presented in more detail below (section 4.4).

Anastasios Batas 2017 Chapter 4
126
Figure 4.1: UV microscopy DA2123 L1 larvae before (24 hours), during (27 and 30 hours) and after (31
hours) of the L1-L2 moult. 63x
magnification, 200ms exposure. Arrows show the LGG-1::GFP marker being expressed in the seam cells
during the moult. Small foci of GFP can be observed in the seam cells after the accumulation of GFP. Size
bars represent 5μm.
Pre-moult
24 hours
Lethargus/moult onset
27 hours
Seam cell division
30 hours
Post-moult
31 hours

Anastasios Batas 2017 Chapter 4
127
Figure 4.2: UV microscopy of IA903 animals before (24 hours), during (26 and 28 hours) and after (31
hours) the L1-L2 moult. 63x magnification, 200ms exposure. Arrow heads show the epithelial junctions
marked by the AJM-1::GFP marker surrounding the seam cells. Arrows show the LGG-1::GFP marker being
expressed in the seam cells during the moult. Size bars represent 5μm.
Pre-moult
24 hours
Lethargus/moult onset
26 hours
Seam cell division
28 hours
Post-moult
31 hours

Anastasios Batas 2017 Chapter 4
128
Figure 4.3: UV microscopy of IA888 larvae before (25 hours), during (29 and 35 hours) and after (36
hours) of the L1-L2 moult.
63x magnification, 200ms exposure. Arrows show the LGG-1::GFP marker being expressed in the seam cells
during the moult. Small foci of GFP can be observed in the seam cells after the accumulation of GFP.
Pre-moult
25 hours Lethargus/moult onset
29 hours
Seam cell division
35 hours
Post-moult
36 hours

Anastasios Batas 2017 Chapter 4
129
Figure 4.4: UV microscopy of IA897 L1 larvae before (25 hours), during (29 and 31 hours) and after
(34 hours) of the L1-L2 moult.
63x magnification, 200ms exposure. Arrows show the LGG-1::GFP marker being expressed in the seam cells
during the moult.
Pre-moult
25 hours
Lethargus/moult onset
29 hours
Seam cell division
35 hours
Post-moult
36 hours

Anastasios Batas 2017 Chapter 4
130
4.4 Assessment of the retention of the LGG-1 autophagy marker in the seam
cells in vps-45 (tm246) and unc-51 (e369) mutants
In the previous section the expression of the LGG-1::GFP autophagy marker in the seam
cells was observed in the wild type, the vps-45 (tm246) and unc-51 (e369) backgrounds
during the moult, and differences in the timing of patterns of accumulation were identified
(Section 4.3). These are documented in more detail in this section. Differences in the
retention time of LGG-1 protein in in the seam cells of the IA897 and IA888 strains and
the wild type strain post moult, could potentially indicate differences in the autophagic
process, as well as establish a link between VPS-45 and its role in the process if that exists.
To accurately measure this, ten larvae from each strain were put on a single slide each after
being synchronised from the L1 arrest. A 0.5μl of OP50 bacteria was added provide food
for the animals. The slides were kept in a box with moist tissue in order to animals from
dehydrating. It should be noted that sodium azide was not added in the agar pad of the
slides in order to keep the worms active so they could go through the moulting process.
Each slide was observed hourly from the onset of the moult to its end and the time at which
the LGG-1 first started being expressed in the seam cells was noted. The visible marker for
the ending of the moult was the division of the seam cells near the end of the L1-L2 moult.
Slides were observed until LGG-1 was no longer visible in the seam cells.
On average lethargus started at 25.3 hours for the wild type strain, 27.8 hours for IA888,
genotype, adIs2122; vps-45 (tm246) X and 27.6 hours for the IA897, genotype adIs2122;
unc-51 (e369) V. LGG-1 had accumulated in the seam cells in less than an hour from the
onset of lethargus for the wild type strain, at about 1 hour of lethargus for the IA888 and
approximately two hours after lethargus for the IA897. The lethargus process lasted
approximately 4 hours for the wild type strain, from 25.3 to 29.1 hours on average for the
10 animals observed. For IA888 it lasted for approximately 7 hours, from 27.8-35 hours
and for IA897 it lasted for approximately 5 hours, from 27.6 to 32.3 hours which generally
agrees with our data from Chapter 3 regarding the moulting profile of the mutants.
At the end of the moult, at the seam cell division and exit from lethargus, the LGG-1::GFP
marker was visible in the seam cells for approximately an hour in DA2123 and IA888, at
29.1 to 30.4 hours and 35 to 36 hours respectively. By contrast, for the IA897 strain, the
LGG-1::GFP was visible in the seam cells for approximately 3 hours, from 32.3 to 34.8

Anastasios Batas 2017 Chapter 4
131
hours, after the end of seam cells division and the exit from lethargus (Figure 4.5, Table
4.1).
From these results, the evidence suggests that VPS-45 function although required for the
completion of the moult process at a wild type rate, is not required for the normal coupling
of the regulation of LGG-1::GFP accumulation within the seam cells to the process of
lethargus, seam cell division and moulting. By contrast, ATG1/UNC-51 clearly does
influence the normal loss of LGG-1::GFP that occurs at the end of the moult as in the unc-
51 mutant the marker accumulation persists after the moult for at least three times longer
than in the wild type, 3 hours compared to 1 hour. This result is consistent with the
possibility that the rate of activation of the autophagy process in seam cells by
ATG1/UNC-51 kinase positively regulates the rate of removal of LGG-1::GFP from seam
cells at the end of the moult. It is known for LC3 the mammalian orthologue of LGG-1,
that PE-LC1 in the autophagosome is destroyed by a cycle of authophagy. Thus, it is
possible that autophagy itself plays a role in the timely removal of LGG-1 at the end of the
moult.
Strain Sample
Lethargus
(h)
LGG-1 ON
(h)
Seam cells division (END OF
MOULT) (h)
LGG-1
OFF (h)
DA2123 1 24 25 29 30
2 24 25 28 30
3 26 26 29 30
4 25 26 28 29
5 24 25 29 30
6 25 26 29 30
7 25 26 29 30
8 27 28 30 32
9 27 28 30 32
10 26 26 30 31
Average
time (h) 25.3 26.1 29.1 30.4
A)

Anastasios Batas 2017 Chapter 4
132
Strain Sample
Lethargus
(h)
LGG-1 ON
(h)
Seam cells division (END OF
MOULT) (h)
LGG-1
OFF (h)
IA888 1 27 29 35 36
2 28 29 35 36
3 28 29 34 35
4 28 29 35 36
5 27 30 35 36
6 28 29 35 36
7 28 29 35 36
8 28 29 35 36
9 28 29 35 36
10 28 29 36 37
Average
time (h 27.8 29.1 35 36
Table 4.1: Analytical tables of the onset of LGG-1 expression during the moult for individual C.
elegans for each strain.
Four time points were scored for each worm, Onset of lethargus (Lethargus), first observation of LGG-
1::GFP in the seam cells (LGG-1 ON), Seam cell division (END OF MOLT) and the stopping of LGG-
1::GFP expression from the seam cells (LGG-1 OFF). A) DA2123 B) IA888 C) IA897.
Strain Sample
Lethargus
(h)
LGG-1 ON
(h)
Seam cells division (END OF
MOULT) (h)
LGG-1
OFF (h)
IA897 1 27 30 31 34
2 28 30 32 35
3 26 29 31 35
4 28 30 31 34
5 26 29 32 34
6 27 30 32 35
7 28 30 32 34
8 27 30 33 35
9 29 31 33 34
10 30 34 36 38
Average
time (h 27.6 30.3 32.3 34.8
B)
C)

Anastasios Batas 2017 Chapter 4
133
DA
2123
IA888
IA897
0
1
2
3
4
R e te n t io n o f L G G -1 p o s t m o lt
S tra in
Tim
e (
h)
Figure 4.5: Average time of retention of LGG-1 in the seam cells after the end of the moult.
All strains were cultured at 15°C. Average time ±SD is shown for each strain. DA2123 (n=10), IA888
(n=10), IA897 (n=10). Tukey’s multiple comparisons test: DA2123 vs IA888 P= 0.47. DA2123 vs IA897,
P= 0.0002. IA888 vs IA897 P<0.001.
*** ****

Anastasios Batas 2017 Chapter 4
134
4.5 Assessment of the autophagy levels in the seam cells of wild type, vps-45
(tm246) mutant and unc-51 (e369) mutant C. elegans
As discussed in the introduction to this chapter, active involvement of LC3/LGG-1 in an
autophagy cycle involves its accumulation on the membranes of the developing
phagosome and subsequent formed autophagosome. In this form, it appears as intense foci
of fluorescence when coupled to GFP. Data previously presented in Section 4.3 suggest
that in the wild type during the seam cell division near the end of the moult for each animal
more foci are present in the seam cells suggesting a higher level of autophagy at that time.
Therefore, the formation of discrete GFP fluorescent foci in seam cells was observed in the
DA2123, IA888 and IA897 strains for evidence of active autophagy in these cells during
lethargus/moulting. Larvae were observed at the L1-L2 moult. Foci form in all seam cells
in the wild type strain however not all of the seam cells divide at the same time. In order to
determine more accurately when relative to the division the foci are formed and
accumulate the same seam cell was selected and documented for each animal. That was the
first ventral seam cell (V1). The foci were counted in the cells at two stages; in lethargus
before and during V1 seam cell division. During the division, the forming daughter cells
were considered as a single dividing cell sharing the same cytoplasm and
foci/autophagosomes.
The average number of foci during the division in the wild type strain DA2123 was 12.1
foci per cell compared to 3.9 foci per cell before the division, exhibiting a 3-fold increase
during the division. By contrast, the IA888 strain, genotype adIs2122; vps-45 (tm246) X,
exhibited higher numbers of foci than the wild type before the seam cells division with an
average number of 5.7 foci per cell (Figure 4.6). A modest increase in the foci at the seam
cell division of IA888 animals was observed which however, was lower compared to the
number in the dividing wild type seam cells with an average number of 7.5 foci per seam
cell. For the IA897 strain, genotype adIs2122; unc-51 (e369) V, the number of foci
remained low and very similar both prior and during the division of the seam cells as
opposed to IA888 and DA2123 strain with an average number of 2 foci both before and
during the division of the seam cells (Figure 4.6). (As discussed below it is possible that a
proportion of GFP foci represent artefactual aggregation of GFP and not autophagosomes.)
The data indicate that in the DA2123 strain, LGG-1::GFP accumulation is induced in the
seam cells as C. elegans enter lethargus, at the beginning of the moult. However, a limited

Anastasios Batas 2017 Chapter 4
135
number of punctate GFP foci are formed at this point suggesting a lower rate of autophagy
compared to during seam cell division. As the larvae approach the end of the moult the
seam cells divide and at this time a significant increase in the numbers of LGG-1::GFP foci
was observed, consistent with an increase in the numbers of autophagosomes. This
coincides with the completion of a period of secretion and cuticle synthesis. An obvious
possibility is that autophagy is required for the clearance of secretory apparatus formed for
the secretion of the cuticle as previously discussed, and the return of these cells to the
inter-moult non-secretory phase (Chapter 3).
In the case of IA888 strain, which carries the vps-45 (tm246) mutation, key differences are
observed in that pattern. A higher number of LGG-1::GFP foci were observed in the seam
cells at earlier stages of lethargus prior to the seam cell division than in the wild type. The
level of increase at the division was slightly less than observed in the wild type. This is
consistent with possibly a more continuous and elevated level of autophagy throughout the
cuticle synthesis process in lethargus when VPS-45 is absent. VPS-45 plays an important
role in the fidelity of correct vesicle targeting and fusion within the endosomal system
(Cowles et al. 1994; Piper et al. 1994; Carr & Rizo 2010; Dulubova et al. 2002). One
consequence of the loss of VPS-45 function is an increase in the rate of aberrant and
inappropriate membrane fusions resulting in perturbed delivery of cargo and thus the
accumulation of aberrant membranes producing ER stress (P. Stepensky et al. 2013) which
might also induce autophagy.
A)
DA
2123
DA
2123 d
ivis
ion
IA888
IA888 d
ivis
ion
IA897
IA897 d
ivis
ion
0
5
1 0
1 5
2 0
s tra in
Av
era
ge
nu
mb
er
of
foc
i/ c
yto
pla
sm
ic v
olu
me

Anastasios Batas 2017 Chapter 4
136
Figure 4.6: Level of autophagy in the seam cells in DA2123, IA888 and IA897 animals.
A) Average number of autophagic foci per cell/dividing cell (±SD) DA2123, IA888 and IA897 L1-L2
molting animals. DA2123 (n=37), DA2123 division (n=25), IA888 (n=71), IA888 (n=33), IA897 (n=43),
IA897 division (n=27) DA2123 vs DA2123 division, P<0.0001. DA2123 vs IA888, P=0.0321. DA2123 vs
IA888, P<0.0001. DA2123 vs IA897 P=0.0531, DA2123 division vs IA897 P=0.1315, DA2123 division vs
IA888 P<0.0001, DA2123 division vs IA888 division P<0.0001, DA2123 division vs IA897 division
P<0.0001, IA888 vs IA888 division P=0.0449, IA888 vs IA897 P<0.001, IA888 vs IA897 division P<0.001,
IA888 division vs IA897 P<0.001, IA888 division vs IA897 division P<0.001, IA897 vs IA897 division
P>0.9999. B-G) Representative images (UV) of V1 seam cells of L1-L2 moulting animals before and during
the division. White arrows point to the autophagy foci of LGG-1::GFP.
DA2123 IA888 IA897
B) F) D)
C) E) G)

Anastasios Batas 2017 Chapter 4
137
As presented in Chapter 3 (Section 3.9) the C. elegans vps-45 mutant takes longer to
proceed through cuticle synthesis/lethargus than the wild type and thus the process is
working less quickly than in the wild type. Here evidence is presented for a higher level of
autophagy in seam cells during the earlier stages of lethargus (as opposed to just at the end
of lethargus when seam cells divide) in the vps-45 (tm246) mutant (Figure 4.6). Data are
consistent with a higher level of autophagy throughout lethargus when VPS-45 is absent,
rather than a rapid induction at the end of lethargus. One possibility is that elevated rates
of autophagy throughout lethargus occurs to remove membrane organelles that have had
inappropriate vesicle fusions during cuticle synthesis and this may also be the reason for
the increased time taken to complete cuticle synthesis/lethargus. It is not clear why the
level of increase in LGG-1::GFP autophagic foci going from early lethargus and into the
seam cell division at the end of moulting is less in the vps-45 mutant than the wild type.
In interpreting these data, the possibility that some of the visible “foci” of fluorescence are
in fact artefactual aggregates of GFP and not autophagosomes should be considered.
Previous studies have shown that mouse embryonic fibroblast (MEF) cells transiently
overexpressing the autophagy marker GFP::LC3, (LC3 being the mammalian homologue
of LGG-1), form artefactual GFP aggregates especially when autophagy was
compromised. These aggregates cannot be discerned from real autophagosomes by
fluorescent microscopy (Kuma et al. 2007). Since the Atg1/UNC-51 kinase is central to
induction of autophagy, the difference in behaviours of the wild type and the unc-51
mutant strains is most compelling. While the unc-51 mutant had an average of 2 foci
before seam cell division and during seam cell division, the wild type had 3.9 versus 12.1
respectively. The dynamic change in number of foci from before seam cell division to
during division in wild type is consistent with an active induction of autophagy (and not
GFP artefact). That this induction is totally absent in the unc-51 mutant is the strongest
evidence that this a real measure of a developmentally regulated increase in autophagy
towards the end of lethargus at the time of seam cell division. That there is no increase in
the number of foci in the unc-51 mutant (on average 2 foci before seam cell division and
during seam cell division), suggests that the induction in wild type is entirely dependent on
Atg1/UNC-51 function and that the unc-51 (e369) allele is with respect to this function
either a null allele or is of too limited function to detect by this assay. It is therefore
possible that the small number of foci visible in the unc-51 (e369) mutant are in fact GFP
artefacts. By contrast, the increase in foci from lethargus pre-seam cell division to during
seam cell division that is unc-51 dependant most likely is a measure of a genuine increase
in autophagy. Interestingly, while the vps-45 (tm246) mutant takes approximately twice as
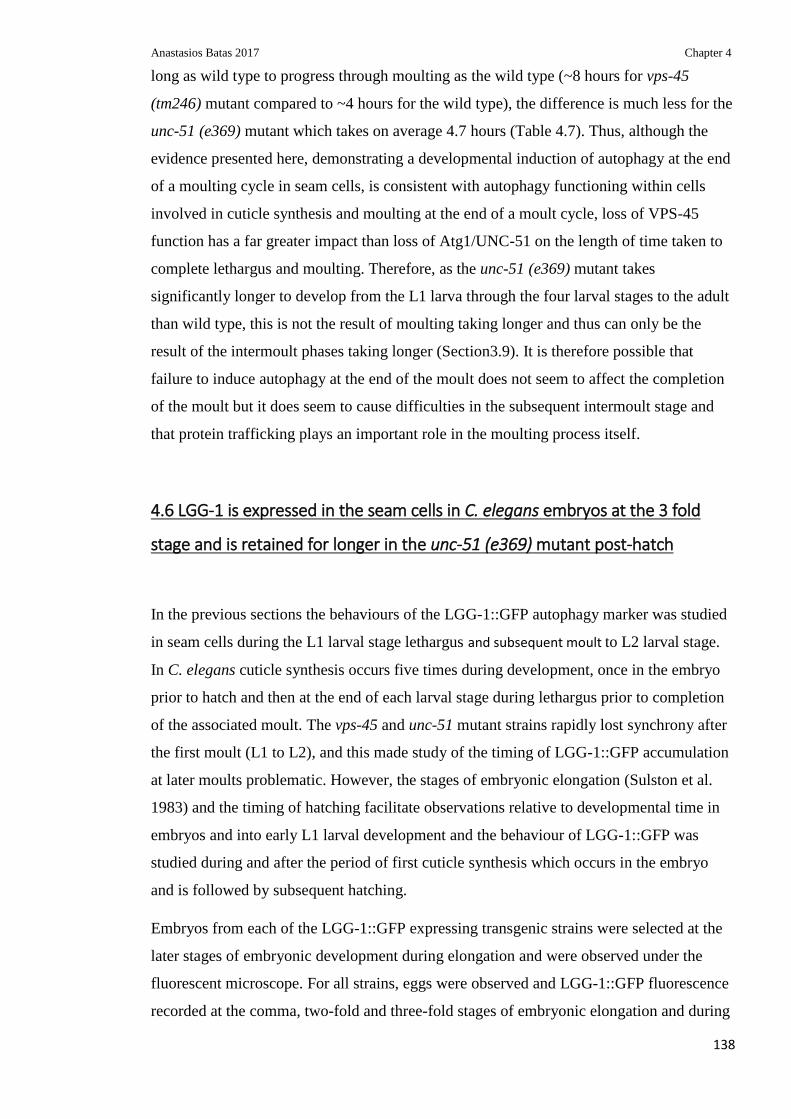
Anastasios Batas 2017 Chapter 4
138
long as wild type to progress through moulting as the wild type (~8 hours for vps-45
(tm246) mutant compared to ~4 hours for the wild type), the difference is much less for the
unc-51 (e369) mutant which takes on average 4.7 hours (Table 4.7). Thus, although the
evidence presented here, demonstrating a developmental induction of autophagy at the end
of a moulting cycle in seam cells, is consistent with autophagy functioning within cells
involved in cuticle synthesis and moulting at the end of a moult cycle, loss of VPS-45
function has a far greater impact than loss of Atg1/UNC-51 on the length of time taken to
complete lethargus and moulting. Therefore, as the unc-51 (e369) mutant takes
significantly longer to develop from the L1 larva through the four larval stages to the adult
than wild type, this is not the result of moulting taking longer and thus can only be the
result of the intermoult phases taking longer (Section3.9). It is therefore possible that
failure to induce autophagy at the end of the moult does not seem to affect the completion
of the moult but it does seem to cause difficulties in the subsequent intermoult stage and
that protein trafficking plays an important role in the moulting process itself.
4.6 LGG-1 is expressed in the seam cells in C. elegans embryos at the 3 fold
stage and is retained for longer in the unc-51 (e369) mutant post-hatch
In the previous sections the behaviours of the LGG-1::GFP autophagy marker was studied
in seam cells during the L1 larval stage lethargus and subsequent moult to L2 larval stage.
In C. elegans cuticle synthesis occurs five times during development, once in the embryo
prior to hatch and then at the end of each larval stage during lethargus prior to completion
of the associated moult. The vps-45 and unc-51 mutant strains rapidly lost synchrony after
the first moult (L1 to L2), and this made study of the timing of LGG-1::GFP accumulation
at later moults problematic. However, the stages of embryonic elongation (Sulston et al.
1983) and the timing of hatching facilitate observations relative to developmental time in
embryos and into early L1 larval development and the behaviour of LGG-1::GFP was
studied during and after the period of first cuticle synthesis which occurs in the embryo
and is followed by subsequent hatching.
Embryos from each of the LGG-1::GFP expressing transgenic strains were selected at the
later stages of embryonic development during elongation and were observed under the
fluorescent microscope. For all strains, eggs were observed and LGG-1::GFP fluorescence
recorded at the comma, two-fold and three-fold stages of embryonic elongation and during

Anastasios Batas 2017 Chapter 4
139
hatching. Eggs were randomly picked and were documented and observed at the
appropriate developmental stage. For observations during hatching, embryos were picked
at the 3-fold stage and were observed until hatching occurred at which point their images
were taken. These observations cover the period of cuticle secretion and synthesis during
embryogenesis, analogous to the cuticle synthesis that occurs subsequently at the end of
each larval stage during lethargus. In L1 development, the seam cells undergo their first
post embryonic division at approximately 5 hours after hatch (Shemer & Podbilewicz
2000; Podbilewicz & White 1994). For observations of the post-hatch LGG-1::GFP
behaviour, this seam cell division was observed and used as a developmental time marker.
This provides a consistent time point after completion of embryonic cuticle synthesis and
before the L1 to L2 lethargus when the second period of cuticle synthesis occurs.
The accumulation of LGG-1::GFP in embryos in the wild type background was observed.
using the DA2123. It is evident that fluorescence is generally diffuse in the comma and
two-fold stage, and is very clearly expressed in the seam cells at the three-fold stage
(Figures 4.7). The IA903 strain, genotype adIs2122 [lgg-1p::GFP::lgg-1 rol-6(su1006)];
jcIs1 [ajm-1::GFP unc-29(+) rol-6(su1006)] IV, was utilised once more to verify that
LGG-1::GFP was indeed being expressed at higher levels in the seam cells (Figure 4.8). It
is interesting and consistent with the previous data for the L1 to L2 moult that the LGG-1
accumulates in the seam cells during periods of cuticle synthesis, and not simply during
post-embryonic moulting. Furthermore, right at the point of hatch the LGG-1::GFP marker
can no longer be seen in the seam cells suggesting that after the L1 larval cuticle has been
synthesised in the embryo, that the autophagy marker is rapidly degraded and that a cycle
of autophagy associated with secretion of this cuticle has completed (Figure 4.7H and
Figure 4.8K, L).
A similar pattern was observed during the embryonic development of the vps-45 mutant
IA888 strain. LGG-1 appears to be expressed in many tissues during the coma and two-
fold stages of development, and it appears to be accumulating to higher levels in the seam
cells once the embryo reaches the three-fold stage (Figure 4.9). It also appears that
embryos from this mutant have higher levels of GFP overall in all stages. The GFP
fluorescence is rapidly lost, once again, at the moment of hatching (Figure 4.9H).
Finally, in the case of the IA897 strain the overall levels of fluorescence were much higher
than the other two strains. In this case to properly visualise the seam cell expression the
exposure time was reduced by half from 200ms to 100ms. In a similar way to the previous
strains, LGG-1::GFP accumulated to its highest levels in the three-fold stage. However, in

Anastasios Batas 2017 Chapter 4
140
addition to the seam cell expression there is a general GFP fluorescence in other cells
throughout much of the anatomy of the animal visible easily from the comma stage (and
earlier, not shown). These cells were not formally identified but probably include other
cells of the hypodermis (Figure 4.10). Additionally, after the eggs hatched the LGG-
1::GFP did not quickly disappear but persisted for a time. Seam cells were clearly visible
as the worm was exiting the egg shell, and the LGG-1::GFP marker could also be detected
throughout the body of the animal (Figure 4.10H).
The results clearly indicate the accumulation of the LGG-1::GFP autophagy marker in the
hypodermal seam cells at the three-fold stage in all strains. LGG-1::GFP is no longer
detectable in the fluorescence microscopy used after the embryos hatch in both the wild
type strain and vps-45 (tm246) mutant but is retained for longer in the unc-51 (e369)
mutant strain post hatch. This is similar to its post-moult retention in larvae (section 4.4).
Thus the activity of the Atg-1/UNC-51 kinase is required for the normal loss of the LGG-
1::GFP autophagy marker immediately after cuticle synthesis (in the egg prior to hatch and
after synthesis of the L2 cuticle at the L1 to L2 moult). These results are consistent with
the hypothesis that cycles of autophagy degrade the autophagy marker LGG-1::GFP, and
most likely normal LGG-1 also, at these developmental times. This strongly implicates a
developmental cycle of autophagy being involved in converting the highly secretory seam
cells during cuticle synthetic phases to their quiescent non-secretory forms in between
cuticle synthesis phases.
Furthermore, it appears that vps-45 (tm246) and unc-51 (e369) mutants exhibit higher
levels of expression than the wild type strain with the later one exhibiting the highest
expression, something which is further investigated below (Section 4.8).

141
Figure 4.7: Representative images of DIC and UV (200ms) images of coma stage, two-fold and three-fold stage embryos along with hatching embryos of DA2123[adIs2122 [lgg-
1p::GFP::lgg-1 rol-6(su1006)]] strain. 63x magnification. White arrows point to the seam cells. Scale bars represent 5μm.
B) D) F) H)
A) C) E) G)

142
.
Figure 4.8: Representative images of DIC and UV (200ms) images of coma stage, two-fold and three-fold stage embryos along with hatching embryos of wild type IA903
[adIs2122 [lgg-1p::GFP::lgg-1 rol-6(su1006)]; jcIs1 [ajm-1::GFP unc-29(+) rol-6(su1006)] IV ]strain. 63x magnification. Two focal points are shown. One focusing on the LGG-
1::GFP marker (B,E,H,K) and one on the junctions visualised by the AJM-1::GFP marker (C,F,I,L).White arrows point to the AJM-1::GFP localising at the periphery of the seam cells.
Arrow heads point to the LGG-1::GFP expressed in the cytoplasm of seam cells. Scale bars represent 5μm
L)
B) E) H) K)
C) F) I)
A) D
)
G) J)

143
Figure 4.9: Representative images of DIC and UV (200ms) images of coma stage, two-fold and three-fold stage embryos along with hatching embryos of IA888 [adIs2122 [lgg-
1p::GFP::lgg-1 rol-6(su1006)]; vps-45 (tm246) X] strain. 63x magnification. White arrows point to the seam cells. Scale bars represent 5μm.
B) D) F) H)
A) C) E) G)

144
Figure 4.10: Representative images of DIC and UV (200ms & 100ms exposure) images of coma stage, two-fold and three-fold stage embryos along with hatching embryos of
IA897 [adIs2122 [lgg-1p::GFP::lgg-1 rol-6(su1006)]; unc-51 (e369) V] strain. 63x magnification. White arrows point to the seam cells. Scale bars represent 5μm.
B) E) H) K)
C) F) I) L)
A) D) G) J)

Anastasios Batas 2017 Chapter 4
145
4.7 LGG-1 expression in the seam cells and seam cell division are two distinct
processes
In order to verify that autophagy in the seam cells is not induced as a result of the cell
division and is associated with moult and the secretion of the cuticle, newly hatched L1
larvae were observed before the moult at the first seam cell division post hatch. DA2123,
genotype adIs2122 [lgg-1p::GFP::lgg-1 rol-6(su1006)], SU93, genotype jcIs1 [ajm-
1::GFP unc-29(+) rol-6(su1006)] IV and IA903, genotype adIs2122 [lgg-1p::GFP::lgg-1
rol-6(su1006)]; jcIs1 [ajm-1::GFP unc-29(+) rol-6(su1006)] IV, embryos were picked at
the three-fold stage, and were observed under the microscope until they hatched. Newly
hatched animals were transferred clonally on NGM plates and five hours later were
observed under the microscope. At this point the seam cells are undergoing their first
division post hatch (Podbilewicz & White 1994; Shemer & Podbilewicz 2000). It was easy
to visualise the dividing seam cells utilising the AJM-1::GFP marker. In all cases the LGG-
1::GFP protein was never observed in the seam cells either in the DA2123 strain or the
double marker IA903 strain. Consequently, the seam cell division and the LGG-1
accumulation during the C. elegans moult are two distinct processes (Figure 4.11).

Anastasios Batas 2017 Chapter 4
146
Figure 4.11: DIC and UV images of L1 larvae seam cells, 5 hours post hatching.
White arrow point to the dividing seam cells. A-B) DA2123[adIs2122 [lgg-1p::GFP::lgg-1 rol-6(su1006)]]
strain C-D) SU93 [jcIs1 [ajm-1::GFP unc-29(+) rol-6(su1006)] IV ] strain E-F) IA903 [adIs2122 [lgg-
1p::GFP::lgg-1 rol-6(su1006)]; jcIs1 [ajm-1::GFP unc-29(+) rol-6(su1006)] IV ] strain. Scale bars
represent 5μm.
E) F)
C) D)
A) B)
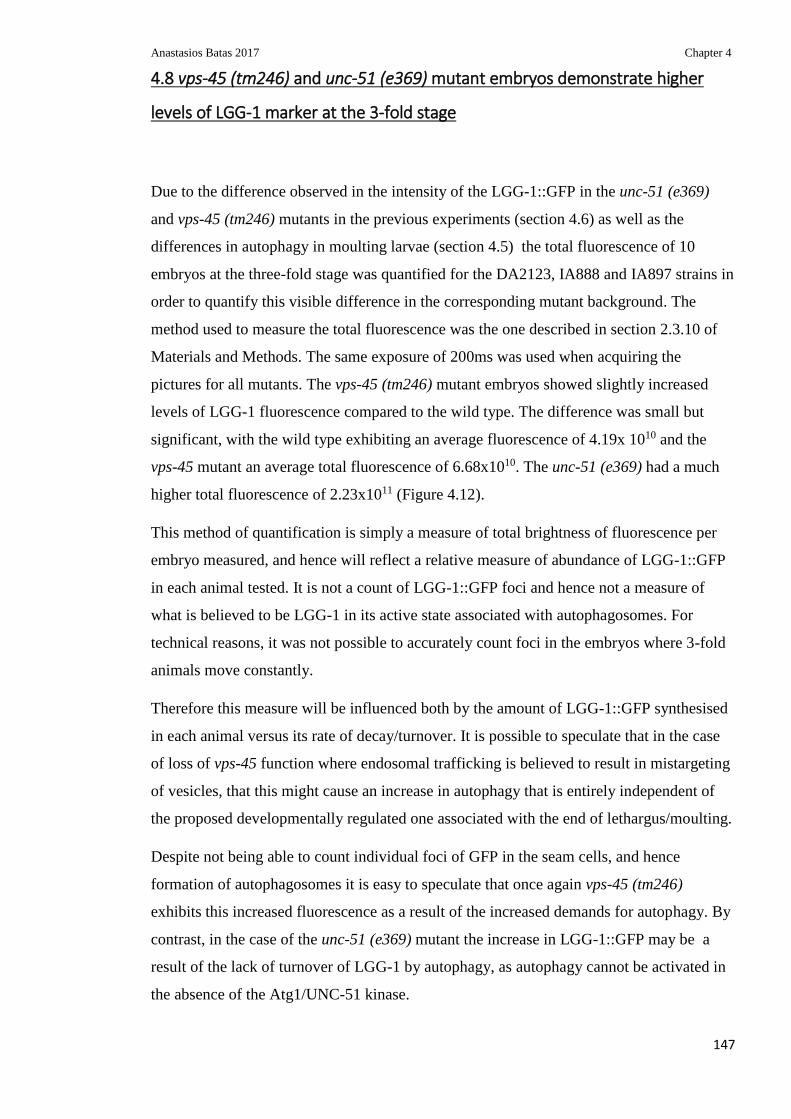
Anastasios Batas 2017 Chapter 4
147
4.8 vps-45 (tm246) and unc-51 (e369) mutant embryos demonstrate higher
levels of LGG-1 marker at the 3-fold stage
Due to the difference observed in the intensity of the LGG-1::GFP in the unc-51 (e369)
and vps-45 (tm246) mutants in the previous experiments (section 4.6) as well as the
differences in autophagy in moulting larvae (section 4.5) the total fluorescence of 10
embryos at the three-fold stage was quantified for the DA2123, IA888 and IA897 strains in
order to quantify this visible difference in the corresponding mutant background. The
method used to measure the total fluorescence was the one described in section 2.3.10 of
Materials and Methods. The same exposure of 200ms was used when acquiring the
pictures for all mutants. The vps-45 (tm246) mutant embryos showed slightly increased
levels of LGG-1 fluorescence compared to the wild type. The difference was small but
significant, with the wild type exhibiting an average fluorescence of 4.19x 10¹⁰ and the
vps-45 mutant an average total fluorescence of 6.68x10¹⁰. The unc-51 (e369) had a much
higher total fluorescence of 2.23x10¹¹ (Figure 4.12).
This method of quantification is simply a measure of total brightness of fluorescence per
embryo measured, and hence will reflect a relative measure of abundance of LGG-1::GFP
in each animal tested. It is not a count of LGG-1::GFP foci and hence not a measure of
what is believed to be LGG-1 in its active state associated with autophagosomes. For
technical reasons, it was not possible to accurately count foci in the embryos where 3-fold
animals move constantly.
Therefore this measure will be influenced both by the amount of LGG-1::GFP synthesised
in each animal versus its rate of decay/turnover. It is possible to speculate that in the case
of loss of vps-45 function where endosomal trafficking is believed to result in mistargeting
of vesicles, that this might cause an increase in autophagy that is entirely independent of
the proposed developmentally regulated one associated with the end of lethargus/moulting.
Despite not being able to count individual foci of GFP in the seam cells, and hence
formation of autophagosomes it is easy to speculate that once again vps-45 (tm246)
exhibits this increased fluorescence as a result of the increased demands for autophagy. By
contrast, in the case of the unc-51 (e369) mutant the increase in LGG-1::GFP may be a
result of the lack of turnover of LGG-1 by autophagy, as autophagy cannot be activated in
the absence of the Atg1/UNC-51 kinase.

Anastasios Batas 2017 Chapter 4
148
DA
2123
IA888
IA897
0
11 0 1 1
21 0 1 1
31 0 1 1
41 0 1 1
L G G -1 ::G F P e x p re s s io n in 3 - fo ld e m b ry o s
s tra in
To
tal
flu
re
se
nc
e
Figure 4.12: Total levels of LGG-1::GFP in 3 fold DA213, IA888 and IA897 embryos
A) Average total fluorescence (±SD) in DA2123[adIs2122 [lgg-1p::GFP::lgg-1 rol-6(su1006)]], IA888
[adIs2122 [lgg-1p::GFP::lgg-1 rol-6(su1006)]; vps-45 (tm246) X] and IA897 [adIs2122 [lgg-
1p::GFP::lgg-1 rol-6(su1006)]; unc-51 (e369) V] three-fold stage LGG-1::GFP :transgenic embryos.
DA2123 (n=27), IA888 (n=31), IA897 (n=16). Tukey’s multiple comparisons test: DA2123 vs IA888 P=
0.0474. DA2123 vs IA897, P<0.001. IA888 vs IA897 P<0.001. B-C) Representative images (UV, DIC) of
***
*
A)
B)
C)
D)
E)
F)
G)

Anastasios Batas 2017 Chapter 4
149
DA2123 three-fold stage embryos 63x, 200ms. D-E) Representative images (UV, DIC) of IA888 three-fold
stage embryos 63x, 200ms. F-G) Representative images (UV, DIC) of IA897 three-fold stage embryos 63x,
200ms. Scale bar represent 100μm.
4.9 vps-45 (tm246) and unc-51 (e369) mutants exhibit higher levels of
expression of the LGG-1 protein outside of the moult
To assess the levels of LGG-1::GFP in animals carrying the vps-45 (tm246) and unc-51
(369) mutant alleles outside of the lethargus/cuticle synthesis phases, the total body
fluorescence of adult animals was measured (described in section 2.3.10) in the adult stage
when all cuticle synthetic phases have terminated. Thus it is expected that any fluorescence
will come from the LGG-1::GFP marker not associated with moulting and cuticle
synthesis.
Measurements indicate that there is higher fluorescence in the vps-45 and the unc-51
mutants compared to the wild type. The vps-45 (tm246) mutant (IA888) had an average
total fluorescence per area of 19.98 compared to 18.77 of the wild type (DA2123), a small
but significant difference. The unc-51 (e369) mutant (IA897) on the other hand showed
much higher levels of fluorescence at 37.57 (Figure 4.13).
The data presented above suggest that the vps-45 and unc-51 mutants express LGG-1 at
higher levels compared to the wild type strain across a variety of tissues in their bodies
after cessation of the repeating moulting cycles. Therefore, any expression of the LGG-1
marker and possibility autophagy, is not a result of the moulting process in this case.
However, as previously discussed higher levels of LGG-1 do not necessarily indicate
higher levels of autophagy (section 4.5). Therefore, it is possible that vps-45 (tm246)
mutant exhibits higher levels of the LGG-1 protein (compared to the wild type) due to the
higher requirements for autophagy to clear the aberrant membranes that are accumulating
due to the defective endosomal trafficking which result in the accumulation of aberrant
proteins that require the autophagic mechanism to clear them. The unc-51 (e369) mutant
on the other hand, has high levels of diffuse protein which should correspond to the non-
PE conjugated form of the protein that does not take part in the formation of the
autophagosomes. It is therefore easy to conclude that there is a very low utilisation of the
LGG-1 protein which does not get incorporated into autophagosomes and consequently,
does not get degraded. This non-degraded LGG-1 remains in a diffuse state in several
Anastasios Batas 2017 Chapter 4
150
tissues of the animals. Therefore, in the case of the LGG-1::GFP marker, it results in
higher body fluorescence in the autophagy defective unc-51 mutants This is further
supported by the results previously presented for unc-51 (e369) embryos (section 4.9) and
the very reduced number of GFP foci in the seam cells of the same mutants during the molt
(section 4.5).
DA
2123
IA888
IA897
0
2 0
4 0
6 0
L G G -1 ::G F P in a d u lt a n im a ls
s tra in
GF
P e
xp
re
ss
ion
pe
r a
re
a
****
*
B)
A)
E)
F)
C)
D)
G)
B)

Anastasios Batas 2017 Chapter 4
151
Figure 4.13: Overall levels of LGG-1::GFP in N2, IA888 and IA897 adult C. elegans.
A) Average GFP expression per area of animal body (±SD) in young. DA2123 (n=38), IA888 (n=45) and
IA897 (n=47) animals. Tukey’s multiple comparisons test: DA2123 vs IA888 P= 0.0434. DA2123 vs IA897,
P<0.001. IA888 vs IA897 P<0.001. B-C) Representative images (UV, DIC) of DA2123 adult worm 63x,
200ms. D-E) Representative images (UV, DIC) of IA888 adult worm 63x, 200ms. F-G) Representative
images (UV, DIC) of IA897 adult worm 63x, 200ms. Scale bar represent 100μm (Previous page).
4.10 Chapter summary
In this chapter, a period of developmentally regulated autophagy associated with molting
was identified in C.elegans. An increased expression of the LGG-1::GFP marker was
identified in the seam cells, which are associated with the secretion of cuticular structures,
during the moult (Section 4.3) and at the late stages of embryogenesis at the first secretion
of the cuticle (Section 4.6). Autophagy appeared to be taking place near the end of the
moult, supporting the idea for its requirement for the removal excessive membranes and
secretory structures at the end of the highly secretory phase of the cells involved in the
secretion of cuticular components (Singh & Sulston 1978). This was further supported by
the fact that the Atg1/UNC-51 kinase is required for the developmental upregulation of
autophagy in the seam cells at the later stages of the moult.
Interestingly, the unc-51 mutant take 36 hours longer than wild type to proceed through
four larval stages (Section 3.9) and associated moults to reach adult than the wild type.
However, the moults only take at the most 1 hour longer that the wild type strain (Section
3.9, 4.3, 4.4), and hence most of that increase must be a result of the inter-moults lasting
longer. This might fit with secretion of the new cuticle at each lethargus working almost
normally, however a failure to clear out the secretory organelles etc. at the end of each
secretory moult is perhaps hindering passage through the next non-secretory intermoult
phase.
On the other hand, it was demonstrated vps-45 (tm246) mutants which are defective for
endosomal trafficking do not exhibit defects in the onset of autophagy during the moulting
process. However, higher levels of autophagy where observed in these mutants (Section
4.4), suggesting that autophagy acts as the homeostatic mechanism for the clearance of
aberrant membranes resulting from defective membrane fusions in the endosomal system.
Furthermore, it was shown that vps-45 mutants require approximately 8 hours to go

Anastasios Batas 2017 Chapter 4
152
through the moult compared to approximately 4 hours for the wild type strain (Section
4.4), and according to previous data longer intermoult periods as well, however not to the
same extend as the unc-51 (e369) mutants (Section 3.9) providing evidence for the
requirement of the endosomal system predominantly for the regulation of moulting
duration and secondly for the intermoult periods. Thus, although both the vps-45 and unc-
51 mutants extend time taken for C. elegans to progress through larval development, loss
of vps-45 function primarily extends lethargus while loss of unc-51 function primarily
extends inter-moult periods.

Anastasios Batas 2017 Chapter 5
153
Chapter 5: Investigating oxidative imbalances and resistance to
oxidative stress in unc-51 (e369) and vps-45 (tm246) mutants
5.1 Overview and aims
Fibroblasts, bone marrow and neutrophils from patients carrying the homozygous T224N
mutation in human VPS45 exhibit accelerated rates of apoptosis (Stepensky et al., 2013;
Vilboux et al., 2013). The low cellular levels of human Vps45 bearing the T224N mutation
(Vilboux et al., 2013) may directly result in perturbed delivery of protein cargo from the
TGN to the endosomal pathway. Stepensky and colleagues (P Stepensky et al. 2013)
suggested that, similar to the ELANE and G6PC3 variants of congenital neutropenia (Grenda
et al. 2007; Boztug et al. 2009), Vps45 T224N may induce a block in the earlier secretory
pathway, which in turn may lead to overwhelming endoplasmic reticulum (ER) stress and
subsequent apoptosis. Hydrogen peroxide (H2O2) has previously been shown to induce ER
stress and subsequent apoptosis in S.cerevisiae as a direct result of reactive oxygen species
(ROS) accumulation (Madeo et al. 1999). Yeast cells harboring the analogous mutation in
Vps45 (T238N) also exhibit increased apoptosis after exposure to H2O2 (Cowan 2014).
This potentially identifies a previously uncharacterised phenotype of Vps45, which is
consistent with the apoptotic phenotype observed in neutrophil and fibroblast cells of
patients affected by the Vps45 T224N variant of congenital neutropenia (P Stepensky et al.
2013; Vilboux et al. 2013). This apoptotic phenotype is not directly associated with the
vacuolar protein sorting phenotype previously described for vps mutants (Cowles et al.
1994; Piper et al. 1994), it may however be a result of ER stress and by extension
oxidative stress, as a result of aberrant vesicles accumulating as a result of defective
membrane fusions (P. Stepensky et al. 2013). The mechanism by which Vps45 deficient
mammalian cells and yeast expressing Vps45 T238N give rise to increased H2O2
sensitivity remains unclear, however it could be a result of the above mentioned oxidative
stress. To obtain a better understanding of this increased sensitivity to oxidative stress in
vps-45 deficient cells and the underlying mechanism, C. elegans was employed as a
multicellular system to study how vps-45 (tm246) mutant animals lacking a functional
Vps45 protein react to oxidative stress. In this study a redox sensitive ER marker and three

Anastasios Batas 2017 Chapter 5
154
well established oxidative stress GFP markers were used. Because of the genetic
interaction (synthetic lethality) presented previously in Chapter 3 describing the unc-51
(e369) V; vps-45 (tm246) X double mutant, the unc-51(369) single mutant was also
assessed for oxidative stress sensitivity and redox imbalances in the ER. Although the
exact reason for synthetic lethality has not been identified, if loss of Vps45 causes defects
in vesicle trafficking with aberrant targeting of vesicles from the TGN to the endosomal
pathway, the synthetic lethality when ATG1/UNC-51 is also mutated could suggest that
autophagy plays a critical role in viability of Vps45 mutant cells. It may be essential to
remove and recycle components of the TGN, endosomes or ER where an excessive build-
up of the wrong cargo has occurred in Vps45 mutants. Indeed, it is possible that autophagy
plays a homeostatic role in the TGN/secretory system even in wild type cells. If so, loss of
autophagy, particularly in highly secretory cells like neutrophils and C. elegans seam cells
during cuticle synthesis, could potentially result in similar ER stresses and by extension
oxidative stress, to that theorised to exist in neutrophil cells and previously suggested in S.
cerevisiae (Cowan 2014) under loss of Vps45 function.
The synthetic lethality effect observed by the double mutant could potentially indicate the
involvement of both vps-45 and unc-51 in the same broad cellular process and maintenance
of a healthy secretory/TGN membranous network system would be an obvious possibility.
Consistent with this suggestion, loss of Tlg2 function, which is the binding partner of
Vps45, has previously been implicated with autophagy and more specifically in the
recruitment of ATG9 to the PAS in yeast (Noda et al. 2000; Ohashi & Munro 2010; Nair et
al. 2011).
Potential imbalances in the ER of the vps-45 (tm246) mutant, most likely towards an
oxidised state could possibly address the sensitivity of S. cerevisiae to H2O2 derived
oxidative stress (Cowan, 2014) and enforce the idea that neutrophil cells with a defective
VPS-45 protein undergo apoptosis as a result of oxidative stress. Additionally,
identification of similar oxidative sensitivity and/or imbalances in the unc-51 (e369)
mutant could explain in part the synthetic lethality and developmental arrest of the double
mutant as a result of an additive sensitivity. Finally, previously presented data (Section 3.9)
indicate that both mutants exhibited a shorter lifespan compared to wild type strain, also
possibly resulting from an oxidised state in the cells of the mutants.
Anastasios Batas 2017 Chapter 5
155
5.2 The roGFP ER3 marker and its introduction in the vps-45 (tm246) and unc-
51 (e369) mutant backgrounds
Previous work in our lab showed that yeast Vps45 mutants are more sensitive to oxidative
stress (Cowan, 2014). An existing collaboration within our College was researching
oxidative stress within the ER in C. elegans using a redox-sensitive GFP (roGFP) that was
targeted to the ER. It was decided to make use of a reduction-oxidation sensitive green
fluorescent protein marker (roGFP) to test for ER redox imbalance in both the vps-45 and
unc-51 mutant C. elegans.
A roGFP marker is a redox sensitive biosensor which has two cysteine residues into the
beta barrel structure of the GFP. This cysteine residues can form a reversible disulphide
bridge, depending on the oxidation state, which alters the conformation of the protein and
by extension alters the emission spectra of the protein (Hanson et al. 2004; Lohman &
Remington 2008). The ratio of the emissions from these excitations at 390nm and 460nm
(390:460) determines whether the environment is oxidising (higher ratio) or reducing
(lower ratio) (van Lith et al., 2011).
In this study a variant of this marker, roGFP ER3 was used, provided by Prof. Tony Page
(University of Glasgow). The marker was adapted by Dr. A.Winter (University of
Glasgow). It was based on the sensors developed by Hanson et al. and Lohman et al. for
expression in the ER, along with the appropriate folding mutations and was derived from a
synthetic gene designed with C. elegans optimised codons. It is expressed in a pAW2
vector under the control of the pdi-2 gene promoter (Figure 5.1) and it was shown that the
presence of the sensor does not induce ER stress (A.Winter, personal communication).
Figure 5.1: The roGFP ER3 marker
Schematic depicting the roGFP-ER3 construct for its expression in C.elegans (provided by Dr.
Alan Winter).

Anastasios Batas 2017 Chapter 5
156
The initial step for this investigation involved the introduction of the roGFP ER3 marker
into the vps-45 (tm246) and unc-51 (e369) C. elegans mutants. The typical process of
constructing double mutants was followed. TP198, genotype kaIs6 [pADW0083 (pdi-
2prom::roGFP-ER3::phy-1 + unc-119(+))], male animals were crossed with
hermaphrodites carrying the desired mutant allele, either with IA757, genotype vps-45
(tm246), or CB369, genotype unc-51 (e369). The ratio of hermaphrodites and male animals
indicated if the crossing was successful. Heterozygotic hermaphrodites from the F1
generation, which carried the roGFP ER3marker as observed under UV light, were clonally
transferred into plates and left to egg lay. For vps-45 (tm246) mutants, heterozygosity was
verified via PCR using the same primers and method described previously on Chapter 3.
For the unc-51 (e369) hererozygosity in the F1 generation was verified via the presence of
GFP positive animals, which were not Dpy Unc. The Dpy Unc phenotype is only present
in homozygotic unc-51 (e369) animals since the mutation is recessive.
Hermaphrodite F2 offsprings for each cross were then clonally transferred into new plates
and left to breed. For the vps-45 (tm246) mutants the F2 parents were lysed and
homozygosity for the vps-45 (tm246) allele was assessed through PCR. This was also
confirmed in subsequent generations by 100% molting death phenotype at 25°C. The lines
were further tested for homozygosity of the roGFP ER3 marker. Only lines which
originated from parents which produced 100% GFP positive offspring were kept,
confirming homozygosity.
For the unc-51 (e369) mutant, F2 parents which displayed the unc-51(e369) DpyUnc
phenotype and were GFP positive were selected. Homozygosity for the roGFP ER3 marker
was assessed as described above.
As such two new strains were constructed, IA881, genotype kaIs6 [pADW0083 (pdi-
2prom::roGFP-ER3::phy-1 unc-119(+))];vps-45 (tm246) X and IA880, genotype kaIs6
[pADW0083 (pdi-2prom::roGFP-ER3::phy-1 unc-119(+))];unc-51 (e369) V.
In all cases in order to verify the presence and expression of the roGFP ER3 marker
protein, in the strains whole worms-lysates were prepared for SDS-page as described in the
materials and methods section 2.3.22.1. Non-reducing and reducing samples were prepared
from each lysate for each strain (TP198, IA880, IA881) as well as for the GFP negative N2
wild type strain. In all cases under the reducing conditions only the reduced state of the
protein was detected at approximately 30kDa. By contrast in the non-reducing conditions
two bands were detected at ~30kDa for the reduced form (no disulphide bond formation)

Anastasios Batas 2017 Chapter 5
157
and around 27kDa for the oxidised form (disulphide bond formation). Thus, the redox
sensor was expressed and was functional as a sensor in C. elegans in the wild type strain
and in the two mutant backgrounds (Figure 5.2).
Figure 5.2: Western blot of roGFP ER3 protein resolved on a 10% tricine gel.
The roGFP can be detected in all transgenic strains (TP198, IA881, IA880) and not on the wild type strain
(N2 just above 25kDa). Both versions of the marker can be detected in the non-reduced samples, at non-
reduced (two bands) and reduced (single band) forms shown.
5.3 The roGFP ER3 marker can detect changes in ER redox state in C. elegans
The roGFP ER3 marker was employed in order to investigate the oxidation state of the ER
in vps-45 (tm246) and unc-51 (e369) mutant backgrounds by measuring the fluorescence of
the different states of the marker in the animals on a plate reader. Animals, were
synchronised to the L4 stage on petri dishes and were then added on each well and
measured as previously described on section 2.3.6.3 and 2.3.18. The corresponding GFP
negative strains were used for normalisation purposes, more specifically the N2, IA757 and
reducing Non-reducing
N2
250kD
75kD
50kD
37kD
25kD

Anastasios Batas 2017 Chapter 5
158
CB369 strains. The value obtained from the GFP negative animals was subtracted in each
case from the corresponding animals expressing the roGFP ER3 marker.
To verify that the marker can detect redox changes in the ER of C. elegans cells a positive
control experiment was carried out using RNAi of the ero-1 gene. ERO-1 is an
oxidoreductase involved in the formation and isomerisation of disulphide bonds in the ER.
As such disruption of the ero-1 gene can inhibit the formation of disulphide bonds,
resulting in a more reducing environment within the ER (Pollard et al. 1998; Harding et al.
2003). For this experiment, the wild type roGFP ER3 marker strain TP198 was used. Two
cultures were prepared, a standard culture without RNAi and one delivering RNAi of the
ero-1 gene by the bacterial feeding method as described in materials and methods (section
2.3.6). The plate reader would produce a 390nm:460nm emission ratio. Emission from the
390nm excitation corresponded to the oxidised state of the protein, whereas emission from
the 490nm excitation corresponded to the reduced state of the protein (Section 2.3.18). The
TP198 strain fed on OP50 E. coli had a 390:460 emissions ratio of 0.74 compared with
1.05 for the same strain fed on the RNAi E. coli strain HT115 carrying the empty RNAi
vector. C. elegans fed HT115 E. Coli instead of the OP50 strain have been shown to have
altered metabolism, including faster development and higher consumption of oxygen (Xiao
et al. 2015). The exact reason for this difference in measured redox state in the ER is not
known, but it might relate to such differences.
That growth on OP50 results in a different measured ER redox state than growth on the
RNAi E.coli strain HT115, means that growth on OP50 cannot be used as a control in these
experiments. The empty vector HT115 data was therefore used as a control for the RNAi
experiments. Animals fed with the ero-1 RNAi exhibited a ratio of 0.55 compared to 0.74
for the empty vector HT115 fed animals, approximately a 35% reduction (Figure 5.3).
The reduction obtained when the C. elegans were fed with ero-1 RNAi expressing HT115
when compared to the empty vector proves that the method is working. Thus, successful
use of this redox marker was verified and the results constitute a positive control for the
later experiments.
Experiments to test the ER oxidation environment of vps-45 and unc-51 mutants, were
performed and compared to the wild type strain. For the TP198 and IA881 strains L4
animals were added on each well and measured. In the case of the IA880 strain, obtaining
synchronous cultures at the L4 stage was not possible, since the mutant grows
asynchronously (Section 3.9) and thus a mixture of animals of different developmental

Anastasios Batas 2017 Chapter 5
159
stages was obtained, the vast majority of which were at the L3 or L4 stages. In the first set
of experiments, all strains were cultured at 15°C. The choice of this temperature was based
on it being the permissive temperature for culture of the vps-45 (tm246) mutant and
identical conditions for all strains being tested was desired. A slightly more reduced
condition was observed in the vps-45 mutant in strain IA881 relative to the parental roGFP
ER3 marker strain TP198 with average ratios of 1.11 for TP198 and 0.91 for IA881,
however this is not significant (p=0.2). A greater difference was measured in the unc-51
mutant strain IA880 with a ratio of 0.72. In this case the difference with TP198 has greater
significance (p=0.009). Thus, it is probable that the ER in the unc-51 mutant has a
significantly more reduced state than in the wild type when animals are cultured at 15°C.
All the strains were further tested after a period of culture at 25°C which is the non-
permissive temperature for the vps-45 (tm246) moulting death phenotype. There is
relatively little measured difference in the behaviour of the wild type strain TP198 at 25°C
with a ratio of 0.96 compared to 1.11 at 15°C (Figure 5.5 A and B). However, both mutant
strains show a shift towards a more oxidised state at the higher temperature. With 25°C
culture, the vps-45 mutant strain IA881 has a 390nm:460nm ratio of 1.37 compared to 0.91
at 15°C (Figure 5.4 A and B). With 25°C culture, the unc-51 mutant strain IA880 has a
ratio of 0.99 compared to 0.72. when cultured at 15°C (Figure 5.3 A and B).
Overall, it appears that the vps-45 mutant exhibits an ER environment similar to the wild
type at the permissive temperature for the moulting death phenotype, whereas the unc-51
mutant has a reduced environment under the same culturing conditions. By contrast when
the temperature was shifted to 25°C, the vps-45 mutants exhibited an oxidised environment
in the ER compared to the wild type. The unc-51 mutant exhibited a similar ER redox state
to the wild type at 25°C, but there is a shift in an oxidising direction relative to when it is
grown at the lower temperature of 15°C. Thus, while redox state of the wild type strain is
not substantially influenced by temperature going from 15°C to 25°C culture, both the vps-
45 and unc-51 mutants altered in the direction of increased oxidation at the higher
temperature relative to their state at the lower culture temperatures.

Anastasios Batas 2017 Chapter 5
160
Figure 5.3: Test of roGFP ER3 oxidation state in C. elegans .
390:460 ratios (±SEM) for the wild type roGFP ER3 expressing strain, TP198 (n=3), the wild type roGFP
ER3 expressing strain under the effect of ero-1 RNAi, TP198 ERO1 (n=3) and the wild type roGFP ER3
expressing strain under the effect of the empty vector RNAi TP198-RNAi (-), (n=3). Lower ratios represent
a more reduced state in the ER. Tukey's multiple comparisons test. TP198 vs TP198 ERO1 p=0.0248, TP198
vs TP198 RNAi (-), p=0.29. TP198 ERO1 vs TP198 RNAi (-), p=0.83.
TP
198
TP
198-E
RO
1
TP
198-R
NA
i(- )
0 .0
0 .5
1 .0
1 .5
S tra in
39
0n
m:4
60
nm
Ra
tio
*

Anastasios Batas 2017 Chapter 5
161
TP
198
IA881
IA880
0 .0
0 .5
1 .0
1 .5
S tra in
39
0n
m:4
60
nm
Ra
tio
E R o x id a t iv e s ta te a t 1 5 °C
TP
198
IA881
IA880
0 .0
0 .5
1 .0
1 .5
2 .0
S tra in
39
0n
m:4
60
nm
Ra
tio
E R o x id a t iv e s ta te a t 2 5 °C
Figure 5.4: roGFP ER3oxidation state in TP198, IA881 and IA880 strains.
390nm:460nm ratios (±SEM) for TP198, IA881 and IA880. Lower ratios represent a more reduced state in
the ER. A) C. elegans cultured at 15°C, TP198 (n=9), IA881 (n=10) and IA880 (n=8). Tukey's multiple
comparisons test. TP198 vs IA881 p=0.2, TP198 vs IA880 p=0.009, TP198 vs IA880 p=0.26 B) C. elegans
cultured at 15°C and then stressed at 25°C for 12 hours, TP198 (n=6), IA881 (n=4) and IA880 (n=3). Tukey's
multiple comparisons test. TP198 vs IA881 p=0.02, TP198 vs IA880 p=0.98, TP198 vs IA880 p=0.07.
Comparison with p values >0.05 are considered significant.
A)
B)

Anastasios Batas 2017 Chapter 5
162
5.4 Assessing the survival of vps-45 (tm246) and unc-51 (e369) mutants under
oxidative stress
The results in the previous section indicated that both the vps-45 (tm246) and unc-51
(e369) mutants under certain conditions of temperature culture behaved differently that
wild type in measured ER redox state. As a next step, the sensitivity of the vps-45 (tm246)
and unc-51 (e369) mutants to oxidative stress by exposure to hydrogen peroxide was
assessed. Strains were treated with H2O2 and their viability was scored at 25°C.
Initially, a range of concentrations from 0mM to 5mM and an exposure period of 4 hours
were tested on wild type early adults to identify at which concentration H2O2 stress should
be carried out. The number of alive animals was scored hourly.
A very small number of animals died at 0mM of H2O2 concentration and at 4 hours 98.4%
of the original inoculate was still alive. Very similar lethality was observed at 0.1mM,
0.5mM and 1mM with approximately 80% of the animals surviving after 4 hours. More
specifically, at 0.1mM 79.2% of the original inoculate was still alive, at 0.5mM 81.7% and
finally at 1mM 77.8%. At 5mM higher lethality was observed with only 35% of the
animals surviving after 4 hours of exposure (Figure 5.5).
Based on the results obtained for the wild type strain N2, the 5mM and 1mM
concentrations were chosen to be tested on the mutant strains; 5mM gave over 50% death
with wild type and 1mM approximately 20%, representing “strong” and “mild” stress
respectively.
With 1mM H2O2, the vps-45 mutant (IA757) exhibits similar sensitivity to oxidative stress
to the wild type strain (Figure 5.6A). More specifically the median survival for both strains
was 2 hours, and a very similar percentage of surviving animals from each population after
the 4-hour mark, a 33.3% for the wild type strain, and 30.7% for the IA757 strain. With
exposure to 5mM H2O2 the vps-45 mutant IA757 strain demonstrated the same median
survival to wild type at 3 hours, however the percentage of surviving animals after 4 hours
of exposure was lower for IA757, at 8.2% percent of the total population compared to
15.8% for the wild type strain (Figure 5.6B). However, this strain also exhibited some
death in the assay without addition of H2O2 with 7.9% and 7% dying after 4 hours in the
1mM and 5mM experiments. Therefore, not all of the additional death in the vps-45 mutant
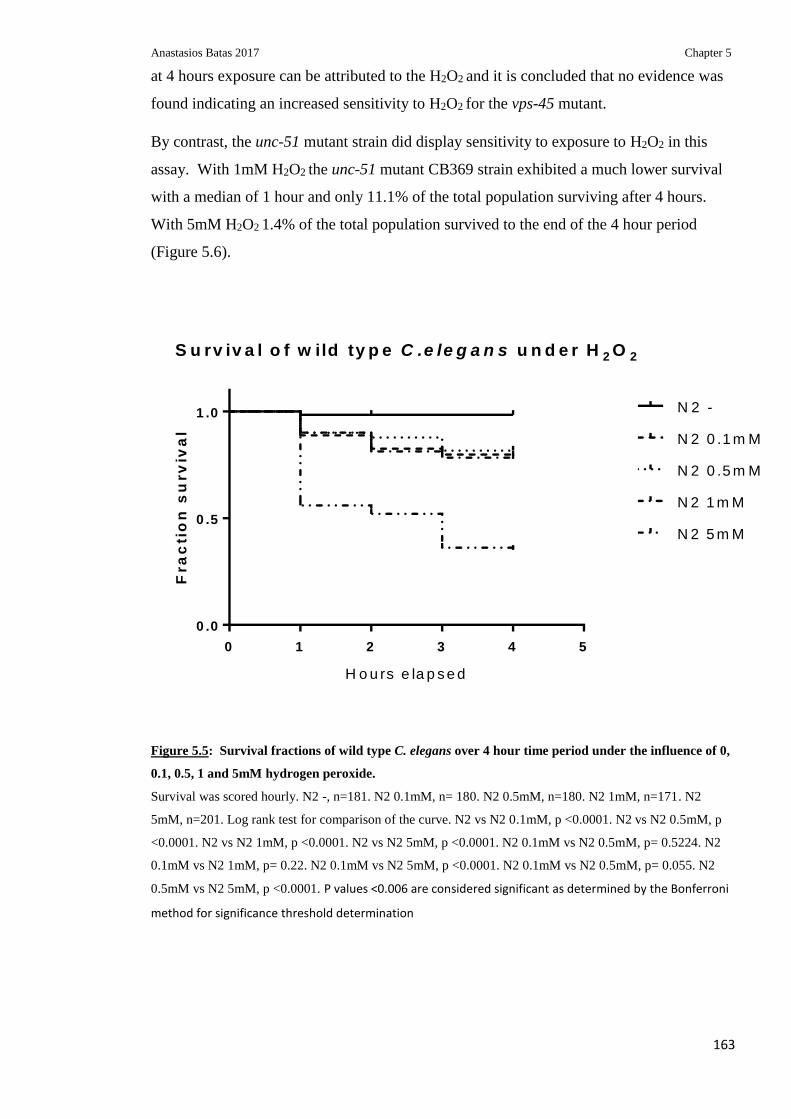
Anastasios Batas 2017 Chapter 5
163
at 4 hours exposure can be attributed to the H2O2 and it is concluded that no evidence was
found indicating an increased sensitivity to H2O2 for the vps-45 mutant.
By contrast, the unc-51 mutant strain did display sensitivity to exposure to H2O2 in this
assay. With 1mM H2O2 the unc-51 mutant CB369 strain exhibited a much lower survival
with a median of 1 hour and only 11.1% of the total population surviving after 4 hours.
With 5mM H2O2 1.4% of the total population survived to the end of the 4 hour period
(Figure 5.6).
0 1 2 3 4 5
0 .0
0 .5
1 .0
S u rv iv a l o f w ild ty p e C .e le g a n s u n d e r H 2 O 2
H o u rs e la p s e d
Fra
cti
on
su
rv
iva
l
N 2 -
N 2 0 .1 m M
N 2 0 .5 m M
N 2 1 m M
N 2 5 m M
Figure 5.5: Survival fractions of wild type C. elegans over 4 hour time period under the influence of 0,
0.1, 0.5, 1 and 5mM hydrogen peroxide.
Survival was scored hourly. N2 -, n=181. N2 0.1mM, n= 180. N2 0.5mM, n=180. N2 1mM, n=171. N2
5mM, n=201. Log rank test for comparison of the curve. N2 vs N2 0.1mM, p <0.0001. N2 vs N2 0.5mM, p
<0.0001. N2 vs N2 1mM, p <0.0001. N2 vs N2 5mM, p <0.0001. N2 0.1mM vs N2 0.5mM, p= 0.5224. N2
0.1mM vs N2 1mM, p= 0.22. N2 0.1mM vs N2 5mM, p <0.0001. N2 0.1mM vs N2 0.5mM, p= 0.055. N2
0.5mM vs N2 5mM, p <0.0001. P values <0.006 are considered significant as determined by the Bonferroni
method for significance threshold determination
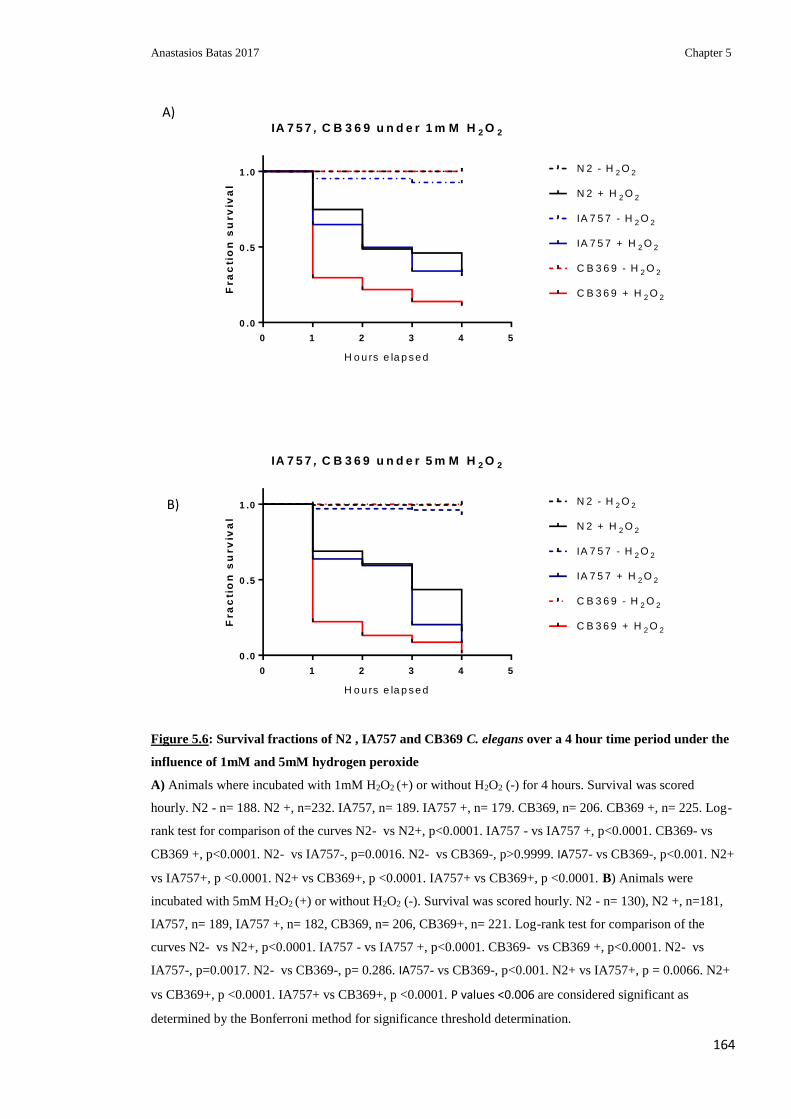
Anastasios Batas 2017 Chapter 5
164
0 1 2 3 4 5
0 .0
0 .5
1 .0
IA 7 5 7 , C B 3 6 9 u n d e r 1 m M H 2 O 2
H o u rs e la p s e d
Fra
cti
on
su
rv
iva
l
N 2 - H 2 O 2
N 2 + H 2 O 2
IA 7 5 7 - H 2 O 2
IA 7 5 7 + H 2 O 2
C B 3 6 9 - H 2 O 2
C B 3 6 9 + H 2 O 2
0 1 2 3 4 5
0 .0
0 .5
1 .0
IA 7 5 7 , C B 3 6 9 u n d e r 5 m M H 2 O 2
H o u rs e la p s e d
Fra
cti
on
su
rv
iva
l
N 2 - H 2 O 2
N 2 + H 2 O 2
IA 7 5 7 - H 2 O 2
IA 7 5 7 + H 2 O 2
C B 3 6 9 - H 2 O 2
C B 3 6 9 + H 2 O 2
Figure 5.6: Survival fractions of N2 , IA757 and CB369 C. elegans over a 4 hour time period under the
influence of 1mM and 5mM hydrogen peroxide
A) Animals where incubated with 1mM H2O2 (+) or without H2O2 (-) for 4 hours. Survival was scored
hourly. N2 - n= 188. N2 +, n=232. IA757, n= 189. IA757 +, n= 179. CB369, n= 206. CB369 +, n= 225. Log-
rank test for comparison of the curves N2- vs N2+, p<0.0001. IA757 - vs IA757 +, p<0.0001. CB369- vs
CB369 +, p<0.0001. N2- vs IA757-, p=0.0016. N2- vs CB369-, p>0.9999. ΙΑ757- vs CB369-, p<0.001. N2+
vs IA757+, p <0.0001. N2+ vs CB369+, p <0.0001. IA757+ vs CB369+, p <0.0001. B) Animals were
incubated with 5mM H2O2 (+) or without H2O2 (-). Survival was scored hourly. N2 - n= 130), N2 +, n=181,
IA757, n= 189, IA757 +, n= 182, CB369, n= 206, CB369+, n= 221. Log-rank test for comparison of the
curves N2- vs N2+, p<0.0001. IA757 - vs IA757 +, p<0.0001. CB369- vs CB369 +, p<0.0001. N2- vs
IA757-, p=0.0017. N2- vs CB369-, p= 0.286. ΙΑ757- vs CB369-, p<0.001. N2+ vs IA757+, p = 0.0066. N2+
vs CB369+, p <0.0001. IA757+ vs CB369+, p <0.0001. P values <0.006 are considered significant as
determined by the Bonferroni method for significance threshold determination.
B)
A)

Anastasios Batas 2017 Chapter 5
165
5.5 Assessing the oxidative response of vps-45 (tm246) and unc-51 (e369)
mutants under oxidative stress
To assess if there is any difference in as the magnitude of the response to oxidative stress
by the vps-45 (tm246) and unc-51 (e369) mutants, a set of GFP reporters were utilised. The
reporter genes that were used are GCS-1::GFP, GST-4::GFP and finally SOD-3::GFP. The
corresponding strains carrying the transgenes were: LD1171, genotype ldIs3 [gcs-1p::GFP
rol-6(su1006)], CL2166 with genotype dvIs19 [(pAF15)gst-4p::GFP::NLS] III and finally
CF1553 with genotype muIs84 [(pAD76) sod-3p::GFP rol-6(su1006)].
Gamma-glutamylcysteine synthetase (GCS) catalyse the first step in the biosynthesis of
glutathione (GSH). gcs-1 is the C. elegans orthologue of GCS, and the production of GSH
result in the inactivation of hydrogen peroxide (H2O2) through the action of glutathione
peroxidase, and the production of glutathione disulphide (GSSG) and water (H2O) (Schulz
et al. 2000).
GST-4 on the other hand, is part of the glutathione-s-transferase group of enzymes, or
GSTs. GSTs can metabolize xenobiotics; superoxide anion and hydrogens peroxide among
others. GSTs can conjugate reduced GSH with other toxic compounds. GST genes are
upregulated in response to oxidative stress such as increased exposure to H2O2 or paraquat
(Hayes et al. 2005; Nebert & Vasiliou 2004; Hoeven et al. 2011).
Finally, there is the superoxide dismutase (SOD) family of enzymes. SOD enzymes are
responsible for the conversion of superoxide species to hydrogen peroxide which in turn is
converted to water by catalases (Fridovich 1995). Superoxide dismutase-3 (SOD-3) in
particular, is a manganese superoxide dismutase. Data have supported a role in maintaining
oxidative balance in the extracellular matrix and in the nucleus (Oury et al. 1996;
Ookawara et al. 2002). It is theorised, that its function promotes normal lifespan in worms,
however its loss has not been shown to reduce longevity (Samuelson et al. 2007). Activity
of sod-3 is affected via daf-2 signalling, which is homologous to igf1 (insulin growth
factor-1) and regulates longevity in C. elegans (Finch & Ruvkun 2001) and mediates
metabolism and expression of free radical detoxification enzymes across multiple
organisms (Honda & Honda 1999; Finch & Ruvkun 2001; Garofalo 2002; Holzenberger et
al. 2003). Decreased daf-2 signalling causes dephosphorylation and subsequently nuclear

Anastasios Batas 2017 Chapter 5
166
localisation of DAF-16 transcription factor (Lee et al. 2001). Two DAF-16 binding sites
are contained on the sod-3 gene. Decrease in insulin/IGF-1 signalling results in daf-16
upregulation of sod-3. Many of the genes involved in the lysosomal vesicular trafficking
are also necessary extension of C. elegans lifespan as a result of decrease in insulin/IGF-1
signalling. Furthermore, the same genes are involved in the induction of sod-3. More
specifically all five subunits of the ESCRT complex (CD4.4, C27F2.5, F1741.8, Y654.3
and T27F7.1) an essential component of the endosomal system (Samuelson et al. 2007).
Additionally, data have also suggested that sod-3 can also be regulated via the NRF2
pathway in breast cancer cells and consequently it is possible that in C. elegans it is
regulated by SKN-1 similar to Phase II enzymes such as GST-4 and GCS-1 (An &
Blackwell 2003; Singh & Bhat 2012; Blackwell et al. 2015).
All 3 of the reporter gene were tagged with GFP. The reporters were introduced to the
IA757 and CB369 strains by crossing the GFP carrying strains LD1171, genotype ldIs3
[gcs-1p::GFP rol-6(su1006)] , CL2116, genotype dvIs19 [(pAF15)gst-4p::GFP::NLS]
III, and DA2123, genotype muIs84 [(pAD76) sod-3p::GFP rol-6(su1006)] with the unc-51
(e369) and vps-45 (tm246) mutants as previously described for the roGFP ER3 marker
(section 5.2). Thus, the following strains were created.
• IA887, genotype muIs84 [(pAD76) sod-3p::GFP rol-6(su1006)]; vps-45 (tm246) X
• IA896, genotype muIs84 [(pAD76) sod-3p::GFP rol-6(su1006)]; unc-51 (e369) V ]
• IA890, genotype dvIs19 [(pAF15) gst-4p::GFP::NLS] III; vps-45 (tm246) X
• IA899, genotype dvIs19 [(pAF15) gst-4p::GFP::NLS] III; unc-51 (e369) V
• IA889, genotype ldIs3 [gcs-1p::GFP rol-6(su1006)]; vps-45 (tm246) X
• IA898 strain, genotype ldIs3 [gcs-1p::GFP rol-6(su1006)]; unc-51 (e369) V
L4 synchronised larvae were exposed to 1mM of hydrogen peroxide for 1 hour. They were
subsequently washed with S-basal prior to mounting on a glass slide with sodium azide to
anesthetize them. Pictures were acquired through the fluorescent microscope with 200ms
exposure times in all cases. This permitted a direct comparison of intensities of
fluorescence between different strains and conditions tested. Whole animal fluoresce was
quantified using the ImageJ software.
The SOD-3::GFP marker in the wild type background (strain CF1553) is expressed at a
higher measured level when treated with 1mM hydrogen peroxide for 1 hour than in the
0mM hydrogen peroxide control, 8.14 compared to 6.68 (Figure 5.7B). A representative

Anastasios Batas 2017 Chapter 5
167
image is given (Figure 5.7A). As can be seen in the image, most of the GFP fluorescence
is in the head and tail of the animal. When treated with H2O2, GFP fluorescence can be
observed in the rest of the body, however the bulk of expression still remains in the head
and tail of the animal (Figure 5.7A).
Expression of the SOD-3::GFP marker in the vps-45 (tm246) background (strain IA887) in
the absence of hydrogen peroxide is higher than in the wild type background, 8.24
compared to 6.68 and is similar to the induced level of wild type expression when treated
with 1mM hydrogen peroxide for 1 hour (8.14) as stated above (Figure 5.7B). With
treatment with 1mM hydrogen peroxide the average measured expression increases further
at 10.34, however this increase is not significant due to the variability between different
animals (Figure 5.7B). However, although the quantified average fluorescence is variable,
the physical pattern of expression in the anatomy of the animals is altered in that GFP
expression visibly and reproducibly extends more throughout the body of animals than in
untreated (Figure 5.7A). Thus, although the measured numerical increase in GFP
fluorescence is not significant in the samples sizes tested, expression is visible in more
tissues/cells.
In the unc-51 (e369) background the SOD-3::GFP marker (IA896) was expressed at a
higher measured level in the absence of hydrogen peroxide at 11.55, compared to the wild
type (CF1553) as well as the vps-45 (tm246) mutant (IA887). With treatment with
hydrogen peroxide a significant increase in the fluorescence was observed, at 16.22 (Figure
5.7B). Expression of GFP was observed mostly in the head and tail, and upon treatment
considerable expression was observed in the intestine of the animals (Figure 5.7A)
The GST-4::GFP marker, in the wild type background (CL2116), GFP was visible at low
levels in the intestine (Figure 5.8A) with a measured fluoresce of 5.19 (Figure 5.8A).Upon
treatment, fluorescence was further induced in the intestine of the animals (Figure 5.8A)
with a measured value of 8.05 (Figure 5.8B).
In the vps-45 (tm246) mutant background (IA890), in untreated animals, expression of
GST-4::GFP was observed in the intestine (Figure 5.8A) at similar levels to the wild type
with a measured value of 4.67 (Figure 5.8B). After treatment with H2O2 the same pattern
of increased fluorescence in the intestine was observed as in the case of the CL2116 strain
with a measured value of 6.40.

Anastasios Batas 2017 Chapter 5
168
For the unc-51 (e369) mutant background (IA899), GFP fluorescence was once again
localised in the intestine at low levels when untreated (Figure 5.8A) and a value, similar to
the wild type and vps-45 (tm246) backgrounds, was obtained at 4.42 (Figure 5.8B). H2O2
GFP expression was increased in the intestine in H2O2 treated animals (Figure 5.8A) with a
value of 8.05 (Figure 5.8B). Overall, minor differences were observed between the strains
which were not significant, suggesting that the gst-4 depended oxidative response is not
affected by the vps-45 (tm246) or the unc-51 (e369) mutant backgrounds.
The final marker to be tested was GCS-1::GFP. In the wild type background (LD1171)
almost no GFP was expressed when animals were cultured without H2O2 (Figure 5.9A) and
the obtained measured value was 1.35 (Figure 5.9B). This value was most likely a result of
background fluorescence in this case. When animals were treated with 1mM H2O2,
expression of the marker was observed in the intestine of the animals (Figure 5.9A) and the
measured value was 2.57.
A similar pattern was observed in the vps-45 (tm246) (IA889) background. In the case of
the vps-45 (tm246) (IA889) mutants without H2O2 treatment, no GFP expression was
observed (Figure 5.9A) and the basal fluorescence value was 1.23 (Figure 5.9B). When the
mutants were treated with H2O2 GFP was observed in the intestine and average GFP
fluorescence per area of 3.16 was measured.
Finally, in the unc-51 (e369) mutant background (IA898) low levels of GFP were observed
at the pharynx (Figure 5.9A) and the measured value was 1.98. A significant increase in
the expression of GFP in the intestine was observed in the animals treated with H2O2
(Figure 5.9A) which was reflected the average GFP expression per area value, at 7.54
(Figure 5.9B), suggesting an increased susceptibility of this strain to oxidative stress.
Overall all data suggest that there is no difference on how vps-45 (tm246) mutants react to
H2O2 derived oxidative stress compared to the wild type strain. On the other hand unc-51
(e369) mutants show a stronger response compared to the same stress in the wild type,
especially in the case of the GCS-1::GFP marker. GCS-1 is part of the phase II
detoxification response and its expression is directly controlled from the skn-1 gene. SKN-
1 activity is directly controlled by the presence of reactive oxygen species (Schulz et al.
2000). On the other hand, SOD-3 is regulated by daf-16 which respond to nutrient
starvation in C. elegans and has been associated with aging and longevity (Honda &
Honda 1999). As such it is possible that the marker is not exclusively responding to
oxidative stress. Additionally, SOD-3 mainly acts in converting ROS to H2O2 and as such

Anastasios Batas 2017 Chapter 5
169
by increasing the supply of H2O2 did not increase ROS production in worms and
subsequently not enough to elicit a greater response from the marker (Fridovich 1995).
Lastly GST-4 expression is controlled by GCS-1 so it is acting at a different stage of the
redox pathway, primarily reacting to the exposure of H2O2 and it is regulated by SKN-1
(Hoeven et al. 2011; Hayes et al. 2005; Nebert & Vasiliou 2004).
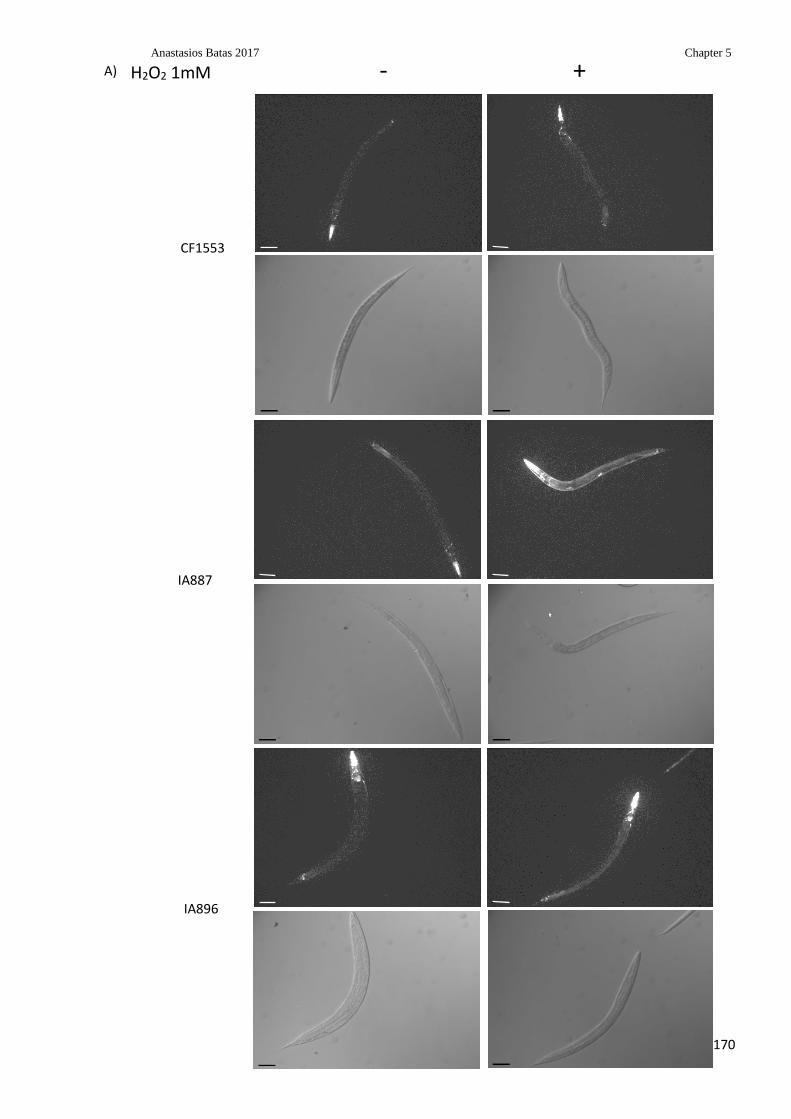
Anastasios Batas 2017 Chapter 5
170
CF1553
IA887
IA896
A) H2O2 1mM - +

Anastasios Batas 2017 Chapter 5
171
Figure 5.7: Assessment of oxidative response in CF1553, IA887 and IA896 strains using the SOD-
3::GFP marker.
A) Representative pictures of treated (+) and untreated (-) CF1553[(pAD76) sod-3p::GFP rol-6(su1006)],
IA887 muIs84 [(pAD76) sod-3p::GFP rol-6(su1006)]; vps-45 (tm246) X and IA896 muIs84 [(pAD76) sod-
3p::GFP rol-6(su1006)]; unc-51 (e369) V ] C. elegans treated with 1mM hydrogen peroxide over a period of
1 hour. B) Average total body fluorescence (integrated density/area) for treated and untreated CF1553, IA887
and IA896 animals with 1mM hydrogen peroxide over a period of 1 hour. For each experiment 30 individual
animals were measured. 3 experiments carried for each strain at each condition (Average fluorescence ±SD).
Tukey's multiple comparisons test. CF1553 0mM vs. CF1553 1mM, p= 0.2945. CF1553 0mM vs. IA887
0mM, p= 0.2525. CF1553 0mM vs. IA887 1mM, p= 0.0015. CF1553 0mM vs. IA896 0mM, p= 0.0001.
CF1553 0mM vs. IA896 1mM, p <0.0001. CF1553 1mM vs. IA887 0 mM, p >0.9999. CF1553 1mM vs.
IA887 1mM, p= 0.0578. CF1553 1mM vs. IA896 0 mM, p= 0.0028. CF1553 1mM vs. IA896 1 mM. p
<0.0001. IA887 0mM vs. IA887 1 mM, p= 0.0694. IA887 0mM vs. IA896 0mM, p= 0.0034. IA887 0mM vs.
IA896 1mM, p <0.0001. IA887 1mM vs. IA896 0 mM, p= 0.4955. IA887 1mM vs. IA896 1 mM, p <0.0001.
IA896 0mM vs. IA896 1mM p= 0.0002.
CF
1553 0
mM
CF
1553 1
mM
IA887 0
mM
IA887 1
mM
IA869 0
mM
IA896 1
mM
0
5
1 0
1 5
2 0
S tra in & T re a tm e n t
GF
P e
xp
re
ss
ion
pe
r a
re
a
B)

Anastasios Batas 2017 Chapter 5
172
IA890
IA899
H2O2 1mM - + A)
Cl2116

Anastasios Batas 2017 Chapter 5
173
Figure 5.8: Assessment of oxidative response in wild type, vps-45 (tm246) and unc-51 (e369) strains
using the GST-4::GFP marker.
A) Representative pictures of treated (+) and untreated (-) CL2116 dvIs19 [(pAF15) gst-4p::GFP::NLS] III,
IA890 dvIs19 [(pAF15) gst-4p::GFP::NLS] III; vps-45 (tm246) X and IA899 dvIs19 [(pAF15) gst-
4p::GFP::NLS] III; unc-51 (e369) V C. elegans treated with 1mM hydrogen peroxide over a period of 1
hour. B) Average total body fluorescence (integrated density/area) for treated and untreated CL2116, IA890
and IA899 animals with 1mM hydrogen peroxide over a period of 1 hour. For each experiment 30 individual
animals were measured. 3 experiments carried for each strain for each condition. (Average fluorescence
+SD). Tukey's multiple comparisons test.CL2116 0mM vs. CL2166 1mM, p= 0.0322. CL2116 0mM vs.
IA890 0 mM, p= 0.8697. CL2116 0mM vs. IA890 1mM, p= 0.1759. CL2116 0mM vs. IA899 0mM, p=
0.5958. CL2116 0mM vs. IA899 1Mm, p= 0.0006. CL2166 1mM vs. IA890 0mM, p= 0.0050. CL2166
1mM vs. IA890 1mM, p= 0.8950. CL2166 1mM vs. IA899 0mM, p= 0.0022. CL2166 1mM vs. IA899 1mM,
p= 0.2135. IA890 0mM vs. IA890 1 mM, p= 0.0288. IA890 0mM vs. IA899 0mM, p= 0.9940. IA890 0mM
vs. IA899 1mM, p= 0.0001. IA890 1mM vs. IA899 0mM, p= 0.0119. IA890 1mM vs. IA899 1mM, p=
0.0400. IA899 CB369 0mM vs. IA899 1 mM, p <0.0001
CL
2116 0
mM
CL
2166 1
mM
IA890 0
mM
IA890 1
mM
IA899 0
mM
IA899 1
mM
0
2
4
6
8
1 0
S tra in & T re a tm e n t
GF
P e
xp
re
ss
ion
pe
r a
re
a
B)

Anastasios Batas 2017 Chapter 5
174
LD1171
IA898
IA889
A) H2O2 1mM - +

Anastasios Batas 2017 Chapter 5
175
LD
1171 0
mM
LD
1171 1
mM
IA889 0
mM
IA889 1
mM
IA898 0
mM
IA898 1
mM
0
2
4
6
8
1 0
S tra in & T re a tm e n t
GF
P e
xp
re
ss
ion
pe
r a
re
a
Figure 5.9: Assessment of oxidative response in wild type, vps-45 (tm246) and unc-51 (e369) strains
using the GCS-1::GFP marker
A) Representative pictures of treated (+) and untreated (-) LD1171 ldIs3 [gcs-1p::GFP rol-6(su1006)],
IA889 ldIs3 [gcs-1p::GFP rol-6(su1006)]; vps-45 (tm246) X and IA898 ldIs3 [gcs-1p::GFP rol-6(su1006)];
unc-51 (e369) V C. elegans treated with 1mM hydrogen peroxide over a period of 1 hour. B) Average total
body fluorescence (integrated density/area) for treated and untreated LD1171, IA889 and IA898 animals with
1mM hydrogen peroxide over a period of 1 hour. For each experiment 30 individual animals were measured.
3 experiments carried for each strain at each condition. (Average fluorescence +SD). Tukey's multiple
comparisons test. LD1171 0mM vs. LD1171 1mM, p= 0.0692. LD1171 0mM vs. IA889 0mM, p= 0.9505.
LD1171 0mM vs. IA889 1mM, p= 0.0054. LD1171 0mM vs. IA898 0mM, p= 0.5889. LD1171 0mM vs.
IA898 1mM, p <0.0001. LD1171 1mM vs. IA889 0mM, p= 0.0165. LD1171 1mM vs. IA889 1mM, p=
0.6591. LD1171 1mM vs. IA898 0mM, p= 0.6589. LD1171 1mM vs. IA898 1mM, p <0.0001. IA889 0mM
vs. IA889 1mM, p= 0.0014. IA889 0mM vs. IA898 0mM, p= 0.1993. IA889 0mM vs. IA898 1mM, p
<0.0001. IA889 1mM vs. IA898 0mM, p= 0.0847. IA889 1mM vs. IA898 1mM, p <0.0001. IA898 0mM vs.
IA898 1mM, p <0.0001
B)

Anastasios Batas 2017 Chapter 5
176
5.6 Chapter summary
In this chapter, the vps-45 (tm246) and unc-51 (e369) mutants were characterised in terms
of their oxidative sensitivity. Initially an ER redox sensor was employed to identify any
potential redox imbalances in the ER of vps-45 (tm246) or unc-51 (e369) mutant C.
elegans. It was verified that the sensor was functional in C. elegans by using western blots
and RNAi for the ero-1 gene and reading the samples the 96-well plate reader. The
experiments for the strains were then conducted in both the permissive (15°C) and non-
permissive temperatures (25°C) for the vps-45 (tm246) moulting death. It was
demonstrated that the unc-51 (e369) mutant had a more reduced environment in its ER at
15°C. The same mutant, appeared to have a similar ER environment to the wild type at
25°C suggesting that the elevated temperature caused an oxidation in the ER of the mutant.
On the other hand, the vps-45 (tm246) mutant had a similar ER environment at 15°C to the
wild type but a much more oxidised environment at 25°C. Coming in agreement with data
previously acquired for yeast (Cowan, 2014) as well as the theory that impairment of vps-
45 could potentially be causing ER stress, similar to ELA2 mutations (Grenda et al. 2007)
and this could be resulting to apoptosis of neutrophils in neutropenia patients carrying the
T224N mutation on the human Vps45 gene (Vilboux et al. 2013). Furthermore, the
reduced ER environment exhibited by the unc-51 mutant can act as an indication that the
synthetic lethal phenotype exhibited by the unc-51 (e369) V; vps-45 (tm246) X (Section
3.3) mutant is not a result of an additive effect in oxidative stress.
To further investigate these results a killing assay was performed on both mutants using
hydrogen peroxide at concentrations of 1mM and 5mM. It was observed in both
concentrations that the unc-51 (e369) mutant was the most sensitive to the oxidising agent.
The vps-45 (tm246) mutant also exhibited a higher sensitivity to oxidative stress when
compared to the wild type at the higher concentration. This comes in agreement with the
previous results which indicated that the vps-45 mutant was more sensitive to H2O2
mediated killing possibly, as a result of its oxidised environment in the ER. The fact that
the unc-51 mutant is more sensitive to hydrogen peroxide mediate killing than the vps-45
mutant, despite its reduce environment in the ER, can potentially be explained due to the
reduced autophagy exhibited by this mutant, which is likely to be acting as a homeostatic
mechanism.

Anastasios Batas 2017 Chapter 5
177
Τhree GFP tagged oxidative stress markers were used, and their induction in each mutant
was measured via microscopy and quantification of the worm’s total body fluorescence to
examine this. Overall in all three cases the wild type strain and the vps-45 (tm246) showed
similar levels of induction between the non-stressed and stressed states across all three
markers. On the other hand, the unc-51 (e369) mutant exhibited a higher fluorescence with
the two of the three markers, namely the SOD-3 and GCS-1 and not the GST-4.
Furthermore, an increased sensitivity of the unc-51 (e369) to oxidative stress both in terms
of survival and in terms of the anti-oxidant response was identified.
Thus, by all assays used, the unc-51 mutant exhibited a reduced environment in its ER and
appeared to be more sensitive to oxidative stress, with the SOD-3 and GCS-1, GFP
markers being expressed at higher levels when stressed with H2O2 the GST-4 marker
showing no difference from the wild type or vps-45 mutants. On the other hand, the vps-45
mutant exhibited a oxidised environment in its ER and milder sensitivity to oxidative
stress compared to the unc-51 mutant, however still greater compared to the wild type. A
slight increase in of the GFP markers was generally observed, however not significantly
higher to the wild type strain.

Anastasios Batas 2017 Chapter 6
178
Chapter 6: Characterisation and identification of the vps-45 (tm246)
moulting death suppressor
6.1 Overview and aims
An EMS (ethylmethasulphonate) mutagenesis screen which was previously done in our
lab, identified multiple independent suppressed lines for the 25°C moulting death of the
vps-45 (tm246) mutant. The original vps-45 (tm246) mutation is an extensive deletion and
as a result is considered to be a non-revertible genetic null allele. Therefore, the suppressor
has to be extragenic. The original vps-45 (tm246) mutants are viable at 15°C and die by
moulting arrest at 25°C. These newly acquired suppressed mutants grow and develop
relatively normally at 25°C despite lacking the Vps45 protein. One of the suppressed lines
(IA773) was selected for work described here, the objective being to characterise the extent
of the suppression across a collection of phenotypes that were observed in the vps-45
(tm246) mutant strain. Additionally, whole genome sequencing was employed in order to
attempt to identify the mutated gene in strain IA773 responsible for the supressed
phenotype.
6.2 Characterization of the svp (ij117) vps-45 (tm246) suppressed mutant
For the reasons discussed above the suppressor of the vps-45 (tm246) allele must be
extragenic. This unknown suppressor was named svp (ij117) (suppressor of vps-45). This
was done under the assumption that only a single suppressor allele was present in the
suppressed strain.
The phenotypic characterisation of the original vps-45 (tm246) strain IA757, and the
comparisons with the phenotypes of the wild type strain N2, is all presented in Chapter 3.
Here an extension of that study is presented with the phenotypic characterisation of the
suppressed IA773 strain, genotype svp (ij117) vps-45(tm246). Furthermore, a new strain
IA882 where the vps-45 (tm246) allele was twice backcrossed with the CB4856 Hawaiian
wild type strain was utilised in the comparisons where appropriate. Only the data from
IA773 and IA882 is new and the comparisons are with the data presented for the other
strains in Chapter 3; experiments were not repeated here for the other strains.

Anastasios Batas 2017 Chapter 6
179
6.3 svp (ij117) suppresses the vps-45 (tm246) moulting death at 25°C
To assess how the svp (ij117) allele affects the embryonic lethality previously
demonstrated by the vps-45 (tm246) mutant (section 3.3), IA773 and IA882 L1 arrested
animals were inoculated in NGM plates and were left to grow at the non-permissive
temperature. 50-60 L1 larvae were used for each strain and each experiment was done in
triplicate. After 120 hours of culturing, the number of surviving adults was scored for each
strain, as a measure of the animals that did not die through moulting. Data clearly shows
that a large majority (78.3%) of animals survives for IA773 whereas very few animals
(10%) were alive after 120 hours of culturing for IA882 (Figure 6.1). More specifically, as
previously described in section 3.4 for the wild type strain N2, 98.3% of the larvae were
able to survive and reach adulthood and for the IA757 strains percentage of animals which
survived through moulting was 14.2% and (Figure 6.1 and Chapter 3). Two conclusions
can be drawn from this data. First, it is evident that the svp (ij117) suppressor greatly
improves the survival of the animals carrying the vps-45 (tm246) allele with considerable
suppression of the moulting death, however the survival is still slightly lower when
compared to the wild type strain. Second, it is suggested that the presence of Hawaiian
genome does not affect the survival of vps-45 (tm246) animals as IA882 larvae exhibit a
very similar larval lethality to the original the IA757 strain. It should be noted that the % of
the genome that is Hawaiian in the IA882 strain is not known however it is the result of a
two-time backcross with CB4856 and the presence of Hawaiian DNA was verified across
chromosomes I, IV and V (Figure 6.9).
6.4 The suppressor does not change the body size of vps-45 (tm246) mutants
The length of mature adult IA773 animals was measured to assess if the suppressor
reverses the small body phenotype exhibited by the vps-45 (tm246) mutant. Animals were
cultured at the permissive temperature of 15° C where the IA757 strain can survive to
adulthood and display the smaller body size phenotype. The average size measured here
for the supressed strain IA773 was 1047μm (Figure 6.2). This compares with the previous
measurements for the non-suppressed IA757 strain of 1048μm and 1211μm for the wild
type N2 strain (Chapter 3, and Figure 6.2). Thus, the IA773 strain does not exhibit any
suppression for the shorter body length associated with the vps-45(tm246) allele in the

Anastasios Batas 2017 Chapter 6
180
IA757 strain with the two of them exhibiting almost the same length. As a result, it is
evident that the suppressor mutation does not reverse the identified smaller body size
phenotype of vps-45(tm246) (section 3.5).
N2
IA757
IA773
IA882
0
5 0
1 0 0
1 5 0
S u rv iv a l 1 2 0 h o u r s f ro m L 1 s y n c h ro n y
S tra in
Su
rv
iva
l(%
)
Figure 6.1: Assessment of the molting death of the suppressed vps-45 (tm246) mutant at 25°C.
Plates inoculated with 50-60 L1 larvae for each strain. Alive C. elegans were scored after 120 hours of
development. Experiments were done in triplicates for each of the N2, IA757, IA773 and IA882 strains.
Average survival (%)± SD is shown for each mutant Tukey’s multiple comparisons test: N2 vs IA757,
p<0.0001. N2 vs IA773 p=0.074. IA757 vs IA773 , p<0.0001. N2 vs IA882, , p<0.0001. IA757 vs IA882,
p=0.77. IA773 vs IA882, p<0.0001.

Anastasios Batas 2017 Chapter 6
181
6.5 The svp (ij117) suppressor allele does not supress embryonic lethality
As previously discussed, the IA757 strain, exhibits defective protein trafficking of yolk
components by the oocytes and it was shown on a previous chapter that such mutants
exhibit high rates of embryonic lethality when grown at both the permissive and non-
permissive temperatures (section 3.4). Previous data showed that, at 15°C the wild type
strain exhibited an embryonic lethality of 11.07% compared to 30.6% for the IA757 strain
(section 3.4). The IA773 strain on the other hand showed an average embryonic lethality of
26.6%, reduced but not to a significant degree, compared to IA757. Thus, suggesting a
mild, however not significant suppression of the mutant phenotype by the svp (ij117) allele
(Figure 6.3A).
At 25°C, a similar pattern was observed. The suppressed strain in this case demonstrated an
embryonic lethality of 21.61% (Figure 6.3B). The wild type strain had previously exhibited
an embryonic lethality of 2.05% and IA757 an embryonic lethality of 30.04%. Once again,
a reduced embryonic lethality is exhibited by the suppressed strain compared to the
original mutant at the same temperature, however still an insignificant change. Although at
both temperatures tested there was a small decrease in the numbers of embryos dying, the
numbers were not significant. Therefore, it is unclear if there is any real suppression
regarding the embryonic lethal phenotype.

Anastasios Batas 2017 Chapter 6
182
Figure 6.2: Length measurement of the suppressed vps-45 (tm246) mutant.
A-C) DIC images of adult wild type N2, IA757, IA773 animals. Scale bars represent 100μm. D) Average
length (± SD) of each strain at the adult stage when cultured at 15°C. N2 (n=10), IA757 (n=11), IA773
(n=9). Tukey’s multiple comparisons test: N2 vs IA757, P=0.0003. N2 vs IA773 P<0.0001. IA757 vs IA773
P=0.0003.
D)
A) B)
C)
N2
IA757
IA773
0
5 0 0
1 0 0 0
1 5 0 0
S tra in
Le
ng
th (
m)

Anastasios Batas 2017 Chapter 6
183
6.6 Characterisation of the moult and intermoult periods on the IA773 strain
As presented in Chapter 3, the vps-45(tm246) null mutant strain IA757 takes longer to
moult than wild type and the intermoult periods are also longer, resulting in the strain
taking significantly longer to reach adulthood from L1 arrest, than the N2 wild type strain
(~25 hours longer). To assess the impact of the svp (ij117) suppressor, these phenotypes
were measured in the IA773 strain.
Synchronised IA773 L1 larvae were seeded at the same time on NGM plates, were left to
grow until the moulting process started and the duration of the moult was measured
(section 3.9). IA773 animals exhibit a delayed entry into the moult in the same way the
IA757 strain did. The first lethargic larvae for the wild type strain were observed at 22
hours of culturing from synchrony and two hours later for the IA757 and IA773 strains.
Both the IA757 and IA773 populations appeared to remain in the lethargic state for longer
than the wild type. On average the populations for both IA757, and IA773 required
approximately 14 hours to exit the moulting state completely compared to 10 hours for the
wild type (Figure 6.4 A). Additionally, it appears that more larvae were in lethargus at the
same time at the peak of the moult for the IA773 population, as indicated by the higher
peaks of the curves, at approximately 70% of the population as compared to 60% for the
N2 and IA757 strains (Figure 6.4 A).
As previously described on Chapter 3 (section 3.9) the high peaks in the moulting graphs
suggest high synchrony whereas low peaks suggest less synchrony in the population.
Additionally, the area under the curve was measured for each of the individual experiments
for each of the strains (Appendix 2) and the average area was plotted for each (Figure
6.4B) as a measure of the average time each of the animals stays in lethargus (section 3.8).
No significant difference was demonstrated between IA773 and IA757 on that aspect.
However, IA773 did significantly differ compared to the wild type strain. Overall it is
suggested that both the supressed (IA773) and non-supressed (IA757) vps-45 mutants stay
in lethargus for longer than the wild type with 3 and 2.67 hours respectively as opposed to
2.05 for the wild type (Figure 6.4B).
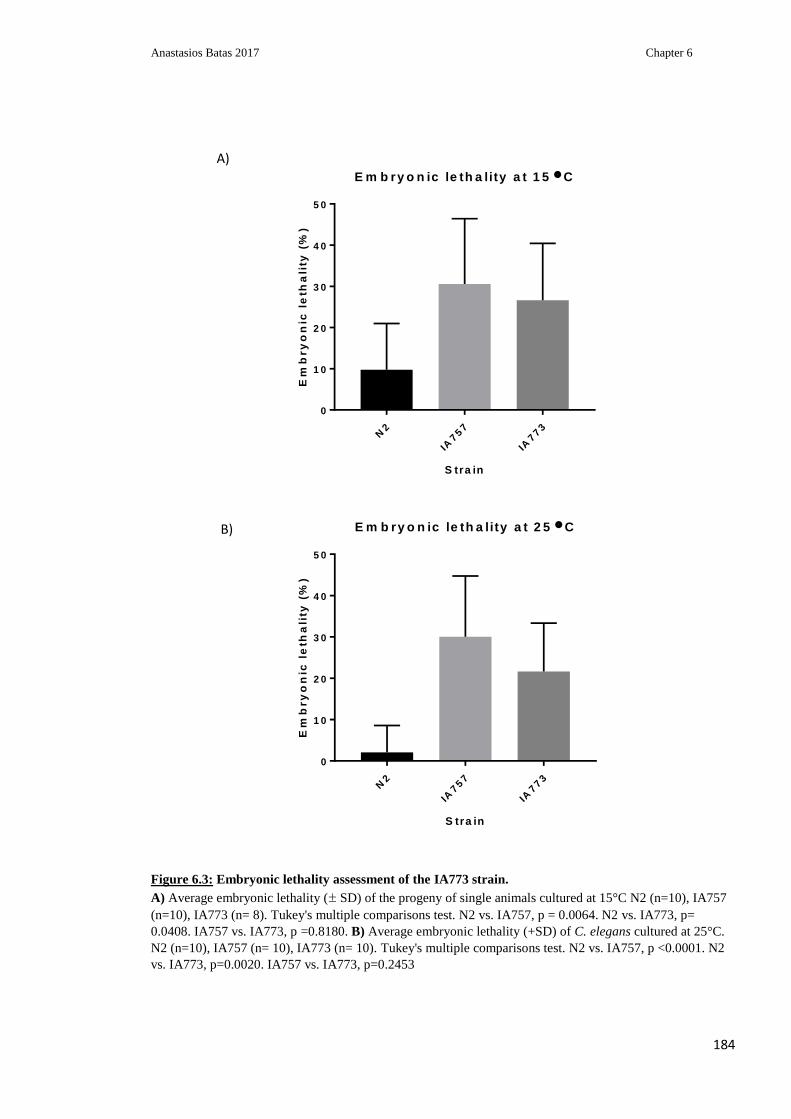
Anastasios Batas 2017 Chapter 6
184
N2
IA757
IA773
0
1 0
2 0
3 0
4 0
5 0
E m b ry o n ic le th a lity a t 1 5 C
S tra in
Em
bry
on
ic l
eth
ali
ty (
%)
N2
IA757
IA773
0
1 0
2 0
3 0
4 0
5 0
E m b ry o n ic le th a lity a t 2 5 C
S tra in
Em
bry
on
ic l
eth
ali
ty (
%)
Figure 6.3: Embryonic lethality assessment of the IA773 strain.
A) Average embryonic lethality (± SD) of the progeny of single animals cultured at 15°C N2 (n=10), IA757
(n=10), IA773 (n= 8). Tukey's multiple comparisons test. N2 vs. IA757, p = 0.0064. N2 vs. IA773, p=
0.0408. IA757 vs. IA773, p =0.8180. B) Average embryonic lethality (+SD) of C. elegans cultured at 25°C.
N2 (n=10), IA757 (n= 10), IA773 (n= 10). Tukey's multiple comparisons test. N2 vs. IA757, p <0.0001. N2
vs. IA773, p=0.0020. IA757 vs. IA773, p=0.2453
A)
B)

Anastasios Batas 2017 Chapter 6
185
0 5 1 0 1 5
0
2 0
4 0
6 0
8 0
1 0 0
T im e (h )
% l
eth
arg
ic a
nim
als
N2
IA 7 5 7
IA 7 7 3
N2
IA757
IA773
0
1
2
3
4
S t r a in n a m e
Av
era
ge
mo
ltin
g t
ime
pe
r a
nim
al
(h)
Figure 6.4: Moulting profiles of wild type N2, IA757, IA773 during the L1-L2 moult at 15°C.
A) Percentage of moulting animals (± SD) at hourly intervals for the duration of the moult for each of strain
populations. Average of three experiments for each strain. B) Average time required for each strain go through
the moult as the product of the calculation of the average area under the curve (±SD) for each moulting graphs
obtained from the triplicate experiments of each strain tested. Tukey's multiple comparisons test. N2 vs. IA757,
p= 0.1327. N2 vs. IA773, p= 0.0272. IA757 vs. IA773, p= 0.4554.
A)
B)

Anastasios Batas 2017 Chapter 6
186
In order to, verify and accurately measure this prolonged lethargic state for the IA773
strain the moult duration of individual larvae was scored. Larvae where seeded on NGM
plates after L1 arrest. 10 animals were individually observed as they entered the L1-L2
moults. The duration of the moult was scored as it was previously done with the N2 and
IA757 strains (section 3.9). Individual animals were observed under the microscope, at
hourly intervals, from the moment they entered lethargus (stop of movement and
pharyngeal pumping) until the moment they exit lethargus (onset of movement and start of
ecdysis). The results indicate that the IA773 strains required 7.63 to progress through the
moult whereas previously acquired data (section 3.9) showed that the wild type and IA757
strains required 5.3 and 7.15 hours respectively. Overall an apparent small increase in the
moulting time of the IA773 strain compared to the IA757 strain which however is not
significant (Figure 6.5B). Therefore, the svp (ij117) suppressor does not change these
aspects of moulting behaviour exhibited by the IA757 strain.
The duration of development from L1 arrested larvae to adult was tested next, in the IA773
strain. Populations of L1 arrested animals where left to feed until they reached the adult
stage at 15°C. IA773 animals require longer to reach the adult stage compared to the wild
type strain, which was the same as the time required for IA757 to reach the same stage. In
previous experiments (Section 3.9) it was shown that the wild type, was able to reach the
adult stage after approximately 100 hours of development when cultured at 15°C whereas
IA757 require 125 hours to reach the same stage. In this case, the IA773 required 125
hours as well to reach adult (Figure 6.5 A). Considering that IA773 requires ~ 2,5 hours
longer for the L1 to L2 moult compared to the N2 wild type (Figure 6.5B) this suggests
that an additional 10 hours are required to go through each of the larval moults until
adulthood assuming that each molt requires the same time to be completed as indicated by
the expression of moulting genes (Johnstone & Barry 1996). Since an extra 15 hours
appear to be required there is strong indication, that the IA773 strain also has longer
intermoult stages compared to the wild type, in the same way IA757 does as already
discussed (Section 3.9).
Finally, IA773 was also tested for levels of asynchrony during larval development.
Arrested L1 larvae were seeded on NGM plates and where left of feed for 72 hours. No
differences where observed in terms of how synchronous the populations where as far the
developmental stage is concerned. The majority of the IA773 population, approximately
94.7 % on average, was able to reach the L3 stage after 72 hours of development and a

Anastasios Batas 2017 Chapter 6
187
small proportion, approximately 5.2% was at the L4 stage (Figure 6.6). Data previously
acquired for the N2 and IA757 strains demonstrated that, the wild type strain had already
reached the L4 stage by 72 hours of development with 96.4% of the population being at
that stage and 3.6% being at the L3 stage. Furthermore, the IA757 population had delayed
development with 88.1% of the population being at the L3 stage and 9.5% being at the L4
stage. Overall, the IA773 strains were one stage behind at the L3 stage after 72 hours of
development similar to the IA757 strain, with negligible asynchrony in the populations of
the animals (Appendix 3).
This was similar to the data presented for IA757 in Chapter 3, where 88% of the
population was at the L3 larval stage ,~9.2% at the L4 stage and ~2% at the L2 stage
.(Figure 6.6) . In both cases, most animals are at the L3 stage. As a result, there is a delay
in development from L1 larva to adult, but the absence of multiple developmental stages
present at any one time during culture suggests that there is not a great loss of synchrony
and that the svp (ij117) suppressor did not affect the development speed and synchrony of
the vps-45 mutant animals.
N2
IA757
IA773
0
5 0
1 0 0
1 5 0
H o u rs to a d u lth o o d
S tra in
Tim
e (
ho
urs
)
A)

Anastasios Batas 2017 Chapter 6
188
N2
IA757
IA773
0
2
4
6
8
1 0
S tra in
Tim
e (
ho
urs
)
D u ra tio n o f m o lt
Figure 6.5: Moulting duration and development time characterisation of the IA773 strain.
A) Average development time (± SD) for >50% the population to reach adult stage from L1 arrest, for wild
type N2 (n=5), vps-45 (tm246) strain (IA757) (n=5), svp (ij117) strain (IA773) (n=5) when cultured at 15°C.
Tukey’s multiple comparison test N2 vs IA757, P<0.0001. N2 vs IA773, P<0.0001. IA757 vs IA773, P=0.9643.
B) Average time (+SD) for the completion of moult at the L1-L2 when cultured at 15°C, N2 (n=12), IA757
(n=10), IA773 (n=12). Tukey’s multiple comparison test N2 vs IA757, P<0.0001. N2 vs IA773, P<0.0001.
IA757 vs IA773, P=0.2795. Average time ±SD
6.7 Determination of lifespan for the IA773 strain
As previously presented on Chapter 3 the IA757 strain has a shorter lifespan compared to
the wild type strain at both the permissive and non-permissive temperature for the vps-45
(tm246) moulting death. To assess how the svp (ij117) suppressor affects the longevity of
the vps-45 mutants the IA773 adult C. elegans were cultured at the 15°C and 25°C and the
survival of the population was scored over time.
The IA773 population exhibited a median survival of 8 days and an overall survival of 17
days when cultured at 15°C (Figure 6.7A). This is significantly lower to the previously
demonstrated median survival of 17 days and an overall survival of 36 days for the N2
strain (Section 3.10, Figure 6.7A). It is also very similar to the data already obtained for the
IA757 strain, which demonstrated a median survival of 6 days and complete death of all
the animals after 18 days.
B)

Anastasios Batas 2017 Chapter 6
189
At the non-permissive temperature of 25 °C the median survival for the IA773 strain was 4
days and it reached 0% survival after 12 days (Figure 6.7B). This was lower compared to
the data obtained for the N2 wild type strain which had a median survival of 6 days.
However, the overall survival for the wild type strain was 13 days (Section 3.10, Figure
6.7B,) which is similar to that demonstrated by the IA773 strain. On the other hand, the
median survival of IA757 strain was 3 days. All animals were dead after 7 days for the
same strain (Section 3.10, Figure 6.7B).
As such, in both cases the suppressed IA773 had a 25% increase in their median survival
compared to their non-supressed counterparts, which however resulted in an increased
population lifespan only in the case of the 25°C cultures. Overall one can argue that the
adult lifespan of the supressed vps-45 (tm246) mutant is higher than that of the non-
suppressed one at 25°C and that the suppressed strain exhibits a better overall fitness in
both 15°C and 25°C as opposed to the non-supressed one as a result of the increased
median survival.
Figure 6.6: Developmental stage of N2, IA757, IA773 strains after 72h of development, from L1 arrest,
at 15°C
IA757 and IA773 appear to be at the L3 and L4 stage for the majority of the population. N2 strains is at the
L4 stage. Average of three experiments for each strain.
0 20 40 60 80 100 120
N2
IA757
IA773
% of C.elegans at each developmental stage after 72h, from synchrony
L4 L3 L2 L1

Anastasios Batas 2017 Chapter 6
190
0 1 0 2 0 3 0 4 0
0
5 0
1 0 0
L ife s p a n a t 1 5 °C
D a y s e la p s e d
Pe
rc
en
t s
urv
iva
l
N2
IA 7 5 7
IA 7 7 3
0 5 1 0 1 5
0
5 0
1 0 0
L ife s p a n a t 2 5 °C
D a y s e la p s e d
Pe
rc
en
t s
urv
iva
l
N2
IA 7 5 7
IA 7 7 3
Figure 6.7: Life span of N2, IA757, IA773 C. elegans at 15°C and 25°C. 3 populations of 50 young adults
where observed for each of the strains.. A) Survival of adult C. elegans at 15°C. Log rank test for
comparison of the curves. N2 vs IA757, p<0.0001. N2 vs IA773, p<0.0001. IA757 vs IA773, p= 0.32 B) Survival
of adult C. elegans at 25°C. Log rank test for comparison of the curves. N2 vs IA757, p<0.0001. N2 vs CB369,
p<0.0001. IA757 vs IA773, p<0.0001. P values <0.017 are considered significant as determined by the
Bonferroni method for threshold determination.
A)
B)

Anastasios Batas 2017 Chapter 6
191
6.8 The svp (ij117) suppressor follows a recessive and autosomal inheritance
pattern
To test the genetic behaviour of the suppressor, the inheritance pattern of the svp (ij117)
allele was investigated through a cross with wild type N2 males. The vps-45 gene is on the
X chromosome and the location of the suppressor svp (ij117) is unknown. C. elegans males
have only one X chromosome and are diploid for autosomes. Outcrossed F1 males from
this cross would have a single vps-45 (tm246) X chromosome inherited from their mother
and for autosomes they would carry one from each parent. Outcrossed F1 hermaphrodites
would carry a copy of all chromosome from each parent and thus would be vps-45 (tm246)
/ + on the X chromosome. For this experiment, there are in principle two possible
outcomes for males:
• Outcome 1 - outcrossed male animals suppressed for the larval arrest at
25 °C.
• Outcome 2 - outcrossed male animals not suppressed for the larval
arrest at 25 °C.
Outcome 1 would indicate one of two possibilities; either the suppressor is dominant if it is
autosomal (heterozygotic state of the allele in these males) or that it is X-linked and as a
result segregates together with vps-45 (tm246) in the hemizygotic state.
Outcome 2 would indicate that the suppressor is not X-linked and that it is autosomal
recessive. In this case, the autosomal heterozygotic svp (ij117) would not be able to
suppress the 25°C larval arrest caused by the hemizygotic vps-45 (tm246).

Anastasios Batas 2017 Chapter 6
192
To assess which of these possible outcomes holds true, the procedure described below, was
followed:
• 10 wild type males were crossed with a single IA773 hermaphrodite. 15 crosses
were prepared and as a result 15 F1 populations were generated.
• The F1 brood of each hermaphrodite was divided approximately equally between
two plates
• For each brood, 1 plate was cultured at 15°C and the other at 25°C.
• The proportion of males to hermaphrodite F1 progeny for each mated
hermaphrodite at each temperature were compared.
• If the frequency of males generated (as surviving adults) was much lower at 25°C
versus 15°C, then it was concluded that the males are dying at 25°C but
hermaphrodites were not.
• If the frequency of males generated (as surviving adults) is the same at 25°C versus
15°C, then F1 males were surviving at 25°C
The data demonstrated that F1 progeny from the same parent, only contained similar
numbers of surviving males and with hermaphrodites when cultured at the permissive
15°C. By contrast at 25°C very small numbers of males survived by comparison to
hermaphrodites. Thus, a high proportion of the males relative to hermaphrodites were not
surviving to adulthood at the non-permissive temperature. (Table 6.1).
As discussed above, this suggests that the svp (ij117) allele which causes the suppression
of the vps-45 (tm246) moulting death and larval arrest, follows a recessive and autosomal
pattern of inheritance. The vps-45 gene is an X-linked gene. Male C. elegans have only one
X-chromosome and the single maternally-derived copy of the mutant vps-45 (tm246) allele
results in the moulting death phenotype at 25°C in these animals. In the case of the
outcrossed F1 generation all hermaphrodites should be heterozygotic for both the vps-45
(tm246) allele and the suppressor svp (ij117) allele. If the svp (ij117) allele was dominant
or X-linked the male animals should be able to survive at the non-permissive temperature
(Table 6.1), which is not the case.
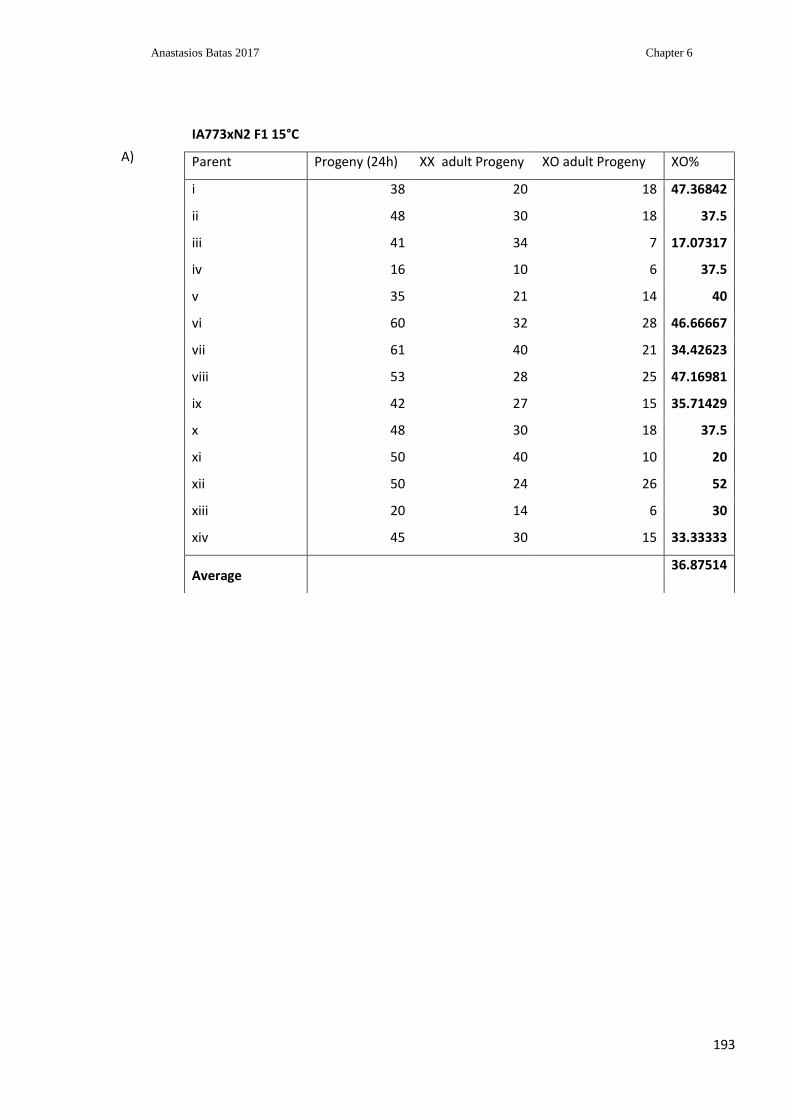
Anastasios Batas 2017 Chapter 6
193
IA773xN2 F1 15°C
Parent Progeny (24h) XX adult Progeny XO adult Progeny XO%
i 38 20 18 47.36842
ii 48 30 18 37.5
iii 41 34 7 17.07317
iv 16 10 6 37.5
v 35 21 14 40
vi 60 32 28 46.66667
vii 61 40 21 34.42623
viii 53 28 25 47.16981
ix 42 27 15 35.71429
x 48 30 18 37.5
xi 50 40 10 20
xii 50 24 26 52
xiii 20 14 6 30
xiv 45 30 15 33.33333
Average 36.87514
A)

Anastasios Batas 2017 Chapter 6
194
Table 6.1: Inheritance pattern of the svp (ij117) suppressor allele
A) Table showing the progeny of svp (ij117), (IA773) hermaphrodites crossed with wild type (N2) males
after 24 hours of egg laying, 15 crosses were set up. Egg laying was done at 15°C. B) Table of progeny for
each of the crosses originating from Table A selected to grow at 15°C. Hatched eggs after 24 hours and
surviving progeny after 72 hours are shown. C) Table of progeny for each of the crosses originating from
Table A selected to grow at 25°C. Hatched eggs after 24 hours and surviving progeny after 72 hours are
shown.
IA773xN2 F1 25°C
Parent Progeny (24h) XX adult Progeny XO adult Progeny XO%
i 30 19 0 0
ii 40 25 3 7.5
iii 35 19 1 2.857143
iv 15 10 1 6.666667
v 35 23 0 0
vi 60 36 2 3.333333
vii 60 40 5 8.333333
viii 50 28 1 2
ix 35 23 1 2.857143
x 42 18 2 4.761905
xi 55 27 0 0
xii 37 23 2 5.405405
xiii 22 12 0 0
xiv 43 19 2 4.651163
Average 3.454721
B)

Anastasios Batas 2017 Chapter 6
195
6.9 Introduction of the vps-45 (tm246) deletion allele and svp (ij117)
suppressor, into ‘Hawaiian’ genetic background for whole genome sequencing
analysis
In order to identify the suppressor for the temperature sensitive molting death of the vps-45
null mutant a combination of traditional SNP mapping and next generation sequencing was
employed as previously described in the introduction (section 1.1.8). As already mentioned
this method has already been utilized in C. elegans (Doitsidou et al. 2010b). It has already
been shown that the Hawaiian genome does not appear to suppress the vps-45 (tm246)
molting arrest phenotype, a critical factor for the use of this method (Section 6.1). As a
result, the Hawaiian genome could be used as the reference genome for the mapping and
40 independent homozygotic lines for both the svp (ij117) suppressor and the vps-45
(tm246) null mutant created in the Hawaiian genetic background.
The Hawaiian C. elegans strain is wild type but has multiple polymorphisms on all
chromosomes, which make its genome distinct from the N2 Bristol strain which was used
for the creation of the IA757 strain and as a result was also the genetic background of its
EMS isolated suppressor. As such, when the two are crossed their F1 progeny will have
one set of “Bristol chromosomes” and one set of “Hawaiian chromosomes”.
Recombination can occur between chromosome pairs. Recombination will be possible
across the entire C. elegans genome, but by selecting for homozygosity for the vps-45
(tm246) mutation and its suppressor, genomic regions containing these genes and closely
linked sequences must remain Bristol. On the other hand, unlinked DNA sequence will
tend towards a 50% Bristol and 50% Hawaiian ratio (Figure 1.5).
The 40 independent lines used for sequencing are generated from 40 independent F2
animals homozygotic for the vps-45 (tm246) allele and its suppressor. Homozygosity for
vps-45 (tm246) was verified via PCR and for the suppressor by survival at 25°C. To
achieve this IA773 hermaphrodites were crossed with CB4856 (wild type Hawaiian)
males. F1 hermaphrodites were picked and individually left to egg lay a F2 brood. After
egg laying, the F1 parents were lysed and PCR was carried out with their DNA to test for
the presence of both the wild-type and mutant vps-45 (tm246) alleles (thus ensuring that
the F1 animals selected were outcrossed and not the result of IA773 self-progeny. PCR
verified that the hermaphrodites were indeed outcrossed since they were heterozygotic for

Anastasios Batas 2017 Chapter 6
196
the vps-45 (tm246) null allele as previously discussed in Chapter 3, section 3.4 (Figure
6.8).
Figure 6.8: Representative gel for detection of vps-45 (tm246) allele.
Primers used are described in materials and methods. 629bp band corresponds to the wild type allele for the
wild type vps-45 and 480bp to the TM246 null vps-45 allele.
To increase the possibility of getting that double homozygotic strain selection was done in
two stages. Initially worms were cultured at 15°C at which stage all IA757 animals will be
able to survive, with or without the suppressor. Single hermaphrodites from each F2 plate
were then transferred to new plates and left to generate a brood by selfing.
Multiworm lysates that were prepared from those broods and were genotyped using PCR,
and those homozygotic for the vps-45 (tm246) were transferred at 25°C to grow. At this
stage, only animals also homozygotic for the suppressor should be able to survive, thus
having the double homozygotic lines, which will be carrying Hawaiian wild type DNA.
500 bp -
200 bp
650 bp -
1000 bp -
Samples

Anastasios Batas 2017 Chapter 6
197
All lines were further tested to establish that they were carrying Hawaiian DNA in
addition to the vps-45 (tm246) mutation and its suppressor. Three sets of primers were used
for this purpose (Bazan & Hillers 2011). One set amplifies a sequence at Chromosome I in
both Bristol (N2) and Hawaiian (CB4856) wild type strains, which produces a band of
594bp. A second primer set amplifies a sequence on Chromosome IV, which produces a
band of 852bp. Finally, the third set can amplify a sequence of 528bp for Chromosome V.
In each case, the amplified band contains a SNP between Hawaiian and Bristol DNA at an
enzyme restriction site. Depending on the sequence only the Bristol or the Hawaiian
sequence can be digested on each case producing two distinct fragments (Figure 6.9). All
lines produced were checked for the presence of Hawaiian DNA across all three
chromosomes. All 40 supressed lines for the moulting death at the non-permissive
temperature were lysed and their DNA was purified and mixed in a single solution in equal
amounts (Appendices 4-7) and were sent for Illumina sequencing.
6.10 Next generation sequencing analysis of the svp (ij117) vps-45 (tm246)
supressed mutants in Hawaiian background
Analysis of the result obtained by the next generation sequencing process was conducted
by the University of Glasgow Polyomics department using a Modified Cloudmap pipeline
on the Galaxy platform (Minevich et al. 2012). The reads were aligned to the reference
genome using bowtie2 (Langmead et al. 2009). Duplicate aligning reads were marked
using Picard MarkDuplicates from SAMtools (Li et al. 2009). Reads around indels were
realigned to eliminate false SNPs around the indels, using GATK (Genome Analysis
Toolkit) Realigner Target Creator and Indel Realigner. Variants were then called using
GATK Unified Genotyper (DePristo et al. 2011). The variant sites were filtered for read
depth coverage of greater than 3 reads. The variant recombination frequencies were plotted
using the custom CloudMap module, CloudMap: Hawaiian

Anastasios Batas 2017 Chapter 6
198
Figure 6.9: Representative PCR for the detection of “Hawaiian” and “Bristol” DNA.
Sequences are amplified for each. The presence or absence of the Hawaiian SNP allows the appropriate
enzyme to cut the sequence in each case. Fragment sizes and enzymes used are detailed in sections 2.3.14
and 2.3.15.4.
Variant Mapping. Results were returned and are shown below. Two graphs were produced
for each of the six chromosomes (LGI-V, LGX), a scatter graph and a frequency plot. The
scatter graph represents the ratio of mapping strain nucleotides, in this case the Hawaiian
strain over the mutant strain, in this case Bristol at all SNP positions. Chromosomes which
contain regions of linkage, meaning the area where the mutation to be identified will be
present will have regions where the frequency of mapping strain (Hawaiian wild type
strain) reads will be equal or close to 0, and consequently the reference genome reads
(Bristol wild type strain) will be approaching a frequency equal or close to 1. The
corresponding plots for those regions will have data points lying on the X axis. To better
visualise these regions where the frequency approaches zero on the scatter maps, a LOESS
regression line is also produced (red line). Those data can then be normalised to produce
frequency plots which show the regions of linked chromosomes where pure parental
(mutant strain) alleles are concentrated (Minevich et al. 2012). On those plots 1Mb areas
(-) N2 CB
ChrI ChrIV ChrV
(-) N2 CB (-) N2 CB
500 bp -
200 bp -
650 bp -
1000 bp -

Anastasios Batas 2017 Chapter 6
199
for the 0 ratio SNP positions are coloured in grey and 0.5Mb areas in red. A strong linkage
signal was observed at chromosome X. The frequency of the mapping strain reads at this
point is zero and the LOESS regression line is adjacent on the x-axis of the graph. This
signal corresponds to the vps-45 deletion. This strong signal for the reference Bristol DNA
demonstrated that the process had worked (Figure 6.10). Three more regions were
observed where there was a signal pointing to parental allele representation in the genome.
Those were on Chromosome I, II and V (Figure 6.10). The Chromosome I region was
quickly disregarded. There is a common known incompatibility at this position arising
from two genes (zeel-1, and peel-1) between Hawaiian and Bristol strain which often arises
when using full genome sequencing for the identification of mutants, when using a
mapping strain [reviewed in (Seidel et al. 2008)]. As a result, only two regions remained
which showed a potential signal for the suppressor. However, the frequency of mapping
strain reads , despite being low, wasn’t close enough to zero to point to the location of a
single allele (Figure 6.10).
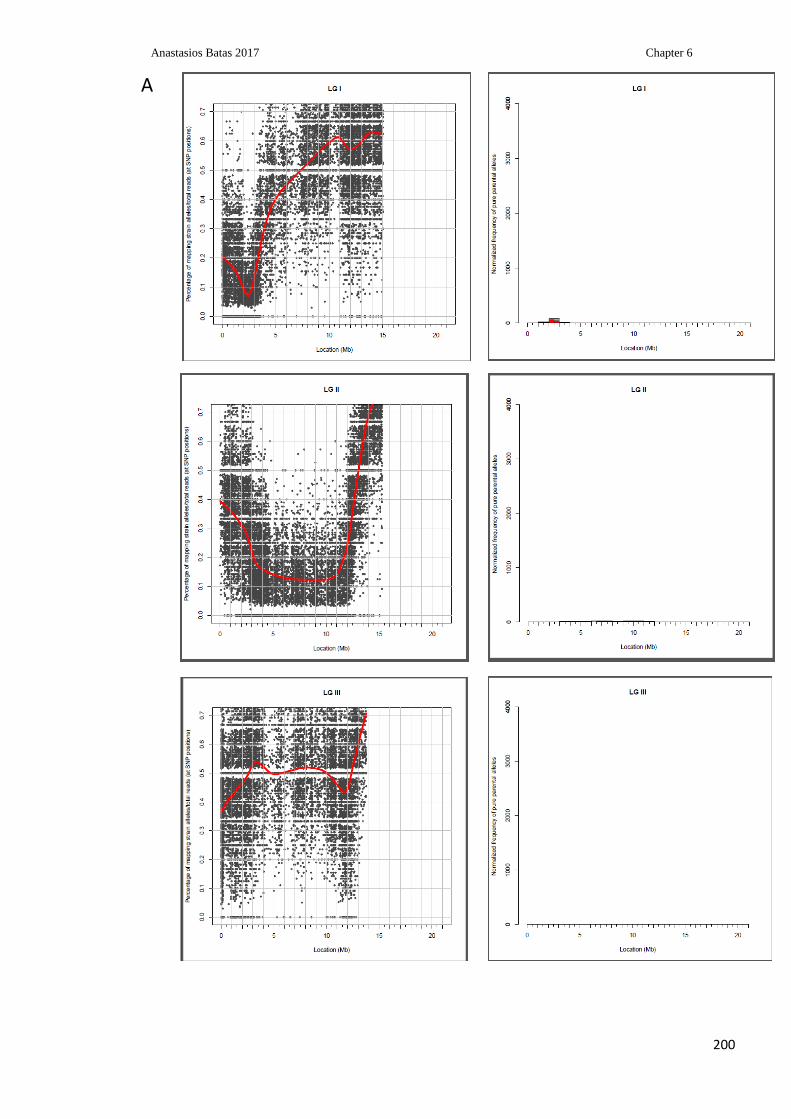
Anastasios Batas 2017 Chapter 6
200
A
)

Anastasios Batas 2017 Chapter 6
201
B)

Anastasios Batas 2017 Chapter 6
202
Figure 6.10: Cloudmap results as retrieved by the analysis of the full genome sequencing data obtained
by the Galaxy software for the identification of the svp (ij117) suppressor allele.
Scatterplots for each SNP are shown for each chromosome on the right and accompanied by a frequency plot
which displays the linked chromosomal regions where pure parental alleles (Bristol) are concentrated. A)
SNP scatterplots for Chromosomes I (LG1), II (LG II and III (LGIII). B) SNP scatterplots for Chromosomes
IV (LG IV), V (LG V) and X (LG X) (Previous page).
6.11 Identification of candidate suppressors for the vps-45 (tm246) moulting
arrest
Two regions stood out which showed a possible signal for a potential suppressor, a region
on chromosome II and a region on chromosome V. However, the frequency of the mapping
strain reads is not low enough to propose a definite single suppression region and
especially in chromosome II too widespread not producing a single peak. Chromosome II
however appeared to the most likely region for the suppressor since it exhibited a lower
frequency of Bristol/reference strain reads with 90% of the total reads being Bristol and
approximately 10% being Hawaiian. (Figure 6.10). On the other hand, on chromosome V
approximately 80% of the total reads was Bristol and only 20% was Hawaiian (Figure
6.10). Therefore, a stronger possible linkage to Bristol DNA is observed at chromosome II
and thus it was selected for the attempted identification of candidate genes as suppressors.
To identify candidate suppressors, the DNA sequence of the region of chromosome II was
compared against that of the wild type Bristol genome sequence, looking for DNA
sequence changes that could alter gene function. These included nonsense and
nonsynonymous changes within coding sequence, splice site mutations, deletions etc.
(Minevich et al. 2012). In the chromosome II region of 5-10mb where a strong Bristol
signal was indicated (Figure 6.11). In total 31 genes were identified with potentially
functional sequence changes relative to the N2 wild type sequence as shown in table 6.2.

Anastasios Batas 2017 Chapter 6
203
6.12 Testing of the candidate genes for suppression of the vps-45 (tm246)
using RNAi
The candidate suppressor genes that were previously retrieved from the full genome
sequencing (Table 6.2) were tested for the ability to supress the vps-45 (tm246) moulting
death phenotype using RNAi. This was done under the assumption that the mutations in
these genes is a loss of function and as a quick method that would easily identify such an
effect if it was present. Approximately, 100 L1 arrested larvae were cultured on plates
seeded with the HT115 RNAi expressing bacterial strain. Bacteria carrying the empty
vector were used for the culturing of the IA757, IA773 and N2 strains were used as the
negative controls for the RNAi effect. The bacterial strains expressing each of the
candidate suppressor genes to be silenced were fed to the IA757 strain as described on
section 2.3.21. Five of those genes were not available in our RNAi library so they were not
tested these were ptc-2, pah-1, kin-6 and the unannotated regions Y110A2AM.1 and
ZK945.7. The survival of each of the treated strains was assessed throughout development
at 25°C. Larvae were observed over the period of development from the L1 stage to
adulthood. Their survival was measured and compared to IA757, IA773 and the N2 strains.
(Table 6.2, Figure 6.11).
None of those candidates that were tested was able to supress the molting death at the non-
permissive temperature, as in no case any of the RNAi affected animals exhibited a median
survival higher than 96 hours which was also observed for the IA757 strain, genotype vps-
45 (tm246). None of the tested RNAi seemed to be preventing the vps-45 (tm246) 25°C
moulting death and none of them came close to simulating the IA773 supressed strain
(Figure 6.11).

Anastasios Batas 2017 Chapter 6
204
Table 6.2: List of candidate suppressors retrieved from sequencing results for the C. elegans
chromosome II.
Cosmid code and gene name are provided. Position of oligos that were used to check for lines that are not
homozygotic for Bristol DNA in the region, indicated as the ‘Right side’ and ‘Left side’ of the chromosome
and the linkage region that was identified.
Cosmid Gene name
map position
W04H10.3 nhl-3 -15.59
Y110A2AM.1 -9.38
Y8A9A.2 -6.21
F59A6.4 -2.6
C27A2.6 dsh-2 -2.54
C34F11.9 dsh-1 -1.93
B0034.5 -0.77
F21H12.4 ptc-2 -0.55
K03H9.3 -0.3
C56E6.1 abcx-1 -0.16
T14B4.2 0.05
F41G3.2 0.09
C52E12.2 unc-104 0.21
F43E2.4 haf-2 0.5
R153.1 pde-4 0.51
B0495.6 0.53
B0495.5 0.53
B0495.7 0.53
B0495.10 cpna-5 0.54
B0228.6 0.56
M110.5 dab-1 0.75
K08F8.4 pah-1 0.88
W07A12.5 col-78 1.05
ZK945.7 1.9
ZK945.8 1.9
C07E3.1 stip-1 2.44
ZK673.9 clec-143 2.65
VM106R.1 3.13
R06F6.2 vps-11 3.13
ZK20.2 kin-6 3.8
Y81G3A.3 gcn-2 14.1
-17.9 T25D3
(A) -14.5 R52 (B)
-4 M03A1 (C)
Left side
ochromosome

Anastasios Batas 2017 Chapter 6
205
0 5 0 1 0 0 1 5 0
0 .0
0 .5
1 .0
T im e (h )
Fra
cti
on
su
rviv
al
N 2 R N A i( -)
IA 7 5 7 R N A i( - )
IA 7 7 3 R N A I ( - )
W 0 4 H 1 0 .3
F 5 9 A 6 .4
C 2 7 A 2 .6
C 5 6 E 6 .1
F 4 1 G 3 .2
R 1 5 3 .1
B 0 4 9 5 .6
B 0 2 2 8 .6
V M 1 0 6 R .1
Y 8 A 9 A .2
B 0 0 3 4 .5
K 0 3 H 9 .3
T 1 4 B 4 .2
C 5 2 E 1 2 .2
F 4 3 E 2 .4
B 0 4 9 5 .5
B 0 4 9 5 .1 0
M 1 1 0 .5
W 0 7 A 1 2 .5
Z K 9 4 5 .8
C 0 7 E 3 .1
Z K 6 7 3 .9
R 0 6 F 6 .2
Y 8 1 G 3 A .3
Figure 6.11: Survival fraction of animals under a period of 6 days, under the influence of RNAi
for each of the candidate suppressor genes.
Animals were inoculated as synchronised L1 larvae onto the plates. Initial inoculate for each
sample was 90-100 L1 larvae. All samples were cultured at 25°C. Median survivals: N2 RNAi(-)
Undefined, IA757 RNAi(-) 96 hours, IA773 RNAI (-) Undefined, W04H10.3 96 hours, F59A6.4 48
hours, C27A2.6 72 hours, C56E6.1 19 hours, F41G3.2 26 hours, R153.1 19 hours, B0495.6 48
hours, B0228.6 34 hours, VM106R.1 26 hours, Y8A9A.2 49 hours, B0034.5 19 hours, K03H9.3 12
hours, T14B4.2 26 hours, C52E12.2 34 hours, F43E2.4 26 hours, B0495.5 26 hours, B0495.10 19
hours, M110.5 12 hours, W07A12.5 19 hours, ZK945.8 12 hours, C07E3.1 26 hours, ZK673.9 19
hours, R06F6.2 96 hours, Y81G3A.3 12 hours.

Anastasios Batas 2017 Chapter 6
206
6.13 Identification of two different genetic subpopulations within the vps-45
(tm246) supressed lines
Through the sequencing results presented above a possible linkage signal was identified
on chromosome II for a high proportion of Bristol DNA sequence within the 40
backcrossed populations. However, that signal did not reach 100% representation of
Bristol DNA as 10% of Hawaiian alleles was present. This contrasts with the clear
signal on the X chromosome for the vps-45(tm246) allele (Figure 6.10).
Other possibilities were therefore considered. In handling the vps-45(tm246) mutant, it
was observed that the strain frequently suppresses when cultured even although the
(tm246) allele is an extensive deletion and hence not a revertible allele. Also, in the
original EMS mutagenesis that generated the svp (ij117) suppressor, the rate of
generation of suppressors was noted to be very high. Thus, the possibility that the
IA773 strain is complex and carries more than one independent allele capable of acting
as an extragenic suppressor of vps-45(tm246) was considered. Such a model could
explain the genome sequence data described above.
To test this hypothesis, a method of SNP screening was employed to investigate each of
the original 40 lines used to produce the pool of DNA used for sequence analysis. All
40 samples that were originally sent for sequencing were screened using PCR primers
that can distinguish between Hawaiian and Bristol DNA at various positions on
chromosome near the region of interest for the suppressor as detailed in section
2.3.15.5 section of Materials and methods. The primers chosen in this case corresponds
to regions of the genome which are present at the two ends of the region with the
candidate suppressor genes that were tested and hence the region from which the
linkage signal for chromosome II originated (Table 6.2, Figure 6.12).

Anastasios Batas 2017 Chapter 6
207
Figure 6.12: Detection of Hawaiian and Bristol SNPs across the C. elegans chromosome II.
Amplified sequences using the primer pairs described on sections 2.3.14 and 2.3.15.4. Each amplified
fragment was digested with the appropriate restriction enzyme). After digestion Hawaiian DNA (CB) can
be
IIF IIE IID IIC IIB IIA
(-) N2 CB (-) N2 CB (-) N2 CB (-) N2 CB (-) N2 CB (-) N2 CB
500 bp -
200 bp -
1000 bp -

Anastasios Batas 2017 Chapter 6
208
Table 6.3: Visual representation of homozygosity of Bristol (red) or Hawaiian (green) sequences of each of the suppressed lines for Chromosome II.
Suppressed Hawaiian vps-45 (tm246) mutant lines 23, 29, 35, 38 and 39 exhibit no homozygotic region for the Bristol alleles in any of the areas tested despite suggesting they could be
carrying a different suppressor allele at a different chromosome.
1 2 3 4 5 6 7 8 9 10 11 12 13 14 15 16 17 18 19 20
A B B H B B B B H B B B H B H B H B H B B B B B B
B B B H B B B B H B B B H B H H B H B B B B B B
C B B B B B B B B B B B B B B B B B B B B
D B B H B B B B B B B B B B H B B B B H B B H B B
E B H B H B B B H B H B B H B B H B B B H B H H B H H B
F H H B B H B H B H B B H B H B B B B B H B H B H B H B H B
21 22 23 24 25 26 27 28 29 30 31 32 33 34 35 36 37 38 39 40
A B H H B B H B H B B H H H B B H B H B H H B H B
B B H H B B B B B H H B B H B H B H H B H B
C B B H B B B B B H B B B B B H B B H B H B
D B H B H B H B B H B B H B B B B B H B B H B H B H
E B H B H H B H B H B H B B H B H B H B B H B H B H B H H B H
F B H B B H B H B H B H B H B H B H B B H B H B B H B H B H B B H B H B H

Anastasios Batas 2017 Chapter 6
209
Using the data obtained from the PCR amplification of DNA for each of the lines a table
was constructed which allowed for the classification of each of the 40 lines as homozygotic
for the Bristol SNP or homozygotic for the Hawaiian SNP or heterozygotic (Hawaiian and
Bristol) for each. From the 40 samples, 35 were identified as homozygotic for the Bristol
DNA at least in one of the positions tested for chromosome II SNP C (Table 6.3).
Interestingly, five of the lines that were sent for sequencing don’t have a homozygotic
region for Bristol DNA on chromosome II as detected by this low resolution SNP-mapping
method (Table 6.3). These were lines 23, 29, 35, 38 and 39. Therefore the possibility that a
suppressor does map to the chromosome II region identified, but not in these 5 lines was
considered. However, all lines can survive at 25°C, so for this to be true there would have
to be more than one suppressor allele in the strain IA773. Such a model could explain the
poor resolution in the sequencing data for the suppressor allele but perfect mapping for the
vps-45 allele. As previously stated, a large number of suppressed lines were obtained from
the original EMS mutagenesis (Section 6.1) and at a frequency that suggests either many
genes can suppress or fewer but highly mutable. Also, the original IA757 strain frequently
suppresses just by sub-culture without applying a mutagen. Therefore, perhaps having two
suppressors in one isolate is not that unlikely. The other chromosomal location for a
second suppressor could be on chromosome V where a weaker possible linkage signal was
also observed (Figure 6.10).
6.14 A second linkage area on chromosome V suggest the existence of a
second suppressor for the vps-45 (tm246) moulting arrest
To investigate the possibility of a second suppressor on chromosome V, all lines were
screened in the linkage region for the identification of SNP of Bristol or Hawaiian DNA
(Figure 6.13). The same five lines that had been previously identified for potentially not
carrying a suppressor on chromosome II stood out once again. Results showed that all of
them had a specific region which was exclusively Bristol on chromosome V snp D, for
lines 23, 29, 35, 38, 39 (Table 6.4). This region coincides with the plateau of the LOESS
regression line on the sequencing graph for chromosome V (Figure 6.10). This is
consistent with the possibility that both the region on chromosome II and on chromosome
V contain vps-45(tm246) suppressor alleles.

Anastasios Batas 2017 Chapter 6
210
The identification of two regions with reduced mapping strain SNPs (in addition to the
clear signal for vps-45 itself) from the genome sequencing could indicate that there are two
distinct genetic populations which are both supressed. If that is the case, it is possible that
despite both of these two populations (possibly 35 Chromosme II lines and 5 chromosome
V lines) being supressed for the moulting death at 25℃ they might exhibit different levels
of suppression as different genes would be involved and possibly exhibit other phenotypes,
such as different growth patterns when cultured in the permissive temperature of 15℃.
Figure 6.13: Detection of Hawaiian and Bristol SNPs across the C. elegans chromosome V
Each amplified fragment was digested with the appropriate restriction enzyme as described on sections 23.14
and 2.3.15.4 After digestion Hawaiian DNA (CB) can be distinguished from the Bristol one (N2).
N2 CB
VA
N2 CB
VC
N2 CB
VD

Anastasios Batas 2017 Chapter 6
211
1 2 3 4 5 6 7 8 9 10 11 12 13 14 15 16 17 18 19 20
A B B B B H H B B B B B B H H H H B B B B B H B H B H B H H H H H B H B H B B B B
C B B B B B B B B B B B B H H B B B B H H B B B H H H B B H H H H B B H H B B B B
D B H B H B B B B B H B B H H B B B H H H B B B H B H B H B H B B B H H H B B B B
Table 6.4: Visual representation of homozygosity of Bristol (red) or Hawaiian (green) sequences of each of the suppressed lines for chromosome V.
Suppressed Hawaiian vps-45(tm246) mutant lines 23, 29, 35, 38 and 39 exhibit exclusively Bristol DNA around the SNP D sequence
21 22 23 24 25 26 27 28 29 30 31 32 33 34 35 36 37 38 39 40
A B B B H H H H H B H H H B H B H H H B H B B B B H H B H H H B H B H H H H B H H
C B B B H H H B H H H B B B B B B H H B B B B H H B B B H B B H H B B H H B H B B
D B H B H B B B B H H B B B B B B B B B B B B B H B B B B B B B H B B B B B B B B

Anastasios Batas 2017 Chapter 6
212
6.15 At least two phenotypic sub-populations exist within the 40 suppressed
sequencing lines exhibiting different growth patterns
In order to assess if the two genetic sub-populations discussed above (chromosomes II and
V possible suppressors) exhibit any phenotypic differences with one another, both were
checked for differences in their growth pattern. Identifying different phenotypic
subpopulations which fell into the same groups as the previously identified genetic ones
enforces the idea that two suppressors exist rather than one.
As such, ten adults from each line were placed on a single plate and cultured at the non-
permissive temperature of 25°C. The time it took for each supressed line to starve was
assessed. This was an indication of the overall growth speed of the whole population. This
test provided potentially informative results. Firstly, the 5 lines that do not contain a
detected homozygotic region for Bristol genome as detected by the SNP method, lines 23,
29, 35, 38, 39, all took longer to grow to starvation and all other individual lines.
Secondly, they do not all behave quite the same; 23 and 29 appear to grow substantially
slower than 35, 38 and 39. Finally, the other 35 lines all grow substantially faster than the
parental suppressed line IA773 (Figure 6.14). This suggests a degree of genetic
complexity to the suppression and possible multiple interacting loci. Potentially more than
one loci are responsible for the suppression of the moulting death caused by the loss of
Vps45 function. Also, the 35 ‘fast’ growing lines that appear to be growing faster than the
original isolate of the suppressor (IA773) could potentially indicate that the IA773 strain
still carried mutations from the EMS screen which affect its fitness which were removed
after the backcrosses with the Hawaiian wild type strain. Alternatively, regions of the
Hawaiian genome could be enhancing the impact of EMS-induced suppressors from the
Bristol genome.
New lysates were prepared only for the 35 ‘’fast growing ‘’ lines and were mixed and
cleaned appropriately in order to be sent for sequencing again in hopes of identifying one
of the two potential alleles causing the suppression (Appendices 8-10).

Anastasios Batas 2017 Chapter 6
213
Figure 6.14: Two sub populations exhibiting different growth phenotypes within the Hawaiian svp (ij117) vps-45 (tm246) lines prepared for the sequencing
experiment.
Fast growing lines are shown with blue. The five slow growing lines are, shown in red. The control lines wild type N2 and svp (ij117)/IA773 are shown with the grey bars.
4
9
14
19
24
29
34
1 2 3 4 5 6 7 8 9
10
11
12
13
14
15
16
17
18
19
20
21
22
23
24
25
26
27
28
29
30
31
32
33
34
35
36
37
38
39
40
N2
IA7
73
Tim
e (D
ays)
Sequencing lines
Growth speed (Days to starvation) of sequencing lines

Anastasios Batas 2017 Chapter 6
214
6.16 Chapter summary
In this chapter, the IA773 suppressed strain was phenotypically characterised by being
compared to the original IA757 strain and to wild type N2. It was demonstrated that the
svp (ij117) allele almost completely suppresses the 25°C moulting death and larval arrest in
animals lacking the VPS45 protein. Furthermore, experiments showed that suppression by
the svp (ij117) suppressor allele is almost exclusive to the temperature sensitive moulting
death as the suppressor doesn’t rescue the smaller body length phenotype originally
observed for the IA757 strain, nor does it significantly alter the moulting profile, as both
the original mutant and the supressed strains require roughly 7-8 hours to go through a
moult whereas the wild type strain requires 5- hours. Furthermore, IA773 animals exhibit a
similar post-embryonic development time to the IA757 animals and both required
approximately130 hours to reach adulthood from arrested L1 larvae as opposed to the wild
type strain which can achieve the same developmental stage at 100 hours.
The svp (ij117) suppressor, on the other hand, was able to mildly suppress the embryonic
lethality exhibited by the vps-45 (tm246) homozygotic strain, however not to a degree that
was comparable to the wild type strain in the permissive (15°C) and non-permissive
temperatures (25°C). Finally, the IA773 strain exhibits a longer overall survival to IA757
at the permissive temperature and a higher median survival in both temperatures. Thus, the
suppressor does improve the lifespan of animals lacking a functional vps-45 gene and
confers a significantly increased lifespan at the non-permissive culturing temperature.
Overall, it was demonstrated that the suppressor mainly rescues the developmental arrest
and moulting death phenotype observed when mutants are cultured at 25°C.
After the suppressor allele was phenotypically characterised, the pattern of inheritance for
it was investigated. The suppressor behaved as being recessive and autosomal in the tests
performed, and a strategy was elected to identify the gene responsible for the suppression
through full genome sequencing. In order to do this the suppressor and the vps-45 deletion
mutant had to be introduced into wild type animals with Hawaiian DNA background. It
was verified that the Hawaiian polymorphisms cannot suppress the vps-45 (tm246) molting
death as worms which carried the deletion allele in Hawaiian background died after being
continuously cultured at 25°C. Hence, the 40 individual lines where produced which

Anastasios Batas 2017 Chapter 6
215
carried the vps-45 (tm246) allele and the suppressor in Hawaiian background, where lysed
and their DNA was sent for full genome sequencing.
Data retrieved from the full genome sequencing however did not point to only one locus of
suppression. Two areas of linkage for the suppressor where identified on chromosomes II
and V. Using PCR to amplify those regions around the linkage hotspots on those
chromosomes two subpopulations where identified within the 40 lines created for the
whole genome sequencing experiment. 35 of those lines exhibit linkage for DNA of Bristol
origin and hence for the suppressor on chromosome II, however 5 lines did not and only
exhibited linkage in the chromosome V region of interested. Those two subpopulations
where further phenotypically tested, the time for an original inoculate of 10 adults, to reach
starvation was assessed. The five lines which exhibited linkage on chromosome V required
overall longer to starve, thus suggesting that potentially a second suppressor is present on
chromosome V. Overall the data strongly suggest the possibility of more than one locus
which contributing to the suppression of the vps-45 (tm246) temperature sensitive molting
death in strain IA773. This is consistent both with the various lines of mapping data
(sequencing and SNP) and with the pattern of different growth rates at the non-permissive
temperature for the 40 different lines used in the sequencing. Further mapping analysis is
needed to resolve the level of complexity in this suppression of vps-45(tm 246).

Anastasios Batas 2017 Chapter 7
216
Chapter 7: Discussion
The primary focus of this work was to investigate the effect of the disruption of endosomal
trafficking and autophagy in embryonic and post embryonic development of the nematode
C. elegans.
C.elegans mutants lacking a functional vps-45 gene, exhibit a temperature sensitive
lethality where they are unable to shed their cuticle during ecdysis at the end of the molting
and die. It should be noted at this point that the vps-45 (tm246) mutant allele is a
substantial deletion and therefore it must be considered a non-revertible mutation. Despite
that, vps-45 mutants were able to supress the 25°C (non-permissive temperature) molting
death phenotype after continuous culturing at the permissive temperature of 15°C at high
frequency. This suppression of a non-revertible allele is unusual. Given the fact that the
function of VPS-45 is the correct targeting and fusion of vesicles it is hard to imagine how
suppression occurred and what spontaneous mutations might be able to suppress a non-
revertible mutation. Furthermore, how and why the vps-45 null mutants produce a
temperature sensitive phenotype, is also of particular interest. It is possible to conclude that
specificity for membrane fusion provided by VPS-45 vesicle targeting through the trans-
Golgi network, and endosomal system are sufficiently functional at 15°C to permit
survival, but somehow not at 25°C. Perhaps membrane trafficking at slower rates because
of lower temperatures is sufficiently accurate, but not so at higher temperatures.
To identify how the suppression works, an EMS mutagenesis screen was carried out in our
lab, prior to the start of this project. The screen was carried out in a relatively small sample
of ~2000 genomes, from which at least 30 independent suppressors were obtained. This
was viewed as a relatively high frequency which suggests most likely that multiple
different genes can mutate to supress the temperature sensitive lethality. Furthermore, by
taking into account the frequent spontaneous mutations at the permissive culturing
temperature as well as the high number of suppressors obtained by a relatively small EMS
screen it is easy reasonable to conclude that there are multiple genes/mechanisms through
which the suppression works.
One possibility is that the suppression could be working through activation of a stress
pathway. The elevated function of such a pathway would allow for the survival of the vps-
45 mutants. Such pathways might involve the unfolded protein response or autophagy,

Anastasios Batas 2017 Chapter 7
217
both of which could conceivably relieve potential cellular stresses caused by mistargeted or
incompletely fused vesicles.
Early observations of molting in C. elegans have indicated the rapid dissapearance of
Golgi bodies and excessive membranes at the end of each molt. These were formed in the
hypodermis of animals during the molt (Singh & Sulston 1978). It is reasonable to suggest
that autophagy is the most likely mechanism responsible for this clearance of these
structures at the end of the moult.
On the other hand, C. elegans lacking a functional VPS-45 protein exhibit a temperature
sensitive moulting death phenotype, where they are unable to shed their cuticle and
complete the moult (Gengyo-Ando et al. 2007). Therefore, a possible relation between the
autophagy, the endocytic pathway and moulting could exist.
To answer the above questions, a suppressor for the vps-45 C. elegans temperature
sensitive lethal phenotype was isolated and using next-generation sequencing and classic
genetic approaches two possible chromosomal regions where potential suppressors might
map were identified. Furthermore, unc-51 and vps-45 C. elegans mutants defective for
endosomal trafficking and autophagy respectively, were compared and phenotypically
characterised during embryonic and post embryonic development (during the moult), with
the aim of identifying any similarities or differences. In addition to this, a unc-51 vps-45
double mutant was created and a synthetically lethal phenotype was identified possibly
suggesting a functional relationship between the two genes. Furthermore, the process of
autophagy was characterised in the hypodermal seam cells, which take part in the secretion
of cuticular components during the moult, in both unc-51 and vps-45 mutants providing
further proof for the involvement autophagy in this developmental process. Finally, the
sensitivity of these mutant to oxidative stress as well as the redox state of the ER was
assessed, in an attempt to identify cause for the previously identified apoptosis of
neutrophil cells in humans carrying the T224N mutation on the Vps45 gene (P. Stepensky
et al. 2013). It was demonstrated that vps-45 and unc-51 mutants exhibited an oxidised
environment and higher sensitivity to oxidative stress, with the latter exhibiting the
stronger phenotype.
Anastasios Batas 2017 Chapter 7
218
7.1 Characterisation and identification of the vps-45 (tm246) molting death
suppressor
The suppressed strain which was isolated from the EMS screen was subjected to several
comparisons with the wild type strain in order to determine what other phenotypes apart
from the moulting arrest at 25°C were suppressed or altered (Section 6.3). Overall, the
supressed strain was very similar to the original vps-45 (tm246) mutant strain. They
showed a very similar body size (slightly smaller than wild type), similar levels of
embryonic lethality, and moulting behaviour at the permissive temperature (Section 6.4,
6.5). The supressed mutant exhibited a mild increase in its lifespan compared to the
original mutant. This increase in the lifespan compared to the original mutant was
temperature independent (Section 6.7). The fact that not all phenotypes were supressed
could indicate that loss of vps-45 is involved in the animal causes various organismal
defects, and that the allele responsible for the suppression is acting and compensating for
the loss of vps-45 only in a subset of them.
Full genome sequencing was utilised in an attempt to identify the suppressor. However, the
sequencing data did not give a single chromosomal region of suppression but possibly two,
and in both cases the signal was not very clean. However, the fact that in the sequencing
data a very clean signal was obtained for the vps-45 (tm246) mutation itself indicates that
the sequencing process and mapping by N2 versus Hawaiian SNPs worked well.
Furthermore, all 40 sequencing lines were homozygotic for the vps-45 (tm246) mutation
and were able to easily grow at 25°C, so they were indeed carrying the suppressor mutation
along with the vps-45 mutant allele (Section 6.14). The lack of a second clean signal for a
suppressor mutation, and the presence of two moderate signals could suggest the presence
of two unlinked suppressors rather than one within the original suppressed strain (Section
6.10).
Further SNP mapping in the chromosome II locus, as well as the chromosome V locus,
where the two moderate signals were located, identified two subpopulations within the
original sequencing population lines. 5 of the 35 lines did not seem to be carrying the locus
for the suppression identified on chromosome II. These 5 lines also appeared to give a
signal in the possible chromosome V suppression locus (Section 6.13, 6.14). The two
subpopulations were subjected to phenotypic screening and it was found that there is a
difference in the development speed of the animals of the smaller chromosome V

Anastasios Batas 2017 Chapter 7
219
subpopulation which grew slower, while still being suppressed for the molting death at the
non-permissive temperature (6.14). The above further strengthen the possibility that two
different suppressors are present. Furthermore, it is possible that the two suppressors might
be interacting with each other and thus producing different levels of suppressions in strain
that are carrying one or the other, or both, and in different combinations of homozygosity
or heterozygosity.
This is indeed possible since in the original EMS screen a large number of suppressors
were obtained and continuous culturing of the vps-45 (tm246) mutant strain (IA757) for
prolonged time would spontaneously produce suppressed animals. This original large
number of supressed animals from the mutagenesis screen as well as the often-spontaneous
suppression would suggest a number of potential suppressors for the moulting death and
potentially other phenotypes caused by the loss of VPS-45. As previously suggested a
possible way through which suppression might work could be through the upregulation of
a stress pathway such as autophagy, which might remove the mistargeted or partially fused
aberrant vesicles resulting from the loss of VPS-45. In this model, any mutation that
caused an upregulation of autophagy might suppress the vps-45 (tm246) mutant.
A second possibility on how the suppression works could be through different SM proteins
which can potentially take up the role of vps-45 or other SNARE proteins apart from SYN-
16/Tlg2. In the past VPS-45 has been proposed to act as a replacement for SM proteins
VPS-33.1 and VPS-33.2 for the maturation of endosomes in C. elegans (Solinger & Spang
2014). It is interesting that VPS-33.2 is located on chromosome II which is the prime
candidate for one of the suppressors based on the sequencing results (Section 6.10). As a
result, it is not impossible that a mutation in the vps-33.2 gene could alter its function to
replace VPS-45. The nature of the potential second suppressor on chromosome V remains
unknown (Section 6.10), as is its relationship with the first suppressor. It is possible that
different interactions between the two suppressors could produce different levels of fitness
in the animals. Concluding, a second round of sequencing with the two sub-population
will help elucidate this and identify the allele or alleles that are responsible for the
suppression.
Anastasios Batas 2017 Chapter 7
220
7.2 Phenotypic characterisation of unc-51 (e369), vps-45 (tm246) and unc-
51(e369) vps-45 (tm246) synthetic lethal double mutant
The hypothesis formed in the section 7.1 suggest the upregulation of a stress pathway such
as autophagy as the cause for the frequent suppression of the vps-45 mutant temperature
sensitive lethality. The autophagy defective mutant unc-51 (e369) and the vps-45 (tm246)
mutant exhibit different phenotypes overall.
It was shown that both mutants do not exhibit any obvious phenotypic similarities in terms
of body shape, with the vps-45 (tm246) mutant exhibiting a relatively normal body shape
and movement, but with a slightly reduced body size. On the other hand, unc-51 (e369)
mutant, exhibits uncoordinated movement phenotype (Unc) (Ogura et al, 1994) as well as
a shorter and fatter body shape similar to that of a Dpy phenotype (Aladzsity et al. 2007).
A number of mutant animals (dpy-5, dpy-7, dpy-11) have the Dpy phenotype as a result of
cuticular defects rather than changes in cell size (Thein et al. 2003). It is possible that
autophagy could be playing a role in moulting since autophagy defective mutants exhibit
cuticular abnormalities. Further to this VPS45 in yeast, and its binding partner
Tlg2/Syntaxin16 have been shown to play a role in the regulation of autophagy (Ohashi &
Munro 2010; Nair & Klionsky 2011; Chen et al. 2014). Taking into consideration all of the
above factors, it is reasonable to consider that autophagy could have some impact in
moulting and development through its interaction with the endosomal system.
Therefore, both the unc-51 and vps-45 mutants were characterised phenotypically in terms
of their development either as embryos for embryonic lethality or post embryonically for
post embryonic development, cuticular, morphological or moulting defects. Wild type, vps-
45 (tm246) and unc-51 (e369) animals which were cultured from the non-permissive
temperature for vps-45 (tm246) showed that only the vps-45 mutants demonstrated a
temperature sensitive moulting lethal phenotype whereas unc-51 mutants would normally
develop to adulthood irrespective of culturing temperature. This outcome suggests that
VPS-45 is not directly influencing the process of autophagy or that it only has a mild
influence on it (Section 3.4). It is also possible that is acting entirely independently of
UNC-51, since no similarities are observed between the two mutants regarding the
temperature sensitive lethality. Previous studies do point to an involvement of VPS-45 in
the regulation of autophagy in yeast but not being essential for autophagy (Chen et al.
2014). Further to this, the data do support previously identified temperature sensitive

Anastasios Batas 2017 Chapter 7
221
phenotypes identified in Vps45 (Shanks et al. 2012) and Vps21 yeast mutants, the latter of
which exhibit similar autophagy defects as Vps45 mutants (Chen et al. 2014).
Further experiments demonstrated that C. elegans carrying the vps-45 (tm246) allele
exhibited higher embryonic lethality compared to the wild type both at the non-permissive
and permissive temperatures for the moulting lethality. The wild type strain exhibited some
embryonic lethality at 15°C, which was almost eradicated at the higher temperature of
25°C. A higher lethality was observed for all strains at the lower culturing temperature,
suggesting that in all cases 15°C did not provide an ideal environment for the embryonic
development of C. elegans. At 25°C, where wild type embryos exhibited a higher survival,
it was observed that there was a small difference even in the case of the unc-51 (e369)
mutant which showed a small lethality, however, not as big as in the case of the vps-45
(tm246) mutant (Section 3.3). This difference between the two mutants suggest that
although both vps-45 and unc-51 can affect embryonic viability, the two must have
different functions in embryonic development. Indeed it has been suggested that
components of the autophagic machinery, including unc-51, take part in the clearance of
apoptotic cell corpses which accumulate during embryonic development in C.elegans
(Huang et al. 2013). Inability to effectively clear these corpses could possibility result in
embryonic death. On the other hand, the vps-45 (tm246) embryonic lethality can
potentially be explained by the defective trafficking of the yolk proteins to the developing
embryo (Gengyo-Ando et al. 2007).
Following the above, it was assumed that shut down of both processes in C. elegans would
potentially result in an additive effect. To investigate this, a double mutant was constructed
by crossing the unc-51 (e369) and vps-45 (tm246) mutants (Section 3.5). The double
mutant exhibited a very obvious phenotype of a much smaller body size compared to any
of the other mutants. All strains, including the double mutant were accurately measured for
their length. As such it became evident that the vps-45 (tm246) mutant was smaller
compared to the N2 wild type strain followed by the unc-51 (e369) mutant and finally the
double mutant which, exhibited a much smaller body size suggesting a more than additive
effect of the two mutant phenotypes. This could potentially suggest a functional relation
between the genes as well as the two processes in C. elegans development, potentially in
moulting.
The double mutant phenotype was rarely encountered and could not produce any progeny
by itself. Very often, the double homozygotic mutant would die during the early larval
stages and not actually reach the adult stage at which size measurements were made. Only

Anastasios Batas 2017 Chapter 7
222
a small proportion reached the adult stage, and animals would often burst while handling
them for microscopy. Even at the rare occasion when these animals were able to reach
adulthood, they would die without producing any progeny (Section 3.6). Therefore, while
C. elegans can survive when either vps-45 or unc-51 function is lost, there is a mutual
requirement for function. If vps-45 is lost, unc-51 (and autophagy) is essential for survival.
When unc-51 function is lost, vps-45 becomes essential and presumably accurate targeting
and fusion of vesicles is much more important when autophagy is defective.
In addition to this, it was observed that the vps-45(tm246) and unc-51(e369) mutants
exhibited different moulting profiles compared to the wild type strain. In more detail, both
the vps-45 and unc-51 mutants started their L1-L2 moult with a delay of 2-3 hours
compared to the wild type strain. This delay in the onset of the L1-L2 moult can most
likely be extended to each of the subsequent moults judging by the time each of the
mutants required to reach adulthood. Both mutants exhibited a longer period of larval
development taking longer to reach the adult stage, however for different reasons. In the
case of the vps-45 mutant a longer moulting period was identified compared to the wild
type, whereas in the case of the unc-51 mutant the duration of the moult was almost the
same as for the wild type strain. The unc-51 was also identified to potentially have longer
intermoult periods. The above suggest that vps-45 is needed during lethargus/moulting as
lethargus takes longer in the mutant and that unc-51 potentially plays a more important role
at the exit from lethargus/moult and the intermoult periods (Section 3.9). These
observations were verified via further experiments of the moulting time of individual
animals for each of the strains as well as the fact that the unc-51 mutant animals lost
synchrony after several hours of development, whereas the other two did not with
approximately only 55% of the population being at the same stage. Furthermore, the unc-
51 (e369) and vps-45(tm246) mutants had a delayed development to adulthood. Generally
it is, known that a family of genes, known as heterochronic genes are responsible for the
regulation of temporal events in C. elegans [reviewed in (Ambros & Moss 1994)].
Moulting is included in these events, and mutation on the heterochronic transcription factor
lin-42 can affect the duration of moults. It is unknown what the internal cues are for the
activation of lin-42 however according to the data presented in this work it is at least
possible that autophagy and or the endosomal system could play a role in its regulation
(Monsalve et al. 2011). Collectively, these results, coupled with the fact that the mutants
exhibited a much shorter lifespan compared to the wildtype strains in both the permissive
(15°C) and non-permissive temperatures (25°C) (Section 3.10), suggest that both
autophagy and endosomal trafficking plays an important role in the post embryonic

Anastasios Batas 2017 Chapter 7
223
development of C. elegans and more specifically transit through the moult and return to the
intermoult stages.
Overall, it is important to note that a synthetic effect was observed in the unc-51 vps-45
double mutant which enforces the idea of some functional relation between autophagy and
endosomal trafficking, potentially in moulting. In yeast, vps-45 function has been
associated with the regulation of autophagy where in the absence of functional Vps45,
autophagosome clusters accumulate around the vacuaole but do not fuse with it (Chen et
al. 2014). It is possible that such an intersection between the two processes is also present
in the more complex model of C. elegans and that vps-45 (tm246) would exhibit a similar
phenotype with a mildly reduced autophagy. If that is the case, it is easy to understand the
synthetic effect of the unc-51 vps-45 double mutant as both proteins will be acting on the
same process but in different steps. It is possible that vps-45 acts in the trafficking of
components required for the secretion of the cuticle during lethargus and that autophagy
takes place subsequently for the clearance/removal of any residual material not effectively
secreted during lethargus. During lethargus when the cuticle components are being
secreted in a vps-45 mutant at permissive temperature 15°C, lethargus takes longer than in
the wild type, but animals survive. At 25°C this might be exacerbated and animals die. In
the double mutant where autophagy is defective, animals die even at the permissive
temperature of 15°C sometimes even by bursting indicating the extreme fragility of the
cuticle. Therefore, autophagy is essential to survival in vps-45 mutants, and the reason for
death might relate to defects in cuticle synthesis as a result of incorrect or delayed protein
trafficking.
7.3 Autophagy is developmentally regulated during moulting and is required for
the survival of vps-45 (tm246) mutants.
As discussed in the previous section (Section 7.1), the unc-51 vps-45 double mutant
exhibited a synthetic lethality with severe irregularities in the body shape and size.
Research from Singh and Sulston has suggested the genesis of new organelles during
moulting, which have Golgi like characteristics (Singh & Sulston 1978). Here, the
requirement for autophagy for the degradation of these structures after moulting is
complete when the animal transits back to the next intermoult phase, is proposed.
Furthermore, as discussed in the previous section there is strong evidence to suggest the

Anastasios Batas 2017 Chapter 7
224
involvement of endosomal trafficking and autophagy in the moulting process. To
investigate this idea, the unc-51 (e369) and vps-45 (tm246) mutants were utilised along
with the LGG-1::GFP autophagy marker. LGG-1, is the homologue of the mammalian
LC3, it can be found on the autophagosome membrane and is rapidly degraded with the
organelle after the completion of autophagy (Ladoire et al. 2012; Abeliovich et al. 2000;
Suzuki & Ohsumi 2007) as a result it can act as a marker for the presence of autophagy and
the formation of autophagosomes
Consistent with my original hypothesis for an involvement of autophagy during the moult,
higher expression of the LGG-1::GFP marker was observed shortly after the worms
entered lethargus (Section 4.3). This was the case for all three strains, wild type and both
the unc-51 (e369) and vps-45 (tm246) mutants. All three strains exhibited different times to
entry into lethargus from L1 larval arrest (Section 4.4). However, LGG-1::GFP
accumulation in the seam cells only appeared after entry into lethargus for each strain.
Thus in each of these strains, although the length of time taken to enter lethargus varies, in
each case the association of accumulation of LGG-1::GFP at the start of lethargus is
retained. Thus, the accumulation of LGG-1::GFP in the seam cells is developmentally
regulated and tightly associated with lethargus. Seam cells are part of the epithelial tissue
responsible for the secretion of collagen components of the cuticle (Sulston & Horvitz
1977; Singh & Sulston 1978; Thein et al. 2003). The fact that the LGG-1 localizes in those
cells during lethargus further strengthens the idea for the involvement of autophagy in
moulting and specifically suggests the seam cells as the place for this process. That this
accumulation is specific to moulting, and not to the seam cell divisions that occur at the
end of each moult is supported by the following observation. In addition to the seam cell
divisions that happen at the end of each moult, there is also a seam cell division that occurs
in L1 larvae approximately 5 hours post-hatch (Shemer & Podbilewicz 2000; Podbilewicz
& White 1994). No accumulation of LGG-1::GFP was observed at this seam cell division
(Section 4.7). This result suggests that the accumulation of LGG-1::GFP in seam cells is
not associated with cell division, but rather lethargus and moulting. This is also consistent
with previous reports suggesting degradation of the midbodies after the cell-division in C.
elegans in a macroautophagy independent way (Fazeli et al. 2016).The LGG-1
fluorescence rapidly disappeared from the seam cell shortly after the worms shed their
cuticle through ecdysis (within 1 hour), with the only exception being in the unc-51 mutant
in which the GFP persisted in the seam after the end of the moult for 2 to 3 hours. This was
to be expected since for the LGG-1 protein to be degraded autophagosomes need to be
formed and degraded with their content via the autophagic process, and as such due to the

Anastasios Batas 2017 Chapter 7
225
reduced autophagy in this strain the LGG-1 protein would persist longer after the end of
the moult in a diffuse state (Section 4.4).The data obtained also suggest a requirement for
higher levels of autophagy as a result of the vps-45 (tm246) mutant. Initially, our data
suggested that there was a slightly faster degradation of the LGG-1 marker in the seam
cells of the vps-45 (tm246) mutant post-moult. Upon measuring the whole body’s total
fluorescence of the LGG-1::GFP marker in the two mutants and the wild type strain it was
observed that both mutants exhibited higher levels of fluorescence and therefore higher
levels of lgg-1 expression compared to the wild type, with the unc-51 (e369) mutant
showing the highest. For the autophagy mutant that can be explained as previously due to
the low incorporation of LGG-1 in autophagosomes as a result of a reduced induction of
autophagy. In the case of the vps-45 (tm246) mutant, however, since the LGG-1 is
degraded rapidly after autophagy, it would suggest that the vps-45 (tm246) mutant has
higher demands for autophagy, probably due to the defects in endosomal sorting and the
accumulation of vesicle, suggesting that autophagy is the mechanism which allows for the
survival and development of these animals despite the problems in the endocytic pathway
(Section 4.9).
To get a better idea of the differences in the induction of autophagy the number of
autophagosomes in the seam cells in lethargic animals was counted. As previously stated,
LGG-1 localizes in the seam cells where it becomes part of the membrane of the forming
autophagosomes (Aladzsity et al. 2007). A low number of LGG-1::GFP foci (believed to
represent formed autophagosomes) was observed at the beginning of lethargus when the
protein first accumulated in the cells. As the moult was coming to an end and the seam
cells start dividing the number of autophagosomes increased in the wild type strain. In the
case of the vps-45 (tm246) mutant the autophagosome count was higher in the pre-division
seam cells compared to the wild type. The number of autophagosomes was increased in the
vps-45 (tm246) mutant during the end of the moult and the seam cell division. However,
the number was less than that in the cells of the wild type strain during the same process.
In the unc-51 (e369) mutant on the other hand, the number of autophagosomes remained
low throughout the process. The above data, once again imply that autophagy is required
particularly at the end of moult near the ecdysis phase. The fact that the vps-45 mutant had
a higher number of autophagosomes at the beginning of lethargus enforces the idea that
higher levels of basal autophagy are required by this strain to aid with the possible defects
of endosomal trafficking. However, the fact that the number of autophagosomes did not
increase as much as in the wild type strain could suggest that this mutant cannot form this
many autophagosomes, potentially due to the absence of a functional vps-45 (tm246) if it

Anastasios Batas 2017 Chapter 7
226
would act as a regulator of autophagy (Chen et al. 2014), or that because of the
requirement of autophagy for the clearance aberrant vesicles cause the diversion of
resources (Section 4.5).
Similar experiments conducted in embryos throughout their developmental stages, further
support the idea that during the secretion of the cuticle autophagy is required, at any stage
of development, and that the vps-45 (tm246) mutant has higher demands for autophagy.
The number of autohagosomes could not be counted in this case, however the total
fluorescence levels in embryos mirror the result obtained by the adult animals (Section 4.8,
4.9).
Overall it was demonstrated that, autophagy takes place at the end of the moult in the seam
cells, promoting the idea that autophagy is required for the rapid clearance of the secretory
Golgi like structures formed in the hypodermis after the secretion of the cuticle (Singh &
Sulston 1978), and returning the animal to the intermoult phases. This claim is further
strengthened by the fact that autophagy was only induced in the seam cells at the end of the
molt and not because of the division of the seam cells (Section 4.7). Further to this, vps-45
(tm246) mutants exhibited higher levels of LGG-1::GFP expression both as an adult and
during embryonic development, aiding to the idea that autophagy is in higher demand in
mutants lacking VPS45 probably as a survival mechanism. This is also consistent with the
previously identified synthetic lethality. Autophagy is induced throughout
lethargus/molting in C. elegans when VPS-45 is absent. Thus, the vps-45 mutants might
need autophagy to survive (Section 7.1), explaining the unc-51 vps-45 synthetic lethality.
7.4 Investigating oxidative imbalances and resistance to oxidative stress in unc
51 (e369) and vps-45 (tm246) mutants
While comparing the vps-45 and unc-51 single mutants and the double mutant, it was
observed that the intestinal lumen appears to be enlarged in all three cases (Section 3.8).
This is consistent with defects in the function on the intestine. Furthermore, the enlarged
intestinal lumen could suggest problems in the digestion for both mutants and possibly
problems in the detoxification process since the intestine is the main detoxification organ
of C. elegans with a number of antioxidant genes expressed in intestinal cells (An &
Blackwell 2003; Freedman et al. 1993; Slice et al. 1990; Swain et al. 2004) .

Anastasios Batas 2017 Chapter 7
227
Possibly both mutations could be affecting the oxidative state of the tissues and
consequently the aging process [ Reviewed in (Finkel & Holbrook 2000)] hence the shorter
lifespan. A more oxidised state in the cells can be a result of the increased stress in the ER
as a consequence of the high number of structures that are potentially accumulating in both
mutants [(Cullinan et al. 2003; Plaisance et al. 2016), reviewed in (Ron 2002)]. In the case
of vps-45(tm246) mutant this could be the result of the ineffective endosomal fusion which
could produce aberrant or misfolded structures which could result in ER stress. In the case
of unc-51 (e369) mutant, the lack of an effective clearance mechanism for misfolded
proteins and other aberrant structures would be the cause for the oxidised environment
once again due to the accumulation of misfolded proteins. Additionally the reduced
lifespan exhibited by the both mutant could be due to an increased oxidative/ER stress
previously mentioned (Bensaad et al. 2009).
Furthermore, accelerated rates of apoptosis has been observed in neutrophils of patients
carrying the homozygous mutation T224N in the human VPS45 gene (P. Stepensky et al.
2013). Experiments in vps-45 yeast mutants have shown that they are more sensitive to
oxidative stress caused by the action of hydrogen peroxide (Cowan, 2014). As such, the
possibility of a similar sensitivity in C. elegans was investigated possibly as a result of ER
stress (Harding et al. 2003; Malhotra & Kaufman 2007b; Plaisance et al. 2016) due to the
accumulation of mistargeted proteins by the endocytic system, or insufficient degradation
of proteins.
Initially, an ER marker was employed to explore the possibility of ER redox imbalances,
that could potentially also cause a susceptibility to oxidative stress. In the permissive
temperature, for the vps-45 moulting death, both mutant exhibited a reduced environment
in the ER compared to the wild type strain. The autophagy defective unc-51 mutant
exhibited a more reduced environment to the vps-45 mutant. The measurement of the ER
redox state in a double homozygotic mutant for both alleles was not possible due to the
synthetic lethality.
When the same measurements were repeated at the non-permissive temperature of 25°C for
all strains, an increased in the oxidation state was observed for all mutants, especially in
the case of the vps-45 mutant. In this case, the unc-51 (e369) mutant appeared to exhibit
similar oxidation levels to the wild type strain. However, the vps-45(tm246) mutants
showed a much more oxidised environment compared to either one of the other strains
(Section 5.3).
Anastasios Batas 2017 Chapter 7
228
From these results, it might be expected that the vps-45 (tm246) mutant be more
susceptible to oxidative stress. However, the killing assay demonstrated that the unc-51
(e369) mutant died faster than both the vps-45 mutant and wild type strain when exposed
to two concentrations of H2O2 for 4 hours. The vps-45 (tm246) mutant however, was more
susceptible than the wild type strain (Section 5.4). To further understand how they reacted
to oxidative stress three GFP markers were utilised, namely SOD-3::GFP, GST-4:::GFP,
and GCS-1::GFP, all three of which act at different points of the detoxification response.
For the SOD-3 marker the data indicate a stronger basal induction (in the absence of H2O2
treatment) from the unc-51 mutant when compared to the wild type. Since SOD-3 has the
role of converting oxygen anions to hydrogen peroxide it is suggested that there is an
increased accumulation of free radicals in the cytoplasm of this strains cells, which was
worsened by the further exposure to H2O2. This could potentially imply an ER stress. A
mildly increased, however non-significant, response was also observed for the vps-45
mutant. It is possible that the reason for this response is the accumulation of aberrant
structures, organelles and proteins as a result of defective autophagy which cannot degrade
them or due to incomplete endosomal sorting in the case of vps-45. Both of which could
potentially cause an ER stress to a different degree, thus explaining the difference in the
redox state of the ER in the two mutants (Madeo et al. 1999; Tu & Weissman 2004;
Malhotra & Kaufman 2007a). Furthermore, SOD-3 is not only regulated exclusively by
oxidative stress, but from starvation as well, since the insulin/IGF-1 signalling and daf-16
are also responsible for its upregulation (Lee et al. 2001). As such, a mild oxidative stress
might not be enough for a great upregulation of the enzyme (Section 5.5).
In the case of GST-4 all strains exhibited very similar responses across the board. GST-4 is
a phase II detoxification enzyme, much like GCS-1 which will be discussed later and are
controlled by the transcription factor SKN-1 (An & Blackwell 2003; Blackwell et al.
2015). In the case of GCS-1 only the unc-51 (e369) mutant showed a higher response to
hydrogen peroxide induced oxidative stress and all other strains and conditions exhibited a
similar response. This is unexpected considering that both these enzymes are controlled via
similar pathways and respond to similar stimuli. However, it is important to note that GST-
4 has a much broader spectrum of targets (Hayes et al. 2005; Nebert & Vasiliou 2004),
and its action involves the conjugation of reduced GSH to its target oxidising compounds.
GCS-1 one the other hand is involved in the first step of GSH biosynthesis, as such
although it is also regulated by SKN-1 it acts earlier in the detoxification pathway as it will
be providing the GSH required for GST-4 to act (Schulz et al. 2000) (Section 5.5).

Anastasios Batas 2017 Chapter 7
229
Collectively, data suggest that both unc-51 (e369) and vps-45 (tm246) mutants are more
sensitive to oxidative stress since both exhibited lower survival after treatment with H2O2.
The unc-51 (e369) mutant was more sensitive of the two, something which can further be
supported by the induction of oxidative stress markers in that mutant which was greater
compared to the other two which overall exhibited similar responses. It is possible that in
both cases accumulation of membranes, organelles and proteins is the cause of this stress,
possibly as a result of ER stress. One of the marks of ER stress is the redox imbalance in
the ER lumen which, when it is too high, can lead to redox imbalances in the cytoplasm as
well. It is possible to consider that since vps-45 acts in the Golgi to lysosome trafficking
pathway, a blockage in this trafficking caused by loss of VPS-45 function could also affect
previous stages in the protein trafficking pathway, namely the ER where proteins are
synthesized and folded. Such a bottle neck could potentially cause accumulation of certain
protein, possibly targeted to lysosomes, in the ER which in turn would put extra burden in
the ER causing the imbalance. This could result in misfolding of proteins which in turn
would require a refolding process which would produce ROS and as such create a more
oxidising environment. However, not to the point where it would cause leakage of calcium
or ROS in the cytoplasm to result in a cell wide oxidation state. On the other hand, in the
case of the unc-51 (e369) mutant, things could be more complex, and possibly affect the
cell to a greater degree. The unc-51 (e369) mutation affects autophagy as a whole, and is
not confined only to a single molecular pathway as is the case of vps-45. Autophagy can
aid in the homeostasis of the cell by recycling cellular structures and molecules that are
either not needed by the cell, or are defective having been damaged by stresses. If
autophagy is greatly reduced, then a greater level of stress might fall upon the ER. This can
possibly explain why the unc-51 is more susceptible to hydrogen peroxide killing and
exhibits a stronger response under stress as well as the shorter lifespan. Alternatively, since
as shown here autophagy is associated with moulting in C. elegans, it is also possible that
the cuticle might be in some manner defective, possibly more permeable to hydrogen
peroxide.
Anastasios Batas 2017 Chapter 7
230
7.5 Concluding remarks and future work
Using the LGG-1::GFP marker it was demonstrated that autophagy is induced in a
developmental manner during lethargus in hypodermal seam cells which are highly active
in secretion of collagens and other components of the cuticle during this period.
Furthermore, during the periods of lethargus which last approximately 4 hours in the wild
type, first the LGG-1::GFP protein was found to accumulate in a diffuse presumed
cytoplasmic localisation and then towards the end of lethargus form distinct foci that are
believed to be active autophagosomes. This is consistent with a model where the
autophagy protein LGG-1 accumulates at the start of lethargus in a developmentally
regulated way in preparation for an active period of autophagy, and then late in lethargus is
converted into its active form driving a period of autophagy. This is supported by the
finding that when the UNC-51/ATG kinase is mutated that the presumed active LGG-
1::GFP foci do not form. In conclusion, the synthetic lethality described in this work
demonstrates that autophagy is essential for organismal viability in C.elegans in the
absence of the SM protein VPS-45.
The known viability of vps-45 null mutants, which in both yeast and C. elegans have this
unusual behaviour of temperature sensitivity, is hard to explain. The conclusion is that
where the SM protein VPS-45 is an essential protein for viability at slightly elevated
temperatures in both organisms, it is not necessary for viability at lower temperatures. Why
the basic cell biology behaves in this way is unclear. However, the synthetic lethality
demonstrated by the unc-51; vps-45 double mutant is potentially interesting in this respect.
It demonstrates that in C. elegans, the viability of a vps-45 null mutant at 15oC requires
functional autophagy. Thus, possibly high levels of defective vesicle/membrane fusions do
occur in the vps-45 mutant even at low temperatures, but cells (and animals) survive by
utilising autophagy to recycle components trapped in defective fused vehicles and
organelles. Evidence was found to suggest a possible upregulation of autophagy during the
early phases of lethargus in the vps-45 mutant, by using the LGG-1::GFP marker.
The molecular basis of the extra-genetic suppression of vps-45 mutants of C. elegans was
not elucidated. Full genome sequencing, despite working properly from a technical
standpoint, failed to identify a single suppressor. However, via the utilisation of genetic
mapping and phenotypic analysis, the existence of more than one suppressors in two
subpopulations of our supressed lines was inferred. Thus, a second round of sequencing in
Anastasios Batas 2017 Chapter 7
231
the two distinct sub-populations (fast and slow growing suppressors) could help verify that
this is the case and identify the suppressors. This is future research for this project.
While the molecular basis of the vps-45 lethality suppression is not currently known, it is
possible that the synthetic lethality with unc-51 might provide an avenue of possible future
research. Since we know now that autophagy is necessary for survival of vps-45 mutants at
15oC, could upregulation of autophagy underpin the suppression of vps-45 lethality at
25oC? This might easily be tested by crossing suppressed vps-45 mutant lines with the
LGG-1::GFP marker strain and using this to assess levels of autophagy in the suppressed
and non-suppressed lines. Additionally, a new EMS screen using the vps-45 (tm246)
LGG-1::GFP expressing strain could be carried out to isolate suppressed lines which will
be expressing the transgene. This could be used to investigate if the frequent suppression
of the vps-45 (tm246) mutant is associated with altered autophagy.
Finally, to investigate the possible role for autophagy in removing the expanded network of
secretory apparatus that accumulate in seam cells during lethargus, electron microscopy of
the wild type and unc-51 mutant C. elegans during and after the moult could be used. If
autophagy is indeed used to remove these organelles and return the hypodermis to its non-
secretory intermoult state, persistence of these secretory structures after the moult would
be anticipated in the unc-51 mutant.

Anastasios Batas 2017 Chapter 7
232
References Abeliovich, H. et al., 2000. Dissection of autophagosome biogenesis into distinct
nucleation and expansion steps. The Journal of cell biology, 151(5), pp.1025–34.
Available at: http://www.ncbi.nlm.nih.gov/pubmed/11086004 [Accessed May 21,
2017].
Abeliovich, H., Darsow, T. & Emr, S.D., 1999. Cytoplasm to vacuole trafficking of
aminopeptidase I requires a t-SNARE-Sec1p complex composed of Tlg2p and
Vps45p. The EMBO journal, 18(21), pp.6005–16. Available at:
http://emboj.embopress.org/cgi/doi/10.1093/emboj/18.21.6005 [Accessed May 18,
2017].
Agnello, M. et al., 2015. Cell Death - Autophagy, Apoptosis and Necrosis T. M. Ntuli, ed.,
InTech. Available at: http://www.intechopen.com/books/cell-death-autophagy-
apoptosis-and-necrosis/the-role-of-autophagy-and-apoptosis-during-embryo-
development [Accessed February 13, 2017].
Ahringer, J., 2006. Reverse genetics. Available at:
https://www.ncbi.nlm.nih.gov/books/NBK19711/ [Accessed January 27, 2017].
Aladzsity, I. et al., 2007. Autophagy genes unc-51 and bec-1 are required for normal cell
size in Caenorhabditis elegans. Genetics, 177(1), pp.655–660. Available at:
http://www.ncbi.nlm.nih.gov/pubmed/17890369.
Ambros, V. & Moss, E.G., 1994. Heterochronic genes and the temporal control of C.
elegans development. Trends in Genetics, 10(4), pp.123–127. Available at:
http://linkinghub.elsevier.com/retrieve/pii/0168952594902135 [Accessed June 25,
2017].
An, J.H. & Blackwell, T.K., 2003. SKN-1 links C. elegans mesendodermal specification to
a conserved oxidative stress response. Genes & development, 17(15), pp.1882–93.
Available at:
http://www.pubmedcentral.nih.gov/articlerender.fcgi?artid=196237&tool=pmcentrez
&rendertype=abstract [Accessed February 8, 2016].
Ang, A.L. et al., 2004. Recycling endosomes can serve as intermediates during transport
from the Golgi to the plasma membrane of MDCK cells. The Journal of Cell Biology,
167(3). Available at: http://jcb.rupress.org/content/167/3/531.short [Accessed May
24, 2017].
Antonin, W. et al., 2002. Crystal structure of the endosomal SNARE complex reveals
common structural principles of all SNAREs. Nature structural biology, 9(2), pp.107–
11. Available at: http://dx.doi.org/10.1038/nsb746 [Accessed October 24, 2016].
Axe, E.L. et al., 2008. Autophagosome formation from membrane compartments enriched
in phosphatidylinositol 3-phosphate and dynamically connected to the endoplasmic
reticulum. The Journal of cell biology, 182(4), pp.685–701. Available at:
http://www.ncbi.nlm.nih.gov/pubmed/18725538 [Accessed May 22, 2017].
Baba, M. et al., 1997. Two distinct pathways for targeting proteins from the cytoplasm to
the vacuole/lysosome. The Journal of cell biology, 139(7), pp.1687–95. Available at:
http://www.ncbi.nlm.nih.gov/pubmed/9412464 [Accessed May 22, 2017].
Baba, M., Osumi, M. & Ohsumi, Y., 1995. Analysis of the Membrane Structures Involved
in Autophagy in Yeast by Freeze-Replica Method. Cell Structure and Function, 20(6),
pp.465–471. Available at:

Anastasios Batas 2017 Chapter 7
233
http://joi.jlc.jst.go.jp/JST.Journalarchive/csf1975/20.465?from=CrossRef [Accessed
May 21, 2017].
Bazan, G.C. & Hillers, K.J., 2011. SNP-based mapping of crossover recombination in
Caenorhabditis elegans. Methods in molecular biology (Clifton, N.J.), 745, pp.207–
22. Available at: http://www.ncbi.nlm.nih.gov/pubmed/21660697 [Accessed February
10, 2016].
Bennett, M., Calakos, N. & Scheller, R., 1992. Syntaxin: a synaptic protein implicated in
docking of synaptic vesicles at presynaptic active zones. Science, 257(5067).
Available at: http://science.sciencemag.org/content/257/5067/255 [Accessed May 20,
2017].
Bensaad, K., Cheung, E.C. & Vousden, K.H., 2009. Modulation of intracellular ROS
levels by TIGAR controls autophagy. The EMBO Journal, 28(19), pp.3015–3026.
Available at: http://www.ncbi.nlm.nih.gov/pubmed/19713938 [Accessed May 18,
2017].
Benson, K.F. et al., 2003. Mutations associated with neutropenia in dogs and humans
disrupt intracellular transport of neutrophil elastase. Nature genetics, 35(1), pp.90–6.
Available at: http://www.ncbi.nlm.nih.gov/pubmed/12897784 [Accessed January 19,
2017].
Betz, C. et al., 2013. Feature Article: mTOR complex 2-Akt signaling at mitochondria-
associated endoplasmic reticulum membranes (MAM) regulates mitochondrial
physiology. Proceedings of the National Academy of Sciences of the United States of
America, 110(31), pp.12526–34. Available at:
http://www.pubmedcentral.nih.gov/articlerender.fcgi?artid=3732980&tool=pmcentrez
&rendertype=abstract [Accessed January 16, 2017].
Biazik, J. et al., 2015. Ultrastructural relationship of the phagophore with surrounding
organelles. Autophagy, 11(3), pp.439–451. Available at:
http://www.ncbi.nlm.nih.gov/pubmed/25714487 [Accessed July 19, 2017].
Blackwell, T.K. et al., 2015. SKN-1/Nrf, stress responses, and aging in Caenorhabditis
elegans. Free radical biology & medicine, 88(Pt B), pp.290–301. Available at:
http://www.pubmedcentral.nih.gov/articlerender.fcgi?artid=4809198&tool=pmcentrez
&rendertype=abstract [Accessed January 27, 2017].
Boztug, K. et al., 2009. A Syndrome with Congenital Neutropenia and Mutations in
G6PC3. Available at: http://www.nejm.org/doi/full/10.1056/NEJMoa0805051
[Accessed February 13, 2017].
Brabin, C. & Woollard, A., 2012. Finding a niche for seam cells? Worm, 1(2), pp.107–111.
Available at: http://www.ncbi.nlm.nih.gov/pubmed/24058832 [Accessed March 7,
2017].
Brenner, S., 1974. The genetics of Caenorhabditis elegans. Genetics, 77(1), pp.71–94.
Available at:
http://www.pubmedcentral.nih.gov/articlerender.fcgi?artid=1213120&tool=pmcentrez
&rendertype=abstract [Accessed January 20, 2017].
Brickner, J.H. et al., 2001. The Tlg SNARE complex is required for TGN homotypic
fusion. The Journal of cell biology, 155(6), pp.969–78. Available at:
http://www.pubmedcentral.nih.gov/articlerender.fcgi?artid=2150899&tool=pmcentrez
&rendertype=abstract [Accessed September 13, 2016].
Anastasios Batas 2017 Chapter 7
234
Bruinsma, P., Spelbrink, R.G. & Nothwehr, S.F., 2004. Retrograde transport of the
mannosyltransferase Och1p to the early Golgi requires a component of the COG
transport complex. The Journal of biological chemistry, 279(38), pp.39814–23.
Available at: http://www.ncbi.nlm.nih.gov/pubmed/15229219 [Accessed June 16,
2017].
Bryant, N.J. & James, D.E., 2001. Vps45p stabilizes the syntaxin homologue Tlg2p and
positively regulates SNARE complex formation. The EMBO journal, 20(13),
pp.3380–8. Available at:
http://www.pubmedcentral.nih.gov/articlerender.fcgi?artid=125511&tool=pmcentrez
&rendertype=abstract [Accessed September 13, 2016].
Bucher, E.A. & Seydoux, G., 1994. Gastrulation in the nematode Caenorhabditis elegans.
Seminars in Developmental Biology, 5(2), pp.121–130. Available at:
http://linkinghub.elsevier.com/retrieve/pii/S1044578184710164 [Accessed January
29, 2017].
Burd, C.G. et al., 1997. A novel Sec18p/NSF-dependent complex required for Golgi-to-
endosome transport in yeast. Molecular Biology of the Cell, 8(6), pp.1089–1104.
Available at: http://europepmc.org/articles/PMC305716/?report=abstract [Accessed
January 20, 2017].
Burkhardt, P. et al., 2008. Munc18a controls SNARE assembly through its interaction with
the syntaxin N-peptide. The EMBO journal, 27(7), pp.923–33. Available at:
http://www.pubmedcentral.nih.gov/articlerender.fcgi?artid=2323264&tool=pmcentrez
&rendertype=abstract [Accessed February 5, 2017].
Byerly, L., Cassada, R.C. & Russell, R.L., 1976. The life cycle of the nematode
Caenorhabditis elegans. Developmental Biology, 51(1), pp.23–33. Available at:
http://linkinghub.elsevier.com/retrieve/pii/0012160676901196 [Accessed April 15,
2017].
C. elegans Sequencing Consortium, 1998. Genome sequence of the nematode C. elegans: a
platform for investigating biology. Science (New York, N.Y.), 282(5396), pp.2012–8.
Available at: http://www.ncbi.nlm.nih.gov/pubmed/9851916 [Accessed January 27,
2017].
Carpp, L.N. et al., 2007. Cellular levels of the syntaxin Tlg2p are regulated by a single
mode of binding to Vps45p. Biochem Biophys Res Commun, 363(3), pp.857–860.
Available at: http://www.ncbi.nlm.nih.gov/pubmed/17904527.
Carr, C.M. & Rizo, J., 2010. At the junction of SNARE and SM protein function. Current
Opinion in Cell Biology, 22(4), pp.519–527.
Cassada, R.C. & Russell, R.L., 1975. The dauerlarva, a post-embryonic developmental
variant of the nematode Caenorhabditis elegans. Developmental Biology, 46(2),
pp.326–342. Available at:
http://linkinghub.elsevier.com/retrieve/pii/0012160675901098 [Accessed May 19,
2017].
Chasnov, J.R. & Chow, K.L., 2002. Why are there males in the hermaphroditic species
Caenorhabditis elegans? Genetics, 160(3), pp.983–94. Available at:
http://www.pubmedcentral.nih.gov/articlerender.fcgi?artid=1462001&tool=pmcentrez
&rendertype=abstract [Accessed January 26, 2017].
Chen, W. et al., 1998. Rab11 is required for trans-golgi network-to-plasma membrane
transport and a preferential target for GDP dissociation inhibitor. Molecular biology

Anastasios Batas 2017 Chapter 7
235
of the cell, 9(11), pp.3241–57. Available at:
http://www.ncbi.nlm.nih.gov/pubmed/9802909 [Accessed May 24, 2017].
Chen, Y. et al., 2014. A Vps21 endocytic module regulates autophagy. Molecular biology
of the cell, 25(20), pp.3166–77. Available at:
http://www.pubmedcentral.nih.gov/articlerender.fcgi?artid=4196867&tool=pmcentrez
&rendertype=abstract [Accessed February 8, 2016].
Cheng, S. et al., 2013. Autophagy genes coordinate with the class II PI/PtdIns 3-kinase
PIKI-1 to regulate apoptotic cell clearance in C. elegans. Autophagy, 9(12), pp.2022–
32. Available at: http://www.tandfonline.com/doi/abs/10.4161/auto.26323 [Accessed
January 16, 2017].
Costa, M., Draper, B.W. & Priess, J.R., 1997. The role of actin filaments in patterning the
Caenorhabditis elegans cuticle. Developmental biology, 184(2), pp.373–84. Available
at: http://www.ncbi.nlm.nih.gov/pubmed/9133443 [Accessed February 10, 2016].
Cowan, M., 2014. A ROLE FOR THE ENDOSOMAL SNARE COMPLEX AND
TETHERS IN AUTOPHAGY. Available at:
http://theses.gla.ac.uk/5046/1/2013cowanphd.pdf [Accessed July 20, 2017].
Cowles, C.R., Emr, S.D. & Horazdovsky, B.F., 1994. Mutations in the VPS45 gene, a
SEC1 homologue, result in vacuolar protein sorting defects and accumulation of
membrane vesicles. Journal of cell science, 107 ( Pt 1, pp.3449–59. Available at:
http://www.ncbi.nlm.nih.gov/pubmed/7706396 [Accessed August 15, 2016].
Cox, G.N., Kusch, M. & Edgar, R.S., 1981. Cuticle of Caenorhabditis elegans: its isolation
and partial characterization. The Journal of cell biology, 90(1), pp.7–17. Available at:
http://www.pubmedcentral.nih.gov/articlerender.fcgi?artid=2111847&tool=pmcentrez
&rendertype=abstract [Accessed January 20, 2017].
Cox, G.N., Staprans, S. & Edgar, R.S., 1981. The cuticle of Caenorhabditis elegans. II.
Stage-specific changes in ultrastructure and protein composition during
postembryonic development. Developmental biology, 86(2), pp.456–70. Available at:
http://www.ncbi.nlm.nih.gov/pubmed/6269931 [Accessed January 20, 2017].
Cullinan, S.B. et al., 2003. Nrf2 Is a Direct PERK Substrate and Effector of PERK-
Dependent Cell Survival. Molecular and Cellular Biology, 23(20), pp.7198–7209.
Available at: http://mcb.asm.org/content/23/20/7198.full [Accessed February 6,
2017].
Cutter, A.D., Avilés, L. & Ward, S., 2003. The proximate determinants of sex ratio in C.
elegans populations. Genetical research, 81(2), pp.91–102. Available at:
http://www.ncbi.nlm.nih.gov/pubmed/12872911 [Accessed January 26, 2017].
Dalley, B.K. & Golomb, M., 1992. Gene expression in the Caenorhabditis elegans dauer
larva: Developmental regulation of Hsp90 and other genes. Developmental Biology,
151(1), pp.80–90. Available at:
http://linkinghub.elsevier.com/retrieve/pii/0012160692902153 [Accessed May 19,
2017].
Degenhardt, K. et al., 2006. Autophagy promotes tumor cell survival and restricts necrosis,
inflammation, and tumorigenesis. Cancer Cell, 10(1), pp.51–64. Available at:
http://www.ncbi.nlm.nih.gov/pubmed/16843265 [Accessed August 28, 2017].
DePristo, M.A. et al., 2011. A framework for variation discovery and genotyping using
next-generation DNA sequencing data. Nature genetics, 43(5), pp.491–8. Available

Anastasios Batas 2017 Chapter 7
236
at: http://dx.doi.org/10.1038/ng.806 [Accessed November 11, 2016].
Djeddi, A. et al., 2012. Induction of autophagy in ESCRT mutants is an adaptive response
for cell survival in C. elegans. Journal of cell science, 125(Pt 3), pp.685–94.
Available at: http://jcs.biologists.org/content/125/3/685 [Accessed August 17, 2016].
Doitsidou, M. et al., 2010a. C. elegans mutant identification with a one-step whole-
genome-sequencing and SNP mapping strategy. PloS one, 5(11), p.e15435. Available
at:
http://www.pubmedcentral.nih.gov/articlerender.fcgi?artid=2975709&tool=pmcentrez
&rendertype=abstract [Accessed January 22, 2016].
Doitsidou, M. et al., 2010b. C. elegans mutant identification with a one-step whole-
genome-sequencing and SNP mapping strategy. PloS one, 5(11), p.e15435. Available
at: http://journals.plos.org/plosone/article?id=10.1371/journal.pone.0015435
[Accessed January 22, 2016].
Dou, Z. et al., 2013. Class IA PI3K p110β Subunit Promotes Autophagy through Rab5
Small GTPase in Response to Growth Factor Limitation. Molecular Cell, 50(1),
pp.29–42. Available at: http://www.ncbi.nlm.nih.gov/pubmed/23434372 [Accessed
May 21, 2017].
Dulubova, I. et al., 1999. A conformational switch in syntaxin during exocytosis: role of
munc18. The EMBO journal, 18(16), pp.4372–82. Available at:
http://emboj.embopress.org/content/18/16/4372.abstract [Accessed February 5, 2017].
Dulubova, I. et al., 2002. How Tlg2p/syntaxin 16 “snares” Vps45. The EMBO journal,
21(14), pp.3620–31. Available at:
http://www.pubmedcentral.nih.gov/articlerender.fcgi?artid=126126&tool=pmcentrez
&rendertype=abstract [Accessed February 10, 2016].
Elkin, S.R., Lakoduk, A.M. & Schmid, S.L., 2016. Endocytic pathways and endosomal
trafficking: a primer. Wiener Medizinische Wochenschrift, 166(7–8), pp.196–204.
Available at: http://www.ncbi.nlm.nih.gov/pubmed/26861668 [Accessed June 15,
2017].
Erdélyi, P. et al., 2011. Shared developmental roles and transcriptional control of
autophagy and apoptosis in Caenorhabditis elegans. Journal of Cell Science, 124(9).
Available at: http://jcs.biologists.org/content/124/9/1510 [Accessed March 31, 2017].
Fader, C.M. et al., 2009. TI-VAMP/VAMP7 and VAMP3/cellubrevin: two v-SNARE
proteins involved in specific steps of the autophagy/multivesicular body pathways.
Biochimica et Biophysica Acta (BBA) - Molecular Cell Research, 1793(12), pp.1901–
1916. Available at: http://www.ncbi.nlm.nih.gov/pubmed/19781582 [Accessed May
21, 2017].
Fan, W., Nassiri, A. & Zhong, Q., 2011. Autophagosome targeting and membrane
curvature sensing by Barkor/Atg14(L). Proceedings of the National Academy of
Sciences of the United States of America, 108(19), pp.7769–74. Available at:
http://www.pubmedcentral.nih.gov/articlerender.fcgi?artid=3093500&tool=pmcentrez
&rendertype=abstract [Accessed January 16, 2017].
Fasshauer, D. et al., 1998. Conserved structural features of the synaptic fusion complex:
SNARE proteins reclassified as Q- and R-SNAREs. Proceedings of the National
Academy of Sciences of the United States of America, 95(26), pp.15781–6. Available
at: http://www.ncbi.nlm.nih.gov/pubmed/9861047 [Accessed June 19, 2017].

Anastasios Batas 2017 Chapter 7
237
Fay, D.S., 2013. Classical genetic methods. WormBook : the online review of C. elegans
biology, pp.1–58. Available at: https://www.ncbi.nlm.nih.gov/books/NBK179229/
[Accessed January 27, 2017].
Fazeli, G. et al., 2016. C. elegans midbodies are released, phagocytosed and undergo LC3-
dependent degradation independent of macroautophagy. Journal of Cell Science,
129(20). Available at: http://jcs.biologists.org/content/129/20/3721 [Accessed May
30, 2017].
Fielding, C.A. et al., 2008. IL-6 Regulates Neutrophil Trafficking during Acute
Inflammation via STAT3. The Journal of Immunology, 181(3), pp.2189–2195.
Available at: http://www.jimmunol.org/content/181/3/2189.full [Accessed March 20,
2016].
Finch, C.E. & Ruvkun, G., 2001. The genetics of aging. Annual review of genomics and
human genetics, 2, pp.435–62. Available at:
http://www.annualreviews.org/doi/abs/10.1146/annurev.genom.2.1.435 [Accessed
January 13, 2017].
Finkel, T. & Holbrook, N.J., 2000. Oxidants, oxidative stress and the biology of ageing.
Nature, 408(6809), pp.239–47. Available at: http://dx.doi.org/10.1038/35041687
[Accessed January 12, 2015].
Fire, A. et al., 1998. Potent and specific genetic interference by double-stranded RNA in
Caenorhabditis elegans. Nature, 391(6669), pp.806–11. Available at:
http://www.ncbi.nlm.nih.gov/pubmed/9486653 [Accessed November 15, 2016].
Frand, A.R., Russel, S. & Ruvkun, G., 2005. Functional genomic analysis of C. elegans
molting. PLoS biology, 3(10), p.e312. Available at:
http://www.pubmedcentral.nih.gov/articlerender.fcgi?artid=1233573&tool=pmcentrez
&rendertype=abstract [Accessed January 24, 2017].
Freedman, J.H. et al., 1993. The novel metallothionein genes of Caenorhabditis elegans.
Structural organization and inducible, cell-specific expression. The Journal of
biological chemistry, 268(4), pp.2554–64. Available at:
http://www.ncbi.nlm.nih.gov/pubmed/8428932 [Accessed May 18, 2017].
Fridovich, I., 1995. Superoxide radical and superoxide dismutases. Annual review of
biochemistry, 64, pp.97–112. Available at:
http://www.ncbi.nlm.nih.gov/pubmed/7574505 [Accessed January 27, 2017].
Friedland, A.E. et al., 2013. Heritable genome editing in C. elegans via a CRISPR-Cas9
system. Nature methods, 10(8), pp.741–3. Available at:
http://www.pubmedcentral.nih.gov/articlerender.fcgi?artid=3822328&tool=pmcentrez
&rendertype=abstract [Accessed October 13, 2016].
Fujita, N. et al., 2008. An Atg4B mutant hampers the lipidation of LC3 paralogues and
causes defects in autophagosome closure. Molecular biology of the cell, 19(11),
pp.4651–9. Available at:
http://www.pubmedcentral.nih.gov/articlerender.fcgi?artid=2575160&tool=pmcentrez
&rendertype=abstract [Accessed January 16, 2017].
Furgason, M.L. et al., 2009. The N-terminal peptide of the syntaxin Tlg2p modulates
binding of its closed conformation to Vps45p. Proc Natl Acad Sci U S A, 106(34),
pp.14303–14308. Available at: http://www.ncbi.nlm.nih.gov/pubmed/19667197.
Furuta, N. et al., 2010. Combinational Soluble N-Ethylmaleimide-sensitive Factor

Anastasios Batas 2017 Chapter 7
238
Attachment Protein Receptor Proteins VAMP8 and Vti1b Mediate Fusion of
Antimicrobial and Canonical Autophagosomes with Lysosomes. Molecular Biology
of the Cell, 21(6), pp.1001–1010. Available at:
http://www.ncbi.nlm.nih.gov/pubmed/20089838 [Accessed May 21, 2017].
Futter, C.E. et al., 1995. Newly synthesized transferrin receptors can be detected in the
endosome before they appear on the cell surface. Journal of Biological Chemistry,
270(18), pp.10999–11003. Available at:
http://www.jbc.org/cgi/doi/10.1074/jbc.270.18.10999 [Accessed May 24, 2017].
Ganley, I.G. et al., 2011. Distinct Autophagosomal-Lysosomal Fusion Mechanism
Revealed by Thapsigargin-Induced Autophagy Arrest. Molecular Cell, 42(6), pp.731–
743. Available at: http://www.ncbi.nlm.nih.gov/pubmed/21700220 [Accessed May
21, 2017].
Garofalo, R.S., 2002. Genetic analysis of insulin signaling in Drosophila. Trends in
Endocrinology & Metabolism, 13(4), pp.156–162. Available at:
http://www.sciencedirect.com/science/article/pii/S1043276001005483 [Accessed
January 13, 2017].
Geng, J. & Klionsky, D.J., 2008. The Atg8 and Atg12 ubiquitin-like conjugation systems
in macroautophagy. “Protein modifications: beyond the usual suspects” review series.
EMBO reports, 9(9), pp.859–64. Available at:
http://www.pubmedcentral.nih.gov/articlerender.fcgi?artid=2529362&tool=pmcentrez
&rendertype=abstract [Accessed January 16, 2017].
Gengyo-Ando, K. et al., 2007. The SM protein VPS-45 is required for RAB-5-dependent
endocytic transport in Caenorhabditis elegans. Embo Reports, 8(2), pp.152–157.
Gillooly, D.J. et al., 2000. Localization of phosphatidylinositol 3-phosphate in yeast and
mammalian cells. The EMBO Journal, 19(17), pp.4577–4588. Available at:
http://www.ncbi.nlm.nih.gov/pubmed/10970851 [Accessed May 21, 2017].
Goedert, M., Clavaguera, F. & Tolnay, M., 2010. The propagation of prion-like protein
inclusions in neurodegenerative diseases. Trends in neurosciences, 33(7), pp.317–25.
Available at: http://www.cell.com/article/S016622361000055X/fulltext [Accessed
November 4, 2016].
Grenda, D.S. et al., 2007. Mutations of the ELA2 gene found in patients with severe
congenital neutropenia induce the unfolded protein response and cellular apoptosis.
Blood, 110(13), pp.4179–87. Available at:
http://www.bloodjournal.org/content/110/13/4179.short [Accessed February 13,
2017].
Grenda, D.S. et al., 2009. neutropenia induce the unfolded protein response and cellular
Mutations of the ELA2 gene found in patients with severe congenital neutropenia
induce the unfolded protein response and cellular apoptosis. Blood, 110(13), pp.4179–
4187. Available at: http://www.bloodjournal.org/content/110/13/4179.short [Accessed
May 20, 2017].
Gurunathan, S. et al., 2000. Yeast exocytic v-SNAREs confer endocytosis. Molecular
biology of the cell, 11(10), pp.3629–43. Available at:
http://www.ncbi.nlm.nih.gov/pubmed/11029060 [Accessed May 20, 2017].
Hanada, T. et al., 2007. The Atg12-Atg5 conjugate has a novel E3-like activity for protein
lipidation in autophagy. The Journal of biological chemistry, 282(52), pp.37298–302.
Available at: http://www.ncbi.nlm.nih.gov/pubmed/17986448 [Accessed May 21,

Anastasios Batas 2017 Chapter 7
239
2017].
Hanson, G.T. et al., 2004. Investigating mitochondrial redox potential with redox-sensitive
green fluorescent protein indicators. The Journal of biological chemistry, 279(13),
pp.13044–53. Available at: http://www.ncbi.nlm.nih.gov/pubmed/14722062
[Accessed January 14, 2016].
Hanson, P.I. et al., 1995. The N-Ethylmaleimide-sensitive Fusion Protein and -SNAP
Induce a Conformational Change in Syntaxin. Journal of Biological Chemistry,
270(28), pp.16955–16961. Available at: http://europepmc.org/abstract/MED/7622514
[Accessed February 5, 2017].
Hara, T. et al., 2006. Suppression of basal autophagy in neural cells causes
neurodegenerative disease in mice. Nature, 441(7095), pp.885–9. Available at:
http://dx.doi.org/10.1038/nature04724 [Accessed October 25, 2016].
Harding, H.P. et al., 2003. An integrated stress response regulates amino acid metabolism
and resistance to oxidative stress. Molecular cell, 11(3), pp.619–33. Available at:
http://www.ncbi.nlm.nih.gov/pubmed/12667446 [Accessed May 18, 2017].
Harsay, E. & Schekman, R., 2002. A subset of yeast vacuolar protein sorting mutants is
blocked in one branch of the exocytic pathway. The Journal of Cell Biology, 156(2),
pp.271–286. Available at: http://www.ncbi.nlm.nih.gov/pubmed/11807092 [Accessed
May 24, 2017].
Hayes, J.D., Flanagan, J.U. & Jowsey, I.R., 2005. Glutathione transferases. Annual review
of pharmacology and toxicology, 45, pp.51–88. Available at:
http://annualreviews.org/doi/abs/10.1146/annurev.pharmtox.45.120403.095857
[Accessed October 23, 2016].
He, C. et al., 2012. Exercise-induced BCL2-regulated autophagy is required for muscle
glucose homeostasis. Nature, 481(7382), pp.511–5. Available at:
http://dx.doi.org/10.1038/nature10758 [Accessed January 17, 2017].
He, C. et al., 2006. Recruitment of Atg9 to the preautophagosomal structure by Atg11 is
essential for selective autophagy in budding yeast. The Journal of cell biology,
175(6), pp.925–35. Available at: http://www.ncbi.nlm.nih.gov/pubmed/17178909
[Accessed May 21, 2017].
Hieb, W.F. & Rothstein, M., 1968. Sterol requirement for reproduction of a free-living
nematode. Science (New York, N.Y.), 160(3829), pp.778–80. Available at:
http://www.ncbi.nlm.nih.gov/pubmed/4869093 [Accessed May 18, 2017].
Hodgkin, J., 2005. Introduction to genetics and genomics. WormBook. Available at:
http://www.wormbook.org/chapters/www_introgeneticsgenomics/IntroGenetGenom.h
tml [Accessed May 25, 2017].
Hodgkin, J., 1983. Male Phenotypes and Mating Efficiency in CAENORHABDITIS
ELEGANS. Genetics, 103(1), pp.43–64. Available at:
http://europepmc.org/articles/PMC1202023/?report=abstract [Accessed January 26,
2017].
Hodgkin, J. & Doniach, T., 1997. Natural variation and copulatory plug formation in
Caenorhabditis elegans. Genetics, 146(1), pp.149–64. Available at:
http://www.pubmedcentral.nih.gov/articlerender.fcgi?artid=1207933&tool=pmcentrez
&rendertype=abstract [Accessed January 26, 2017].
Hoeven, R. van der et al., 2011. Ce-Duox1/BLI-3 generated reactive oxygen species

Anastasios Batas 2017 Chapter 7
240
trigger protective SKN-1 activity via p38 MAPK signaling during infection in C.
elegans. PLoS pathogens, 7(12), p.e1002453. Available at:
http://www.pubmedcentral.nih.gov/articlerender.fcgi?artid=3245310&tool=pmcentrez
&rendertype=abstract [Accessed February 8, 2016].
Holzenberger, M. et al., 2003. IGF-1 receptor regulates lifespan and resistance to oxidative
stress in mice. Nature, 421(6919), pp.182–7. Available at:
http://dx.doi.org/10.1038/nature01298 [Accessed January 13, 2017].
Honda, Y. & Honda, S., 1999. The daf-2 gene network for longevity regulates oxidative
stress resistance and Mn-superoxide dismutase gene expression in Caenorhabditis
elegans. FASEB journal : official publication of the Federation of American Societies
for Experimental Biology, 13(11), pp.1385–93. Available at:
http://www.ncbi.nlm.nih.gov/pubmed/10428762 [Accessed January 13, 2017].
Hong, W., 2005. SNAREs and traffic. Biochimica et biophysica acta, 1744(2), pp.120–44.
Available at: http://www.sciencedirect.com/science/article/pii/S0167488905000571
[Accessed November 13, 2016].
Huang, S. et al., 2013. Autophagy genes function in apoptotic cell corpse clearance during
C. elegans embryonic development. Autophagy, 9(2), pp.138–49. Available at:
http://www.ncbi.nlm.nih.gov/pubmed/23108454 [Accessed September 19, 2017].
Huang, W.P. et al., 2000. The itinerary of a vesicle component, Aut7p/Cvt5p, terminates in
the yeast vacuole via the autophagy/Cvt pathways. The Journal of biological
chemistry, 275(8), pp.5845–51. Available at:
http://www.ncbi.nlm.nih.gov/pubmed/10681575 [Accessed July 25, 2017].
Hunter, C.P. et al., 1999. Hox gene expression in a single Caenorhabditis elegans cell is
regulated by a caudal homolog and intercellular signals that inhibit wnt signaling.
Development, 126(4). Available at: http://dev.biologists.org/content/126/4/805.long
[Accessed May 19, 2017].
Itakura, E., Kishi-Itakura, C. & Mizushima, N., 2012. The Hairpin-type Tail-Anchored
SNARE Syntaxin 17 Targets to Autophagosomes for Fusion with
Endosomes/Lysosomes. Cell, 151(6), pp.1256–1269. Available at:
http://www.ncbi.nlm.nih.gov/pubmed/23217709 [Accessed May 21, 2017].
Itakura, E. & Mizushima, N., 2010. Characterization of autophagosome formation site by a
hierarchical analysis of mammalian Atg proteins. Autophagy, 6(6), pp.764–76.
Available at:
http://www.pubmedcentral.nih.gov/articlerender.fcgi?artid=3321844&tool=pmcentrez
&rendertype=abstract [Accessed January 16, 2017].
Jahn, R. & Scheller, R.H., 2006. SNAREs--engines for membrane fusion. Nature reviews.
Molecular cell biology, 7, pp.631–643.
Jahn, R. & Südhof, T.C., 2003. Membrane Fusion and Exocytosis. Available at:
http://www.annualreviews.org/doi/abs/10.1146/annurev.biochem.68.1.863?journalCo
de=biochem [Accessed February 4, 2017].
Jahn, R. & Südhof, T.C., 1999. Membrane fusion and exocytosis. Annual review of
biochemistry, 68, pp.863–911. Available at:
http://www.ncbi.nlm.nih.gov/pubmed/10872468 [Accessed February 4, 2017].
Jao, C.C. et al., 2013. A HORMA domain in Atg13 mediates PI 3-kinase recruitment in
autophagy. Proceedings of the National Academy of Sciences, 110(14), pp.5486–

Anastasios Batas 2017 Chapter 7
241
5491. Available at: http://www.pnas.org/content/110/14/5486.full.pdf [Accessed May
21, 2017].
Jewell, J.L., Russell, R.C. & Guan, K.-L., 2013. Amino acid signalling upstream of mTOR.
Nature reviews. Molecular cell biology, 14(3), pp.133–9. Available at:
http://www.pubmedcentral.nih.gov/articlerender.fcgi?artid=3988467&tool=pmcentrez
&rendertype=abstract [Accessed January 16, 2017].
Jiang, P. et al., 2014. The HOPS complex mediates autophagosome-lysosome fusion
through interaction with syntaxin 17. Molecular biology of the cell, 25(8), pp.1327–
37. Available at: http://www.ncbi.nlm.nih.gov/pubmed/24554770 [Accessed May 23,
2017].
Johnstone, I.L., 2000. Cuticle collagen genes. Expression in Caenorhabditis elegans.
Trends in genetics : TIG, 16(1), pp.21–7. Available at:
http://www.ncbi.nlm.nih.gov/pubmed/10637627 [Accessed February 8, 2016].
Johnstone, I.L., 1994. The cuticle of the nematode Caenorhabditis elegans: a complex
collagen structure. BioEssays : news and reviews in molecular, cellular and
developmental biology, 16(3), pp.171–8. Available at:
http://www.ncbi.nlm.nih.gov/pubmed/8166670 [Accessed January 20, 2017].
Johnstone, I.L. & Barry, J.D., 1996. Temporal reiteration of a precise gene expression
pattern during nematode development. The EMBO journal, 15(14), pp.3633–9.
Available at:
http://www.pubmedcentral.nih.gov/articlerender.fcgi?artid=451985&tool=pmcentrez
&rendertype=abstract [Accessed January 24, 2017].
Kabeya, Y. et al., 2005. Atg17 Functions in Cooperation with Atg1 and Atg13 in Yeast
Autophagy. Molecular Biology of the Cell, 16(5), pp.2544–2553. Available at:
http://www.ncbi.nlm.nih.gov/pubmed/15743910 [Accessed May 21, 2017].
Kabeya, Y. et al., 2009. Characterization of the Atg17–Atg29–Atg31 complex specifically
required for starvation-induced autophagy in Saccharomyces cerevisiae, Available at:
http://www.sciencedirect.com/science/article/pii/S0006291X09018221 [Accessed
May 21, 2017].
Kabeya, Y. et al., 2000. LC3, a mammalian homologue of yeast Apg8p, is localized in
autophagosome membranes after processing. The EMBO journal, 19(21), pp.5720–8.
Available at:
http://www.pubmedcentral.nih.gov/articlerender.fcgi?artid=305793&tool=pmcentrez
&rendertype=abstract [Accessed September 27, 2016].
Kamada, Y. et al., 2000. Tor-mediated induction of autophagy via an Apg1 protein kinase
complex. The Journal of cell biology, 150(6), pp.1507–13. Available at:
http://www.ncbi.nlm.nih.gov/pubmed/10995454 [Accessed May 21, 2017].
Kamada, Y. & Ohsumi, Y., 2010. The TOR-Mediated Regulation of Autophagy in the
Yeast Saccharomyces cerevisiae. In pp. 143–165. Available at:
http://linkinghub.elsevier.com/retrieve/pii/S1874604710280071 [Accessed May 21,
2017].
Kamber, R.A., Shoemaker, C.J. & Denic, V., 2015. Receptor-Bound Targets of Selective
Autophagy Use a Scaffold Protein to Activate the Atg1 Kinase. Molecular Cell,
59(3), pp.372–381. Available at: http://www.ncbi.nlm.nih.gov/pubmed/26166702
[Accessed May 22, 2017].

Anastasios Batas 2017 Chapter 7
242
Kanazawa, T. et al., 2004. Amino acids and insulin control autophagic proteolysis through
different signaling pathways in relation to mTOR in isolated rat hepatocytes. The
Journal of biological chemistry, 279(9), pp.8452–9. Available at:
http://www.ncbi.nlm.nih.gov/pubmed/14610086 [Accessed January 16, 2017].
Kaplan, R.E.W. & Baugh, L.R., 2016. L1 arrest, daf-16 /FoxO and nonautonomous control
of post-embryonic development. Worm, 5(2), p.e1175196. Available at:
http://www.ncbi.nlm.nih.gov/pubmed/27383290 [Accessed March 10, 2017].
Karanasios, E. et al., 2013. Dynamic association of the ULK1 complex with omegasomes
during autophagy induction. Journal of cell science, 126(Pt 22), pp.5224–38.
Available at: http://jcs.biologists.org/content/126/22/5224 [Accessed January 16,
2017].
Khalfan, W.A. & Klionsky, D.J., 2002. Molecular machinery required for autophagy and
the cytoplasm to vacuole targeting (Cvt) pathway in S. cerevisiae. Current opinion in
cell biology, 14(4), pp.468–75. Available at:
http://www.ncbi.nlm.nih.gov/pubmed/12383798 [Accessed May 22, 2017].
Kijanska, M. et al., 2010. Activation of Atg1 kinase in autophagy by regulated
phosphorylation. Autophagy, 6(8), pp.1168–78. Available at:
http://www.ncbi.nlm.nih.gov/pubmed/20953146 [Accessed September 13, 2016].
Kim, J. et al., 2011. AMPK and mTOR regulate autophagy through direct phosphorylation
of Ulk1. Nature cell biology, 13(2), pp.132–41. Available at:
http://www.pubmedcentral.nih.gov/articlerender.fcgi?artid=3987946&tool=pmcentrez
&rendertype=abstract [Accessed November 24, 2016].
Kim, J. et al., 2002. Convergence of multiple autophagy and cytoplasm to vacuole
targeting components to a perivacuolar membrane compartment prior to de novo
vesicle formation. The Journal of biological chemistry, 277(1), pp.763–73. Available
at: http://www.ncbi.nlm.nih.gov/pubmed/11675395 [Accessed May 20, 2017].
Kim, J. et al., 2001. Cvt9/Gsa9 Functions in Sequestering Selective Cytosolic Cargo
Destined for the Vacuole. The Journal of Cell Biology, 153(2). Available at:
http://jcb.rupress.org/content/153/2/381 [Accessed May 21, 2017].
Kim, M.S. et al., 2011. Expressional and mutational analyses of ATG5 gene in prostate
cancers. APMIS : acta pathologica, microbiologica, et immunologica Scandinavica,
119(11), pp.802–7. Available at: http://www.ncbi.nlm.nih.gov/pubmed/21995634
[Accessed January 17, 2017].
Kim, Y.G., Cha, J. & Chandrasegaran, S., 1996. Hybrid restriction enzymes: zinc finger
fusions to Fok I cleavage domain. Proceedings of the National Academy of Sciences
of the United States of America, 93(3), pp.1156–60. Available at:
http://www.pubmedcentral.nih.gov/articlerender.fcgi?artid=40048&tool=pmcentrez&
rendertype=abstract [Accessed January 28, 2017].
Kirisako, T. et al., 1999. Formation Process of Autophagosome Is Traced with
Apg8/Aut7p in Yeast. The Journal of Cell Biology, 147(2). Available at:
http://jcb.rupress.org/content/147/2/435 [Accessed May 20, 2017].
KLASS, M. & HIRSH, D., 1976. Non-ageing developmental variant of Caenorhabditis
elegans. Nature, 260(5551), pp.523–525. Available at:
http://www.nature.com/doifinder/10.1038/260523a0 [Accessed May 19, 2017].
Köppen, M. et al., 2001. Cooperative regulation of AJM-1 controls junctional integrity in
Anastasios Batas 2017 Chapter 7
243
Caenorhabditis elegans epithelia. Nature cell biology, 3(11), pp.983–91. Available at:
http://www.nature.com/doifinder/10.1038/ncb1101-983 [Accessed March 28, 2017].
Koyama-Honda, I. et al., 2013. Temporal analysis of recruitment of mammalian ATG
proteins to the autophagosome formation site. Autophagy. Available at:
http://www.tandfonline.com/doi/abs/10.4161/auto.25529 [Accessed January 16,
2017].
Kuervers, L.M. et al., 2003. The sterol modifying enzyme LET-767 is essential for growth,
reproduction and development in Caenorhabditis elegans. Molecular genetics and
genomics : MGG, 270(2), pp.121–31. Available at:
http://www.ncbi.nlm.nih.gov/pubmed/12905072 [Accessed January 24, 2017].
Kuma, A., Matsui, M. & Mizushima, N., 2007. LC3, an Autophagosome Marker, Can be
Incorporated into Protein Aggregates Independent of Autophagy: Caution in the
Interpretation of LC3 Localization. Autophagy, 3(4), pp.323–328. Available at:
http://www.tandfonline.com/doi/abs/10.4161/auto.4012 [Accessed August 15, 2017].
Kuroyanagi, H. et al., 1998. Human ULK1, a novel serine/threonine kinase related to
UNC-51 kinase of Caenorhabditis elegans: cDNA cloning, expression, and
chromosomal assignment. Genomics, 51(1), pp.76–85. Available at:
http://www.ncbi.nlm.nih.gov/pubmed/9693035 [Accessed January 16, 2017].
Kutscher, L.M. & Shaham, S., 2014. Forward and reverse mutagenesis in C. elegans.
WormBook : the online review of C. elegans biology, pp.1–26. Available at:
http://www.pubmedcentral.nih.gov/articlerender.fcgi?artid=4078664&tool=pmcentrez
&rendertype=abstract [Accessed January 27, 2017].
Ladoire, S. et al., 2012. Immunohistochemical detection of cytoplasmic LC3 puncta in
human cancer specimens. Autophagy, 8(8), pp.1175–84. Available at:
http://www.tandfonline.com/doi/abs/10.4161/auto.20353 [Accessed January 17,
2017].
Lamb, C.A., Yoshimori, T. & Tooze, S.A., 2013. The autophagosome: origins unknown,
biogenesis complex. Nature reviews. Molecular cell biology, 14(12), pp.759–74.
Available at: http://dx.doi.org/10.1038/nrm3696 [Accessed August 24, 2016].
Langmead, B. et al., 2009. Ultrafast and memory-efficient alignment of short DNA
sequences to the human genome. Genome biology, 10(3), p.R25. Available at:
http://genomebiology.biomedcentral.com/articles/10.1186/gb-2009-10-3-r25
[Accessed August 21, 2016].
Laplante, M. & Sabatini, D.M., 2012. mTOR signaling in growth control and disease. Cell,
149(2), pp.274–93. Available at:
http://www.pubmedcentral.nih.gov/articlerender.fcgi?artid=3331679&tool=pmcentrez
&rendertype=abstract [Accessed October 18, 2016].
Lee, R., Hench, J. & Ruvkun, G., 2001. Regulation of C. elegans DAF-16 and its human
ortholog FKHRL1 by the daf-2 insulin-like signaling pathway. Current Biology.
Available at: http://www.sciencedirect.com/science/article/pii/S0960982201005954
[Accessed January 13, 2017].
Levine, B. & Kroemer, G., 2008. Autophagy in the pathogenesis of disease. Cell, 132(1),
pp.27–42. Available at: http://www.cell.com/article/S0092867407016856/fulltext
[Accessed December 13, 2016].
Li, H. et al., 2009. The Sequence Alignment/Map format and SAMtools. Bioinformatics

Anastasios Batas 2017 Chapter 7
244
(Oxford, England), 25(16), pp.2078–9. Available at:
http://www.pubmedcentral.nih.gov/articlerender.fcgi?artid=2723002&tool=pmcentrez
&rendertype=abstract [Accessed August 20, 2016].
Liang, C. et al., 2008. Beclin1-binding UVRAG targets the class C Vps complex to
coordinate autophagosome maturation and endocytic trafficking. Nature Cell Biology,
10(7), pp.776–787. Available at: http://www.ncbi.nlm.nih.gov/pubmed/18552835
[Accessed May 21, 2017].
Lin, R.C. & Scheller, R.H., 2000. Mechanisms of synaptic vesicle exocytosis. Annual
review of cell and developmental biology, 16, pp.19–49. Available at:
http://www.ncbi.nlm.nih.gov/pubmed/11031229 [Accessed February 5, 2017].
Lohman, J.. & Remington, S.J., 2008. Development of a family of redox-sensitive green
fluorescent protein indicators for use in relatively oxidizing subcellular environments.
Biochemistry, 47, pp.8678–8688. Available at:
http://www.rcsb.org/pdb/explore.do?structureId=3cd1 [Accessed February 13, 2017].
Ma, J.-F. et al., 2010. Immunohistochemical evidence for macroautophagy in neurones and
endothelial cells in Alzheimer’s disease. Neuropathology and applied neurobiology,
36(4), pp.312–9. Available at: http://www.ncbi.nlm.nih.gov/pubmed/20102518
[Accessed January 17, 2017].
Mack, H.I.D. et al., 2012. AMPK-dependent phosphorylation of ULK1 regulates ATG9
localization. Autophagy, 8(8), pp.1197–1214. Available at:
http://www.ncbi.nlm.nih.gov/pubmed/22932492 [Accessed May 21, 2017].
Madeo, F. et al., 1999. Oxygen stress: a regulator of apoptosis in yeast. The Journal of cell
biology, 145(4), pp.757–67. Available at:
http://www.pubmedcentral.nih.gov/articlerender.fcgi?artid=2133192&tool=pmcentrez
&rendertype=abstract [Accessed February 13, 2017].
Malhotra, J.D. & Kaufman, R.J., 2007a. Endoplasmic reticulum stress and oxidative stress:
a vicious cycle or a double-edged sword? Antioxidants & redox signaling, 9(12),
pp.2277–93. Available at: http://www.ncbi.nlm.nih.gov/pubmed/17979528 [Accessed
February 10, 2016].
Malhotra, J.D. & Kaufman, R.J., 2007b. Endoplasmic Reticulum Stress and Oxidative
Stress: A Vicious Cycle or a Double-Edged Sword? Antioxidants & Redox Signaling,
9(12), pp.2277–2294. Available at:
http://www.liebertonline.com/doi/abs/10.1089/ars.2007.1782 [Accessed May 23,
2017].
Matsunaga, K. et al., 2010. Autophagy requires endoplasmic reticulum targeting of the
PI3-kinase complex via Atg14L. The Journal of cell biology, 190(4), pp.511–21.
Available at: http://www.ncbi.nlm.nih.gov/pubmed/20713597 [Accessed January 16,
2017].
Matsuura, A. et al., 1997. Apg1p, a novel protein kinase required for the autophagic
process in Saccharomyces cerevisiae. Gene, 192(2), pp.245–250. Available at:
http://www.sciencedirect.com/science/article/pii/S037811199700084X [Accessed
May 21, 2017].
Matyash, V. et al., 2004. Sterol-derived hormone(s) controls entry into diapause in
Caenorhabditis elegans by consecutive activation of DAF-12 and DAF-16. PLoS
biology, 2(10), p.e280. Available at:
http://europepmc.org/articles/PMC517820/?report=abstract [Accessed January 24,

Anastasios Batas 2017 Chapter 7
245
2017].
Mayer, A. & Wickner, W., 1997. Docking of yeast vacuoles is catalyzed by the Ras-like
GTPase Ypt7p after symmetric priming by Sec18p (NSF). The Journal of cell
biology, 136(2), pp.307–17. Available at:
http://www.ncbi.nlm.nih.gov/pubmed/9015302 [Accessed August 24, 2017].
McCloy, R.A. et al., 2014. Partial inhibition of Cdk1 in G 2 phase overrides the SAC and
decouples mitotic events. Cell cycle (Georgetown, Tex.), 13(9), pp.1400–12.
Available at: http://www.tandfonline.com/doi/abs/10.4161/cc.28401 [Accessed May
25, 2016].
McMahon, L. et al., 2003. Two sets of interacting collagens form functionally distinct
substructures within a Caenorhabditis elegans extracellular matrix. Molecular biology
of the cell, 14(4), pp.1366–78. Available at:
http://www.pubmedcentral.nih.gov/articlerender.fcgi?artid=153107&tool=pmcentrez
&rendertype=abstract [Accessed February 8, 2016].
Meléndez, A. et al., 2003. Autophagy genes are essential for dauer development and life-
span extension in C. elegans. Science (New York, N.Y.), 301(5638), pp.1387–91.
Available at: http://science.sciencemag.org/content/301/5638/1387.abstract [Accessed
January 16, 2017].
Meléndez, A. & Levine, B., 2009. Autophagy in C. elegans. WormBook, pp.1–26.
Available at: http://www.ncbi.nlm.nih.gov/pubmed/19705512 [Accessed May 21,
2017].
Minevich, G. et al., 2012. CloudMap: a cloud-based pipeline for analysis of mutant
genome sequences. Genetics, 192(4), pp.1249–69. Available at:
http://www.pubmedcentral.nih.gov/articlerender.fcgi?artid=3512137&tool=pmcentrez
&rendertype=abstract [Accessed January 22, 2016].
Misura, K.M.S., Scheller, R.H. & Weis, W.I., 2000. Three-dimensional structure of the
neuronal-Sec1–syntaxin 1a complex. Nature, 404(6776), pp.355–362. Available at:
http://www.ncbi.nlm.nih.gov/pubmed/10746715 [Accessed May 22, 2017].
Mizushima, N. et al., 1998. A new protein conjugation system in human. The counterpart
of the yeast Apg12p conjugation system essential for autophagy. The Journal of
biological chemistry, 273(51), pp.33889–92. Available at:
http://www.ncbi.nlm.nih.gov/pubmed/9852036 [Accessed January 16, 2017].
Mizushima, N., 2007. Autophagy: process and function. Genes & development, 21(22),
pp.2861–73. Available at: http://www.ncbi.nlm.nih.gov/pubmed/18006683 [Accessed
May 21, 2017].
Mizushima, N. et al., 2008. Autophagy fights disease through cellular self-digestion.
Nature, 451(7182), pp.1069–75. Available at:
http://www.ncbi.nlm.nih.gov/pubmed/18305538 [Accessed May 20, 2017].
Mizushima, N. & Klionsky, D.J., 2007. Protein turnover via autophagy: implications for
metabolism. Annual review of nutrition, 27, pp.19–40. Available at:
http://www.ncbi.nlm.nih.gov/pubmed/17311494 [Accessed January 16, 2017].
Monsalve, G.C. et al., 2011. LIN-42/PERIOD controls cyclical and developmental
progression of C. elegans molts. Current biology : CB, 21(24), pp.2033–45. Available
at: http://www.ncbi.nlm.nih.gov/pubmed/22137474 [Accessed June 26, 2017].
Nair, U. et al., 2012. A role for Atg8–PE deconjugation in autophagosome biogenesis.

Anastasios Batas 2017 Chapter 7
246
Autophagy, 8(5), pp.780–793. Available at:
http://www.ncbi.nlm.nih.gov/pubmed/22622160 [Accessed May 21, 2017].
Nair, U. et al., 2011. SNARE proteins are required for macroautophagy. Cell, 146(2),
pp.290–302. Available at: http://www.ncbi.nlm.nih.gov/pubmed/21784249 [Accessed
May 13, 2017].
Nair, U. & Klionsky, D.J., 2011. Autophagosome biogenesis requires SNAREs.
Autophagy, 7(12), pp.1570–2. Available at:
http://www.pubmedcentral.nih.gov/articlerender.fcgi?artid=3327624&tool=pmcentrez
&rendertype=abstract [Accessed February 10, 2016].
Nakatogawa, H., Ichimura, Y. & Ohsumi, Y., 2007. Atg8, a Ubiquitin-like Protein
Required for Autophagosome Formation, Mediates Membrane Tethering and
Hemifusion. Cell, 130(1), pp.165–178. Available at:
http://www.sciencedirect.com/science/article/pii/S0092867407006587 [Accessed May
21, 2017].
Nebert, D.W. & Vasiliou, V., 2004. Analysis of the glutathione S-transferase (GST) gene
family. Human Genomics, 1(6), p.460. Available at:
http://humgenomics.biomedcentral.com/articles/10.1186/1479-7364-1-6-460
[Accessed January 27, 2017].
Nielsen, E. et al., 2000. Rabenosyn-5, a novel Rab5 effector, is complexed with hVPS45
and recruited to endosomes through a FYVE finger domain. The Journal of cell
biology, 151(3), pp.601–12. Available at:
http://www.pubmedcentral.nih.gov/articlerender.fcgi?artid=2185588&tool=pmcentrez
&rendertype=abstract [Accessed February 19, 2016].
Noda, T. et al., 2000. Apg9p/Cvt7p is an integral membrane protein required for transport
vesicle formation in the Cvt and autophagy pathways. The Journal of cell biology,
148(3), pp.465–80. Available at: http://www.ncbi.nlm.nih.gov/pubmed/10662773
[Accessed May 13, 2017].
Noda, T. & Ohsumi, Y., 1998. Tor, a phosphatidylinositol kinase homologue, controls
autophagy in yeast. The Journal of biological chemistry, 273(7), pp.3963–6.
Available at: http://www.ncbi.nlm.nih.gov/pubmed/9461583 [Accessed January 16,
2017].
Ogura, K., Wicky, C., Magnenat, L., Tobler, H., Mori, I., Müller, F., et al., 1994.
Caenorhabditis elegans unc-51 gene required for axonal elongation encodes a novel
serine/threonine kinase. , 8(20). Available at:
http://www.genesdev.org/cgi/doi/10.1101/gad.8.20.2389 [Accessed March 10, 2017].
Ogura, K., Wicky, C., Magnenat, L., Tobler, H., Mori, I., Muller, F., et al., 1994.
Caenorhabditis elegans unc-51 gene required for axonal elongation encodes a novel
serine/threonine kinase. Genes & Development, 8(20), pp.2389–2400. Available at:
http://www.genesdev.org/cgi/doi/10.1101/gad.8.20.2389 [Accessed March 24, 2017].
Ohashi, Y. & Munro, S., 2010. Membrane delivery to the yeast autophagosome from the
Golgi-endosomal system. Molecular biology of the cell, 21(22), pp.3998–4008.
Available at:
http://www.pubmedcentral.nih.gov/articlerender.fcgi?artid=2982105&tool=pmcentrez
&rendertype=abstract [Accessed September 13, 2016].
Ohsumi, Y., 2000. Kamada 2000, Tor-mediated induction of autophagy via an Apg1
protein kinase complex. Journal of Cell Biology, 150(6), pp.1507–1513. Available at:

Anastasios Batas 2017 Chapter 7
247
http://jcb.rupress.org/content/150/6/1507.full [Accessed May 21, 2017].
Ookawara, T. et al., 2002. Nuclear translocation of extracellular superoxide dismutase.
Biochemical and Biophysical Research Communications, 296(1), pp.54–61. Available
at: http://www.sciencedirect.com/science/article/pii/S0006291X02008045 [Accessed
January 27, 2017].
Orsi, A. et al., 2012. Dynamic and transient interactions of Atg9 with autophagosomes, but
not membrane integration, are required for autophagy. Molecular biology of the cell,
23(10), pp.1860–73. Available at:
http://www.pubmedcentral.nih.gov/articlerender.fcgi?artid=3350551&tool=pmcentrez
&rendertype=abstract [Accessed January 16, 2017].
Oury, T.D., Day, B.J. & Crapo, J.D., 1996. Extracellular superoxide dismutase in vessels
and airways of humans and baboons. Free Radical Biology and Medicine, 20(7),
pp.957–965. Available at:
http://www.sciencedirect.com/science/article/pii/0891584995022228 [Accessed
January 27, 2017].
Peixoto, C.A., Kramer, J.M. & de Souza, W., 1997. Caenorhabditis elegans cuticle: a
description of new elements of the fibrous layer. The Journal of parasitology, 83(3),
pp.368–72. Available at: http://www.ncbi.nlm.nih.gov/pubmed/9194814 [Accessed
March 27, 2017].
Piper, R.C., Whitters, E.A. & Stevens, T.H., 1994. Yeast Vps45p is a Sec1p-like protein
required for the consumption of vacuole-targeted, post-Golgi transport vesicles.
European journal of cell biology, 65(2), pp.305–18. Available at:
http://www.ncbi.nlm.nih.gov/pubmed/7720726 [Accessed September 13, 2016].
Plaisance, V. et al., 2016. Endoplasmic Reticulum Stress Links Oxidative Stress to
Impaired Pancreatic Beta-Cell Function Caused by Human Oxidized LDL A. Nadal,
ed. PLOS ONE, 11(9), p.e0163046. Available at:
http://dx.plos.org/10.1371/journal.pone.0163046 [Accessed May 23, 2017].
Podbilewicz, B. & White, J.G., 1994. Cell Fusions in the Developing Epithelia of C.
elegans. Developmental Biology, 161(2), pp.408–424. Available at:
http://www.sciencedirect.com/science/article/pii/S0012160684710414 [Accessed
April 27, 2016].
Pollard, M.G., Travers, K.J. & Weissman, J.S., 1998. Ero1p: a novel and ubiquitous
protein with an essential role in oxidative protein folding in the endoplasmic
reticulum. Molecular cell, 1(2), pp.171–82. Available at:
http://www.ncbi.nlm.nih.gov/pubmed/9659914 [Accessed May 18, 2017].
Possik, E. & Pause, A., 2015. Measuring Oxidative Stress Resistance of Caenorhabditis
elegans in 96-well Microtiter Plates. Journal of Visualized Experiments, (99),
p.1367520. Available at: http://www.jove.com/video/52746/measuring-oxidative-
stress-resistance-caenorhabditis-elegans-96-well [Accessed February 8, 2016].
Poteryaev, D. et al., 2010. Identification of the switch in early-to-late endosome transition.
Cell, 141(3), pp.497–508. Available at:
http://www.sciencedirect.com/science/article/pii/S0092867410002473 [Accessed
March 2, 2016].
Qu, X. et al., 2007. Autophagy Gene-Dependent Clearance of Apoptotic Cells during
Embryonic Development. Cell, 128(5), pp.931–946. Available at:
http://www.ncbi.nlm.nih.gov/pubmed/17350577 [Accessed May 20, 2017].
Anastasios Batas 2017 Chapter 7
248
Raymond, C.K. et al., 1992. Morphological classification of the yeast vacuolar protein
sorting mutants: evidence for a prevacuolar compartment in class E vps mutants.
Molecular biology of the cell, 3(12), pp.1389–402. Available at:
http://www.ncbi.nlm.nih.gov/pubmed/1493335 [Accessed June 20, 2017].
Reggiori, F. et al., 2004. The Atg1-Atg13 complex regulates Atg9 and Atg23 retrieval
transport from the pre-autophagosomal structure. Developmental cell, 6(1), pp.79–90.
Available at: http://www.ncbi.nlm.nih.gov/pubmed/14723849 [Accessed May 20,
2017].
Reggiori, F. & Klionsky, D.J., 2006. Atg9 sorting from mitochondria is impaired in early
secretion and VFT-complex mutants in Saccharomyces cerevisiae. Journal of Cell
Science, 119(14). Available at: http://jcs.biologists.org/content/119/14/2903
[Accessed May 20, 2017].
Reggiori, F. & Klionsky, D.J., 2002. Autophagy in the Eukaryotic Cell. Eukaryotic Cell,
1(1), pp.11–21. Available at: http://ec.asm.org/content/1/1/11.full [Accessed August
13, 2016].
Robinson, J.S. et al., 1988. Protein sorting in Saccharomyces cerevisiae: isolation of
mutants defective in the delivery and processing of multiple vacuolar hydrolases.
Molecular and cellular biology, 8(11), pp.4936–48. Available at:
http://www.pubmedcentral.nih.gov/articlerender.fcgi?artid=365587&tool=pmcentrez
&rendertype=abstract [Accessed September 13, 2016].
Ron, D., 2002. Translational control in the endoplasmic reticulum stress response. The
Journal of clinical investigation, 110(10), pp.1383–8. Available at:
http://www.jci.org/articles/view/16784 [Accessed February 6, 2017].
Rubinsztein, D.C., Codogno, P. & Levine, B., 2012. Autophagy modulation as a potential
therapeutic target for diverse diseases. Nature reviews. Drug discovery, 11(9),
pp.709–30. Available at: http://dx.doi.org/10.1038/nrd3802 [Accessed September 21,
2016].
Samuelson, A. V, Carr, C.E. & Ruvkun, G., 2007. Gene activities that mediate increased
life span of C. elegans insulin-like signaling mutants. Genes & development, 21(22),
pp.2976–94. Available at: http://genesdev.cshlp.org/content/21/22/2976.abstract
[Accessed January 13, 2017].
Sato, K. et al., 2014. C. elegans as a model for membrane traffic. WormBook : the online
review of C. elegans biology, pp.1–47. Available at:
http://www.ncbi.nlm.nih.gov/pubmed/24778088 [Accessed March 27, 2017].
Sato, M. et al., 2011. Degradation of paternal mitochondria by fertilization-triggered
autophagy in C. elegans embryos. Science (New York, N.Y.), 334(6059), pp.1141–4.
Available at: http://www.ncbi.nlm.nih.gov/pubmed/21998252 [Accessed July 1,
2016].
Schneeberger, K. et al., 2009. SHOREmap: simultaneous mapping and mutation
identification by deep sequencing. Nature methods, 6(8), pp.550–1. Available at:
http://dx.doi.org/10.1038/nmeth0809-550 [Accessed February 7, 2017].
Schneider, C.A., Rasband, W.S. & Eliceiri, K.W., 2012. NIH Image to ImageJ: 25 years of
image analysis. Nature Methods, 9(7), pp.671–675. Available at:
http://www.nature.com/doifinder/10.1038/nmeth.2089 [Accessed March 10, 2017].
Schulz, J.B. et al., 2000. Glutathione, oxidative stress and neurodegeneration. European
Anastasios Batas 2017 Chapter 7
249
Journal of Biochemistry, 267(16), pp.4904–4911. Available at:
http://doi.wiley.com/10.1046/j.1432-1327.2000.01595.x [Accessed January 27, 2017].
Scott, R.C., Juhász, G. & Neufeld, T.P., 2007. Direct Induction of Autophagy by Atg1
Inhibits Cell Growth and Induces Apoptotic Cell Death. Current Biology, 17(1), pp.1–
11. Available at: http://www.ncbi.nlm.nih.gov/pubmed/17208179 [Accessed May 20,
2017].
Scott, S. V et al., 1996. Cytoplasm-to-vacuole targeting and autophagy employ the same
machinery to deliver proteins to the yeast vacuole. Proceedings of the National
Academy of Sciences of the United States of America, 93(22), pp.12304–8. Available
at: http://www.ncbi.nlm.nih.gov/pubmed/8901576 [Accessed May 22, 2017].
Seals, D.F. et al., 2000. A Ypt/Rab effector complex containing the Sec1 homolog Vps33p
is required for homotypic vacuole fusion. Proceedings of the National Academy of
Sciences, 97(17), pp.9402–9407. Available at:
http://www.pnas.org/cgi/doi/10.1073/pnas.97.17.9402 [Accessed May 23, 2017].
Seidel, H.S., Rockman, M. V & Kruglyak, L., 2008. Widespread genetic incompatibility in
C. elegans maintained by balancing selection. Science (New York, N.Y.), 319(5863),
pp.589–94. Available at:
http://www.pubmedcentral.nih.gov/articlerender.fcgi?artid=2421010&tool=pmcentrez
&rendertype=abstract [Accessed November 24, 2016].
Séron, K. et al., 1998. A yeast t-SNARE involved in endocytosis. Molecular biology of the
cell, 9(10), pp.2873–89. Available at: http://www.ncbi.nlm.nih.gov/pubmed/9763449
[Accessed May 20, 2017].
Shanks, S.G. et al., 2012. The Sec1/Munc18 Protein Vps45 Regulates Cellular Levels of
Its SNARE Binding Partners Tlg2 and Snc2 in Saccharomyces cerevisiae W. Hong,
ed. PLoS ONE, 7(11), p.e49628. Available at:
https://www.researchgate.net/publication/233725644_The_Sec1Munc18_Protein_Vps
45_Regulates_Cellular_Levels_of_Its_SNARE_Binding_Partners_Tlg2_and_Snc2_in
_Saccharomyces_cerevisiae [Accessed April 26, 2016].
Shemer, G. et al., 2004. EFF-1 Is Sufficient to Initiate and Execute Tissue-Specific Cell
Fusion in C. elegans. Current Biology, 14(17), pp.1587–1591. Available at:
http://linkinghub.elsevier.com/retrieve/pii/S0960982204005585 [Accessed May 19,
2017].
Shemer, G. & Podbilewicz, B., 2000. Fusomorphogenesis: cell fusion in organ formation.
Developmental dynamics : an official publication of the American Association of
Anatomists, 218(1), pp.30–51. Available at:
http://www.ncbi.nlm.nih.gov/pubmed/10822258 [Accessed April 27, 2016].
Shin, H.-W. et al., 2005. An enzymatic cascade of Rab5 effectors regulates
phosphoinositide turnover in the endocytic pathway. The Journal of Cell Biology,
170(4), pp.607–618. Available at: http://www.ncbi.nlm.nih.gov/pubmed/16103228
[Accessed May 21, 2017].
Simonsen, A. et al., 1999. The Rab5 effector EEA1 interacts directly with syntaxin-6. The
Journal of biological chemistry, 274(41), pp.28857–60. Available at:
http://www.ncbi.nlm.nih.gov/pubmed/10506127 [Accessed May 23, 2017].
Singh, B. & Bhat, H.K., 2012. Superoxide dismutase 3 is induced by antioxidants, inhibits
oxidative DNA damage and is associated with inhibition of estrogen-induced breast
cancer. Carcinogenesis, 33(12), pp.2601–10. Available at:

Anastasios Batas 2017 Chapter 7
250
http://www.pubmedcentral.nih.gov/articlerender.fcgi?artid=3510741&tool=pmcentrez
&rendertype=abstract [Accessed February 10, 2016].
Singh, R.N. & Sulston, J.E., 1978. Some Observations On Moulting in Caenorhabditis
Elegans. Nematologica, 24(1), pp.63–71. Available at:
http://booksandjournals.brillonline.com/content/journals/10.1163/187529278x00074
[Accessed February 8, 2016].
Slice, L.W., Freedman, J.H. & Rubin, C.S., 1990. Purification, characterization, and cDNA
cloning of a novel metallothionein-like, cadmium-binding protein from
Caenorhabditis elegans. The Journal of biological chemistry, 265(1), pp.256–63.
Available at: http://www.ncbi.nlm.nih.gov/pubmed/2294106 [Accessed May 18,
2017].
Solinger, J.A. & Spang, A., 2014. Loss of the Sec1/Munc18-family proteins VPS-33.2 and
VPS-33.1 bypasses a block in endosome maturation in Caenorhabditis elegans.
Molecular biology of the cell, 25(24), pp.3909–25. Available at:
http://www.ncbi.nlm.nih.gov/pubmed/25273556 [Accessed February 27, 2016].
Solinger, J.A. & Spang, A., 2013. Tethering complexes in the endocytic pathway:
CORVET and HOPS. The FEBS journal, 280(12), pp.2743–57. Available at:
http://www.ncbi.nlm.nih.gov/pubmed/23351085 [Accessed February 8, 2016].
St Onge, R.P. et al., 2007. Systematic pathway analysis using high-resolution fitness
profiling of combinatorial gene deletions. Nature genetics, 39(2), pp.199–206.
Available at: http://www.tdi.ox.ac.uk/_asset/file/6692.pdf [Accessed April 19, 2017].
Stenmark, H., 2009. Rab GTPases as coordinators of vesicle traffic. Nature Reviews
Molecular Cell Biology, 10(8), pp.513–525. Available at:
http://www.nature.com/doifinder/10.1038/nrm2728 [Accessed May 21, 2017].
Stepensky, P. et al., 2013. The Thr224Asn mutation in the VPS45 gene is associated with
the congenital neutropenia and primary myelofibrosis of infancy. Blood, 121(25),
pp.5078–5087. Available at: http://www.ncbi.nlm.nih.gov/pubmed/23599270
[Accessed May 20, 2017].
Stepensky, P. et al., 2013. VPS 45-associated primary infantile myelofibrosis - Successful
treatment with hematopoietic stem cell transplantation. Pediatr Transplant, 17(8),
pp.820–825. Available at: http://www.ncbi.nlm.nih.gov/pubmed/24164830.
Stiernagle, T., 2006. Maintenance of C. elegans. WormBook. Available at:
http://www.wormbook.org/chapters/www_strainmaintain/strainmaintain.html
[Accessed March 10, 2017].
Struthers, M.S. et al., 2009. Functional homology of mammalian syntaxin 16 and yeast
Tlg2p reveals a conserved regulatory mechanism. J Cell Sci, 122(Pt 13), pp.2292–
2299. Available at: http://www.ncbi.nlm.nih.gov/pubmed/19509055.
Sudhof, T.C. et al., 2009. Membrane fusion: grappling with SNARE and SM proteins.
Science (New York, N.Y.), 323(5913), pp.474–7. Available at:
http://science.sciencemag.org/content/323/5913/474.abstract [Accessed January 17,
2017].
Sudhof, T.C. & Rothman, J.E., 2009. Membrane Fusion: Grappling with SNARE and SM
Proteins. Science, 323(5913), pp.474–477. Available at:
https://www.ncbi.nlm.nih.gov/pmc/articles/PMC3736821/pdf/nihms494840.pdf
[Accessed May 22, 2017].
Anastasios Batas 2017 Chapter 7
251
Sulston, J.E. et al., 1983. The embryonic cell lineage of the nematode Caenorhabditis
elegans. Developmental biology, 100(1), pp.64–119. Available at:
http://wormatlas.org/ver1/Sulstonemblin_1983/toc.html [Accessed January 12, 2017].
Sulston, J.E. & Horvitz, H.R., 1977. Post-embryonic cell lineages of the nematode,
Caenorhabditis elegans. Developmental biology, 56(1), pp.110–56. Available at:
http://www.ncbi.nlm.nih.gov/pubmed/838129 [Accessed January 13, 2017].
Sun, Q. et al., 2010. Rubicon controls endosome maturation as a Rab7 effector.
Proceedings of the National Academy of Sciences of the United States of America,
107(45), pp.19338–43. Available at: http://www.ncbi.nlm.nih.gov/pubmed/20974968
[Accessed May 21, 2017].
Suzuki, K. et al., 2007. Hierarchy of Atg proteins in pre-autophagosomal structure
organization. Genes to Cells, 12(2), pp.209–218. Available at:
http://www.ncbi.nlm.nih.gov/pubmed/17295840 [Accessed May 21, 2017].
Suzuki, K. et al., 2002. Studies of cargo delivery to the vacuole mediated by
autophagosomes in Saccharomyces cerevisiae. Developmental cell, 3(6), pp.815–24.
Available at: http://www.ncbi.nlm.nih.gov/pubmed/12479807 [Accessed May 21,
2017].
Suzuki, K. et al., 2001. The pre-autophagosomal structure organized by concerted
functions of APG genes is essential for autophagosome formation. The EMBO
Journal, 20(21), pp.5971–5981. Available at:
http://www.ncbi.nlm.nih.gov/pubmed/11689437 [Accessed May 20, 2017].
Suzuki, K. & Ohsumi, Y., 2007. Molecular machinery of autophagosome formation in
yeast, Saccharomyces cerevisiae. FEBS Letters, 581(11), pp.2156–2161. Available at:
http://doi.wiley.com/10.1016/j.febslet.2007.01.096 [Accessed May 21, 2017].
Swain, S.C. et al., 2004. C.elegans Metallothioneins: New Insights into the Phenotypic
Effects of Cadmium Toxicosis. Journal of Molecular Biology, 341(4), pp.951–959.
Available at: http://linkinghub.elsevier.com/retrieve/pii/S0022283604007545
[Accessed May 18, 2017].
Tabara, H., Grishok, A. & Mello, C.C., 1998. RNAi in C. elegans: soaking in the genome
sequence. Science (New York, N.Y.), 282(5388), pp.430–1. Available at:
http://www.ncbi.nlm.nih.gov/pubmed/9841401 [Accessed May 19, 2017].
Takacs-Vellai, K. et al., 2005. Inactivation of the Autophagy Gene bec-1 Triggers
Apoptotic Cell Death in C. elegans. Current Biology, 15(16), pp.1513–1517.
Available at: http://www.ncbi.nlm.nih.gov/pubmed/16111945 [Accessed May 20,
2017].
Takeshige, K. et al., 1992. Autophagy in yeast demonstrated with proteinase-deficient
mutants and conditions for its induction. The Journal of cell biology, 119(2), pp.301–
11. Available at: http://www.ncbi.nlm.nih.gov/pubmed/1400575 [Accessed May 18,
2016].
Tanida, I. et al., 2002. Human Apg3p/Aut1p homologue is an authentic E2 enzyme for
multiple substrates, GATE-16, GABARAP, and MAP-LC3, and facilitates the
conjugation of hApg12p to hApg5p. The Journal of biological chemistry, 277(16),
pp.13739–44. Available at: http://www.ncbi.nlm.nih.gov/pubmed/11825910
[Accessed January 16, 2017].
Tanida, I. et al., 2005. Lysosomal turnover, but not a cellular level, of endogenous LC3 is a

Anastasios Batas 2017 Chapter 7
252
marker for autophagy. Autophagy, 1(2), pp.84–91. Available at:
http://www.ncbi.nlm.nih.gov/pubmed/16874052 [Accessed July 25, 2017].
Thein, M.C. et al., 2003. Caenorhabditis elegans exoskeleton collagen COL-19: an adult-
specific marker for collagen modification and assembly, and the analysis of
organismal morphology. Developmental dynamics : an official publication of the
American Association of Anatomists, 226(3), pp.523–39. Available at:
http://www.ncbi.nlm.nih.gov/pubmed/12619137 [Accessed January 13, 2017].
Thoreen, C.C. et al., 2009. An ATP-competitive mammalian target of rapamycin inhibitor
reveals rapamycin-resistant functions of mTORC1. The Journal of biological
chemistry, 284(12), pp.8023–32. Available at:
http://www.pubmedcentral.nih.gov/articlerender.fcgi?artid=2658096&tool=pmcentrez
&rendertype=abstract [Accessed January 16, 2017].
Tian, E. et al., 2009. epg-1 functions in autophagy-regulated processes and may encode a
highly divergent Atg13 homolog in C. elegans. Autophagy, 5(5), pp.608–15.
Available at: http://www.ncbi.nlm.nih.gov/pubmed/19377305 [Accessed May 21,
2017].
Timmons, L., Court, D.L. & Fire, A., 2001. Ingestion of bacterially expressed dsRNAs can
produce specific and potent genetic interference in Caenorhabditis elegans. Gene,
263(1–2), pp.103–12. Available at: http://www.ncbi.nlm.nih.gov/pubmed/11223248
[Accessed May 19, 2017].
Tsukada, M. & Ohsumi, Y., 1993. Isolation and characterization of autophagy-defective
mutants of Saccharomyces cerevisiae. FEBS letters, 333(1–2), pp.169–74. Available
at: http://www.ncbi.nlm.nih.gov/pubmed/8224160 [Accessed May 20, 2017].
Tu, B.P. & Weissman, J.S., 2004. Oxidative protein folding in eukaryotes: mechanisms
and consequences. The Journal of cell biology, 164(3), pp.341–6. Available at:
http://jcb.rupress.org/content/164/3/341 [Accessed February 6, 2017].
Vanfleteren, J.R. & De Vreese, A., 1995. The gerontogenes age-1 and daf-2 determine
metabolic rate potential in aging Caenorhabditis elegans. FASEB journal : official
publication of the Federation of American Societies for Experimental Biology, 9(13),
pp.1355–61. Available at: http://www.ncbi.nlm.nih.gov/pubmed/7557026 [Accessed
May 19, 2017].
VanRheenen, S.M. et al., 1999. Sec34p, a protein required for vesicle tethering to the yeast
Golgi apparatus, is in a complex with Sec35p. The Journal of cell biology, 147(4),
pp.729–42. Available at: http://www.ncbi.nlm.nih.gov/pubmed/10562277 [Accessed
June 16, 2017].
VanRheenen, S.M. et al., 1998. Sec35p, a novel peripheral membrane protein, is required
for ER to Golgi vesicle docking. The Journal of cell biology, 141(5), pp.1107–19.
Available at: http://www.ncbi.nlm.nih.gov/pubmed/9606204 [Accessed June 16,
2017].
Vilboux, T. et al., 2013. A congenital neutrophil defect syndrome associated with
mutations in VPS45. N Engl J Med, 369(1), pp.54–65. Available at:
http://www.ncbi.nlm.nih.gov/pubmed/23738510.
Ward, E.S. et al., 2005. From Sorting Endosomes to Exocytosis: Association of Rab4 and
Rab11 GTPases with the Fc Receptor, FcRn, during Recycling. Molecular Biology of
the Cell, 16(4), pp.2028–2038. Available at:
http://www.molbiolcell.org/cgi/doi/10.1091/mbc.E04-08-0735 [Accessed May 23,

Anastasios Batas 2017 Chapter 7
253
2017].
Waring, D.A. et al., 1990. Selective silencing of cell communication influences
anteroposterior pattern formation in C. elegans. Cell, 60(1), pp.123–31. Available at:
http://www.ncbi.nlm.nih.gov/pubmed/2295086 [Accessed May 19, 2017].
Wartosch, L. et al., 2015. Recruitment of VPS33A to HOPS by VPS16 Is Required for
Lysosome Fusion with Endosomes and Autophagosomes. Traffic (Copenhagen,
Denmark), 16(7), pp.727–42. Available at:
http://www.ncbi.nlm.nih.gov/pubmed/25783203 [Accessed May 12, 2017].
Webb, G.C. et al., 1997. Genetic interactions between a pep7 mutation and the PEP12 and
VPS45 genes: evidence for a novel SNARE component in transport between the
Saccharomyces cerevisiae Golgi complex and endosome. Genetics, 147(2), pp.467–
78. Available at: http://europepmc.org/articles/PMC1208171/?report=abstract
[Accessed January 20, 2017].
Weimbs, T. et al., 1997. A conserved domain is present in different families of vesicular
fusion proteins: A new superfamily. Proceedings of the National Academy of
Sciences, 94(7), pp.3046–3051. Available at:
http://www.pnas.org/content/94/7/3046.abstract?ijkey=92d3e590273b91c8179f6c1ba
93910d6afb6f1a9&keytype2=tf_ipsecsha [Accessed February 5, 2017].
Wicks, S.R. et al., 2001. Rapid gene mapping in Caenorhabditis elegans using a high
density polymorphism map. Nature genetics, 28(2), pp.160–4. Available at:
http://dx.doi.org/10.1038/88878 [Accessed February 3, 2017].
Williams, B.D. et al., 1992. A genetic mapping system in Caenorhabditis elegans based on
polymorphic sequence-tagged sites. Genetics, 131(3), pp.609–24. Available at:
http://www.pubmedcentral.nih.gov/articlerender.fcgi?artid=1205034&tool=pmcentrez
&rendertype=abstract [Accessed February 7, 2017].
Wright, H.L. et al., 2010. Neutrophil function in inflammation and inflammatory diseases.
Rheumatology (Oxford, England), 49(9), pp.1618–31. Available at:
http://rheumatology.oxfordjournals.org/content/49/9/1618.full [Accessed September
11, 2016].
Xiao, R. et al., 2015. RNAi Interrogation of Dietary Modulation of Development,
Metabolism, Behavior, and Aging in C. elegans. Cell Reports, 11(7), pp.1123–1133.
Available at: http://www.ncbi.nlm.nih.gov/pubmed/25959815 [Accessed July 28,
2017].
Yamaguchi, T. et al., 2002. Sly1 Binds to Golgi and ER Syntaxins via a Conserved N-
Terminal Peptide Motif. Developmental Cell, 2(3), pp.295–305. Available at:
http://www.sciencedirect.com/science/article/pii/S1534580702001259 [Accessed May
20, 2017].
Yan, J. et al., 1998. Identification of mouse ULK1, a novel protein kinase structurally
related to C. elegans UNC-51. Biochemical and biophysical research
communications, 246(1), pp.222–7. Available at:
http://www.ncbi.nlm.nih.gov/pubmed/9600096 [Accessed January 16, 2017].
Yang, P. & Zhang, H., 2011. The coiled-coil domain protein EPG-8 plays an essential role
in the autophagy pathway in C. elegans. Autophagy, 7(2), pp.159–65. Available at:
http://www.ncbi.nlm.nih.gov/pubmed/21116129 [Accessed May 21, 2017].
Yen, W.-L. et al., 2007. Atg27 is required for autophagy-dependent cycling of Atg9.
Anastasios Batas 2017 Chapter 7
254
Molecular biology of the cell, 18(2), pp.581–93. Available at:
http://www.ncbi.nlm.nih.gov/pubmed/17135291 [Accessed May 20, 2017].
Yen, W.L. et al., 2010. The conserved oligomeric Golgi complex is involved in double-
membrane vesicle formation during autophagy. J Cell Biol, 188(1), pp.101–114.
Available at: http://www.ncbi.nlm.nih.gov/pubmed/20065092.
Yochem, J. et al., 1999. A gp330/megalin-related protein is required in the major epidermis
of Caenorhabditis elegans for completion of molting. Development (Cambridge,
England), 126(3), pp.597–606. Available at:
http://www.ncbi.nlm.nih.gov/pubmed/9876188 [Accessed January 24, 2017].
Yorimitsu, T. & Klionsky, D.J., 2005. Atg11 Links Cargo to the Vesicle-forming
Machinery in the Cytoplasm to Vacuole Targeting Pathway. Molecular Biology of the
Cell, 16, pp.1593–1605. Available at:
http://www.molbiolcell.org/content/16/4/1593.full.pdf [Accessed May 21, 2017].
Young, A.R.J. et al., 2006. Starvation and ULK1-dependent cycling of mammalian Atg9
between the TGN and endosomes. Journal of Cell Science, 119(18). Available at:
http://jcs.biologists.org/content/119/18/3888.short [Accessed May 21, 2017].
Yu, Z.-Q. et al., 2012. Dual roles of Atg8−PE deconjugation by Atg4 in autophagy.
Autophagy, 8(6), pp.883–892. Available at:
http://www.ncbi.nlm.nih.gov/pubmed/22652539 [Accessed May 21, 2017].
Zarkower, D., 2006. Somatic sex determination. WormBook : the online review of C.
elegans biology, pp.1–12. Available at:
http://www.wormbook.org/chapters/www_somaticsexdeterm/somaticsexdeterm.html
[Accessed January 20, 2017].
Zerial, M. et al., 1999. The Rab5 effector EEA1 is a core component of endosome docking.
Nature, 397(6720), pp.621–625. Available at:
http://www.ncbi.nlm.nih.gov/pubmed/10050856 [Accessed August 24, 2017].
Zhang, B. et al., 2015. Environmental Temperature Differentially Modulates C. elegans
Longevity through a Thermosensitive TRP Channel. Cell Reports, 11(9), pp.1414–
1424. Available at: http://www.cell.com/cell-reports/pdf/S2211-1247(15)00498-2.pdf
[Accessed April 19, 2017].
Zhu, D. et al., 2015. Munc18c mediates exocytosis of pre-docked and newcomer insulin
granules underlying biphasic glucose stimulated insulin secretion in human pancreatic
beta-cells. Molecular Metabolism, 4(5), pp.418–426. Available at:
http://www.ncbi.nlm.nih.gov/pubmed/25973389 [Accessed May 12, 2017].
Zolov, S.N. & Lupashin, V. V, 2005. Cog3p depletion blocks vesicle-mediated Golgi
retrograde trafficking in HeLa cells. The Journal of cell biology, 168(5), pp.747–59.
Available at: http://www.ncbi.nlm.nih.gov/pubmed/15728195 [Accessed June 16,
2017].

Anastasios Batas 2017 Chapter 7
255
Appendices

Anastasios Batas 2017 Chapter 7
256
0 5 1 0 1 5
0
2 0
4 0
6 0
8 0
1 0 0
T im e (h )
% l
eth
arg
is a
nim
als
N2
IA 7 5 7
C B 3 6 9
0 5 1 0 1 5
0
2 0
4 0
6 0
8 0
1 0 0
T im e (h )
% l
eth
arg
is a
nim
als
N2
IA 7 5 7
C B 3 6 9
0 5 1 0 1 5
0
2 0
4 0
6 0
8 0
T im e (h )
% l
eth
arg
is a
nim
als
N2
IA 7 5 7
C B 3 6 9
Appendix 1: Molting profiles of wild type (N2), vps-45 (tm246) (IA757), unc-51 (e369) (CB369) strains
during the L1-L2 molt at 15°C.
Three individual experiments are shown (A-C).
A)
B)
C)

Anastasios Batas 2017 Chapter 7
257
0 5 1 0 1 5
0
2 0
4 0
6 0
8 0
1 0 0
T im e (h )
% l
eth
arg
is a
nim
als
N2
IA 7 5 7
IA 7 7 3
0 5 1 0 1 5
0
2 0
4 0
6 0
8 0
1 0 0
T im e (h )
% l
eth
arg
is a
nim
als
N2
IA 7 5 7
IA 7 7 3
0 5 1 0 1 5
0
2 0
4 0
6 0
8 0
1 0 0
T im e (h )
Tim
e (
h)
N2
IA 7 5 7
IA 7 7 3
Appendix 2: Molting profiles of adult wild type (N2), vps-45 (tm246) strain (IA757), svp (ij117) strain
(IA773) during the L1-L2 molt at 15°C.
Three individual experiments are shown (A-C). Both IA757 and IA773 populations start molting at 1-2 hours
later than the wild type stain.
A)
B)
C)

Anastasios Batas 2017 Chapter 7
258
N2
IA757
CB
369
IA773
0
2 0
4 0
6 0
8 0
L 2 a n im a ls a f te r 7 2 h o u rs (1 5 °C )
S tra in
Av
era
ge
po
pu
lati
on
(%
)
N2
IA757
CB
369
IA773
0
5 0
1 0 0
1 5 0
L 3 a n im a ls a f te r 7 2 h o u rs (1 5 °C )
S tra in
Av
era
ge
po
pu
lati
on
(%
)
N2
IA757
CB
369
IA773
0
5 0
1 0 0
1 5 0
L 4 a n im a ls a f te r 7 2 h o u rs (1 5 °C )
S tra in
Av
era
ge
po
pu
lati
on
(%
)
Appendix 3: Average percentage of animals at a specific developmental stage for each strain after 72
hours of culturing at 15°C. Average of three experiments for each strain is shown. A) Percentage of animals
at the L2 stage (± SD). Tukey’s multiple comparison test N2 vs IA757, P=0.9998. N2 vs CB369, P<0.0001.
IA757 vs CB369, P<0.0001. N2 vs IA773, P=0.9999. IA757 vs IA773, P=0.9987. B) Percentage of animals
at the L3 stage (± SD). Tukey’s multiple comparison test N2 vs IA757, P<0.0001. N2 vs CB369, P=0.0066.
IA757 vs CB369, P<0.0001. N2 vs IA773, P<0.0001. IA757 vs IA773, P=0.6718. C) Percentage of animals
at the L4 stage (± SD). Tukey’s multiple comparison test N2 vs IA757, P<0.0001. N2 vs CB369, P<0.0001.
IA757 vs CB369, P=0.0208. N2 vs IA773, P<0.0001. IA757 vs IA773, P=0.0784.
B) A)
C)

Anastasios Batas 2017 Chapter 7
259
Appendix 4: 40 homozygotic lines for the vps-45(tm246) after cross with the Hawaiian strain verified by PCR. Verification of the suppression for the molting death by survival at
25°C.
27 28 29 30 31 32 33 34 35 36 37 38 39 40
200 bp -
500 bp -
1000 bp -
1 2 3 4 5 6 7 8 9 10 11 12 13 14 15 16 17 18 19 20 21 22 23 24 25 26 N2 IA757
200 bp -
500 bp -
1000 bp -

Anastasios Batas 2017 Chapter 7
260
Appendix 5: Genomic isolates of the 40 suppressed lines for the vps-45 (tm246) molting death at 25°C, after treatment with RNAse.
Isolates generated for full genome sequencing. Ladder was loaded at 10 μl and 5 μl. The 500 bp band from the ladder was used as the control for the quantification of the rest of the
samples, the band has 97 ng of DNA.
1.517 bp
1 2 3 4 5 6 7 8 9 10 11 12 13 14 15 16 17 18 19 20 21 22 23 24 25 26 27 28
500 bp -
29 30 31 32 33 34 35 36 37 38 39 40
1.517 bp
500 bp -

Anastasios Batas 2017 Chapter 7
261
Column 1
Column 2
SAMPLE ng/μl volume for final mix (μl) SAMPLE ng/μl volume for final mix (μl)
1 2.987747408 33.47003155 11 7.587182 13.18012422
2 4.458058435 22.43128964 12 7.832234 12.7677497
3 4.79736098 20.84479371 13 8.341188 11.98870056
4 5.34401508 18.71252205 14 11.32893 8.826955075
5 7.295004713 13.70801034 15 8.774741 11.39634801
6 6.889726673 14.51436389 16 7.615457 13.13118812
7 6.738925542 14.83916084 17 8.62394 11.59562842
8 11.27272727 8.870967742 18 9.245994 10.81549439
9 8.934967012 11.19198312 19 8.086711 12.36596737
10 7.747408106 12.90754258 20 7.210179 13.86928105
Total volume(μl) 171.4906654 119.9374369

Anastasios Batas 2017 Chapter 7
262
Appendix 6: Table showing the concentration of each sample from the 40 sequencing lines genomic isolates, as it was quantified from the gel pictures.
Samples were mixed together in 4 tubes (10 samples per tube) with 100 ng/μl final concentration for each sample. The mix from each tube was passed through a DNA cleaning column to
remove the RNAse enzyme.
Column 3
Column 4
SAMPLE ng/μl volume for final mix (μl) SAMPLE ng/μl volume for final mix (μl)
21 6.918002 14.45504087 31 3.426966 29.18032787
22 6.908577 14.47476126 32 3.445693 29.02173913
23 6.757776 14.79776848 33 2.84176 35.18945634
24 6.823751 14.65469613 34 3.03839 32.91217257
25 6.993402 14.29919137 35 3.77809 26.46840149
26 5.777568 17.30831974 36 6.208178 16.10778443
27 4.542884 22.01244813 37 2.570225 38.90710383
28 3.025448 33.0529595 38 2.275281 43.95061728
29 3.426966 29.18032787 39 1.348315 74.16666667
30 2.827715 35.36423841 40 0.828652 120.6779661
209.5997518 446.5822357
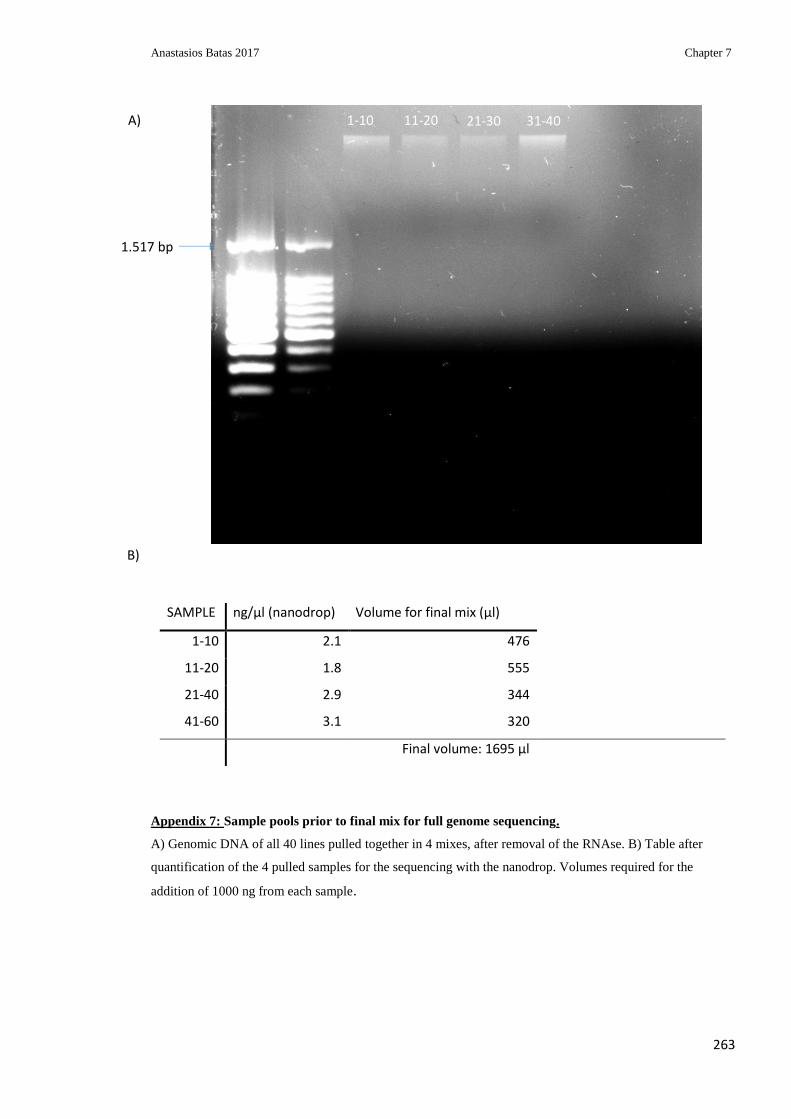
Anastasios Batas 2017 Chapter 7
263
Appendix 7: Sample pools prior to final mix for full genome sequencing.
A) Genomic DNA of all 40 lines pulled together in 4 mixes, after removal of the RNAse. B) Table after
quantification of the 4 pulled samples for the sequencing with the nanodrop. Volumes required for the
addition of 1000 ng from each sample.
SAMPLE ng/μl (nanodrop) Volume for final mix (μl)
1-10 2.1 476
11-20 1.8 555
21-40 2.9 344
41-60 3.1 320
Final volume: 1695 μl
1.517 bp
1-10 11-20 21-30 31-40 A)
B)

Anastasios Batas 2017 Chapter 7
264
Appendix 8: Genomic isolates of the 35 suppressed lines for the vps-45 (tm246) molting death at 25°C excluding the five slow growing lines, after treatment with RNAse.
Isolates generated for the second round of full genome sequencing. Ladder was loaded at 10 μl. The 500 bp band from the ladder was used as the control for the quantification of the rest of
the samples, the band has 97 ng of DNA.
1.517 bp
1 2 3 4 5 6 7 8 9 10 11 12 13 14 15 16 17 18 19
20 21 22 24 25 26 27 28 30 31 32 33 34 36 37 40
500 bp
500 bp
1.517 bp

Anastasios Batas 2017 Chapter 7
265
Column C
Column D
SAMPLE ng/μl volume for final mix SAMPLE ng/μl volume for final mix
15 20.3086738 14.77201332 22 24.04400816 12.47712103
16 30.57985707 9.810379405 24 32.07471967 9.353160467
17 18.2422537 16.44533646 25 30.43289921 9.857752885
18 22.57470775 13.28920859 26 24.21954235 12.38669153
19 18.40736202 16.29782691 27 30.84353186 9.72651256
20 48.69255906 6.161105635 28 29.47836997 10.17695349
21 25.5539895 11.73984986 30 27.20854129 11.02594942
88.51572018 75.00414138
Column A
Column B
SAMPLE ng/μl volume for final mix SAMPLE ng/μl volume for final mix
1 21.39937373 14.01910186 8 29.38898 10.2079084
2 29.35723362 10.21894651 9 26.61252 11.27289073
3 16.12266202 18.60734906 10 21.86167 13.72264744
4 23.72794994 12.6433173 11 31.39324 9.556198699
5 21.32526165 14.0678227 12 29.5149 10.16435637
6 32.76058557 9.157345473 13 25.21992 11.89536046
7 20.61645979 14.55147989 14 24.19593 12.39877711
Total
volume(μl) 93.2653628 79.21813921

Anastasios Batas 2017 Chapter 7
266
Column E
SAMPLE ng/μl volume for final mix
31 29.66812027 10.11186409
32 25.76589628 11.64329767
33 29.72941141 10.09101714
34 26.64130776 11.26070847
36 31.34359506 9.571333456
37 28.64796542 10.47194785
40 28.63165125 10.47791472
73.6280834
Appendix 9: Table showing the concentration of each sample from the genomic isolates, as it was
quantified from the gel pictures for the second round for full genome sequencing.
Samples were mixed together in 5 tubes (7 samples per tube) with 100 ng/μl final concentration for each
sample. The mix from each tube was passed through a DNA cleaning column to remove the RNAse enzyme.

Anastasios Batas 2017 Chapter 7
267
Appendix 10: Sample pools prior to final mix for the second round of full genome sequencing.
A) Genomic DNA of all 35 ‘fast growing’ lines pulled together in 5 cleaning mixes, after removal of the
RNAse. B) Table after quantification of the 5 pulled samples for the sequencing with the nanodrop. Volumes
required to achieve 200ng of DNA per sample.
SAMPLE ng/μl (nanodrop) Volume for final mix (μl)
A (1-7) 10.1 19.8
B (8-14) 8.3 24
C (15-21) 8.1 24
D (22-28, 30) 7.3 27
E (31-34, 36,3,40) 6.7 30
Final volume:124.8 μl
A B C D E A)
B)
500 bp
1.517 bp
1.000 bp
![Anastasios Taliotis: Un. Of Crete, CCTP Elias Kiritsis and Anastasios Taliotis Arxiv:[1111.1931]](https://img.pdfslide.us/doc/110x75/5697bfdc1a28abf838cb11db/anastasios-taliotis-un-of-crete-cctp-elias-kiritsis-and-anastasios-taliotis.jpg)