Embed Size (px)
Citation preview
Basis of reporting 2018
Contents
annualreview2018.arcelormittal.com
Climate Action Report(coming soon)
Integrated Annual Review
Reporting Index(coming soon)
Fact Book Annual Report 20F
01 Basis of Reporting: Guidelines for ArcelorMittal sustainable development indicators
02 Reporting methodology by indicator
02 – Outcome 1
05 – Outcome 4
06 – Outcome 5
09 – Outcome 6
13 – Outcome 7
13 – Outcome 9
14 – Outcome 10
15 – Transparent good governance
16 APPENDIX 1: CO
2 and Energy footprint
default values
ARCELORMITTAL INTEGRATED ANNUAL REVIEW 2018

Basis of ReportingGuidelines for ArcelorMittal sustainable development indicators
This document sets out the main principles and methodologies used by ArcelorMittal in reporting data relating to our corporate responsibility and sustainability performance in the report’s data table.
We provide guidelines for our operations to help them understand how to report this data both for internal reporting and consolidation at group level, and for their own local sustainability reporting.
We seek to follow best practice in reporting. We draw on the guidelines of the Global Reporting Initiative as well as industry guidelines from the World Steel Association (worldsteel).
Scope of reporting criteria
We report on our performance against those indicators that best communicate the most material aspects of our sustainability performance at the level where it is most meaningful to report – global or local – as outlined in our Reporting Index.
Scope and boundary-setting
The Integrated Annual Review covers ArcelorMittal and its significant operating subsidiaries, excluding joint ventures and associates where we do not have operating control – where we do have operating control of a JV our headcount includes full time employees. A list of our significant operating subsidiaries, joint ventures and associates can be found in ArcelorMittal’s Form 20F.
All data is reported for the period 1st January to 31st December.
All financial figures refer to United States Dollars ($) unless stated otherwise. All other currencies have been converted to $ using an average exchange rate for the year, as used in preparing our Form 20F.
Health, safety and environmental data is specific to our steel or mining operations as indicated, except where it is clearly combined. For health & safety it covers occurrences among both our employees and contractors.
Other data, unless otherwise stated in this basis of reporting document, covers both our steel and mining operations. The boundary of operations that such data covers is broader for health and safety data than environmental data. The latter covers only major industrial operations, since we believe this is where our material impacts lie. More details on the boundary for each outcome are provided in this document and our Reporting Index.
Restating data
Each year the environmental data we publish is provisional with the best available data at the time of publication. We restate previous year’s data each following year after a full review of our data is complete.
1 ARCELORMITTAL BASIS OF REPORTING 2018

Outcome 1:
Safe, healthy, quality working lives for our people
Safety indicators scope and boundary
Scope includes all companies within the ArcelorMittal Group and permanent or temporary employees, as well as contractors (direct or indirect) who perform work on ArcelorMittal sites.
Almost all operational sites are included within the perimeter for health and safety data. In 2018 there were the following exceptions: London office; Paris-St Denis office (together these comprise some 250 employees).
Any acquisitions or divestments are included within the scope of reporting from/until the date of the transaction.
Temporary employment: Employees hired on a temporary basis by the company are included in all health and safety statistics. Temporary employment may include: contracts limited in time, temporary jobs, holiday jobs, student jobs or traineeships.
Contractor: ArcelorMittal considers contractors to be all companies contracted (directly or indirectly) by ArcelorMittal to perform work on a site where ArcelorMittal has operating control. This definition includes the personnel of a service provider, subcontractors, etc, whether with a permanent or temporary employment. This also includes transport of incoming and outgoing products as far as ArcelorMittal has a direct or indirect contract with the transporting company (i.e. loading, unloading and transport on ArcelorMittal sites).
Reporting methodology by indicator
Indicator Definition Unit
Fatalities A death caused by work that occurs on company property or while travelling on company business. This also includes contractors on our site or when transporting our goods (when a service contract with ArcelorMittal exists), that results in a fatality. If as a result of an official enquiry or medical investigation the cause of death is declared as not work-related the figure will not be included in our reporting.
An incident that occurs while travelling to or from the normal place of work is not to be included in the statistics. An incident that occurs while travelling on company business is to be included in the statistics, wherever this is happening and thus covers all the time from leaving home or normal working place, wherever the business trip is starting, until returning home or to the normal place of work, unless due to specific activities that are not linked to the business trip.
Number of people
This data at site and group level is assured by DNV GL.
2 ARCELORMITTAL BASIS OF REPORTING 2018

Indicator Definition Unit
Lost time injury rate Fatalities + number of Injuries with lost time
person hours workedx106
Figures reported express the frequency of injuries per million hours worked.
A work-related injury is one that results in the loss of at least one full working day (beyond the date of the injury) and is measured from the first day after the event.
Any absence, beyond the day of the injury occurring or the consequence of the incident, is automatically a lost-time injury. This is independent of medical advice to stay at home or do adapted work – the reality is to be used for reporting.
The injury must be caused by a sudden, single instantaneous event, caused by the work and not the result of any pre-existing underlying medical conditions with a history of like symptoms – this is to be determined only by medical professional.
An incident with lost time which spans over several months is only counted once, in the month of start of the absence. In case of a lost time injury which spans over a longer period, there is no limit to the number of absence days to be counted.
An incident that occurs while travelling to or from the normal place of work is not to be included in the statistics. An incident that occurs while travelling on company business is to be included in the statistics, wherever this is happening and thus covers all the time from leaving home or normal working place, wherever the business trip is starting, until returning home or to the normal place of work, unless due to specific activities that are not linked to the business trip.
Worked hours are calculated based on the number of actual hours worked or scheduled hours to be worked. The hours actually worked and those regarded as such include the time spent for training or other work required activities, but does not take into account holidays or other days off.
Methodologies for calculating hours worked may differ for employees and contractors.
Per million hours worked
This data at site and group level is assured by DNV GL.
Proactive potential serious injuries and fatalities (proactive PSIFs)
Potential serious occurrences that were reported proactively that could have resulted in a permanent disability or a fatality. This is a leading indicator, and should be differentiated from those serious occurrences that were reported reactively ie after the accident took place. The higher the number, the more likely fatalities will be avoided.
Number
Accident severity rate number of days lost for injury
person hours workedx103
Figures reported express the rate of accident severity per thousand hours worked. Injuries are defined as for lost time injuries above Worked hours are calculated as for lost time injury.
Days per thousand hours worked
Industrial operations certified to OHSAS 18001
Sites which, through audit by an external certified body, have been granted the OHSAS 18001:2007 certificate from that certified body. All active sites except London and St Denis, Paris (447) report figures on a monthly basis. This data is recorded and extracted from the databases H&S Cube (MD4BI) / REX server. OHSAS data was last fully recorded/validated in 2011-2012, through individual correspondence with each site. This validation has been taking place during the latter part of 2018 and continuing during 2019.
%
This data at site and group level is assured by DNV GL.
3 ARCELORMITTAL BASIS OF REPORTING 2018

Reporting methodology by indicator
Indicator Definition Unit
Employees covered by collective bargaining agreements
Percentage of employees, being exempts or non-exempts covered by a Collective Labour Agreement (CLA).
%
Number of strikes exceeding 1 week in duration
A strike is defined as a work stoppage caused by mass refusal of employees to perform work, in response to a labour dispute
Number
Training hours per employee The number of full time employee training hours divided by the number of employees. Previously we reported the number of full-time employee training hours at the ArcelorMittal University only, excluding all training provided at site level. The new indicator reports the number of training hours per employee. This figure is derived from the total number of hours spent on training initiatives occurring across the whole group divided by the total number of employees at those sites from which data has been consolidated. It includes ArcelorMittal University, online, on the job, onsite and external training programmes. This number excludes subcontractors and apprentices. It includes health and safety, leadership and management, induction, language, compliance, vocational, technical and functional training. Other training types are additionally specified.
Hours
Women in management positions (manager & above positions)
Percentage of Managers and above positions with women incumbent
No. female incumbents in manager positions
Total no of incumbents in manager positionsx100
%
This data at site and group level is assured by DNV GL.
Manager turnover rate Percentage of Managers and above people who have left the company on a voluntary basis during the year
Managers who left on a voluntary basis
Average management population during the yearx100
%
Women recruited (exempt population)
Percentage of women recruited in exempt and above population during the year. Exempts and above include: Exempts, Managers, General Managers, Vice Presidents and Executive Vice Presidents.
No. of female exempts and above recruited
Total No. of exempts and above recruitedx100
Exempt employees are monthly salaried employees, paid an agreed amount for the whole job, not eligible for overtime regardless the amount of time or efforts required to complete the work.
Employees having their working time measured through clock machine or equivalent system are not exempts.
%
This data at site and group level is assured by DNV GL.
Women on key positions succession plans (general managers and above positions)
Definition: Percentage of women amongst all potential successors of General Managers and above positions.
No. of female candidates on General Managers and above succession plans
total No. of candidates on General Managers and above succession plans
x100
%
This data at site and group level is assured by DNV GL.
4 ARCELORMITTAL BASIS OF REPORTING 2018
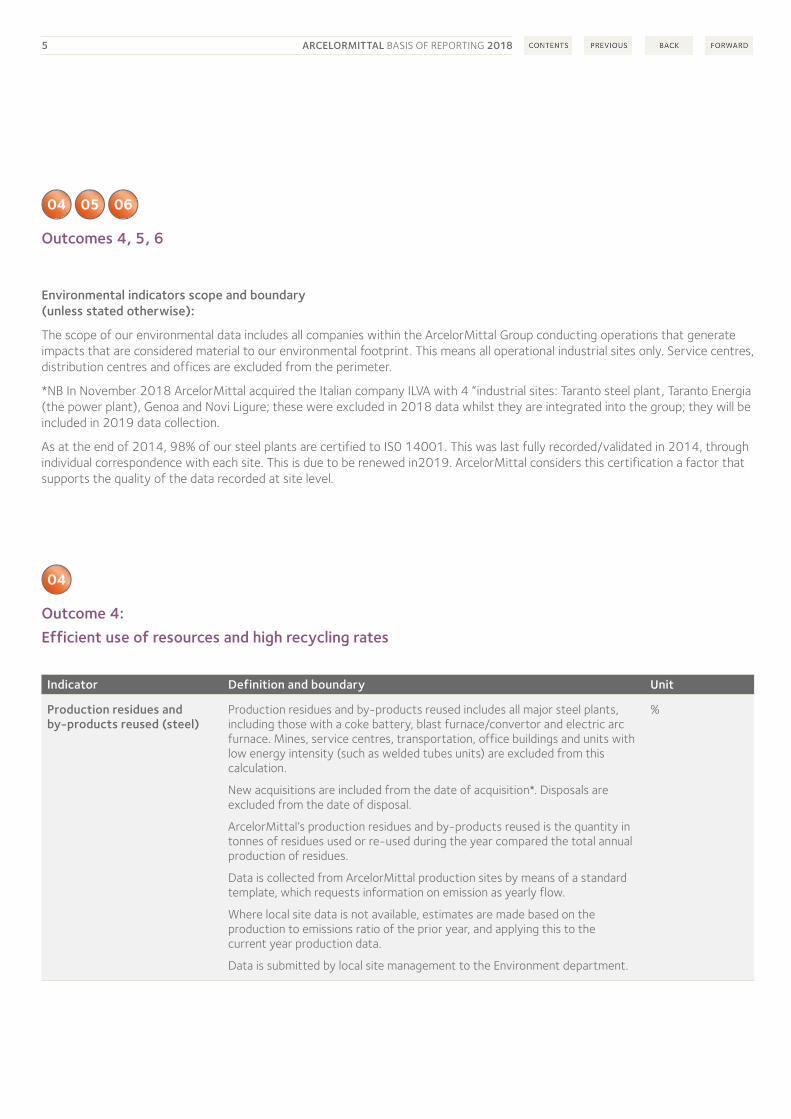
Outcomes 4, 5, 6
Environmental indicators scope and boundary (unless stated otherwise):
The scope of our environmental data includes all companies within the ArcelorMittal Group conducting operations that generate impacts that are considered material to our environmental footprint. This means all operational industrial sites only. Service centres, distribution centres and offices are excluded from the perimeter.
*NB In November 2018 ArcelorMittal acquired the Italian company ILVA with 4 “industrial sites: Taranto steel plant, Taranto Energia (the power plant), Genoa and Novi Ligure; these were excluded in 2018 data whilst they are integrated into the group; they will be included in 2019 data collection.
As at the end of 2014, 98% of our steel plants are certified to IS0 14001. This was last fully recorded/validated in 2014, through individual correspondence with each site. This is due to be renewed in2019. ArcelorMittal considers this certification a factor that supports the quality of the data recorded at site level.
Outcome 4:
Efficient use of resources and high recycling rates
Indicator Definition and boundary Unit
Production residues and by-products reused (steel)
Production residues and by-products reused includes all major steel plants, including those with a coke battery, blast furnace/convertor and electric arc furnace. Mines, service centres, transportation, office buildings and units with low energy intensity (such as welded tubes units) are excluded from this calculation.
New acquisitions are included from the date of acquisition*. Disposals are excluded from the date of disposal.
ArcelorMittal’s production residues and by-products reused is the quantity in tonnes of residues used or re-used during the year compared the total annual production of residues.
Data is collected from ArcelorMittal production sites by means of a standard template, which requests information on emission as yearly flow.
Where local site data is not available, estimates are made based on the production to emissions ratio of the prior year, and applying this to the current year production data.
Data is submitted by local site management to the Environment department.
%
5 ARCELORMITTAL BASIS OF REPORTING 2018

Reporting methodology by indicator
Indicator Definition and boundary Unit
Production residues and by-products reused (mining)
Production residues and by-products reused includes all our mining operations, including beneficiation plants, pellets and boilers and power plants.
New acquisitions are included from the date of acquisition. Disposals are excluded from the date of disposal.
ArcelorMittal’s production residues and by-products reused is the quantity in tonnes of residues re- used at site level and externally compared the production of the year of residues.
Data is collected from ArcelorMittal production sites by means of a standard template, which requests information on emission as yearly flow.
Where local site data is not available, estimates are made based on the production to emissions ratio of the prior year, and applying this to the current year production data.
Data is submitted by local site management to the Environment department.
%
Slag to cement industry Blast furnace slag is used by the cement industry in place of clinker. This averts the emission of 766kg CO
2 per tonne of steel from the production
process of clinker. The data is collected from the by-product sales team and their sales data system.
Source: Annex 1, the “(EU) COMMISSION DECISION of 27 April 2011 determining transitional Union- wide rules for harmonised free allocation of emission allowances
pursuant to Article 10a of Directive 2003/87/EC of the European Parliament and of the Council (notified under document C(2011) 2772) (2011/278/EU).
http://eur-lex.europa.eu/legal-content/EN/ALL/?uri=CELEX:32011D0278
Tonnes (of BF slag)
Outcome 5:
Trusted user of air, land and water
Note: Data coverage is not always 100% of steel producing sites because some sites may not provide data. In this case we divide total emission by the production of the sites that have provided data; therefore it is in ‘xx’ per ton of crude steel of ‘responding’ sites.
Indicator Definition and boundary Unit
Environmental expenditure Any investment in environmental improvements, such as water treatment facilities, de-dusting equipment and technology upgrades. This excludes environmental operating expenditures that are incurred as a result of maintenance. Energy capex projects are reported separately under outcome 6.
USD (million)
6 ARCELORMITTAL BASIS OF REPORTING 2018

Indicator Definition and boundary Unit
Dust (steel) The dust emission includes all major steel plants, including those with a coke battery, blast furnace/convertor and electric arc furnace. Mines, service centres, transportation, office buildings and units with low energy intensity (such as welded tubes units) are excluded from this calculation.
New acquisitions are included from the date of acquisition*. Disposals are excluded from the date of disposal.
ArcelorMittal’s dust emission (steel) include all emissions of ducted dust (i.e. from stacks and chimneys).
Data is collected from ArcelorMittal production sites by means of a standard template, which requests information on emission as yearly flow process by process and cover the whole site.
Where local site data is not available, estimates are made based on the production to emissions ratio of the prior year, and applying this to the current year production data.
Data is submitted by local site management to the Environment department.
kg per tonne of crude steel produced
Dust (mining) The dust emission includes all our mining operations including beneficiation plants, pellets and boilers and power plants. New acquisitions are included from the date of acquisition. Disposals are excluded from the date of disposal.
ArcelorMittal’s dust emission (mining) include all emissions of ducted dust (i.e. from stacks and chimneys).
Data is collected from ArcelorMittal mine sites by means of a standard template, which requests information on emission as yearly flow process by process and cover the whole site.
Where local site data is not available, estimates are made based on the production to emissions ratio of the prior year, and applying this to the current year production data.
Data is submitted by local site management to the Environment department.
Tonnes
SOx (steel) SOx emissions data includes all major steel plants, including those with a coke battery, blast furnace/convertor and electric arc furnace. Mines, service centres, transportation, office buildings and units with low energy intensity (such as welded tubes units) are excluded from this calculation.
New acquisitions are included from the date of acquisition*. Disposals are excluded from the date of disposal.
ArcelorMittal’s SOx emissions (steel) include all emissions of ducted SOx (i.e. from stacks and chimneys). SOx or sulfur oxide refers to many types of sulfur and oxygen containing compounds such as, SO
2, SO
3, etc
Data is collected from ArcelorMittal production sites by means of a standard template, which requests information on emission as yearly flow process by process and cover the whole site.
Where local site data is not available, estimates are made based on the production to emissions ratio of the prior year, and applying this to the current year production data. Data is submitted by local site management to the Environment department.
kg per tonne of crude steel produced
* NB In November 2018 ArcelorMittal acquired the Italian company ILVA with 4 “industrial sites: Taranto steel plant, Taranto Energia (the power plant), Genoa and Novi Ligure; these were excluded in 2018 data whilst they are integrated into the group; they will be included in 2019 data collection.
7 ARCELORMITTAL BASIS OF REPORTING 2018

Reporting methodology by indicator
Indicator Definition and boundary Unit
SOx (mining) The dust emission includes all our mining operations including beneficiation plants, pellets and boilers and power plants. New acquisitions are included from the date of acquisition. Disposals are excluded from the date of disposal.
SOx or sulfur oxide refers to many types of sulfur and oxygen containing compounds such as, SO
2, SO
3, etc. ArcelorMittal’s SOx emissions (mining)
include all ducted emissions (i.e. from stacks and chimneys).
Data is collected from ArcelorMittal mine sites by means of a standard template, which requests information on emission as yearly flow process by process and cover the whole site.
Where local site data is not available, estimates are made based on the production to emissions ratio of the prior year, and applying this to the current year production data.
Data is submitted by local site management to the Environment department.
Tonnes
NOx (steel) NOx emissions data includes all major steel plants, including those with a coke battery, blast furnace/convertor and electric arc furnace. Mines, service centres, transportation, office buildings and units with low energy intensity (such as welded tubes units) are excluded from this calculation.
New acquisitions are included from the date of acquisition*. Disposals are excluded from the date of disposal.
ArcelorMittal’s NOx emissions (steel) include all ducted emissions (i.e. from stacks and chimneys). NOx is a generic term for mono-nitrogen oxides NO and NO
2 (nitric oxide and nitrogen dioxide).
Data is collected from ArcelorMittal production sites by means of a standard template, which requests information on emission as yearly flow process by process and cover the whole site.
Where local site data is not available, estimates are made based on the production to emissions ratio of the prior year, and applying this to the current year production data.
Data is submitted by local site management to the Environment department.
kg per tonne of crude steel produced
NOx (mining) The dust emission includes all our mining operations including beneficiation plants, pellets and boilers and power plants. New acquisitions are included from the date of acquisition. Disposals are excluded from the date of disposal.
NOx is a generic term for mono-nitrogen oxides NO and NO2 (nitric oxide and
nitrogen dioxide).
ArcelorMittal’s NOx emissions (mining) include all ducted emissions (i.e. from stacks and chimneys).
Data is collected from ArcelorMittal mine sites by means of a standard template, which requests information on emission as yearly flow process by process and cover the whole site.
Where local site data is not available, estimates are made based on the production to emissions ratio of the prior year, and applying this to the current year production data.
Data is submitted by local site management to the Environment department.
Tonnes
* NB In November 2018 ArcelorMittal acquired the Italian company ILVA with 4 “industrial sites: Taranto steel plant, Taranto Energia (the power plant), Genoa and Novi Ligure; these were excluded in 2018 data whilst they are integrated into the group; they will be included in 2019 data collection.
8 ARCELORMITTAL BASIS OF REPORTING 2018

Outcome 6:
Responsible energy user that helps create a lower carbon future
Indicator Definition and boundary Unit
Energy capital expenditure All capital investments aimed at energy improvements. This excludes energy operating expenditures. This is reported separately to environmental investments to improve air, land and water outcomes, reported in outcome 5.
USD (million)
Primary Energy consumption (steel only)
The primary energy consumption or energy footprint calculation includes all major steel plants, including those with a coke battery, blast furnace/convertor and electric arc furnace. Mines, service centres, transportation, office buildings and units with low energy intensity (such as welded tubes units) are excluded from this calculation.
New acquisitions are included from the date of acquisition*. Disposals are excluded from the date of disposal.
ArcelorMittal’s primary energy consumption (or “energy footprint”) = energy from fuels + equivalent energy for pre-processed flows (electricity, industrial gas pellets and burnt fluxes).
Data is collected from ArcelorMittal production sites by means of a standard template, which requests information on material use, energy and utility flows at the site level. Site level data is obtained from procurement, delivery and inventory information. This data is used to calculate net use, and converted to energy with standard factors from energy contents or equivalent energy value for pre-processed flows (electricity, steam, hot water, compressed air, industrial gases, pellets and burnt fluxes). These standard factors are preferably measured or otherwise derived from standard values from ArcelorMittal’s experience.
The data is collated at group level and verified by the Environment department.
Where local site data is not available, estimates are made based on the production to emissions ratio of the prior year, and applying this to the current year production data.
Reporting method:
The net use of materials and energies at site level (procurements – deliveries – inventory change) associated with net calorific values or equivalent energy value for pre-processed flows (electricity, steam, hot water, compressed air, industrial gases, pellets and burnt fluxes) gives an estimate of the energy impact of the Group. In particular:
• Energy from fuels (condensed and gases) is accounted with their net calorific value, also named lower heating value (LHV) or lower calorific value (LCV).
• Electricity is accounted with a standard equivalent energy, taking into account power plant efficiency and not only unit conversion from MWh to GJ.
• Steam and hot water are accounted with a standard equivalent energy based on ArcelorMittal experience.
• Energy from pellet is accounted with a standard value based on IISI study on “Energy use in the steel industry”.
• Energy for industrial gas and burnt fluxes is accounted with standard values based on ArcelorMittal experience.
Gigajoules (GJ) and GJ / tonnes crude steel for specific energy consumption
This data at site and group level is assured by DNV GL.
9 ARCELORMITTAL BASIS OF REPORTING 2018

Reporting methodology by indicator
Indicator Definition and boundary Unit
Total CO2 emissions (steel) Those business units of material significance within our operational control. New acquisitions are included from the date of acquisition*. Disposals are excluded from the date of disposal. Joint ventures and subsidiaries are included only where they fall within our operational control.
For CO2e (steel), this includes all steel plants with a significant CO
2e impact,
including those with a coke battery, blast furnace/convertor, electric arc furnace. Business units with low energy intensity (such as welded tubes units) as well as service centres, office buildings and transportation are excluded from the boundary of calculation.
Description of significant CO2e emissions during steelmaking process: An integrated steel mill has all the functions for primary steel production: iron making (conversion of ore to liquid iron), steelmaking (conversion of pig iron to liquid steel), casting (solidification of the liquid steel) and product rolling (finished shapes). Waste gases are produced mainly by the coke plant, blast furnace and basic oxygen furnace and contribute to the heat balance of the site.
The only material greenhouse gas thus emitted is CO2. Therefore all
references to CO2e (steel) refer in practice to CO
2.
These waste gases burnt internally (reused within the site); flared or burnt in a power plant (internal or external) to produce electricity or, where this is not possible, they must be flared. Since these gases must be emitted within a short time (some minutes) after production, the decision on how they are emitted is driven entirely by the level of activity of the steel plant. We therefore consider the emissions from our waste gases to always be within our operational control. We differentiate as follows:
‘Direct emissions’ are the actual emissions coming out of the chimneys of the sites. This data is based on a carbon balance at site level.
‘Process emissions’ are the aggregate of direct emissions + emissions resulting from the combustion of exported waste gas used in the power plant to generate electricity.
Operational boundary: we report on Scope 1, Scope 2 and Scope 3 of the GHG Protocol as follows:
ArcelorMittal’s total CO2e emissions (or “CO
2e footprint”) is made up of the
following categories:
• Scope 1 (all ArcelorMittal process emissions, as defined above)
• Scope 2 (indirect emissions from ‘net’ purchased electricity as defined below)
• Scope 3 (other indirect emissions as defined below).
Million tonnes CO
2e; tonnes
CO2e/tonne
crude steel
* NB In November 2018 ArcelorMittal acquired the Italian company ILVA with 4 “industrial sites: Taranto steel plant, Taranto Energia (the power plant), Genoa and Novi Ligure; these were excluded in 2018 data whilst they are integrated into the group; they will be included in 2019 data collection.
10 ARCELORMITTAL BASIS OF REPORTING 2018

Indicator Definition and boundary Unit
Scope 1: (Process emissions): Our reporting under Scope 1 is conservative in order to allow a fair comparison of carbon data between the reporting sites and includes all our process emissions under our control. If we only considered direct and not full process emissions (ie excluded the external power plant emissions) we would effectively transfer our process emissions to the power plant and replace them with Scope 2 emissions for all the electricity we import from the power plant, based on the average carbon content of grid electricity. But since our waste gases are five times more carbon- intensive than the natural gas that power plants would normally utilize, we would be under- reporting the emissions for which we are responsible. The CO
2e per
tonne of steel of a steel plant that report its direct emissions only can be half those of the one that reports its full process emissions including the ones used for power generation by an external power plant but which can be entirely consumed in the steel production operation
Scope 2: (Indirect emissions from ‘net’ purchased electricity): Electricity-related emissions are linked to the external procurement of electricity in excess of those quantities produced from waste gas exported to external power plants. For this calculation, country (or local if relevant) specific CO
2e
equivalent emission factors of electricity are applied.
Scope 3: (Other indirect emissions): the other upstream CO2e included in our
boundary emissions related to the procurements of preprocessed materials and utilities (such as, pellets, burnt fluxes, industrial gases) and exchange of intermediate products between sites (such as coke, DRI, pig iron). Upstream emissions do not include raw material extraction or transportation and only capture emissions produced during processing of materials. Transportation activities are currently excluded.
Collection of data: Data is submitted by local site management to the Environment department. ArcelorMittal requires production sites to fill in a standard template, which requests information on material use, energy and utility flows at the site level. This data is obtained from procurement, delivery and inventory information at site level and is used to calculate net use.
Our CO2e (steel) data at site and group level is assured by DNV GL.
Data conversion: and then converted to CO2e with standard emission
factors1 from carbon contents or upstream values for processed materials, utilities and intermediate products. These values are preferably measured directly; otherwise they are derived from standard values based on ArcelorMittal’s experience (see Appendix 1). For scope 3 emissions, a unique upstream value is allocated to each pre-processed material, utility and intermediate product, based on the average performance of the producing sector. Where local site data is not available, estimates are made based on the production to emissions ratio of the prior year, and applying this to the current year production data.
1 These factors are detailed in Appendix 1
11 ARCELORMITTAL BASIS OF REPORTING 2018

Reporting methodology by indicator
Indicator Definition and boundary Unit
Total CO2e emissions (mining and steel)
For CO2e (mining), the organisational boundary includes all our mining
operations; our CO2 emissions relate predominantly to our use of electricity
and our CH4 emissions from coalbed methane. Transportation activities are currently excluded. See indicator “Total CO
2e emissions (steel)” for
steel boundary.
ArcelorMittal’s total CO2e emissions (or “CO
2e footprint”) =
– Scope 1 (process CO2e emissions from steel + CO
2 from mining + CH
4
from mining) +
– Scope 2 (indirect emissions from “net” purchased electricity + electricity purchased at mining sites)
– Scope 3 (other indirect emissions as defined above)
CH4 emissions reported in tonnes of CH4 are multiplied by the warming
potential (we use 21) to get the equivalent CO2e emissions in tonnes.
Collection of data: Data is submitted by local site management to the Environment department. ArcelorMittal requires production sites to fill in a standard template, which requests information on material use, energy, utility flows and CH
4 emissions (for coal mines) at the site level. This data is
obtained from procurement, delivery, inventory information and air analysis (for CH
4) at site level and is used to calculate net use and then converted to
CO2 with standard emission factors from carbon contents or upstream values
for processed materials, utilities and intermediate products. These values are preferably measured directly; otherwise they are derived from standard values based on ArcelorMittal’s experience (see Appendix 1). A unique upstream value is allocated to each pre-processed material, utility and intermediate product (steel only), based on the average performance of the producing sector. Where local site data is not available, estimates are made based on the production to emissions ratio of the prior year, and applying this to the current year production data.
Million tonnes CO
2e
The CO2e data at
site and group level is assured by DNV GL.
12 ARCELORMITTAL BASIS OF REPORTING 2018
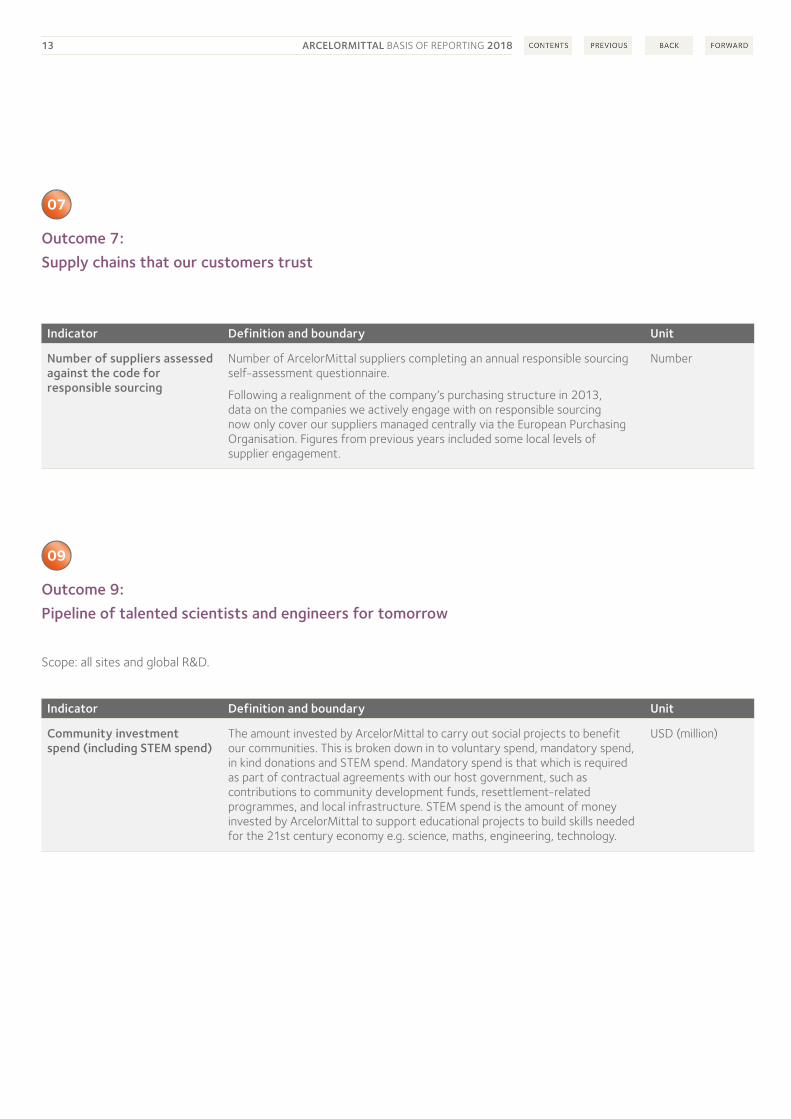
Outcome 7:
Supply chains that our customers trust
Indicator Definition and boundary Unit
Number of suppliers assessed against the code for responsible sourcing
Number of ArcelorMittal suppliers completing an annual responsible sourcing self-assessment questionnaire.
Following a realignment of the company’s purchasing structure in 2013, data on the companies we actively engage with on responsible sourcing now only cover our suppliers managed centrally via the European Purchasing Organisation. Figures from previous years included some local levels of supplier engagement.
Number
Outcome 9:
Pipeline of talented scientists and engineers for tomorrow
Scope: all sites and global R&D.
Indicator Definition and boundary Unit
Community investment spend (including STEM spend)
The amount invested by ArcelorMittal to carry out social projects to benefit our communities. This is broken down in to voluntary spend, mandatory spend, in kind donations and STEM spend. Mandatory spend is that which is required as part of contractual agreements with our host government, such as contributions to community development funds, resettlement-related programmes, and local infrastructure. STEM spend is the amount of money invested by ArcelorMittal to support educational projects to build skills needed for the 21st century economy e.g. science, maths, engineering, technology.
USD (million)
13 ARCELORMITTAL BASIS OF REPORTING 2018

Reporting methodology by indicator
Outcome 10:
Our contribution to society measured, shared and valued
Indicator Definition and boundary Unit
Direct economic contribution Direct economic contribution is the sum of the wages and salaries paid, supplier and contractor payments, taxes paid, capital reinvested in the business, dividends, interest payments and R&D. Although R&D and capex are subcategories of certain other categories given, such as payments to suppliers, they are notable contributions to society in terms of intellectual and manufactured capital, and are therefore extracted in order to provide more detail.
It does not include indirect contributions to the economy, such as through indirect job creation through the supply chain. Data is derived from financial records for the year in review, with additional data collection on specific elements as described below.
USD (million)
Total tax contribution In 2016, the company undertook a review of all the taxes paid at a local level besides income tax. The figures published in the 2016 Annual Review (outcome 10) are the result of that work, and represent a wider scope than reported in previous years. Details of the elements making up this figure, are set out below:
‘Corporate income tax’ comprises all taxes that are based on the taxable profits of a company.
‘Payroll taxes’ comprise two parts:
(i) Employee payroll taxes: payroll and employee taxes withheld from employee remuneration, and paid to governments, i.e. tax collected by ArcelorMittal and remitted to governments on behalf of employees.
(ii) Employer payroll taxes: payroll and employer taxes payable as a result of a company’s capacity as an employer.
‘Local taxes’ comprises:
(i) property tax: Land tax or property tax on real estate
(ii) environment tax: any taxes generally levied as directly as possible on a pollutant or an action causing environmental damage, such as air emissions (dust, NOx, SOx, CO
2 except emission trading), water emissions
(water discharge, water intake), residues (elimination of hazardous waste, elimination of non-hazardous waste, storage residues) and related fines.
(iii) energy tax: taxes, contributions collected by energy suppliers, transport system operators net of any refund from government.
‘Other taxes’ comprise: customs & excise duties, motor vehicle tax, government royalties, mining taxes, irrecoverable indirect taxes, and financial transaction tax.
‘Government royalties’ are calculated according to the scope of extractive industry reporting under the EU Accounting Directive 2013/34/EU, which is narrower than the ArcelorMittal’s scope used in previous years.
Employee salaries, wages and pensions comprises all employer costs as reported in our 20f, plus payments to pension plans. In 2016 for the first time this figure excludes employee payroll taxes, reported separately.
Supplier and contractor payments exclude any taxes, R&D or capital expenditure included in other categories.
14 ARCELORMITTAL BASIS OF REPORTING 2018

Transparent good governance
Indicator Definition and boundary Unit
The number of board self-assessments
The board self-assessment takes place at the level of the board of directors of the ArcelorMittal group’s parent company.
Number
Employees completed code of business conduct training
All employees are required to undertake this training every three years. The percentage reported for the year relates to the number of all employees who have a valid training certificate at the end of the period.
%
Employees completed anti-corruption guidelines training
Employees in relevant roles are required to undertake this training every three years. The percentage reported for the year relates to the number of relevant employees who have a valid training certificate at the end of the period.
%
Employees trained on human rights
Employees in relevant roles are required to undertake this training every three years. The percentage reported for the year relates to the number of relevant employees who have a valid training certificate at the end of the period. Relevant roles include CR, legal, HR, and all managers and above.
%
Number of operations with a local confidential whistleblowing system
Our whistleblowing system globally is provided by a third party in the language of the participating country. The number of operations relates to a number of countries which have a whistle blowing line operated by this third party. One whistleblowing line may serve many sites in the country.
Number
Whistleblowing complaints received via Internal Audit
Complaints received relate to those received via whistleblowing lines relating to fraud and corruption and referred to the Group Forensic team, which records and tracks each one until resolution.
Number
15 ARCELORMITTAL BASIS OF REPORTING 2018
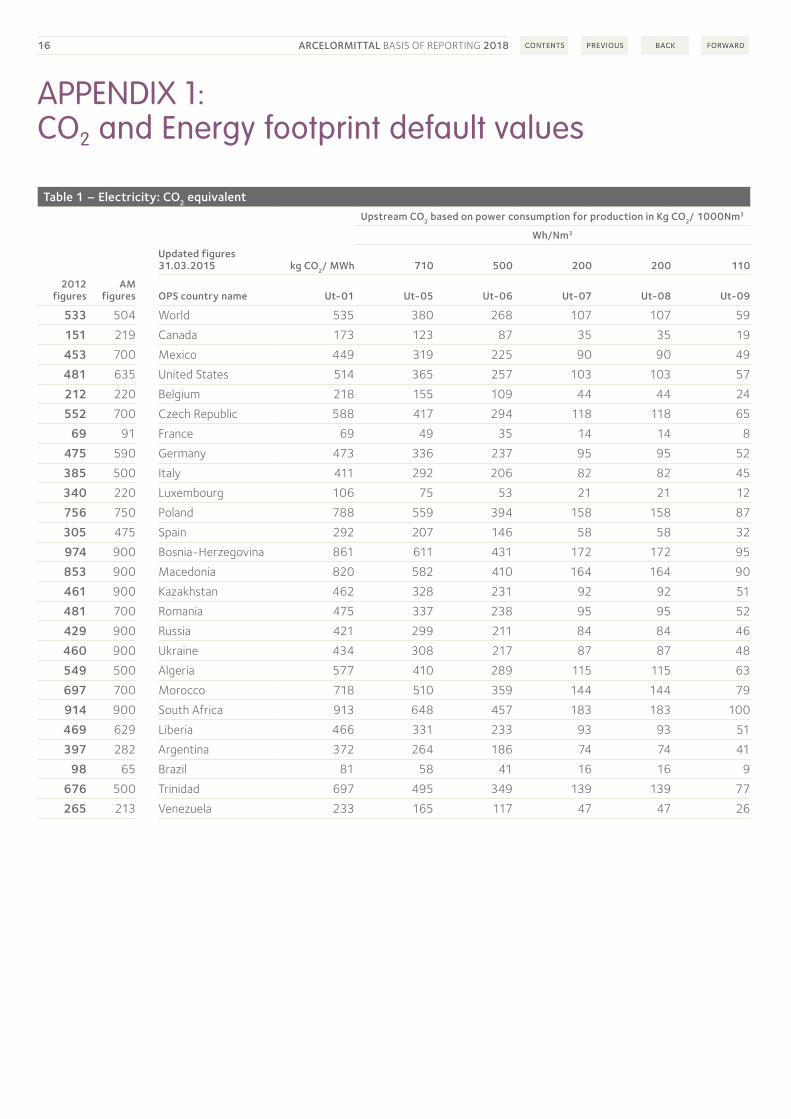
APPENDIX 1:CO2 and Energy footprint default values
Table 1 – Electricity: CO2 equivalent
Upstream CO2 based on power consumption for production in Kg CO2/ 1000Nm3
Wh/Nm3
Updated figures 31.03.2015 kg CO2/ MWh 710 500 200 200 110
2012 figures
AM figures OPS country name Ut-01 Ut-05 Ut-06 Ut-07 Ut-08 Ut-09
533 504 World 535 380 268 107 107 59
151 219 Canada 173 123 87 35 35 19
453 700 Mexico 449 319 225 90 90 49
481 635 United States 514 365 257 103 103 57
212 220 Belgium 218 155 109 44 44 24
552 700 Czech Republic 588 417 294 118 118 65
69 91 France 69 49 35 14 14 8
475 590 Germany 473 336 237 95 95 52
385 500 Italy 411 292 206 82 82 45
340 220 Luxembourg 106 75 53 21 21 12
756 750 Poland 788 559 394 158 158 87
305 475 Spain 292 207 146 58 58 32
974 900 Bosnia-Herzegovina 861 611 431 172 172 95
853 900 Macedonia 820 582 410 164 164 90
461 900 Kazakhstan 462 328 231 92 92 51
481 700 Romania 475 337 238 95 95 52
429 900 Russia 421 299 211 84 84 46
460 900 Ukraine 434 308 217 87 87 48
549 500 Algeria 577 410 289 115 115 63
697 700 Morocco 718 510 359 144 144 79
914 900 South Africa 913 648 457 183 183 100
469 629 Liberia 466 331 233 93 93 51
397 282 Argentina 372 264 186 74 74 41
98 65 Brazil 81 58 41 16 16 9
676 500 Trinidad 697 495 349 139 139 77
265 213 Venezuela 233 165 117 47 47 26
16 ARCELORMITTAL BASIS OF REPORTING 2018

Table 2 – CO2 and energy upstream for utilities
Upstream energy and CO2 Default values
Product code Stream Upstream energy
Up CO2 Up En
Utilities t/unit GJ/unit
Ut-01 MWh Electricity Depend on country 9.208
Ut-02 t High pressure steam 3.350
Ut-03 t Low pressure steam 3.050
Ut-04 t Hot water 0.850
Ut-05 Wh/Nm3 High pressure oxygen
Figures based on Up energy and electricity country CO
2
equivalent
710.000
Ut-06 Wh/Nm3 Low pressure oxygen 500.000
Ut-07 Wh/Nm3 Nitrogen 200.000
Ut-08 Wh/Nm3 Argon 200.000
Ut-09 Wh/Nm3 Compressed air 110.000
Ut-10 Hydrogen
17 ARCELORMITTAL BASIS OF REPORTING 2018

APPENDIX 1: CO2 and Energy footprint default values
Table 3 – C content, CO2 and ncv’s (net calorific value)
C content, CO2 EF and ncv’s Default values
Product code Stream C content C content Calorific value Calorific value
Products C (t/t)
PR-01 Merchant Sinter 0.0000
PR-02 | PR-04 Pig Iron 0.0470
PR-03 DRI 0.0200
PR-05 to Pr-34 Flat Steel 0.0004
PR-05 to Pr-34 Long Steel 0.0010
Cond Fuels C (t/t) C (t/m3) ncv (MJ/t) ncv (MJ/m3)
CF-01a to CF-01c Coke 0.8800 30 135
CF-02 Coke Breeze 0.8500 29 925
CF-03 Coking coal 0.8200 32 230
CF-04 Anthracite 0.7900 29 300
CF-05 to CF-07 BF injection Coal 0.8000 31 140
CF-08 Petroleum Coke 0.8500 31 935
CF-09 | CF-14 | CF-15 Heavy oil (d=0.85) 0.8650 39 845
CF-10 | CF-11 Light oil (d=0.85) 0.8450 0.7183 41 982 35685
CF-12 LPG 0.8218 46 030
CF-13 Charcoal (d=0.25) 0.7000 0.1800 18 810 4703
CF-16 Used Plastics 0.7200 46 000
CF-17 Used Tyres 0.6000 35 000
Gas Fuels C (kg/m3N) ncv (MJ/m3N)
GF-01 Coke Oven gas 0.2390 19.685
GF-02 Blast Furnace Gas 0.2390 3.185
GF-03 Smelting Reduction Gas 0.4287 7.660
GF-04 BOF Gas 0.4662 9.190
GF-05 Natural Gas 0.5495 35.920
Materials C (t/t) Eq. Energy (MJ/t)
Ma-01 | Ma-02 EAF Electrodes 0.9990
Ma-03 Ferro Chromium 0.0650
Ma-04 Ferro Manganese 0.0750
Ma-06 | Ma-07 Scraps 0.0010
Ma-08 Limestone 0.1200
Ma-09 Burnt Lime 0.0065 3 600
Ma-10 Crude Dolomite 0.1300
Ma-11 Burnt Dolomite 0.0065 3 600
Ma-12 Fine Iron Ore 0.0005
Ma-13 Lump Ore 0.0015
Ma-14 Pellets 0.0001
Ma-15 Bedding
18 ARCELORMITTAL BASIS OF REPORTING 2018

Table 3 – C content, CO2 and ncv’s (net calorific value)
C content, CO2 EF and ncv’s Default values
Product code Stream C content C content Calorific value Calorific value
Residues C (t/t) C (t/m3) ncv (MJ/t) ncv (MJ/m3)
Res-01 Tar 0.9250 37 670
Res-02 Benzole 0.9185 46 040
Res-03 Naphtalenic oil 0.7183 35 685
Res-04 CDQ Dust 0.8800 30 135
Res-05 Coke quenching breeze 0.8800 29 925
Res-06 | Res-10 BF gas cleaning dust 0.4000 13 698
Res-07 BF gas sludge 0.4000 13 698
Res-09 DRI screening fines 0.0200
Res-13 Flat steel scraps 0.0004
Res-13 Long steel scraps 0.0010
Table 4 – Energy equivalent for the different streams
Stream type Equivalent energy Unit
Burnt lime 3600.000 MJ/t
Burnt dolomite 3600.000 MJ/t
Pellets 1250.000 MJ/t
Electricity 9.210 GJ/MWh
HP steam 3350.000 MJ/t
LP steam 3050.000 MJ/t
Hot water 850.000 MJ/t
Low purity oxygen 4.600 GJ/103m3
High purity oxygen 6.540 GJ/103m3
Nitrogen 1.840 GJ/103m3
Argon 1.840 GJ/103m3
Compressed air 1.010 GJ/103m3
Note:The values in this document are derived either from externally published sources or internal ArcelorMittal analysis by our research and development teams and the chief technology officer’s department.
19 ARCELORMITTAL BASIS OF REPORTING 2018

Published in April 2019
ArcelorMittal 19, Avenue de la Liberté L-2930 Luxembourg Grand Duchy of Luxembourg
corporate.arcelormittal.com
We welcome your feedback on this report. Please send it to [email protected]