Embed Size (px)
Citation preview
Originally published as:
Sachse, V., Strozyk, F., Anka, Z., Rodrigues, J. F., di Primio, R. (2016): The tectono‐stratigraphic
evolution of the Austral Basin and adjacent areas against the background of Andean tectonics,
southern Argentina, South America. ‐ Basin Research, 28, 4, pp. 462—482.
DOI: http://doi.org/10.1111/bre.12118
1
The tectono‐stratigraphic evolution of the Austral Basin and adjacent areas against the
background of Andean tectonics, southern Argentina, South America
V.F. Sachse (1) (4) (*), F. Strozyk(2), Z. Anka (1) (5), J.F. Rodriguez (3) and R. di Primio (1) (6)
(1) GFZ German Research Centre for Geosciences, Section 4.3 Organic Geochemistry,
Telegrafenberg, 14473 Potsdam, Germany
(2) Energy and Minerals Resources, Geological Institute, RWTH Aachen University,
Wüllnerstr. 2, 52056 Aachen, Germany
(3) Petrobras Argentina S.A., Buenos Aires, Argentina
now at (4) Energy and Minerals Resources, Instititute of Geology and Geochemistry of
Petroleum and Coal, RWTH Aachen University, Lochnerstr. 4‐20, 52056 Aachen, Germany
now at (5) TOTAL Exploration‐ New Ventures, Paris, France
now at (6) Lundin Norway AS, P.O. Box 247, N‐1326 Lysaker, Norway
(*) Corresponding Author : [email protected]‐aachen.de
Abstract
The Austral Basin (or Magallanes Basin) in southern Argentina is situated in a highly active
tectonic zone. The openings of the South Atlantic and the Drake Passage to the east and
south, active subduction in the west, and the related rise of the Andes have massively
influenced the evolution of this area. In order to better understand the impacts of these
tectonic events on basin formation to its present‐day structure we analyzed 2D seismic
reflection data covering about 95.000 km² on‐ and 115.000 km² offshore (Austral “Marina”
and Malvinas Basin). A total of 10 seismic horizons, representing 9 syn‐ and post‐ rift
sequences, were mapped and tied to well data to analyze the evolution of sedimentary
supply and depocenter migration through time. 1D well backstripping across the study area
confirms three main tectonic stages, containing (1) the break‐up phase forming basement
graben systems and the evolution of the Late Jurassic ‐ Early Cretaceous ancient backarc
Austral/Rocas Verdes Basin (RVB), (2) the inversion of the backarc marginal basin and the
development of the foreland Austral Basin, and (3) the recent foreland Austral Basin. Synrift
sedimentation did not exceed the creation of accommodation space, leading to a deepening
of the basin. During the Early Cretaceous a first impulse of compression due to Andes uplift
2
caused rise also of parts of the basin. Controlling factors for the subsequent tectonic
development are subduction, balanced phases of sedimentation, accumulation and erosion
as well as enhanced sediment supply from the rising Andes. Further phases of rock uplift
might be triggered by cancelling deflection of the plate and slab window subduction,
coupled with volcanic activity. Calculations of sediment accumulation rates reflect the
different regional tectonic stages, and also show that the Malvinas Basin acted as a sediment
catchment after the filling of the Austral Basin since the Late Miocene. However, although
the Austral and Malvinas Basin are neighboring basin systems that are sedimentary coupled
in younger times, their earlier sedimentary and tectonic development was decoupled by the
Rio Chico basement high. Thereby, the Austral Basin was affected by tectonic impacts of the
Andes orogenesis, while the Malvinas Basin was rather affected by the opening of the South
Atlantic.
Keywords: foreland basin; on/offshore correlation; Andes; sedimentation rates;
Austral/Malvinas Basin; on/offshore Argentinian continental margin; volcanic activity; basin
subsidence
1. Introduction
The Austral Basin (also known as Magallanes Basin) is located on‐and offshore in southern
Argentina and Chile, in the area of southern Patagonia (Figure 1). The neighboring offshore
Malvinas Basin is localized to the east of Tierra del Fuego, on the southernmost continental
margin of South America. Several previous studies in both basins have dealt with the
evolution (Ludwig et al., 1968; Galeazzi, 1998; Ghiglione, 2002, Ghiglione et al., 2009, 2010;
Franzese et al., 2003; Fosdick et al., 2011; Romans et al., 2012; Varela et al., 2012), the
petroleum system (Pittion & Gouadain, 1992; Rodriguez et al., 2008; Rossello et al., 2008),
the chronostratigraphy (Biddle et al., 1986; Galeazzi, 1998; Pérez Panera, 2012), and
presence of magmatic and sedimentary intrusions (Hubbard et al., 2007; Bruni et al., 2008).
In the case of the Malvinas Basin, Galeazzi (1998), Tassone et al. (2008) and Baristeas et al.
(2013) carried out a detailed seismo‐stratigraphic analysis with focus on the structural‐
tectonic evolution, as well as the distribution of hydrocarbon leakage features (Baristeas et
3
al., 2012). Various researches (i.e. Galeazzi, 1998; Ghiglione, 2002; Rossello et al., 2008)
based on outcrop, well data and scattered seismic lines led to a relatively good knowledge
about the basin evolution, however, these studies focused on particular areas of the
Malvinas and Austral Basin. In this study we integrate the previous works into a basin‐wide
view of the processes controlling the evolution of the basin. We present a redefined analysis
of the tectono‐stratigraphic framework and episodes of basin fill with focus on the northern
Austral Basin, but also including the Rio Chico High and the neighboring western Malvinas
Basin, based on detailed 2D seismic interpretation and development of a tectono‐
stratigraphic model. The influence of the rising Andes on exhumation events and sediment
supply history of the Austral Basin is a main focus of this study. The investigation of the
neighboring Austral Basin and the western Malvinas Basin is used to demonstrate how
predominant impacts of regional orogenesis (i.e., Andes formation) affect basin evolution by
far‐field stresses compared to those from continental break‐up and rifting (i.e., Atlantic
opening), respectively. The development of the two neighboring basins was not diachronous
and initially decoupled by the Rio Chico basement high in terms of sedimentary and tectonic
processes. This setting serves as an analogue of the spatial and temporal limitations of
tectonic forces on basin systems. Furthermore, a more detailed view inside the Austral Basin
demonstrates the sequential evolution of an intra‐continental basin from an early rift to a
later foreland stage.
1.1 Regional geologic framework
The Mesozoic Austral Basin (or Magallanes Basin, Figure 1) in southernmost Argentina (>50°
south latitude) covers an area of approx. 195.000 km2, both on‐ and offshore (Zambrano &
Urien, 1970). Maximum extent reaches approx. 700 km in length and 370 km in width
(Biddle et al., 1986). It is bounded by the Andes in the west (Patagonian cordillera) and south
(Fuegian cordillera), the Rio Chico High (Dungeness Arch) in the east, extending as Deseado
Massif to the northwest and northeast, as well as the Malvinas Basin in the southeast and
the fold & thrust belt in the south. The Austral and Malvinas Basins are part of the South
American plate which is surrounded by the Nazca plate to the west, the Antarctic plate to
the southwest and south, the Scotian plate to the south and the African plate to the east
(Figure 1). In general, South America contains four simplified tectonic provinces from west to
4
east (Diraison et al., 2000): Cordillera (Fuegian and Patagonian) with metamorphic rocks of
Paleozoic and Mesozoic ages, including Jurassic to Mid‐ Tertiary intrusions and the volcanic
arc (1); the remnant marginal Rocas Verdes Basin contains Early Cretaceous marine
sediments (2) Austral fold & thrust belt with Paleozoic to Early Cretaceous metamorphic
rocks and Mesozoic to Cenozoic sediments (3) and the undeformed Austral Basin to the east
(4) (Figure 1; Diraison et al., 2000).
1.2 Stratigraphy
The stratigraphic units are based on the sequences outlined by i.e. Biddle et al. (1986),
Olivero & Martinioni (2001), Olivero & Malumián (2008), Pérez Panera (2012), Richiano et al.
(2012) the presented chronostratigraphy was basically compiled by Robbiano et al. (1996).
For this interpretation best visible markers of stratigraphic units were taken: Tobifera
Formation; Lower Inoceramus (Rio Mayer Fm.) and Margas Verdes Formation (Nueva
Argentina; not sub‐divided); Middle (Arroyo Alfa Formation) and Upper Inoceramus (Cabeza
de Leon Fm.); Upper Palermo Aike Formation; Paleocene, Eocene, Oligocene (Lower and
Upper Magallanes); Miocene (Santa Cruz and Patagonia; not‐subdivided); and Plio‐
Pleistocene.
1.3 Methods and data set
Seismic data and wells
The study area covers approx. 210.000 km², including parts of the onshore Austral Basin
(approx. 95.000km²) and the western offshore Malvinas Basin (approx. 115.000km²) with the
Rio Chico High in between (Figure 1). A dense seismic reflection data set consisting of 341
profiles in the onshore and 358 profiles in the offshore area (Figure 2) as well as 140 wells,
all provided by Petrobras Argentina S.A., were used for seismic interpretation and
subsequent reconstruction of the geological evolution of the Austral Basin. The length of
used seismic data for the continental Austral Basin is approx. 5000 km and approx. 12.000
km for the marine part.
The seismic data are standard processed, 2D, industrial reflection seismic profiles (post‐
stack/time migrated). They consist of different surveys shot between 1970 and 2008
5
(Malvinas Basin seismic data were recorded between 1970 and 1998). The spacing between
single 2D lines varies from 2.5 to 35 km, and the maximum depth of profiles is 8 s TWT. The
well data comprises stratigraphic well tops, lithological data, and checkshots. The seismic
interpretation and the time‐to‐depth conversion of interpretation results were performed
with Petrel Interpretation Software (Schlumberger).
A seismic‐to‐well log correlation and its integration with stratigraphic data were carried out
to perform a chrono‐stratigraphic framework for the basic seismic interpretation, a seismo‐
stratigraphic interpretation, and a tectono‐stratigraphic analysis. In addition to basic
stratigraphic seismic horizons, major faults, intrusions, and seismic chimneys were mapped.
Seismic horizon interpretation was carried out based on time‐migrated well stratigraphy and
tracing of corresponding, well visible, continuous reflectors. All seismic horizons and faults
were manually interpreted. Due to the partially high spacing between single seismic lines,
large parts of the final stratigraphic surfaces were interpolated with a standard interpolation
algorithm. Checkshots were used to calculate interval velocities for the interpreted seismic
units, summarized to a final velocity model and depth conversion of the interpreted
horizons. Velocities are compiled in Table 1. Depth and thickness maps for all seismic units
were created. Thicknesses and volumes of seismic units were used to assess sediment
distribution and the orientation of sediment input as well as to calculate sedimentation
rates.
Sediment accumulation/rates
Sediment accumulation rates (km³/Ma*10‐3) were calculated for each unit based on
compacted isopach maps, as they show volumetric amounts of sediment covering a specific
area. Sedimentation rates (m/Ma) were then calculated from average sediment thicknesses
accumulated in defined areas (Table 2). This was done for the entire study area as well as
independently for the Austral and Malvinas Basins (Table 2). Note that compaction was not
taken into account for this approach, because the present day depth and sediment
thicknesses for the entire study area highly vary and thus a consistent change of porosity
with depth cannot be assumed. As the sedimentation and accumulation rates were
calculated for the entire study area a more precise, decompacted calculation was not done
for the entire basins, but for the maximum sediment thickness values of each unit. Based on
6
this values the sedimentation rates were calculated (Table 3). The porosity values were
taken as published by Bond & Kominz (1984) for the lithostratigraphy presented in Figure 3.
1D well backstripping‐ tectonic subsidence
1D backstripping was done along 38 wells using the “McKenzie tool” included in PetroMod®
(Schlumberger). The used wells are located in Figure 4. Thereby the present day stratigraphic
record is used to estimate the depth of basement during incremental removing of the
sediment and water load (i.e. Watts & Ryan, 1976). The resulting depth reveals the tectonic
history of subsidence or uplift as tectonic driven forces in the basin (e.g., Watts & Ryan,
1976). For the back‐stripping process the required lithologies, ages, and thicknesses of
sedimentary units are provided by internal well reports (Petrobras), while well logs and well
picks are based on the seismo‐stratigraphic interpretation. Due to compaction of the
sediments during deposition and subsidence (Airy isostasy) a decompaction process is
assigned during backstripping (see data by Bond & Kominz, 1984; Hantschel & Kauerauf,
2009). Paleo‐water depths were adopted from Wilson (1991) as the uncertainty of results for
tectonic subsidence in some areas is depending on the paleo‐water depth. Thus a deep‐
water zone was assigned for the Jurassic in the westernmost area of the basin, expanding
during the Early Cretaceous to the east, and being pronounced in the central basin during
the Late Cretaceous to Paleogene (Figure 5). A theoretical subsidence curve was calculated
based on McKenzie (1978), taking into account that extensional basins and accompanied
thermal contraction leads to subsidence of the lithosphere and thus creates more space for
sediment load followed by further subsidence. The amount of subsidence will depend on the
initial amount of stretching. This can be estimated and is known as the stretching factor, or β
– factor. β is defined as b/a, whereas b is the stretched width and a the initial width. As the
Austral Basin shows a mixture of smooth rifting and flexure, a maximum sediment thickness
of 7 km and an assumed crustal thickness of 35 km, we assigned a β‐factor of 1.3 for all
theoretical models.
7
2. Results
2.1 Seismo‐stratigraphic units, basin geometry and sediment distribution
Seismo‐stratigraphic syn‐ and post‐ rift sequences were identified and mapped on‐ and
offshore the northern Austral Basin and in the Malvinas Basin. In total 10 seismic horizons,
representing nine key stratigraphic units of the study area, were mapped (Figures 3, 6, and
7). These units are (i) pre‐Jurassic basement (U1), (ii) Jurassic Tobifera Formation (U2), (iii)
Early Cretaceous deposits (Lower Inoceramus and Margas Verdes Formation; U3), (iv) Late
Cretaceous deposits (Middle and Upper Inoceramus; U4), (v) sub‐unit Coniacian to
Campanian deposits (Upper Palermo Aike Formation; U4A), (vi) Paleocene deposits (U5), (vii)
Eocene deposits (U6), (viii) Oligocene deposits (U7), (ix) Miocene deposits (U8), and (x) Plio‐
Pleistocene deposits (U9). In general, the Palaeozoic geometries of the Austral Basin and the
western Malvinas Basin follow the structure of basement highs. The Malvinas Basin, on the
eastern flank of the basement high Rio Chico, has an approximately triangular shape, while
the Austral Basin on the western flank of the Rio Chico High shows an elongated to rhombic
geometry (Figures 1 and 7A). The overall maximum sediment thickness, including Mesozoic
and Cenozoic is 8000 m (Figure 8).
Acoustic Basement (U1)
The acoustic basement represents pre‐Jurassic rocks and is defined by its chaotic to
transparent seismic reflectivity (U1) (Figure 7A). The top of the rifted unit occurs as a
discontinuous reflector of low to medium amplitudes, which was affected by intense
faulting, and shows graben and half‐graben structures (Figure 6). The graben structures,
including rotated blocks, are observed in the entire study area, except for the Rio Chico High.
On the Rio Chico High and the northern parts of the Austral and Malvinas Basins, the top of
U1 occurs in < 1000 m depth, while in the northern Malvinas Basin and the Austral Basin, it is
located between 800 and 2000 m with a general deepening trend to 7 km towards the SE
and 8 km towards the SW (Figure 7A).
Jurassic synrift (Tobifera Formation) (U2)
The synrift unit is represented by the Jurassic Tobifera Formation (U2), which discordantly
overlays the faulted basement and also fills the syn‐rift grabens and half‐graben structures
8
(Figure 6). The map of top Jurassic indicates geometries similar to U1 with a general
southward deepening trend down to 7 and 7.5 km in the SE and SW parts of the basins,
respectively, (Figure 7B). On the Rio Chico High its maximum depth is 800‐900 m. The unit
shows strong and partly continuous reflection pattern throughout the entire study area. The
top reflector is the first continuous reflector of the entire units. The sediments of this unit fill
basement grabens and cover the basement, and they are of highly variable thickness (Fig.
6A).
Highest thicknesses are 1494 m, in the western Malvinas Basin, where it forms a prominent,
N‐S‐elongated structure, and 1200 m in the central and southern Austral Basin (Figure 8A).
Further, the unit thins out above rotated basement blocks and at the Rio Chico High, where
it is of only 250 m thick maximum, thus partially merging with the top basement reflector.
Accumulation rate was calculated with 3.24 km³/Ma*10‐3 and slightly higher for the
Malvinas Basin with 4.49 km³/Ma*10‐3 (Table 2 and Figure 9). For the maximum,
decompacted thickness a sedimentation rate of 168 m/Ma was calculated (Table 3).
Early Cretaceous (Springhill, Lower Palermo Aike Formation (Lower Inoceramus/Rio
Mayer), and Middle Palermo Formation (Margas Verdes Formation/Nueva Argentina) (U3)
The Early Cretaceous (U3) represents a seismic unit with a fashion similar to the Jurassic
graben and half graben infill (Figure 7C), while its top reflection is almost continuous across
the entire study area. This unit therefore represents the oldest post‐rift sediments. The
reflector set representing the top of U3 was identified on both sides of the Rio Chico High,
but is missing on the Rio Chico High, where a clear differentiation between single reflections
of U1, U2 and U3 is limited due to a strong thinning of the entire sediment succession (U1 to
U9). Below the top reflector, the reflectors become more diffuse, discontinuous and
transparent. The minimum depth of top U3 with approx. 800 m occurs in the northern basins
and on the Rio Chico High, while its deepest parts of 6 km are located in the southern basins
(Figures 7C and 8B). In the western Austral Basin, the sediments occur now in a shallow
depth of 1500 m. The sediment thickness of U3 is very similar to U2. The unit thickens in the
central part of the Austral Basin to 1000 m and shows a maximum of 3225 m in the south‐
westernmost edge of the basin (Figure 8B). An U3 thickness of 1000 m is observed for the
southernmost and easternmost part of the Malvinas Basin. A general trend of southward
thickening and deepening is observed (Figures 7C and 8B), although it appears generally
9
smoother and more NW‐SE oriented than for the underlying units. An accumulation rate of
0.97km³/Ma*10‐³ was calculated, for the Austral/ previous RVB and lower values of 0.69
km³/Ma*10‐³ for the Malvinas Basin (Table 2; Figure 9). For the maximum, decompacted
thickness a sedimentation rate of 116 m/Ma was calculated (Table 3).
Late Cretaceous (upper parts of Middle Palermo Aike Formation (Middle
Inoceramus/Arroyo Alfa), Upper Palermo Aike and lower parts of Lower Magallanes
(Upper Inoceramus/ Cabeza de Leon) (U4)
The top of the Late Cretaceous unit (U4) is characterized by the Late Cretaceous
(Maastrichtian) unconformity, showing truncated reflections on the top of this unit (Figure
6A). The uppermost Late Cretaceous internal reflectors show minor continuous reflectors
with a less strong amplitude. The lower Late Cretaceous reflectors show a strong amplitude,
occur parallel to the top reflector and are not internally disturbed (Figure 6). Within the
western Malvinas Basin, the unconformity is not clearly resolved and thus the age is
questionable (see also Baristeas et al., 2012). In the western part areas of lower depth occur.
A pronounced deepening from north to south ceased for U4 and a smooth depth in the
central Austral Basin occurs. To the west limited sediment accumulations occur now 800 m
above sea level. Further, the clear separation of the Rio Chico High and the basin areas is less
resolved compared to the older units. In the Malvinas Basin the Late Cretaceous shows a
deepening from 800 m depth in the northwest to 4500 m depth in the southeast (Figure 7E).
The unit shows highest thicknesses of 5039 m in the southern Austral Basin, with a thinning
to values lower than 4000 m towards the NW (Figure 8D). On the Rio Chico High the unit
shows an average thickness of 500 m. Also this unit shows highest thicknesses in the
southern study area with an elongation of the thickest part in NW‐SE direction.
Upper Palermo Aike Formation (lower parts of Upper Inoceramus/Cabeza de Leon) (U4A)
The Upper Palermo Aike Formation subunit (U4A), as part of the Late Cretaceous, clearly
demonstrates thinning onlapping geometries at the Rio Chico High (Figure 6A). In the central
Austral Basin parallel, continuous reflectors with a strong amplitude characterize the top
(Figure 7E). To the west and eastern basin, an onlapping of the U4A top reflector on older
Cretaceous sediments is observed (Figure 6A). Sediments of the U4A are deposited (sub‐)
parallel to the recent coastline and the Andes, but now a migration of the depocenter to the
10
southeast is clearly visible (Figure 7D). Highest sediment thickness of approx. 2576 m occur
in the southern Austral Basin imaging the prominent NW‐SE trending structure, which is now
thinning to the northwest (Figure 8C). In the northern study area, the formation has a
thickness of up to 300 m. To the west, it onlaps on older Cretaceous units. Same applies for
the eastern part of the basin, where reflectors are terminating in a tapering and, thinning
geometry (Figure 6). In the Malvinas Basin, the U4A was not mapped because well picks are
missing and the units’ thickness might be below seismic resolution due to its strong thinning
towards the western flank of the Rio Chico High.
The whole Late Cretaceous (including subunit U4A) accumulation rates were calculated as
3.09 km³/Ma*10‐³ for the Austral Basin and 1.05 km³/Ma*10‐3 for the Malvinas Basin (Table
2; Figure 9). For the maximum, decompacted thickness a sedimentation rate of 205 m/Ma
was calculated (Table 3).
Paleocene (lower parts of Lower Magallanes Formation) (U5)
The Paleocene unit (U5) is seismically clearly resolved in the Austral Basin, but not on the Rio
Chico High and in the western Malvinas Basin, because of its significant thinning down to less
than 50 m and thus below seismic resolution. The entire Paleocene reflectors show a high
amplitude, occur parallel to the top reflector and are clearly visible in the Austral Basin. The
top U5 shows elevations that reach 400 m depth in the western and north‐western fringes of
the Austral Basin (Figure 7F). Similar to the Late Cretaceous deepest parts of U5 with 2500 m
depth are located in the central part of the Austral Basin (Figure 7F). Local sediments in the
western part of the Austral Basin are now 1000 m above sea level. The unit clearly reflects
the Malvinas Basin’s triangular geometry with a deepening from 700 m in the NW to 3600 m
in the SE. In the NW Austral Basin and SE Malvinas Basin the Paleocene reaches thicknesses
of up to 1396 m (Figure 8E). The majority of the Austral Basin, the Rio Chico High, and the
western Malvinas Basin show in average 100 m thick U5. Accumulation rates of 1.7
km³/Ma*10‐³ for the Austral Basin and 1.0 km³/Ma*10‐³ in the Malvinas Basin were
calculated (Table 2; Figure 9). For the maximum, decompacted thickness a sedimentation
rate of 173 m/Ma was calculated (Table 3).
11
Eocene (upper Lower Magallanes Formation) (U6)
The Eocene unit (U6) is locally very thin in the basins and thus below seismic resolution.
Similar to the Paleocene, its top reflector is parallel to the overlying and subjacent reflectors,
and almost continuous within the entire study area. It shows in general a high amplitude. On
the Rio Chico High a clear identification of these reflectors is limited due to thinning of the
entire sediment package with a maximum thickness of 300 m. The geometry of U6 (Figure
7G) images sediments 600 m above sea level in the northwest and western area, showing a
deepening to 1300 m depth in the central part of the Austral Basin. The Paleocene at the Rio
Chico High shows a depth of 500 m. In the Malvinas Basin, a NW ‐ SE deepening from 600 m
to more than 3500 m depth in the southern most edge occurs (Figure 7G). A slightly
increased sediment thickness to approx. 1908 m is observed in SW central part of the Austral
Basin. In the Malvinas Basin thickest parts of up to 1000 m are observed in for the south‐
eastern part. In comparison, in the NW part, U6 is thin, with a maximum of thickness of 400
m (Figure 6F). Accumulation rates were calculated with 0.9 km³/Ma*10‐³ in the Austral Basin
and 0.6 km³/Ma*10‐³ in the Malvinas Basin (Table 2; Figure 9). For the maximum,
decompacted thickness a sedimentation rate of 101 m/Ma was calculated (Table 3).
Oligocene (Upper Magallanes Formation) (U7)
The top of the Oligocene unit (U7) is defined by a well‐resolved continuous reflector with
high amplitude. Internal reflectors show partly blank outs. Because of missing well data for
this unit in the western Malvinas Basin and it’s thinning towards the Rio Chico High (less than
50 m), it could not be mapped over the entire study area and is limited to the western and
central part of the Austral Basin (Figure 8G). The U7 depth map shows a depth of 800 m in
the western and north‐western part, while the north shows a depth of 400 m, and in the
south of 900 m (Figure 7H). The deepest parts now occur in the south easternmost edge of
the study area and not in the central part anymore (Figure 7H). The highest sediment
thickness of up to 1044 m occurs in the western part and as non‐uniform deposits in the
south central Austral Basin and thin out to 150 m in the northeast. In the northwest,
southwest and south the U7 partly shows strong thinning to a maximum thickness of less
than 50 m. During Oligocene accumulation rate increased again to 2.79 km³/Ma*10‐³ in the
Austral Basin (Table 2; Figure 9). For the Malvinas Basin no data is available, as done in our
study, Galeazzi et al. (1998) and Baristeas et al. (2012) mapped the Oligocene as part of the
12
Miocene sequence. For the maximum, decompacted thickness a sedimentation rate of 197
m/Ma was calculated (Table 3).
Miocene (Patagonia/Santa Cruz Formation) (U8)
U7 is covered by the Miocene (U8). The top reflector is in most areas not resolved, because
of vertical seismic limit, but this is the uppermost section where continuous reflectors are
not that common as in the previous sections. Mainly, the reflectors show a less strong
amplitude and are partly disturbed. The U8 top depth map reveals 1400 m above sea level in
the western Austral Basin, decreasing to 250 m above sea level in the north and to the east
and deepening to 750 m depth in the south (Figure 7). The structures above sea level, which
are located in the western part of the Austral Basin, show a NE‐SW trend. A constant depth
of 150 m occurs on the Rio Chico High, continuing in the Malvinas Basin in the northern
fringe, while to the south‐easternmost edge deepening to 1750 m occurs (Figure 7I). The
maximum thickness of 800 m occurs in the south‐western and central area of the Austral
Basin, thinning to 200 m in the north and east, continuing on the Rio Chico High, with
minimum values of 30 m (Figure 8H). In the Malvinas Basin U8 thickness in mass to the south
up to 3121 m and decreases to the north, north‐western and north‐eastern fringe, from 250
m, to minimum values of less than 50 m. Sediment accumulation in the Austral Basin was
calculated with 1.16 km³/Ma*10‐³ and in the Malvinas Basin with 1.75 km³/Ma*10‐³, but
here it is likely that Oligocene sediments contribute (Table 2; Figure 9). For the maximum,
decompacted thickness a sedimentation rate of 170 m/Ma was calculated (Table 3).
Plio‐Pleistocene (uppermost parts of Patagonia/Santa Cruz Formation) (U9)
Plio‐Pleistocene (U9) is the uppermost mapped unit in the study area. The interpretation
depends highly on well pick correlation due to limited vertical seismic resolution in the
Austral Basin. Within the western Malvinas Basin, the reflectors are (sub‐) parallel to the
ocean floor. Top depth map reveals deepest Pleistocene of 500 m depth in the eastern and
south‐eastern part of Malvinas Basin (Figure 7J). The south‐western part and the northern
parts show a constant depth of maximum 200 m, continuing on the Rio Chico High and with
an average depth of 100 m in the eastern and central Austral Basin. The western Austral
Basin shows 1500 m above sea level, similar to Miocene and Oligocene, based on well data
interpolation. However the depth map shows that the structures in the western Austral
Basin are not constantly located above sea level but show variations in between. On the
13
western part of the Austral Basin the Plio‐Pleistocene sediments thin out and on lap older
sediments. Highest thickness of 700 m is observed in the southern part of the Austral Basin
and of 1264 m in the south‐eastern part of western Malvinas Basin (Figure 8I). On the Rio
Chico High, the Plio‐Pleistocene shows maximum thickness of only 150 m and remains
constant on the northern part of the Malvinas Basin. Accumulation rates were calculated
with 2.63 km³/Ma*10‐³ for the Austral and 6.09 km³/Ma*10‐³ for the Malvinas Basin (Table
2; Figure 9). For the maximum, decompacted thickness a sedimentation rate of 257 m/Ma
was calculated (Table 3).
2.2 Faults & seismic anomalies
Analysis of the 2D reflection seismic revealed different structures within the Austral Basin,
especially in the north‐western and southern part of the study area. These structures have
been interpreted as: (1) faults, (2) pipes of seismic discontinuity, (3) pipes of seismic
continuity and (4) inclined dykes.
(1) The majority of faults mapped in the study area are found within syn‐rift sediments,
thus are rift‐related and associated to graben and half‐graben structures below the
break‐ up unconformity (Figure 6). Their main trend is NNW‐SSE to NW‐SE and NE‐
SW. Rooted within the basement they are mostly terminating within or at the base
of the Early Cretaceous sediments. A second group of faults is detected in
Cretaceous to early Palaeogene sediments. These faults are mainly rift‐reactivated
growth faults sealed by Tertiary (Neogene) sediments (Figures 6 and 10). A third
group of faults are NW‐SE and NE‐SW orientated and occur in younger sediments
(Magallanes and Santa Cruz Fm.) and can be related to older (growth) fault systems
(Figures 6 and 10). They seem to be coupled to the doming processes of chimney
propagation, distributed over the entire area of the Austral Basin.
(2) Vertical seismic pipes with discontinuity of host rock reflections and internally low
seismic amplitude or wipe outs (Figure 10A) are spatially identified in the northern,
central, and southern part of the Austral Basin. Their height varies between 100 m
and 3000 m. Their width is between 40 and 300 m. Zones of weak and diffuse
reflectivity within these structures are typical. Sometimes two or more of these
14
pipes are laterally connected in depth (Figure 10A). In greater depth the boundaries
between the pipe zones and surrounding host rock is diffuse and in many cases the
structures’ roots cannot be clearly identified. However, the roots are located within
basement or syn‐ or early post‐rift sediments. The structures’ 3D extension is not
resolved due to limitations of the seismic data. Therefore we use satellite images
from the study area showing rounded or slightly elliptic craters at surface exactly
above the positions of the seismic pipes, thus interpreted to represent their surface
exposures (Figure 10B, BB). The surface structures are prominent in the southern
basin area between 46.5° S (latitude of the Chile Triple Junction, CTJ) and 52° S,
found within a total an area of approx. 4500 km² (Corbella et al., 1996), each
covering 0.12 to 0.35 km². As the structures represent the Pali‐Aike Volcanic Field,
we interpreted the seismic pipes to represent the subsurface dykes of these volcanic
events (Figure 3).
(3) Vertical seismic pipes with continuity of host rock reflections occur mainly in the
northern and spatially in the southern study area. They represent vertical structures
rooted at basement or top Early Cretaceous. Their internal structure is characterized
by reflections continuing from the host rock, while they can be of reduced or
increased amplitude (i.e., high‐amplitude anomalies) in some places. The reflections
are internally bending upward and depict sharp, fault‐like offsets along the edges of
the structures, thus resembling tectonic pop‐up structures. Their vertical size of up
to 2.5 s reaches the full height of the sedimentary section. Their width ranges from
almost 6 km in depth to 3‐4 km at surface, where they correlate to doming
elevations identified from satellite images (Figure 10B, BB). Internal faulting is
observed mostly in the lower parts of these pipes (Figure 10B). In some cases, the
intrusions are limited to Late Cretaceous sediments (Palermo Aike Superior Fm.) and
Eocene (Upper Magallanes Fm.) to Miocene, and show a more crater‐like structure
at surface.
(4) Inclined seismic dykes were detected in the fold & thrust belt area in the western
Austral Basin and occur at approx. 600 m to 800 m depth (1.5‐2 s TWT). Contrasting
the seismically weak sedimentary host rock these dykes consist of prominent, high‐
amplitude reflections imaging a fully discordant and inclined geometry. We further
15
observe that syn‐rift‐rooted faults extend up to the inclined dykes. The 3D extension
of the dyke is not resolved because of seismic data limitations.
2.3 1D well backstripping and Tectonic subsidence Based on assigned deep water zones in the Austral Basin (Figure 10; Wilson, 1991; ), which
were used as input parameter for the 1D models of tectonic subsidence, five well groups
were defined, but only four were considered for 1D backstripping (Figure 4): (i) the Late
Jurassic to Mid/Late Cretaceous deep water zone (Group A; Figure 11A); (ii) Late Cretaceous
to Paleogene deep water zone in the central Austral Basin, not affecting the southern tip of
Tierra del Fuego (Group B; Figure 11B); (iii) the former marine platform during Jurassic to
Late Cretaceous/ Paleogene (Group C; Figure 11C), never affected by deep water; (iv) the
Malvinas Basin which had deep‐water conditions mainly during the Late Cretaceous (Group
D, Figure 11D). Times of earliest basin inversion / rock uplift observed from 1D backstripping
are interpolated as presented in Figure 4. The subsidence history can be divided into three
major phases: (1) syn‐ and initial post‐rift phase (Stage I; Figures 12A‐C); (2) basin inversion
and development of the fold & thrust belt; initiating a foreland phase with a migrating fold &
thrust belt (Stage II; Figures 12C‐E); (3) smooth rock uplift, followed by tectonic subsidence,
leading to new rock uplift, deceleration, or even cessation of tectonic subsidence as in the
western Malvinas Basin (Stage III; Figure 11F).
The reconstruction of the tectonic subsidence history from wells located in the previous
Jurassic/ Early Cretaceous deep water locations in the Austral Basin reveals a constant
subsidence during the rifting phase, gradually slowing down similar to the “McKenzie
Model” (McKenzie, 1978; Stage I; Figure 11A). Stage I represents thermal subsidence during
syn‐ rift. Time of deepest burial varies between 90 Ma and 80 Ma. The immediate following
basin inversion, smoothes and decreases since 65 Ma. This marks the beginning of Stage II,
representing the transition from tensional to compressional tectonic regime (Ghiglione et
al., 2010). This caused a rock uplift of 1000‐ 1500 m between deepest burial and today.
Stage III is either dominated by slight subsidence followed by a prominent rock uplift since 7
Ma as indicated in wells 1 and 4, or a rather constant rock uplift since 34 Ma as indicated in
wells 2 and 3.
16
Wells located in the previous Late Cretaceous/ Paleogene deep water zone also indicate
three stages of subsidence (Figure 11B): during Stage I, after constant, flat‐ dipping
subsidence during the rift phase, a short phases of rock uplift is followed by burial occurred
with deepest burial in the Paleogene (Paleocene or Eocene). Again rock uplift occurred since
42 Ma in Stage II. As for the other wells Stage III shows a minor subsidence phase for the
Late Oligocene (25 Ma), but decelerates at around 7 Ma leading to a phase of rock uplift
again. Also here the amount of uplift is approx. 1500 m. However, we observe a clear shift in
timing of subsidence and uplift phases compared to the wells from the Jurassic deep water
zone.
Wells located in the former marine platform area in the northern and northeastern Austral
Basin reflect the three tectonic stages as well (Figure 11C): in stage I a constant subsidence
accompanies the rift phase, followed by smoothing and stabilizing since ca. 70 Ma. During
Stage II a rapid rock uplift occurred in the Late Paleocene (60 Ma), followed by a smoother
and, continuous second phase of rock uplift. This phase heralds the peak of uplift at approx.
23 Ma. The following tectonic subsidence of Stage III ends in a new phase of rock uplift
around 5 Ma a variability of total rock uplift from 50 m to 250 m.
The tectonic subsidence curves reconstructed for the Malvinas Basin reveals tectonic stages
which are, except some variation, very similar to those of the Austral Basin. The
northernmost well (well 14, Figure 11D) shows constant burial since and during the rift
phase (Stage I). It reaches its equilibrium phase (subsidence = sediment accumulation) at 75
Ma, followed by a rock uplift phase between 65 and 33 Ma (Stage II). Here the amount of
rock uplift is approx. 1000 m. Since the Early Oligocene a smooth rock uplift follows, ending
up in a second phase of equilibrium (15 Ma; Stage III). Wells located in the central‐ western
Malvinas Basin show tectonic subsidence during the rifting phase as well (Stage I). The time
of deceleration of basin subsidence is depending on the location, reaching it later in the
southernmost wells (67 Ma for well 13, Figure 11D) than in the northern central wells (90
Ma for, well 14). The following Stage II rock uplift starts at approx. 67 Ma, reaching
maximum uplift of 1500 m in the northernmost well, and approx. 800 m in the southernmost
well.
Wells located on the Rio Chico High (wells 11 and 12) reveal trends of tectonic subsidence
similar to those from the western Austral Basin. Deepest burial was reached in the Late
17
Cretaceous and, followed by constant rock uplift, which smoothed since the Late
Eocene/Oligocene and got nearly constant since the Miocene. One well on the western flank
of the Rio Chico High (well 11; Figure 11D) indicates that it was nearly unaffected by tectonic
subsidence and only minor rock uplift is observed during Early Eocene (50 Ma). This depicts
the character of the Rio Chico High as basement high, with reduced crustal thinning, that
remained elevated during Mesozoic and Cenozoic due to its higher freeboard (Galeazzi,
1998).
3. Discussion
3.1 Sediment distribution and depocenter evolution
Triassic to Jurassic
The syn‐rift phase in the Rocas Verdes Basin (RVB) produced classic graben and half graben
structures (Figures 6, 11A & B), which are orientated parallel to the N‐S opening of the South
Atlantic and the former opening of the Weddell Sea in NNW direction, and are therefore
correlated to these events. In contrast to the RVB, the Malvinas Basin shows a NW‐SE
orientation (Figure 7A), which is most likely related to rotation of neighbouring plates during
separation of South America and Antarctica (Diraison et al., 2000). The syn‐ and early post‐
rift phases due to the breakup of Gondwana are expressed in constant tectonic subsidence
(Stage I) in the back arc RVB and the Malvinas Basin. Because of constant subsidence,
accommodation space was created, which exceeded the accumulation rates of Triassic and
Jurassic sediments during this stage (Table 1 and Figure 9). The result was active deepening
of the basin. Slightly higher accumulation rates occurred in the Malvinas Basin. These
differences in sediment accumulation can be explained by varying onsets of rifting and that
sediment accumulation occurred only in the active basin depocenter. The Malvinas rift phase
was terminated to 168‐ 150 Ma (Galeazzi, 1998), while rifting in the Rocas Verdes Basin due
to the opening of the Weddell Sea was dated to 152 to 142 Ma (Calderón et al., 2007; König
& Jokat, 2006). This is supported by Baristeas et al. (2013), assuming an early break‐up
process between Patagonia, the Antarctic Peninsula, East Antarctica, and the Falkland
Plateau, affecting the Malvinas Basin.
18
Cretaceous
The Early Cretaceous represents a phase of balanced creation of accommodation space and
sediment accumulation until early Late Cretaceous (Stage I). This phase was accompanied
with tectonic subsidence and minor fault activity (Figure 6). Thereby the tectonic regime
changed from extension to compression in the early Late Cretaceous, heralding Stage II as
shown in Figure 11, initiated by increased Atlantic ridge activity, increased subduction along
the Pacific margin, and, finally, crustal shortening (Dalziel, 1981; Ramos, 1989; Fosdick et al.,
2011; Varela et al., 2012).
First, in our study area, the western Austral Basin was affected around 87 Ma (Figures 4,
11A) as indicated by sediment deposition at shallower depth or even above sea level to
growing foothill structures and active thrusting in the Patagonian fold & thrust belt (see also
Wilson, 1991; Fig. 12). Faults of the syn‐rift phase were reactivated and growth upward in
the sediments (Figure 6). Fosdick et al. (2011) have postulated an onset of the compressional
phase using thermochronological data for ~100 Ma for a location north of our study area
(51°30`S). Varela et al. (2012) revealed a compressional regime older than 96 Ma for a study
area close to Tres Lagos (49.5°S) in the north west of our study area. Younger ages (~92 Ma)
were estimated by Fildani et al. (2003) for a fold and thrust belt in the region of the Torres
del Paine National Park and in the Ultima Esperanza Province. Progradation of the
contraction to the east is indicated from wells of the central and eastern parts of the
northern Austral Basin as the timing of basin subsidence deceleration is shifted to younger
times and to the east (Figure 4). Our seismic interpretation proves the deceleration of basin
subsidence and inversion of the RVB latest for Upper Palermo Aike Formation (Figures 7D
and 8D), while backstripping models for the westernmost wells might support even earlier
ages (Figure 4; Figure 11B). However, the eastern Austral Basin was still not affected and
remained stable as indicated by absence of reverse faulting or reactivation of faults.
The relatively low accumulation rates in the Austral Basin and the Malvinas Basin during this
stage (Table 1) can be explained by the long time span of low basin subsidence, the
restriction of accumulation only to the formation of elongated basins in front of the fold &
thrust belt, the northeast progradation of the thrust belt and the basin depo‐centers sub‐
parallel to the rising Andes (Figures 6D, 12C, D).
19
However, onlap geometries of Upper Cretaceous sediments (Upper Palermo Aike) to the
east as well as a deceleration of subsidence in the west, as indicated by decreasing sediment
thicknesses (Figures 8C, D), indicate drastic changes of the main direction of sediment input
from N and E to W latest in the Maastrichtian (see also data by Biddle et al., 1986), depicted
by the Upper Cretaceous unconformity (see also Figure 6A). As a late Eocene age of the
unconformity (~42.5 Ma; Galeazzi, 1998) is as likely as a Late Cretaceous age (Fish, 2005) for
the Malvinas Basin, this further indicates an eastward deceleration of basin subsidence. This
can be explained by the eastward growth of the thrust wedge and the equilibrium between
accumulation and erosion coexisting with sediment load (Figures 9, 11; Naylor & Sinclair,
2008). The accumulation rate exceeded the rate of creation of accommodation space,
leading to a shallower basin and sediment migration to the east. The immediate rock uplift
and the lack of a steady state phase in well locations close to the orogenic belt can be
explained by the absence of new created accommodation space (Naylor & Sinclair, 2008)
maybe accompanied by a sea level drop induced by rock uplift (Baristeas et al., 2013). The
phases of basin inversion within the Austral Basin (Figure 11 A‐C) are assumed as rebound
after slab detachment, including elastic flexure of the down‐bending plate after rupture
(Guillaume et al., 2009). These authors pointed out, that mantle‐lithosphere interaction and
its impact on dynamic topography changes are needed to explain the strong rock uplift
occurring from the Andes to the Atlantic coast. However, it remains unclear if all phases of
rock uplift can be interpreted as rebound, but the eastward progradation of basin inversion
and rock uplift supports this (Figures 4, 11). Thus, the earliest foreland basin phase in the
Austral Basin starts in the Late Cretaceous with an eastward shift of the onset towards the
Paleocene due to migration of basin loads (Figures 4, 11), what is also supported by the work
carried out by i.e. Fosdick et al. (2011) and Varela et al. (2012). In addition, various authors
describe progradating facies changes due to compression resulting in a foreland stage. For
the middle Austral Basin the compressional phase was characterized by Varela et al. (2012)
as fluvial‐ estuarine facies progradation from east to west (middle Cenomanian to lower
Coniacian age (96‐84 Ma)). Sedimentary facies changes in the north of Lake Viedma were
dated by Cánessa et al. (2005) to upper Albian to upper Cenomanian age. In the area of the
Torres del Paine National Park and in the Última Esperanza Province, the compressional
phase marks sedimentary changes from a shelf marine facies to a deep marine facies
(Wilson, 1991; Fildani et al., 2003; Fildani & Hessler, 2005; see Fig. 5), and was dated on
20
approx. 92 Ma (Fildani et al., 2003). New data from Fosdick et al. (2011) revealed ages of
approx. 100 Ma.
As the data sets of Varela et al. (2012) and Fosdick et al. (2011) both indicate onset of
compression being simultaneously around 100 Ma, our data set clearly demonstrates
rejuvenation of the contractional influence to the east.
Paleocene and Eocene
The beginning of the early Cenozoic is marked by on‐going rise of the Andes, changes in the
convergence rates of the Nazca relative to the South American plate (Thomson et al., 2001;
Figure 1), and a shift in the Farallón plate convergence direction toward the north
accompanied by an increase in its convergence rate (Ghiglione & Ramos, 2005). During the
early Paleocene the plate rearrangements led to transpressive E‐W deformation in the
Austral Basin (Robbiano et al., 1996). Associated features in the Austral Basin are a
progradation of the basin’s depo‐centers from west to east (Figure 8F), a relatively high
sedimentation rate coupled with enduring thermal subsidence (Figures 8F‐H) and phases of
regression (Figure 9; Haq et al., 1987). The following low Eocene sedimentation rate (Figure
9) is a consequence of the basin inversion of the Cretaceous basin to a Palaeocene‐Eocene
unconformity in the foreland basin. Associated are progradating depocenters from west to
east (Figure 8). Biddle et al. (1986) related the asymmetric thickening of the Paleocene to
Eocene strata towards the west to crustal shortening, eastward migration of the fold &
thrust belt and the Neogene Andean rock uplift. Up to the Paleocene, the Austral Basin
catched the majority of sediments coming from the Andes, but due to a new forming
extensional regime in the Malvinas Basin, sediment was now also significantly transported
and deposited into the Malvinas Basin (Figure 8; Baristeas et al., 2013). This new setting is
likely related to the opening of the Drake Passage (Ghiglione et al., 2010; Baristeas et al.,
2013), incremental creation of accommodation space, and the progressively northward
migration of the Fuegian fold & thrust belt (Tassone et al., 2008). During the Late Eocene the
tectonic regime changed to compression (Ghiglione et al., 2010), as supported by our rock
uplift phases starting at the end of the Eocene (Figure 11).
21
Oligocene
The Oligocene marks the beginning of Stage III and shows variable patterns of rock uplift and
subsidence in the backstripping models (Figure 11). This is still related to low
accommodation space and ongoing changes in the tectonic system, now being wrench
deforming in the Malvinas Basin and compressional in the Austral Basin (Ghiglione et al.,
2010). The subduction direction of Nazca plate relative to South America plate was now
more perpendicular to the continent (Quinteros & Sobolev, 2012), accompanied by
increasing topographic/ rock uplift in the Andes, known as Quechua phase (Thomson et al.,
2001). Results are volcanic fields as identified in the seismic (Figure 10), rock uplift as shown
in Figure 11 and deformation of Patagonian fold & thrust belt (Ghiglione et al., 2010). As a
consequence of the compressional setting, depocenters were deposited in NE‐SW direction
parallel to the prograding fold & thrust belt (Figure 8). Since the Late Oligocene/Miocene,
phases of subsidence reflect the cessation of progradation of the fold & thrust belt and the
development of a passive depo‐center (Figure 8; Carbonell et al., 2008).
Miocene
The transition between Oligocene and Miocene is marked by a phase of E‐W transpressive
deformation, massively influenced by the Chile ridge‐Chile trench collision in the western
part of Tierra del Fuego approx. 14 Ma ago (Cande & Leslie, 1986). Due to this collision
Andes uplift and the deformation of the Patagonian fold & thrust belt was still going on
(Ramos, 1989), thus limiting the accomodation space in the Austral Basin and only minor
accumulation took place in the central part and the south (Figure 8). Latest since the
Miocene (not calculable for Oligocene), sediment accumulation in the Malvinas Basin
exceeded those of the Austral Basin (Figures 8H, 9; Table 2), showing that the
accommodation space in the Malvinas Basin remained high (Figure 8) and an additional
major sediment source established from the south: the Fuegian Andes and the rising Fuegian
fold‐ thrust‐belt (Galeazzi, 1998; Baristeas et al., 2013).
The observed seismic pipes in the Austral Basin are likely a consequence of transtensional
tectonics along the South American and Scotian plates and associated strike‐slip faults of
NW‐SE direction, resulting in the Magallanes Strait rift system. This Pali Aike volcanic field
displays eruptions along ENE‐WSW and NW‐SE fault systems (D`Orazio et al., 2000).
22
Pliocene to present day
The latest stages of rock uplift at around 5 Ma (Figure 11) depict the time‐lag influence of
changes in the stress field due to on‐going, oblique convergence of the collision between the
Chile ridge and the Chile trench, finally resulting in the subduction of the Chile trench and
the opening of an asthenospheric window cancelling the downward mantle motion of the
South American plate (Guillaume et al., 2009). Despite this tectonic causes for rock uplift
phases, the influence of glaciation and deglaciation processes (Ramos, 2005) in the
Patagonian Cordillera since the Late Miocene might play a role, but were not taken into
account in our models.
Northward migration of the subduction and collision zone associated with prograding slab
window (D`Orazio et al., 2000; Kay et al., 2004; Aragón et al., 2013) are expressed at the
locality Pali Aike (Bruni et al., 2008), in the northern Condor Cliff area (Bruni et al., 2008) and
the Camusú Aike Volcanic Field (Figure 2; Bruni et al., 2008) and supports the idea of mainly
magmatic induced seismic pipes detected in the seismic lines (Figure 10). Further, magmatic
activities are supposed as result of steepening of a formally shallow subduction zone and
thermal anomalies (Kay et al., 2004). However, based on literature information, most of our
identified seismic pipes seem to be related to magmatic activity, but some of them might
have another origin, i.e. fluid injection or fluid flowpaths, but this cannot be solved in this
context.
Post Miocene sequences show highest sediment accumulations in the Malvinas Basin as
indicated by thick progradational sequences which are associated to ongoing northward
movement of the Fuegian Andes as the primary sediment source (Figure 8I; Figure 9; Table
1). The Austral Basin could not accumulate significant sediments anymore, thus it is highly
likely that the sediments were further transported into the Malvinas Basin.
23
4. Conclusions
A seismic interpretation study was used to compare the tectono‐stratigraphic evolution of the large
Austral Basin, the Rio Chico High, and the western Malvinas Basin. The study’s results demonstrate
that the development of the two neighbouring basin systems was decoupled by the basement high
over a long period of time. Seismic analysis, calculated accumulation rates, and 1D backstripping
clearly demonstrate the importance of the Andes orogenesis and its far‐field stresses on the Austral
Basin, with only minor impacts on the Malvinas Basin. Tectonics impacts from the opening of the
South Atlantic were not detected in the Austral Basin, but in the Malvinas Basin. The present study
supports results from previous studies, but also demonstrates how the development of sediment
thickness distribution and sediment geometries within the basins is related to impacts of the Andes
orogenesis. Based on our backstripping approach of basin evolution we conclude and support the
idea that three main stages occurred. These stages show an eastward deceleration from the Austral
Basin to the Malvinas Basin. In contrast to the temporal offsets of tectonic impacts in the Austral
Basin, the tectonic deformation in the Malvinas Basin is decoupled by the Rio Chico High and can be
linked to process related to the opening of the South Atlantic.
The three main stages of basin evolution are:
1. Stage I represents the synrift phase of the Rocas Verdes Basin accompanied with NNW‐SSE to NW‐
SE and NE‐SW faulting related to the opening of the Weddell Sea, indicating features from the South
Atlantic opening in the Malvinas Basin. Large sediment input into the rift graben structures in the
Rocas Verdes Basin caused initial basin subsidence.
2. Stage II was initiated by Andes uplift since at least the Turonian in the study area. It is
characterized by rock and topographic uplift, eastward progradation of the Patagonian fold & thrust
belt, high sedimentation rates, decrease of accommodation space, and reorganization of the basins’
depo‐centres and structures. Since the end of Stage II (Eocene), plate reconfigurations were
accompanied with magmatism in the Austral Basin, as indicated by magmatic pipes detected in the
study area.
3. Stage III represents a phase after cessation of the approximately eastward Patagonian fold &
thrust belt migration. Significant changes in sediment accommodation occurred due to
reorganization in the stress field to a transpressional tectonic system that started in the Oligocene, a
bidirectional sediment source, and finally sediment overfills in the Austral Basin. The sediment
accumulation in the Malvinas Basin exceeds that of the Austral Basin at least since the Miocene. This
indicates the Fuegian fold & thrust belt as a new, dominating sediment source.
24
5. Acknowledgments
This study is funded by the German Research Foundation (DFG) within the priority program SPP 1375
‐ SAMPLE. We thank editor S. Castelltort and reviewers U. A. Glasmacher, A. Bilmes and an unknown
reviewer for helpful comments and suggestions that highly improved our manuscript. Petrobras
Argentina S.A. is thanked for providing the seismic profiles, well data, and allowing publication.
6. References
ARAGÓN, E., PINOTTI, L., D` ERAMO, F., CASTRO, A., RABBIA, O., CONIGLIO, J., DEMARTIS,
M., HERNANDO, I., CAVAROZZI, C.E., AGUILERA, Y.E. (2013) The Farallon‐Aluk ridge collision
with South America: Implications for the geochemical changes of slab window magmas from
fore‐ to back‐arc. Geoscience Frontiers, http://dx.doi.org/10.1016/j.gsf.2012.12.004.
BARISTEAS, N., ANKA, Z., DI PRIMIO, R., RODRIGUEZ, J.F., MARCHAL, D., DOMINGUEZ, F.
(2012) Distribution and hydrocarbon leakage indicators in the Malvinas Basin, offshore
Argentine continental margin. Marine Geology, 332‐334, 56‐74.
BARISTEAS, N., ANKA, Z., DI PRIMIO, R., RODRIGUEZ, J.F., MARCHAL, D., DOMINGUEZ, F.
(2013) New insights into the Seismo‐Stratigraphic and Structural evolution of the Malvinas
Basin, offshore the southernmost South American Atlantic margin. Tectonophysics, EDOC:
20852 | 10.1016/j.tecto.2013.06.009 |
BIDDLE, K.T., ULIANA, M.A., MITCHUM JR., R.M., FITZGERALD, M.G., WRIGHT, R.C. (1986)
The stratigraphy and structural evolution of the central and eastern Magallanes Basin,
southern South America. International Association of Sedimentologists, Special Publication,
8, 41‐61.
BOND, G.C. & KOMINZ, M.A. (1984) Construction of tectonic subsidence curves for the early
Paleozoic miogeocline, southern Canadian Rocky Mountains; implications for subsidence
mechanisms, age of breakup, and crustal thinning. Geological Society of America Bulletin, 95,
(2), 155–173.
BRUNI, S., D`ORAZIO, M., HALLER, M.J., INNOCENTI, F., MANETTI, P., PÉCSKAY, Z., TONARINI,
S. (2008) Time‐evolution of magma sources in a continental back‐arc setting: the Cenozoic
25
basalts from Sierra de San Bernardo (Patagonia, Chubut, Argentina). Geological Magazine,
145, 5, 714‐732.
CALDERÓN, M., FILDANI, A., HERVÉ, F., FANNING, C. M., WEISLOGEL, A., CORDANI, U. (2007)
Late Jurassic bimodal magmatism in the northern sea‐floor remnant of the Rocas Verdes
basin, southern Patagonian Andes. Journal of the Geological Society, 164, 1011‐1022.
CANDE, S.C. & LESLIE, R.N. (1986) Late Cenozoic tectonics of the Southern Chile Trench.
Journal of Geophysical Research, 91, 471‐496.
CÁNESSA, N.D., POIRÉ, D.G. & DOYLE, P. 2005. Estratigrafía de las unidades Cretácicas de la
margen Norte del Lago Viedma, entre el Cerro Pirámides y la estancia Santa Margarita,
provincia de Santa Cruz, República Argentina. Congreso Geológico Argentino, No. 16. Actas
del CD‐ROM Artículo 366, 8 p. La Plata.
CARBONELL, P.J., OLIVERO, E.B. & DIMIERI, L.V. (2008) Structure and evolution of the
Fuegian Andes foreland thrust‐fold belt, Tierra del Fuego, Argentina: Paleogeographic
implications. Journal of South American Earth Sciences, 25, 417‐439.
CORBELLA, H., CHELOTTI, L. & POMPOSIELLO, C. (1996) Neotectonica del rift Jurasico austral
en Pali Aike, Patagonia Extrandina, Santa Cruz, Argentina. XIII Congreso Geológico Argentino
y III Congreso de Exploración de Hidrocarburos, Actas, II, 383–393.
DALZIEL, I.W.D. (1981) Back‐Arc Extension in the Southern Andes: A Review and Critical
Reappraisal. Phil. Trans. R. Soc. Lond., A 300, 319‐335.
DIRAISON, M., COBBOLD, P.R., GAPAIS, D., ROSSELLO, E.A., LE CORRE, C. (2000) Cenozoic
crustal thickening, wrenching and rifting in the foothills of the southernmost Andes.
Tectonophysics, 316, 91‐119.
D`ORAZIO, M., AGOSTINI, S., MAZZARINI, F., INNOCENTI, F., MANETTI, P., HALLER, M.J.,
LAHSEN, A. (2000) The Pali Aike Volcanic Field, Patagonia: slab‐window magmatism near the
tip of South America. Tectonophysics, 321, 407‐427.
FILDANI, A., COPE, T.D., GRAHAM, S.A., WOODEN, J.L. (2003) Initiation of the Magallanes
foreland basin: Timing of the southernmost Patagonian Andes orogeny revised by detrital
zircon provenance analysis. Geology, 31, 1081‐ 1084.
26
FILDANI, A., ROMANS, B.W., FOSDICK, J.C., CRANE, W.H., HUBBARD, S.M. (2008) Orogenesis
of the Patagonian Andes as reflected by basin evolution in southernmost South America. In:
Ores and orogenesis: Circum‐Pacific tectonics, geologic evolution, and ore deposits. (Ed. by
J.E. Spencer and S.R. Titley), Arizona Geological Society Digest, 22, 259‐268.
FILDANI, A. & HESSLER, A.M. 2005. Stratigraphic record across a retroarc basin inversion:
Rocas Verdes‐Magallanes Basin, Patagonian Andes, Chile. Geological Society of America
Bulletin, 117, 1596‐1614.
FISH, P. (2005) Frontier South, East Falkland basins reveal important exploration potential.
Oil and Gas Journal, 103, 34–40.
FOSDICK, J.C., ROMANS, B.W., FILDANI, A., BERNHARDT, A., CALDERÓN, M., GRAHAM, S.A.
(2011) Kinematic evolution of the Patagonian retroarc fold‐and‐thrust belt and Magallanes
foreland basin, Chile and Argentina, 51°30′S. Geological Society of America Bulletin, 123(9‐
10), 1679–1698.
FRANZESE, J., SPALLETTI, L., GÓMEZ PÉREZ, I., MACDONALD, D. (2003) Tectonic and
paleoenvironmental evolution of Mesozoic sedimentary basins along the Andean foothills of
Argentina (32°–54°S). Journal of Earth Sciences, 16, 81‐90.
GALEAZZI, J.S. (1998) Structural and Stratigraphic Evolution of the Western Malvinas Basin,
Argentina. AAPG Bulletin, 82, 4, 596‐636.
GHIGLIONE, M.C., 2002. Diques clásticos asociados a deformación transcurrente en
depósitos sinorogénicos del Mioceno inferior de la Cuenca Austral. Revista de la Asociación
Geológica Argentina, 77, 2, 103‐118.
GHIGLIONE, M.C. & RAMOS, V.A. (2005) Progression of deformation and sedimentation in
the southernmost Andes. Tectonophysics, 405, 25‐46.
GHIGLIONE, M.C., SUAREZ, F., AMBROSIO, A., DA POIAN, G., CRISTALLINI, E.O., PIZZIO, M.F.,
REINOSO, R.M. (2009) Structure and evolution of the Austral Basin fold‐thrust belt, southern
Patagonian Andes. Revista de la Asociación Geológica Argentina, 65,1, 215‐226.
GHIGLIONE, M.C., QUINTEROS, J., YAGUPSKY, D., BONILLO‐MARTÍNEZ, P., HLEBSZEVTICH, J.,
RAMOS, V.A., VERGANI, G., FIGUEROA, D., QUESADA, S., ZAPATA, T. (2010) Structure and
27
tectonic history of the foreland basins of southernmost South America. Journal of South
American Earth Sciences, 29, 262‐277.
GUILLAUME, B., MARTINOD, J., HUSSON, L., RODDAZ, M., RIQUELME, R. (2009) Neogene
uplift of central eastern Patagonia: Dynamic response to active spreading ridge subduction?
Tectonics, 28, doi:10.1029/ 2008TC002324.
HANTSCHEL, TH. & KAUERAUF, A.I. (2009) Pore Pressure, Compaction and Tectonics: Event‐
Stepping. In: Fundamentals of Basin and Petroleum System Modeling (Ed. by T. Hantschel
and A.I. Kauerauf). Springer Berlin Heidelberg, p.467.
HAQ, B.U., HARDENBOL, J., & VAIL, P.R. (1987) Chronology of fluctuating sea levels since the
Triassic. Science, 235, 1156‐1166.
HUBBARD, S.M., ROMANS, B.W. & GRAHAM, S.A. (2007) An outcrop example of large‐scale
conglomeratic intrusions sourced from deep‐water channel deposits, Cerro Toro Formation,
Magallanes basin, southern Chile, In: Sand injectites: Implications for hydrocarbon
exploration and production (Ed. by A. Hurst and J. Cartwright), AAPG Memoir, 87, 199 – 207.
KAY, S.M., GORRING, M., & RAMOS, V.A. (2004) Magmatic sources, setting and causes of
Eocene to Recent Patagonian plateau magmatism (36°S to 52°S latitude). Revista de la
Asociación Geológica Argentina, 59, 4, 556‐568.
KÖNIG, M. & JOKAT, W. (2006) The Mesozoic breakup of the Weddell Sea. Journal of
Geophysical Research, 111, B12102.
LUDWIG, W.J., EWING, J.I. & EWING, M. (1968) Structure of Argentine continental margin.
AAPG Bulletin, 52, 2337‐2368.
MCKENZIE, D. (1978) Some remarks on the development of sedimentary basins. Earth and
Planetary Science Letters, 40 (1), 25–32.
NAYLOR, M. & SINCLAIR, H.D. (2008) Pro‐ vs. retro‐foreland basins. Basin Research, 20, 3,
285‐303.
OLIVERO, E.B. & MARTINIONI, D.R. (2001) A review of the geology of the Fuegian Andes.
Journal of South American Earth Sciences, 14, 175‐188.
28
OLIVERO, E.B. & MALUMIÁN, D.R. (2008) Mesozoic‐Cenozoic stratigraphy of the Fuegian
Andes, Argentina. Geologica Acta, 6, 1, 5‐18.
PÉREZ PANERA, J.P. (2012) Nanofósiles calcáreous y bioestratigrafía del Cretácico del
sudeste de la cuenca Austral, Patagonia, Argentina. Ameghiniana, 49, 2, 137‐ 163.
PITTION, J.L., & GOUADAIN, J. (1992) Source rocks and oil generation in the Austral basin.
1991. World Petroleum Congress. 13th World Petroleum Congress, October 20 ‐ 25, 1991,
Buenos Aires, Brazil.
QUINTEROS, J. & SOBOLEV, S.V. (2012) Why has the Nazca plate slowed since the Neogene?
GEOLOGY, G33497.1, doi:10.1130/G33497.1.
RAMOS, V.A. (1989) Andean foothills structures in Northern Magallanes Basin, Argentina.
American Association of Petroleum Geologists, 73, 887‐903.
RAMOS, V.A. & KAY, S.M. (1992) Southern Patagonian plateau basalts and deformation:
backarc testimony of ridge collisions. Tectonophysics, 205, 261‐282.
RAMOS, V.A. (2005) Seismic ridge subduction and topography: Foreland deformation in the
Patagonian Andes. Tectonophysics, 399, 73‐86.
RICHIANO, S., VARELA, A. , CERECEDA, A., & POIRÉ, D. G. (2012) Evolución Paleoambiental
de la Formación Río Mayer, Cretácico Inferior, Cuenca Austral, Provincia de Santa Cruz,
Argentina. Latin American Journal of Sedimentology and Basin Analysis, 19, 1, 3–26.
ROBBIANO, J.A., ARBE, H. & GANGUI, A. (1996) Cuenca Austral Marina. In: Geología y
Recursos Naturales de la Plataforma Continental Argentina (Ed. by V.A. Ramos and M.A.
Turic). Congreso Geológico Argentino, No. 13 y Congreso de Exploración de Hidrocarburos,
No. 3, Relatorio 17, 323‐341. Buenos Aires.
RODRIGUEZ, J.F., MILLER, M. & CAGNOLATTI, M.J. (2008) Sistemas Petroleros de Cuenca
Austral, Argentina y Chile. In: Simposio: “Sistemas Petroleros de las Cuencas Andinas (Eds: C.
E. Cruz, J. F. Rodríguez, J. J. Hechem and H. J. Villar). Instituto Argentino del Petróleo y del
Gas. Talleres Trama S.A., Buenos Aires, 1‐31.
29
ROMANS, B.W., FILDANI, A., GRAHAM, S.A., HUBBARD, S.M., COVAULT, J.A. (2010).
Importance of predecessor basin history on sedimentary fill of a retroarc foreland basin:
provenance analysis of the Cretaceous Magallanes basin, Chile (50‐52°S). Basin Research,
22(5), 640–658.
ROSSELLO, E.A., HARING, C.E., CARDINALI, G., SUÁREZ, F., LAFFITTE, G.A., NEVISTIC, A.V.
(2008) Hydrocarbons and petroleum geology of Tierra del Fuego, Argentina. Geologica Acta,
6, 1, 69‐83.
TASSONE, A., LODOLO, E., MENICHETTI, M., YAGUPSKY, D., CAFFAU, M., VILAS, J.F., (2008)
Seismostratigraphic and structural setting of the Malvinas Basin and its southern margin
(Tierra del Fuego Atlantic offshore). Geologica Acta, 6, 1, 55‐67.
THOMSON, S.N., HERVÉ, F. & STÖCKHERT, B. (2001) Mesozoic‐Cenozoic denudation history
of the Patagonian Andes (southern Chile) and its correlation to different subduction
processes. Tectonics, 20, 693–711.
VARELA, A.N., POIRÉ, D.G., MARTIN, T., GERDES, A., GOIN, F.J., GELFO, J.N., HOFFMANN, S.
(2012) U‐Pb zircon constraints on the age of the Cretaceous Mata Amarilla Formation,
Southern Patagonia, Argentina: its relationship with the evolution of the Austral Basin.
Andean Geology, 39, 3, 359–379.
WATTS, A.B. & RYAN, W.B.F. (1976) Flexure of the lithosphere and continetal margin basins.
Tectonophysics, 36, 24‐44.
WILSON, T.J. (1991) Transition from back‐arc to foreland basin development in
southernmost Andes: Stratigraphic record from the Ultima Esperanza District, Chile.
Geological Society of America Bulletin, 103, 98–111.
ZAMBRANO, J.J. & URIEN, C.M. (1970) Geological outlines of the basins in southern
Argentina and their offshore extension. Journal of Geophysical Research, 75, 1363–1396.
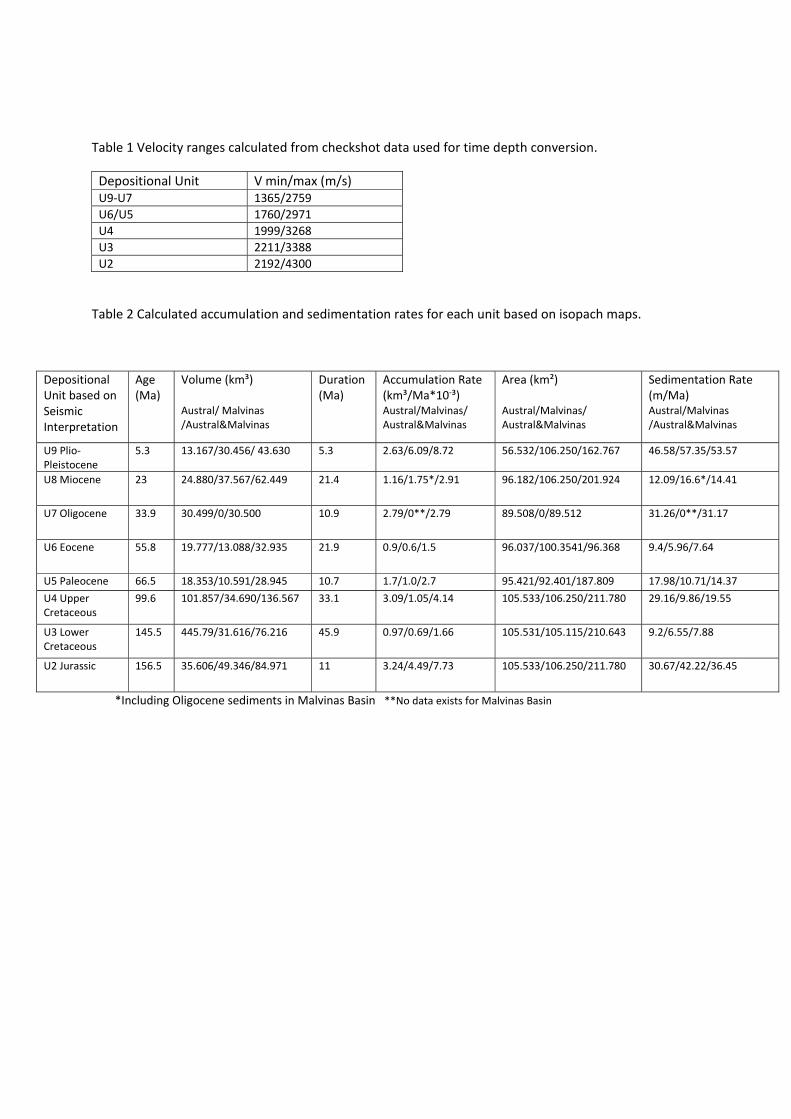
Table 1 Velocity ranges calculated from checkshot data used for time depth conversion.
Depositional Unit V min/max (m/s) U9‐U7 1365/2759
U6/U5 1760/2971
U4 1999/3268
U3 2211/3388
U2 2192/4300
Table 2 Calculated accumulation and sedimentation rates for each unit based on isopach maps.
Depositional Unit based on Seismic Interpretation
Age (Ma)
Volume (km³) Austral/ Malvinas /Austral&Malvinas
Duration (Ma)
Accumulation Rate (km³/Ma*10‐³) Austral/Malvinas/ Austral&Malvinas
Area (km²) Austral/Malvinas/ Austral&Malvinas
Sedimentation Rate (m/Ma) Austral/Malvinas /Austral&Malvinas
U9 Plio‐ Pleistocene
5.3 13.167/30.456/ 43.630 5.3 2.63/6.09/8.72 56.532/106.250/162.767 46.58/57.35/53.57
U8 Miocene 23 24.880/37.567/62.449 21.4 1.16/1.75*/2.91 96.182/106.250/201.924 12.09/16.6*/14.41
U7 Oligocene 33.9 30.499/0/30.500 10.9 2.79/0**/2.79 89.508/0/89.512 31.26/0**/31.17
U6 Eocene 55.8 19.777/13.088/32.935 21.9 0.9/0.6/1.5 96.037/100.3541/96.368 9.4/5.96/7.64
U5 Paleocene 66.5 18.353/10.591/28.945 10.7 1.7/1.0/2.7 95.421/92.401/187.809 17.98/10.71/14.37
U4 Upper Cretaceous
99.6 101.857/34.690/136.567 33.1 3.09/1.05/4.14 105.533/106.250/211.780 29.16/9.86/19.55
U3 Lower Cretaceous
145.5 445.79/31.616/76.216 45.9 0.97/0.69/1.66 105.531/105.115/210.643 9.2/6.55/7.88
U2 Jurassic 156.5 35.606/49.346/84.971 11 3.24/4.49/7.73 105.533/106.250/211.780 30.67/42.22/36.45
*Including Oligocene sediments in Malvinas Basin **No data exists for Malvinas Basin
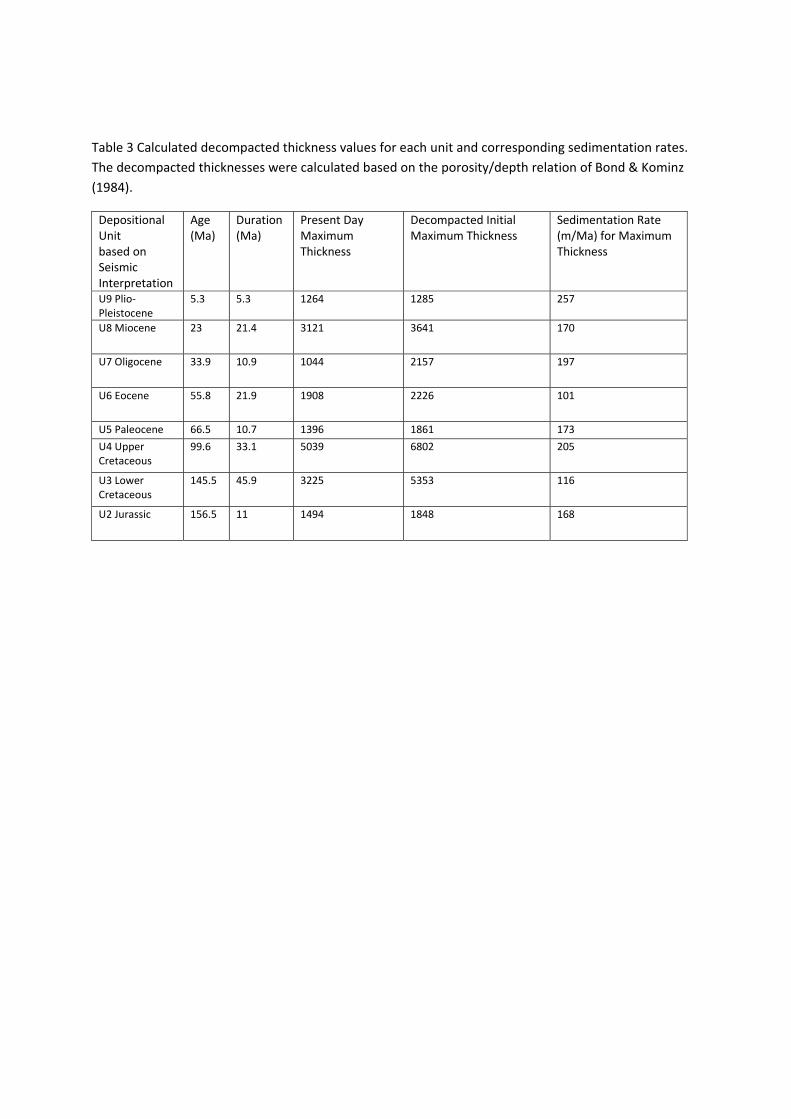
Table 3 Calculated decompacted thickness values for each unit and corresponding sedimentation rates.
The decompacted thicknesses were calculated based on the porosity/depth relation of Bond & Kominz
(1984).
Depositional Unit based on Seismic Interpretation
Age (Ma)
Duration (Ma)
Present Day Maximum Thickness
Decompacted Initial Maximum Thickness
Sedimentation Rate (m/Ma) for Maximum Thickness
U9 Plio‐ Pleistocene
5.3 5.3 1264 1285 257
U8 Miocene 23 21.4 3121 3641 170
U7 Oligocene 33.9 10.9 1044 2157 197
U6 Eocene 55.8 21.9 1908 2226 101
U5 Paleocene 66.5 10.7 1396 1861 173
U4 Upper Cretaceous
99.6 33.1 5039 6802 205
U3 Lower Cretaceous
145.5 45.9 3225 5353 116
U2 Jurassic 156.5 11 1494 1848 168
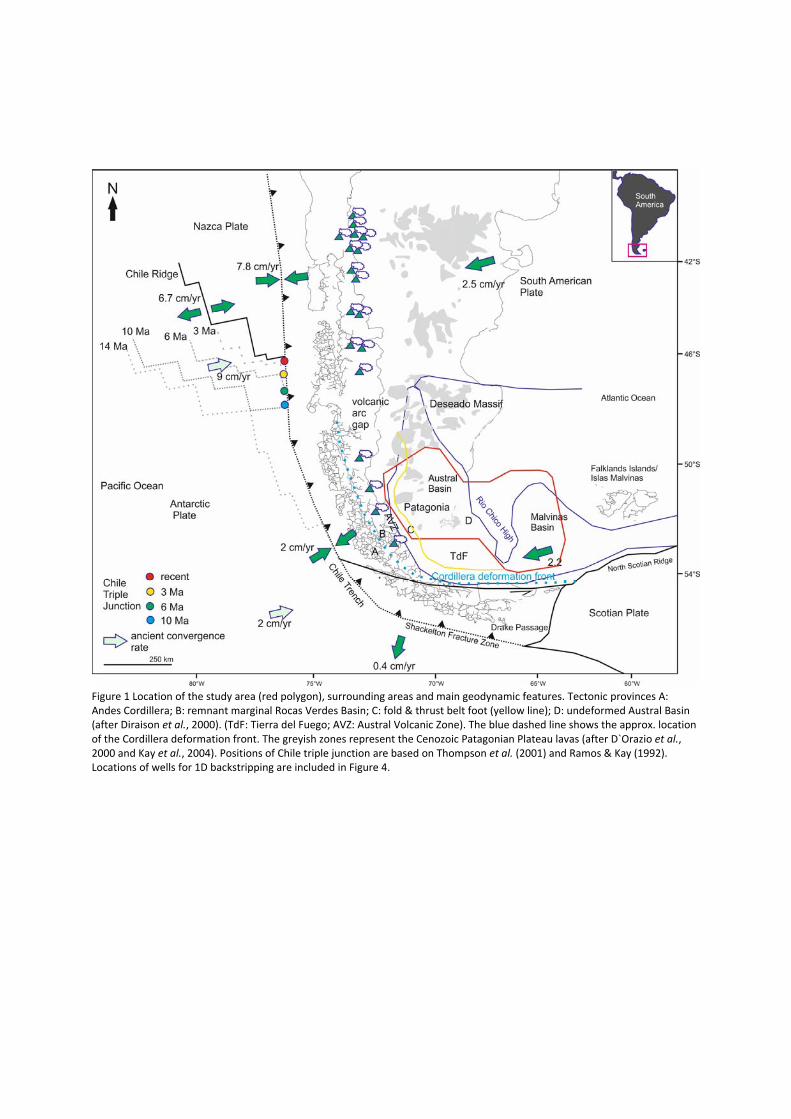
Figure 1 Location of the study area (red polygon), surrounding areas and main geodynamic features. Tectonic provinces A: Andes Cordillera; B: remnant marginal Rocas Verdes Basin; C: fold & thrust belt foot (yellow line); D: undeformed Austral Basin (after Diraison et al., 2000). (TdF: Tierra del Fuego; AVZ: Austral Volcanic Zone). The blue dashed line shows the approx. location of the Cordillera deformation front. The greyish zones represent the Cenozoic Patagonian Plateau lavas (after D`Orazio et al., 2000 and Kay et al., 2004). Positions of Chile triple junction are based on Thompson et al. (2001) and Ramos & Kay (1992). Locations of wells for 1D backstripping are included in Figure 4.
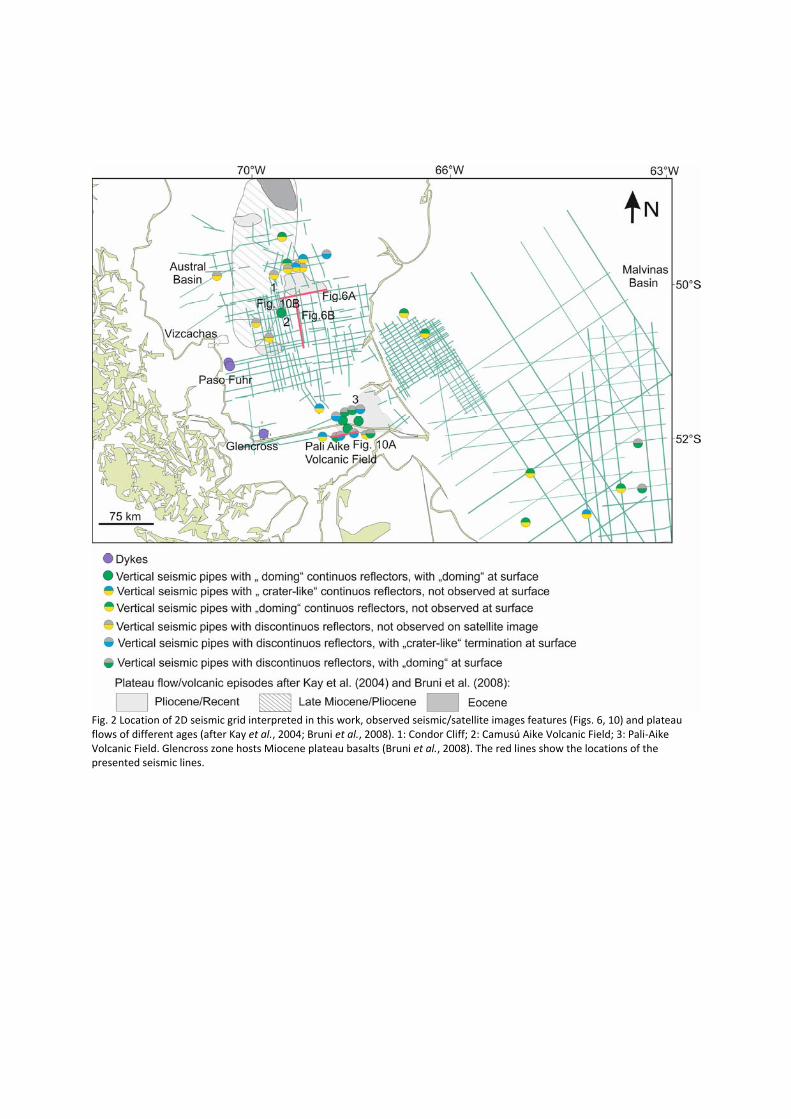
Fig. 2 Location of 2D seismic grid interpreted in this work, observed seismic/satellite images features (Figs. 6, 10) and plateau flows of different ages (after Kay et al., 2004; Bruni et al., 2008). 1: Condor Cliff; 2: Camusú Aike Volcanic Field; 3: Pali‐Aike Volcanic Field. Glencross zone hosts Miocene plateau basalts (Bruni et al., 2008). The red lines show the locations of the presented seismic lines.
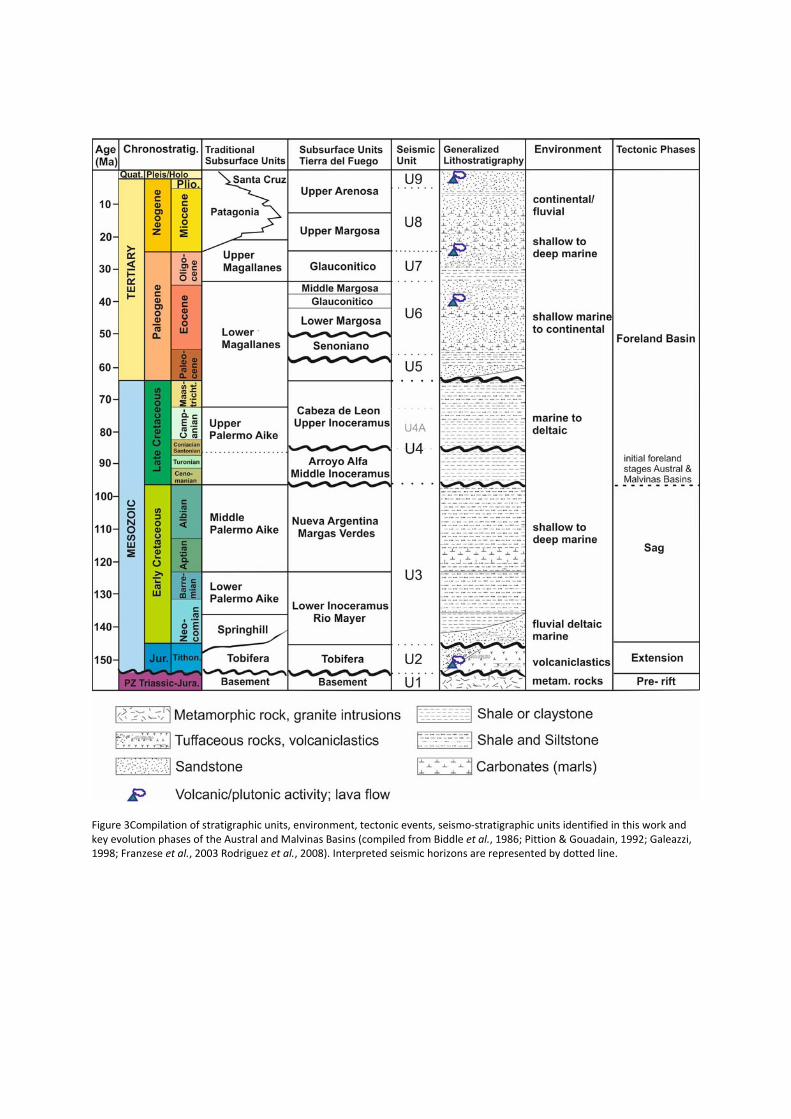
Figure 3Compilation of stratigraphic units, environment, tectonic events, seismo‐stratigraphic units identified in this work and key evolution phases of the Austral and Malvinas Basins (compiled from Biddle et al., 1986; Pittion & Gouadain, 1992; Galeazzi, 1998; Franzese et al., 2003 Rodriguez et al., 2008). Interpreted seismic horizons are represented by dotted line.
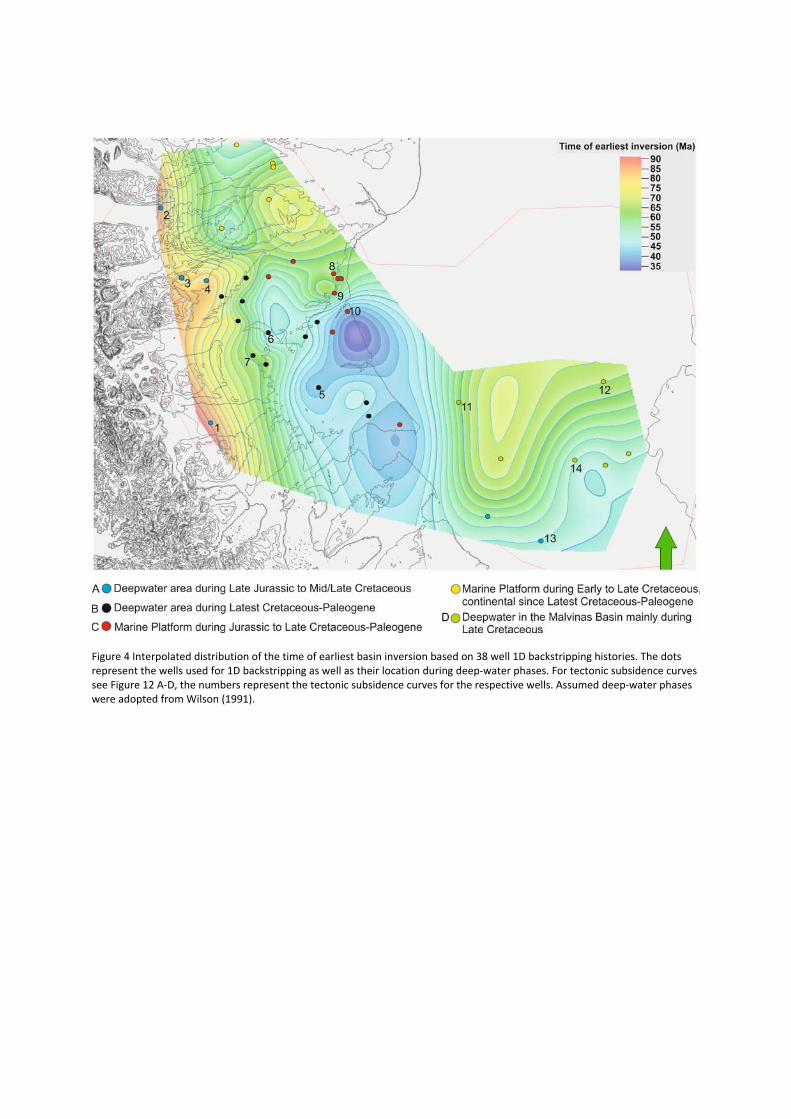
Figure 4 Interpolated distribution of the time of earliest basin inversion based on 38 well 1D backstripping histories. The dots represent the wells used for 1D backstripping as well as their location during deep‐water phases. For tectonic subsidence curves see Figure 12 A‐D, the numbers represent the tectonic subsidence curves for the respective wells. Assumed deep‐water phases were adopted from Wilson (1991).
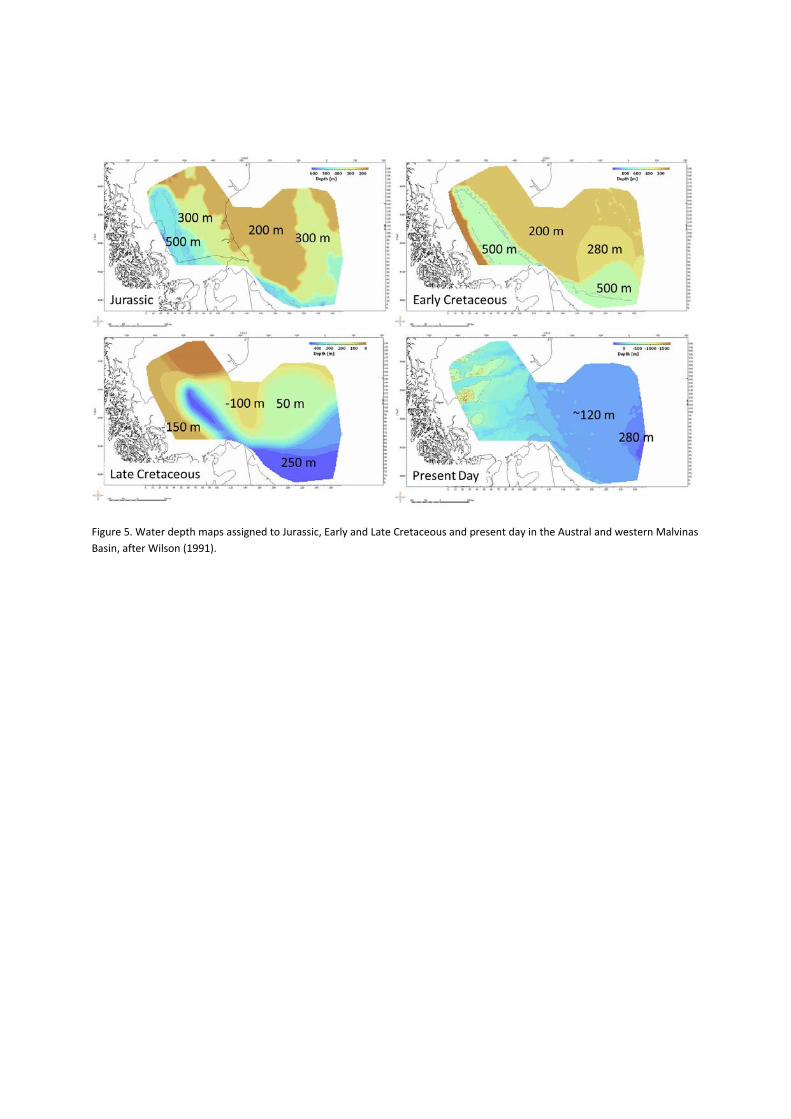
Figure 5. Water depth maps assigned to Jurassic, Early and Late Cretaceous and present day in the Austral and western Malvinas
Basin, after Wilson (1991).
A
B
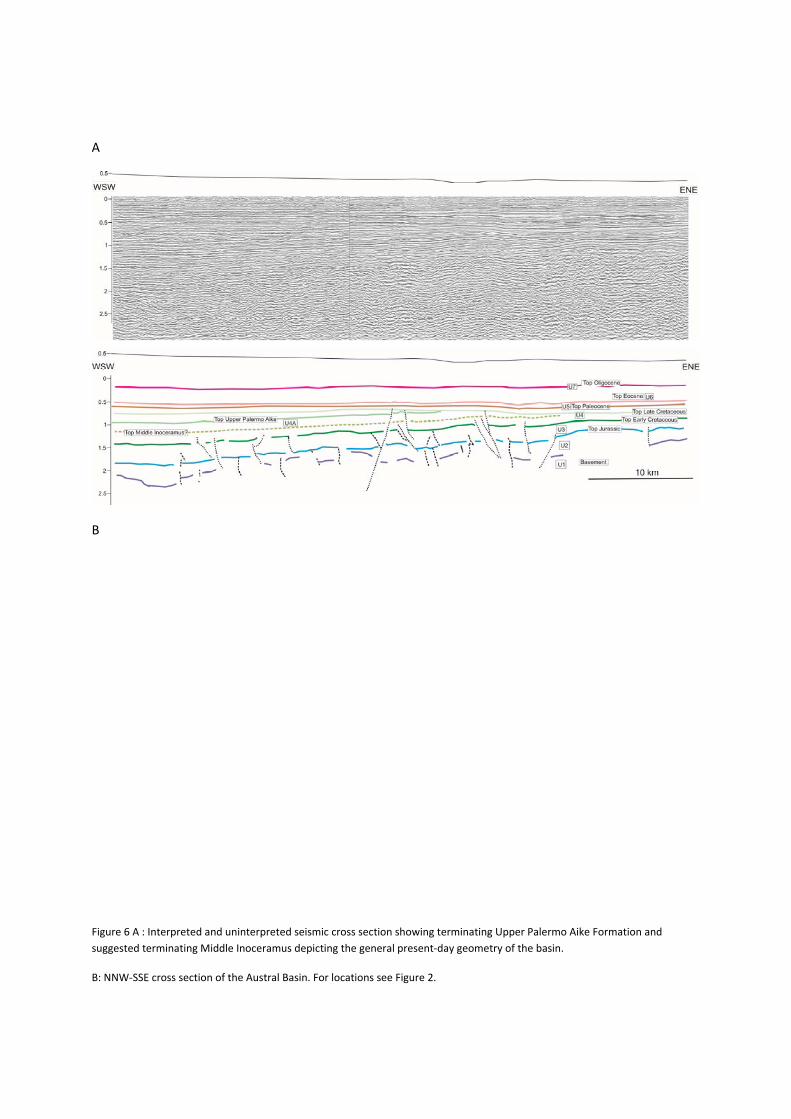
Figure 6 A : Interpreted and uninterpreted seismic cross section showing terminating Upper Palermo Aike Formation and
suggested terminating Middle Inoceramus depicting the general present‐day geometry of the basin.
B: NNW‐SSE cross section of the Austral Basin. For locations see Figure 2.
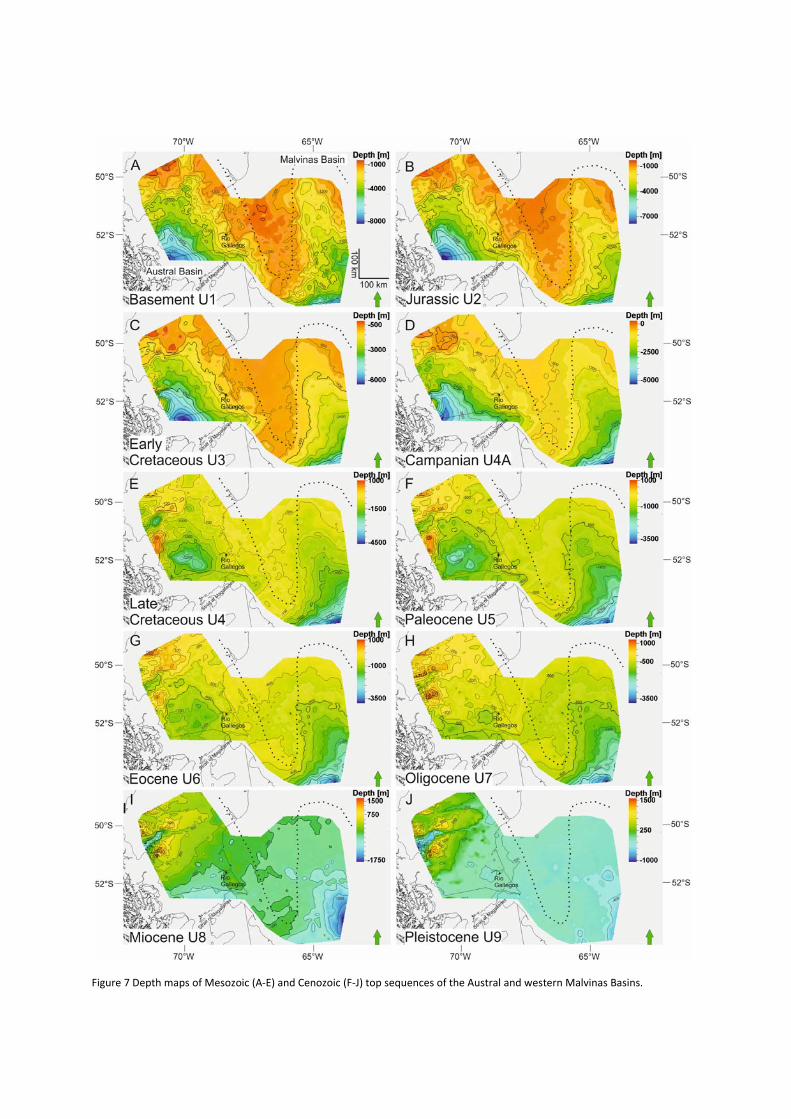
Figure 7 Depth maps of Mesozoic (A‐E) and Cenozoic (F‐J) top sequences of the Austral and western Malvinas Basins.

Figure 8 Thickness maps (m) of Mesozoic (A‐D) and Cenozoic (E‐I) sequences of the Austral and western Malvinas Basins. J shows the total thickness of the accumulated sediments in the study area.
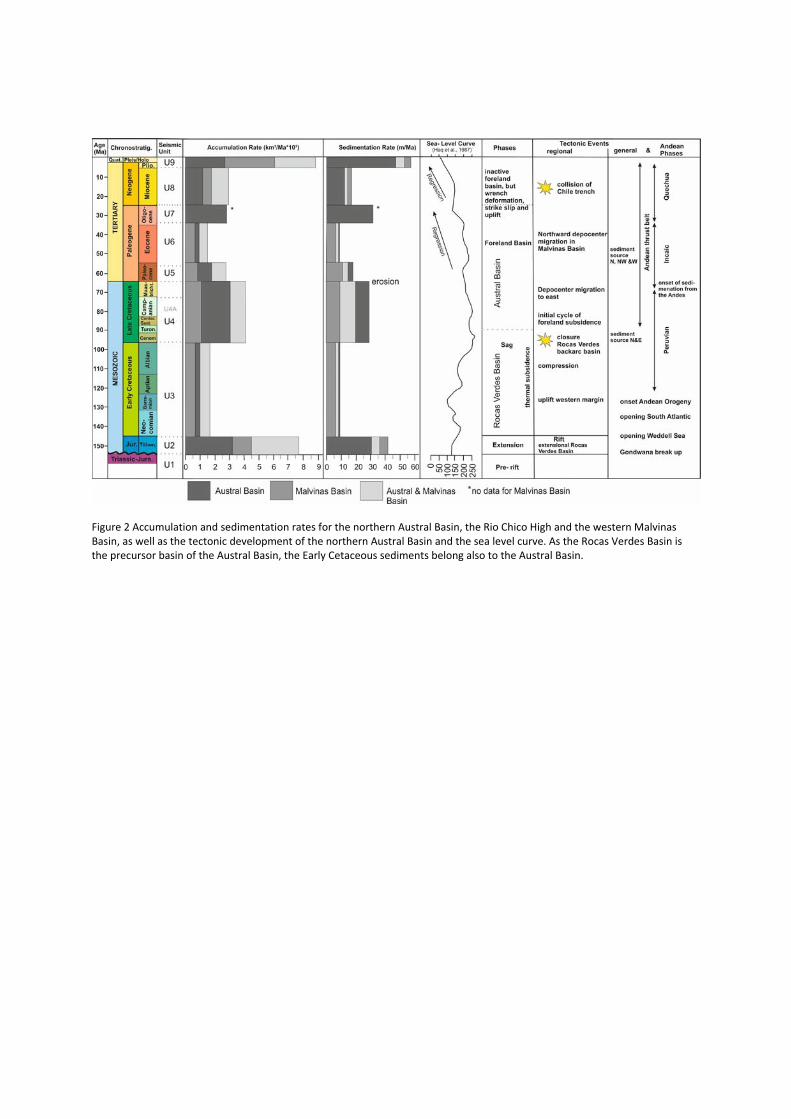
Figure 2 Accumulation and sedimentation rates for the northern Austral Basin, the Rio Chico High and the western Malvinas Basin, as well as the tectonic development of the northern Austral Basin and the sea level curve. As the Rocas Verdes Basin is the precursor basin of the Austral Basin, the Early Cetaceous sediments belong also to the Austral Basin.

Figure 10. Interpreted seismic sections (A) indicating vertical seismic pipes with discontinuous reflectors in the southern part in the Camusú Aike Volcanic Field. (B) vertical pipe with continuous reflectors accompanied by internal faults in the northern basin. Dashed lines represent the structures, black lines associated faults. For location see Figure 2.
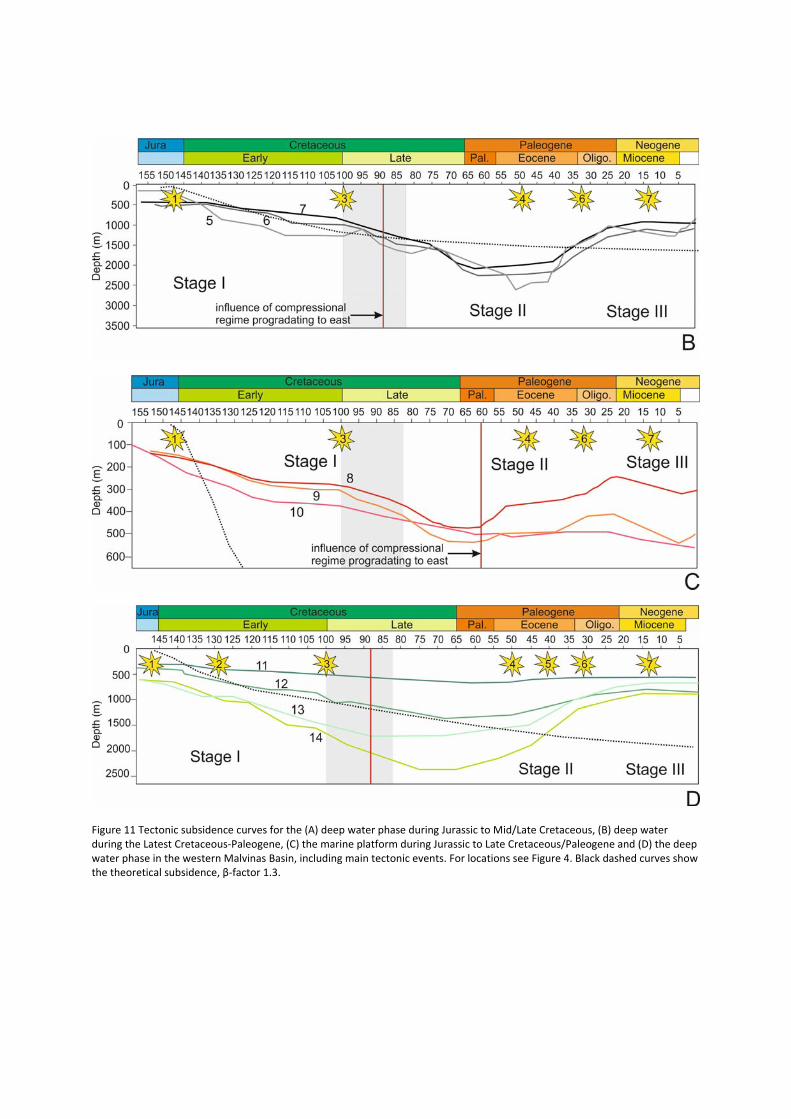
Figure 11 Tectonic subsidence curves for the (A) deep water phase during Jurassic to Mid/Late Cretaceous, (B) deep water during the Latest Cretaceous‐Paleogene, (C) the marine platform during Jurassic to Late Cretaceous/Paleogene and (D) the deep water phase in the western Malvinas Basin, including main tectonic events. For locations see Figure 4. Black dashed curves show the theoretical subsidence, β‐factor 1.3.
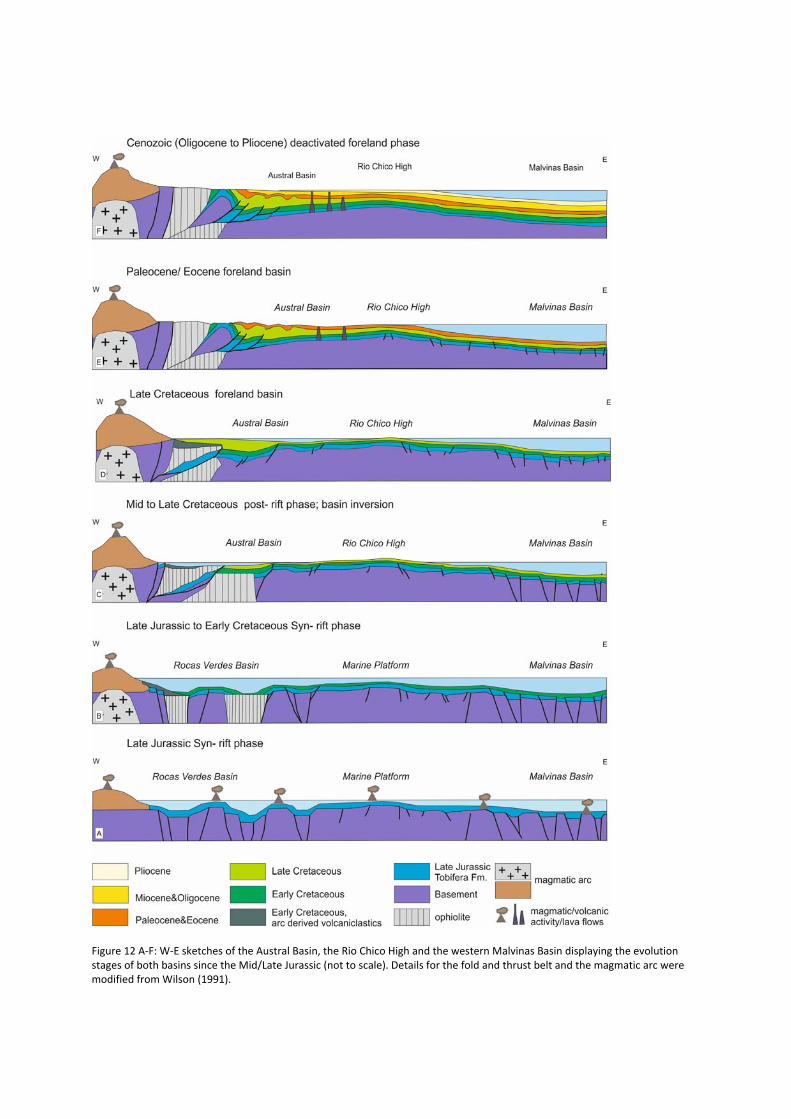
Figure 12 A‐F: W‐E sketches of the Austral Basin, the Rio Chico High and the western Malvinas Basin displaying the evolution stages of both basins since the Mid/Late Jurassic (not to scale). Details for the fold and thrust belt and the magmatic arc were modified from Wilson (1991).