Embed Size (px)
Citation preview
Otter Creek Tactical Basin Plan
The Otter Creek
Tactical Basin Plan was prepared in accordance with 10 VSA § 1253(d), the Vermont Water Quality Standards1, the Federal Clean Water Act and 40 CFR 130.6, and the Vermont Surface Water Management Strategy.
December 2019

ii
Basin 3 Overview Map --Towns, HUC 12 watersheds, and location of Basin 3 in VT--

iii
Basin 3 Tactical Plan Overview
Contents Executive Summary ....................................................................................................................... 1
What is a Tactical Basin Plan? ....................................................................................................... 4
Chapter 1 – Basin Description and Conditions .............................................................................. 6
A. Climate Change Implications for Basin 3 Surface Waters ...................................................... 6
B. The Otter Creek Basin ............................................................................................................ 6
C. Conditions of Surface Waters ................................................................................................ 9
Chapter 2 – Priority Areas for Surface Water Protection ............................................................ 13
A. Surface Water Classification ................................................................................................ 14
B. Identification of Existing Uses .............................................................................................. 20
Chapter 3 – Priority Areas for Surface Water Restoration .......................................................... 22
A. Stressed or Impaired Surface Waters .................................................................................. 22
B. Basin Specific Total Maximum Daily Loads (TMDLs) ............................................................ 30
C. The Lake Champlain Phosphorus TMDL ............................................................................... 32
D. Priority Areas for Restoration .............................................................................................. 39
Chapter 4 –Strategies to Address Pollution by Source Sector ..................................................... 41
A. Agriculture ........................................................................................................................... 42
B. Developed Lands -- Stormwater .......................................................................................... 54
C. Developed Lands--Roads ..................................................................................................... 60
D. Wastewater ......................................................................................................................... 67
E. Natural Resource Restoration--Forests ................................................................................ 72
F. Natural Resource Restoration--Lakes ................................................................................... 75
G. Natural Resource Restoration--Rivers ................................................................................. 78
H. Natural Resource Restoration—Wetlands .......................................................................... 92
Chapter 5 -The Basin 3 Implementation Table ............................................................................ 96
A. Basin 3 Implementation Table Summary ............................................................................. 97
B. Coordination of Basin 3 Partners: ...................................................................................... 108
C. Monitoring Priorities ......................................................................................................... 110
D. List of Acronyms ................................................................................................................ 124
References ................................................................................................................................ 126
Glossary .................................................................................................................................... 132
iv
Appendix A. 2012 Basin 3 Report Card ...................................................................................... 133
Appendix B. Existing Uses in Basin 3 ......................................................................................... 146
Appendix C. Dams in Basin 3 ..................................................................................................... 154
Appendix D. Responsiveness Summary ..................................................................................... 161
Appendix E. Letters of Conformance ......................................................................................... 178
List of Figures Figure 1. Summary of Protection Priorities for Basin 3. ALS = Aquatic Life Support. ..................... 2 Figure 2. Summary of Restoration Priorities for Basin 3. ST= Stressed waters list, 303d = Impaired waters list, Part D = Aquatic Invasive Species list, and Part F = waters with altered flow regimes. ........................................................................................................................................ 3 Figure 3. The Tactical Basin Planning Process. .............................................................................. 4 Figure 4. The land uses and major stressors of Basin 3 surface waters by HUC12 watershed. ..... 8 Figure 5. Conditions of Lakes and Ponds in VT and Basin 3 from Lake Scorecard data. .............. 10 Figure 6. Distribution of River Uses in VT and Basin 3. ................................................................ 11 Figure 7. Geomorphic condition of rivers and streams in VT and Basin 3. .................................. 12 Figure 8. Water quality protection actions in the 2019 Basin 3 plan. .......................................... 14 Figure 9. Class A(2) designated public water sources in Basin 3. ................................................. 16 Figure 10. Reclassification candidates and existing high-quality waters of Basin 3. ALS = Aquatic Life Support. ................................................................................................................................ 18 Figure 11. Overview of stressed and impaired waters in Basin 3. ............................................... 23 Figure 12. Stressed and impaired waters of Lewis Creek, Little Otter Creek, and the New Haven River. EWM = Eurasian watermilfoil. ........................................................................................... 24 Figure 13. Stressed and impaired waters of Lower Otter Creek, including Dead Creek. EWM = Eurasian watermilfoil, TSS = Total Suspended Solids. ................................................................. 25 Figure 14. Stressed and impaired waters of the Otter Creek, including the Lemon Fair and Middlebury River. EWM = Eurasian watermilfoil. ....................................................................... 26 Figure 15. Stressed and impaired waters of the Otter Creek, including tributaries of the mid mainstem. EWM = Eurasian watermilfoil. ................................................................................... 27 Figure 16. Stressed and impaired waters of the Upper Otter Creek watershed, including Furnace Brook, East Creek, and Cold Brook. EWM = Eurasian watermilfoil, DO = dissolved oxygen. ....... 28 Figure 17. Stressed and impaired waters of the Upper Otter Creek watershed, including the Clarendon River and the Cold River. EWM = Eurasian watermilfoil. ........................................... 29 Figure 18. Vermont sources of P loading to Lake Champlain segments, by land use; annual average of 2001-2010. The Otter Creek Basin is highlighted in the orange polygon. .................. 32

v
Figure 19. Annual total P contributions to Lake Champlain from 1990 to 2017 by the 10 watersheds in the Lake Champlain basin. The Otter Creek is shown in BLUE. Source: www.lcbp.org. ............................................................................................................................. 33 Figure 20. Modeled total P loading (%) to Lake Champlain by land use sector. Source: Tetra Tech Inc., 2016. ................................................................................................................................... 34 Figure 21. Modeled total P loading (%) to Lake Champlain by land use sector from the Otter Creek segment. Source: Tetra Tech Inc., 2016. ........................................................................... 35 Figure 22. Comparison of Basin, HUC12, and NHD+ Catchment spatial scales used in this plan. 38 Figure 23. Combined agricultural land uses in Basin 3. Percentages are for the entire basin and each individual HUC12 watershed. ............................................................................................. 43 Figure 24. Number of farms by size and agricultural land cover in Basin 3 by HUC12 watershed. .................................................................................................................................................... 46 Figure 25. Acreage of VAAFM and NRCS field BMPs installed in Basin 3 from 2012-2018. ......... 48 Figure 26. 2018 VAAFM and NRCS field BMPs by HUC 12 and modeled P load. Note: Acreage of some field BMPs may overlap as each practice is counted separately, but may occur on the same field area. ........................................................................................................................... 49 Figure 27. Number of VAAFM and NRCS farmstead BMPs installed in Basin 3 from 2012-2018. 50 Figure 28. 2012-2018 VAAFM and NRCS farmstead BMPs implemented by HUC 12 and modeled P load. ......................................................................................................................................... 51 Figure 29. Annual average estimated total P load reduction (kg/yr.) achieved by state-funded agricultural pollution prevention projects implemented SFY 2016-2018, and projected reductions based on currently implemented practices for the 5-year, Basin 3 planning cycle. .. 52 Figure 30. Park Street Green Plan Conceptual Design. Green = targeted areas for installation of bioswales upgradient from drop inlets to better infiltrate stormwater runoff. .......................... 57 Figure 31. MRGP timeline and milestones. ................................................................................. 61 Figure 32. Hydrologically connected roads, their MRGP status, and modeled TP loading by HUC12 watershed in Basin 3 (roads data are from July 2019). ................................................... 63 Figure 33. Annual average estimated TP load reduction (kg/yr.) achieved by state-funded stormwater treatment and road erosion remediation projects implemented/constructed, SFY 2016-2018, and projected reductions during the 5-year, Basin 3 planning cycle ........................ 64 Figure 34. Estimated forest TP loading for Otter Creek towns and HUC12 watersheds and TP load reduction potential. ............................................................................................................ 74 Figure 35. Geomorphic Conditions of Basin 3 rivers and streams. .............................................. 80 Figure 36. Aquatic organism passage assessment results for Basin 3 bridges and culverts. ....... 84 Figure 37. Geomorphic compatibility assessment of Basin 3 bridges and culverts. .................... 86 Figure 38. Municipal protection goals for towns and status of local protections in Basin 3. ...... 91 Figure 39. Priority wetland restoration areas based on P retention potential and previous NRCS wetland remediation areas. ........................................................................................................ 94

vi
List of Tables Table 1. A list of uses that can be placed into each water class in the VWQS. ............................ 15 Table 2. TMDLs in Basin 3. ........................................................................................................... 30 Table 3. Summary of allocations for the Otter Creek segment of Lake Champlain. .................... 36 Table 4. Focus areas for implementation of water quality projects by land use sector in Basin 3. .................................................................................................................................................... 39 Table 5. Progress of Basin 3 towns toward completing Stormwater Master Plans or Reports. ... 55 Table 6. Prioritization of municipal road segments based on MRGP REI and slope. Road segments that do not meet standards and are on a steep slope are priorities for water quality protection. .................................................................................................................................. 61 Table 7. Progress of Basin 3 towns toward completing Road Erosion Inventories. ..................... 62 Table 8. Summary of current permit requirements for the wastewater treatment facilities in Basin 3. ........................................................................................................................................ 69 Table 9. Basin 3 Lakes with Poor or Fair Shore and Habitat Scores. ............................................ 76 Table 10. Example of the total watershed deficit calculation. .................................................... 82 Table 11. Screening criteria for Aquatic Organism Passage. ....................................................... 83 Table 12. Screening criteria for Geomorphic Compatibility. ....................................................... 85 Table 13. Summary implementation actions for the Basin 3 tactical basin plan. ........................ 97 Table 14. Basin 3 priorities for monitoring and assessment. ..................................................... 112 Table A-1. 2012 Basin 3 report card with 2019 updates from partners…………………………………..134 Table B-1. Determination of existing uses of waters for swimming in Basin 3………………………..147 Table B-2. Determination of existing uses of waters for fishing in Basin 3………………………………148
Table B-3. Determination of existing uses of waters for pubic water supplies in Basin 3………..150 Table B-4. Determination of existing uses of waters for recreational boating in Basin 3 – Flat water……………………………………………………………………………………………………………………………………..153 Table B-5. Determination of existing uses of waters for recreational boating in Basin 3 – White water……………………………………………………………………………………………………………………………………..153 Table B-6. Determination of waterbodies not considered as Existing Use – Fishing……………….154 Table C-1. Active dams in Basin 3 organized by town name. These dams are either in service, partially breached, or drained………………………………………………………………………………………………..155

2019 OTTER CREEK TACTICAL BASIN PLAN pg. 1
Executive Summary The Basin 3 Tactical Basin Plan (TBP) provides an assessment of surface water conditions within the Otter Creek, Little Otter Creek, and Lewis Creek watersheds. The plan identifies current and future strategies to protect high quality waters and restore impaired water resources (see Vermont Surface Water Management Strategy (VSWMS)).
The five chapters in this plan are a framework for understanding Basin 3’s unique characteristics and water quality issues, and where and how to implement projects to protect and restore water quality in the basin.
Chapter 1 provides broad context for the plan by presenting the following: climate change and implications for water resources, a basin description, and a high-level summary of water resource conditions. This plan centers on Basin 3, which drains 936 square miles and includes the Otter Creek watershed plus the watersheds of Lewis Creek, and Little Otter Creek, which drain directly to Lake Champlain. The basin covers portions of Bennington, Rutland, and Addison counties and includes all surface waters that flow into the Otter Creek, the longest river in Vermont.
Chapter 1
• Basin OverviewChapter 2
• Protection priorities
Chapter 3
• Restoration prioritiesChapter 4
• Pollution by Sector Chapter 5
• Implementation

2019 OTTER CREEK TACTICAL BASIN PLAN pg. 2
Chapter 2 of the plan identifies high quality surface waters in the basin and recommends other waters as potential protection candidates (Figure 1):
Figure 1. Summary of Protection Priorities for Basin 3. ALS = Aquatic Life Support.
In addition, 9 abandoned A(2) public water sources are recommended for reclassification to B(1) or B(2), 2 waters are designated as permanent A(2) public water sources, 1 lake is identified as a sentinel lake and is used by Lake and Ponds Program (LPP) as a ‘reference’ waterbody, and 11 others are identified by the LPP as protection priorities based on Lake Scorecard criteria. Despite dedicated efforts to maintain existing conditions, numerous stressors degrade water quality in the basin (Figure 2). Many of these are linked to the following:
1. Encroachment of unpermitted stream alterations, non-buffered agricultural fields, and development within river corridors, floodplains, wetlands, and lake shores;
2. Stream channel erosion due to undersized crossing structures, lack of riparian vegetation for bank stabilization, and increases in stormwater flow and volume;
3. Land erosion due to unmanaged stormwater runoff from roads, developed lands, and agricultural lands; and
4. Pathogens from sources that likely stem from bacterial communities in soils, waste runoff from domesticated animals and livestock, and out-of-date and failed septic systems.
Chapter 3 of the plan identifies degraded surface waters in the basin, i.e., impaired and stressed waters and those with a Total Maximum Daily Load (TMDL) and recommends restoration candidates (Figure 2). More details are presented in Figures 11-21 and Table 2.
9 for Potential B1 Fishing Reclassification
2 for Potential Class I Wetland Reclassification
45 Current A1 surface waters
ALS7 for Potential A1 Aquatic Life Support Reclassification
ALS4 for Potential B1 Aquatic Life Support Reclassification

2019 OTTER CREEK TACTICAL BASIN PLAN pg. 3
Figure 2. Summary of Restoration Priorities for Basin 3. ST= Stressed waters list, 303d = Impaired waters list, Part D = Aquatic Invasive Species list, and Part F = waters with altered flow regimes.
Chapter 4 of the plan is a guide for the next 5 years to address pollution from land use sectors contributing to water quality issues. Information from assessments in the basin and derived from public input have been compiled to guide the development of strategies for the following sectors: agriculture, developed lands—stormwater and roads, wastewater treatment facilities, and restoration of forest lands, lakes, rivers, and wetlands. A total of 56 strategies are listed in the Chapter 5 implementation table and rivers and lakes that have been identified for water quality monitoring are in the monitoring priorities table. Individual implementation projects are listed in the Watershed Projects Database.
7 lakes/ponds are threatened by Aquatic Invasive Species
8 rivers/streams (or segments) and 3 lakes/ponds have altered Flow regimes
17 rivers/streams (or segments) and 16 lakes/ponds are on the Stressed list
303d
PartD
11 rivers/streams (or segments) and 7 lakes/ponds have TMDLs
3 rivers/streams (or segments) are on the Impaired list
Part F
AIS
ST

2019 OTTER CREEK TACTICAL BASIN PLAN pg. 4
What is a Tactical Basin Plan? Tactical basin planning is carried out for the Vermont Agency of Natural Resources (VANR) by the Watershed Management Division’s Monitoring, Assessment, and Planning Program (MAPP) in coordination with watershed partners. Tactical basin plans are developed in accordance with the VSWMS and the Vermont Water Quality Standards (VWQS) to protect, maintain, enhance, and restore the biological, chemical, and physical integrity of Vermont’s water resources. The basin specific water quality goals, objectives, strategies, and actions described in the TBPs aim to protect public health and safety and ensure public use and enjoyment of VT waters.
The TBPs incorporate the U.S Environmental Protection Agency’s (EPA) 9-element framework for watershed plans (Environmental Protection Agency, 2008), meet obligations of the Vermont Clean Water Act, and going forward, will integrate Act 76 (2019), which establishes a water quality project delivery framework to support Vermont’s clean water goals. The planning process allows for the issuance of plans for Vermont’s fifteen basins every five years, as required by statute 10 V.S.A. § 1253. Updating a basin plan includes: 1. monitoring water quality and summarizing existing information, 2. assessing and analyzing water quality data, 3. identifying strategies and projects to protect and restore waters, 4. seeking public input and finalizing the plan, and 5. plan implementation, tracking, and project identification, which are ongoing throughout the cycle (Figure 3).
Tactical basin plans are a guide for protecting and restoring VT surface waters for VANR and watershed partners. They identify opportunities for: a) protection through Outstanding Resource Water (ORW) designation and reclassification and b) restoration by addressing causes and sources of pollution. They also quantify pollutant reductions needed to meet the Lake Champlain and Lake Memphremagog TMDLs, foster education and outreach, and recommend restoration actions that are eligible for federal and State funding. The Plan’s strategies, described in Chapter 5’s implementation table, are tracked via the online clearinghouse, the Watershed Projects Database (WPD). The WPD is continuously updated to capture project information from the planning
Figure 3. The Tactical Basin Planning Process.

2019 OTTER CREEK TACTICAL BASIN PLAN pg. 5
process, projects identified by assessments or watershed partners, and emerging projects due to natural and/or anthropogenic events. The 2012 Basin 3 Report Card in Appendix A provides the status and updated information for each of the objectives identified in the previous basin plan.

2019 OTTER CREEK TACTICAL BASIN PLAN pg. 6
Chapter 1 – Basin Description and Conditions
A. Climate Change Implications for Basin 3 Surface Waters One of the main effects of climate change is the disruption of the water cycle. This plan aims to protect and restore surface waters in the basin and therefore, it is important to understand the impacts climate change is having and will have on water resources. The 2014 Vermont Climate Assessment documented state-level, climate changes, such as increasing temperatures and precipitation, which have implications for local surface waters (Galford et al., 2014). Since 1941, average temperatures have increased 2.7° F with warming occurring twice as fast in winter. Warmer winters result in earlier thaw dates for rivers, lakes and ponds, and snowpack. Average annual stream flows are increasing, which is expected to continue in the future. High flows now happen more frequently, which increase local flooding and fluvial erosion. Average annual precipitation has increased by 5.9 inches since 1960. The timing of precipitation and warmer temperatures, however, may increase the risk of summer drought due to earlier rains, decreased snowpack, and higher rates of evapotranspiration (Galford et al., 2014).
The effects of increasing streamflow and runoff in a watershed depends heavily on local land use and land cover. In Basin 3, both agricultural and developed land uses may experience more runoff thereby increasing non-point source pollution as flows carry eroded sediments, road sands, fertilizers, animal wastes, bacteria and nutrients from inundated septic systems, and other nutrient-rich materials into surface waters. Toxins such as mercury may increasingly be transported to aquatic ecosystems where warmer temperatures can accelerate mercury methylation and increase bioaccumulation in aquatic foodwebs (Stager and Thill 2010, https://bit.ly/2y6dpy2). In response, this plan’s restoration projects incorporate stormwater and non-point source runoff controls to counteract pollutant transport as well as consider the potential for higher peak flows.
Aquatic habitats affected by increasing streamflow and runoff could experience increases in sediments, nutrients, scouring, and water temperature. Warmer waters hold less dissolved oxygen, which can be harmful to many aquatic species (e.g. brook trout). Furthermore, changes in the timing and duration of high and low flows could interfere with the life cycles of migratory fish or aquatic insects. In response, local species may shift their geographic ranges, seasonal activities, and alter their abundance. This plan focuses on maintaining and restoring habitat connectivity, increasing river and lake riparian buffers, and stream equilibrium conditions to reduce the impacts of climate change on Vermont’s rivers, lakes and ponds, and wetlands. Additional information on climate change in Vermont can be found at: https://climatechange.vermont.gov.
B. The Otter Creek Basin
Basin 3 consists of the Otter Creek, Little Otter Creek, and Lewis Creek watersheds, which drain directly to Lake Champlain. The Otter Creek watershed encompasses 936 square miles, drains portions of Bennington, Rutland, and Addison counties, and includes all surface waters that flow
2019 OTTER CREEK TACTICAL BASIN PLAN pg. 7
into the Otter Creek. As the longest river in Vermont, the Otter Creek originates in Bennington County, flows through the Green Mountain National Forest, and travels ≈100 miles to its mouth in Addison County where it flows into Lake Champlain in Ferrisburgh. The river has been heavily developed for hydroelectric power generation, with seven active dams on the mainstem. Otter Creek’s wide floodplains and vast wetland complexes, such as found in the Pomainville Wildlife Management Area (WMA) and the Cornwall Swamp WMA, significantly dampened the 2011 floods of Tropical Storm Irene.
Basin 3 also includes the watersheds of Little Otter Creek and Lewis Creek. Little Otter Creek is a lowland river and has three main branches draining 73 square miles. At approximately 25 miles long, it begins in Bristol and flows through New Haven, Monkton, and Ferrisburgh before entering Lake Champlain. The Lewis Creek originates in the hills of Starksboro. It flows north, then west, before returning to Addison County and emptying into Lake Champlain at Hawkins Bay.
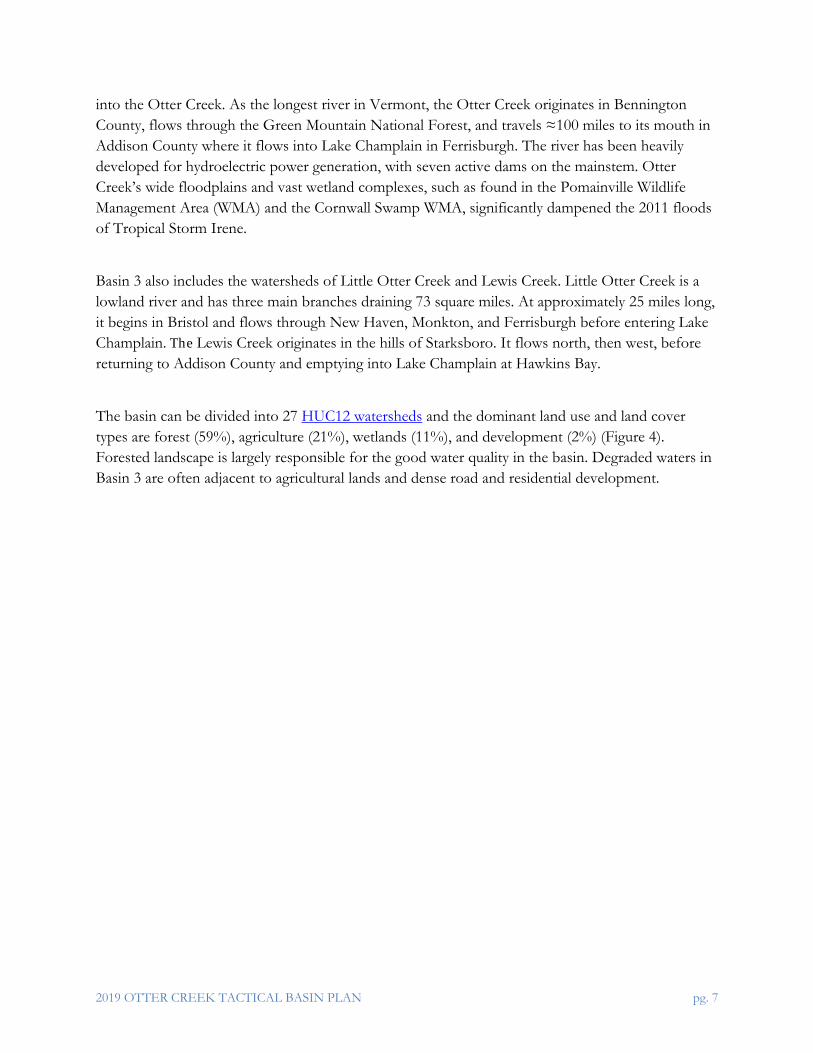
The basin can be divided into 27 HUC12 watersheds and the dominant land use and land cover types are forest (59%), agriculture (21%), wetlands (11%), and development (2%) (Figure 4). Forested landscape is largely responsible for the good water quality in the basin. Degraded waters in Basin 3 are often adjacent to agricultural lands and dense road and residential development.
2019 OTTER CREEK TACTICAL BASIN PLAN pg. 8
Managing land use to reduce discharge of polluted runoff and allowing adequate space for treatment can both improve and protect water quality.
Figure 4. The land uses and major stressors of Basin 3 surface waters by HUC12 watershed.

2019 OTTER CREEK TACTICAL BASIN PLAN pg. 9
C. Conditions of Surface Waters
Vermont Assessment Approach
The VANR Watershed Management Division (WSMD) in VDEC assesses the condition of a waterbody using biological, chemical, and physical criteria described in the Vermont Water Quality Monitoring Program Strategy 2011-2020 (VDEC, 2015). Most of these data can be accessed through the Vermont Integrated Watershed Information System, an online data portal. VDEC uses monitoring and assessment data to evaluate individual surface waters in relation to the VWQS as outlined in the 2016 VTDEC Assessment and Listing Methodology (VDEC, 2016). The VWQS establish the minimum or maximum limits for water quality parameters at specific locations for the purpose of managing waters to support their designated uses. Designated uses include aquatic biota and habitat; swimming and contact recreation; boating; fishing; public water supply, and crop irrigation.
The four categories used to assess Vermont’s surface water are full support, stressed, altered and impaired. Waters that currently support designated and existing uses and meet water quality standards are placed into the full support or stressed categories. Waters that do not meet VWQS are placed in the altered or impaired categories. Waters for which VDEC has no monitoring data or only limited information are considered unassessed.
Assessments that support tactical basin planning include, but are not limited to: biological monitoring (biomonitoring), water quality monitoring, Road Erosion Inventories (REIs), Stream Geomorphic Assessments (SGAs), Stormwater Master Planning (SWMP) and Illicit Discharge Detection and Elimination infrastructure mapping, and the Vermont Rapid Assessment Method (VRAM) of wetlands. Assessment results identify very high-quality waters, which are protected through reclassification (Ch. 2), and stressed, altered, or impaired waters, which are restored through regulation and project implementation (Ch. 3-4).
An overview of water quality conditions at state and basin scales are presented in the following subsections. This overview lends context to tactical basin planning efforts, which address the stressors and pollutants degrading waters through spatially explicit actions listed in the Chapter 5 Implementation Table and the online Watershed Projects Database.
Conditions of Lakes and Ponds
Vermont has over 800 lakes or ponds, with 220 of them larger than 20 acres in size. Basin 3 has 24 of those lakes or ponds that are 20 acres or larger. Four lakes with excellent water quality, intact shoreline, high biodiversity, few invasive species, and scenic features, are identified as the best lakes in this basin. High Pond in Sudbury is a sentinel lake, and Mud Pond, Johnson Pond, and Sugar Hollow Pond are identified as high quality. For more information about sentinel lakes in VT and/or High Pond, please read a 2018 Flow Blog post at: https://bit.ly/2KwMuCp.

2019 OTTER CREEK TACTICAL BASIN PLAN pg. 10
Encroachment through shoreland development is the greatest stressor to Vermont and Basin 3 lakes (USEPA, 2016), Figure 5). Lakes assessed in Basin 3 have a higher percentage of lake area with fair to poor shoreland conditions when compared to others assessed in Vermont. Out of 36 lakes assessed for shoreland condition in the basin, more than half are threatened by development. Sedimentation, eutrophication, aquatic invasive species (AIS), and artificial water level fluctuation also threaten lake and pond ecosystem health. Eleven Basin 3 lakes have increasing nutrient trends. Aquatic invasive species, especially Eurasian Water Milfoil, Myriophyllum spicatum, pose a threat to 11 lakes. Lake level manipulation is also a major cause of non-support of uses and values in the basin. Lake Dunmore, Silver Lake, Dunklee Pond, and Chittenden Reservoir are listed as stressed or impaired due to artificial water level fluctuation.
All Basin 3 lakes are under a Vermont Department of Health fish consumption advisory for exceeding the USEPA mercury (Hg) limits in fish, and Chittenden Reservoir is considered impaired based on elevated levels of mercury in walleye. Please refer to the following for a comprehensive assessment of mercury in Vermont Lakes (https://bit.ly/2KtkCAp).
Figure 5. Conditions of Lakes and Ponds in VT and Basin 3 from Lake Scorecard data.
Conditions of Rivers
Many Basin 3 rivers are in good to excellent condition and support many uses (Figure 6). Approximately 60% of assessable river miles (i.e., rivers large enough to be mapped as blue lines on United States Geological Survey (USGS) topographic maps) fully support aquatic life and over 70% support fishing and boating uses. Excellent water quality in many of the tributaries along with

2019 OTTER CREEK TACTICAL BASIN PLAN pg. 11
striking geologic formations support popular swimming holes, e.g., Bartlett’s Falls and Sycamore Park on the New Haven River and the Middlebury River Gorge. With community support, these stream reaches are natural candidates for Outstanding Resource Water based on their spectacular aesthetic value and swimming use. The North Branch of the Middlebury River is also popular for kayaking.
Increasing sediments, nutrients, pathogens, and temperatures are the most prevalent pollutants resulting in impairment of Basin 3 streams and rivers. Primary sources of these pollutants include agricultural land use, streambank modification/destabilization, and loss of riparian vegetation. Physical alterations are also present throughout the basin, ranging from habitat alteration, general stream channel instability, and flow alterations associated with water withdrawals or hydroelectric dams (e.g., East Creek). Development has encroached into the flood hazard zone (i.e., river corridors and floodplains) in many towns. In addition, atmospheric deposition of mercury causes stress for all surface waters in the basin.
Figure 6. Distribution of River Uses in VT and Basin 3.
Of the streams with a Phase 2 Stream Geomorphic Assessment, Basin 3 has more river miles in both good and reference geomorphic condition than found statewide (Figure 7). The results of specific assessments are described in greater detail in Chapter 4.
Not Assessed Impaired Altered Stressed Full Supporting

2019 OTTER CREEK TACTICAL BASIN PLAN pg. 12
Figure 7. Geomorphic condition of rivers and streams in VT and Basin 3.
Conditions of Wetlands
Basin 3 wetlands have an extensive history of draining and clearing for agriculture and wood products. In recent years, residential, commercial, and industrial development have been the primary causes of wetland loss. Basin 3 wetlands span a range of conditions and thus provide numerous opportunities for protection (Ch. 2) and restoration (Ch. 4). Generally, poor condition wetlands are associated with agriculture and development in the lower basin, while excellent wetlands occur at higher elevations, in headwater regions, and in the central Otter Creek wetland complex from Brandon to Middlebury. The Otter Creek wetland complex serves an important function by effectively mitigating the effects of flooding (e.g., 2011 Tropical Storm Irene) thereby reducing damages incurred by downstream communities. In addition, the wetlands and surrounding forested areas south of Brandon provide a critical wildlife corridor link between the Taconic Mountains and the Green Mountains.
The USEPA’s National Wetland Condition Assessment 2011 of Eastern Mountains wetlands, including Vermont’s, estimated that 52% of wetland area is in Good condition; 11% is in Fair condition, and 37% is in Poor condition. Presently, the WSMD Wetlands Program conducts monitoring and assessment of vegetation, water quality, and other wetland metrics to discern wetland condition, function, and value. Compared to other basins, Basin 3 wetlands are relatively well sampled, with 78/500 VRAM plots and 30/200 vegetation plots. In addition, 80/440 Natural Heritage Inventory plant survey plots have been conducted in the basin. Basin 3 wetlands have 43/49 natural community types identified in Vermont by the VT Fish and Wildlife’s Natural Heritage Inventory, which is the most of any basin in the state. To date many Basin 3 wetland assessments have focused on poor condition systems and as such, an unbiased comparison of Basin 3 and state wetland condition is not possible.
Poor Fair Good Reference
2019 OTTER CREEK TACTICAL BASIN PLAN pg. 13
Chapter 2 – Priority Areas for Surface Water Protection In order to protect VT surface waters and their designated uses, the VWQS establish water quality classes (Table 1) and associated management objectives. All surface waters are managed to support designated uses valued by the public at a level of Class B(2) (i.e., good condition) or better. Designated uses include: swimming, boating, fishing, aquatic biota, aquatic habitat, aesthetics, drinking water source, and irrigation. This section of the plan identifies surface waters where monitoring data indicate conditions meet or exceed the VWQS objectives and criteria. These high-quality waters may be protected by the anti-degradation policy of the VWQS or by upward reclassification through one of the following protection pathways:
• Reclassification of surface waters • Class I Wetland designation • Outstanding Resource Waters designation • Identification of existing uses • Designation of waters as cold-water fisheries
In addition to the above pathways, tactical basin plans identify opportunities to increase protection of high-quality waters through land stewardship programs, conservation easements, and land acquisition. Since 2012, the USDA Natural Resources Conservation Service has partnered with 25 private landowners and the US Fish and Wildlife Service to restore over 1000 acres of wetlands in the Otter Creek watershed through the Wetlands Reserve Program and Agricultural Conservation Easement Program Wetland Reserve Easement component. More examples of protection strategies are included in Chapter 5 of this plan.
2019 OTTER CREEK TACTICAL BASIN PLAN pg. 14
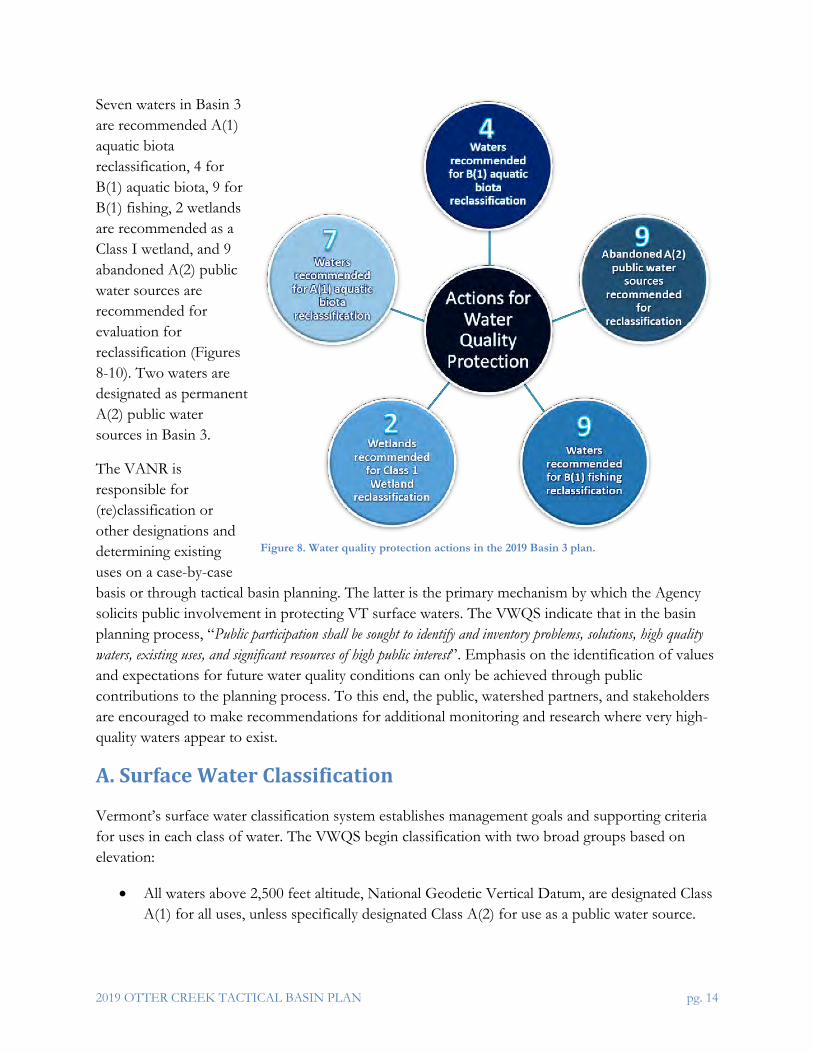
Seven waters in Basin 3 are recommended A(1) aquatic biota reclassification, 4 for B(1) aquatic biota, 9 for B(1) fishing, 2 wetlands are recommended as a Class I wetland, and 9 abandoned A(2) public water sources are recommended for evaluation for reclassification (Figures 8-10). Two waters are designated as permanent A(2) public water sources in Basin 3.
The VANR is responsible for (re)classification or other designations and determining existing uses on a case-by-case basis or through tactical basin planning. The latter is the primary mechanism by which the Agency solicits public involvement in protecting VT surface waters. The VWQS indicate that in the basin planning process, “Public participation shall be sought to identify and inventory problems, solutions, high quality waters, existing uses, and significant resources of high public interest”. Emphasis on the identification of values and expectations for future water quality conditions can only be achieved through public contributions to the planning process. To this end, the public, watershed partners, and stakeholders are encouraged to make recommendations for additional monitoring and research where very high-quality waters appear to exist.
A. Surface Water Classification
Vermont’s surface water classification system establishes management goals and supporting criteria for uses in each class of water. The VWQS begin classification with two broad groups based on elevation:
• All waters above 2,500 feet altitude, National Geodetic Vertical Datum, are designated Class A(1) for all uses, unless specifically designated Class A(2) for use as a public water source.
Figure 8. Water quality protection actions in the 2019 Basin 3 plan.
2019 OTTER CREEK TACTICAL BASIN PLAN pg. 15
• All waters at or below 2,500 feet altitude, National Geodetic Vertical Datum, are designated Class B(2) for all uses, unless specifically designated as Class A(1), A(2), or B(1) for any use.
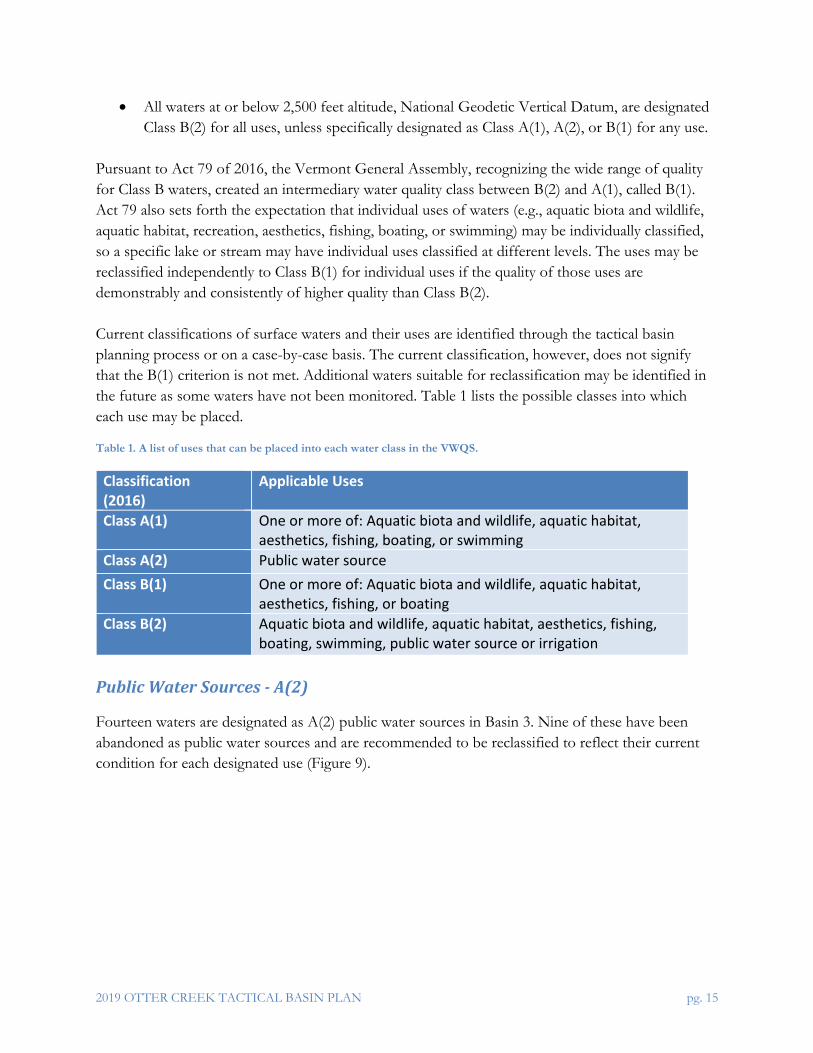
Pursuant to Act 79 of 2016, the Vermont General Assembly, recognizing the wide range of quality for Class B waters, created an intermediary water quality class between B(2) and A(1), called B(1). Act 79 also sets forth the expectation that individual uses of waters (e.g., aquatic biota and wildlife, aquatic habitat, recreation, aesthetics, fishing, boating, or swimming) may be individually classified, so a specific lake or stream may have individual uses classified at different levels. The uses may be reclassified independently to Class B(1) for individual uses if the quality of those uses are demonstrably and consistently of higher quality than Class B(2). Current classifications of surface waters and their uses are identified through the tactical basin planning process or on a case-by-case basis. The current classification, however, does not signify that the B(1) criterion is not met. Additional waters suitable for reclassification may be identified in the future as some waters have not been monitored. Table 1 lists the possible classes into which each use may be placed.
Table 1. A list of uses that can be placed into each water class in the VWQS.
Classification (2016)
Applicable Uses
Class A(1) One or more of: Aquatic biota and wildlife, aquatic habitat, aesthetics, fishing, boating, or swimming
Class A(2) Public water source Class B(1) One or more of: Aquatic biota and wildlife, aquatic habitat,
aesthetics, fishing, or boating Class B(2) Aquatic biota and wildlife, aquatic habitat, aesthetics, fishing,
boating, swimming, public water source or irrigation Public Water Sources - A(2)
Fourteen waters are designated as A(2) public water sources in Basin 3. Nine of these have been abandoned as public water sources and are recommended to be reclassified to reflect their current condition for each designated use (Figure 9).

2019 OTTER CREEK TACTICAL BASIN PLAN pg. 16
Figure 9. Class A(2) designated public water sources in Basin 3.

2019 OTTER CREEK TACTICAL BASIN PLAN pg. 17
Very High-Quality Waters Supporting Aquatic Biota – A(1) & B(1)
The VDEC stream biomonitoring assessments indicate that 11 surface waters in Basin 3 consistently and demonstrably attain a higher level of quality than Class B(2) (Figure 10). A(1) reclassification candidates are: Hillsboro Brook, Alder Brook, Blue Bank Brook Tributary 6 (Upper and Lower), New Haven River Tributary 27, Sugar Hollow Brook, and Warner Brook. B(1) reclassification candidates are: Lewis Creek, Hollow Brook, High Knob Brook, and Upper Lewis Creek. Through the basin planning process, which provides opportunities for public comment and input, these waters are recommended for reclassification to A(1) or B(1).
Five streams are recommended for additional sampling to determine eligibility for B(1) for aquatic biota: Jones Brook (River Mile (RM) 0.5 and RM 2.3), Seymour Brook (above RM 3.2), New Haven River (RM 21.8), Mendon Brook (RM 2.5), and McGinn Brook (RM 0.7).

2019 OTTER CREEK TACTICAL BASIN PLAN pg. 18
Figure 10. Reclassification candidates and existing high-quality waters of Basin 3. ALS = Aquatic Life Support.

2019 OTTER CREEK TACTICAL BASIN PLAN pg. 19
Very Good Waters for Recreational Fishing – B(1)
Rivers and streams classified as B(1) recreational fishing waters, support wild, self-sustaining salmonid populations characterized by the presence of multiple age classes and a minimum abundance of 1000 individuals per mile (all species/ages/sizes); and/or 200 large (> 6 inches total length) individuals per mile; and/or 20 pounds/acre (all species/ages/sizes). The streams that meet B(1) criteria for recreational fishing (§29A-306) are: New Haven River, Eubar Brook, N. Branch Neshobe River, Neshobe River, Sugar Hollow Brook, Furnace Brook, Brewers Brook, Baker Brook, and Upper Otter Creek (Figure 10).
B(1) waters are managed to achieve and maintain very good quality fishing. Basin 3 B(1) waters may be amended in the future based on updated survey data and as protocols are refined. Waters that meet the revised criteria in the water quality standards for both B(1) and A(1) fishing use will be continually identified and updated. It is important to note that all waterbodies that would naturally support fish populations are protected and maintained in perpetuity.
Warm and Cold-Water Fish Habitat Designations
Warm-Water Fish Habitat
All surface water wetlands and the following waters are designated as warm-water fish habitat for purposes of the VWQS:
• All waters West of VT Route 22A and South of Vergennes • Brilyea East Pond, Addison • Brilyea West Pond, Addison • Chipman Lake (Tinmouth Pond), Tinmouth • Danby Pond, Danby • Fern Lake, Leicester • Lemon Fair River • Mud Pond, Leicester • Otter Creek from the outfall of the Proctor WWTF to its confluence with Lake Champlain,
except the portion between the Beldens Dam and the Huntington Falls Dam in New Haven/Weybridge
• Richville Pond, Shoreham • Stone Bridge Pond, Panton/Addison • Wallingford Pond, Wallingford
The VWQS specify a lower minimum dissolved oxygen concentration than waters in the remainder of the basin, which are cold-water habitat.

2019 OTTER CREEK TACTICAL BASIN PLAN pg. 20
Cold-Water Fish Habitat
All Basin 3 waters not designated as warm-water fish habitat are designated as cold-water fish habitat (Vermont Department of Environmental Conservation, 2017).
Outstanding Resource Waters Designation
Vermont Act 67 (“An Act Relating to Establishing a Comprehensive State Rivers Policy,” 1987) provides protection to rivers and streams that have “exceptional natural, cultural, recreational, or scenic values” through the designation of Outstanding Resource Waters (ORW). ORW designation may protect exceptional waters through permit conditions in stream alterations, dams, wastewater discharges, aquatic nuisance controls, solid waste disposal, Act 250 projects, and other activities. ORWs are waters which can be designated by the VANR through a petition process. There are currently no ORW designations in Basin 3.
Class I Wetland Designation
The State of Vermont identifies and protects significant wetlands such that no net loss of wetlands and their values and functions is allowed. By evaluating the extent to which a wetland provides functions and values, it is classified as:
• Class I: Exceptional or irreplaceable in its contribution to Vermont's natural heritage and therefore, merits the highest level of protection,
• Class II: Merits protection, either taken alone or in conjunction with other wetlands, or • Class III: Neither a Class II nor a Class I wetland.
Impacts to Class I wetlands may only be permitted when the activity is necessary to meet a compelling public need for health or safety. The VT Wetlands Program’s Class I website contains an interactive map and includes determinations for eight VT Class I wetlands: Dorset Marsh, Northshore Wetland, Tinmouth Channel, Chickering Fen, Dennis Pond Wetlands, Sandbar Wetlands, Peacham Bog and the LaPlatte River Wetlands. The last five wetlands were added in the past three years.
The Wetlands Program welcomes recommendations for Class I candidates. Tinmouth Channel is the only Class I wetland in Basin 3, however Beaver Meadow Wetland in Ripton and the Otter Creek Wetland Complex are recommended for Class I designation for having exceptional or irreplaceable functions and values. As of the writing of this plan, Beaver Meadow has an active Class I petition pending with the VDEC.
B. Identification of Existing Uses The VANR may identify existing uses of waters during the tactical basin planning process or on a case-by-case basis during application reviews for State or federal permits. Consistent with the federal
2019 OTTER CREEK TACTICAL BASIN PLAN pg. 21
Clean Water Act, the VWQS stipulate that existing uses may be documented in any surface water location where that use has occurred since November 28, 1975. Pursuant to the definition of Class B(1) in Act 79, the VANR may identify an existing use as Class B(1) when that use is demonstrably and consistently attained.
The VANR stipulates that all lakes and ponds in the basin have existing uses of swimming, boating, and fishing. The VANR recognizes that fishing activities in streams and rivers are widespread and too numerous to thoroughly document for Basin 3. In the case of streams too small to support significant fishing activity, the VANR recognizes these as potential spawning and nursery areas, which contribute fish stocks downstream where fishing may occur. These small streams support the use of fishing and therefore, are protected at a level commensurate with downstream areas.
Existing uses in Basin 3 should be viewed as a partial accounting of known existing uses based upon limited information. The list does not change protection under the Clean Water Act or VWQS for unlisted waters. The existing uses in Basin 3 of swimming, boating, fishing, and drinking water supply are found in Appendix B (Tables B1-B6). The public is encouraged to recommend waters for existing uses of swimming, boating, fishing, drinking water, and ecological significance given that they provide evidence of such use. New recommendations for existing uses should be sent to the Basin 3 Watershed Coordinator for review.
For existing uses of waters, the level of water quality necessary to protect those existing uses shall be maintained and protected regardless of the water’s classification (VDEC, 2017).

2019 OTTER CREEK TACTICAL BASIN PLAN pg. 22
Chapter 3 – Priority Areas for Surface Water Restoration
A. Stressed or Impaired Surface Waters The VDEC monitors and assesses the chemical, physical, and biological status of individual surface waters to determine if they meet the VWQS per the 2016 VDEC Assessment and Listing Methodology (VDEC, 2016). Surface waters are assessed as: full support, stressed, altered, or impaired. To address Section 303(d) of the Federal Clean Water Act, the VDEC develops the 303(d) List of Impaired Waters, which includes impaired lakes, ponds, rivers, and streams that do not meet VWQS.
The State also produces the Priority Waters List, which identifies other waters that do not meet water quality standards, but do not require a TMDL. Sections of that list include: Part B- impaired waters that have other required remediation measures in place; Part D-impaired waters with TMDLs in place; Part E-waters altered by AIS; and Part F-waters altered by flow modifications. These lists can be viewed on the Vermont Environmental Atlas. For a more detailed description of monitoring results use the Vermont Integrated Watershed Information System online data portal. Figures 11-17 show the known stressed, impaired, or altered waterbodies in Basin 3. These figures also indicate where data gaps exist, which inform monitoring priorities for the 2019-2023 planning cycle (Table 14).
A primary goal of the plan is to identify and address pollutants degrading the listed waters (Figures 11-17) through strategies in the Chapter 5 Implementation Table. The types of actions prescribed are based on the sector-specific practices outlined in the Vermont Surface Water Management Strategy.

2019 OTTER CREEK TACTICAL BASIN PLAN pg. 23
Figure 11. Overview of stressed and impaired waters in Basin 3.

2019 OTTER CREEK TACTICAL BASIN PLAN pg. 24
Figure 12. Stressed and impaired waters of Lewis Creek, Little Otter Creek, and the New Haven River. EWM = Eurasian watermilfoil.

2019 OTTER CREEK TACTICAL BASIN PLAN pg. 25
Figure 13. Stressed and impaired waters of Lower Otter Creek, including Dead Creek. EWM = Eurasian watermilfoil, TSS = Total Suspended Solids.

2019 OTTER CREEK TACTICAL BASIN PLAN pg. 26
Figure 14. Stressed and impaired waters of the Otter Creek, including the Lemon Fair and Middlebury River. EWM = Eurasian watermilfoil.

2019 OTTER CREEK TACTICAL BASIN PLAN pg. 27
Figure 15. Stressed and impaired waters of the Otter Creek, including tributaries of the mid mainstem. EWM = Eurasian watermilfoil.

2019 OTTER CREEK TACTICAL BASIN PLAN pg. 28
Figure 16. Stressed and impaired waters of the Upper Otter Creek watershed, including Furnace Brook, East Creek, and Cold Brook. EWM = Eurasian watermilfoil, DO = dissolved oxygen.

2019 OTTER CREEK TACTICAL BASIN PLAN pg. 29
Figure 17. Stressed and impaired waters of the Upper Otter Creek watershed, including the Clarendon River and the Cold River. EWM = Eurasian watermilfoil.
2019 OTTER CREEK TACTICAL BASIN PLAN pg. 30
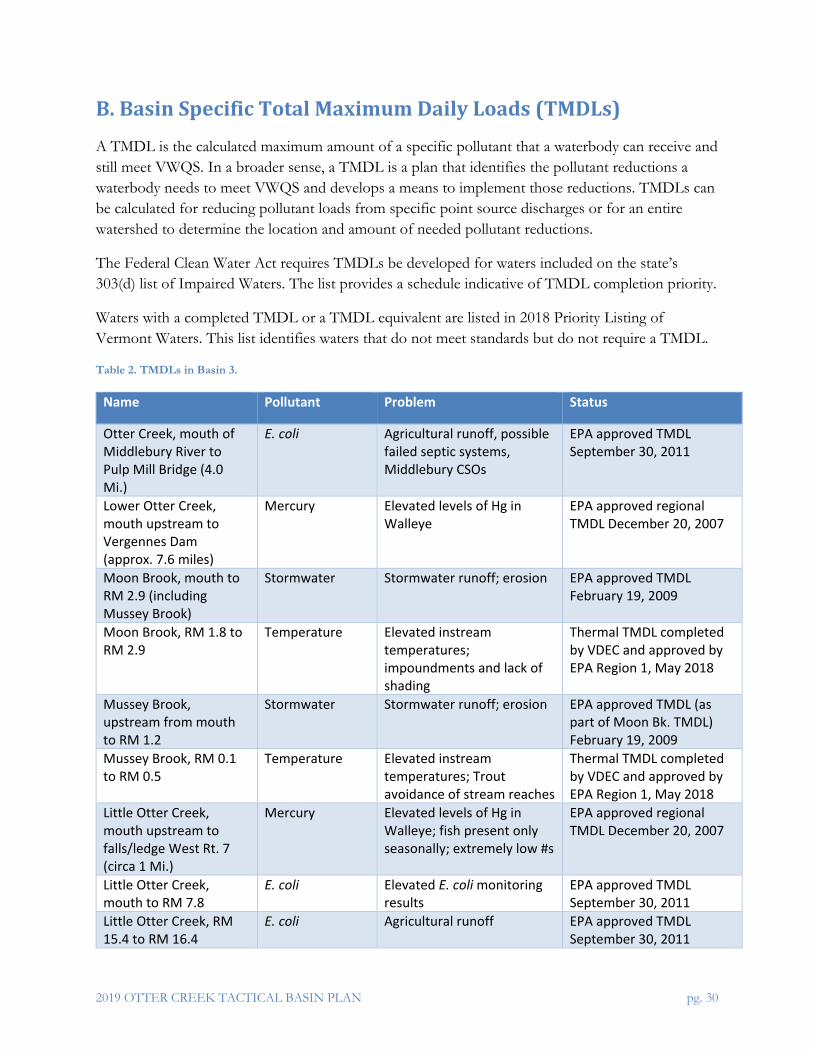
B. Basin Specific Total Maximum Daily Loads (TMDLs) A TMDL is the calculated maximum amount of a specific pollutant that a waterbody can receive and still meet VWQS. In a broader sense, a TMDL is a plan that identifies the pollutant reductions a waterbody needs to meet VWQS and develops a means to implement those reductions. TMDLs can be calculated for reducing pollutant loads from specific point source discharges or for an entire watershed to determine the location and amount of needed pollutant reductions.
The Federal Clean Water Act requires TMDLs be developed for waters included on the state’s 303(d) list of Impaired Waters. The list provides a schedule indicative of TMDL completion priority.
Waters with a completed TMDL or a TMDL equivalent are listed in 2018 Priority Listing of Vermont Waters. This list identifies waters that do not meet standards but do not require a TMDL.
Table 2. TMDLs in Basin 3.
Name Pollutant Problem Status
Otter Creek, mouth of Middlebury River to Pulp Mill Bridge (4.0 Mi.)
E. coli Agricultural runoff, possible failed septic systems, Middlebury CSOs
EPA approved TMDL September 30, 2011
Lower Otter Creek, mouth upstream to Vergennes Dam (approx. 7.6 miles)
Mercury Elevated levels of Hg in Walleye
EPA approved regional TMDL December 20, 2007
Moon Brook, mouth to RM 2.9 (including Mussey Brook)
Stormwater Stormwater runoff; erosion EPA approved TMDL February 19, 2009
Moon Brook, RM 1.8 to RM 2.9
Temperature Elevated instream temperatures; impoundments and lack of shading
Thermal TMDL completed by VDEC and approved by EPA Region 1, May 2018
Mussey Brook, upstream from mouth to RM 1.2
Stormwater Stormwater runoff; erosion EPA approved TMDL (as part of Moon Bk. TMDL) February 19, 2009
Mussey Brook, RM 0.1 to RM 0.5
Temperature Elevated instream temperatures; Trout avoidance of stream reaches
Thermal TMDL completed by VDEC and approved by EPA Region 1, May 2018
Little Otter Creek, mouth upstream to falls/ledge West Rt. 7 (circa 1 Mi.)
Mercury Elevated levels of Hg in Walleye; fish present only seasonally; extremely low #s
EPA approved regional TMDL December 20, 2007
Little Otter Creek, mouth to RM 7.8
E. coli Elevated E. coli monitoring results
EPA approved TMDL September 30, 2011
Little Otter Creek, RM 15.4 to RM 16.4
E. coli Agricultural runoff EPA approved TMDL September 30, 2011

2019 OTTER CREEK TACTICAL BASIN PLAN pg. 31
Lewis Creek, Parsonage Bridge Rd. (LCR19.5) to covered bridge (LCR7.3)
E. coli Agricultural runoff EPA approved TMDL September 30, 2011
Pond Brook, from Lewis Creek confluence upstream (1.5 miles)
E. coli Agricultural runoff EPA approved TMDL September 30, 2011
Lower Dead Creek, from mouth upstream (approx. 3 miles)
Mercury Elevated levels of Hg in Walleye
EPA approved regional TMDL December 20, 2007
North Pond (Bristol) Acid Atmospheric deposition: critically acidified; chronic acidification
EPA approved TMDL September 30, 2003
Gilmore Pond (Bristol) Acid Atmospheric deposition: extremely sensitive to acidification; episodic acidification
EPA approved TMDL September 30, 2003
Middlebury River, from mouth upstream 2 miles
E. coli Agricultural runoff, livestock, possible failed septic systems
EPA approved TMDL September 30, 2011
Chittenden Reservoir (Chittenden)
Mercury Elevated levels of Hg in Walleye
EPA approved regional TMDL December 20, 2007
Griffith Lake (Peru) Acid Atmospheric deposition: extremely sensitive to acidification; episodic acidification
EPA approved TMDL September 30, 2003
Big Mud Pond (Mt. Tabor)
Acid Atmospheric deposition: extremely sensitive to acidification; episodic acidification
EPA approved TMDL September 30, 2003
Long Hole (Mt. Tabor) Acid Atmospheric deposition: critically acidified; chronic acidification
EPA approved TMDL September 30, 2003
Little Mud (Mt. Tabor) Acid Atmospheric deposition: extremely sensitive to acidification; episodic acidification
EPA approved TMDL September 30, 2003
Otter Creek section - Lake Champlain (Ferrisburgh)
Mercury Elevated levels of Hg in Walleye
EPA approved regional TMDL December 20, 2007
Otter Creek section - Lake Champlain (Ferrisburgh)
Phosphorous P enrichment EPA approved Lake Champlain Phosphorous TMDL June 2016
2019 OTTER CREEK TACTICAL BASIN PLAN pg. 32
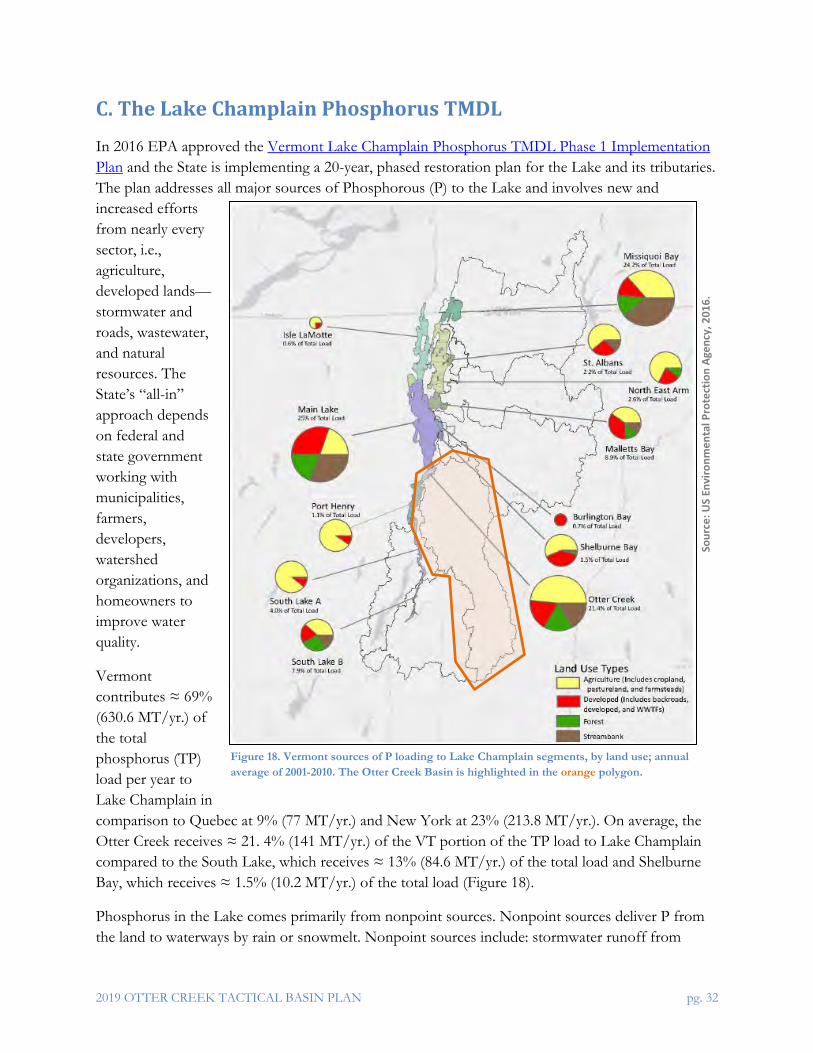
C. The Lake Champlain Phosphorus TMDL In 2016 EPA approved the Vermont Lake Champlain Phosphorus TMDL Phase 1 Implementation Plan and the State is implementing a 20-year, phased restoration plan for the Lake and its tributaries. The plan addresses all major sources of Phosphorous (P) to the Lake and involves new and increased efforts from nearly every sector, i.e., agriculture, developed lands—stormwater and roads, wastewater, and natural resources. The State’s “all-in” approach depends on federal and state government working with municipalities, farmers, developers, watershed organizations, and homeowners to improve water quality.
Vermont contributes ≈ 69% (630.6 MT/yr.) of the total phosphorus (TP) load per year to Lake Champlain in comparison to Quebec at 9% (77 MT/yr.) and New York at 23% (213.8 MT/yr.). On average, the Otter Creek receives ≈ 21. 4% (141 MT/yr.) of the VT portion of the TP load to Lake Champlain compared to the South Lake, which receives ≈ 13% (84.6 MT/yr.) of the total load and Shelburne Bay, which receives ≈ 1.5% (10.2 MT/yr.) of the total load (Figure 18).
Phosphorus in the Lake comes primarily from nonpoint sources. Nonpoint sources deliver P from the land to waterways by rain or snowmelt. Nonpoint sources include: stormwater runoff from
Sour
ce: U
S En
viro
nmen
tal P
rote
ctio
n Ag
ency
, 201
6.
Figure 18. Vermont sources of P loading to Lake Champlain segments, by land use; annual average of 2001-2010. The Otter Creek Basin is highlighted in the orange polygon.

2019 OTTER CREEK TACTICAL BASIN PLAN pg. 33
developed lands including roads and parking lots, lawns, agriculture, timber harvest operations, and eroding river channels. Point sources of P include: regulated stormwater discharges and wastewater treatment facilities (WWTF).
Measuring the amount of P in water that comes out of a pipe (point source) is less complicated than measuring P in water flowing over land surfaces (non-point source). As a result, determining P loading of non-point sources requires environmental modeling based on long-term field measurements and land use information from satellite imagery and LiDAR data. More information on how P loading was projected in the Lake Champlain Basin (LCB) can be found in Chapter 5 of the Phosphorus TMDLs for Vermont Segments of Lake Champlain.
The Otter Creek Basin and the Lake Champlain Phosphorus TMDL
The Otter Creek drains into the Otter Creek segment of Lake Champlain, which then flows north. Compared to the 10 major watershed contributors shown in Figure 19, the Otter Creek Basin is
Vermont’s third highest contributor of P into Lake Champlain after the Winooski and Missisquoi basins. In order to implement the Lake Champlain P TMDL (LC TMDL), annual TP loading into the Otter Creek is required to decrease by approximately 47 % (averaged across all sectors) or by ≈ 40 MT/yr.
Figure 19. Annual total P contributions to Lake Champlain from 1990 to 2017 by the 10 watersheds in the Lake Champlain basin. The Otter Creek is shown in BLUE. Source: www.lcbp.org.

2019 OTTER CREEK TACTICAL BASIN PLAN pg. 34
Phosphorus pollution in the Otter Creek Basin ultimately ends up in Lake Champlain, but the sources of P by land use type are slightly different within the Otter Creek Basin compared to the entire LCB (Figures 20 and 21).
Figure 20. Modeled total P loading (%) to Lake Champlain by land use sector. Source: Tetra Tech Inc., 2016.

2019 OTTER CREEK TACTICAL BASIN PLAN pg. 35
Figure 21. Modeled total P loading (%) to Lake Champlain by land use sector from the Otter Creek segment. Source: Tetra Tech Inc., 2016.
Specifically, Basin 3 contributes more P from agricultural lands (49%) and less from developed lands (9%) and river erosion (16%) compared to the entire LCB (Figures 20 and 21).
Understanding the relationship between P and land use is important, because the conditions caused by P pollution (e.g., harmful algal blooms) can significantly threaten clean water in the Otter Creek Basin and Lake Champlain, which both provide recreational and drinking water uses, as well as aquatic life and habitat functions. Addressing P pollution through actions on the landscape will also lead to reductions in other pollutants in the watershed. This is because other pollutants (e.g., N and bacteria) can be released from land and river erosion as well as land use runoff. Much of the P from the eroding landscape comes in the form of particulate P, which is bound to sediment and becomes a transport mechanism of P to surface water during periods of runoff.
This plan reports actions needed to implement the Lake Champlain P TMDL to reduce P loading from different land uses in sub-watersheds and watersheds within the basin. Reducing P in Lake Champlain could take many years and as a result, the 20-year TMDL is being implemented and

2019 OTTER CREEK TACTICAL BASIN PLAN pg. 36
tracked in phases. Progress is currently being tracked through the Clean Water Initiative Program’s (CWIP) internal tracking systems such as the Clean Water Reporting Framework (CWRF), which contains the Best Management Practice Accounting and Tracking Tool (BATT)). The Clean Water Project Explorer is an interactive, online application that displays clean water projects in all stages of development, from potential to in progress to completed projects.
TMDL allocations for the Otter Creek segment of Lake Champlain
Table 3 below provides the final P allocations and the resulting reductions required for the Otter Creek segment of Lake Champlain. These values are taken directly from the final LC TMDL and the Phase I Implementation Plan (2016). For the Otter Creek segment, the allocations reflect a 40.1% reduction from streambanks, a 5% reduction from forest lands, a 46.9% reduction from agricultural sources, and a 15% reduction from developed lands.
Table 3. Summary of allocations for the Otter Creek segment of Lake Champlain.
Source Category Allocation Category
Total Allocation (MT/yr.)
Reduction Required (%)
Forest All lands Load* 22.78 5 Stream Channels
All streams Load 13.76 40.1
Agriculture Fields/pasture Load 35.48 46.9 Production areas Waste load* 0.41 80
Developed Lands
VTrans owned roads and developed lands
Wasteload 17.56 15
Roads MRGP Wasteload MS4 Wasteload Larger unregulated parcels
Wasteload
Wastewater WWTF discharges Wasteload 11.98 0 CSO discharges Wasteload included with
developed lands
15
* Pollutant sources are characterized as either point sources that receive a wasteload allocation (WLA), or nonpoint sources that receive a load allocation (LA). For purposes of assigning WLAs, point sources include all sources subject to regulation under the National Pollutant Discharge Elimination System (NPDES) program, e.g. wastewater treatment facilities, some stormwater discharges and concentrated animal feeding operations (CAFOs). For purposes of assigning LAs, nonpoint sources include all remaining sources of the pollutant as well as natural background sources. Source: www.epa.gov.
Lake Champlain Phosphorus TMDL Phase II Plan
The LC TMDL establishes the allowable P loadings, or allocations, from the watershed for lake water quality to meet established standards. These allocations are apportioned both by land use sector (e.g., developed land, agriculture, etc.) and by lake watershed basin (e.g., South Lake, Otter Creek, etc.). Due to the large size of the LCB in VT, the modeling techniques used to estimate

2019 OTTER CREEK TACTICAL BASIN PLAN pg. 37
loading were implemented at a coarse scale. For example, the modeled loading at the mouth of the major river basins is based on monitoring data and represents the collective inputs from the various land uses and physical features of the watershed. At the basin scale, this is useful to estimate the necessary level of P reducing Best Management Practices (BMPs).
As part of the LC TMDL development, EPA completed a “Reasonable Assurance” analysis at the basin scale and determined it was possible to obtain to necessary P reduction through appropriate application of BMPs across all sectors. However, there is no specific prescription as to where individual BMPs should be applied. It is through tactical basin planning that local opportunities for BMP implementation can be identified.
The LC TMDL is being implemented through a combination of regulatory and non-regulatory programs. Identifying non-regulatory projects often follows a two-step process of first knowing “where to look” for opportunities followed by “what to do”. Many P reduction programs require an initial assessment phase to identify what BMPs already exist on the landscape and where others are needed. This plan examines how these P reductions will be met across all land use sectors within the Otter Creek Basin.
Several modeling products were used to determine where LC TMDL reductions will be most effective to implement the TMDL. The EPA SWAT (Soil and Water Assessment Tool) model was developed to estimate P loading from the LCB from various land use sectors for development of the TMDL. Discrete SWAT models were calibrated and validated for each of the Hydrologic Unit Code – level 8 (HUC8) watersheds as well as for direct drainages to the lake. Three additional tools were developed from the SWAT modeling results: the HUC – level 12 (HUC12) Tool, the BMP Scenario Tool, and the Clean Water Roadmap, which downscales the SWAT modeling from the HUC12 scale to the catchment level. In the sector-specific sections of Ch. 4, varying spatial scales are used, depending on the source sector (Figure 22). In order of decreasing size, they are the major river basin (i.e., HUC-8), major tributary or sub-basin (i.e., HUC12), and the NHD+ catchment scale.

2019 OTTER CREEK TACTICAL BASIN PLAN pg. 38
Figure 22. Comparison of Basin, HUC12, and NHD+ Catchment spatial scales used in this plan.
The LC TMDL also incorporates an “Accountability Framework” to ensure that P reduction actions are implemented at a sufficient pace to meet the TMDL requirements. While the specific timeline for lake improvement isn’t specified by the TMDL, an estimate of the projected P reduction is identified within each TBP on a 5-year, rotating basis. Beginning in 2018, the “Accountability Framework” is built around the priority milestones contained in the each of the Phase 2 Implementation (Tactical Basin) Plans. Each TBP’s implementation table lays out priority actions to be taken by specific dates and if not specified, the 5-year basin planning cycle is implied. Those actions and dates constitute the report card elements for the basin. EPA envisions issuing an interim report card halfway through each 5-year cycle and a formal assessment at the end of the cycle. The TBP implementation tables translate the results of the integrated assessments into spatially explicit areas for project implementation and support programmatic and partner installation of BMP’s in order to reduce P loads by a projected amount for each planning cycle. These science-based assessments also serve to identify where additional regulatory program requirements may need to be brought to bear. Tactical basin plan implementation tables will be frequently updated to reflect the implementation of practices that are required as a result of regulatory program requirements.

2019 OTTER CREEK TACTICAL BASIN PLAN pg. 39
Subsequent iterations of TBP implementation tables will be considered as subsequent phases of TMDL implementation, which are intended to:
1. Document and report on progress made per assessment and implementation efforts,
2. Identify gaps in programmatic capacity the jurisdictions will need to address in the next 5-year cycle for each major river basin in the LCB,
3. Identify corollary and/or co-benefits from project implementation, and
4. Revisit local, regional, and federal engagement strategies and commitments.
D. Priority Areas for Restoration By analyzing the priority waters list and areas identified as sources in TMDL’s, the following focus areas have been identified for water quality restoration by land use sector, i.e., Agriculture, Developed Lands—Stormwater, Developed Lands--Roads, Wastewater, and Natural Resources. (see detailed sector descriptions in Ch. 4).
Table 4. Focus areas for implementation of water quality projects by land use sector in Basin 3.
Sector Focus Areas (not to exclude work in other areas)
Strategies
Dead Creek, Little Otter Creek, Lewis Creek, Upper and Lower Lemon Fair
• Support regional agricultural working group • Hold annual soil health, BMP, and/or RAP
workshops • Support farmers in developing and
implementing Nutrient Management Plans (NMPs)
• Initiate a regional equipment sharing program • Identify areas lacking vegetated riparian buffer
zones and promote buffer planting programs • Identify areas where agriculture is coincident
with wetlands to guide restoration efforts • Conduct water quality monitoring and research
to understand P, bacteria, and sediment source areas
Rutland City, West Rutland, Rutland Town, Mendon,
Brandon, Pittsford, Clarendon,
Middlebury, Vergennes
• Develop Stormwater Master Plans/Reports (Ch. 4)
• Implement priority practices from Stormwater Master Plans/Reports
• Develop and implement GSI practices at local schools
• Support MS4 municipalities and non-municipal MS4s in their work to develop and implement Flow Restoration Plans and P Control Plans

2019 OTTER CREEK TACTICAL BASIN PLAN pg. 40
Sector Focus Areas (not to exclude work in other areas)
Strategies
Homer Stone Brook-Otter Creek (i.e.,
Towns of Wallingford,
Tinmouth, Danby, Mount Tabor), Mill Creek (i.e., Mount
Holly, Shrewsbury), Clarendon River (i.e., Ira, Clarendon), and in the headwaters of the Lewis Creek (i.e.,
Hinesburg, Starksboro
• Complete REI’s (Ch. 4) and provide technical support to towns
• Support for towns in applying for funding to target WQ issues
• Address Class 4 WQ issues with support from Addison County Regional Planning Commission (ACRPC), Chittenden County RPC (CCRPC), and Rutland RPC (RRPC)
• Host Workshops and Peer to Peer sharing on BMP’s
• Identify towns in need of equipment and apply for shared equipment grant funding
Timber harvest areas, A(1) and B(1) watersheds
• Support skidder bridge program • Promote AMPS and implementation of
Voluntary Harvesting Guidelines with an emphasis on riparian buffer protections
Tinmouth, Cedar Lake (Monkton
Pond), Lake Dunmore, Fern Lake
• Support Lake Wise planning, assessment and implementation
• Complete a Lake Wise assessment of Tinmouth Pond and Cedar Lake (Monkton Pond) and implement practices
Rutland City, Chittenden, Mendon, Goshen, Lewis Creek,
Cold River, East Creek, Middlebury River, Mill Brook,
Moon Brook, Mussey Brook, New Haven
River
• Develop and implement projects from river corridor plans
• Restore floodplain access and stream stability through active projects or river corridor easements & buffer planting projects
• Remove obsolete or compromised dams (e.g., Dunklee Pond Dam).
• Strategic wood additions in locations where this is identified by VFW and USFS.
• Provide outreach to communities on floodplain and river corridor protections
Otter Creek Watershed
• Increased mapping of wetlands by municipalities or by VDEC, which becomes a public facing advisory layer on the ANR Atlas
• Analyze restoration potential maps and pursue restoration of high priority areas
*Project partners are identified in Chapter 5.
2019 OTTER CREEK TACTICAL BASIN PLAN pg. 41
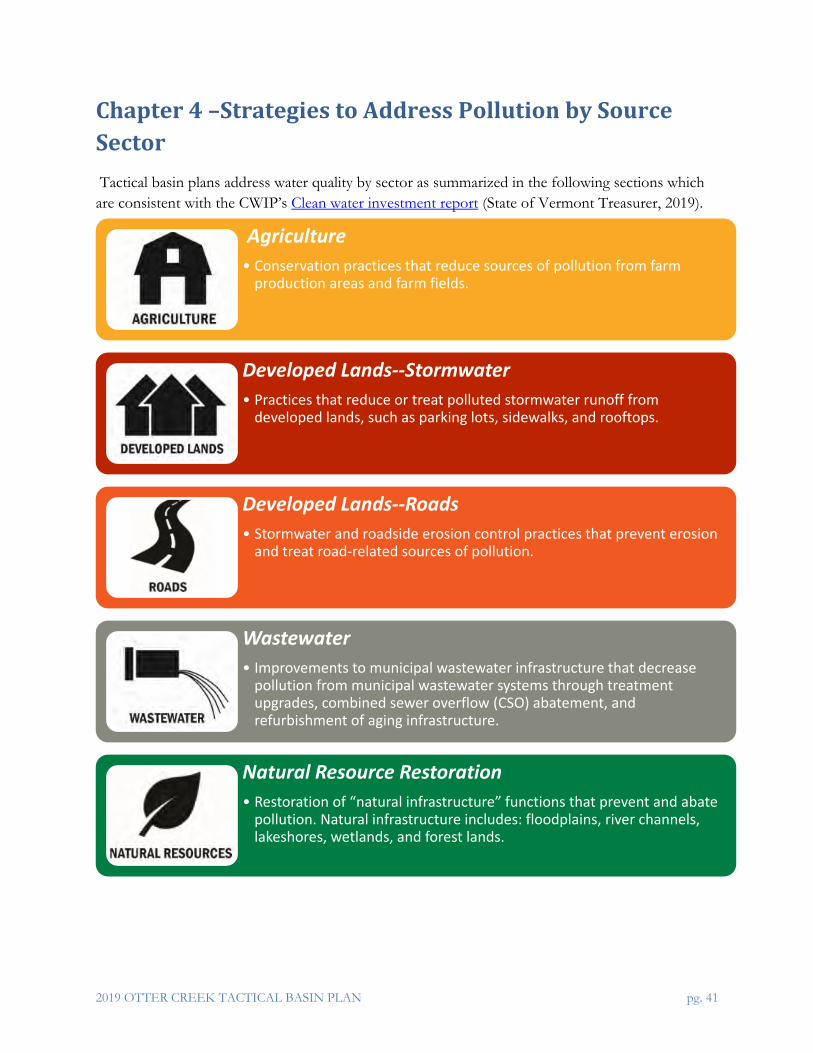
Chapter 4 –Strategies to Address Pollution by Source Sector Tactical basin plans address water quality by sector as summarized in the following sections which are consistent with the CWIP’s Clean water investment report (State of Vermont Treasurer, 2019).
Agriculture• Conservation practices that reduce sources of pollution from farm
production areas and farm fields.
Developed Lands--Stormwater• Practices that reduce or treat polluted stormwater runoff from
developed lands, such as parking lots, sidewalks, and rooftops.
Developed Lands--Roads• Stormwater and roadside erosion control practices that prevent erosion
and treat road-related sources of pollution.
Wastewater• Improvements to municipal wastewater infrastructure that decrease
pollution from municipal wastewater systems through treatment upgrades, combined sewer overflow (CSO) abatement, and refurbishment of aging infrastructure.
Natural Resource Restoration• Restoration of “natural infrastructure” functions that prevent and abate
pollution. Natural infrastructure includes: floodplains, river channels, lakeshores, wetlands, and forest lands.

2019 OTTER CREEK TACTICAL BASIN PLAN pg. 42
A. Agriculture Agriculture accounts for 21% of Basin 3 land use and is concentrated in Dead Creek, Little Otter Creek, Lower Otter Creek, and the Upper and Lower Lemon Fair (Figure 23). Runoff from agriculture adversely affects 122.4 miles of rivers and 668 acres of lakes in the basin. These estimates represent 62% of the total impaired river miles and 41.3% of the total stressed/impaired lake acreage in the basin. Agricultural loads are 49% of the estimated P loading to Lake Champlain from the Otter Creek segment (Figure 21).
Agriculture can adversely affect water quality as nutrients, pathogens, and sediments are exported from farms when waste storage facilities or erosion control methods fail, or heavy rains and floods inundate fields and wash sediment, manure, or fertilizer from fields and farmstead areas. Conversely, well managed agricultural lands and implementation of BMPs can filter precipitation, improve soil health, and remove nutrients through vegetative uptake (i.e., from crops or riparian buffers), especially in comparison to developed lands.
This section presents basin specific strategies to address agricultural water resource impairments through regulatory programs, BMP implementation, funding sources, outreach efforts, and partnerships. The tactical basin planning approach engages local, regional, and federal partners in the development of these strategies needed to accelerate agricultural BMPs to meet the state’s clean water goals including reductions to comply with the LC TMDL. This section is organized around the Vermont Agency of Agriculture, Food, and Markets (VAAFM) regulatory programs including the Required Agricultural Practices (RAPs), the Large Farm Operation Program (LFO), the Medium Farm Operation Program (MFO) and the Certified Small Farm Operations Program (CSFO), and the available agricultural assistance and outreach programs, and local coordination efforts.

2019 OTTER CREEK TACTICAL BASIN PLAN pg. 43
Figure 23. Combined agricultural land uses in Basin 3. Percentages are for the entire basin and each individual HUC12 watershed.
EXPLANATION OF FIGURE High-resolution mapping (≈1m) shows agricultural land use is concentrated in the Dead Creek, Little Otter Creek, Lower Otter Creek, and Upper and Lower Lemon Fair and these areas are coincident with many agriculture related water quality listings (red lines, Data source: https://bit.ly/2YD88g5)).

2019 OTTER CREEK TACTICAL BASIN PLAN pg. 44
Agricultural Regulatory Programs
The VAAFMs RAPs, formerly the Accepted Agricultural Practices, and existing MFO and LFO permit programs set baseline farm management practices to ensure environmental stewardship. MFO and LFO permits have been in place for over 10 years. The RAPs were revised in 2016 and again in 2018 to support the necessary P load reductions required by the Lake Champlain and Lake Memphremagog TMDLs and nitrogen reductions for the Long Island Sound TMDL. The RAP revisions will result in a significant increase in practice implementation by requiring nutrient management plans (NMPs) within the new small farm certification program, increasing vegetative buffers, and reducing maximum soil erosion rates.
Large (LFO) and Medium (MFO) Farm Operation Programs
VAAFM’s LFO Program requires farms
Project Spotlight-2014-15 Last Resort Farm Gully Stabilization
Water quality monitoring by the Lewis Creek Association (LCA), a member of the Addison County River Watch Collaborative (ACRWC), identified chronic exceedances of VWQS in the lower Pond Brook tributary. During SGAs in 2012, erosion from 6 gullies originating along the edge of hay fields on the Last Resort Farm was identified as a likely contributing source of sediment and nutrients to Pond Brook.
Post-practice water quality monitoring is underway, with provisional results from the summer of 2018 indicating a significant reduction in TP and Turbidity during high-flow conditions (Figure 2). Post-implementation water quality monitoring, including targeted storm events, will continue in 2019 and 2020 with funding from LaRosa Program Organizational Support and Analytical Support grants.
Figure 1. NRCS Rock-Lined Waterway practice installed
to stabilize Gully #3, Jan 2015
With grant funding from the NRCS EQIP and the VANR ERP, and in-kind labor and materials from LCA and the landowner, 6 gullies were stabilized from 2014-2015 using stone-lined waterway practice (Figure 1) and bioengineering practice of stone lined waterways including log check dams.
Figure 2. Water quality monitoring conducted at a downstream station on the Pond Brook before (2012-2013) and after
(2018) gully stabilization during high-flow conditions. Whiskers denote standard
error of the mean.
2019 OTTER CREEK TACTICAL BASIN PLAN pg. 45
with > 700 mature dairy cows or the equivalent in other livestock types to operate under an individual permit. The MFO Program requires farms with 200-700 mature dairy cows or the equivalent to operate under a general permit. Both permit program requirements exceed those of the technical components of the Federal Clean Water Act and aim to reduce the amount of P and other pollutants entering state waterways.
As of the date of this plan, there are 11 individually permitted LFOs and 23 MFOs with coverage under the MFO General Permit in the basin (Figure 24). VAAFM inspects all LFOs annually and all MFOs every 3 years. Inspections include assessments of farm NMPs, production area assessments of all facilities associated with the permitted operation, and cropland management assessments in accordance with the farm’s individual NMP, the RAPs, and the VWQS.
Certified Small (CSFO) and Small Farm Operations (SFO) Programs
VAAFM’s CSFO program began July 1, 2017, and supports farmers to ensure their clear understanding of the RAPs, while helping assess, plan, and implement any conservation and management practices necessary to meet water quality goals. CSFOs (defined as having 50-199 dairy cows or equivalents in other species) are required to annually certify their operations and are inspected at least once every 7 years. VAAFM estimates there are 55 farms in Basin 3 that meet the CSFO threshold. In 2018, 44 CSFOs submitted the required annual certification. Based on the 2018 CSFO annual certifications, CSFOs manage at least 16,170 acres (or 2.3%) in Basin 3 (Figure 24). Priority watersheds for inspection in this basin include the Dead Creek, and Upper and Lower Lemon Fair watersheds. Since the program is new, many CSFOs have not yet been inspected and so much of the current effort is focused on education and outreach about regulations and financial and technical assistance programs.
The VAAFM estimates 64 SFOs in Basin 3 will fall within RAP jurisdiction, but do not need to certify. These farms have less than 50 dairy animals (or equivalents in other species), and are not regularly inspected, but must follow the RAPs. VAAFM or VDEC will inspect if complaints are received. VAAFM has also identified 317 locations where livestock may be housed, however some of these locations may have livestock numbers or land base below the requirements to follow the RAPs. Figure 24 shows the distribution of farms by size and agricultural land use in each HUC 12 watershed and agriculture related water quality listings. Outreach will continue to the remaining farms or locations to help landowners understand where they fall within the RAP farm size categories and to help them understand the applicable RAP requirements.

2019 OTTER CREEK TACTICAL BASIN PLAN pg. 46
Farm Distribution in Basin 3
Figure 24. Number of farms by size and agricultural land cover in Basin 3 by HUC12 watershed.
EXPLANATION OF FIGURE More farms and agricultural land cover are located in Dead Creek than in any other HUC12 watershed. The Upper and Lower Lemon Fair River also has a high number of farms and agricultural land cover. These areas are coincident with many agriculture related water quality listings (red lines). Based on 2016 LCBP 1m data, the dominant agricultural land cover in most watersheds is hay.
2019 OTTER CREEK TACTICAL BASIN PLAN pg. 47
Agricultural Assistance and Outreach Programs
In addition to work completed to meet regulatory requirements, farm operators have increased voluntary adoption of BMPs in recent years with increased availability of technical and financial assistance throughout the basin. VAAFM and NRCS fund programs that assist farmers with developing NMPs, implementing field and farmstead practices, and purchasing equipment to improve water quality. For information about VAAFM programs go here and for NRCS programs go here.
Figures 25-28 represent field and farmstead BMPs implemented through state and federal assistance programs during this planning cycle. Figure 25 shows VAAFM and NRCS combined acreage of Basin 3 field BMPs from 2012-2018. The most popular field practice types are cover cropping and crop rotation with 29,900 acres of cover crop and 16,651 acres of crop rotation practices implemented between 2012-2018. Basin wide field BMP acreage increased from 2012-2018 due to increased usage of crop rotation, cover cropping, and conservation tillage practices. Prescribed grazing acreage declined from 2012-2018.
Many farmers implement conservation practices without state or federal financial assistance and these are not included in Figures 25-28. In 2019, the VAAFM launched the Multi-Partner Agricultural Conservation Practice Tracking and Planning Geospatial Database (“Partner Database”) to improve planning and tracking of NRCS, VAAFM, and farmer-funded agricultural field and farmstead BMP implementation across the state. During the next basin planning cycle, data from the Partner Database will be reviewed by VDEC, then uploaded into the CWRF, which contains the BATT. The BATT will be used to calculate P reductions for Lake Champlain and Lake Memphremagog. The BATT will also account for BMPs by estimating combined P reduction effectiveness (i.e., multiple practices on one farm) of BMP systems with individual BMPs having different lifespans.

2019 OTTER CREEK TACTICAL BASIN PLAN pg. 48
Figure 26 shows the top three field BMPs applied to agricultural fields in 2018 in HUC12 watersheds with high modeled P loads. This indicates many field BMPs were funded and implemented in high priority watersheds where the largest P reductions are required. During the next Basin 3 planning cycle, BMPs will be tracked using the VAAFM Partner Database and the CWIP’s CWRF and BATT will be used to assign practice-specific P reduction values at the site scale.
EXPLANATION OF FIGURE Basin 3 field BMPs increased from 2012-2018 due to increased use of cover cropping (+318%), crop rotation (+273%), and conservation tillage (+202%). These data represent funding of field BMPs and as a result, a decrease over time reflects ending payments for a given practice. In reality however, the farmer may continue implementing the practice. Also, acreage of some field BMPs may overlap as each practice is counted separately, but may occur on the same field area.
0
2000
4000
6000
8000
10000
12000
14000
16000
18000
2012 2013 2014 2015 2016 2017 2018
ACRE
S
YEAR
Cover Crop Crop Rotatation Conservation TillagePrescribed Grazing Corn-Hay Conversion
Figure 25. Acreage of VAAFM and NRCS field BMPs installed in Basin 3 from 2012-2018.

2019 OTTER CREEK TACTICAL BASIN PLAN pg. 49
Figure 26. 2018 VAAFM and NRCS field BMPs by HUC 12 and modeled P load. Note: Acreage of some field BMPs may overlap as each practice is counted separately, but may occur on the same field area.
EXPLANATION OF FIGURE 2018 field BMPs were implemented in watersheds with high modeled P loads (e.g., Dead Creek and Lower Lemon Fair). Continued progress toward meeting the LC P TMDL will require more field practices be implemented in the Otter Creek and the Upper Lemon Fair watersheds as well as those with little/no practice implementation.
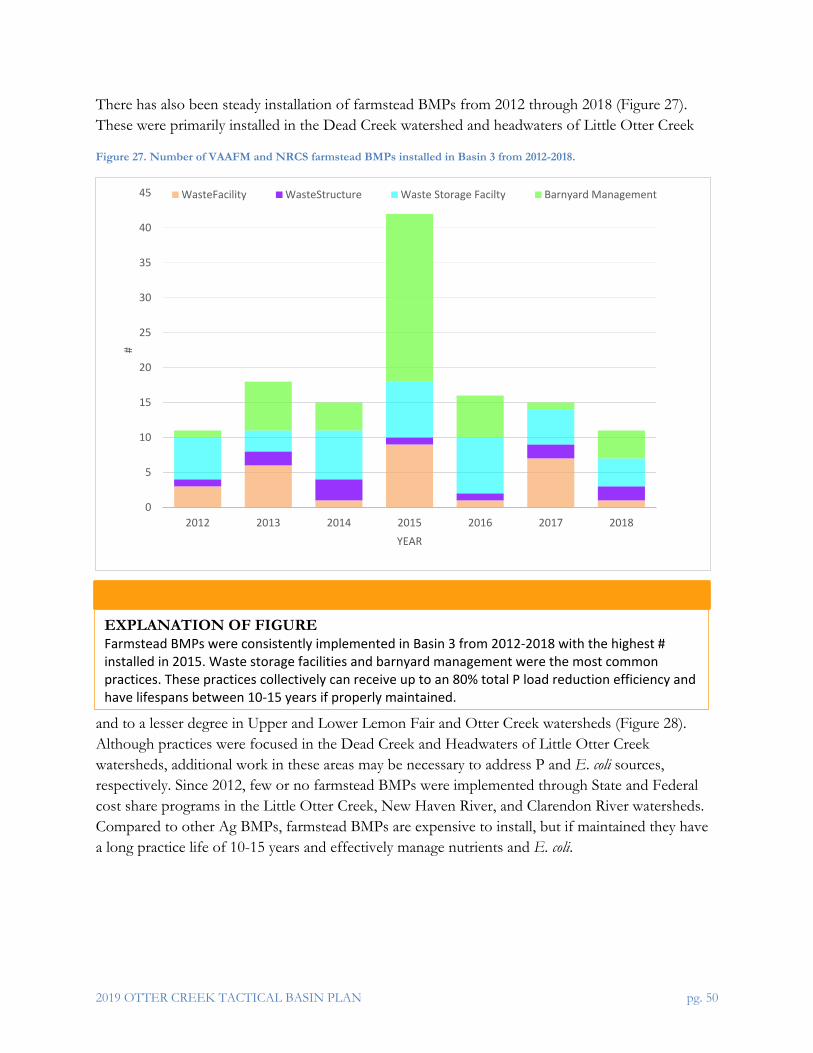
2019 OTTER CREEK TACTICAL BASIN PLAN pg. 50
There has also been steady installation of farmstead BMPs from 2012 through 2018 (Figure 27). These were primarily installed in the Dead Creek watershed and headwaters of Little Otter Creek
and to a lesser degree in Upper and Lower Lemon Fair and Otter Creek watersheds (Figure 28). Although practices were focused in the Dead Creek and Headwaters of Little Otter Creek watersheds, additional work in these areas may be necessary to address P and E. coli sources, respectively. Since 2012, few or no farmstead BMPs were implemented through State and Federal cost share programs in the Little Otter Creek, New Haven River, and Clarendon River watersheds. Compared to other Ag BMPs, farmstead BMPs are expensive to install, but if maintained they have a long practice life of 10-15 years and effectively manage nutrients and E. coli.
EXPLANATION OF FIGURE Farmstead BMPs were consistently implemented in Basin 3 from 2012-2018 with the highest # installed in 2015. Waste storage facilities and barnyard management were the most common practices. These practices collectively can receive up to an 80% total P load reduction efficiency and have lifespans between 10-15 years if properly maintained.
0
5
10
15
20
25
30
35
40
45
2012 2013 2014 2015 2016 2017 2018
#
YEAR
WasteFacility WasteStructure Waste Storage Facilty Barnyard Management
Figure 27. Number of VAAFM and NRCS farmstead BMPs installed in Basin 3 from 2012-2018.

2019 OTTER CREEK TACTICAL BASIN PLAN pg. 51
Figure 28. 2012-2018 VAAFM and NRCS farmstead BMPs implemented by HUC 12 and modeled P load.
EXPLANATION OF FIGURE The majority of 2012-2018 Basin 3 farmstead BMPs were installed in watersheds with high modeled P loads (e.g., Dead Creek and Headwaters Little Otter Creek). Continued progress toward meeting the LC P TMDL will require more farmstead BMPs in the Upper and Lower Lemon Fair, Otter Creek, Little Otter Creek, and New Haven River watersheds as well as those with no BMPs (e.g., Clarendon River).

2019 OTTER CREEK TACTICAL BASIN PLAN pg. 52
Figure 29. Annual average estimated total P load reduction (kg/yr.) achieved by state-funded agricultural pollution prevention projects implemented SFY 2016-2018, and projected reductions based on currently implemented practices for the 5-year, Basin 3 planning cycle.
Local planning, goal development, and implementation—Agriculture In order to coordinate agricultural water quality improvement efforts identified through the basin planning process, several pre-existing watershed and farm-focused organizations have been actively engaging their communities for several years. These include: VAAFM, UVM Extension, NRCS, the ACRWC, Lewis Creek Association, the Champlain Valley Farmer Coalition, NRCDs, and RPCs.
12.2 12.2 12.2 12.2 12.2 12.210.5 10.5 10.5 10.5 10.5 10.5
9.9 10.3
11.9 11.9 11.9 0.5
113.790.6
181.3
120.3
13.4
0
50
100
150
200
250
2016 2017 2018 2019 2020 2021 2022 2023Tota
l Pho
spho
rus
Load
Red
uctio
n (K
ilogr
ams/
Year
)
Annual conservation practices (minimum duration 1 yr.)Crop rotation and associated practices (minimum duration 5 yrs.)Livestock exclusion from surface waters (minimum duration 15-30 yrs.)Forested riparian buffer restoration (minimum duration 15-30 yrs.)
Achieved within SFY 2016-2018 reporting period
Projected based on projects'expected lifespan
EXPLANATION OF FIGURE P reductions achieved by agricultural projects increased in SFYs 2018-2019 compared to the previous 2 years. Projected P reductions, based on projects’ anticipated lifespan (see legend), are shown to the right of the dashed line. The 2020-2023 projections don’t account for the most commonly used annual practices, and as a result, are underestimates. Practices must be maintained for pollutant reductions to continue in future years.

2019 OTTER CREEK TACTICAL BASIN PLAN pg. 53
Public forums were held in Basin 3 over several years of this planning process. Sustaining and coordinating with these groups is an important strategy in this plan to effectively target agricultural BMP implementation to improve water quality. Examples of priority actions from the public forums include:
• Hosting annual workshops on improving soil health, RAPs revisions, and the Flood Hazard & River Corridor Rule, implementing conservation tillage and cover cropping practices,
• Supporting farmers in developing NMPs and creating a program to continue to work with priority farms on implementing NMPs,
• Developing regional equipment sharing programs to support the implementation of cover cropping,
• Conducting outreach to promote buffer planting programs across the basin, • Developing water quality monitoring and outreach aimed at understanding P, bacteria, and
sediment source areas in the Dead Creek, Little Otter Creek, and Lemon Fair watersheds.
Click the following hyperlink to view summary strategies to address Runoff from Agricultural Lands.

2019 OTTER CREEK TACTICAL BASIN PLAN pg. 54
B. Developed Lands -- Stormwater
Despite the primarily rural character of much of Basin 3, stormwater runoff contributes to many of the basin’s water quality issues. Urban streams such as Moon and Mussey Brooks have stormwater TMDLs and exhibit impacts from stormwater runoff. Stormwater also affects water quality where growth areas have encircled traditional Vermont towns and villages or where runoff from developments was improperly directed onto unstable soils or slopes. Examples can be found in villages and towns such as Brandon and Bristol. Stormwater runoff from developed lands also degrades water quality of many upland lakes through impacts from encroachment on the littoral zone and nutrient and sediment loading. These include Chipman Lake, Fern Lake, Cedar Lake (Monkton Pond), and Richville Pond.
This section integrates basin specific information on stormwater-related water resource impairments, regulatory programs, stormwater master plans (SWMPs), Illicit Discharge Detection and Elimination (IDDE) studies, implementation efforts, and partnerships to inform strategies to address water resource impairments. The tactical basin planning approach engages local, regional, and federal partners needed to accelerate stormwater treatment practice implementation in the development of these strategies in order to meet the state’s clean water goals including reductions needed to comply with the LC P TMDL. The section is organized around regulatory programs including the 3 acre permit, Municipal Separate Storm Sewer System Permit (MS4), and then SWMP and IDDE studies, which are the primary drivers for voluntary implementation efforts in the basin. Stormwater runoff from roadways is considered separately in the next section of this plan.
Stormwater Regulatory Programs
Operational three-acre impervious surface permit program
Act 64 of the 2015 Vermont State Legislature requires the VDEC Stormwater Program to issue a general permit in 2019 for stormwater from so-called “three-acre sites”. These sites have 3 or more acres of impervious surface and lack a stormwater permit based on the 2002 Vermont Stormwater Management Manual. The Program has identified and notified affected owners. The list of those sites can be found here. Basin 3 parcels will need to apply for permit coverage by 2023. Since this date is at the end of the 5-year timeframe for this plan, voluntary SWMPs will be the primary drivers for stormwater implementation efforts for this planning cycle. Though early adoption of the 3-acre permit requirements is encouraged.
It is anticipated that the “three-acre impervious surface” program will address the developed lands P reductions necessary to achieve the LC TMDL that are not addressed by other developed lands programs. Once the program is implemented, this projection will be verified by tracking P reductions achieved through implementation using the CWIP’s CWRF and BATT. If additional

2019 OTTER CREEK TACTICAL BASIN PLAN pg. 55
reductions are required to implement the LC TMDL, developed lands permitting requirements may be adjusted accordingly.
Stormwater Master Planning and Outreach
Stormwater master plans (or reports) have been completed or are planned for 25/44 of the communities with stormwater systems in Basin 3 (Table 5). Below are brief updates on the stormwater master planning efforts in several of these communities.
Table 5. Progress of Basin 3 towns toward completing Stormwater Master Plans or Reports.
Rutland Town--Moon Brook
Moon Brook is an impaired waterway, and has been impacted by uncontrolled stormwater runoff, including increased flow, elevated temperature, and other stressors. The 2016 Flow Restoration Plan (FRP) for the section of the Moon Brook Watershed (MBW) that falls within the Town of Rutland was developed in accordance with requirements for Municipal Separate Storm Sewer System (MS4) entities. This FRP became part of the MS4 stormwater permit plan prepared by the Town of Rutland. The purpose of this Moon Brook FRP was to identify the necessary stormwater BMPs that will be used to achieve the flow restoration targets prescribed in the Moon Brook TMDL document.
Rutland City--Moon Brook
As of the writing of this plan, a flow Restoration Plan (FRP) Stormwater Master Plan (SWMP) to reduce stormwater flow, temperature, and sediment, and nutrient loading is being drafted for the MBW. The SWMP will enable the City to identify and pursue priority projects such as infiltration basins, gravel wetlands, sand filters, underground storage, etc. to make progress toward the flow reductions called for in the 2008 Moon Brook TMDLs.
The SWMP identified 32 stormwater “problem areas” and 20 projects were selected for further development and design. These sites were assessed via an in-depth ranking matrix that includes
SWMP Status
Complete Planned Incomplete
Towns Brandon, Bristol, Charlotte, Danby, Dorset, Ferrisburgh, Hinesburg, Hubbardton, Ira, Killington, Lincoln, Middlebury, Mount Holly, Pittsford, Proctor, Orwell, Rutland Town, Rutland City, Shoreham, Starksboro, Vergennes, Wallingford, West Rutland
Clarendon Addison, Bridport, Buels Gore, Chittenden, Cornwall, Goshen, Leicester, Mendon, Mount Tabor, Monkton, New Haven, Panton, Ripton, Shrewsbury, Salisbury, Sudbury, Tinmouth, Waltham, Weybridge, Whiting

2019 OTTER CREEK TACTICAL BASIN PLAN pg. 56
pollutant reductions and cost estimations. Once outreach has been completed and there is comitment from landowners, 30% designs will be produced for at least 3 of these projects.
The outcome of the study will be the development of a comprehensive retrofit plan that will achieve flow targets as set forth in the Moon Brook TMDL. Prioritized projects will be included in the Watershed Projects Database.
East Creek and Tenney Brook SWMP
A SWMP for the East Creek and Tenney Brook in the City of Rutland was completed in December of 2014. Creating the SWMP involved research into the stressors faced by the water bodies within the watershed, assembling all relevant data in a watershed data library and assessing that data for quality and completeness, as well as generating new data where necessary to support future management actions. Finally, a series of recommendations were made as to priority project sites. 18 project sites were identified, conceptual designs were completed for 8/18 projects, and 3 of these projects have been implemented.
East Creek and Tenney Brook flow through some moderately-to-heavily urbanized areas of Rutland Town and Rutland City, leading to increased flows in the streams, as well as sediment and nutrient wash-off. The presence of combined sewers in Rutland City leads to combined sewer overflows. These overflows have led to 303(d) listing of East Creek as E. coli impaired.
The City, the Rutland Natural Resources Conservation District (RNRCD), and Watershed Consulting Associates, LLC, developed a broad array of projects, from traditional end-of-pipe BMPs like gravel wetlands and infiltration galleries, to more distributed green stormwater infrastructure practices like bioretention and sub-surface infiltration galleries integrated into a new ‘green streets’ boulevard in the heart of the City. Extensive water quality modeling for all priority projects allowed the team to create a ranking matrix that will help the RNRCD and City develop a priority list of projects.
Brandon
The Town of Brandon SWMP was completed in 2017 and identified 6 parcels within Brandon with 3 acres or more of impervious surfaces. The following 5 were selected for further development to 30% engineering designs: 1. Park Street, 2. Pearl Street, 3. Café Provence parking lot area, 4. West Seminary Street Public Park, and 5. Rite Aid / Hannaford’s. Additional opportunities for project development include:
• Installation of stormwater improvements for the Parking lot behind Café Provence BMPs (e.g., Café Provence) project, receiving drainage from Chase Street, a portion of High Street and the southern end of Pinehurst Street.
• Park Street is considered for a “Green Street” design and there is already a conceptual overview (Figure 30).

2019 OTTER CREEK TACTICAL BASIN PLAN pg. 57
Figure 30. Park Street Green Plan Conceptual Design. Green = targeted areas for installation of bioswales upgradient from drop inlets to better infiltrate stormwater runoff.
Bristol
The Town of Bristol SWMP was completed in 2019. A total of 55 stormwater “problem areas” were identified and prioritized, including opportunities for BMP installation, erosion control, and gully prevention and stabilization. Twenty projects were selected for further development and design. The following 4 projects were completed with 30% designs:
(1) A system of sub-surface chambers is envisioned for the School St 001, a 3-acre site.
These chambers would sit under the park and essentially be invisible, other than a manhole structure that would be used for operation and maintenance access. Total annual phosphorus removal is estimated to be 57 lbs. Total estimated cost is $610,000.
(2) North St 001: similar to (1) this project would be substantially larger than either of the smaller two systems and therefore require a temporary loss of use of the park during construction. This project also has the potential to encounter additional challenges in the form of underground utilities or other conditions. Total annual phosphorus removal is estimated to be 103 lbs. Total estimated cost is $997,000.
(3) School 1 & 2: another infiltration system similar to the above two. A system of sub-surface chambers is envisioned for the School 1 (northern) and School 2 (southern) sites. These chambers would sit under the playground and essentially be invisible, other than a manhole structure that would be used for operation and maintenance access. Total annual phosphorus removal for School 1 is estimated to be 95.5 lbs. and School 2 is 7 lbs. Total estimated cost for School 1 is $1,000,000 and School 2 is $162,000.
(4) West St 002 and 003: A series of dry wells of different sizes could be used in this area to replace existing catch basins. The dry wells would capture runoff and slowly bleed it off through the perforations in the bottom and sides, with a grate and overflow pipe that would function similarly to a normal catch basin. Total annual phosphorus removal is estimated to be 9.5 lbs. Total estimated cost is $20,000.

2019 OTTER CREEK TACTICAL BASIN PLAN pg. 58
Middlebury
The Town of Middlebury completed a Stormwater Infrastructure Report (SWIR) in 2012. Ten stormwater problem areas were identified and prioritized. Creation of an in-depth SWMP in 2016 followed completion of the SWIR. The SWMP focused on subwatersheds in Middlebury’s downtown area, approximately 37.1 acres, of which 12.5 acres are impervious. The Plan found 23 potential sites available for retrofits. Three 30% designs were completed, which include a series of stormwater retrofits and implementation of new management practices that build on each other. At this time, further design for these projects is not being pursued due to the high cost of projects and the impact to private landowners.
In 2019, Middlebury received a Better Connections Transportation and Community Development grant. The project includes “Green Alley” improvements for Bakery Lane, Mill Street, and Printer’s Alley, such that street repaving incorporates green stormwater features, including a gravel subbase with permeable pavers, planters, and wall vegetation. These practices will reduce stormwater runoff into Otter Creek or into catch basins with outfalls to Otter Creek. They also reduce P, petroleum residue, and road salts from pavement runoff entering the Creek. Plantings, planter boxes, and green walls will reduce the volume of runoff on narrow streets.
Wallingford
Five hundred and fifty-two acres were assessed for stormwater pollution and a SWMP was developed for the Otter Creek Watershed in the Town of Wallingford, Vermont. The completed SWMP includes a review of pre-existing data, on-the-ground assessment of problem areas, and a detailed identification of projects.
Eight 30% designs have been completed for BMPs, four stormwater retrofit sites and four road erosion sites. These are sites where stormwater treatment structures could be added and where they would be most cost effective and efficient for removal of nutrients and sediment. This will enable the Town to more efficiently plan for and implement watershed management activities.
Basin wide Illicit Discharge Detection and Elimination (IDDE) Study
A 2014 IDDE study was completed for the following 7 towns in Rutland County: Benson, Castleton, Fair Haven, Poultney, Proctor, Wallingford, and West Rutland. The goal of the project was to improve water quality by identifying and eliminating contaminated, non-stormwater discharges entering stormwater drainage systems and discharging to the Otter Creek, the Poultney River, and their tributaries. The geographic scope included the entirety of the municipal closed drainage systems in these towns. The final reports are available at: https://bit.ly/2QQH4Un and https://bit.ly/2ydaDHe.
A second IDDE study was also completed in 2014 for the following 6 towns in the Otter Creek Basin: Brandon, Middlebury, Pittsford, Rutland City, Rutland Town, and Vergennes. The goal of the project was to improve water quality by identifying and eliminating contaminated, non-stormwater
2019 OTTER CREEK TACTICAL BASIN PLAN pg. 59
discharges entering stormwater drainage systems and discharging to the Otter Creek and its tributaries. The project encompassed the entirety of the municipal closed drainage systems in the six towns.
Through these studies several sewage and industrial wastewater discharges were detected and eliminated in the communities of Wallingford, Rutland City and Rutland Town, Proctor, Brandon, Middlebury, and Vergennes. These studies also produced comprehensive developed land stormwater infrastructure maps for each municipality (https://bit.ly/2YbZrFh).
Local planning, goal development, and implementation—Stormwater
The VDEC and local conservation partners are working together to set watershed specific priorities that ensure that expected pollutant load reductions are consistent with any wasteload allocation for developed lands in a TMDL, and to ensure consistency with the VWQS. In order to coordinate stormwater related water quality improvement efforts identified through the basin planning process, the ACRPC, RNRCD, and RRPC have taken the lead by working closely with local communities. Examples of stormwater strategies to improve water quality include:
• Map parcels that will come under the 3-acre stormwater permit in the basin and do outreach to landowners that will be required to seek permit coverage.
• Reduce stormwater inputs into water resources in villages and town centers through SWMPs and prioritization.
• Implement high priority practices from municipal SWMPs. See VDEC’s Stormwater Infrastructure Mapping directory.
• Implement practices using green infrastructure and low impact development techniques, with a focus on Rutland Town and City, West Rutland, Brandon, Bristol, Vergennes, Middlebury, and other high priority catchments.
• Identify towns in need of SWMPs/reports. • Support funding of stormwater practice implementation. • Identify and correct potentially errant connections identified by IDDE assessment.
Click the following hyperlink to view summary strategies to address Stormwater pollution.

2019 OTTER CREEK TACTICAL BASIN PLAN pg. 60
C. Developed Lands--Roads
It is estimated that more than 75% of Vermont roads were constructed prior to any requirements for managing stormwater runoff (Otter Creek Basin plan, 2012). Where road networks intersect the stream network, the roads and their ditches effectively serve as an extension of the stream network (Wemple et al., 1996). Runoff from municipal roads is a source of sediment and nutrients in Basin 3 which contribute to water quality issues in the basin (Ch. 3) Specifically, road runoff loads are 5% of the estimated P loading to Lake Champlain from the Otter Creek segment (Figure 21).
This section integrates basin specific information on transportation-related water resource impairments, road erosion inventories (REIs), road practice implementation, regulatory programs, and existing partnerships to inform strategies to address transportation-related water resource impairments. The tactical basin planning approach engages local, regional, and federal partners needed to accelerate transportation-related practice implementation in the development of these strategies in order to meet the state’s clean water goals including reductions needed to comply with the LC TMDL. The section is organized around the regulatory programs including the Municipal Roads General Permit (MRGP), the Transportation Separate Storm Sewer System Permit (TS4), and the Municipal Separate Storm Sewer System Permit (MS4) as these regulatory programs are the driving factor in road water quality implementation efforts in the basin.
Roads Regulatory Programs-Municipal Roads General Permit
The 2015 MRGP is a stormwater general permit for non-MS4 cities and towns signed into law as part of Act 64. The MRGP is intended to achieve significant reductions in stormwater-related erosion from paved and unpaved roads. The permit requires each municipality to conduct a REI of hydrologically connected road segments by 12/31/2020 to determine if they meet MRGP standards. A road segment is ≈ 100 meters or 328 feet in length. Hydrologically connected roads are those municipal roads within 100 feet of or that bisect a wetland, lake, pond, perennial or intermittent stream, or a municipal road that drains to one of these water resources. These road segments represent ≈ 60% of municipal roads and can be viewed using the “Municipal Road Theme” on the VANR Natural Resource Atlas. Road segments are assessed as Fully Meeting, Partially Meeting, or Not Meeting the MRGP standards.
MRGP standards include: road crowning, stabilizing drainage ditches and turnouts, and upgrading drainage culverts and intermittent stream culverts. VDEC has established a timeline with milestones to guide towns through the MRGP requirements (Figure 31). Towns will use the REI results to prioritize road upgrades with goal of all connected municipal roads meeting the MRGP standard by 12/31/2036.

2019 OTTER CREEK TACTICAL BASIN PLAN pg. 61
Figure 31. MRGP timeline and milestones.
This plan recommends that technical and financial assistance be prioritized for interested towns based on the water quality benefit and feasibility of a project. Very High Priority road segments “Do Not Meet” standards and have >10% slope and high erosion risk (Table 6). Resources available from the Clean Water Fund (e.g. VDEC Grants-in-Aid and VTrans Better Roads grants) assist with the completion of REIs, development of designs, capital budgets, cost estimates and implementation of road projects. Completion of these projects may be counted towards meeting the requirements of the MRGP if roads meet MRGP standards. For additional information see the VDEC Municipal Roads Program. Table 6. Prioritization of municipal road segments based on MRGP REI and slope. Road segments that do not meet standards and are on a steep slope are priorities for water quality protection.
MRGP Status 0-4% slope or Low Road Erosion Risk
5-9% slope or Moderate Road Erosion Risk
10%+ slope or High Road Erosion Risk
Fully Meets - - - Partially Meets
Low priority Moderate priority Moderate priority
Does Not Meet
Moderate priority High priority Very High priority
VDEC has partnered with regional planning commissions to offer training, technical assistance, outreach, and funding for REIs, road upgrades, and equipment purchases to assist municipalities with the MRGP requirements. To-date these efforts have resulted in ≈73% of Basin 3 towns having completed a REI (Table 7). Results of REIs that have been uploaded to the MRGP database are now online and can be viewed by town and REI inventory status. Many towns that completed earlier

2019 OTTER CREEK TACTICAL BASIN PLAN pg. 62
inventories still need to upload the assessments into the database and all remaining towns will complete inventories by December 2020.
Table 7. Progress of Basin 3 towns toward completing Road Erosion Inventories.
In order to implement the LC TMDL requirements for the roads sector, this plan identifies priority areas for road improvement projects based on available REIs and P modeling results. From the uploaded inventories, towns in the Homer Stone Brook-Otter Creek, Mill Creek, Clarendon River, Furnace Brook, and in the headwaters of the Lewis Creek watersheds have a high proportion of Very High Priority road segments and high modeled TP loading (Figure 32).
REI Status Complete Planned (2019) Planned
(2020) Incomplete
Towns Addison, Brandon, Bridport, Charlotte, Chittenden, Clarendon, Cornwall, Danby, Dorset, Hinesburg, Hubbardton, Huntington, Ira, Leicester, Lincoln, Mendon, Monkton, Mount Holly, Mount Tabor, Orwell, Panton, Pittsford, Proctor, Salisbury, Shoreham, Shrewsbury, Starksboro, Sudbury, Vergennes, Wallingford, West Rutland
Bristol, Ferrisburgh, Middlebury, New Haven, Rutland City, Tinmouth, Waltham
Goshen Whiting
Killington, Ripton, Rutland Town
EXPLANATION OF TABLE The REI due date is 12/31/2020 and this table highlights the rapid adoption of the MRGP guidance. To date ≈73% of Basin 3 towns have completed REIs.

2019 OTTER CREEK TACTICAL BASIN PLAN pg. 63
Figure 32. Hydrologically connected roads, their MRGP status, and modeled TP loading by HUC12 watershed in Basin 3 (roads data are from July 2019).
As of July 2019, 47% of hydrologically connected road segments in the basin have been assessed and meet the MRGP standards. The MRGP permit mandates that, at a minimum, 15% of the non-compliant road segments need to be brought into compliance by 2023. Many towns have already begun utilizing State-funded grant programs to address non-compliant road segments. Of the 42 towns in the basin, in State Fiscal Year (SFY) 2017, 24 enrolled in Grants-in-Aid and in SFY 2019,
EXPLANATION OF FIGURE Areas where Very High Priority road segments (red) are coincident with high modeled TP loading are prioritized for road improvement project implementation. Towns in the Homer Stone Brook-Otter Creek (i.e., Wallingford, Tinmouth, Danby, Mount Tabor), Mill Creek (i.e., Mount Holly, Shrewsbury), Clarendon River (i.e., Ira, Clarendon), and in the headwaters of the Lewis Creek (i.e., Hinesburg, Starksboro) watersheds have the highest #s of very high priority road segments.

2019 OTTER CREEK TACTICAL BASIN PLAN pg. 64
30 enrolled in Grants-in-Aid to receive financial support for addressing hydrologically connected roads. As a result, the miles of state-funded municipal road drainage and erosion control improvements increased nearly 1.5-fold from SFY 2017 to SFY 2019.
The assessment process of the MRGP is ongoing and is expected to be finished at the end of 2020. By tracking the mileage of completed road improvements, VDEC will be able to calculate local P reductions. However, calculating TP load reductions around BMP implementation and developing the methodology to do so for roads has yet to be finalized, so this projection cannot currently be applied to P reductions. In the next basin planning cycle, when all road assessments are completed and the loading methodology is finalized, load reduction projections will be reported.
Figure 33. Annual average estimated TP load reduction (kg/yr.) achieved by state-funded stormwater treatment and road erosion remediation projects implemented/constructed, SFY 2016-2018, and projected reductions during the 5-year, Basin 3 planning cycle
Local planning, goal development, and implementation—Roads
Local planning efforts are enhanced through formal basin planning grant agreements which fund the ACRPC and RRPC to provide support to towns. The ACRPC developed a tablet-based application for road crews use when conducting REIs. The ACRPC natural resource and transportation
514
39 39 39 39 39
1
3
3 3 3 3 3
6
16
42 42 42
0
10
20
30
40
50
60
70
SFY 2016 SFY 2017 SFY 2018 SFY 2019 SFY 2020 SFY 2021
Tota
l Pho
spho
rus
Load
Red
uctio
n (k
g/yr
)
Stormwater Treatment (minimum duration 20 years)Road Erosion Remediation (minimum duration 8 years)
Achieved within SFY 2016-2018 reporting period
Projected based on projects'expected lifespan
42 42
SFY 2022 SFY 2023
ND
EXPLANATION OF FIGURE P reductions increased as a result of road erosion practices installed in SFYs 2017 and 2018. Projected P reductions, based on projects’ anticipated practice life (see legend), are shown to the right of the dashed line. Practices must be maintained for reductions to continue into future years.

2019 OTTER CREEK TACTICAL BASIN PLAN pg. 65
committee(s) also provide technical support and training in use of the application, assistance in prioritizing road BMPs, help for towns developing Capital Improvement Plan (CIP) budgets, and applying for Better Road grants and Municipal Grants in Aid to implement projects identified in CIPs.
In 2019, a Clean Water Advisory Committee (CWAC) was established at the RRPC. This committee focuses on providing municipalities with outreach, technical and financial assistance, and additional training to assist towns with the upcoming MRGP requirements. Specifically, the CWAC is working with towns to complete REIs, develop CIP budgets, and support towns in applying for funding.
Click the following hyperlink to view summary strategies to address Runoff from Municipal Roads.
State Managed Roads (Transportation Separate Storm Sewer System General Permit – TS4)
The 2017 TS4 General Permit is a stormwater permit for all VTrans owned or controlled infrastructure. The permit requires VTrans to develop comprehensive Phosphorus Control Plans (PCPs) for their developed land in each lake segment. This includes state roads, garages, park and rides, welcome centers, airports, and sand and gravel operations. The PCPs will require inventories of all regulated surfaces, establishment of baseline phosphorus loading per lake segment, and a prioritized schedule for implementation of BMPs to achieve the lake segment percent phosphorus reductions.
VTrans will address state roads under the TS4. The permit requires VTrans to reduce the discharge of pollutants from the TS4 to the maximum extent practicable through compliance with the six minimum control measure requirements throughout the entire State.
On April 1, 2019, VTrans submitted an analysis of the P baseload from their owned and controlled land. A target of 245.96 kg/year was established for the Otter Creek lake segment basin, to be achieved by 2036. A small portion of those lands drain to the North Lake Champlain planning basin, although the exact location of P reductions will not be determined until the PCP is completed. VTrans is required to submit a generalized PCP by April 1, 2020, which will include an estimate of the area (acreage or road miles) to be treated and the extent and type of BMPs to meet the entire phosphorus load reduction. By October 1st in 2020, 2024, 2028, and 2032 each, VTrans will submit a more detailed PCP that achieves on average 25% of the total reduction to Lake Champlain in each 4-year period.
Click the following hyperlink to view summary strategies to address Runoff from VTrans Roads and Infrastructure.
Municipal Separate Storm Sewer Systems permit (MS4)
The Municipal Separate Storm Sewer System permit is a permit for municipalities with census designated urbanized areas and stormwater impaired watersheds. Both the City of Rutland and the

2019 OTTER CREEK TACTICAL BASIN PLAN pg. 66
Town of Rutland are designated MS4s. Under the MS4 permit, Rutland City and Rutland Town are required to develop Flow Restoration Plans (FRPs) to achieve the flow restoration targets in Moon Brook. They must also develop comprehensive PCPs to achieve required P reductions for their respective lake segment, on developed land owned or controlled by the municipality. These municipalities will not need separate permit coverage under the MRGP or for any municipally-controlled 3-acre parcels as these requirements will be incorporated into the PCPs within the municipality. The PCPs will include requirements to inventory municipally owned or controlled developed lands, estimate P loading from developed land, and identify BMPs and an implementation schedule to achieve the required reductions.
The City of Rutland has applied for an Individual MS4 permit to address both the Moon Brook Thermal TMDL and the Moon Brook Stormwater TMDL. The Town of Rutland has applied for the General MS4 permit and will be developing a PCP for municipally owned or controlled developed land by April 1, 2021.
Click the following hyperlink to view summary strategies to address Runoff from MS4 communities.

2019 OTTER CREEK TACTICAL BASIN PLAN pg. 67
D. Wastewater
In Basin 3 there are 9 municipal wastewater treatment facilities. All of these are subject to NPDES discharge permit requirements issued by the State of Vermont (Table 8). Wastewater loads are 3% of the estimated P loading to Lake Champlain from the Otter Creek segment (Figure 21).
Controlling Phosphorus from Wastewater Treatment Facilities and Other Industrial Discharges
This section provides additional information regarding wastewater treatment facilities in Basin 3. As of the issuance of this Plan, all facilities are presently operating under administrative continuance of existing permits, which were issued in conformance with the allocations in place under the remanded 2002 LC TMDL. The 2016 LC TMDL did not alter the allowable P discharge loads from WWTFs that discharge to the Otter Creek segment of Lake Champlain, and as such, no specific requirements for upgrade are addressed by this plan. This does not eliminate requirements for ongoing operation and maintenance of these facilities, nor scheduled engineering performance reviews required of all VT WWTFs. The municipal wastewater discharge permits in place in the basin are shown in Table 8. As part of a necessary refinement of the facility-specific P wasteload allocations, the WSMD, with assistance from municipalities, is conducting an extensive sampling effort to document the current P loading conditions, and determine the “reasonable potential” that WWTF's have to cause or contribute to downstream water quality impairment. In addition, the approved 2016 LC TMDL presents a wasteload allocation for P loads, to which each facility in the basin will adhere (Table 3). To minimize the financial impact of WWTF WLA reductions on communities, VDEC will employ flexibility in meeting WLA targets by:
• Expressing effluent P limits in permits as total annual mass loads. • Providing a period for optimization to be pursued and the corresponding load reduction
results to be realized, and then commencement of the process to upgrade P treatment facilities will be required when actual P loads reach 80% of the TMDL limits.
• Establishing P compliance schedules in discharge permits that allow adequate time for planning, engineering, and municipal budgeting.
• Providing other forms of flexibility that support achieving the wasteload allocations in an optimally cost-effective manner, including P trading and integrated planning and permitting.
Facility-specific information
This section of the plan is intended to provide additional information about wastewater treatment facilities in Basin 3. As of the issuance of this Plan, all facilities are presently operating under

2019 OTTER CREEK TACTICAL BASIN PLAN pg. 68
administrative continuance of existing permits, which were issued in conformance with the allocations in place at the time of their last issuance.

2019 OTTER CREEK TACTICAL BASIN PLAN pg. 69
Table 8. Summary of current permit requirements for the wastewater treatment facilities in Basin 3.
Facility (permit ID)
Permit expiration (yr.)
Planned permit reissuance (yr.)
Design flow (MGD)
IWC* 7Q10 /LMM
Current permitted load (mt TP/yr.)
TMDL Allocated Waste load (mt TP/yr)
Current % of Design Flow (2017)
Treatment type
# of CSOs
Receiving water
Brandon 2011 2021 0.700 0.363/0.133 0.580 0.580 59% Extended aeration
0 Neshobe River
Middlebury 2013 2021 2.200 0.022/0.010 1.823 1.823 47% Sequential batch reactor
4 Otter Creek
Otter Valley Union High School
2012 2021 0.025 0.369/0.137 0.173 0.173 45% Aerated lagoons
0 Otter Creek
Pittsford 2011 2021 0.085 0.011/0.005 0.483 0.483 58% Extended aeration
0 Furnace Brook
Proctor 2011 2021 0.325 0.006/0.002 0.359 0.359 62% Aerated lagoons
0 Otter Creek
Rutland 2008 2021 8.100 0.152/0.069 5.634 5.634 51% Extended aeration
5 Otter Creek
Vergennes 2009 2021 0.750 0.006/0.003 0.621 0.621 40% Aerated lagoons
1 Otter Creek
Wallingford FD 1
2011 2021 0.120 0.013/0.004 0.829 0.829 33% Extended aeration
0 Otter Creek
West Rutland
2011 2021 0.450 0.141/0.036 0.364 0.364 47% Sequential batch reactor
0 Clarendon River
Instream Waste Concentration – or the proportion of river flow at lowest base (7Q10) and low median monthly (LMM) flow attributable to discharge, for the facility design flow. Note that the IWC is specific to the flow of receiving water.

2019 OTTER CREEK TACTICAL BASIN PLAN pg. 70
Brandon
The Town of Brandon owns and operates the Brandon Wastewater Treatment Facility, an activated sludge extended aeration process that provides phosphorus removal. Dechlorination follows the addition of liquid chlorine for disinfection. Solids are trucked to the City of Rutland WWTF for dewatering. The collection system consists of seven pump stations.
The Town of Brandon was issued a 1272 Order on March 8, 2018, addressing a recent 12-inch sewer line break in the Neshobe River. The Order required the repair of the line and an engineering inspection and evaluation within 18 months. This facility is also nearing the end of its anticipated design life having been originally constructed in 1961.
Middlebury
The Town of Middlebury owns and operates the Middlebury Wastewater Treatment Facility, a sequencing batch reactor (SBR) activated sludge process with chemical addition for phosphorus removal and ultraviolet light disinfection. The facility receives domestic sewage from the Town, as well as industrial process wastewater from the Agri-Mark dairy processing facility, Vermont Hard Cider, Otter Creek Brewing, and other industrial sources.
The Town of Middlebury received an Administrative Order on Consent from USEPA – Region 1 on April 25, 2016, to continue work to reduce wet weather overflows from the collection system. The Town submitted an Overflow Control Plan on June 26, 2018, with recommended improvements and a project timeline to reduce wet weather overflows at Pump Stations No. 3 and No. 9.
Otter Valley Union High School
Otter Valley Union High School owns and operates a wastewater treatment facility consisting of two in series concrete aeration lagoons, a clarifier, and sand filter, followed by chlorine disinfection.
Pittsford
The facility consists of the headworks, the Aero-Mod Technology extended aeration treatment system and a separate chlorine disinfection tank followed by de-chlorination. Effluent is discharged into Furnace Brook, a tributary of the Otter Creek.
Proctor
The treatment system at this facility consists of two aerated lagoons. Ultraviolet light is used for disinfection and then the wastewater is discharged to Otter Creek

2019 OTTER CREEK TACTICAL BASIN PLAN pg. 71
Rutland
The City of Rutland operates the Rutland Wastewater Treatment Facility which is an extended air activated sludge treatment system. The facility currently receives and treats wastewater from the City of Rutland and some areas of the Towns of Rutland, Mendon, Killington and Clarendon. A project to upgrade the facility’s digestors is in planning.
The City has five active CSOs. The Northwest Neighborhood Sewer Separation Project was completed in 2015. A 2017 report showed it had little effect on the incidence of CSOs, but appears to have reduced their duration and total volumes. The City recently installed advanced flow monitoring on all of its CSOs and now can report much more accurate overflow data. The development of projects to decrease the number, duration, and volumes of CSO events is ongoing.
The City of Rutland was issued a 1272 Order on May 8, 2018, requiring compliance with the applicable requirements of state and federal law, including the VWQSs. The Order required the implementation of the 9 Minimum Controls for CSOs as well as the creation of a Long-Term Control Plan (LTCP). The LTCP is due May 2020.
Vergennes
The City of Vergennes owns and operates the Vergennes Wastewater Treatment Facility which is a super-primary aerated lagoon system followed by chemical addition and filtration for phosphorus removal. The facility discharges tertiary treated, chlorinated wastewater to Otter Creek.
The City of Vergennes was issued a 1272 Order on April 20, 2018, to address the one Sanitary Sewer Overflow in the collection system. The Order required the City to submit a completed Long-Term Control Plan with a list of projects and a timeline for implementation.
Wallingford FD 1
The Wallington Fire District #1 owns and operates the Wallington Fire District #1 Wastewater Treatment Facility. The facility provides secondary treatment consisting of extended aeration in an oxidation canal. Chlorination is provided for disinfection.
West Rutland
The Town of West Rutland owns and operates the West Rutland Wastewater Treatment Facility, a secondary treatment facility that utilizes sequential batch reactor (SBR) technology and UV light disinfection. The facility was upgraded and expanded in 2000 when the design flow increased from 0.325 to 0.450 MGD.
Click the following hyperlink to view summary strategies to address Loading from WWTF.

2019 OTTER CREEK TACTICAL BASIN PLAN pg. 72
E. Natural Resource Restoration--Forests
Forest lands cover 59% of Basin 3 and are important for safeguarding many high-quality surface waters in the basin. Management activities take place on a portion of those lands for the benefits of maintaining healthy forest communities, improving wildlife habitat, addressing non-native invasive plants, contributing to the working landscape economy, and addressing poorly designed legacy road infrastructure. Improving management and oversight of harvesting activities can help reduce sediment, nutrients, petroleum products, and woody debris that can end up in surface waters if Acceptable Management Practices (AMPs) are not followed. As the dominant land cover type in Basin 3, reducing runoff and erosion from forests is important to meeting the state’s clean water goals including reductions needed to comply with the LC TMDL. Specifically, forest loads are 17% of the estimated P loading to Lake Champlain from the Otter Creek segment (Figure 21).
This section is organized around the Vermont Department of Forest, Parks, and Recreation (VDFPR) Acceptable Management Practices for Logging Jobs, Vermont Voluntary Harvesting Guidelines to protect forest health and Sustainability, local skidder bridge programs, information minimizing water quality impacts from maple sugaring operations, and forest land conservation efforts.
Forest Regulatory Programs-Acceptable Management Practices
The VDFPR updated the Accepted Management Practices (AMPs) for maintaining water quality and minimizing erosion on logging jobs in Vermont effective as of August 11, 2018. Vermont first adopted these rules 1987. The AMPs provide measures for loggers, foresters, and landowners to utilize, before, during, and after logging operations to comply with the VWQS. Specifically, their intent is to prevent any mud, petroleum products and woody debris (logging slash) from entering the waters of the State and to otherwise minimize the risks to water quality. Updates in 2018 include standards for permanent crossing on intermittent streams. Key modifications are found here. Permits are necessary for “Heavy Cutting” of 40 acres or more. Only a small percentage of harvesting in Vermont is done through this type of cutting, so there are very few (approximately 40-50) heavy cut permits each year. Most logging operations do not require a permit. The website for heavy cut permits is here: https://bit.ly/2Y4H06b. Harvesting over 2,500 feet in elevation requires an Act 250 permit and harvests where biomass chips go to Vermont power plants require a chip harvest permit from the VT Department of Fish and Wildlife. The VDFPR is promoting and demonstrating the use of portable bridge designs on timber harvesting operations throughout Vermont, including programs to rent bridges in the basin. When properly installed, used, and removed, skidder bridges minimize stream bank and stream bed disturbance as compared with alternative devices, such as culverts or poled fords. In addition,

2019 OTTER CREEK TACTICAL BASIN PLAN pg. 73
bridges reduce the occurrence of sedimentation, channeling, and degradation of aquatic habitat, while allowing loggers to harvest timber in compliance with the AMPs.
Limiting Phosphorus Loading from Forest
For the Otter Creek Basin, an overall TP reduction target of 5% has been allocated to all forest lands. The primary sources of forest land P export are forest roads and harvest areas, which are addressed in the 2018 AMPs. Thus, EPA suggests the 5% reduction called for in the Reasonable Assurance scenario is easily supported.
Based on watershed TP modeling in support of the TMDL, Figure 34 identifies areas where forest TP export is highest. While TP loading rates are generally low in forested areas, areas with steep slopes and thin soils could be problematic for forest road building and harvest activity. These areas should receive the most oversight to control the downstream effects of erosion. In addition, there is a rebuttable presumption that all lands enrolled in Vermont’s Use Value Appraisal (UVA) Program, better known as the “Current Use” Program, are compliant with AMPs per the implementation of Forest Management Plans developed as a requirement of participating in the UVA Program. In Basin 3, 128,552 acres (23.7%) of forest lands are UVA Forest, 125,477 acres (23.1%) are Non-Forest UVA, and 288,583 acres (53.2%) are Non-UVA Forest.

2019 OTTER CREEK TACTICAL BASIN PLAN pg. 74
Figure 34. Estimated forest TP loading for Otter Creek towns and HUC12 watersheds and TP load reduction potential.
EXPLANATION OF FIGURE Modeled TP loading is highest in the headwaters of Otter Creek (i.e., Danby and Mount Tabor) and Lewis Creek (i.e., Starksboro), which are characterized by steep slopes and erodible/thin soils. If allocated reductions were completely applied to these top 20 HUC12s, approximately 27% of the necessary reductions from forest land could be realized.

2019 OTTER CREEK TACTICAL BASIN PLAN pg. 75
The mapped TP export shown in Figure 34 identifies the highest-loading catchments by town and lists the forest load as well as the potential P load reduction if the respective lake segment reduction targets were applied. If allocated reductions were completely applied to these top catchments, approximately 27% of the necessary P reductions from forest land could be realized.
Local planning, goal development, and implementation —Forests
The VDFPR, the VDEC, and partner organizations are offering training, technical assistance, outreach, and funding to maintain forest lands for water quality as well as many other benefits. Local planning efforts are enhanced through formal basin planning grant agreements which fund the RPCs and NRCDs to provide support to towns. For example, between 2014-2018, the RNRCD rented portable skidder bridges out on 14 different occasions. The RNRCD also provides technical support and training in use of the bridge. Continued support for this program and outreach necessary to maximize the use of the bridges will support water quality improvements in the basin. Another strategy in the plan is to support outreach to private forestland owners, foresters, and loggers on the revised AMPs and voluntary harvesting guidelines.
Click the following hyperlink to view summary strategies to address Runoff from Forest Lands.
F. Natural Resource Restoration--Lakes
Restoration of lakeshores is critical to meeting the state’s clean water goals in Basin 3. In the absence of lake BMPs, developed shorelands may contribute 5% more runoff, 7% more P, and 18% more sediment than undeveloped shorelands.
This section includes basin specific information about lake shoreland conditions and the Lake Wise program which is the VDEC’s program for restoring lakeshore habitat. Tactical basin planning supports Lake Wise assessments by identifying lakeshore problems, engaging local communities, lake and watershed organizations, and partners. This section provides a summary of lake shoreland conditions in the basin, a brief update on the shoreland protection act, and a discussion of how Lake Wise restoration efforts can improve shoreland conditions in this basin.
Shoreland Condition
The Vermont Lake Score Card uses the same thresholds used by the USEPA National Lake Assessment to score a lake as good, fair or poor for lakeshore disturbance whenever possible (see Next Generation Lake Assessment). A detailed explanation of how shoreland scores are calculated can be found at: https://bit.ly/2SHDBbN. Richville Pond, Rutland City Reservoir, and Chipman Lake have poor (red) shoreland scores and 18 others have fair (yellow) shoreland scores (Table 9).

2019 OTTER CREEK TACTICAL BASIN PLAN pg. 76
Table 9. Basin 3 Lakes with Poor or Fair Shore and Habitat Scores.
Lake Name Town Shore & Lake Habitat Score
Burr Pond Pittsfield Fair
Cedar Lake (Monkton Pond) Monkton Fair
Chittenden Reservoir Chittenden Fair
Danby Pond Danby Fair
Danyow Pond Ferrisburgh Fair
Dow Lake Middlebury Fair
Lake Dunmore Salisbury Fair
Elfin Lake Wallingford Fair
Emerald Lake Dorset Fair
Fern Lake Leicester Fair
Hallock Lake Starksboro Fair
Silver Lake Leicester Fair
South Chittenden Fair
Star Lake Mount Holly Fair
Patch Pond Rutland City Fair
Porter Pond Ferrisburgh Fair
Winona Lake (Bristol Pond) Bristol Fair
Walker Hubbardton Fair
Richville Pond Shoreham Poor
Rutland City Rutland Town Poor
Chipman Lake Tinmouth Poor
The largest fair or poor lakes are Lake Dunmore in Salisbury, Chittenden Reservoir in Chittenden, Winona Lake (Bristol Pond) in Bristol, Richville Pond in Shoreham, and Silver Lake in Leicester. Fifteen out of 36 lakes assessed in the basin have good condition shorelands with the largest being Wallingford Pond in Wallingford, Lefferts Pond in Chittenden, and Spring Pond in Shrewsbury.

2019 OTTER CREEK TACTICAL BASIN PLAN pg. 77
Effective July 1, 2014, the Vermont Legislature passed the Shoreland Protection Act which regulates shoreland development within 250 feet of a lake’s mean water level for all lakes greater than 10 acres in size. The Act’s intent is to prevent degradation of water quality in lakes, preserve habitat and natural stability of shorelines, and maintain the economic benefits of lakes and their shorelands. The Act seeks to balance good shoreland management and shoreland development. Shoreland developed prior to July 1, 2014, is not required to retroactively meet standards.
Lake Wise Program
The Lake Wise Program, an VANR initiative that awards lake-friendly shoreland properties, is available to lakeshore owners and Lake Associations to assess shorelands for improvements that benefit water quality and wildlife habitat. Lakes with a fair or poor shoreland score will benefit from implementing Lake Wise Program BMPs. The program provides on-site review of shoreland conditions and recommendations for lessening the impact of existing shoreland development on a lake. Lake Wise participants passing all 4 categories for driveway, structures and septic systems, recreation areas, and shorefront receive the Lake Wise Award, which can include a sign to be displayed on the property. Lake Associations are also awarded the “Gold Award,” depending on the percentage of shoreland owners participating in Lake Wise. Landowners wishing to retrofit their property to meet Lake Wise standards are given a list of BMPs that can be easily implemented. Participation is tracked and a cumulative benefit of the program in terms of improved property management can be calculated. To date, Fern Lake and Lake Dunmore are the only lakes with Lake Wise assessments in the basin.
The VDEC is developing a Lake Wise master planning process whereby coordinated Lake Wise assessments catalogue potential BMP projects and landowner interest in implementing these. The BMPs will be prioritized based on their ability to reduce nutrient runoff and improve habitat conditions along lakes and landowner interest in implementing BMPs. Chipman Lake and Richville Pond are priorities for Lake Wise master planning.
Click the following hyperlink to view summary strategies to address Runoff from Lakeshore Properties.
Aquatic Invasive Species
Of the 30 lakes and ponds assessed for AIS in the basin, 11 have identified AIS. They are Beaver Pond (Proctor), Cedar Lake ((Monkton Pond, Monkton), Chipman Lake (Tinmouth), Lake Dunmore (Salisbury), Fern Lake (Leicester), Porter Lake (Ferrisburgh), Richville Pond (Shoreham),

2019 OTTER CREEK TACTICAL BASIN PLAN pg. 78
Rutland City (Rutland), Star Lake (Mount Holly), Vergennes Watershed (Bristol), and Winona Lake (Bristol Pond, Bristol). Strategies to support AIS spread prevention efforts include:
• Regular and expanded AIS monitoring,
• Initiating AIS Greeter Programs, and
• AIS spread prevention through signage or Vermont Invasive Patroller program.
Click the following hyperlink to view summary strategies to address Aquatic Invasive Species.
G. Natural Resource Restoration--Rivers Rivers constantly balance the energy they produce and the work that must be done to carry the water, sediment, and woody material produced in their watersheds. A change in any of these factors will cause adjustments of the other variables until the river system comes back into equilibrium. These changes can be caused by natural events and by human activity. Human activities can disrupt the balance by changing flow inputs to the channel (e.g., by deforestation, increasing impervious surfaces and runoff, or water withdrawals) or by changing sediment regime (e.g., dams, dredging, or in response to intensified erosion). In Basin 3, changes are frequently caused by natural flood events, increases in impervious surfaces and runoff, channel straightening, beaming, and dams. The impact of these actions may be seen immediately or for decades after the activity occurred.
The VDEC has a goal of managing rivers to protect and restore their equilibrium condition. Stream equilibrium is essential for good water quality, healthy aquatic habitat, and flood resilience in the basin and will help to mitigate impacts of increased runoff and streamflow described in the Climate Change section. The degraded geomorphic condition of some of the basin’s streams has the following consequences:
• water quality (e.g., accelerated streambank erosion, higher E. coli populations caused by increased fine sediment resuspension and bank erosion, and nutrient and sediment runoff from encroachment of impervious surfaces and agricultural land),
• impacts to wildlife and fish habitat (e.g., riparian buffer removal reduces shading and habitat for insects and fish, channel alteration destroys aquatic habitat), and
• public safety (e.g., loss of floodplains that store floodwaters, accelerated streambank erosion leading to infrastructure damage, and channel straightening that increases flow velocity during rain events).
This section includes basin specific information on how to improve river connectivity in the basin. River connectivity means that a river is connected longitudinally, laterally, vertically, and temporally to support stream equilibrium and riparian habitat. A connected river freely flows from upstream to downstream, meanders and exchanges water with lands, vegetation, and waterbodies alongside its path, freely accesses its floodplain, and cycles through its seasonal flow pattern. The tactical basin

2019 OTTER CREEK TACTICAL BASIN PLAN pg. 79
planning approach engages local, regional, and federal partners in the development of strategies needed to accelerate practices to increase river connectivity and meet the state’s clean water goals including reductions to support the LC TMDL. This section provides an overview of Basin 3 SGAs, aquatic organism passage (AOP) and geomorphic status of culverts and bridges, dams, and community efforts to regulate floodplain and river corridor development, which together guide implementation efforts in the basin to increase river connectivity.
Stream Geomorphic Assessments
Stream geomorphic assessments help us understand the physical integrity of rivers and develop management strategies in support of stream equilibrium. The final products of the assessment are the condition of each reach, the channel adjustment process that may be underway, and the sensitivity of the reach to change from anthropogenic and/or natural sources. Phase 1 and Phase 2 SGAs have been completed on many Basin 3 streams (Figure 35). All final assessment reports are available at the following link. These assessments identify good conditions in some reaches of the Lewis Creek, the New Haven River, and the Middlebury River. Poor conditions are found in Moon Brook, Lewis Creek, and New Haven River tributaries. Data gaps exist in the Lower Otter Creek, which has a Phase 1 SGA, but a Phase 2 lite assessment would be valuable. The highest priority stream segments in the basin have SGAs and will be revisited as needed. Data gaps will be addressed during this 5-year planning cycle.
Additional project development is needed to advance restoration of floodplain access and stream stability through active projects such as: floodplain excavation, berm removal, channel restoration, and/or river corridor easements where feasible. These projects will be key to restoring stream stability and water quality, especially in subwatersheds where nutrient and/or sediment impairment is of concern.

2019 OTTER CREEK TACTICAL BASIN PLAN pg. 80
Figure 35. Geomorphic Conditions of Basin 3 rivers and streams.
EXPLANATION OF FIGURE Lewis Creek, the New Haven River, and the Middlebury River have some of the best geomorphic conditions in the basin, whereas poor conditions are found in reaches of Moon Brook, Lewis Creek, and New Haven River tributaries. Data gaps exist in the Lower Otter Creek, which has a Phase 1 SGA, but a Phase 2 lite assessment would be valuable.
2019 OTTER CREEK TACTICAL BASIN PLAN pg. 81
Reducing Phosphorus from Unstable Stream Channels
The Lake Champlain Phase I Implementation Plan recognizes that it is impossible to achieve the P load reduction targets for unstable streams by restoration activities alone. If the river corridors along incised and straightened stream channels are not protected from encroachment, they will be developed and the potential for cost-effective restoration will be lost. River corridor and floodplain protection ensures that the desired channel evolution, stream equilibrium, and natural floodplain function can take place whether it be from restoration activities or through the natural channel forming processes that occur during floods. Further, the estimation of subwatershed P loading from stream channels would be a scientifically tenuous proposition at any scale smaller than that established by the TMDL. As such, this plan relies on the identification of high priority subwatersheds where SGAs indicate the highest likelihood for P reductions through the pursuit of dynamic stream equilibrium.
Measuring Phosphorus Reductions from Stream Channels
VDEC has developed a methodology to document long-term achievement of the LC TMDL allocation for stream channels. Approved by EPA, the methodology still needs to be piloted and a database developed to support it. The Stream Equilibrium (SE) Tracking Method starts by establishing a total watershed deficit where the existing condition is subtracted from the ideal condition and a total watershed sum is derived by adding the deficit that is calculated for each reach in the watershed. The deficit for each reach is comprised of two components, one to track restoration activities and another to track corridor and floodplain protection activities. This is a novel approach because most tracking tools focus entirely on activities that manipulate the environment to achieve restoration. The total watershed deficit is envisioned to be calculated as shown in Table 10.

2019 OTTER CREEK TACTICAL BASIN PLAN pg. 82
Table 10. Example of the total watershed deficit calculation.
Parameters used for developing Reach Deficit Score: • Incision Ratio – looking at how connected reach is to the floodplain • Confinement – Entrenchment and Flood-prone to Belt-width ratio – determining how much floodplain is available compared to what should be available • Channel Evolution Stage – Determine how far from equilibrium the reach is • Protection – Consideration for ability of stream to obtain/maintain equilibrium over time
Data to support the scoring is largely available in the VT SGA database. The land protection scoring will be developed from existing GIS data layers, and finally, a restoration practice scoring matrix will be developed to score each type of project pursued by the VANR and its partners.
Aquatic Organism Passage (AOP) and Geomorphic Compatibility
Vermont Fish and Wildlife Department have completed VANR Bridge and Culvert assessments of most culverts in Basin 3. Undersized or poorly installed culverts can increase sediment loading and pose a risk to public health when they fail or act as a barrier to sediment movement, which causes erosion downstream of the structure. Culverts can also act as a barrier to AOP, which can negatively affect fish and other species that need to move to gain access to colder water habitats, feeding and spawning locations, and for natural dispersal. The VANR developed a bridge and culvert assessment and screening tool to identify infrastructure in need of replacement or retrofit to restore AOP (Table 11) or address geomorphic issues (Table 12). In addition, a guide for Implementing AOP Enhancement Projects in Vermont (Kirn, 2016) is available and a new culvert mapping tool has been developed by the WSMD MAPP assessment program and can be viewed at http://arcg.is/19eqSD0.

2019 OTTER CREEK TACTICAL BASIN PLAN pg. 83
Table 11. Screening criteria for Aquatic Organism Passage.
VT Aquatic Organism Passage Coarse Screen
Fully Passable for all organisms No outlet drop or obstructions to culvert with sediment through structure and depth at outlet greater than 0.3ft.
Reduced Passage for all organisms Cascade at culvert outlet and sediment not present throughout structure and depth at outlet greater than 0.3ft.
Impassable (except adult salmonids)
Free fall between 0 and 1 ft, or with downstream pool greater than 1 ft depth, and depth at outlet greater than 0.3ft.
Impassable for all aquatic organisms
Free fall greater than 1 ft, or less than 1 ft with downstream pool present or outlet less than 0.3 ft deep
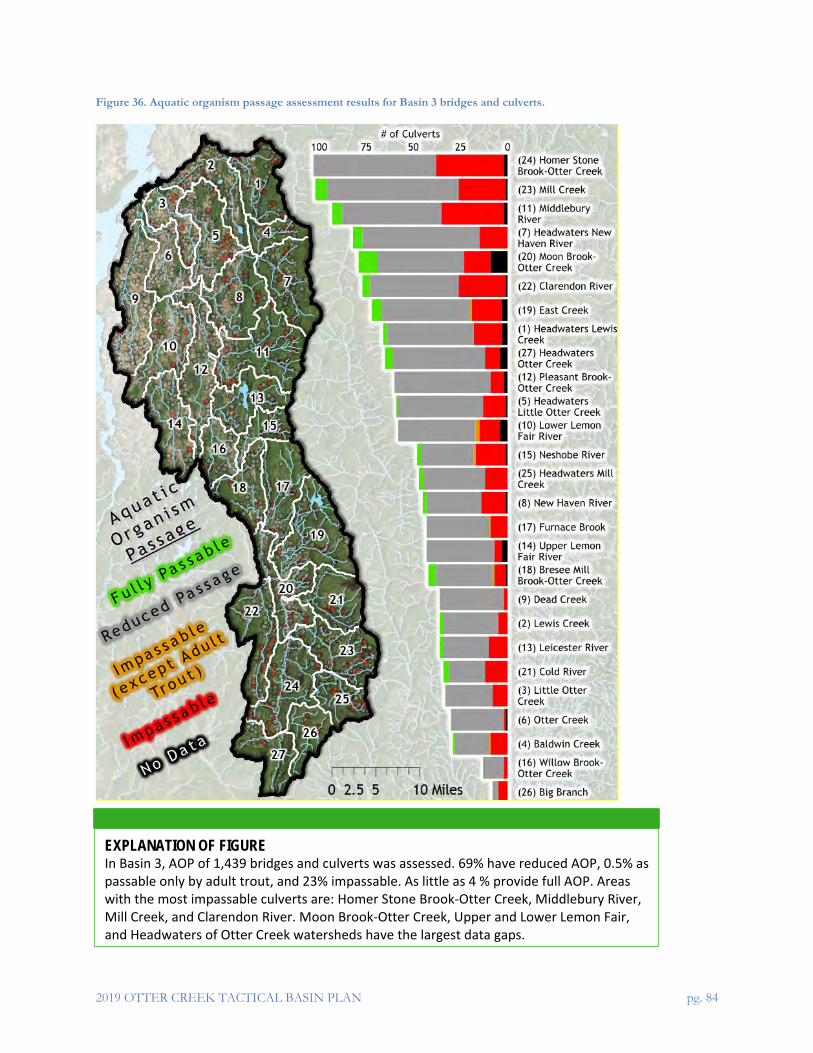
2019 OTTER CREEK TACTICAL BASIN PLAN pg. 84
Figure 36. Aquatic organism passage assessment results for Basin 3 bridges and culverts.
EXPLANATION OF FIGURE In Basin 3, AOP of 1,439 bridges and culverts was assessed. 69% have reduced AOP, 0.5% as passable only by adult trout, and 23% impassable. As little as 4 % provide full AOP. Areas with the most impassable culverts are: Homer Stone Brook-Otter Creek, Middlebury River, Mill Creek, and Clarendon River. Moon Brook-Otter Creek, Upper and Lower Lemon Fair, and Headwaters of Otter Creek watersheds have the largest data gaps.

2019 OTTER CREEK TACTICAL BASIN PLAN pg. 85
Table 12. Screening criteria for Geomorphic Compatibility.
Vermont Geomorphic Compatibility Screen
Fully Compatible-
Excellent
Structure fully compatible with natural channel form and process. There is a low risk of failure. No replacement anticipated over the lifetime of the structure. A similar structure is recommended when replacement is needed.
Mostly Compatible-
Excellent
Structure mostly compatible with current channel form and process. There is a low risk of failure. No replacement anticipated over the lifetime of the structure. Minor design adjustments recommended when replacement is needed to make fully compatible.
Partly Compatible-
Good
Structure compatible with either current form or process, but not both. Compatibility likely short term. There is a moderate risk of structure failure and replacement may be needed. Re-design suggested to improve geomorphic compatibility.
Mostly Incompatible=-
Fair
Structure mostly incompatible with current form and process, with a moderate to high risk of structure failure. Re-design and replacement planning should be initiated to improve geomorphic compatibility.
Fully Incompatible-
Poor
Structure fully incompatible with channel and high risk of failure. Re-design and replacement should be performed as soon as possible to improve geomorphic compatibility.

2019 OTTER CREEK TACTICAL BASIN PLAN pg. 86
Figure 37. Geomorphic compatibility assessment of Basin 3 bridges and culverts.
EXPLANATION OF FIGURE An assessment of geomorphic compatibility of Basin 3 bridges and culverts shows just 3% are fully compatible, 27% are mostly compatible, 48% partly compatible, and 22% are incompatible. Areas with the lowest geomorphic compatibility are: Homer Stone Brook-Otter Creek, Mill Creek, Moon Brook-Otter Creek, and Clarendon River.

2019 OTTER CREEK TACTICAL BASIN PLAN pg. 87
For Basin 3, it is a priority to provide this information to towns as part of the road inventory and capital budget process and to assist in identifying grant funding to address the most significant AOP and geomorphically incompatible structures. These screening tools are a desktop analysis used to flag incompatible culverts and bridges that are the need for replacement or retrofit to restore AOP or address geomorphic issues. Follow-up field visits are needed to fully assess their condition along with coordination with road commissioners to match town priorities with potential funding.
Dams of Basin 3
Dams are the most important channel modifications in Basin 3. There are 103 dams of different types, sizes, and condition in the basin. While dams provide renewable energy and recreational opportunities such as boating, fishing, and swimming, they can also: • impede a stream’s ability to transport flow and sediment; • cause streambank erosion and flooding problems; • degrade and alter fisheries habitat; • create barriers to AOP; • alter downstream temperature; • degrade water quality; and • impede river-based recreational activity. Of the 103 inventoried dams, 95 are in-service, 6 are fully breached, 1 has been removed, and 1 is partially breached. Approximately 50% of the dams in Basin 3 are privately owned. Twenty-two are owned by the VDFW and 14 are hydroelectric dams. The VDEC reviews hydroelectric generating dams as a flow alteration activity and issues a certification pursuant to Section 401 of the federal Clean Water Act (CWA) that the project as operated meets the VWQS. The surface waters impounded by and downstream of these facilities are classified to maintain designated uses at a Class B(2) level of quality. Water quality issues related to hydroelectric dams include flow modification as documented along: East Creek (Chittenden Reservoir, Glen dam, and Patch dam) (Figure 16), and the Leicester River (Salisbury dam) and Lake Dunmore (Figure 15). A tributary to East Creek (Hydro bypass) is also listed as impaired by low DO. A detailed list of known active and historic dams in the basin can be found in Appendix C.
Dam owners are improving management during federal relicensing or by working with partners to remove dams. Dam removal activity in Basin 3 has increased since 2012. An example of a recent dam removal project is the 2014 Kendrick Pond project on Sugar Hollow Brook in Pittsford. It restored 10 miles2 of stream habitat, which supports brown, brook, and rainbow trout (see sidebar below and Flow Blog post at: https://bit.ly/2WZ9VHP). Stream Geomorphic Assessments and site assessments have identified several other dams as priorities for removal in the basin. One of the

2019 OTTER CREEK TACTICAL BASIN PLAN pg. 88
highest priorities is the Dunklee Pond Dam on Tenney Brook in Rutland City. The privately-owned dam is rated as failing, threatens 2 adjacent homes and Route 7, and blocks AOP.
Following a flood event on October 17, 2019, the dam condition deteriorated rapidly, and the decision was made to partially remove the dam on October 30. Full dam removal is anticipated in 2020 and has the support of the dam owners, the Vermont River Conservancy, and the City of Rutland. The City is interested in the project as a flood resiliency initiative to increase public safety. An important co-benefit to the Rutland community is the opportunity for progressive habitat management in an urban environment. Restoration of the impounded area will restore an urban setting to a “natural” state and increase longitudinal river connectivity and ultimately AOP.
On January 18, 2018, H.554 or Act 161, the Dam Safety bill, passed the Vermont House of Representatives and received final approval on May 10th, 2018. The bill was developed collaboratively with the VDEC, Vermont Natural Resources Council, Vermont Trout Unlimited, the Vermont Section of the American Society of Civil Engineers, and other partners. The bill addresses gaps in inspection requirements for hundreds of small dams. Under the bill, VDEC will be required to
Project Spotlight: 2014 Kendrick Pond Dam Removal
a)
b)
a) Before and b) after photos of the Kendrick Pond dam removal site, Pittsford, VT
The removal of the Kendrick Pond Dam (circa 1870) restored 10 square miles of stream habitat in Sugar Hollow Brook. The removal of 12,600 cubic yards of accumulated sediment restored 10 square miles of stream habitat in Sugar Hollow Brook and restored natural sediment transport. The project was a collaborative effort between the Town of Pittsford, the USFWS, and the VANR. The funding was secured from the Eastern Brook Trout Joint Venture Program, the WSMD’s ERP, and the VT Watershed Grant Program.

2019 OTTER CREEK TACTICAL BASIN PLAN pg. 89
maintain an inventory of all dams in the state and develop rules that will require all dams to be regularly inspected.
Floodplain Management
VDEC’s efforts to help towns improving flood resilience includes identifying flood attenuation zones, e.g., floodplains, river corridors, forests and wetlands, and recommending actions and policies to towns that will protect these functions and reduce the risks facing existing development. The Flood Ready website hosts supportive materials for municipal officials including community data on the River Corridor Protections Summary Report and Expanded Community Reports. VDEC River Corridor and Floodplain Protection Program has prepared model flood hazard bylaws to assist municipalities in the development of their flood hazard regulations. These bylaws have been pre-reviewed by the Federal Emergency Management Agency (FEMA) and meet or exceed the requirements of the National Flood Insurance Program (NFIP). In addition, adoption and enforcement of Section D, River Corridors, qualifies communities for enhanced cost share under the Emergency Relief and Assistance Fund (ERAF). ERAF provides State funding to match Federal Public Assistance after federally declared disasters. Eligible public costs are reimbursed by federal taxpayers at 75%. As of October 23, 2014, the State of Vermont contributes an additional 7.5% toward the costs. For communities that take specific steps to reduce flood damage the State will contribute 12.5% or 17.5% of the total cost. Only 5 Basin 3 towns qualify for the 17.5% contribution. However, all towns except Killington and Mount Tabor are participating in the National Flood Insurance Program. All towns except Rutland City have adopted the Town Road and Bridge Standards and most (81%) have adopted a Local Hazard Mitigation Plan (Figure 38). Towns that meet ERAF criteria protect water quality while protecting themselves financially. Questions regarding the model flood hazard bylaws and ERAF should be directed to the appropriate DEC Regional Floodplain Manager: https://bit.ly/2L2rc0e.
Municipal Protections—Zoning and Town Plans
Local zoning and town plan policies can provide community specific protections and guidance to maintain and enhance local water resources. Local protections also afford benefits to downstream communities and water resource users. Although a town may have bylaws or town plan policies it does not mean their resources are afforded the strongest protection. Communities should work with their RPCs to identify opportunities that provide their constituents with the highest level of natural resource protection within their means. Towns with high development pressure, significant impervious surface cover including roads, and extensive development within proximity to water resources are a high priority for protection, as well as those areas with deficiencies related to their protective policies.

2019 OTTER CREEK TACTICAL BASIN PLAN pg. 90
• Protecting river corridors helps protect roads and structures from erosive damage, improves
water quality, moderates flooding, and enhances wildlife habitat. River corridor protection, limits development close to stream and river channels to allow the channel to establish and maintain a least-erosive path through the valley lessening the need to armor channel edges. In recognition of historic settlement patterns, the DEC model river corridor bylaw provides for infill and redevelopment in designated centers and densely developed areas provided that new development does not further encroach on the river relative to pre-existing development.
• Local stormwater regulations prevent runoff of pollutants from hard surfaces into wetlands, rivers and lakes. Stormwater management also slows flow into waterbodies during some flood events.
• Smart planning and design for development through Local Hazard Mitigation Plans (LHMP), floodplain bylaws, and ERAF attainment in towns and villages saves money and lowers the risk of significant loss during flood events, while protecting water quality as an added benefit.
• Limiting development on steep slopes, ridgelines, and landslide hazard areas can protect high quality water resources and prevent excessive erosion and sedimentation to streams and lakes that impacts water quality and aquatic habitat.
Recommendations for local water resource protection goals are illustrated in Figure 38. For detailed information on municipal protectiveness for towns in Basin 3, please see the Basin 3 Plan webpage.

2019 OTTER CREEK TACTICAL BASIN PLAN pg. 91
Figure 38. Municipal protection goals for towns and status of local protections in Basin 3.

2019 OTTER CREEK TACTICAL BASIN PLAN pg. 92
Local planning, goal development, and implementation —River Connectivity
Accelerated completion of priority projects, both protection and restoration, reflect an increasing interest in partners over the last 10 years to become involved in project planning and implementation (see Clean Water Board Reports). Community support of river corridor protection and restoration projects has multiple benefits including: flood resilience, outdoor recreational opportunities, and habitat function as well as nutrient and sediment reduction. The interest has led to municipally supported projects over the last 5 years in Brandon, Clarendon, and Rutland City where flood resilience was a primary focus. The VANR contributed technical assistance and funding required to enhance flood resilience through actions including the construction of flood benches and the removal of berms and dams. Moreover, VANR continues to provide technical assistance to encourage towns to protect river corridors through municipal zoning, over lays, and conservation. Berms, or earthen levees, are a common concern in the basin. Substantial berming along portions of the Otter Creek and its tributaries prevent the stream from accessing the adjacent floodplain. One example of berming is along the Cold River in North Clarendon. A project between the VDEC Rivers program and the RNRCD determined berm removal options, assessed alternative scenarios, and modeled their outcomes. The modeling showed that removing specific berms would allow the flood water to spill onto the floodplain, thereby reducing flood flows and damages downstream. They are currently working to remove as much of the berm as possible to reconnect the floodplain for flood water and nutrient storage.
Another berm removal study in 2019 assessed alternatives for berm removal on Homer Stone Brook in South Wallingford. The alternatives included property buyouts, which would remove residential infrastructure from the hazard area and could reduce or eliminate the risk to life and private property. Additionally, by reducing the need to actively manage the channel to protect homes, Homer Stone Brook could begin to naturally adjust in order to achieve equilibrium and reduce erosion. Click the following hyperlink to view summary strategies to address River Connectivity.
H. Natural Resource Restoration—Wetlands
Wetlands cover 11% of Basin 3 and are important for safeguarding many high quality surface waters in the basin. As recently as the 1950s, wetlands were seen as obstacles to development, agriculture, and transportation, and consequently, were systematically drained and altered. These losses and alterations compromise the important benefits provided by wetlands including attenuating sediment and nutrients, providing habitat for a wide variety of plants and animals, and reducing flood damage. While protecting remaining wetland resources is an important strategy in the basin (see Ch. 2),

2019 OTTER CREEK TACTICAL BASIN PLAN pg. 93
restoring degraded wetlands is essential to improving water quality. Many Basin 3 wetlands are candidates for restoration to rehabilitate them to approximate pre-disturbance condition. As the third dominant land cover type in Basin 3, reducing P export from wetlands is important to meeting the state’s clean water goals including reductions needed to comply with the LC TMDL.
This section is organized around the VDEC Wetlands Program Restoration Initiative and identifying sites with the greatest potential for P removal through wetland restoration and conservation.
Wetland Restoration
The 2007 the VANR Lake Champlain Basin Wetland Restoration Plan and 2017 updates includes the identification and prioritization of wetlands in the VT portion of the Lake Champlain Basin (LCB) with the greatest potential for P removal through restoration. While the modeling exercise identified highly-ranked sites in all sub-basins in the VT LCB, sites in the Otter Creek sub-basin had the highest mean restoration scores. These scores reflected a high proportion of agricultural land near surface waters draining clay soils (i.e., in soil hydrologic groups C and D, which are characteristic of these sub-basins). The high ranking of sites in the Otter Creek sub-basin suggests that it would be an appropriate target for initial wetland restoration efforts (Figure 39). Based on this model, highest priority sites are being selected for contractor outreach and partner collaboration. Funding priorities will be given to projects in the LCB that have high P rank scores (https://bit.ly/2RnprMc).

2019 OTTER CREEK TACTICAL BASIN PLAN pg. 94
Figure 39. Priority wetland restoration areas based on P retention potential and previous NRCS wetland remediation areas.
Wetland Conservation Easements
A new initiative is in progress for the protection of wetlands in Vermont. The state is currently developing a Wetlands Easement calculator to evaluate the value of wetlands for protection through the easement process. River Corridor Easements are used by the state and partner organizations to purchase channel management and development rights in the most sensitive and important areas along stream channels to encourage stream equilibrium, sediment and nutrient attenuation, and flood protection. The wetland conservation easements will be used in a similar way to protect and restore wetlands with significant function and values related to water quality, flood protection, climate change mitigation and wildlife habitat.
EXPLANATION OF FIGURE The figure shows an assessment of Basin 3 wetlands with the greatest potential to retain P. Dead Creek, Lower Lemon Fair, and Pleasant Brook-Otter Creek are the highest priority wetlands for potential P retention. Moreover, 2012-2018 NRCS data suggest the greatest wetland remediation opportunities remain in these areas.

2019 OTTER CREEK TACTICAL BASIN PLAN pg. 95
Click the following hyperlink to view summary strategies to address Wetland Restoration.
2019 OTTER CREEK TACTICAL BASIN PLAN pg. 96
Chapter 5 -The Basin 3 Implementation Table The Basin 3 Plan addresses all impaired, stressed, and altered waters in the basin as well as protection needs for high quality waters. The list of strategies in the Implementation Table (Table 13) and the Monitoring and Assessment Table (Table 14) cover future assessment and monitoring needs, as well as projects that protect or restore waters and related education and outreach. The Implementation Table Summary is a list of 56 priority strategies to be used to guide efforts toward watershed practice implementation. A list of related, individual project entries is found in the online Watershed Projects Database (WPD). The projects vary in level of priority based on the strategies outlined in the summary. Not all the WPD projects are expected to be completed over the next five years, but each strategy is expected to be pursued and reported upon in the following plan and updated in the WPD. As projects are developed, priority for CWIP funding will be given to those projects that achieve the highest water quality benefits. Additionally, projects that provide cumulative benefits (i.e. flood resiliency, water quality improvement, water resource protection, AOP) will receive additional consideration for prioritization. Table 13 is organized by land use or pollutant sectors described in Chapter 4 and can be accessed directly by clicking on the bookmarks below: A) Runoff from Agricultural Lands B) Runoff from Developed Lands -- Stormwater C) Runoff from Developed Lands -- Roads D) Wastewater Treatment Facilities E) Natural Resource Restoration -- Forest Lands F) Natural Resource Restoration -- Lakes G) Natural Resource Restoration -- River connectivity H) Natural Resource Restoration –Wetlands
Table 14 provides a list of monitoring and assessment recommendations for Basin 3 in the next 5 years.

2019 OTTER CREEK TACTICAL BASIN PLAN pg. 97
A. Basin 3 Implementation Table Summary Table 13. Summary implementation actions for the Basin 3 tactical basin plan.
Strategy Priority Area Town(s) Partners (see Partners)
Funding
Strategies to address pollution from Agricultural lands.
1. Support meetings and workshops between ACRWC, VAAFM, UVM Ext., CVFC, and local farmers
Lewis Creek, Little Otter, Middlebury River, Dead Creek, Lemon Fair
Middlebury, Panton, Ripton, Cornwall, Bristol, Starksboro, and Ferrisburgh
ACRWC, CFVC, UVM ext., RNRCD, OCNRCD, VAAFM, NRCS, VDEC
ACWIP, TBPSG, VAAFM
2. Host annual workshops on improving soil and water health, RAPs, implementing conservation tillage and cover cropping practices.
Basin wide with focus on Lewis Creek, Little Otter, Middlebury River, Upper Otter, Dead Creek, Lemon Fair
All towns RNRCD, OCNRCD, ACRWC, LCA, VAAFM, NRCS, VDEC, UVM ext.
RCPP, USDA, ACWIP
3. Support farmers in developing NMPs through UVM Extension’s Digging In course and the development of NMPs for all certified farms through NRCS CAPS funding.
Basin wide with focus on Lewis Creek, Little Otter, Middlebury River, Upper Otter, Dead Creek, Lemon Fair
All towns RNRCD, OCNRCD, VAAFM, NRCS, UVM ext.
RCPP, EQIP, ACWIP
4. Support the development of NMPs for certified farms that are not interested in Digging in Course through NRCS CAPS funding.
Basin wide with focus on Lewis Creek, Little Otter, Middlebury River, Upper Otter, Dead Creek, Lemon Fair
All towns RNRCD, OCNRCD, VAAFM, NRCS, UVM ext.
RCPP, EQIP, ACWIP
5. Track # of NMPs developed and implemented in priority
Basin wide with focus on Lewis Creek, Little
All towns RNRCD, OCNRCD, VAAFM, NRCS
RCPP, EQIP, ACWIP
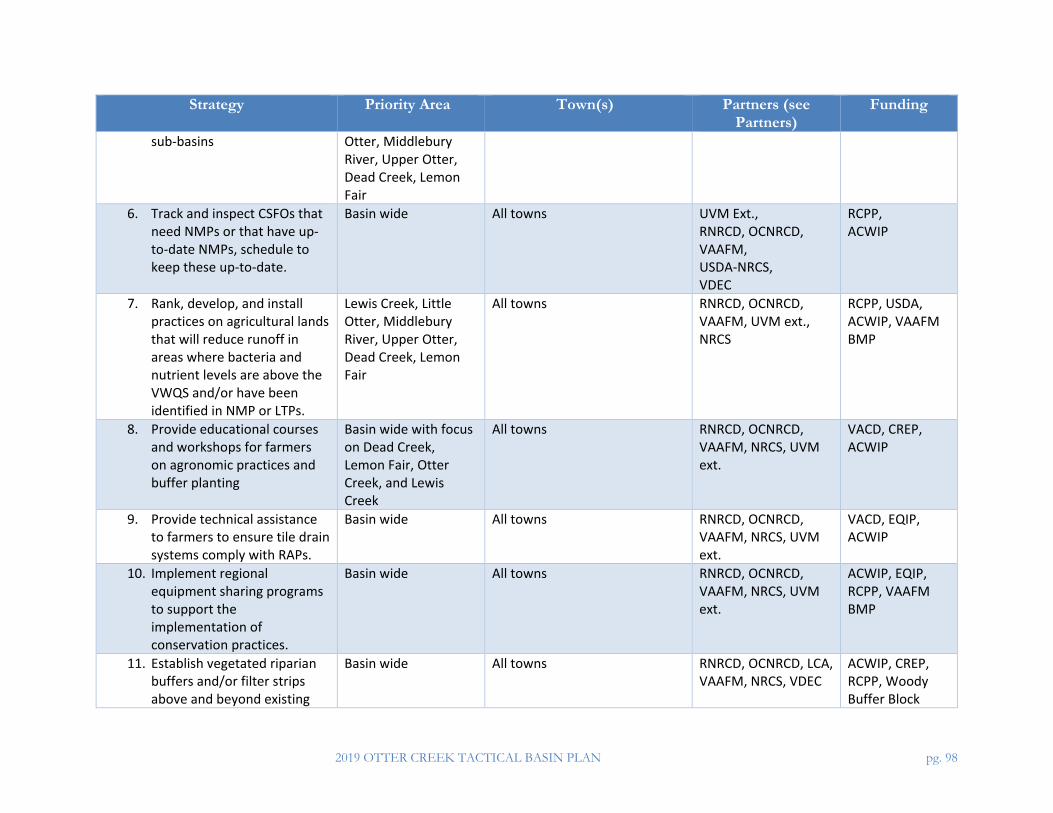
2019 OTTER CREEK TACTICAL BASIN PLAN pg. 98
Strategy Priority Area Town(s) Partners (see Partners)
Funding
sub-basins Otter, Middlebury River, Upper Otter, Dead Creek, Lemon Fair
6. Track and inspect CSFOs that need NMPs or that have up-to-date NMPs, schedule to keep these up-to-date.
Basin wide All towns UVM Ext., RNRCD, OCNRCD, VAAFM, USDA-NRCS, VDEC
RCPP, ACWIP
7. Rank, develop, and install practices on agricultural lands that will reduce runoff in areas where bacteria and nutrient levels are above the VWQS and/or have been identified in NMP or LTPs.
Lewis Creek, Little Otter, Middlebury River, Upper Otter, Dead Creek, Lemon Fair
All towns RNRCD, OCNRCD, VAAFM, UVM ext., NRCS
RCPP, USDA, ACWIP, VAAFM BMP
8. Provide educational courses and workshops for farmers on agronomic practices and buffer planting
Basin wide with focus on Dead Creek, Lemon Fair, Otter Creek, and Lewis Creek
All towns RNRCD, OCNRCD, VAAFM, NRCS, UVM ext.
VACD, CREP, ACWIP
9. Provide technical assistance to farmers to ensure tile drain systems comply with RAPs.
Basin wide All towns RNRCD, OCNRCD, VAAFM, NRCS, UVM ext.
VACD, EQIP, ACWIP
10. Implement regional equipment sharing programs to support the implementation of conservation practices.
Basin wide All towns RNRCD, OCNRCD, VAAFM, NRCS, UVM ext.
ACWIP, EQIP, RCPP, VAAFM BMP
11. Establish vegetated riparian buffers and/or filter strips above and beyond existing
Basin wide All towns RNRCD, OCNRCD, LCA, VAAFM, NRCS, VDEC
ACWIP, CREP, RCPP, Woody Buffer Block

2019 OTTER CREEK TACTICAL BASIN PLAN pg. 99
Strategy Priority Area Town(s) Partners (see Partners)
Funding
compliance standards (i.e., RAPs or shoreline protection).
Grants
12. Target BMP implementation to highest priority sub-basins and ground truth to reconcile modeled P source areas with field data
Dead Creek, Otter Creek, Lemon Fair, and New Haven River
All towns RNRCD, OCNRCD, VAAFM, VDEC, NRCS, UVM ext.
LaRosa, ACWIP, TBPSG
13. Develop practical stormwater BMPs for farms and provide technical and financial support for farms to implement these to address stormwater runoff from impervious surfaces in farm production areas.
Basin wide All towns UVM Ext., RNRCD, OCNRCD, VAAFM, NRCS
ACAP, EQIP, RCPP, VAAFM BMP, ACWIP
14. Complete water quality monitoring on/near farms to help identify source areas and evaluate nutrient reductions achieved through BMP implementation.
Lewis Creek, Little Otter, Middlebury River, Upper Otter, Dead Creek, Lemon Fair
All towns ACRWC, UVM Ext., RNRCD
LaRosa, ACWIP, TBPSG
15. Conduct outreach to farmers with potential natural resource protection opportunities (e.g., river corridor or wetlands)
Lewis Creek, Little Otter, Middlebury River, Upper Otter, Dead Creek, Lemon Fair, Clarendon River
All towns RNRCD, OCNRCD, LCA, VAAFM, NRCS, VDEC, UVM ext.
ACWIP, RCPP
16. Analyze LCBP 1m data to identify agricultural lands lacking riparian buffers and use these to prioritize BMP implementation and outreach on RAPs.
Basin wide All towns UVM Ext., OCNRCD, RNRCD, RRPC, LCA, VAAFM, NRCS, VDEC
VACD, ACWIP, NRCS, UVM ext., TBPSG

2019 OTTER CREEK TACTICAL BASIN PLAN pg. 100
Strategy Priority Area Town(s) Partners (see Partners)
Funding
17. Provide technical support to farmers and assistance tracking BMP practices implemented with(out) state or federal funding.
Basin wide All towns UVM Ext., OCNRCD, RNRCD, RRPC, VAAFM, NRCS, VDEC
VACD, ACWIP, NRCS, UVM ext., TBPSG
18. Publish success stories where farmers have installed BMP practices and seen improved farm operations and improved water quality conditions.
Basin wide All towns ACRWC, UVM Ext., VACD, VAAFM, NRCS, VDEC
VACD, ACWIP, NRCS, UVM ext., TBPSG
Developed Lands—Stormwater
19. Develop stormwater master reports or plans.
Basin wide Addison, Bridport, Chittenden, Cornwall, Goshen, Leicester, Mendon, Mount Tabor, Monkton, New Haven, Panton, Ripton, Shrewsbury, Salisbury, Tinmouth, Waltham, Weybridge, Whiting
ACRPC, RRPC, RNRCD, Towns
CWI
20. Outreach to landowners that will come under the 3-acre stormwater permit
Basin wide Rutland city, Rutland town, and Middlebury
ACRPC, RRPC, RNRCD, Towns
TBPSG
21. Determine if high priority practices identified in Stormwater Mapping Reports should be carried out singularly or through multi-town Stormwater Master Planning.
Basin wide Bristol, Charlotte, Danby, Dorset, Ferrisburgh, Hinesburg, Ira, Killington, Lincoln, Mount Holly, Pittsford, Proctor, Orwell, Shoreham
ACRPC, RRPC, RNRCD, Towns
CWI
22. Develop and implement GSI practices at local schools.
Basin wide All towns Local school administrations and
CWI, ERP

2019 OTTER CREEK TACTICAL BASIN PLAN pg. 101
Strategy Priority Area Town(s) Partners (see Partners)
Funding
towns, VDEC, ACRPC, RRPC, RNRCD
23. Provide outreach and education for development of stormwater bylaws
Basin wide All towns ACRPC, RRPC, RNRCD, Towns
TBPSG
Developed Lands—Roads
24. Complete REIs for all towns in the basin by 12/31/2020.
Basin wide Killington, Ripton, Rutland Town ACRPC, CCRPC, VTrans, RRPC, Towns
Better Roads Grant, Grant-In-Aid
25. Provide support to towns to upload REI data into MRGP database by 2020.
Basin wide All towns VDEC, VTrans, Towns, ACRPC, RRPC
TPI, TBPSG
26. Implement high priority road projects across the basin to meet MRGP requirements.
Basin wide All towns ACRPC, CCRPC, RRPC, Towns, VTrans
Better Roads Grant, Grant-In-Aid, Town funds, VTrans funds
27. Provide technical assistance to towns for developing project proposals, budgets, and funding opportunities for implementing priority projects that have the largest water quality benefits.
Basin wide All towns VDEC, VTrans, ACRPC, RRPC
TPI, TBPSG
28. Host workshops and peer to peer sharing on best practices for using new equipment to meet MRGP standards and support equipment purchase.
Basin wide All towns VDEC, VTrans, RRPC, ACRPC, Towns
TPI, TBPSG, Grant-in-Aid
29. Create an equipment sharing program and track use of equipment used to meet
Basin wide All towns RRPC, ACRPC, Towns. Grant-in-Aid--Equipment grant

2019 OTTER CREEK TACTICAL BASIN PLAN pg. 102
Strategy Priority Area Town(s) Partners (see Partners)
Funding
MRGP requirements. 30. Support the development and
implementation of Phosphorus Control Plans and the Flow Restoration Plans.
MS4 entities MS4 entities VDEC, RRPC CWI
31. Implement six minimum control measures required in the State TS4 permit.
Basin wide All towns VTrans VTrans
Wastewater Treatment Facilities
32. Reissue permits to 9 WWTFs in the basin in 2021 that meet the P limits. Support municipalities pursuing P optimization, expansion projects, and upgrades.
Basin wide Brandon, Middlebury, Otter valley Union High School, Pittsford, Proctor, Rutland, Vergennes, Wallingford, West Rutland
VDEC, Municipalities USDA-Rural Development, Clean Water State Revolving Funds
Natural Resource Restoration—Forests
33. Increase education and outreach on minimizing water quality impacts of maple sugaring operations.
Basin wide All towns VACD, RNRCD, VDFPR CWI
34. Provide outreach, technical assistance and workshops to private forestland owners, foresters, and loggers on AMPs, use of skidder bridges, and voluntary harvesting guidelines.
Basin wide All towns VACD, RNRCD, VDFPR TBPSG
35. Map and assess forest access Basin-wide Towns with state lands VDEC, VDFPR, VFW Staff time
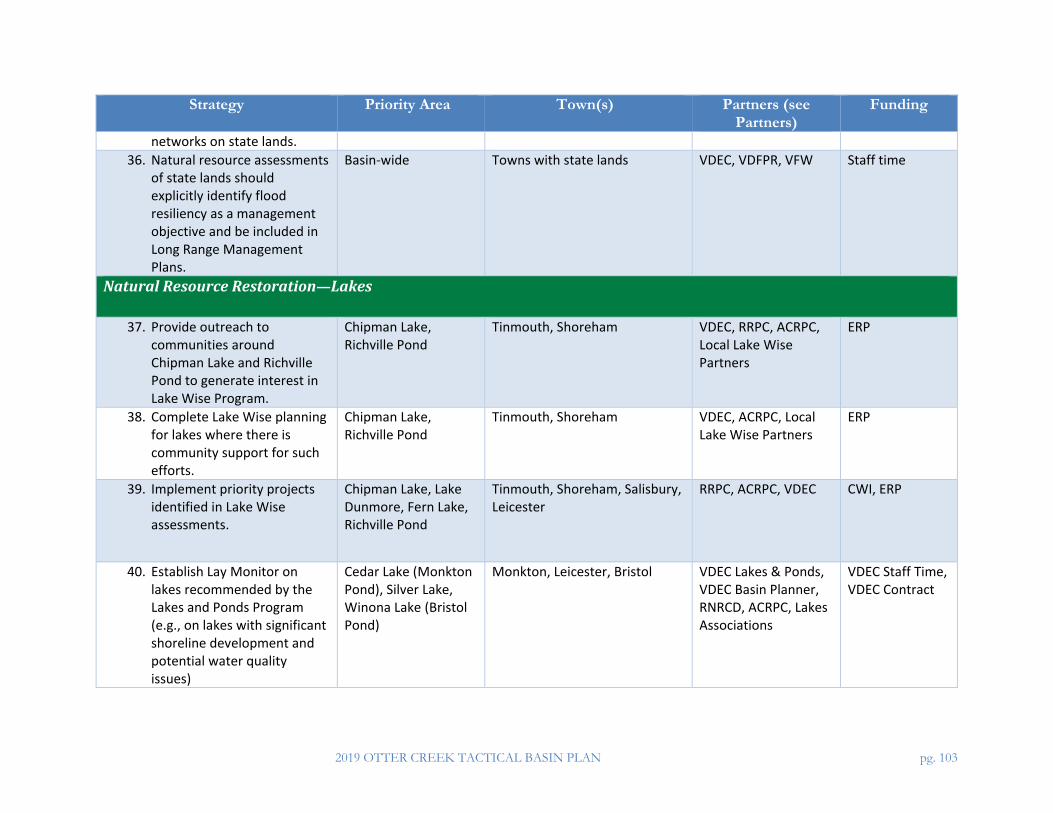
2019 OTTER CREEK TACTICAL BASIN PLAN pg. 103
Strategy Priority Area Town(s) Partners (see Partners)
Funding
networks on state lands. 36. Natural resource assessments
of state lands should explicitly identify flood resiliency as a management objective and be included in Long Range Management Plans.
Basin-wide Towns with state lands VDEC, VDFPR, VFW Staff time
Natural Resource Restoration—Lakes
37. Provide outreach to communities around Chipman Lake and Richville Pond to generate interest in Lake Wise Program.
Chipman Lake, Richville Pond
Tinmouth, Shoreham VDEC, RRPC, ACRPC, Local Lake Wise Partners
ERP
38. Complete Lake Wise planning for lakes where there is community support for such efforts.
Chipman Lake, Richville Pond
Tinmouth, Shoreham VDEC, ACRPC, Local Lake Wise Partners
ERP
39. Implement priority projects identified in Lake Wise assessments.
Chipman Lake, Lake Dunmore, Fern Lake, Richville Pond
Tinmouth, Shoreham, Salisbury, Leicester
RRPC, ACRPC, VDEC CWI, ERP
40. Establish Lay Monitor on lakes recommended by the Lakes and Ponds Program (e.g., on lakes with significant shoreline development and potential water quality issues)
Cedar Lake (Monkton Pond), Silver Lake, Winona Lake (Bristol Pond)
Monkton, Leicester, Bristol VDEC Lakes & Ponds, VDEC Basin Planner, RNRCD, ACRPC, Lakes Associations
VDEC Staff Time, VDEC Contract

2019 OTTER CREEK TACTICAL BASIN PLAN pg. 104
Strategy Priority Area Town(s) Partners (see Partners)
Funding
41. Recruit greeter and initiate AIS Greeter Program
Beaver Pond, Cedar Lake (Monkton Pond), Chipman Lake, Lake Dunmore, Fern Lake, Porter Lake, Richville Pond, Rutland City, Star Lake, Vergennes Watershed, and Winona Lake (Bristol Pond)
Proctor, Monkton, Tinmouth, Salisbury, Leicester, Ferrisburgh, Shoreham, Rutland, Mount Holly, Bristol
VDFPR, Lake Communities, Municipalities, RNRCD
VDEC Lakes and Ponds
42. Initiate VIP where there is interest in priority towns.
Beaver Pond, Cedar Lake (Monkton Pond), Chipman Lake, Lake Dunmore, Fern Lake, Porter Lake, Richville Pond, Rutland City, Star Lake, Vergennes Watershed, and Winona Lake (Bristol Pond)
Proctor, Monkton, Tinmouth, Salisbury, Leicester, Ferrisburgh, Shoreham, Rutland, Mount Holly, Bristol
RNRCD, Municipalities, Lake Communities
VDEC Lakes and Ponds
Natural Resources Restoration—Rivers
43. Implement high priority projects recommended in the Moon Brook River Corridor Plan
Moon Brook Rutland City and town VDEC Rivers, RNRCD, RRPC, VDEC Basin Planner
ERP
44. Develop and implement priority river corridor protection projects and floodplain/channel restoration projects where there is landowner support
Basin wide All towns VDEC, RRPC, ACRPC, towns
ERP, EQIP, WISPr

2019 OTTER CREEK TACTICAL BASIN PLAN pg. 105
Strategy Priority Area Town(s) Partners (see Partners)
Funding
45. Provide information on the benefits of the NFIP program and technical support for towns that are interested in joining the program.
Basin-wide Tinmouth, Mount Tabor, Killington
VDEC, ACRPC, RRPC, Towns
TBPSG
46. Work with towns to retrofit or replace culverts and/or bridges to restore AOP.
Basin wide All towns RRPC, ACRPC, towns, VTrans
ERP, CWI, Better Roads
47. Strategic additions of large wood material to restore aquatic habitat in streams which were historically impacted by logging operations.
USFS lands in the Green Mtn. National Forest identified in the next Integrated Resource Project (IRP)
The IRP will include the Basin 3 towns of Chittenden, Mendon, and Goshen
USFS, VFW, TNC, TU ERP, CWI, WISPr
48. Continue and expand riparian buffer programs. Prioritize buffer plantings based upon recommendations in completed River Corridor Plans, P reduction potential, and known water quality issues.
Basin wide All towns RNRCD, OCNRCD, ACRWC, LCA, USFS, USFWS, VDEC
ERP, USFS Grants, USFWS Cost-Share, Woody Buffer Block Grants
49. Municipal outreach to towns without river corridor protection in town plans/by-laws
Basin-wide Addison, Bridport, Bristol, Chittenden, Clarendon, Cornwall, Ferrisburgh, Goshen, Ira, Killington, Leicester, Middlebury, Middletown Springs, Monkton, Mount Holly, Mount Tabor, New Haven, Panton, Pittsford, Rutland City, Rutland Town, Salisbury, Shoreham, Starksboro, Sudbury,
ACRPC, RRPC, VDEC Rivers
Municipal planning grant

2019 OTTER CREEK TACTICAL BASIN PLAN pg. 106
Strategy Priority Area Town(s) Partners (see Partners)
Funding
Tinmouth, Vergennes, Wallingford, Waltham, Weybridge, Whiting
50. Continue work on dam removal prioritization, design, and implementation on high priority sites
Basin wide All towns VDEC Rivers, VRC, USFWS, VFWD, Municipalities
ERP, WISPr
51. Continue monitoring popular swimming areas for the protection of public health
Middlebury River, New Haven River
Middlebury, New Haven ACRWC, Municipalities
LaRosa
52. Reclassify surface waters recommended in Ch. 2 to safeguard high quality waters, existing uses, and significant resources of high public interest.
Basin-wide All Towns Local citizens, VDEC VDEC
Natural Resources Restoration—Wetlands
53. Identify high priority sites for wetland restoration based on P reduction ranking
Dead Creek, Lower Lemon Fair, and Pleasant Brook-Otter Creek watersheds
Brandon, Pittsford, Addison, Bridport, Panton, Cornwall, Shoreham, Weybridge
VDEC Wetlands CWI, VDEC
54. Reclassify wetlands recommended for Class 1 status to protect their key functions and values
Otter Creek Wetland Complex
Cornwall, Salisbury, Middlebury, Sudbury, Whiting, Leicester, Brandon
TNC, ACRPC, local Steering Committee composed of Middlebury, Cornwall and Salisbury CC members and other local citizens, VDEC
VDEC, TNC
55. Outreach to landowners of wetlands identified as restoration priorities– with a
Basin-wide All towns USDA-NRCS, VACD
WREP, CREP, CWI, LCBP

2019 OTTER CREEK TACTICAL BASIN PLAN pg. 107
Strategy Priority Area Town(s) Partners (see Partners)
Funding
focus on lands with new landowners, actively being conserved or where landowners are making changes in land management
56. Review new natural resource mapping and make recommendations for improving wetland mapping in target towns
Basin-wide All towns VDEC Wetlands, UVM CWI, VDEC contract
*List of partner acronyms below.

2019 OTTER CREEK TACTICAL BASIN PLAN pg. 108
B. Coordination of Basin 3 Partners: Partnerships are crucial in carrying out non-regulatory actions to improve water quality. Several Basin 3 organizations undertake watershed monitoring, assessment, protection, restoration, and education and outreach projects. These partners are non-profit, private, state, and federal organizations working on both private and public lands. Addison County Regional Planning Commission, Addison County River Watch Collaborative, Lewis Creek Association, Otter Creek Natural Resource Conservation District, Panton Planning Commission, Rutland Regional Planning Commission, Rutland Natural Resource Conservation District, Upper Otter Creek Watershed Council, Chittenden County Regional Planning Commission, The Nature Conservancy, United States Forest Service, Vermont River Conservancy, Vermont Fish and Wildlife, and municipalities are active in:
• providing outreach and education to local stakeholders, private landowners, and municipalities;
• developing stream and floodplain protection and restoration projects (e.g., river corridor easements, tree plantings, culvert and bridge upgrades, dam removals, and stream channel habitat restoration);
• developing stormwater projects (e.g., stormwater master plans, road erosion inventories, implementation of town road BMPs);
• and monitoring water quality (e.g., lay monitoring program on lakes, E. coli and nutrient monitoring in rivers).
Partners actively working with farms in the basin developing and implementing BMPs for water quality include Natural Resource Conservation Service, Vermont Agency Agriculture Food and Markets, Addison County River Watch Collaborative, Champlain Valley Farmers Coalition, Otter Creek Natural Resource Conservation District, Rutland Natural Resource Conservation District, VDEC, and University of Vermont Extension Service. The large amount of work that is necessary to meet water quality targets in this basin require collaborations among all these groups to maximize the effectiveness of watershed partners. Without funding or partners, little of this work would be possible.
Partner Acronyms:
VAAFM VT Agency of Agriculture Food & Markets
RRPC Rutland Regional Planning Commission
CC Conservation Commission TRORC Two Rivers-Ottauquechee Regional Commission
CWIP Clean Water Initiative Program USFS United States Forest Service

2019 OTTER CREEK TACTICAL BASIN PLAN pg. 109
ACRWC Addison County River Watch Collaborative
USFWS United States Fish & Wildlife Service
CVFC Champlain Valley Farmers Coalition
VDEC Vermont Department Environmental Conservation
ACRPC Addison County Regional Planning Commission
VDFW Vermont Department Fish and Wildlife
RRPC Rutland Regional Planning Commission
VDFPR Vermont Department of Forests Parks and Recreation
CCRPC Chittenden County Regional Planning Commission
VRC Vermont River Conservancy
MAPP Monitoring Assessment and Planning Program
RNRCD Rutland Natural Resource Conservation District
PPC Panton Planning Commission UOCWC Upper Otter Creek Watershed Council
TNC The Nature Conservancy LCA Lewis Creek Association

2019 OTTER CREEK TACTICAL BASIN PLAN pg. 110
C. Monitoring Priorities This section identifies monitoring priorities for Basin 3 across several monitoring programs during the next planning cycle. As described in the “What is a Tactical Basin Plan?” section – the planning process is a 5-year cycle and Basin 3 is targeted for monitoring in 2021. While 2021 is the target year for monitoring, several programs monitor water quality in the basin on an ongoing basis. There are a variety of monitoring programs that are supported by the VDEC and its partners which are described in detail in the Water Quality Monitoring Program Strategy. Monitoring programs in this basin include the Biomonitoring and Aquatic Studies Section (BASS)– that monitors macroinvertebrate and fish communities as well as targeted temperature monitoring and water chemistry sampling around WWTF or other pollution concerns. This section also provides support for the LaRosa volunteer water quality monitoring program (https://bit.ly/2HtZQ0l, e.g., the ACRWC and UOCWC). The VDFW supports fish assessments, temperature monitoring, and the evaluation of streams in need of habitat restoration (e.g., large wood additions). The LPP supports the spring P monitoring and lay monitoring programs, which evaluate nutrient conditions and trends of lakes. The LPP also monitors shoreland condition and conducts in-depth lake assessments in addition to AIS surveys. Finally, the Rivers Program supports SGAs that evaluate geomorphic and habitat conditions on our rivers and the Wetlands programs has a wetlands assessment program.
The Lake Champlain Basin Program-(LCBP) supports Long-Term Water Quality and Biological Monitoring Project, including cyanobacteria monitoring (http://dec.vermont.gov/watershed/lakes-ponds/monitor/lake-champlain). The LCBP program supports the monitoring of progress towards attainment of the LC TMDL goals for each lake segment with biweekly lake and tributary monitoring. These sampling efforts allow for the evaluation of flow-normalized loading and concentration trends which are presented biannually in the state of the lake report produced by the Lake Champlain Basin Program. These water quality sampling efforts have been on-going since 1992 and will continue with the support of the Lake Champlain Basin Program, the States of Vermont and New York, and the USGS.
The common goals for monitoring efforts across programs include:
1) Confirming of biological and water quality conditions that support reclassification of surface waters to a higher level where data are not sufficient or are too old to support reclassification, which is a focus for the BASS regarding aquatic biota and VDFW regarding fishing use.
2) Understanding biological and water quality conditions where these are unknown, such as streams or lakes that have not been sampled or assessed or where assessments may be out of date.
3) Understanding biological and water quality conditions where there is a known water quality problem – to evaluate if the problem has worsened or to evaluate the effectiveness of restoration efforts (e.g., BMP implementation).
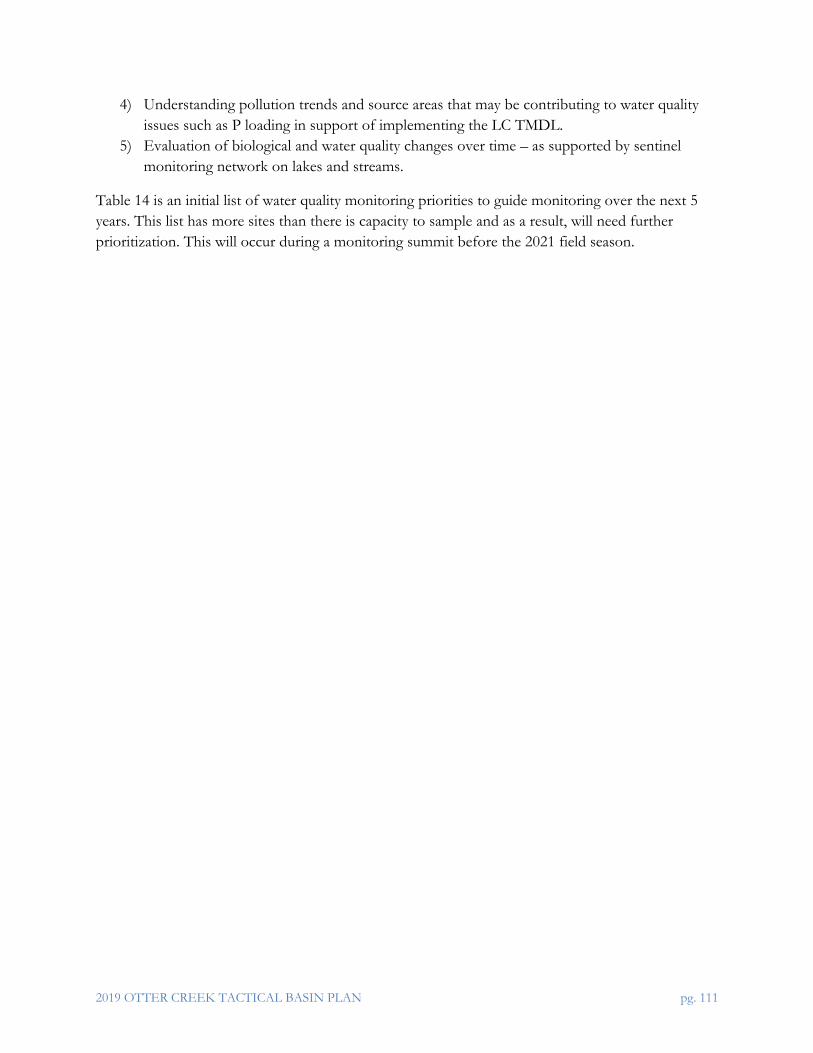
2019 OTTER CREEK TACTICAL BASIN PLAN pg. 111
4) Understanding pollution trends and source areas that may be contributing to water quality issues such as P loading in support of implementing the LC TMDL.
5) Evaluation of biological and water quality changes over time – as supported by sentinel monitoring network on lakes and streams.
Table 14 is an initial list of water quality monitoring priorities to guide monitoring over the next 5 years. This list has more sites than there is capacity to sample and as a result, will need further prioritization. This will occur during a monitoring summit before the 2021 field season.

2019 OTTER CREEK TACTICAL BASIN PLAN pg. 112
Table 14. Basin 3 priorities for monitoring and assessment.
Waterbody Assessment Status
Location (Latitude or River Mile)
Location (Longitude)
Partner(s) Monitoring action/ Site description
1. Macdonough Creek
No Data 44.16853036 -73.25727211 BASS Data gap - collect new data to determine condition
2. Maple Creek No Data 44.12531553 -73.25975668 BASS Data gap - collect new data to determine condition
3. Maple Brook No Data 44.10950137 -73.2567733 BASS Data gap - collect new data to determine condition
4. Dog Team Stream
No Data 44.06630451 -73.18595209 BASS Data gap - collect new data to determine condition
5. Fire Brook No Data 43.9910432 -73.0384936 BASS Data gap - collect new data to determine condition
6. Beaver Brook Trib 1
No Data 43.97994513 -73.11442761 BASS Data gap - collect new data to determine condition
7. Dragon Brook No Data 43.9789255 -73.05320669 BASS Data gap - collect new data to determine condition
8. Beaver Brook Upper
No Data 43.97931551 -73.11428277 BASS Data gap - collect new data to determine condition
9. Middlebury Trib 1
No Data 43.96727813 -73.15540633 BASS Data gap - collect new data to determine condition
10. Beaver Brook Lower
No Data 43.96585433 -73.12381273 BASS Data gap - collect new data to determine condition
11. Hale Brook No Data 43.95438207 -73.02682284 BASS Data gap - collect new data to determine condition
12. Brandy Brook No Data 43.95323359 -73.00064937 BASS Data gap - collect new data to determine condition
13. Crystal Brook No Data 43.94363521 -72.9674627 BASS Data gap - collect new data to determine condition
14. Halnon Brook Trib 3
No Data 43.94740439 -73.12616689 BASS Data gap - collect new data to determine condition
15. Dunmore North
No Data 43.91240834 -73.07818515 BASS Data gap - collect new data to determine condition

2019 OTTER CREEK TACTICAL BASIN PLAN pg. 113
16. Voters Brook No Data 43.9140338 -73.04003557 BASS Data gap - collect new data to determine condition
17. Barnard Brook
No Data 43.89242969 -73.02340722 BASS Data gap - collect new data to determine condition
18. Gould Brook North
No Data 43.87212712 -73.00491701 BASS Data gap - collect new data to determine condition
19. Basin Brook No Data 43.81874594 -73.02351987 BASS Data gap - collect new data to determine condition
20. Beaudry Brook
No Data 43.77708206 -72.96848928 BASS Data gap - collect new data to determine condition
21. Kiln Brook No Data 43.75396601 -72.96719263 BASS Data gap - collect new data to determine condition
22. Sugar Hollow Trib. 1
No Data 43.74795377 -73.0149588 VFWD Data gap - collect new data to determine condition
23. Holden Brook No Data 43.74001123 -72.97786577 BASS Data gap - collect new data to determine condition
24. Mendon Brook
Update Data 43.57394133 -72.90946183 BASS Old sampling data should be updated
25. Robinson Brook
No Data 43.560995 -72.85121704 BASS Data gap - collect new data to determine condition
26. North Branch Neshobe River
No Data 43.84184395 -73.03118215 BASS Data gap - collect new data to determine condition
27. Willow Brook Update Data 43.80640242 -73.14992478 BASS Old sampling data should be updated 28. Baker Brook Update Data,
Reclassification 43.77893109 -72.97037312 BASS Old sampling data should be updated,
also potential reclassification candidate at RM 2.7
29. Steam Mill Brook
No Data 43.77893684 -72.97011166 BASS Data gap - collect new data to determine condition
30. Sugar Hollow Trib 2
No Data 43.76318805 -73.02216379 BASS Data gap - collect new data to determine condition
31. Bresee Mill Brook
Update Data 43.75905942 -73.07749582 BASS Old sampling data should be updated
32. Little Brook Update Data 43.71657448 -73.0045102 BASS Old sampling data should be updated 33. Smith Pond
Brook Update Data 43.71597361 -73.05461723 BASS Old sampling data should be updated
34. Pondy Brook No Data 43.70459279 -73.0071035 BASS Data gap - collect new data to

2019 OTTER CREEK TACTICAL BASIN PLAN pg. 114
determine condition 35. Sugar Hollow
Brook Reclassification 43.69479933 -73.02343393 BASS Reclass data update needed
36. North Branch Cold River
No Data 43.56959024 -72.91880159 BASS Data gap - collect new data to determine condition
37. Cold River Lower
Reclassification 43.56923023 -72.92007184 BASS Have data at RM 1.4 from 2012; could be reclass candidate with more data
38. Cold River Lower 1
No Data 43.56751471 -72.9195516 BASS Data gap - collect new data to determine condition
39. Gould Brook Upper
No Data 43.54160875 -72.85935166 BASS Data gap - collect new data to determine condition
40. Gould Brook Lower
No Data 43.53914252 -72.87326145 BASS Data gap - collect new data to determine condition
41. Cold River Upper
No Data 43.53887669 -72.87348013 BASS Data gap - collect new data to determine condition
42. Russell Brook No Data 43.47782116 -72.85463376 BASS Data gap - collect new data to determine condition
43. Freeman Brook
No Data 43.4740334 -72.87646633 BASS Data gap - collect new data to determine condition
44. Mount Holly Trib Upper
No Data 43.44806821 -72.84067227 BASS Data gap - collect new data to determine condition
45. Mount Holly Trib Lower
No Data 43.44985333 -72.87428741 BASS Data gap - collect new data to determine condition
46. Feller Brook No Data 43.43972124 -72.86568991 BASS Data gap - collect new data to determine condition
47. Mill River No Data 43.44015093 -72.86549909 BASS Data gap - collect new data to determine condition
48. Quaker Creek No Data 44.07765001 -73.23830942 BASS Data gap - collect new data to determine condition
49. Sparks Brook No Data 43.97568381 -73.03137612 BASS Data gap - collect new data to determine condition
50. North Branch Middlebury River
No Data 43.97549779 -73.06206229 BASS Data gap - collect new data to determine condition
51. Middle Branch Middlebury
No Data 43.97394702 -73.03518236 BASS Data gap - collect new data to determine condition

2019 OTTER CREEK TACTICAL BASIN PLAN pg. 115
River 52. South Branch
Middlebury River
Update Data 43.97384958 -73.03547315 BASS Old sampling data should be updated
53. Goshen Brook 1st/2nd
No Data 43.9603929 -73.02786903 BASS Data gap - collect new data to determine condition
54. Halnon Brook No Data 43.95274653 -73.13420113 BASS Data gap - collect new data to determine condition
55. North Branch Sucker Brook
No Data 43.9094446 -73.0477125 BASS Data gap - collect new data to determine condition
56. Sucker Brook Lower
No Data 43.90547077 -73.06876066 BASS Data gap - collect new data to determine condition
57. Sucker Brook Upper
No Data 43.9023858 -73.04045214 BASS Data gap - collect new data to determine condition
58. Lewis Creek Reference Site Update
RM 3.7 Data update needed
59. Hogback Brook
Reclassification RM 1.7 Reclass data update needed
60. Furnace Brook
Update Data RM 5.3 and 6.3 Sample ab/bl hatchery. Future data throughout stream could also support reclassification.
61. Seymour Brook
Reclassification RM 3.2 Reclass data update needed
62. Button Brook Reclassification RM 0.1 Reclass data update needed 63. Blue Bank Reclassification RM 1.7, 0.2 Must be monitored during 2021 to
remain reclass. candidates 64. High Knob
Brook Reclassification RM 0.7 Reclass data update needed
65. Hillsboro Brook
Reclassification RM 0.5 Reclass data update needed
66. Hollow Brook Reclassification RM 2.5, 0.9 Reclass data update needed 67. New Haven
River Trib. 27 Reclassification RM 0.5 Reclass data update needed
68. Sugar Hollow Brook
Reclassification RM 4.2, 3 Reclass data update needed
69. Upper Lewis Creek
Reclassification RM 26.4, 24 Reclass data update needed
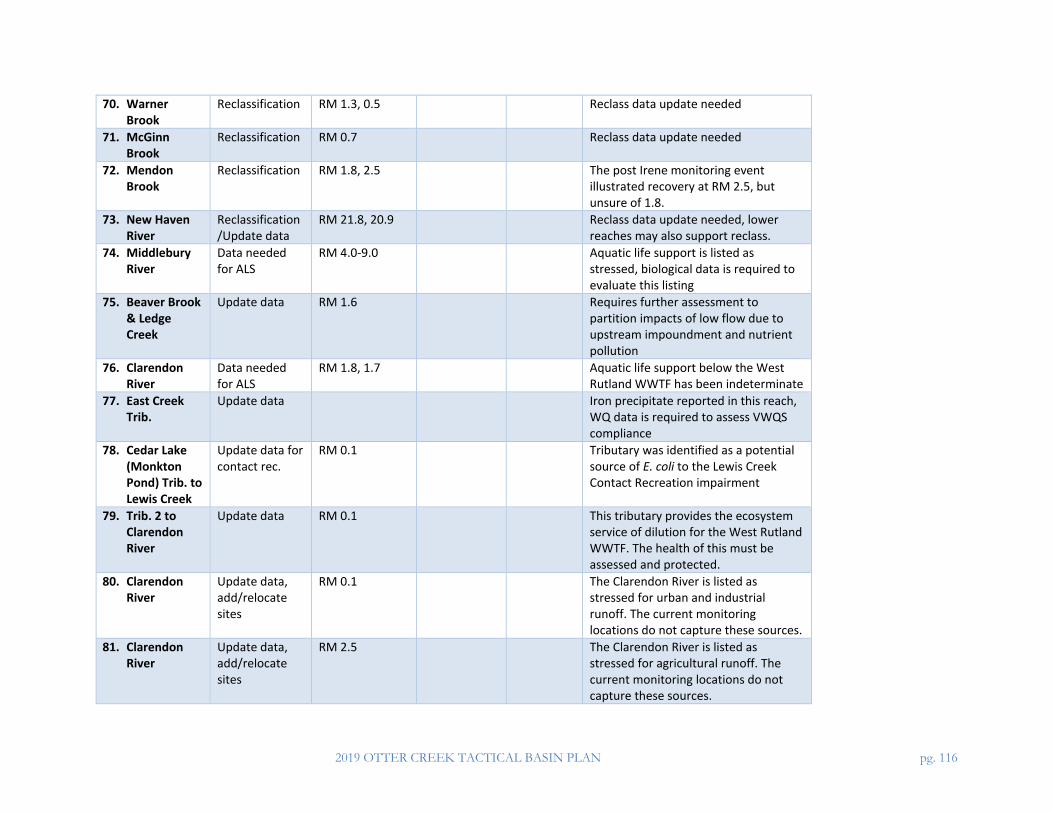
2019 OTTER CREEK TACTICAL BASIN PLAN pg. 116
70. Warner Brook
Reclassification RM 1.3, 0.5 Reclass data update needed
71. McGinn Brook
Reclassification RM 0.7 Reclass data update needed
72. Mendon Brook
Reclassification RM 1.8, 2.5 The post Irene monitoring event illustrated recovery at RM 2.5, but unsure of 1.8.
73. New Haven River
Reclassification/Update data
RM 21.8, 20.9 Reclass data update needed, lower reaches may also support reclass.
74. Middlebury River
Data needed for ALS
RM 4.0-9.0 Aquatic life support is listed as stressed, biological data is required to evaluate this listing
75. Beaver Brook & Ledge Creek
Update data RM 1.6 Requires further assessment to partition impacts of low flow due to upstream impoundment and nutrient pollution
76. Clarendon River
Data needed for ALS
RM 1.8, 1.7 Aquatic life support below the West Rutland WWTF has been indeterminate
77. East Creek Trib.
Update data Iron precipitate reported in this reach, WQ data is required to assess VWQS compliance
78. Cedar Lake (Monkton Pond) Trib. to Lewis Creek
Update data for contact rec.
RM 0.1 Tributary was identified as a potential source of E. coli to the Lewis Creek Contact Recreation impairment
79. Trib. 2 to Clarendon River
Update data RM 0.1 This tributary provides the ecosystem service of dilution for the West Rutland WWTF. The health of this must be assessed and protected.
80. Clarendon River
Update data, add/relocate sites
RM 0.1 The Clarendon River is listed as stressed for urban and industrial runoff. The current monitoring locations do not capture these sources.
81. Clarendon River
Update data, add/relocate sites
RM 2.5 The Clarendon River is listed as stressed for agricultural runoff. The current monitoring locations do not capture these sources.

2019 OTTER CREEK TACTICAL BASIN PLAN pg. 117
82. Neshobe River
Update data for ALS
RM 0.9-3.6 The aquatic life score significantly decreases between 3.6 and after 0.9, likely due to the Brandon WWTF. A site above the WWTF and below 3.6 should be assessed
83. Mill River Update data for ALS
RM 3.9 This reach failed to support aquatic life in 2016 and should be reassessed.
84. Lemon Fair River
Update data, add sites
74 Bridge to 125 Bridge
Of all the water quality data in this reach, the greatest increase in TP occurs between these sites. More sites should be added.
85. S. Branch, Middlebury River (1.4 mi.)
Data gap for ALS
RM 5.8, below Snowbowl facility
Aquatic Life is listed as not supported in this reach. No data to prove this.
86. East Creek Data gap for ALS
RM 8.0-11.0, From Glen Dam to 3.0 mi. downstream
Aquatic Life is listed as not supported in this reach. No data to prove this.
87. Otter Creek Update data From Pulp Mill Bridge to the Middlebury River
The most recent monitoring in 2015 was above VWQS for E. coli. But, this site was above all CSO discharges. Monitoring should identify manure sources.
88. Halnon Trib 10
Update data RM 0.1, Salisbury
This site is adjacent to the Salisbury fish hatchery and it has not been monitored since 2012. Immediate monitoring is recommended.
89. Hollow Bk (Lewis Ck) LCHLW0.1
Other site, assessment status TBD
44.27549 -73.07656 ACRWC E.coli bracket monitoring site
90. Hollow Bk (Lewis Ck) LCHLW1.0
Other site, assessment status TBD
44.28382 -73.07267 ACRWC E.coli bracket monitoring site
91. Lewis Creek LCR0.3
Rotational Site 44.24847 -73.27436 ACRWC Capture drainage below VTDEC LTM station at Greenbush Rd

2019 OTTER CREEK TACTICAL BASIN PLAN pg. 118
92. Lewis Creek LCR14
Sentinel Site 44.277097 -73.081485 ACRWC Swimming/ recreation site; d/s from farms, Hollow Bk; Biomonitoring
93. Lewis Creek LCR14.3
Other site, assessment status TBD
44.27533 -73.07687 ACRWC E.coli bracket monitoring site
94. Lewis Creek LCR15
Other site, assessment status TBD
44.27082 -73.0715 ACRWC E.coli bracket monitoring site
95. Lewis Creek LCR16
Other site, assessment status TBD
44.2556 -73.07038 ACRWC E.coli bracket monitoring site
96. Lewis Creek LCR3.7
Sentinel Site 44.247953 -73.231202 ACRWC Downstream of US Rt 7; near USGS streamflow gage; Biomonitoring
97. Lewis Creek LCR9.9
Rotational Site 44.288855 -73.149929 ACRWC Swimming site; downstream from Pond Brook confluence
98. Pond Brook LCT3D.5
Rotational Site 44.269047 -73.113298 ACRWC Largest tributary. Loader of sediment, nutrients, pathogens
99. Beaver Branch (LFR) LFB0.5
Rotational Site 43.99287 -73.23572 ACRWC Bracket Monitoring
100. Beaver Branch (LFR) LFB2.5
Rotational Site 43.971568 -73.229269 ACRWC Downstream of farms.
101. Beaver Branch (LFR) LFB5
Rotational Site 43.94444 -73.22623 ACRWC Bracket Monitoring
102. Bascom Brook (LFR) LFBasc0.3
Rotational Site 43.90951 -73.25863 ACRWC Bracket Monitoring
103. Trib to Beaver Br (LFR) LFBS1-0.9
Rotational Site 43.954017 -73.220053 ACRWC Downstream of farms and residential development
104. Perry Brook (LFR) LFPerr 0.5
Rotational Site 43.90395 -73.26074 ACRWC Bracket Monitoring

2019 OTTER CREEK TACTICAL BASIN PLAN pg. 119
105. Lemon Fair River LFR1.2
Rotational Site 44.047095 -73.251372 ACRWC Downstream of area that is pastured into Lemon Fair
106. Lemon Fair River LFR12
Sentinel Site 43.942435 -73.262336 ACRWC Downstream of former pasture/cropland; sentinel station
107. Lemon Fair River LFR15.8
Rotational Site 43.910859 -73.275274 ACRWC Downstream of a farm
108. Lemon Fair River LFR23
Rotational Site 43.846413 -73.236313 ACRWC Monitor established riparian buffers at a large farm.
109. Lemon Fair River LFR26.6
Rotational Site 43.81344 -73.23563 ACRWC Bracket Monitoring, downstream of farm lands
110. Lemon Fair River LFR4
Rotational Site 44.01973 -73.23692 ACRWC Bracket Monitoring
111. Lemon Fair River LFR6.7
Sentinel Site 43.990959 -73.252514 ACRWC Site surrounded by pasture with very little riparian buffer.
112. Little Otter Creek LOC10
Rotational Site 44.18581 -73.18492 ACRWC Downstream of wetland complexes with agriculture.
113. Little Otter Creek LOC14.4
Rotational Site 44.157109 -73.15892 ACRWC Upstream of several farms
114. Little Otter Creek LOC20.3
Rotational Site 44.130637 -73.120947 ACRWC Downstream of farming; upstream of large wetland complex
115. Little Otter Creek LOC21.5
Rotational Site 44.136786 -73.105935 ACRWC Baseline data; upstream end of watershed
116. Little Otter Creek LOC4.3
Sentinel Site 44.198145 -73.249263 ACRWC At US Rt 7; site of USGS streamflow gaging station
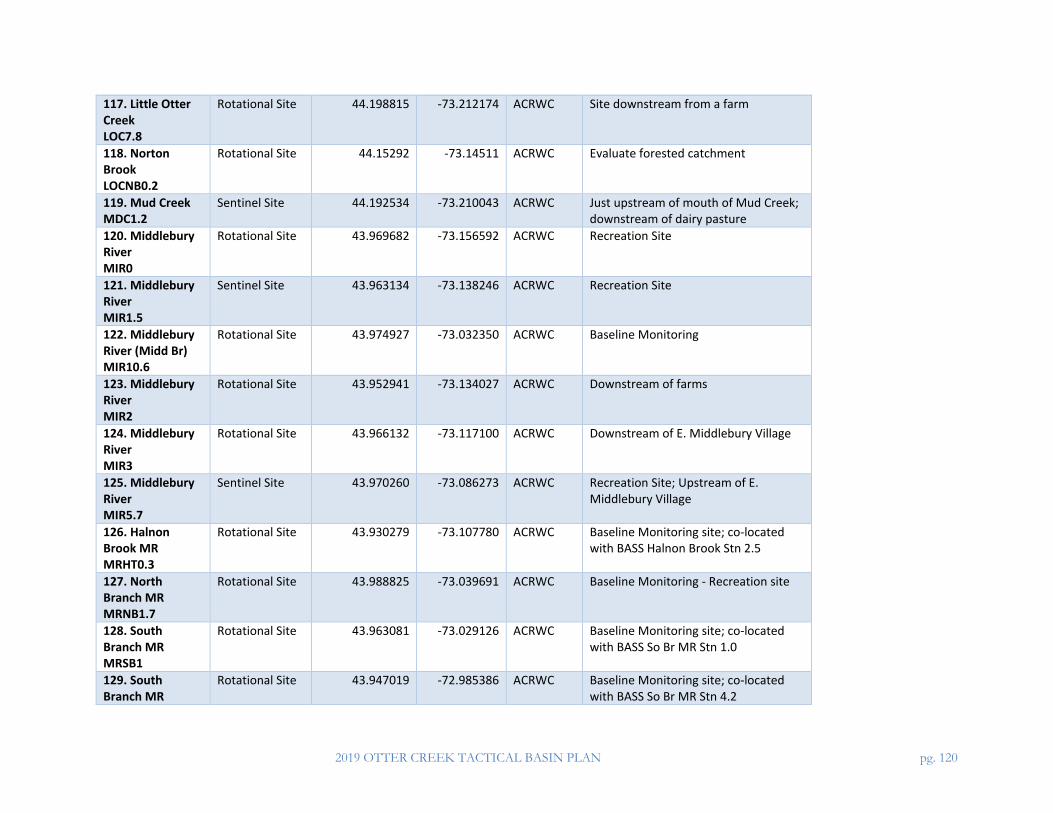
2019 OTTER CREEK TACTICAL BASIN PLAN pg. 120
117. Little Otter Creek LOC7.8
Rotational Site 44.198815 -73.212174 ACRWC Site downstream from a farm
118. Norton Brook LOCNB0.2
Rotational Site 44.15292 -73.14511 ACRWC Evaluate forested catchment
119. Mud Creek MDC1.2
Sentinel Site 44.192534 -73.210043 ACRWC Just upstream of mouth of Mud Creek; downstream of dairy pasture
120. Middlebury River MIR0
Rotational Site 43.969682 -73.156592 ACRWC Recreation Site
121. Middlebury River MIR1.5
Sentinel Site 43.963134 -73.138246 ACRWC Recreation Site
122. Middlebury River (Midd Br) MIR10.6
Rotational Site 43.974927 -73.032350 ACRWC Baseline Monitoring
123. Middlebury River MIR2
Rotational Site 43.952941 -73.134027 ACRWC Downstream of farms
124. Middlebury River MIR3
Rotational Site 43.966132 -73.117100 ACRWC Downstream of E. Middlebury Village
125. Middlebury River MIR5.7
Sentinel Site 43.970260 -73.086273 ACRWC Recreation Site; Upstream of E. Middlebury Village
126. Halnon Brook MR MRHT0.3
Rotational Site 43.930279 -73.107780 ACRWC Baseline Monitoring site; co-located with BASS Halnon Brook Stn 2.5
127. North Branch MR MRNB1.7
Rotational Site 43.988825 -73.039691 ACRWC Baseline Monitoring - Recreation site
128. South Branch MR MRSB1
Rotational Site 43.963081 -73.029126 ACRWC Baseline Monitoring site; co-located with BASS So Br MR Stn 1.0
129. South Branch MR
Rotational Site 43.947019 -72.985386 ACRWC Baseline Monitoring site; co-located with BASS So Br MR Stn 4.2

2019 OTTER CREEK TACTICAL BASIN PLAN pg. 121
MRSB4.2 130. Muddy Branch NHM0.4
Rotational Site 44.06068 -73.14754 ACRWC Assess Contribution of Muddy Branch
131. Muddy Branch NHM1.4
Rotational Site 44.050119 -73.140737 ACRWC Baseline data to Assess Contribution of Muddy Branch
132. Muddy Branch NHM3.6
Rotational Site 44.03119 -73.13209 ACRWC Baseline data to Assess Contribution of Muddy Branch
133. Muddy Branch NHM5.2
Rotational Site 44.025281 -73.114807 ACRWC Baseline data to Assess Contribution of Muddy Branch
134. New Haven River NHR0.5
Rotational Site 44.062478 -73.171918 ACRWC Swimming and recreation site
135. New Haven River NHR11.5
Sentinel Site 44.127648 -73.046841 ACRWC State-significant swimming and recreation site
136. New Haven River NHR13
Rotational Site 44.1189 -73.01973 ACRWC Development & septic systems
137. New Haven River NHR15
Rotational Site 44.09537 -72.98286 ACRWC Swimming and recreation site
138. New Haven River NHR2
Sentinel Site 44.060634 -73.148449 ACRWC Bracket Muddy Branch tributary
139. New Haven River NHR5
Rotational Site 44.09239 -73.1074 ACRWC Swimming and recreation site
140. New Haven River NHR6
Rotational Site 44.096148 -73.092454 ACRWC Swimming and recreation site
141. New Haven River NHR9
Sentinel Site 44.131417 -73.079891 ACRWC 100 yds. below downtown Bristol’s septic system

2019 OTTER CREEK TACTICAL BASIN PLAN pg. 122
142. West Brook NHWB0.2
Rotational Site 44.091796 -73.09856 ACRWC Baseline data to Assess Contribution of West Brook
143. West Brook NHWB2.7
Rotational Site 44.066761 -73.088333 ACRWC Baseline data to Assess Contribution of West Brook
144. Otter Creek OTR18
Sentinel Site 44.065573 -73.215858 ACRWC Accessible site downstream of Midd. Sewage Treatment Plant. Upstream of Lemon Fair River confluence.
145. Otter Creek OTR7.3
Sentinel Site 44.168667 -73.260904 ACRWC E. coli testing at the request of Vergennes Town Manager to monitor E.coli upstream and downstream of sewage treatment plant.
146. Tenn1.0 Update data 43o37.277 72o58.491 UOCWC Tenney Brook – (Rutland City) - Lincoln Avenue (Rotary Park)
147. Tenn0.8 Update data 43o61.559 72o98.812 UOCWC Tenney Brook – Rutland City) – Baxter St. at Confluence with East Creek
148. East0.2 Update data 43o36.285 72o59.342 UOCWC East Creek – (Rutland City) - Off of Meadow St. at recreation area
149. East2.1 Update data 43o61.795 72o98.934 UOCWC East Creek – (Rutland City) – At Giorgetti Park
150. Moon0.3 Update data 43o35.653 72o58.888 UOCWC Moon Brook – (Rutland City) – At Forest Street Bridge
151. Moon0.9 Update data 43o59.841 72o97.335 UOCWC Moon Brook (Rutland City) – At Porter Place - Above Porter Street Bridge to Howe Center
152. Moon1.5 Update data 43o35.991 72o58.063 UOCWC Moon Brook – (Rutland City) - At White’s Playground
153. Mussey0.1 Update data 43o35.647 72o58.770 UOCWC Mussey Brook – (Rutland City) – At Park Street Bridge
154. Mussey0.8 Update data 43o59.229 72o96.292 UOCWC Mussey Brook – (Rutland City) – At Mussey Street Bridge near VT Sport & Fitness
155. East10 Update data 43.69054 72.95668 UOCWC East Creek – (Pittsford) - Just downstream of Sangamon Road, below hydro bypass tributary
156. East13 Update data 43.72067 72.92453 UOCWC East Creek – (Chittenden) - Just below Chittenden dam, where flume crosses the road

2019 OTTER CREEK TACTICAL BASIN PLAN pg. 123
157. Tenn12 Update data 43 o37.455 72 o58.37 UOCWC Tenney Brook – (Rutland City) – Behind Seward’s Restaurant

2019 OTTER CREEK TACTICAL BASIN PLAN pg. 124
D. List of Acronyms 319 Federal Clean Water Act, Section 319 604(b) Federal Clean Water Act, Section 604b ACWIP Agricultural Clean Water Initiative Grant Program AIS Aquatic Invasive Species AMPs Acceptable Management Practices (for logging) AOP Aquatic Organism Passage BASS VDEC Biomonitoring and Aquatic Studies Section BBR Better Backroads program BMP Best Management Practices CCNRCD Chittenden County Natural Resources Conservation District CREP Conservation Reserve Enhancement Program CWI Clean Water Initiative Grant Funding CWIP Clean Water Initiative Program EQIP Environmental Quality Incentive Program ERAF Emergency Relief and Assistance Fund ERP Ecosystem Restoration Program FAP Farm Agronomic Practices FEH Fluvial Erosion Hazard FERC Federal Energy Regulatory Commission FOVLAP Federation of Vermont Lakes and Ponds GIS Geographic Information System GSI Green Stormwater Infrastructure IDDE Illicit Discharge Detection (and) Elimination LFO Large Farm Operation LID Low Impact Development LiDAR Light Detection and Ranging LIP Landowner Incentive Program LWD Large Woody Debris LPP Lakes and Ponds Program MAPP Monitoring, Assessment and Planning Program MFO Medium Farm Operation MPG Municipal Planning Grant MRGP Municipal Roads General Permit NFIP National Flood Insurance Program NMP Nutrient Management Plan NPDES National Pollution Discharge Elimination System NPS Non-point source pollution NRCD Natural Resource Conservation District NRCS Natural Resources Conservation Service
2019 OTTER CREEK TACTICAL BASIN PLAN pg. 125
ORW Outstanding Resource Water RAP Required Agricultural Practices RCP River Corridor Plan RCPP Regional Conservation Partnership Program RMP River Management Program RPC Regional Planning Commission SFO Small Farm Operation SGA Stream Geomorphic Assessment SWMP Stormwater master plans TBP Tactical Basin Plan TMDL Total Maximum Daily Load TNC The Nature Conservancy TPI Transportation Planning Initiative TS4 Transportation Separate Storm Sewer System General Permit TU Trout Unlimited USDA United States Department of Agriculture USEPA United States Environmental Protection Agency USFWS United States Fish and Wildlife Service USFS United States Forest Service USGS United States Geological Survey UVA Use Value Appraisal program, or Current Use Program UVM ext. University of Vermont Extension VAAFM Vermont Agency of Agriculture, Food, and Markets VACD Vermont Association of Conservation Districts VANR Vermont Agency of Natural Resources VDEC Vermont Department of Environmental Conservation VDFPR Vermont Department of Forests, Parks and Recreation VFWD Vermont Fish and Wildlife Department VIP Vermont Invasive Patrollers VLRP Vermont Local Roads Program VLT Vermont Land Trust VRC Vermont River Conservancy VTrans Vermont Agency of Transportation VWQS Vermont Water Quality Standards WISPr Water Infrastructure Sponsorship Program

2019 OTTER CREEK TACTICAL BASIN PLAN pg. 126
References Agency of Agriculture Food & Markets. (2016, May 13). Required Agricultural Practices (RAPs).
Retrieved from Vermont.gov: http://agriculture.vermont.gov/water-quality/regulations/rap#Q16.
Agency of Natural Resources. (2015, December). Riparian Management Guidelines for Agency of Natural Resources Lands. Montpelier, VT.
Arnold, C., & Gibbons, C. (1996). Impervious surface coverage: the emergence of a key environmental indicator. American Planners Association Journal, 243-258.
Bear Creek Environmental and Lamoille County Planning Commission. (2009, October 30). Elmore Branch River Corridor Plan: Wolcott and Elmore. Middlesex, VT.
Bear Creek Environmental and Lamoille County Planning Commission. (2009, October 30). Gihon River Corridor Plan: Johnson, Hyde Park, & Eden, Vermont. Middlesex, VT.
Bear Creek Environmental and Lamoille County Planning Commission. (2010, March 18). Wild Branch Corridor Plan: Wolcott, Craftsbury and Eden, Vermont. Middlesex, VT.
Bear Creek Environmental and Lamoille County Planning Commission. (2010, March 18). Wild Branch Corridor Plan: Wolcott, Craftsbury and Eden, Vermont. Middlesex, VT.
Bear Creek Environmental and Lamoille County Planning Commission. (2010, February 2010). Centerville Brook Corridor Plan: Hyde Park, VT. Middlesex, VT.
Butler, B. (2016, May 25). Local Project to Use LiDAR to Map Private Forest Roads. Retrieved from VTDigger.org: http://vtdigger.org/2016/05/26/local-project-to-use-lidar-to-map-private-forest-roads/
Caledonia County NRCD. (2009, February). Upper Lamoille River Stream Geomorphic Assessment Phase 2 Report: Greensboro and Hardwick, VT. St. Johnsbury, Vermont.
Deacon, J. S. (2006). Assessment of total nitrogen in the Upper Connecticut River Basin in New Hampshire, Vermont, and Massachusetts, December 2002–September 2005. U.S. Geological Survey Scientific Investigations Report. Retrieved from https://pubs.usgs.gov/sir/2006/5144/pdf/sir2006-5144.pdf
Department of Forests, Parks and Recreation. (2015, April). 2015 Vermont Forest Fragmentation Report. Report to the Vermont Legislature. Montpelier, VT: Agency of Natural Resources.
Environmental Compliance Services, Inc. (2016, January 15). Waterville VOCs, Route 109, Waterville, VT. Supplemental Site Investigation and Corrective Action Feasibility Investigation Report . Waterbury, VT.

2019 OTTER CREEK TACTICAL BASIN PLAN pg. 127
Environmental Protection Agency. (2008, March). Handbook for Developing Watershed Plans to Restore and Protect Our Waters. Retrieved from US Environmental Protection Website: https://www.epa.gov/sites/production/files/2015-09/documents/2008_04_18_nps_watershed_handbook_handbook-2.pdf
Fitzgerald Environmental Associates. (2013, March 15). Brewster River Phase 1 & 2: Stream Geomorphic Assessment Summary. Colchester, VT.
Fitzgerald Environmental Associates, LLC. (2015, July 31). Brewster River Corridor Plan. Colchester, VT.
Freeman, M. C., Pringle, C. M., & Jackson, C. R. (2007, January 26). Hydrologic Connectivity and the Contribution of Stream Headwaters to Ecological Integrity at Regional Scales. Journal of the American Water Resources Association, pp. 5-14.
Galford, G. L., Carlson, S., Ford, S., Nash, J., Palchak, E., Pears, S., . . . Baker, D. V. (Eds.). (2014). Considering Vermont’s Future in a Changing Climate: The First Vermont Climate Assessment. 219.
IPCC. (2014). Summary for Policymakers. In: Climate Change 2014: Impacts, Adaptation, and Vulnerability. Part A: Global and Sectoral Aspects. Contribution of Working Group II to the Fifth Assessment Report of the Intergovernmental Panel on Climate Change .
JJ Environmental. (2015). Final Report - Low Cost Retrofits for Nitrogen Removal at Wastewater Treatment Plants in the Upper Long Island Sound Watershed. NEIWPCC. Retrieved from http://click.neiwpcc.org/neiwpcc_docs/LIS%20Low%20Cost%20Retrofit%20Final%20Report%20-%20March%202015%20(revised).pdf
Kirn, R. (2016, April 29). Implementing AOP Enhancement Projects in Vermont. Retrieved from VT Fish and Wildlife: http://www.vtfishandwildlife.com/common/pages/DisplayFile.aspx?itemId=111522
Kirn, R. (2016, April 29). Implementing AOP Enhancement Projects in Vermont. Retrieved from VT Fish and Wildlife: https://vtfishandwildlife.com/sites/fishandwildlife/files/documents/Learn%20More/Library/REPORTS%20AND%20DOCUMENTS/AOP/IMPLAMENTING%20AOP%20PROJECTS%20IN%20VT.pdf
Lamoille County Planning Commission. (2010, September). Phase I & II Geomorphic Assessment: Foote Brook, Johnson, Vermont. Johnson, VT.
Lamoille County Planning Commission. (2012, September). Phase 1 Stream Geomorphic Assessment: Green River Watershed, Lamoille County, Vermont. Morrisville, VT.

2019 OTTER CREEK TACTICAL BASIN PLAN pg. 128
MacKenzie, C. (2016, February). Lake Champlain Lake Sturgeon Recovery Plan. Montpelier, VT: Vermont Fish and Wildlife Department.
Richard Bridge Moore, C. M. (2004). Estimation of Total Nitrogen and Phosphorus in New England Streams Using Spatially Referenced Regression Models. U.S. Geological Survey. Retrieved from https://pubs.usgs.gov/sir/2004/5012/SIR2004-5012_report.pdf
State of Vermont Treasurer. (2019). Clean water Report Required by Act 64 of 2015. Montpelier, VT. Retrieved from https://dec.vermont.gov/sites/dec/files/wsm/erp/docs/2019-01-15%20Vermont%20Clean%20Water%20Investment%20Report%20SFY2018_Revised%202019-02-01.pdf
Stone Environmental, Inc. (2014, July 11). Detecting and Eliminating Illicit Discharges to Improve Water Quality in the Lamoille River Basin. Montpelier, VT.
Tetra Tech, Inc. (2015, April). Lake Champlain BMP Scenario Tool: Requirements and Design. Boston, MA: US Environmental Protection Agency.
Tetra Tech, Inc. (2016, March). Lake Champlain BMP Scenario Tool. Boston, MA, New England.
The Nature Conservancy. (2012). Lamoille Basin 2012 Geomorphic Compatibility and Aquatic Organism Passage Culvert Assessment: Town of Belvidere, Vermont. Montpelier: The Nature Conservancy.
U.S. Environmental Protection Agency. (2016, June 17). Phosphorus TMDLs for Vermont Segments of Lake Champlain. Boston, MA, New England: USEPA.
USEPA. (2008, March). Handbook for Developing Watershed Plans to Restore and Protect Our Waters. Retrieved from US Environmental Protection Website: https://www.epa.gov/sites/production/files/2015-09/documents/2008_04_18_nps_watershed_handbook_handbook-2.pdf
USEPA. (2016, June 17). Phosphorus TMDLs for Vermont Segments of Lake Champlain. Boston, MA, New England: USEPA.
USEPA. (2016). Climate change indicators in the United States, 2016. 4th Edition. Retrieved from https://www.epa.gov/climate-indicators
USEPA. (2016). National Lakes Assessment 2012: A Collaborative Survey of Lakes in the United States. Washington DC: U.S. Environmental Protection Agency. Retrieved from https://nationallakesassessment.epa.gov/
VAAFM. (2018, November 23). Required Agricultural Practices (RAPs). Retrieved from Vermont.gov: https://agriculture.vermont.gov/rap

2019 OTTER CREEK TACTICAL BASIN PLAN pg. 129
VDEC. (2015). Water Quality Monitoring Program Strategy Interim Update – May 2015. Montpelier: VTDEC. Retrieved from https://dec.vermont.gov/sites/dec/files/documents/WSMD_MonitoringStrategy2015.pdf
VDEC. (2015). Water Quality Monitoring Program Strategy Interim Update – May 2015. Montpelier: VDEC. Retrieved from https://dec.vermont.gov/sites/dec/files/documents/WSMD_MonitoringStrategy2015.pdf
VDEC. (2016, March). Vermont Surface Water Assessment and Listing Methodology. Montpelier, Vermont: Agency of Natural Resources.
VDEC. (2016, March). Vermont Surface Water Assessment and Listing Methodology. Montpelier, Vermont: Agency of Natural Resources.
VDEC. (2016, March). Vermont Surface Water Assessment and Listing Methodology. Montpelier, Vermont: Agency of Natural Resources.
VDEC. (2016, March). Vermont Surface Water Assessment and Listing Methodology. Montpelier, Vermont: Agency of Natural Resources.
VDEC. (2016). State of Vermont 2016 Stressed Waters List. Montpelier, VT: State of Vermont.
VDEC. (2016, August 5). Vermont Surface Water Management Strategy. Retrieved from VDEC Website: http://dec.vermont.gov/watershed/map/strategy
VDEC. (2017, January 15). Vermont Water Quality Standards Environmental Protection Rule Chapter 29A. VT: State of Vermont.
VDEC. (2018, September). Part A. Impaired Surface Waters in Need of TMDL. State of Vermont 2018 303(d) List of Impaired Waters - Draft. Montpelier, VT: State of Vermont.
VDEC. (2018). Part B. Impaired Surface Waters - No Total Maximum Daily Load Determination Required. State of Vermont 2018 List of Priority Surface Waters. Montpelier, VT: State of Vermont.
VDEC. (2018). Part D. Impaired Surface Waters with Completed and Approved TMDLs. State of Vermont List of Priority Surface Waters. Montpelier, VT: State of Vermont.
VDEC. (2018). Part E. Suface Waters Altered by Invasive Aquatic Species. State of Vermont 2018 List of Priority Surface Waters. Montpelier, VT: State of Vermont.
VDEC. (2018). Part F. Surface Waters Altered by Flow Regulation. State of Vermont 2018 List of Priority Surface Waters. Vermont: State of Vermont.

2019 OTTER CREEK TACTICAL BASIN PLAN pg. 130
VDEC. (2019, January 2). The Passumpsic Watershed Water Quality Assessment Report 2018. Montpelier, VT: State of Vermont. Retrieved from https://dec.vermont.gov/content/passumpsic-river-watershed-assessment-report-2018
Vermont Agency of Natural Resources and Vermont Agency of Agriculture, Food, and Markets. (2015, August). Vermont Lake Champlain Phosphorus TMDL Phase 1 Implementation Plan. Montpelier, VT: State of Vermont.
Vermont Clean Water Act, VT No. 64 (H.35) (June 16, 2015).
Vermont Department of Environmental Conservation. (2001, February). Basin 7 - Lamoille River Watershed Water Quality and Aquatic Habitat Assessment Report. Montpelier, VT: State of Vermont.
Vermont Department of Environmental Conservation. (2009, February). Lamoille River Basin Water Quality Management Plan - Draft. Montpelier, VT: State of Vermont.
Vermont Department of Environmental Conservation. (2014). Part F. Surface Waters Altered by Flow Regulation. State of Vermont 2014 List of Priority Surface Waters . Vermont: State of Vermont.
Vermont Department of Environmental Conservation. (2016, February). Lamoille River Watershed: Updated Water Quality/Aquatic Habitat Assessment Report. Montpelier, VT: State of Vermont.
Vermont Department of Environmental Conservation. (2016). State of Vermont 2016 Stressed Waters List - DRAFT. Montpelier, VT: State of Vermont.
Vermont Department of Environmental Conservation. (2016). Vermont Water Quality Standards: Environmental Protection Rule Chapter 29A - DRAFT. Montpelier, VT: State of Vermont.
Vermont Department of Environmental Conservation. (2016, May). Part A. Impaired Surface Waters in Need of TMDL. State of Vermont 2016 303(d) List of Impaired Waters - Draft. Montpelier, VT: State of Vermont.
Vermont Department of Environmental Conservation. (2016, May). Part B. Impaired Surface Waters - No Total Maximum Daily Load Determination Required. State of Vermont 2016 List of Priority Surface Waters - Draft. Montpelier, VT: State of Vermont.
Vermont Department of Environmental Conservation. (2016). Part D. Impaired Surface Waters with Completed and Approved TMDLs. State of Vermont List of Priority Surface Waters - DRAFT. Montpelier, VT: State of Vermont.
Vermont Department of Environmental Conservation. (2016). Part E. Suface Waters Altered by Invasive Aquatic Species . State of Vermont 2016 List of Priority Surface Waters - DRAFT. Montpelier, VT: State of Vermont.

2019 OTTER CREEK TACTICAL BASIN PLAN pg. 131
Vermont Department of Environmental Conservation. (2016). Part F. Surface Waters Altered by Flow Regulation. State of Vermont 2016 List of Priority Surface Waters - DRAFT . Montpelier, VT: State of Vermont.
Vermont Department of Environmental Conservation. (2016, August 5). Vermont Surface Water Management Strategy. Retrieved from VT Department of Environmental Conservation Website: http://dec.vermont.gov/watershed/map/strategy
Vermont Department of Environmental Conservation. (2017, January 15). Vermont Water Quality Standards Environmental Protection Rule Chapter 29A. VT: State of Vermont.
Vermont Lakes and Ponds Program. (2012). Best Lakes. Montpelier, Vermont: Vermont Agency of Natural Resources.
VT Association of Conservation Districts. (2015, May). Regional Conservation Patnership Program. Retrieved from USDA Natural Resource Conservation Service Vermont: http://www.nrcs.usda.gov/wps/portal/nrcs/main/vt/programs/farmbill/rcpp/
VT Department of Forest, Parks and Recreation. (2010, March 31). Use Value Appraisal Program Manual. Vermont: Agency of Natural Resources.
VT Department of Forests, Parks and Recreation. (2016, August 11). Skidder Bridges. Retrieved from Vermont.gov: http://fpr.vermont.gov/forest/your_woods/harvesting_your_woodlots/skidder_bridge
VTANR & VAAFM. (2015, August). Vermont Lake Champlain Phosphorus TMDL Phase 1 Implementation Plan. Montpelier, VT: State of Vermont.
VTANR. (2015, December). Riparian Management Guidelines for Agency of Natural Resources Lands. Montpelier, VT.
Weston Solutions, Inc. (2015, October). Sampling and Analysis Plan for the Vermont Asbestos Group Mine Site Eden and Lowell, Vermont. (E. P. 2014, Compiler)
Wipfli, M. S., Richardson, J. S., & Naiman, R. J. (2007, February). Ecological Linkages Between Headwaters and Downstream Ecosystems: Transport of Organic Matter, Invertebrates, and Wood Down Headwater Channels. Journal of the American Water Resources Association, pp. 72-85.

2019 OTTER CREEK TACTICAL BASIN PLAN pg. 132
Glossary Please see: https://bit.ly/2YtMxYf for an alphabetized glossary of key terms used in this plan.

2019 OTTER CREEK TACTICAL BASIN PLAN pg. 133
Appendix A. 2012 Basin 3 Report Card Work completed in Basin 3 since the 2012 Plan has allowed several assessments and efforts to support the implementation of specific actions. This includes mapping and assessing road and stormwater infrastructure, rivers and streams, agricultural land, and wetlands. This work was done in partnership with the ACRPC, RRPC, the RNRCD, the OCNRCD, the ACRWC, non-profits, and other divisions of state and federal government as well as landowners to protect and restore Basin 3 lakes, rivers, and wetlands. Conservation projects and especially buffer projects have increased the total land under conservation, and towns and villages are working to increase flood preparedness, reduce erosion and green their infrastructure for better water quality. Table A1 below is organized in four columns, the first of which describes the action, the second lists the key players, the third includes the funding sources, and the fourth includes the priority and status of the action.
Table A1. 2012 Basin 3 report card with 2019 updates from partners.
Objective 1: Reduce levels of Non-Point Source Pollution from developed lands and the working landscape
Action Partners Funding Status Priority/Update 1. Encourage municipal zoning to protect
riparian buffer zones and minimize the amount of new impervious surfaces from new development. Promote LID concepts and practices.
VLCT, RPC’s, towns
EPA pass-through 604(b)
In progress, see Municipal Protectiveness Table on the Basin 3 Plan webpage.
H/Outreach to towns without river corridor protections or stream setbacks that are highlighted as priorities in Ch. 4 of this plan.
2. Develop demonstration projects for techniques to address stormwater and erosion control from homes, businesses, and construction sites.
VANR, NRCDs EPA 319, Ecosystem Restoration Funds
Complete M/Rooftop disconnect of 14 homes by RNRCD and several demo GSI in the basin (see VT Guide to SW Management at https://bit.ly/2QvzXjW)
3. Work with State and Federal transportation agencies on implementing water quality BMPs for road infrastructure construction and maintenance.
VTrans, VANR EPA 319, AOT structures, Better Backroads
In progress M/Multiple BBR and Better Roads project completed and/or underway. Strategy 31. Implement six minimum control measures required in the State TS4 permit.
4. Identify retrofit opportunities and/or potential new stormwater controls for older developed areas and seek to upgrade or install new controls.
VANR, towns EPA pass-through 319, Ecosystem Restoration Funds
In progress H/SWMPs have ID’ed projects in Basin 3 towns, Strategy 19. Develop stormwater master reports or plans

2019 OTTER CREEK TACTICAL BASIN PLAN pg. 134
5. Encourage local municipal regulations for erosion and sediment control during new construction that fall outside of the scope of state stormwater regulations.
RPCs, VLCT EPA pass-through 604(b), Municipal Planning Grants
2019 B03 plan H/Will follow-up with RPCs during next planning cycle
6. Develop a LID building applicant checklist that could be considered by town ZA’s and DRB’s as a precursor to issuing a general construction permit.
VDEC, RPCs, VLCT
EPA pass-through 604(b), Municipal Planning Grants
Complete M/Developed GSI handbook that includes GSI BMPs for multiple project types (see VT Guide to SW Management at https://bit.ly/2QvzXjW)
7. Development standards should encourage minimization of impervious surfaces and use of open vegetated channels for stormwater runoff. Provisions for narrower streets, shorter or shared driveways, smaller parking spaces, and reduced setback distances from roads should be part of urban or suburban zoning regulations. Alternative modes of transportation such as mass transit, bike paths, and commuter parking areas should also be encouraged in order to reduce the need for new roads and parking.
VANR, VTrans, private consultants
EPA 319, SIWRF (for Moon Brook only), Municipal Planning Grants, Ecosystem Restoration Funds
In progress H/New programs should help going forward – Complete streets, DTF, Better Connections
8. Increase the infiltration of stormwater flows in conjunction with the traditional detention methods used to treat stormwater
VANR, private consultants
Ecosystem Restoration Funds, EPA 319
In progress H/SWMPs identify opportunities for increased infiltration of SW flows where possible
9. Promote residential practices, especially lawn and garden-related practices that promote the Low Input Lawn Care outreach and demonstration campaign
RNRCD, UVM Sea Grant, VDEC
Lake Champlain Sea Grant
Complete H/2009-2011 RNRCD interns worked w/ private landowners and lawn care businesses on low input lawn care

2019 OTTER CREEK TACTICAL BASIN PLAN pg. 135
10. Provide outreach to landowners about impacts of over-fertilizing lawns and the importance of establishing and maintaining buffer strips along streams and ponds to reduce NPS pollution. Distribute “Don’t P on the Lawn” brochure.
VANR, Lake Champlain Sea Grant, RSEP
Lake Champlain Sea Grant
Complete H/Outreach focused on areas in the Moon Brook
11. Work with the local community and partners to address major sources of phosphorus identified in watershed survey. Likely efforts will include working with watershed residents to improve riparian management practices, improve roads and driveways to reduce erosion, reduce the use of fertilizer, and continued work with the agricultural community to reduce phosphorus loading.
VDEC, NRCS, NRCDs, town Select board, Planning Commissions, and Road Commissioner
Existing staff and resources
2019 B03 plan M/ Most via SWMPs and REIs , Ch. 4 and 5 of this plan
12. Review layouts of municipal garages in the watershed with each municipality to control runoff from salt and sand piles at municipal garages. Develop a set of cost effective management practices and municipal garage layouts that minimize erosion runoff and assist towns in completing these improvements.
Road Commissioners, select board members, Local Roads Program, VTrans
DEC Stormwater program, Existing staff and resources
In Progress M/Working with RPCs and their planners to implement BMPs at municipal garages
Working Lands – Forests 13. Build 2-3 portable skidder bridges for
loan to timber harvesting projects in the Otter Creek watershed
VANR, NRCDs Ecosystem Restoration Funds
Complete H/ RNRCD completed the build-out of skidder bridges and lends these upon request
14. Increase logger education on water quality issues through the VT Family Forests, the LEAP program and the Vermont Loggers Association’s Forestry
NRCS, FPR, Vermont Coverts, VFF, LEAP program
ANR Watershed Forestry Program, Ecosystem
In Progress H/These programs are ongoing – VFF is very strong in the lower Otter Creek Basin

2019 OTTER CREEK TACTICAL BASIN PLAN pg. 136
Academy to encourage good forestry practices in the watershed.
Restoration Funds
15. Promote educational workshops for forest landowners and forestry consultants via Vermont Coverts. Promote erosion control techniques for skidder trails, stream and river access points, and proper bridge and culvert construction. Develop a proposal to use a VYCC watershed crew to restore impacted sites including project development and implementation. Identify sensitive areas where access should be limited.
NRCS, FPR, LEAP Program, VFF, VYCC
ANR Watershed Forestry Program, Ecosystem Restoration Funds
In Progress H/NRCDs will work with VYCC crews as projects are identified
16. Encourage landowners to develop long term management plans for woodlands with the assistance of a forester. The management plan should prominently include AMPs and provide educational materials that promote responsible management of forest resources.
NRCS, DFPR, Vermont Coverts, VFF, LEAP program
Existing staff and resources
In Progress M/ All lands in UVA
17. Locate local tree stock appropriate for riparian buffer plantings and engage local volunteers to complete riparian buffer plantings along the Otter Creek and its tributaries.
DEC, NRCS, NRCDs, TNC (Native Plant Nursery), watershed groups, RPCs
Existing staff and resources
In Progress M/ CREP/ TNC’s native plant nursery taken over by PMNRCD
Objective 2: Reduce levels of Non-Point Source Pollution from developed lands and the working landscape River Corridors
18. Based on geomorphic assessments of the Otter Creek, select riparian restoration projects have been identified and prioritized to restore stream equilibrium and minimize erosion. Using geomorphic-based solutions, to the greatest extent
VANR - RMP, VLT, towns, watershed organizations
Ecosystem Restoration Funds, RCCE Dev. and Implementation grants
In Progress H/M16/17 Lewis Creek, M06B Middlebury River

2019 OTTER CREEK TACTICAL BASIN PLAN pg. 137
possible, restore sections of major tributaries identified in stream geomorphic assessments as being unstable. Promote passive restoration principles and corridor/floodplain avoidance where appropriate.
19. Expand land use practices and programs (Best Management Practices and Accepted Agricultural Practices) that provide a greater emphasis on riparian corridor restoration and protection activities. Encourage stream channel adjustment processes towards a stable regime and improve riparian buffers.
VAAFM, VANR Woody Buffer Block grants, VAAFM BMP grants
In Progress H/ Update w-RAPs, SFO inspections, high priority sub-basins to target for assessments and BMP implementation
20. Conduct detailed river geomorphic assessments and corridor planning on priority sub-basins in the Otter Creek watershed
VANR - RMP ERP Complete H/ Pond Brook was looked at more closely, but no SGA since it’s wetland dominated, see Figure 35 in this plan and SGA and river corridor final reports at: https://anrweb.vt.gov/DEC/SGA/finalReports.aspx
21. Use the assessment data to 1) identify opportunities for projects that will increase river stability, 2) evaluate landowner-proposed channel management activities, and 3) target related local, state and federal programs to increase river stability
VANR - RMP, NRCS, NRCDs
In Progress H/Working with River Program staff to identify projects, also Functioning floodplain initiative is coming online
22. Work with willing landowners, municipalities, regional/watershed conservation organizations, and others to design and implement river corridor protection projects consistent with increasing overall river stability
VANR, NRCDs, watershed organizations
Ecosystem Restoration Funds
In Progress H/ RNRCD completed Moon and Mussey Brook, Cold River, Mill River, and Neshobe RCPs and is prioritizing and implementing projects from these
23. Provide enhanced incentives and resources for municipalities to permanently protect riparian corridors
VANR, RPCs, VRC
Ecosystem Restoration Program,
In Progress H/ Strategies 44 and 49 in this plan include working with RPCs and municipalities to

2019 OTTER CREEK TACTICAL BASIN PLAN pg. 138
from new development and to restore existing corridors through municipal land use ordinances and conservation easements
conservation easements
increase riparian corridor protection and restoration
24. Establish vegetated buffers and/or filter strips along rivers, streams, and lake shorelines
VANR, NRCDs, VRC, towns
Ecosystem Restoration Program, Woody Buffer Block Grant
In Progress H/ RNRCD completed partial buffer assessments along Otter Creek and Neshobe River (2004) and will revisit
25. Modify existing state and federal programs, or create new ones, to more effectively support riparian corridor protection and restoration, e.g., impacts of ditching and tile drainage
VANR, VAAFM, EPA, VT Legislature
Ecosystem Restoration Program, conservation easements, VAAFM-BMPs
In Progress H/ Focus on Dead, Lewis, Lemon Fair, Little Otter, Otter Creeks
26. Use all available good quality data on the physical, chemical, and biological values of the waters, and collect any additional necessary data in the watershed to establish reference reaches.
VANR – RMP, ACRWC
Existing staff and budget resources – as function of tactical basin planning process going forward
In Progress H/ Ongoing as part of the TBP processes of identifying reclassification candidates (Figure 10) and determining monitoring priorities (Table 14)
27. Protect land along the rivers and streams where there are existing riparian buffers, significant wetlands, or where land is important to maintaining the rivers stability as determined by the geomorphic assessments and future river corridor plan.
RMP, private landowners, VLT, MALT municipalities, NRCDs, CCs, VRC
Ecosystem Restoration Funds , VHCD
In Progress H/Working to reclassify Otter Creek Wetland Complex and establishing River Corridor Easements where possible
28. Create minimum consistent zoning that would protect rivers in the watershed through setbacks and riparian buffer ordinances, and flood hazard zones and overlay districts.
VLCT, RMP, RPCs, Towns, DEC, select boards, VRC
Municipal Planning Grants
In Progress H/Working with RPCs and municipalities to include zoning for stream setbacks, riparian buffers, and flood hazard areas.

2019 OTTER CREEK TACTICAL BASIN PLAN pg. 139
Objective 3: PROTECT AND RESTORE THE NATURAL ENVIRONMENTS OF WETLANDS, LAKES AND PONDS IN THE BASIN TO SUPPORT WATER QUALITY, RECREATION AND AESTHETICS Wetlands and Floodplain Protection and Restoration
29. Using the new Lake Champlain Basin Wetland Restoration Plan as a guide, work with willing landowners to identify opportunities to restore and conserve wetlands and their role in improving water quality
VANR, VAAFM, NRCS (WRP)
WRP, WHIP, EQIP, Ecosystem Restoration Program
In Progress H/Highest priority sites identified per the Lake Champlain Basin Wetland Restoration Plan (and verified) – will cross-reference with SGA/ RCP.
30. Class Three wetlands are not within state jurisdiction and should be addressed under municipal regulations. Municipalities were given a responsibility in the 1986 wetland legislation to notify the state about developments in wetlands in 24 V.S.A. §4409. Encourage municipal oversight and stewardship efforts.
RPC’s, towns, VLCT, DEC Wetlands Program, NRCS
EPA pass-through 604(b), Municipal Planning Grants
In Progress M/Will target town plan and zoning rewrites and revisions
31. Work with conservation commissions to map existing wetlands and wetland functions and values for willing towns in the watershed. Use this information to prioritize the protection or restoration of wetlands in the watershed.
Conservation Commissions, VT Wetlands Section
Watershed Grant
In Progress M/ Ongoing as part of the TBP processes of identifying restoration candidates (Figure 39)
32. Communities should consider adopting flood hazard area regulations that are more stringent than the minimum requirements of participation in the NFIP.
VANR, RPCs EPA 604(b), Municipal Planning Grants
In Progress M/ Working with RPCs and municipalities to focus on river corridor adoption and ERAF eligibility of towns
33. Encourage municipal adoption of a Fluvial Erosion Hazard overlay district as one of the best avoidance strategies for fluvial erosion hazard mitigation. An overlay district is an additional zoning requirement placed on a specific
VANR, RPCs ANR – RMP existing staff and resources, Ecosystem Restoration
In Progress H/ Working with RPCs and municipalities to identify where adoption of a Fluvial Erosion Hazard overlay district is needed

2019 OTTER CREEK TACTICAL BASIN PLAN pg. 140
geographic area (in this case the FEH zone) without changing the underlying zoning.
Funds , EPA 604(b), Municipal Planning Grants
34. Protect floodplains identified through the geomorphic assessments as important for maintaining the stability of rivers and streams. Work with land trusts to include language in conservation easements that protect floodplains and buffers for maintaining or restoring stream stability.
VLT, MALT, RMP, VRC, conservation commissions
VHCB, Ecosystem Restoration Funds
In Progress H/ Functioning floodplains initiative will replace
Lake and Pond Protection and Restoration
35. Hold a Vermont Invasive Patrollers (VIPs) workshop in the Basin and form survey groups to patrol the watershed to identify and control invasive riparian or aquatic species populations before they are well established
Lake/river associations, VANR, FOVLAP
ANC, Watershed Grants, LCBP
In Progress—where receptive
H/ See Strategy 42-- focus on Beaver Pond, Cedar Lake (Monkton Pond), Chipman Lake, Lake Dunmore, Fern Lake, Porter Lake, Richville Pond, Rutland City, Star Lake, Vergennes Watershed, and Winona Lake (Bristol Pond)
36. Encourage the development of locally-run public access “greeter” programs to prevent aquatic invasive species from entering or leaving a lake or pond, and support general public education and outreach about this topic
Lake associations, VDEC, DFW, DFPR, FOVLAP
ANC, Watershed Grants, LCBP
In Progress—where receptive
H/ See Strategy 41—focus on Beaver Pond, Cedar Lake (Monkton Pond), Chipman Lake, Lake Dunmore, Fern Lake, Porter Lake, Richville Pond, Rutland City, Star Lake, Vergennes Watershed, and Winona Lake (Bristol Pond)
37. Increase the level of communication between lake associations and residents to prevent spread of invasive species into or within the watershed. Distribute information to lake and pond residents about invasive species and other common lake and pond
FOVLAP, VDEC - AIS, VDEC
ANC, local fundraising
In Progress M/ Ongoing throughout the basin in coordination with LPP and FOVLAP. Also, social media reboot may be useful.

2019 OTTER CREEK TACTICAL BASIN PLAN pg. 141
issues, using modern approaches (social media sites, online forums, etc.)
38. Continue to support lake - lay monitoring programs in the watershed.
Lake/river associations, VDEC, LaRosa
LMP and LaRosa Program
In Progress H/See Strategy 40—focus on Cedar Lake (Monkton Pond), Silver Lake, Winona Lake (Bristol Pond)
39. Maintain existing shoreline vegetation through the creation of shoreline zoning with vegetated buffers for all watershed towns.
State of Vermont, Planning commissions, VLCT
N/A In Progress H/ N/A the Shoreland Protection Act
40. Hold a workshop or series of workshops on lakeshore management to cover such topics as buffer restoration and low impact lawn care and landscaping. In addition, continue to promote LID concepts for camp conversions or replacement.
Lake Associations, Land Trusts, VDEC, RPCs, and planning commissions
Watershed Grant, 604(b), Municipal Planning Grants
In Progress M/Several examples including the NSEC
41. Maintain signs encouraging invasive species spread prevention actions at all public launches in the Basin to prevent spread to or from the waterbody. Include what aquatic invasive species are present.
VDEC, DFW, DFPR
Existing staff and resources
In Progress – where updated information exists
H
General Water Quality Issues and Protection
42. Include riparian area protection within town plans. Develop riparian area protection language within town zoning regulations.
VLCT, RPCs, towns
EPA 604(b), Ecosystem Restoration Funds , existing staff and resources
In Progress—where receptive
H/ Working with RPCs and municipalities to develop riparian area protection language within zoning
43. Identify surface waters with regular or episodic elevations in pathogens and disseminate this information to the public. Correct obvious runoff issues
VANR, towns, watershed groups
Existing staff and budget resources
In Progress M/via ACRWC outreach materials-- Focus on these TMDL watersheds: Lewis Creek, Little Otter Creek, Middlebury River, Otter Creek

2019 OTTER CREEK TACTICAL BASIN PLAN pg. 142
that may be contributing to this problem.
44. Provide results of water quality testing and information about the water quality of the watershed to the public through towns, schools, the web, and the local library.
VDEC, ACRWC Towns, school, libraries, local media
DEC MAPP, Watershed grants
In progress M/via RRPC CWAC and ACRPC Natural Resources Committee meetings and ACRWC outreach materials
45. Expand the capacity of volunteer monitoring programs with minimum monthly sampling on all high priority waterbodies throughout the watershed (as resources allow).
ACRWC, UOCWC, VDEC LaRosa, EPA
DEC – LaRosa, EPA
In Progress M/ Expand monitoring on rotational, priority basis as ACRWC currently administers and also with UOCWC
46. Make annual water quality data easily accessible online and linked to RPC, lake/ watershed association, and town web sites.
VDEC, RPCs, ACRWC, UOCWC, towns
EPA 604(b), watershed grants, Ecosystem Restoration Funds
In Progress H/ ACRWC and UOCWC monitor and disseminate their data online
47. Protect and provide public access to unique features throughout the watershed. The Otter Creek and its tributaries have many waterfalls, historical mill sites, and beautiful areas where it is important to maintain public access to help keep people connected with these resources.
VDEC, VRC, MALT, VLT, LARC
VHCB In Progress H/Can be identified through existing uses tables in Appendix B and communicated during public meetings.
48. Complete a demonstration project along the New Haven River on control methods for Japanese knotweed, including the proper disposal of Knotweed, to prevent its spread. Encourage landowners to mow or cut areas of knotweed on private property.
TNC, NHRAA, towns, CCs
Watershed Grants, Ecosystem Restoration Funds
Discontinued M
Objective 4: MINIMIZE CONFLICTS BETWEEN STREAMS’ NATURAL FUNCTIONS AND TRANSPORTATION INFRASTRUCTURE

2019 OTTER CREEK TACTICAL BASIN PLAN pg. 143
49. Conduct comprehensive assessments when replacing infrastructure that is in conflict with natural stream processes, utilizing the recently updated ANR/AOT bridge and culvert assessment protocols
VANR, VTrans, towns
Existing staff and budget resources
In Progress H/ Mostly completed through TNC, VDFW
50. Hold a series of Local Roads workshops in the Basin to increase awareness of maintenance measures that will reduce gravel road erosion. Encourage the participation of all town highway managers and road crews in the watershed.
VT Local Roads Program, VT Better Backroads Program, RPCs, RMP, towns
Better Backroads
In Progress H/ Monthly road commissioner workshops/ luncheons
51. Develop capital road improvement budgets for all towns in the Otter Creek Basin.
Town select boards, road commissioners
Better Backroads, Grants in Aid
2019 B03 plan M/ MRGP will require and RPCs will assist
52. Identify Better Backroad grant opportunities by touring watersheds with road commissioners from each town. Apply for Better Backroad grants in all watershed towns to conduct road inventories and address the most serious road-related erosion problems.
VDEC, road commissioners, select boards, Local Roads Program
Better Backroads grants, municipal stormwater mitigation grants, town highway funds
In Progress M/ RPCs will assist
53. Compile guidance on winter sanding and salt application and distribute to towns in the Basin to encourage the development of policies that will reduce salt and sand application in the watershed. Provide outreach to the general public on the impacts of salt and sand application to reduce the pressure for their expanded use.
Road commissioners, VTrans, Local Roads Program, VDEC
Discontinued M/ Article on this topic in Vermont Local Road News.
54. Work with road crews in the watershed to put in a grant for a hydroseeder that
NRCDs, Road crews and
Ecosystem Restoration
Complete H/ RNRCD shares hydroseeder with PMNRCD, ACRPC and Cornwall have

2019 OTTER CREEK TACTICAL BASIN PLAN pg. 144
could be used by all towns in the watershed and possibly landowners to stabilize ditches.
commissioners, CCs, select board members, VTrans
Funds, Municipal Stormwater Mitigation Grant, Better Backroads grant
developed such a program in Addison County
55. Work with all municipalities in the watershed to adopt and actively implement the following programs or standards:
A. Town road and bridge standards consistent with or exceeding those listed per Act 110: http://www.leg.state.vt.us/reports/2011ExternalReports/265312.pdf B. Driveway/highway access (curb cut) construction ordinances meeting the standards outlined in the Highway Access Policy and Program Guidance and Model Ordinance, VT Local Roads Program, May 1997.
Road crews and commissioners, CCs, and select board members, VTrans
Town Funds - Increased state match for class 2 road projects and reimbursement for disaster relief
In Progress H/ongoing as part of TBP process to identify Act 110 compliant towns and target those towns that need updating, especially mountain towns and those affected by Tropical Storm Irene, Req. by Title 19
56. Compile available bridge and culvert survey data in the basin and present this information to watershed towns and develop a list of priority culverts for replacement based on likelihood of culvert failure, geomorphic impacts and aquatic species passage concerns.
Road crews and commissioners, CCs, select board members, VTrans, RPCs, RMP, DFW
Better Backroads
2019 B03 plan H/See Figures 36 and 37 of this plan
57. Work with town road commissioners and select board members to replace top priority culverts in each town.
Road crews, CCs, and select board members,
Better Backroads
2019 B03 plan H/ See Figures 36 and 37 of this plan

2019 OTTER CREEK TACTICAL BASIN PLAN pg. 145
VTrans, RPCs, RMP, DFW
Identify non-functioning dams and prioritize for removal, partial breaching, and/or improved fish passage. Address effects of hydro-modification.
58. Identify existing dams which are no longer used in the watershed and are candidates for removal. Remove one dysfunctional dam in the Basin and restore the natural flows and riverine habitat.
Dam Task Force, Hydrology Program, private dam owners
USGS grants 2019 B03 plan H/working to identify willing owners of failing dams that have disrupted sediment regimes and fish passage (e.g., Dunklee Pond Dam, Youngs Brook Dam)
59. Review any large water withdrawal proposals in the watershed to ensure that they do not reduce fish passage, alter sediment regimes, or reduce flows or groundwater levels to significantly impact aquatic habitat.
VDEC Hydrology program, NRCS, NRCDs, Stream Alteration Engineer, DFW
ERP, Better Backroads grant, Watershed grant
Complete High/ project proposal by NVDA to work with one or two towns in 2018 on class 4 assessments. Town not yet selected.

2019 OTTER CREEK TACTICAL BASIN PLAN pg. 146
Appendix B. Existing Uses in Basin 3 During the Basin 3 planning process, the VANR documented existing uses for swimming (contact recreation), fishing, and boating on flowing waters. All surface waters used as public drinking water sources were also identified. The VANR presumes that all lakes and ponds in the basin have existing uses of fishing, swimming (contact recreation), and boating, because of the extensive use of waters based upon their intrinsic qualities. The VANR recognizes that fishing activities in streams and rivers are widespread throughout the basin and can be too numerous to document. Also, streams too small to support significant angling activity provide spawning and nursery areas, which contribute to fish stocks downstream where larger streams and rivers support a higher level of fishing activity. As such, these small tributaries are considered supporting the use of fishing and are protected at a level commensurate with downstream areas. This presumption may be rebutted on a case-by-case basis during the VANR’s consideration of a permit application, which might be deemed to affect these uses.
The following tables are not intended to represent an exhaustive list of all existing uses, but merely an identification of well-known existing uses. Additional existing uses of swimming (contact recreation), boating, and fishing on/in flowing waters may be identified during a permit application or during future basin planning efforts.
Table B-1. Determination of existing uses of waters for swimming in Basin 3.
Surface Water Location of Use Watershed Town Basis for Determining the Presence of an Existing Use
Emerald Lake Emerald Lake State Park Otter mainstem Dorset Public (State) beach and attractive recreation site Elfin Lake Elfin Lake Municipal
Swimming Beach Unnamed tributary Wallingford Public (municipal) beach and attractive recreation
site Griffith Lake USFS – Green Mountain
National Forest Big Branch Peru,
Mount Tabor USFS Public waterbody and attractive recreation site (hikers/ campers only)
Little Rock Pond USFS – Green Mountain National Forest
Homer Stone Brook Wallingford USFS Public waterbody and attractive recreation site (hikers/ campers only)
Mill River (1) Swinging Bridge Mill River Clarendon Locally used swimming hole at public recreation area (Long Trail/ Appalachian Trail)
Clarendon Gorge (1) Clarendon Gorge – multiple swimming areas
Mill River Clarendon Popular Swimming hole

2019 OTTER CREEK TACTICAL BASIN PLAN pg. 147
Table B-2. Determination of existing uses of waters for fishing in Basin 3.
Surface Water Watershed Town Basis for Determining the Presence of an Existing Use
Otter Creek WMA Otter Creek Danby/ Mount Tabor Otter Creek WMA F&W access, special use regulations and stocking
Danby Pond Mill Brook Danby State designated “carry-in” access to Pond, warm-water fishery.
Emerald Lake Emerald Lake State Park Dorset Public (State) beach and attractive recreation site, State designated “carry-in” access to Lake, warm-water fishery.
Tinmouth Pond Clarendon River Tinmouth State designated “car-top” access to Pond, warm-water fishery.
Star Lake Mill River Mount Holly State designated “trailer” access to Lake, mixed water fishery.
Spring Lake Spring Lake local access area Mill River Shrewsbury Private (local) access and attractive recreation site with public swimming usage permitted upon request
Chittenden Reservoir/ Lefferts Pond
USFS – Green Mountain National Forest
East Creek Chittenden Green Mountain National Forest – CVPS Public access area. USFS designated access to Sugar Hill Reservoir, Silver Lake, and Falls of Lana.
Lake Dunmore/ Fern Lake/ Falls of Lana/ Silver Lake/ Sugar Hill Reservoir
USFS – Green Mountain National Forest, Branbury State Park
Sucker Brook, tributary to the Leicester River
Salisbury/ Leicester
Green Mountain National Forest, Branbury State Park. USFS designated access to Sugar Hill Reservoir, Silver Lake, and Falls of Lana (1).
High Pond TNC protected land Willow Brook Sudbury Protected access and attractive recreation site Middlebury Gorge (1) Middlebury River – Route 125
pull-off access points Middlebury River East
Middlebury Public (local) access and attractive recreation site. Popular and well-known swimming location with easy access from State Route 125.
New Haven Gorge – Bartlett Falls (1)
New Haven River – Lincoln Mountain Road – multiple pull-off access points.
New Haven River Bristol Public (local) access and attractive recreation site. Popular and well-known swimming location with easy access from the Bristol-Lincoln Road.
New Haven River – Sycamore Park
New Haven River – municipal park off State Route 116
New Haven River Bristol Public (municipal) access and attractive recreation site. Popular and well-known swimming location with easy access from State Route 125.
Monkton Pond Cedar Lake (Monkton Pond) Lewis Creek Monkton

2019 OTTER CREEK TACTICAL BASIN PLAN pg. 148
Little Rock Pond Homer Stone Brook Wallingford USFS Public waterbody and attractive recreation site (hikers/ campers only), cold water fishery.
Wallingford Pond Mill River Wallingford USFS Public waterbody and attractive recreation site (hikers/ campers only), designated “carry-in” access to Pond, warm-water fishery.
Spring Lake Mill River Shrewsbury Public (local) beach and attractive recreation site, cold-water fishery.
Chittenden Reservoir/ Lefferts Pond East Creek Chittenden Green Mountain National Forest – CVPS Public access area. State designated “trailer” access to Lake, mixed water fishery, special use regulations and stocking.
Sutherland Falls Otter Creek Proctor Public (municipal) access and attractive recreation site below falls.
Otter Creek Otter Creek Proctor/ Pittsford Gorham Covered Bridge, State designated “car-top” access to Creek, mixed-water fishery. State designated special use regulations and stocking.
Furnace Brook Furnace Brook Chittenden Pittsford
State designated special use regulations and stocking.
Neshobe River Neshobe River Goshen Brandon
State designated special use regulations and stocking.
Otter Creek Otter Creek Brandon State designated “trailer” access to Creek, mixed water fishery, special use regulations and stocking.
Otter Creek Otter Creek Salisbury State designated “car-top” access to Creek, mixed-water fishery.
Lower Otter Creek WMA Otter Creek New Haven Lower Otter Creek WMA F&W access, special use regulations and stocking
Richville Pond – Richville WMA Lemon Fair River Shoreham, Orwell Richville WMA F&W access, special use regulations and stocking. State designated “car-top” access to Pond, warm-water fishery.
Lake Dunmore/ Fern Lake/ Falls of Lana/ Silver Lake/ Sugar Hill Reservoir
Leicester River Salisbury/ Leicester Green Mountain National Forest – and State DFW Public access areas. USFS designated access to Sugar Hill Reservoir, Silver Lake, and Falls of Lana.
Middlebury River Middlebury River East Middlebury State designated special use regulations and stocking. Access from Route 125

2019 OTTER CREEK TACTICAL BASIN PLAN pg. 149
New Haven River New Haven River Lincoln, Bristol, New Haven State designated special use regulations and stocking.
New Haven River New Haven River New Haven - Brooksville Public (local) access and attractive recreation site. Popular and well-known fishing location at the site of the former Dog Team Tavern.
Dead Creek WMA Dead Creek Addison, Panton State designated “car-top” access to Creek, warm-water fishery, special use regulations and stocking.
Bristol Pond Pond Brook – Lewis Creek Bristol State designated “trailer” access to Pond, warm-water fishery, special use regulations and stocking.
Monkton Pond Lewis Creek Monkton State designated “trailer” access to Pond, warm-water fishery, special use regulations and stocking.
Lewis Creek WMA Lewis Creek Ferrisburgh State designated “trailer” access to Creek, mixed water fishery, special use regulations and stocking.
Otter Creek Otter Creek Weybridge State designated “trailer” access to Creek, mixed water fishery, special use regulations and stocking.
Otter Creek Otter Creek Ferrisburgh Fort Cassin - State designated “trailer” access to Creek, warm-water fishery, special use regulations and stocking.
Little Otter Creek WMA Little Otter Creek Ferrisburgh State designated “trailer” access to Creek, mixed water fishery, special use regulations and stocking.
Table B-3. Determination of existing uses of waters for pubic water supplies in Basin 3.
Surface Water Watershed Town Basis for Determining the Presence of an Existing Use
Unnamed Pond Middlebury River Ripton The Middlebury College Breadloaf Campus water system in Ripton: An unnamed pond as an Inactive, Emergency source
Furnace Brook Kiln Brook
Furnace Brook Chittenden The Proctor Water Department in Proctor: Furnace Brook as an Active, Permanent source

2019 OTTER CREEK TACTICAL BASIN PLAN pg. 150
Kiln Brook as an Active, Permanent source
Mendon Brook East Creek
Mendon Brook East Creek
Mendon Chittenden
The Rutland City Water Department in Rutland: Mendon Brook in Mendon as an Active, Permanent source East Creek in Chittenden as an Inactive, Emergency source
Roaring Brook Roaring Brook Wallingford The Wallingford Fire District #1 water system in Wallingford: Roaring Brook as an Inactive, Emergency source
Unnamed tributary (A2) Cold River Killington City of Rutland water supply. Unnamed tributary to Cold River and all waters within its watershed upstream of its diversion into the Mendon Brook watershed in the town of Killington.
Mendon Brook (A2) Previously mentioned
Mendon Brook Killington Mendon
City of Rutland water supply. Mendon Brook and all waters within its watershed upstream of the water intake just south of Meadow Lake Drive in the Town of Mendon.
Tenney Brook (A2) Tenney Brook Mendon Rutland Town
Rutland-Mendon Town water supply. Tenney Brook and all waters with its watershed upstream of and including a small intake impoundment.
Rutland City Reservoir (A2) East Creek Rutland Town City of Rutland water supply. Rutland City Reservoir in Rutland Town and all waters within its watershed in Rutland Town and Mendon.
Moon Brook (A2) Moon Brook Mendon Rutland-Mendon F.D. #2 water system. (Gleason Road System - now abandoned.) Moon Brook and all waters within its watershed in Mendon upstream of and including a small intake impoundment.
Unnamed Tributary to Tenney Brook (A2)
Tenney Brook Mendon Rutland F.D. #2 (Gleason Road) water system. Unnamed tributary to Tenney Brook and all waters within its watershed in Mendon upstream of the water intake.

2019 OTTER CREEK TACTICAL BASIN PLAN pg. 151
Young’s Brook (A2) Clarendon River West Rutland Ira
Village of West Rutland water supply. (No longer used). Young’s Brook and reservoir and all waters within its watershed in West Rutland and Ira upstream of the water intake.
Furnace Brook and Kiln Brook (A2) Previously mentioned
Furnace Brook Chittenden Village of Proctor water supply. (Kiln Brook in the main source, with Furnace Brook used as a backup). Furnace Brook and Kiln Brook and all waters within their watersheds in Chittenden upstream of their confluence.
Sugar Hollow Brook (A2) Sugar Hollow Brook Goshen Chittenden
Town of Brandon water supply. (No longer used). Sugar Hollow Brook and all waters within its watershed in Goshen and Chittenden upstream of the water intake.
Leicester Hollow Brook (A2) Neshobe River Leicester Town of Brandon Water Supply. (No longer used). Leicester Hollow Brook and all waters within its watershed in Leicester upstream of the water intake.
Brandy Brook (A2) Previously mentioned
Middlebury River Ripton Now or former water supply for Breadloaf School. Brandy Brook and all waters within its watershed.
Unnamed tributary to Beaver Meadow Brook (A2)
New Haven River Lincoln Village of Bristol water supply. Unnamed tributary to Beaver Meadow Brook and all waters within its watershed upstream of the water intake in Lincoln.
Unnamed tributary to Lewis Creek (A2) Lewis Creek Starksboro Village of Starksboro water supply. (No longer used). Unnamed tributary to Lewis Creek and all waters within its watershed in Starksboro upstream of the water intake.
Two unnamed tributaries to Little Otter Creek (A2)
Little Otter Creek Monkton Bristol
City of Vergennes water supply. (Not used since 1973). Two unnamed tributaries to Little Otter Creek and all waters within their watersheds in Monkton and Bristol upstream of two water intakes.
Notch Brook (A2) New Haven River Bristol Village of Middlebury water supply. (Reserved for emergency use). Notch Brook and all waters within its

2019 OTTER CREEK TACTICAL BASIN PLAN pg. 152
watershed upstream of the water intake in Bristol.
Roaring Brook Previously mentioned
Roaring Brook Wallingford Wallingford F.D. #1 water supply. Roaring Brook and all waters within its watershed upstream of the water intake.
Table B-4. Determination of existing uses of waters for recreational boating in Basin 3 – Flat water.
Surface Water Location of Use Watershed Town Basis for Determining the Presence of an Existing Use
Emerald Lake Emerald Lake State Park Otter mainstem Dorset Public (State) beach and attractive recreation site Elfin Lake Elfin Lake Municipal
Swimming Beach Unnamed tributary Wallingford Public (municipal) beach and attractive recreation site
Otter Creek mainstem Otter Creek Otter Creek Dorset to Ferrisburgh
Multiple Otter Creek F&W and other access areas
Danby Pond Danby Pond Mill Brook Danby State designated “carry-in” access to Pond Tinmouth Pond Baker Brook Danby/ Tinmouth Spring Lake Spring Lake local access area Mill River Shrewsbury Private (local) access and attractive recreation site Chittenden Reservoir/ Lefferts Pond
USFS – Green Mountain National Forest
East Creek Chittenden Green Mountain National Forest – CVPS Public access area. USFS designated access to Sugar Hill Reservoir, Silver Lake, and Falls of Lana.
Lake Dunmore/ Fern Lake/ Falls of Lana/ Silver Lake/ Sugar Hill Reservoir
USFS – Green Mountain National Forest, Branbury State Park
Sucker Brook, tributary to the Leicester River
Salisbury/ Leicester
Green Mountain National Forest, Branbury State Park. USFS designated access to Sugar Hill Reservoir, Silver Lake, and Falls of Lana (1).
Lake Winona (Bristol Pond) F&W access area Pond Brook Bristol State F&W access area Monkton Pond Cedar Lake (Monkton Pond)
F&W access area Lewis Creek Monkton Swimming listed as a present use in
Star Lake Belmont – Star Lake Mill River Mount Holly State designated “trailer” access to Lake Little Otter Creek Little Otter Creek WMA Little Otter Creek Ferrisburgh State designated “trailer” access to Creek
Table B-5. Determination of existing uses of waters for recreational boating in Basin 3 – White water.
Surface Water Watershed Town Basis for Determining the Presence of an Existing Use Clarendon Gorge to Route 7 Mill River Clarendon Multiple access locations New Haven River New Haven River Lincoln, Bristol Bristol - Lincoln Mountain Road – multiple pull-off access points. Middlebury Gorge Middlebury River Middlebury, Ripton East Middlebury - Multiple access locations - Route 125 pull-off
access points

2019 OTTER CREEK TACTICAL BASIN PLAN pg. 153
Furnace Brook Furnace Brook Chittenden Pittsford
Multiple access locations
Neshobe River Neshobe River Goshen Brandon
Multiple access locations
Otter Creek Gorge and Falls Otter Creek Middlebury, Weybridge Multiple access locations Cold River Cold River Shrewsbury Multiple access locations Roaring Brook Roaring Brook Wallingford Multiple access locations Big Branch Big Branch Mount Tabor Multiple access locations Danby Slides Mill Brook Danby Multiple access locations
(1) Jenkins and Zitka, The Waterfalls, Cascades, and Gorges of Vermont, VTANR, 1988. Table B-6. Determination of waterbodies not considered as Existing Use – Fishing in Basin 3.
Surface Water Watershed Town Basis for Existing Use exclusion Moon Brook Moon Brook Rutland – Rutland City No stocking, use regulations, or access areas Willow Brook Otter Creek Sudbury No stocking, use regulations, or access areas Muddy Branch New Haven River Middlebury No stocking, use regulations, or access areas Pond Brook Lewis Creek Monkton No stocking, use regulations, or access areas Beaver Pond Mendon Brook Mendon Future milfoil management uncertain, ownership and contracted use in jeopardy

2019 OTTER CREEK TACTICAL BASIN PLAN pg. 154
Appendix C. Dams in Basin 3 Table C1. Active dams in Basin 3 organized by town name. These dams are either in service, partially breached, or drained.
Stat
e ID
Dam
Nam
e
Tow
n
Stre
am
Dam
Sta
tus
TNC
Rank
Dam
Haz
ard
Clas
s
Com
men
ts
31.07 Bristol Bristol Breached 26.01 Blair Brandon Arnold Brook-TR In Service 54.02 Norinberg Cornwall Beaver Brook In Service Medium Medium 54.03 Kirk Cornwall Beaver Creek-TR In Service Low Low 167.01 Bread Loaf Ripton Brandy Brook In Service Medium Medium
99.05 Walker Pond Hubbardton Bresee Mill Brook-TR In Service Medium Medium Pond with recreation
site
99.06 Mudd Pond Hubbardton Bresee Mill Brook-TR In Service Medium Medium
54.01 Cornwall-1 Cornwall Cedar Swamp-TR In Service Low Low 149.01 Stone Bridge Panton Dead Creek In Service High High VDFW WMA 1.01 Farrel Addison Dead Creek-TR In Service Low Low VDFW WMA
1.02 Woodcock Site 2 Addison Dead Creek-TR In Service Low Low VDFW WMA
1.04 Woodcock Site 4 Addison Dead Creek-TR In Service Low Low VDFW WMA
1.05 Woodcock Site 3 Addison Dead Creek-TR In Service Very Low Very Low VDFW WMA
1.06 Jerome Addison Dead Creek-TR In Service Medium Medium VDFW WMA
1.17 Woodcock Site 1 Addison Dead Creek-TR In Service Low Low VDFW WMA
1.18 Farrell North Addison Dead Creek-TR In Service Low Low VDFW WMA

2019 OTTER CREEK TACTICAL BASIN PLAN pg. 155
Stat
e ID
Dam
Nam
e
Tow
n
Stre
am
Dam
Sta
tus
TNC
Rank
Dam
Haz
ard
Clas
s
Com
men
ts
82.02 Stewart Goshen Dutton Brook-TR In Service Low Low Pond with homes
1.08 Brilyea East Addison East Branch Dead Creek In Service High High VDFW WMA
1.10 Tetreault Addison East Branch Dead Creek-TR In Service Medium Medium VDFW WMA
49.01 Chittenden Reservoir Chittenden East Creek In Service High High Hydropower
49.02 Lefferts Pond West Chittenden East Creek In Service High High USDA-FS recreation site
49.03 Lefferts Pond East Chittenden East Creek In Service
154.05 East Pittsford Pittsford East Creek Breached Very Low Very Low Appears to be gone 173.01 Patch Pond Rutland City East Creek In Service High High Hydropower 174.03 Glen Rutland Town East Creek In Service High High Hydropower
174.04 Rutland City Reservoir Rutland Town East Creek-TR In Service
174.06 Rutland-6 Rutland Town East Creek-TR In Service 174.07 Rutland-7 Rutland Town East Creek-TR In Service Very Low Very Low Pond with homes
174.08 Rutland City Reservoir Dike Rutland Town East Creek-TR In Service
76.07 Jackman Ferrisburgh East Slang In Service 76.01 Harris Ferrisburgh East Slang-TR In Service Medium Medium VDFW WMA 76.02 Robinsons Slang Ferrisburgh East Slang-TR In Service Medium Medium VDFW WMA 76.08 Goose Creek Ferrisburgh Goose Creek In Service Low Low VDFW WMA
219.02 Quinn Lower Wallingford Homer Stone Brook In Service Low Low

2019 OTTER CREEK TACTICAL BASIN PLAN pg. 156
Stat
e ID
Dam
Nam
e
Tow
n
Stre
am
Dam
Sta
tus
TNC
Rank
Dam
Haz
ard
Clas
s
Com
men
ts
26.03 Jones Mill Brandon Jones Brook In Service Medium Medium State-owned 54.05 Perry-Jackson Cornwall Ledge Creek In Service Medium Medium 180.01 Lake Dunmore Salisbury Leicester River In Service Medium Medium Lake with homes 180.03 Salisbury Salisbury Leicester River In Service Medium Medium Hydropower 189.01 Richville Pond Shoreham Lemon Fair River In Service High High VDFW WMA
46.02 Scott Pond Charlotte Lewis Creek In Service Very High Very High Waterfalls immediately u/s and d/s
197.01 Baldwin Pond Starksboro Lewis Creek-TR In Service Medium Medium 197.03 Clifford Starksboro Lewis Creek-TR In Service Medium Medium
197.06 Common Ground Pond Starksboro Lewis Creek-TR-
Offstream In Service
76.03 Turner Ferrisburgh Little Otter Creek Breached Medium Medium
31.01 Norton Brook Bristol Little Otter Creek-TR In Service Low Low
76.04 Callery Ferrisburgh Little Otter Creek-TR In Service Medium Medium
76.06 Bergh Ferrisburgh Little Otter Creek-TR In Service Medium Medium
76.06 Bergh Ferrisburgh Little Otter Creek-TR In Service Medium Medium VDFW WMA
1.11 Warner Site 2 Addison Middle Branch Dead Creek In Service
1.12 Warner Site 3 Addison Middle Branch Dead Creek-TR In Service Low Low VDFW WMA
125.05 East Middlebury Middlebury Middlebury River Breached

2019 OTTER CREEK TACTICAL BASIN PLAN pg. 157
Stat
e ID
Dam
Nam
e
Tow
n
Stre
am
Dam
Sta
tus
TNC
Rank
Dam
Haz
ard
Clas
s
Com
men
ts
135.02 Star Lake Mount Holly Mill River-TR In Service Medium Medium Community recreation site
173.03 Combination Pond Rutland City Moon Brook In Service Low Low Active removal project
173.07 Piedmont Pond Rutland City Moon Brook In Service Very Low Very Low Included in Moon Bk. TMDL analysis
125.03 Dow Pond Middlebury Muddy Branch In Service High High
125.04 Middlebury Reservoir Middlebury Muddy Branch-TR In Service Low Low
125.06 Wood Middlebury Muddy Branch-TR In Service Medium Medium 125.07 Pomainville Middlebury Muddy Branch-TR In Service Low Low
173.04 Lower Eddy Pond
Rutland City Mussey Brook Breached Medium Medium
174.05 Upper Eddy Pond
Rutland Town Mussey Brook In Service Medium Medium
26.05 Brandon (Upper)
Brandon Neshobe River In Service Low Low
26.06 Brandon (Lower)
Brandon Neshobe River In Service Low Low
82.03 Kingsland Goshen Neshobe River In Service High High 31.04 Bartletts Falls Bristol New Haven River Breached
114.03 Senk Lincoln New Haven River - TR In Service Very Low Very Low Farm pond
114.02 Lincoln-2 Lincoln New Haven River-OS In Service Low Low Pond with homes
114.01 Goeselt Lincoln New Haven River- In Service Low Low Pond with home

2019 OTTER CREEK TACTICAL BASIN PLAN pg. 158
Stat
e ID
Dam
Nam
e
Tow
n
Stre
am
Dam
Sta
tus
TNC
Rank
Dam
Haz
ard
Clas
s
Com
men
ts
TR 60.01 Emerald Lake Dorset Otter Creek In Service High High State park
125.01 Middlebury Upper
Middlebury Otter Creek In Service Low Low Natural barrier
125.02 Middlebury Lower
Middlebury Otter Creek In Service Low Low Hydropower
140.01 Huntington Falls
New Haven Otter Creek In Service Low Low Hydropower
140.02 Beldens New Haven Otter Creek In Service Very Low Very Low Hydropower 160.04 Proctor Proctor Otter Creek In Service Low Low Hydropower 173.06 Ripley Mills Rutland City Otter Creek In Service Medium Medium Mainstem dam
174.09 Center Rutland
Rutland Town Otter Creek In Service Medium Medium Hydropower
213.01 Vergennes No. 9
Vergennes Otter Creek In Service Low Low Hydropower
240.01 Weybridge Weybridge Otter Creek In Service Medium Medium Hydropower
1.19 DuBois Manure Pit
Addison Otter Creek-OS In Service
125.09 Buttolph Middlebury Otter Creek-OS In Service Low Low Pond with homes 154.02 Smith Pond Pittsford Otter Creek-OS In Service High High Pond with homes 26.02 Adams Brook Brandon Otter Creek-TR In Service Medium Medium 76.05 Danyow Ferrisburgh Otter Creek-TR Breached Medium Medium
125.08 Middlebury Industrial Park
Middlebury Otter Creek-TR In Service Very Low Very Low Industrial park site

2019 OTTER CREEK TACTICAL BASIN PLAN pg. 159
Stat
e ID
Dam
Nam
e
Tow
n
Stre
am
Dam
Sta
tus
TNC
Rank
Dam
Haz
ard
Clas
s
Com
men
ts
160.01 Beaver Pond Proctor Otter Creek-TR In Service 160.02 Olympus Pool Proctor Otter Creek-TR In Service
160.03 Reynolds Reservoir
Proctor Otter Creek-TR In Service Low Low
189.02 Pomainville Shoreham Perry Brook In Service Low Low
31.02 Lake Winona (Bristol Pond) Bristol Pond Brook In Service High High VDFW access area
129.01 Vermont Kaolin Corporation Monkton Pond Brook-TR In Service Medium Medium
26.04 Goodnew Brandon Smalley Swamp-TR In Service Low Low
82.01 Sugar Hill Reservoir Goshen Sucker Brook In Service High High Hydropower
180.02 Sucker Brook Salisbury Sucker Brook In Service High High Hydropower
111.01 Silver Lake Leicester Sucker Brook-TR In Service Medium Medium Hydropower/USDA-FS recreation site
173.02 Dunklee Pond Rutland City Tenney Brook In Service Medium Medium Previously identified, City interested in removal
124.05 Ballantyne Mendon Tenney Brook-TR In Service Medium Medium
207.01 Chipman Lake Tinmouth Tinmouth Channel-TR In Service Medium Medium Lake with homes
1.07 Brilyea West Addison West Branch Dead Creek In Service Medium Medium VDFW WMA
1.09 Norton Addison West Branch Dead Creek-TR In Service Low Low VDFW WMA
1.13 Martin Addison West Branch In Service Low Low VDFW WMA

2019 OTTER CREEK TACTICAL BASIN PLAN pg. 160
Stat
e ID
Dam
Nam
e
Tow
n
Stre
am
Dam
Sta
tus
TNC
Rank
Dam
Haz
ard
Clas
s
Com
men
ts
Dead Creek-TR
1.14 Harte Addison West Branch Dead Creek-TR In Service Low Low VDFW WMA
1.15 Norton Shallow Dike Addison West Branch
Dead Creek-TR In Service Low Low VDFW WMA
1.16 McCuens Slang Addison Whitney Creek In Service
31.03 Coffin Bristol Winona Lake (Bristol Pond)-TR In Service Very Low Very Low
238.01 Youngs Brook West Rutland Youngs Brook Breached (Partial) High High May not be a barrier

2019 OTTER CREEK TACTICAL BASIN PLAN pg. 161
Appendix D. Responsiveness Summary
Vermont Department of Environmental Conservation Agency of Natural Resources
Responsiveness Summary to Public Comments Regarding:
Otter Creek (Basin 03) Tactical Basin Plan
On October 7, 2019, the Vermont Agency of Natural Resources, Department of Environmental Conservation (DEC) released a final draft of the Otter Creek Tactical Basin Plan Update for public comment. The public comment period began on October 7, 2019 and ended on November 8, 2019 and included three public meetings. The meetings were held in Middlebury, Vermont on October 9th, Rutland on October 15th, and Brandon on October 22nd.
The DEC prepared this responsiveness summary to address specific comments and questions and to indicate how the plan has been modified. The comments below may have been paraphrased or quoted in part. The full text of the comments is available for review or copying at the Rutland Office of the Department of Environmental Conservation, 430 Asa Bloomer State Office Bldg., 88 Merchants Row, Rutland, VT.
SUMMARY OF COMMENTS RECIEVED BY THE VERMONT DEPARTMENT OF ENVIRONMENTAL CONSERVATION (DEC):
Commenter: Rutland Regional Planning Commission
1. Comment: RRPC supports the reclassification of surface waters that have been outlined in the Draft Basin 3 TBP: Sugar Hollow Brook and Warner Brook from B2 to Al and Mendon Brook and Sugar Hollow Brook (fishing) from B2 to Bl. It would be helpful if these candidates for reclassification are listed in the Implementation Actions on pp 99-108.
Response: DEC agrees and has added a reclassification strategy in the Ch. 5 Implementation Table.
2. Comment: To support more widespread reclassification efforts, RRPC urges ANR to create a pathway for the public to submit recommendations for surface water reclassification. This would enhance communication about the benefits of reclassification, encourage increased public participation with the tactical basin planning process and allow for communities themselves to designate additional surface waters that merit an increased level of protection.

2019 OTTER CREEK TACTICAL BASIN PLAN pg. 162
Response: Duly noted. DEC is supportive of reclassification efforts with stakeholders and members of the public in order to develop and submit petitions for reclassification as well as potential ORW designations. A draft ORW and reclassification petition submittal form is currently in development and should be available for stakeholders and members of the public to submit in the near future. The VT statute 10 V.S.A. § 1424a (https://legislature.vermont.gov/statutes/section/10/049/01424a) describes the details of ORW designations.
3. Comment: The Draft Basin 3 Plan has an extensive list of implementation actions that are summarized on pages 99-108. RRPC has been working with other RPCs to develop a prioritization process for projects on this list, but it has not yet been finalized nor adopted by ANR for incorporation into its prioritization process. When this is finalized, RRPC will provide further recommendations through the Clean Water Advisory Committee on regional project priorities.
Response: Duly noted.
4. Comment: The Draft Basin 3 TBP calls out Stormwater Master Plans and, to a lesser extent, Stormwater Infrastructure Reports, as being essential for identifying priority projects. RRPC recommends that ANR make available as much funding as possible for communities to complete these plans. One solution could be the use of multi-town Stormwater Master Plans which is identified as Implementation Action #21 on p. 102, but this action is not explained in the plan’s text.
Response: Duly noted and this request has been shared with the Clean Water Initiative Program. Multi-town SWMPs are often used to address lake watersheds containing several towns but could be used in other cases. This will be explored further during this Basin 3 planning cycle. We also note that the design/implementation block grants presently available provide a ready means to move projects along that have resulted from prior SWMPs. Further, there is presently open a Partnership Project Development block grant that will support the identification and development of water quality remediation projects for stormwater, outside of three-acre general permit requirements.
5. Comment: RRPC suggests that the Developed Lands-Stormwater section of the Implementation Actions #19-23 on pp. 102-103, address land use patterns that ultimately affect surface waters. This could include guidance on the design of development, reducing impervious surfaces, and discouraging sprawl development.
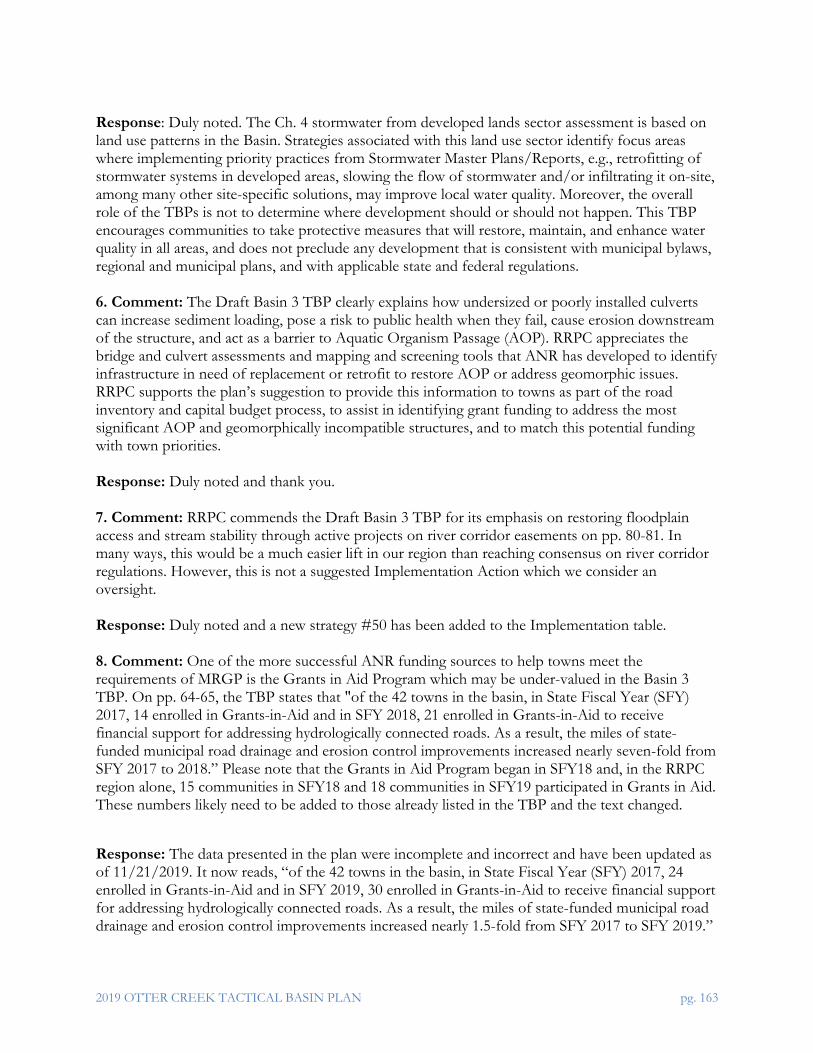
2019 OTTER CREEK TACTICAL BASIN PLAN pg. 163
Response: Duly noted. The Ch. 4 stormwater from developed lands sector assessment is based on land use patterns in the Basin. Strategies associated with this land use sector identify focus areas where implementing priority practices from Stormwater Master Plans/Reports, e.g., retrofitting of stormwater systems in developed areas, slowing the flow of stormwater and/or infiltrating it on-site, among many other site-specific solutions, may improve local water quality. Moreover, the overall role of the TBPs is not to determine where development should or should not happen. This TBP encourages communities to take protective measures that will restore, maintain, and enhance water quality in all areas, and does not preclude any development that is consistent with municipal bylaws, regional and municipal plans, and with applicable state and federal regulations. 6. Comment: The Draft Basin 3 TBP clearly explains how undersized or poorly installed culverts can increase sediment loading, pose a risk to public health when they fail, cause erosion downstream of the structure, and act as a barrier to Aquatic Organism Passage (AOP). RRPC appreciates the bridge and culvert assessments and mapping and screening tools that ANR has developed to identify infrastructure in need of replacement or retrofit to restore AOP or address geomorphic issues. RRPC supports the plan’s suggestion to provide this information to towns as part of the road inventory and capital budget process, to assist in identifying grant funding to address the most significant AOP and geomorphically incompatible structures, and to match this potential funding with town priorities. Response: Duly noted and thank you. 7. Comment: RRPC commends the Draft Basin 3 TBP for its emphasis on restoring floodplain access and stream stability through active projects on river corridor easements on pp. 80-81. In many ways, this would be a much easier lift in our region than reaching consensus on river corridor regulations. However, this is not a suggested Implementation Action which we consider an oversight. Response: Duly noted and a new strategy #50 has been added to the Implementation table. 8. Comment: One of the more successful ANR funding sources to help towns meet the requirements of MRGP is the Grants in Aid Program which may be under-valued in the Basin 3 TBP. On pp. 64-65, the TBP states that "of the 42 towns in the basin, in State Fiscal Year (SFY) 2017, 14 enrolled in Grants-in-Aid and in SFY 2018, 21 enrolled in Grants-in-Aid to receive financial support for addressing hydrologically connected roads. As a result, the miles of state-funded municipal road drainage and erosion control improvements increased nearly seven-fold from SFY 2017 to 2018.” Please note that the Grants in Aid Program began in SFY18 and, in the RRPC region alone, 15 communities in SFY18 and 18 communities in SFY19 participated in Grants in Aid. These numbers likely need to be added to those already listed in the TBP and the text changed.
Response: The data presented in the plan were incomplete and incorrect and have been updated as of 11/21/2019. It now reads, “of the 42 towns in the basin, in State Fiscal Year (SFY) 2017, 24 enrolled in Grants-in-Aid and in SFY 2019, 30 enrolled in Grants-in-Aid to receive financial support for addressing hydrologically connected roads. As a result, the miles of state-funded municipal road drainage and erosion control improvements increased nearly 1.5-fold from SFY 2017 to SFY 2019.”

2019 OTTER CREEK TACTICAL BASIN PLAN pg. 164
9. Comment: The Draft Basin 3 TBP does not include a description of Clean Water Service Providers or the responsibilities of them as specified in Act 76. In addition, Clean Water Service Providers are not mentioned as partners in any of the implementation Actions on pp. 99-108. Response: Act 76 and this plan were being drafted and finalized at the same time and as such, a discussion of Clean Water Service Providers (CWSP) was not initially included in this plan. Please see DEC’s Act 76 webpage for more information about Clean Water Service Providers. As of the writing of the responsiveness summary, no CWSPs have been identified for Basin 3 and as a result, cannot be listed as “partners”. 10. Comment: RRPC recommends that another larger map be added to the Basin 3 TBP that clearly delineates municipal boundaries in HUC-12. The List of Figures at the beginning of the plan contains some errors on page numbers and is missing Figure 4. Response: Duly noted. The List of Figures has been updated and a new map was added to the plan.
11. Comment: RRPC suggests that Natural Resource Restoration-Lakes #38 on p. 105 include RRPC as one of the partners of providing outreach on the Lake Wise Program for Chipman Lake (Tinmouth Pond).
Response: Duly noted. RRPC has been added to the partner list. 12. Comment: This is a well-prepared and well-produced plan. Response: Thank you. Commenter: Rutland Regional Planning Commission – Clean Water Advisory Committee 13. Comment: Some small parts that lead up to big parts are missing resulting in some gaps in the plan. There is nothing about the state planning for more water quality testing or what to test for in the near or long term. The Rutland CWAC strongly believes that all waters should be considered and tested to ensure they all have positive conditions. That's because everything that feeds into Otter Creek and Lake Champlain can be a potential problem. There is a need to find out where the problems are in the watershed and to continue upstream to find all the sources of those problems. The TBP indicates there are 91 streams in the watershed and 86% of them have either no data or outdated data. This is even more reason for having a plan for testing so that the state has up to-date data to better identify high priority needs and projects in each town of the watershed. This planning should be included in the Implementation Table. Response: Future monitoring and assessment priorities are listed in Table 14 of this plan. There are several baseline monitoring initiatives currently underway in Basin 3 and Statewide. The DEC supports the Monitoring, Assessment and Planning Program of the Watershed Management Division (WSMD) to provide baseline monitoring (see the strategy here: https://dec.vermont.gov/sites/dec/files/documents/WSMD_MonitoringStrategy2015.pdf) as well as analyze data and support additional work by volunteer groups through the LaRosa Analytical Services Partnership Program. Where DEC is aware that BMPs may be installed, the LaRosa Program may support baseline monitoring before installation to measure benefits and effectiveness

2019 OTTER CREEK TACTICAL BASIN PLAN pg. 165
of BMPs. Please see response to #15 below. 14. Comment: In addition, there should be actual water quality testing for phosphorus and nitrogen, not just modeling. Testing and monitoring should go hand-in-hand so that it is consistent and periodically reviewed. Response: DEC agrees on the need for monitoring to ultimately determine the response of rivers and the Lake itself to water quality improvement efforts. The Lake Champlain Basin Program annually funds the Long-Term Water Quality and Biological Monitoring Program to identify water quality issues of concern and assess progress in reducing lake pollution. Program data are also used by the Lake Champlain Basin Program to produce State of the Lake Reports and technical reports on trends in lake phosphorus concentrations and tributary loadings. These analyses comprise Vermont’s official accounting of lake concentrations and tributary loads. The long-term Lake Champlain tributary water chemistry data can be found here: https://anrweb.vermont.gov/dec/_dec/LongTermMonitoringTributary.aspx. 15. Comment: The Rutland CWAC suggests there is a need to get local people and resources involved since the state doesn't have the employees to get this testing done. The state should work with towns to find good stewards who have the energy and passion to help do testing. It needs to provide local communities the information they need for testing. Most importantly, it should find a way to reimburse towns for the testing to ensure it is done uniformly across the watershed. Response: The Vermont Water Quality Monitoring Strategy outlines how Vermont’s water quality monitoring program is managed. DEC does not have the capacity and/or resources to conduct water quality monitoring on each and every waterbody on an annual basis. Monitoring on all rivers and streams is conducted by VANR aquatic biologists on a five-year rotational basis and as needed to monitor discharge permits (ABN). Targeted monitoring is underway through local partners (such as the Rutland NRCD) to help to more accurately identify the sources for elevated levels of nutrients, sediments, bacteria, and other contaminants. Where capacity exists to support the monitoring of Best Management Practices (BMPs), DEC supports conducting this monitoring through the LaRosa Volunteer Water Quality Monitoring Analytical Services Partnership (LaRosa Partnership Program)
DEC supports several water quality monitoring programs and projects that either collect data annually and/or take a rotational approach on several geographic scales, including:
• Ambient Biomonitoring Network – see the recently issued report:
A Probabilistic Assessment of Vermont’s Wadeable Streams (2013-2017)
• Water Quality Monitoring Data • Lake Monitoring Programs • Rivers & Stream Monitoring Programs • Wetland Monitoring Programs • Volunteer Monitoring • Special Studies
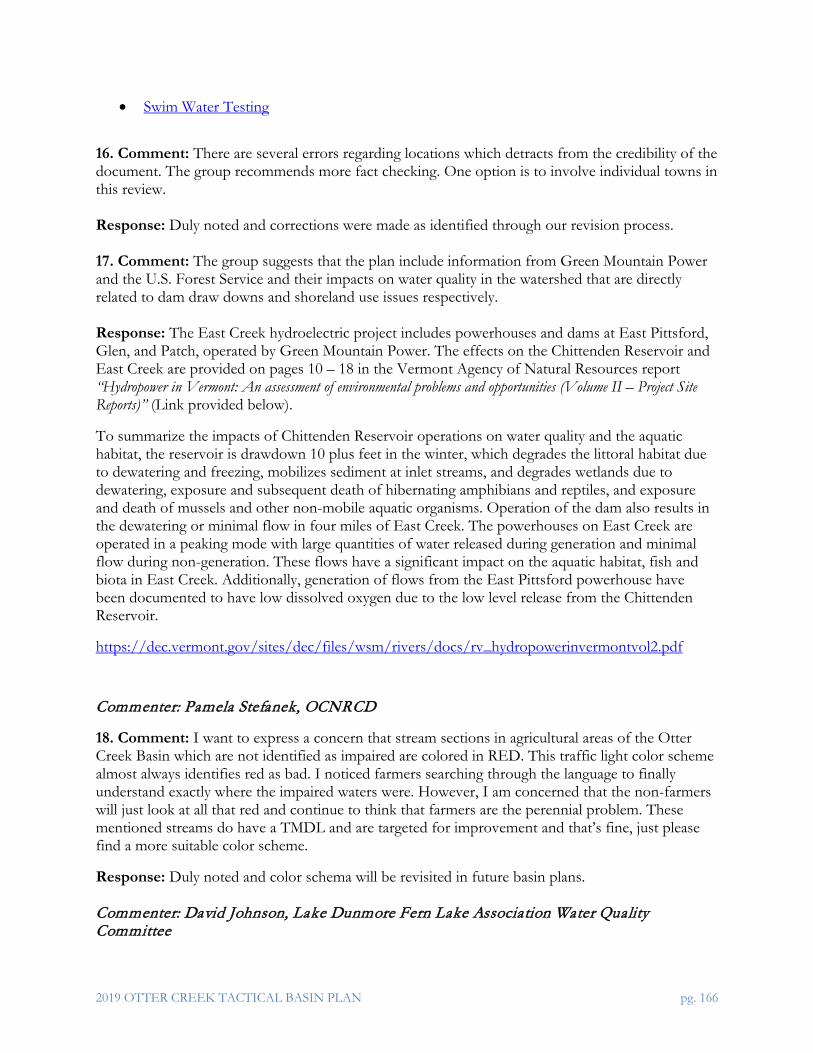
2019 OTTER CREEK TACTICAL BASIN PLAN pg. 166
• Swim Water Testing
16. Comment: There are several errors regarding locations which detracts from the credibility of the document. The group recommends more fact checking. One option is to involve individual towns in this review. Response: Duly noted and corrections were made as identified through our revision process. 17. Comment: The group suggests that the plan include information from Green Mountain Power and the U.S. Forest Service and their impacts on water quality in the watershed that are directly related to dam draw downs and shoreland use issues respectively. Response: The East Creek hydroelectric project includes powerhouses and dams at East Pittsford, Glen, and Patch, operated by Green Mountain Power. The effects on the Chittenden Reservoir and East Creek are provided on pages 10 – 18 in the Vermont Agency of Natural Resources report “Hydropower in Vermont: An assessment of environmental problems and opportunities (Volume II – Project Site Reports)” (Link provided below).
To summarize the impacts of Chittenden Reservoir operations on water quality and the aquatic habitat, the reservoir is drawdown 10 plus feet in the winter, which degrades the littoral habitat due to dewatering and freezing, mobilizes sediment at inlet streams, and degrades wetlands due to dewatering, exposure and subsequent death of hibernating amphibians and reptiles, and exposure and death of mussels and other non-mobile aquatic organisms. Operation of the dam also results in the dewatering or minimal flow in four miles of East Creek. The powerhouses on East Creek are operated in a peaking mode with large quantities of water released during generation and minimal flow during non-generation. These flows have a significant impact on the aquatic habitat, fish and biota in East Creek. Additionally, generation of flows from the East Pittsford powerhouse have been documented to have low dissolved oxygen due to the low level release from the Chittenden Reservoir.
https://dec.vermont.gov/sites/dec/files/wsm/rivers/docs/rv_hydropowerinvermontvol2.pdf
Commenter: Pamela Stefanek, OCNRCD
18. Comment: I want to express a concern that stream sections in agricultural areas of the Otter Creek Basin which are not identified as impaired are colored in RED. This traffic light color scheme almost always identifies red as bad. I noticed farmers searching through the language to finally understand exactly where the impaired waters were. However, I am concerned that the non-farmers will just look at all that red and continue to think that farmers are the perennial problem. These mentioned streams do have a TMDL and are targeted for improvement and that’s fine, just please find a more suitable color scheme.
Response: Duly noted and color schema will be revisited in future basin plans. Commenter: David Johnson, Lake Dunmore Fern Lake Association Water Quality Committee

2019 OTTER CREEK TACTICAL BASIN PLAN pg. 167
19. Comment: Lake Dunmore is mentioned as being stressed by a number of factors, including troubling trends in water quality, invasive species, lakeshore development, and by unnatural lake level variations. On reading this section, one is left feeling that the level variation is the major stressor affecting usage. As a resident on Lake Dunmore, this is not my perception. While the lake level is dropped in late October to minimize dock and shoreline ice damage, this level change is too late in the year and too small to be a "major" limitation on lake usage. Swimming, boating, and fishing are already nearly finished for the year.”
Response: To provide some background, lakes in Vermont are managed in accordance with the Vermont Water Quality Standards. The Standards are adopted in accordance the federal Clean Water Act passed in 1972. The Standards include requirements not only to protect human uses of the water bodies, such as swimming and boating, but to also to protect non-human uses, such as aquatic habitat and aquatic biota of water bodies.
The artificial lowering of water levels of lakes during the winter months has several negative impacts on a lake ecosystem and water quality. These included the following: degrading the littoral habitat due to dewatering and freezing, mobilization of sediment at inlet streams, degradation of wetlands due to dewatering, exposure and subsequent death of hibernating amphibians and reptiles, and exposure and death of mussels and other non-mobile aquatic organisms. Recent studies have shown that even drawdowns that are considered relatively small can have significant negative impact on littoral habitat of a lake.
While most lake residents may not see the impacts of the drawdown because of ice or less frequent use of the lake, drawdowns have been found to be a significant stressor in lake ecosystems.
20. Comment: However, another problem related to troubling trends in dissolved phosphorous is the presence of nuisance native aquatic plants in our shallow coves. Particularly in late summer, these weeds seriously impact dozens of homeowners who have difficulty navigating the waters with their motorboats. Certainly, the longer growing season and increasing temperatures are contributing as well as increased nutrient loading. I feel this usage limitation deserves more emphasis in the Tactical Basin Plan. I agree with you that Lake Wise best practices should be pursued more aggressively, perhaps also with more state support.
Response: Duly noted. The Lakes and Ponds Protection and Management Program attempts to balance the valuable interactions between aquatic native plants and their place within the ecosystem, with the social values and recreational opportunities popular within the lake community as well as the economic challenges and opportunities associated with supporting long-term lake management programs. The Aquatic Nuisance Control Permit that Lake Dunmore Fern Lake Association holds provides lake users with opportunities to identify and manage these areas of concern. Though limited, DEC provides support for aquatic nuisance control projects through its Aquatic Nuisance Control Grant in Aid Program, and Lakewise Projects through ERP funds.
Commenter: Addison County RPC
21. Comment: Pg. 1 Chapter 1 needs a location map. Location and relationship to other basins is needed for context.
Response: Duly noted and a new overview map was added to the plan.

2019 OTTER CREEK TACTICAL BASIN PLAN pg. 168
22. Comment: Please add Chapter heading to page numbers.
Response: This suggestion was considered, and it was determined that it would make the footer too long.
23. Comment: Pg. 6 No mentions of industry development strategy sectors.
Response: Please see the following text from pg. 6 wherein “developed land uses” is mentioned. “In Basin 3, both agricultural and developed land uses may experience more runoff thereby increasing non-point source pollution as flows carry eroded sediments, road sands, fertilizers, animal wastes, bacteria and nutrients from inundated septic systems, and other nutrient-rich materials into surface waters.”
24. Comment: Pg. 10, 11, 12, (Figures 5,6, and 7) colors in key should appear in same order as bar chart.
Response: Duly noted and we will consider revising this element in future plans.
25. Comment: Pg. 13 anti-degradation policy is mentioned, but it warrants a few more sentences on its role.
Response: A link to the antidegredation policy of the Vermont Water Quality Standards (VWQS) was added to the plan to redirect the reader to additional information. The degree of protection afforded to these uses is based on the water’s class as described in Appendix F. In addition, under the antidegradation policy, if the Agency of Natural Resources identifies in a waterbody, a use, the existing condition of which exceeds its classification criteria, then that use shall be protected to maintain that higher level of quality. The Agency may also identify existing uses of particular waters during the tactical basin planning process or on a case-by-case basis during application reviews for State or federal permits. Consistent with the federal Clean Water Act, the Vermont Water Quality Standards have always stipulated that existing uses may be documented in any surface water location where that use has occurred since November 28, 1975. Pursuant to the definition of the new Class B(1) in Act 79 of 2016, the Agency will identify an existing use at Class B(1) levels when that use is demonstrably and consistently attained.
26. Comment: Pg. 23 Key for river colors is confusing.
Response: Duly noted and we will consider revising this element in future plans.
27. Comment: Pg. 30 Basin TMDL pollutant table needs to be organized somehow – difficult to understand.
Response: Duly noted and we will consider revising this element in future plans.
28. Comment: Pg. 36 Table 3 - what is the difference between load and wasteload?
Response: The following text has been added to the plan. From EPAs website (https://www.epa.gov/tmdl/overview-total-maximum-daily-loads-tmdls)
“Pollutant sources are characterized as either point sources that receive a wasteload allocation (WLA), or nonpoint sources that receive a load allocation (LA). For purposes of assigning WLAs, point sources include all sources subject to regulation under the National Pollutant Discharge
2019 OTTER CREEK TACTICAL BASIN PLAN pg. 169
Elimination System (NPDES) program, e.g. wastewater treatment facilities, some stormwater discharges and concentrated animal feeding operations (CAFOs). For purposes of assigning LAs, nonpoint sources include all remaining sources of the pollutant as well as natural background sources.”
29. Comment: Pg. 37 - bottom of top para - ‘However, there is no specific prescription as to where BMPs should be applied. It is through tactical basin planning that local opportunities for BMPs can be identified and prioritized for implementation.’ This is a perfect place to enter some text supporting the subwatershed sampling and subsequent hotspot analysis done by ACRWC.
Response: Given the current plan layout, we describe the important role of partner organizations in Ch. 4 and Ch. 5.
30. Comment: Please ADD - The work of local watershed groups like the Addison County River watch Collaborative that undertake water quality sampling is vital to identify the sub-watersheds that have high levels of P loading and focus on BMP implementation with success.
Response: Given the current plan layout, we describe the important role of partner organizations in Ch. 4 and Ch. 5. For example, please find the following text in Ch.4 pg. 52.
“In order to coordinate agricultural water quality improvement efforts identified through the basin planning process, several pre-existing watershed and farm-focused organizations have been actively engaging their communities for several years. These include: VAAFM, UVM Extension, NRCS, the ACRWC, Lewis Creek Association, the Champlain Valley Farmer Coalition, NRCDs, and RPCs. Public forums were held in Basin 3 over several years of this planning process. Sustaining and coordinating with these groups is an important strategy in this plan to effectively target agricultural BMP implementation to improve water quality.”
31. Comment: Pg. 41 - Table 4 - Road sector focus area - add Lincoln and Goshen
Response: The towns listed in the table 4 are the watersheds with the highest #s of very high priority road segments (see Figure 32). This is not an exhaustive list and your addition is duly noted.
32. Comment: Pg. 46 Figure 24. One bar is for Farm size and the next is for land cover. But it says ‘# of Farms’ on the top bar and it doesn’t say ‘Landcover acres’ on the second bar. It takes some studying to figure out what is being shown.
Response: Duly noted and we will consider revising this element in future plans.
33. Comment: Pg. 47 Lots of acronyms here and everywhere. For first mention on each page use full name/title then switch to acronyms.
Response: Duly noted and in the interest of brevity, the decision was made to only use full names for the first mention in the document and acronyms thereafter.
34. Comment: Pg. 55- 3 - acre impervious sites could be updated with DEC estimates.
Response: Duly noted and we will consider revising this element in future plans.
35. Comment: Pg. 58/59 Describes Bristol Storm Water plan projects. Listed are the P reductions estimated. However, this is no unit of time only amount of P reduced. Example: “Total phosphorus

2019 OTTER CREEK TACTICAL BASIN PLAN pg. 170
removal for School 1 is estimated to be 95.5 lbs. and School 2 is 7 lbs.” Please add that these are annual loading and removal estimates.
Response: Duly noted and the suggested additions have been made to the plan.
36. Comment: Pg. 60 - 4th bullet - Is Middlebury not included for a reason?
Response: No, Middlebury has been added to the list.
37. Comment: Pg. 63 add Whiting to Planned 2020 column in REI table – move Waltham to Planned 2019
Response: The information was added to the plan as suggested.
38. Comment: Pg. 91 All towns except Rutland City have adopted the Town Road and Bridge Standards and most (81%) have adopted a Local Hazard Mitigation Plan (Figure 39) Change to Figure 38.
Response: The change was made as suggested.
39. Comment: Pg. 41 - Table 4 - Lakeshore sector focus area - add Lake Dunmore
Response: The information was added to the plan as suggested.
40. Comment: Pg. 110 – Monitoring Priorities - The Addison County River Watch Collaborative and Rutland NRCD should be mentioned by name here and highlighted for the volunteer efforts they contribute.
Response: The changes were made as suggested.
41. Comment: Lake Winona’s name has been changed officially back to Bristol Pond and Cedar Lake is Monkton Pond – pls confirm with the State Board of Libraries.
Response: The information was added to the plan as follows “Cedar Lake (Monkton Pond)” and “Winona Lake (Bristol Pond):”
42. Comment: Discussion needed on both acid and mercury since they are mentioned in report and listed in the TMDL table.
Response: We have approved TMDLs for acid and mercury impaired surface waters and implementation plans in place. A concise description of mercury and acidity pollutants may be found at this link: https://dec.vermont.gov/sites/dec/files/documents/wsmd_swms_Appendix_B_Pollutants.pdf.
Additional information about Vermont’s approach to addressing mercury and acidity in surface waters is found in the Surface Water Management Strategy, https://dec.vermont.gov/sites/dec/files/documents/wsmd_swms_StressorPlan_Toxics.pdf, and https://dec.vermont.gov/sites/dec/files/documents/wsmd_swms_StressorPlan_Acidity.pdf.
The Statewide TMDL for Mercury, and TMDLs for Acid Lakes may be found here: https://dec.vermont.gov/watershed/map/tmdl.

2019 OTTER CREEK TACTICAL BASIN PLAN pg. 171
Vermont’s regulatory programs addressing mercury are here: https://dec.vermont.gov/waste-management/solid/product-stewardship/mercury.
43. Comment: Pg. 100 Implementation Table – Tile drains are suggested as a strategy in 8,9 but there is no discussion in text. What is the effect tile drainable has on streambank erosion? Does it increase the rate and volume of runoff, in which case the stream would enlarge to accommodate it?
Response: The word tile drain was removed from Strategy 8. Tile drains are addressed under the RAPs and as such, will remain in Strategy 9. To the questions posed above, in 2016, Stone Environmental conducted a literature review on Subsurface Tile Drain Analysis. This was used to inform the joint ANR and AAFM Vermont Subsurface Tile Drainage Report that was submitted to the Vermont Legislature in 2017 (https://agriculture.vermont.gov/sites/agriculture/files/documents/Water_Quality/Vermont-Subsurface-Agricultural-Tile-Drain-Report-01312017.pdf). According to the report, “the use of tile drains also significantly alters the hydrology of the landscape. Increased hydrologic flow patterns that allow water to more quickly leave the field increase the total quantity of the water in a river system and also changes the velocity of flow, which can contribute to erosion and channel destabilization. Streambank erosion, with phosphorus-laden soil particles, is estimated to contribute as much as 22% of the phosphorus in Lake Champlain. The use of tile drains increases total water output from a field as much as two times and can be the primary source of stream flow in smaller watershed drainages. (LCBP Literature Review, p. 5). Tiles can also reduce surface runoff, which contributes to phosphorus impacts to water, especially during peak flows, by increasing capacity for infiltration into the soil. Many factors influence these hydrologic impacts, including soil types, cropping, tillage and drainage system design. Soils with higher permeability have increased tile drain flows, and some research indicates that no-till cropping can also result in higher tile drain output due to the prevalence of undisturbed preferential pathways in the soil.”
44. Comment: Pg. 105 Implementation Table – Please add ‘ACRPC’ to strategy 38, 39, 40 and 41 to assist towns with the priority lakes and others.
Response: ACRPC was added to the Strategies 38, 39, 40, and 41 in the Ch. 5 Implementation table.
Commenter: Matthew Witten, Managing Director, Addison County River Watch Collaborative
45. Comment: Strategy #1: yes, this would be the Ag partner meeting(s).
Response: Duly noted.
46. Comment: Strategy #2: our "hosting" this type of workshop will be limited to our volunteer training in which we will have a session on RAPs
Response: Duly noted and the basin planner will coordinate with the ACRWC on these efforts.
47. Comment: Strategy #14: We can facilitate this process, but we need to be careful about committing to "complete water quality monitoring on/near farms" for evaluating effectiveness of BMPs. For a variety of reasons, we are more focused on assessing subwatersheds for their respective contributions to pollution levels; we may not have the resources to bracket specific BMPs.

2019 OTTER CREEK TACTICAL BASIN PLAN pg. 172
Response: Duly noted.
48. Comment: Strategy #18: This is generally a good idea for us but again, we need to be careful here: The ACRWC technical staff has indeed given presentations where certain improved practices appeared to result in improved water quality downstream. However, correlation may not indicate causation.
Response: Duly noted.
49. Comment: Strategy #49: Because you mention "known water quality issues," it's probably a good idea to have ACRWC at the table for this strategy, at least in an advisory role.
Response: Duly noted and the ACRWC was added to Strategy 49.
50. Comment: Strategy #51: looks good. Funding is for sure a big issue for this particular item, and there is no assurance that our LPP grant will allow us to follow through with E.coli tests. We may need to go to a private lab or fund from another source. The most obvious source at this time is the pool of municipal money (~ $5K) that we get from 10 Addison County towns, but no decision has been made.
Response: Duly noted. In addition to ACRWC monitoring, the town health officer may be able to assist with E. coli monitoring of local swimming areas. To this end, municipalities were added as a partner to this strategy.
Comments on the monitoring and assessment table: 51. Comment: "no data" does not seem to be an assessment goal. Should this read "begin data collection" or "establish baseline"? Or “use support”? Response: The column title was changed to “Assessment Status”. 52. Comment: For some reason, starting around #75, there are very complete “monitoring actions” given for these river reaches – I am sure there is just as much to say about the previous reaches. Not sure why these have not been fleshed out. Response: Duly noted. Multiple data streams are used to populate the table and as a result, the resolution of the information may differ. The planner has added text to the “Assessment Status”.
53. Comment: #50, #51, #52 (and possibly #53 as well as upper branches of the Middlebury R.): at least on one of these branches reclassification is an important goal; "update data" might also be a goal; it might be good to list the branch or two that are possible candidates for reclassification as "high" priority due to the possibility of further protecting these fairly pristine waters.
Response: Duly noted.
54. Comment: #54 (Halnon): “update data” as both BASS and ACRWC have monitored above and below the hatchery. ACRWC should be listed as a partner. I would say this is “high” priority because very high levels of P and E. coli were detected in our samples about 4-5 years ago.

2019 OTTER CREEK TACTICAL BASIN PLAN pg. 173
Response: Duly noted. Halnon Trib. 10 (#88) needs updated data and is listed as high priority as it is adjacent to the hatchery and hasn’t been sampled since 2012.
55. Comment: #61 (Furnace); there may also be some issues with rip-rap that need to be monitored. Possibly moderate to high priority stream.
Response: Duly noted.
56. Comment: #58 (Lewis): Update data also a goal. ACRWC and LCA are partners.
Response: This is a reference site update for BASS.
57. Multiple Comments: #59 (Hogback): assuming this is a trib to LCR, ACRWC and LCA should be listed as partners.
#68, #69: assuming these are tribs to LCR, ACRWC and LCA should be listed as partners.
#70 (NHR trib #27): not sure what trib this refers to, but ACRWC should probably be listed as a partner.
#71 (upper LCR): update data as goal? List ACRWC.
#76, #77 (NHR & MIR): please list ACRWC as partner
#87 (LFR): please list ACRWC as partner
#88 (upper MIR): please list ACRWC as partner
#90 (OTR reach): please list ACRWC as partner
#91 (Halnon trib 10): not sure what trib this refers to, but ACRWC should probably be listed as a partner.
Response: Revisions were made accordingly. Many of these are sites monitored by DEC for specific water quality issues, e.g., ALS or reclassification, and would not require partner support.
58. Multiple Comments on the Appendix A, Implementation Table 5: #26: please list ACRWC as partner #44: please list ACRWC as partner #45, 46: good – thanks!
Response: The changes were made as suggested.
Commenter: Alan Shelvey, RNRCD
59. Comment: The amount of work that went into that plan is very evident. It covers a lot of ground and is a very good reference document as well as being the plan itself.

2019 OTTER CREEK TACTICAL BASIN PLAN pg. 174
Response: Thank you.
60. Comment: (Pg11) Chapter 1 [C] “Vermont Assessment Approach.” Comment: Consideration of installing permanent (seasonal) automated sampling devices, as used in some other states should be discussed.
Response: Duly noted. While the DEC recognizes that automated water quality samplers are valuable scientific tools, the costs associated with their purchase, maintenance, and sample processing is prohibitive for widespread deployment. In partnership with the Lake Champlain Basin Program and UVM, DEC supports automated monitoring installations where strategically warranted.
61. Comment: Chapter 1 “Conditions of Wetlands” “In recent years, residential, commercial, and industrial development have been the primary causes of wetland loss.” Comment: There seems to be little of this in “recent years” with improved protections, aggressive enforcement and better awareness of wetlands. Perhaps the term should be “previous years”.
Response: Duly noted. The term “recent” in this case is used to differentiate between contemporary or modern events and historical ones. 62. Comment: (Pg37) Otter Creek Basin and the Lake Champlain TMDL” Comment: In the discussion of “The Lake Champlain Phosphorus TMDL” “However, the reduction of P in Lake Champlain could take decades ….” Comment: This is because of the legacy phosphorus contained in the runoff sediment that has built up in the rivers over the last 200 years and is slowly working its way to the lake. There should be a discussion of the option of actively removing that legacy phosphorus, as is being done successfully in other states. Response: Duly noted. We realize there are many sources of P to LC and we are implementing a watershed approach to address these.
63. Comment: (Pg63) “Municipal Roads General Permit” MRGP Standards. “MRGP standards include: road crowning, stabilizing drainage ditches and turnouts, and upgrading drainage culverts and intermittent stream culverts.” Comment: It is unfortunate that the underlying legislation requires that the State apply these standards also to long abandoned Class 4 highways that have, over many decades, naturally revegetated and stabilized. To comply with the law, a great deal of disturbance (and cost) will be required on Class 4 roads that have naturalized to a stable condition. DEC should ask the Legislature to correct this. Response: The MRGP standards included in the above comment only apply to Paved and Gravel Roads with Drainage Ditches Road Types (mostly Class 2 and Class 3 roads). There is only one MRGP standard for connected Class 4 roads- any gully erosion must be addressed. Gully erosion is defined as 1’ or deeper. The practices mentioned are not required for Class 4 roads, only spot fixes of the worst erosion, and therefore biggest water quality impacts. The second part of the comment addresses Class 4 roads that over decades that have naturally revegetated and stabilized. What the comment describes is unlikely used as a road, and perhaps in this scenario that abandoned Class 4 road should be re-classified as a legal trail, if the town decides this is what is best for that condition

2019 OTTER CREEK TACTICAL BASIN PLAN pg. 175
and use. This designation would better match the existing conditions and use on-site. Legal trails do not require any implementation of MRGP standards. 64. Comment: (Pg85) “Reducing Phosphorus from Unstable Stream Channels. Comment: While the usual suspects, stream straightening and development encroachment are cited, there is no discussion of natural conditions that result in phosphorus loading from erosion. In the higher and steeper stream sections where there is not and never was a floodplain, always, but most notably since Irene, there has been a significant amount of erosion. Many of Irene’s scars are simply too steep to restore through any natural process. In the flatter valleys along Otter Creek, trees falling into the river deflect the flow causing new erosion of phosphorus-rich soil that has been used for agriculture for well over a century. The loss of stream flow capacity due to historic sediment accumulation forces high flows to further erode the banks. This phosphorus laden sediment works its way unimpeded to Lake Champlain. These are existing conditions that will continue regardless of limitations of development in the river corridor and should be discussed. It is good policy to protect the corridor but it should not be presented as a solution to the problems mentioned above. Response: Tropical Storm Irene created widespread erosion in the system and contributed a significant amount of sediment that is working through the system. In general, higher gradient headwater streams tend to transport sediment and have smaller floodplain features. There are a number of mass failures in the headwaters, and significant bank erosion. While this may appear to be part of a natural process, some of these streams are limited in lateral migration due to roads and development, which can exacerbate erosion of steep banks. We have tried to stabilize these banks in multiple locations throughout the state. Most of these banks have subsequently failed and continue to erode. This type of bank stabilization is cost prohibitive and to date, we don’t have a good way to halt bank failure in the headwaters. For example, we worked with the RNRCD to stabilize an eroding bank on the Ira Brook and it continues to fail despite our best efforts. Over time these erosional scars will heal, usually through failing until they establish a stable angle of repose for the soil type. For steeper gradient streams, river corridor protection provides space to establish the boundary conditions necessary for the banks to stabilize. After Tropical Storm Irene, areas that saw the greatest increase in sediment are altered alluvial fans. These are areas where there is a transition from the steep mountains into the broad valley and the stream loses energy and drops its sediment load. If left alone these systems would deposit and braid as they plug with sediment. For example, the Cold River in North Clarendon is an alluvial fan that was reactivated during Tropical Storm Irene Irene. The stream aggraded and was heavily dredged, and has already filled back in. We can’t change the slope of the channel, only the grade controls in the system that set the grade (elevation) of the bed. We can dredge and create a hole, but with sediment moving through the system the hole fills right back in. Past experience has shown removal of sediment from our systems is cost prohibitive and short-lived, plus does harm to infrastructure and can destabilize our channels, ultimately increasing erosion of the stream bed and banks. A primary issue on the Otter Creek is that there is either no buffer, or one line of old growth trees. When a large tree falls in it can deflect the stream onto another bank and if there is no buffer, nothing remains to hold the banks together, so they erode. Landowners can contact the stream alteration engineers if they have concern about their property. Where a hearty buffer exists, the roots hold the banks together, fewer trees fall in, and when they do the banks have some structure from the remaining trees. Trees falling into the stream also provide a multitude of benefits. They stabilize

2019 OTTER CREEK TACTICAL BASIN PLAN pg. 176
the channel bed, store sediment, provide habitat and food for animals, and slow the water flow in the channel. There is a natural amount of sediment working through the system, which was exacerbated by a very large flood. The natural amount of sediment will work its way through the system and some of it will end up in our downstream waterways. By restoring floodplains and protecting river corridors we increase the amount of sediment that will be stored in the system and not end up in the lake. These restoration and protection practices also provide space for rivers and streams to work through the effects of past channel management and eventually return to a more stable, less erosive form. For additional information about river corridor protection, please see: https://dec.vermont.gov/sites/dec/files/wsm/rivers/docs/rv_CorridorProtectionasRestoration.pdf. 65. Comment: (Pg100) Basin 3 Implementation Table Summary Comment: Please add a column (or put at the end of the list of partners), “Default Lead” to enter the name of the entity that would be the presumed leader and organizer, subject to change at the consensus of the partners. This will show seriousness and expectations and fulfill this statement from page 42 “*Project leaders and partners are identified in Chapter 5”. As is well known – “That which is everyone’s responsibility is no one’s responsibility.” Response: Duly noted and we will consider revising this element in future plans.
66. Comment: (Pg103) Basin 3 Implementation Table Summary- Item 20 “Outreach to landowners that will come under the 3-acre stormwater permit.” Comment: Three communities are listed. The State’s 3-acre list includes 17 municipalities that are all or partially in Basin 3. Response: Duly noted and the priority area is listed as basin-wide, which agrees with your comment. The 3 towns listed are areas with the most 3-acre parcels in the basin.
Commenter: Marty Illick, Lewis Creek Association
67. Comment: Figure 19. Annual total P contributions to Lake Champlain from 1990: This figure is not readable. Response: Duly noted and we will consider revising this element in future plans. The link to the original source data/graph is included in the plan (Source: www.lcbp.org).
68. Comment: Figure 20. Modeled total P loading (%) to Lake Champlain by land use sector. We need to see LC and LOC broken out of "otter". Pls remark that LC is the 2019 LCBP/State of the Lake stream that is P trending upward.
Response: This figure is based on P modeling results produced by a consultant in 2016 in the development of the Lake Champlain TMDL, which are specific to the Otter Creek segment. There is no current plan to update the model, but rather use these results to guide restoration of (sub)watersheds. The tactical basin approach addresses pollution from land use sectors contributing to water quality issues (e.g., P loading) in watersheds throughout Basin 3 including Little Otter (LO)

2019 OTTER CREEK TACTICAL BASIN PLAN pg. 177
and Lewis Creek (LC). Downscaled estimates of source sector P contributions may be found in the Clean Water Roadmap.
69. Comment: State how we will assure projects will be completed if all are voluntary. What is the strategy to get willing landowners? Under what category is the budget for this? Response: The answers to these questions are tied to Act 76 and VANR is currently developing Act 76 guidance documents. New funding pathways for clean water projects are being finalized in four new grant categories as part of Act 76 promulgation. Additional information about Act 76, Clean Water Service Providers, and an overall timeline are available at: https://dec.vermont.gov/water-investment/statues-rules-policies/act-76. 70. Comment: 56. Reclassify Streams...........Lewis Creek etc. Response: DEC agrees and (we) have added a reclassification strategy in the Ch. 5 Implementation Table.
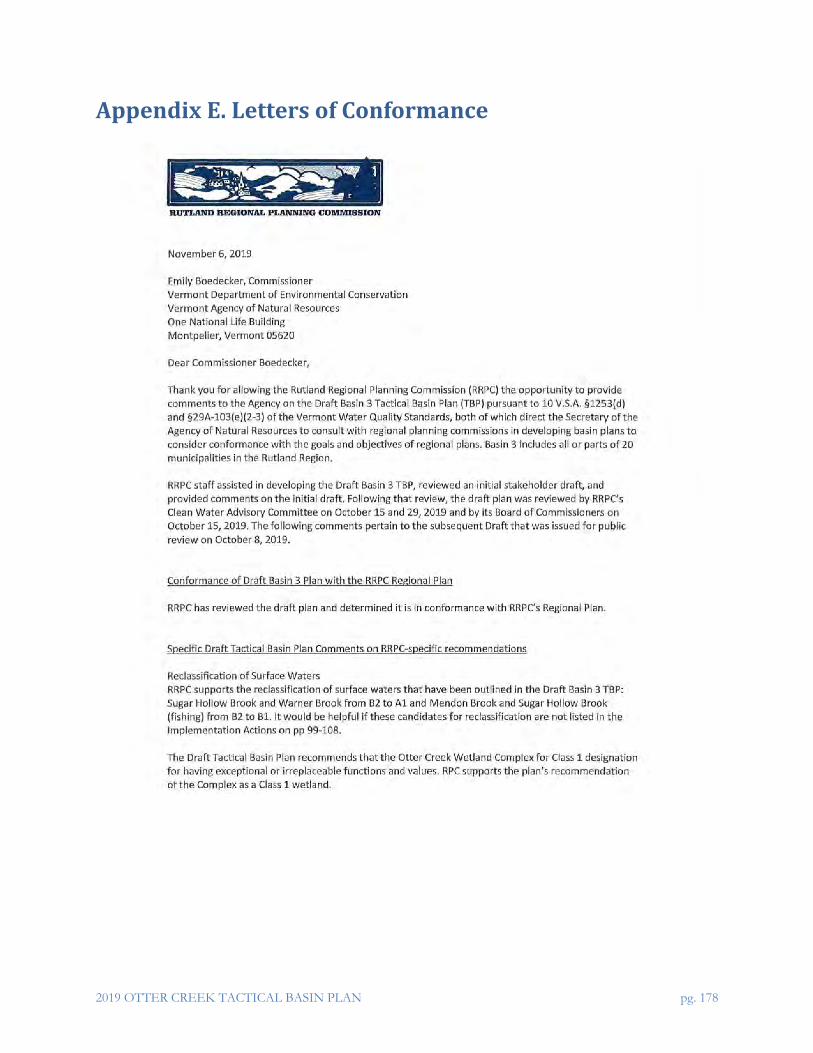
2019 OTTER CREEK TACTICAL BASIN PLAN pg. 178
Appendix E. Letters of Conformance

2019 OTTER CREEK TACTICAL BASIN PLAN pg. 179

2019 OTTER CREEK TACTICAL BASIN PLAN pg. 180

2019 OTTER CREEK TACTICAL BASIN PLAN pg. 181

2019 OTTER CREEK TACTICAL BASIN PLAN pg. 182
Otter Creek Tactical Basin Plan (2019) Statement of Compliance with
Addison County Regional Plan (2018)
The Vermont Department of Environmental Conservation as well as the Addison County Regional Planning Commission must comply with State requirements in the development of Tactical Basin and Regional Plans. The DEC, under Chapter 47 - Water Pollution Control § 1253 Classification of Waters Designated, Reclassification is tasked with the development of basin plans –
(d)(1) Through the process of basin planning, the Secretary shall determine what degree of water quality and classification should be obtained and maintained ….
The requirements of a basin plan are laid out as follows:
(d)2 In developing a basin plan under this subsection, the Secretary shall: (A) identify waters that should be reclassified outstanding resource waters or that should have one or more uses reclassified under section 1252 of this title; (B) identify wetlands that should be reclassified as Class I wetlands; (C) identify projects or activities within a basin that will result in the protection and enhancement of water quality; (D) ensure that municipal officials, citizens, watershed groups, and other interested groups and individuals are involved in the basin planning process; (E) ensure regional and local input in State water quality policy development and planning processes; (F) provide education to municipal officials and citizens regarding the basin planning process; (G) develop, in consultation with the regional planning commission, an analysis and formal recommendation on conformance with the goals and objectives of applicable regional plans; (H) provide for public notice of a draft basin plan; and (I) provide for the opportunity of public comment on a draft basin plan.
Similarly, Regional Plans must conform to the following:
- 24 V.S.A. §4302 “Vermont’s water quality should be maintained and improved according to the policies and actions developed in the basin plans established by the Secretary of Natural Resources under 10. V.S.A.§1253” and, - 24 V.S.A. §4348a(a)(6)(B) A statement of policies on the “protections and improvement of waters of the State to be used in the development and furtherance of the applicable basin plans established by the Secretary of Natural Resources under 10. V.S.A. §1253.”

2019 OTTER CREEK TACTICAL BASIN PLAN pg. 183
This establishes that there must be a coordinated effort to develop Tactical Basin Plans in conjunction with the water quality goals and strategies of Regional Plans developed by Regional Planning Commissions which share the same Basin Planning area. Additionally, as noted above, under(2)(G) The office of the [ANR] Secretary must in the creation of a basin plan… “develop in, consultation with the regional planning commission, an analysis and formal recommendation on conformance with the goals and objectives of applicable regional plans” This document recognizes where Otter Creek Tactical Basin Plan surface water management goals and implementation strategies conform with the surface water goals and objectives of the Addison County Regional Plan. The ACRPC Natural Resources Committee has reviewed the Otter Creek Tactical Basin Plan (Final Draft, Sept, 2019) and respectfully requests that the Addison County Regional Planning Commission find the Otter Creek Tactical Basin Plan in conformance with the Addison County Regional Plan (adopted Sept 18, 2018).

2019 OTTER CREEK TACTICAL BASIN PLAN pg. 184
Addison County Regional Plan Otter Creek Tactical Basin Plan 2019 Final Draft
Surface Water Goals and Objectives
A. Identify, protect, and enhance quality of our waters, significant wetlands, vernal pools, fens and bogs.
a. This Plan is a direct result of this goal
B. Support monitoring of surface water
a. Pg. 111 Monitoring Priorities b. Pg. 99 Implementation Table 13,
ACRWC support i. Implementation table
strategy: 1, 2, 14, 18, 51, report card action: 43, 44, 45, 46
C. Support LCBP’s efforts and DEC’s
basin planning efforts
a. This Plan is a direct result of this goal
D. Complete and maintain geomorphic assessments on all surface water where there is a reasonable likelihood of flooding.
a. Climate Change Implications Pg. 6 b. Condition of Wetlands Pg. 12 c. Floodplain Management Pg. 91
E. Restore and maintain stream equilibrium by developing and implementing river corridor plans
a. Tactical Basin Plan covers river corridor planning
i. Natural Resource Restoration—Rivers pg. 80-94
ii. Floodplain Management pg. 91
iii. Municipal Protections pg. 91-92
iv. Local Planning, goal development, and implementation pg. 94
v. Conservation easements pg. 96
vi. Implementation Table Natural Resource Restoration Strategies 44,45,49 Pg. 107
F. Reducing flooding and damages, through mitigation techniques.
a. Climate change implications of flooding pg.6

2019 OTTER CREEK TACTICAL BASIN PLAN pg. 185
b. Wetland mitigation pg. 12 c. Dam modification and removal Pg. 89 d. Municipal Planning moderates
flooding pg. 92 e. “The VDEC has a goal of managing
rivers to protect and restore their equilibrium condition. Stream equilibrium is essential for good water quality, healthy aquatic habitat, and flood resilience in the basin and will help to mitigate impacts of increased runoff and streamflow described in the Climate Change section. The degraded geomorphic condition of some of the basin’s streams has the following consequences: public safety (e.g., loss of floodplains that store floodwaters, accelerated streambank erosion leading to infrastructure damage, and channel straightening that increases flow velocity during rain events),” pg.80
f. Flood Plain Management pg. 91 g. Municipal Protections—Zoning and
Town Plans pg. 91 G. Encourage Watershed based
cooperation educate towns and public about water quality and stream dynamics.
a. Implementation Table Developed Lands Strategies 19 – 29 Pg. 102
b. Implementation Table Natural Resource Protection Strategies 33 – 55 Pg. 104
H. Identify and work to improve proposed and existing land use activities that have a reasonable potential to threaten surface waters through pollution, depletion, or other means of degradation.
a. Priority Areas for Restoration i. “By analyzing the priority
waters list and areas identified as sources in TMDL’s, the following focus areas have been identified for water quality restoration by land use sector, i.e., Agriculture, Developed Lands—Stormwater, Developed Lands--Roads, Wastewater, and Natural Resources” pg. 39

2019 OTTER CREEK TACTICAL BASIN PLAN pg. 186
ii. Chapter 4- Strategies to Address Pollution by Source Sector Pg. 41
1. Agriculture, Developed Lands- Stormwater, Developed Lands- Roads, Wastewater, Natural Resource Restoration.
I. Acknowledge and address
interrelationships between various water resources in planning process.
a. Coordination of Basin 3 Partners Pg. 109
J. Maintain diverse areas of vegetation along surface waters sufficient to protect stream and functional habitat of waterbody.
a. Buffers for Ag Pg. 44 b. Natural Restoration of Rivers pg. 80 c. Implementation Table Buffer
strategies: 11, 16, 19, 24, 27, 28 34, 39
d. Buffer projects present in ongoing activities in report card.
K. Protect watersheds from detrimental effects of invasive species
a. Natural Resource Restoration- Forests pg. 74
b. Natural Resource Restoration- Lakes, Aquatic Invasive Species pg. 79
c. Four Actions in report card address invasive species: 35, 36, 37, 41
d. Conditions of Lakes and Ponds: pg. 9
L. Encourage conservation of water resources
a. Chapter 2 Priority Areas for Surface Water Protection pg 13-21
b. Conservation is mentioned as a strategy in the Chapter 4 focus areas of Stormwater and River Connectivity under Local planning, goal development, and implementation sections. Pg. 56-60
M. Encourage practices that reduce or eliminate the release of effluent which negatively affect surface waters.
a. Chapter 4 –Strategies to Address Pollution by Source Sector - Wastewater pg. 69 – 73

2019 OTTER CREEK TACTICAL BASIN PLAN pg. 187
b. Implementable Table – Wastewater 32 pg. 106
N. Encourage development of wastewater treatment technologies that will help protect and improve quality of surface waters.
a. Chapter 4 –Strategies to Address Pollution by Source Sector - Wastewater pg. 69 – 73
b. Implementable Table – Wastewater 32 pg. 106
O. Support research and development of local, small scale hydro-power facilities that maintain adequate surface flow and do not compromise surface water quality or habitat.
a. Dams of Basin 3 Pg. 89 b. Plan seems to address negative
aspects of hydro power/dams - no mention of small-scale hydro