Embed Size (px)
Citation preview
BASICS OF VIBRATION MONITORING FOR FAULT DETECTION ANDPROCESS CONTROL
Wilfried Reimche, Ulrich Südmersen, Oliver Pietsch, Christian Scheer, Fiedrich-Wilhelm BachUniversity of Hannover, Institute of Materials Science, Department of NDT, Lise-Meitner-Str.1, D-30823 Garbsen, [email protected] Abstract. Recent years have seen the rise of vibration problems associated with structures, which are more delicate and intricate,machines, which are faster and more complex, and production processes, which are automated and interlinked. The occurred problemsare direct related with demands of lower investment, running and maintenance costs in coincidence with the requirements of increasedproductivity and efficiency. Consequently, there has been the necessity for a better understanding of vibration causes and the dynamicresponse of complex machinery as well as single components. Shown are basics of comprehensive vibration analysis based on an aimedinstrumentation of the unit to be supervised and the state of art in monitoring using statistical time values for general signal descriptionand threshold comparison, envelope analysis and spectrum, phase and correlation analysis of multi sensor arrangements. Hints are alsogiven to data reduction using cepstral and hocerence analysis in combination with the extraction of machine or fault specificcharacteristical patterns as input values of vector or neural classification.
Keywords. signal processing, vibration analysis, vector analysis, condition monitoring
1. Introduction
The use of vibration analysis as one of the fundamental tools for condition monitoring has been developed extensivelyover a period of approximately 35 years. With the parallel developments in electronic equipment, transducers, computersand software nowadays machine supervision is almost completely automated. From 1960 to the mid 1970s simple practicalmethods were used, along with careful watch on the machine’s behavior, often reinforced by frequent maintenance.Elementary instruments were sometimes used to measure and record the values on which failure detection and concludedmaintenance decisions were based. This required highly skilled and experienced maintenance staff to ensure efficientoperation and to avoid catastrophic failures.
During the 1970s there were basic developments in analogue instrumentation and mainframe computers. Severalaccelerometers, velocity transducers and displacement pickups were developed and adapted to the requirement of industrialapplications. Standards and guidelines give information about their use and present a first knowledge base for failuredescription and determination. Analogue instrumentation became popular in form of portable vibration measuring andrecording meter, FM tape recorders and frequency analyzers. Many of these equipments were heavy and cumbersome butthey did prove increased accuracy in recording and analysis. If a company had access to a mainframe computer, data wouldbe kept in store so that first maintenance strategies could be developed, still limited due to the amount of available measure-ment and analysis channels respectively the data store media.
Although some digital instruments were available during the early 1970s, significant developments took place duringthe late 1970s and the early 1980s due to the availability of new microprocessors. Circuits could be miniaturized, reducingthe dimensions and weight of instruments and allowed data to be handled at high speeds. Onboard microprocessors gaveinstruments the ability to capture data, analyze it via suitable algorithms, then store and display the information. A verysignificant feature of frequency analysis was efficient computation of the FFT (Fast-Fourier-Transformation) of multichannel measurements within seconds respectively minutes and the ability to store data for further decisions. Long-termdata storage became an accepted practice.
From the mid 1980s onwards the developments have been associated with the desktop computer, its interfacedequipment and software. Many manufacturers have produced hand-held instruments for the instant measurement, recordingand analysis of variables. Information is often directly available from the measurement instrument on a machine component(e.g. standard deviation, Smax). This makes it easier to decide upon maintenance strategies, therefore, the decision makerrequires a lower level of skill. Indeed some companies have developed suites of software, which allow the whole processand the actual machine condition to be monitored automatically, giving a complete service for measurement, analysis andproblem diagnosis followed by action or maintenance strategies.
The 1990s are characterized by minimizing the instrumentation and the data acquisitions and data process units. Theinstrumentation is simpler to operate, and problems can be analyzed with aid of knowledge-based systems. Sensor systemsare combined with electronic data pre-processing and multi-sensor arrangement allow not only to emphasize on singlemachine components, the whole plant with the interactions and dependencies of all processes becomes transparent. At themid of the 1990s the remote monitoring was initiated with central control units to interlink the knowledge and experiencesof customers, the machine manufacturer and liability insurance companies. In contrast, early condition monitoring systemsrelied on a few experts having specialist knowledge of the instrumentation and analysis techniques.
While vibration analysis was used former mainly to determine faults and critical operation conditions. Nowadays thedemands for condition monitoring and vibration analysis are no more limited trying to minimize the consequences ofmachine failures, but to utilize existing resources more effectively. Some factors which have increased these demandsinclude:
02 a 06 de Junho de 2003 / June 2 to 6 2003Rio de Janeiro - RJ - Brasil
* increased quality expectations reflected in product liability legislation,* increased automatization to improve profitability and maintain competitiveness, * increased safety and reliability expectations reinforced by legislation,* increased cost of maintenance and production due to labor and material cost, and* increased market pressure due to globalization of markets.
Actually developments still deal with minimization of measurement equipment and analysis techniques implementingworldwide standards for data processing and acquisition, with the possibility of central data acquisition. The supply of morecost-effective monitoring tools has been made possible by technical advances such as:
* reduced costs of instrumentation,* increased capability of instrumentation such as data pre-acquisition, data storage, radio transmission direct by
the sensors with integrated electronical circuits, * improved data storage media in combination with low cost computation, and* faster and more effective data analysis using specialist software tools.
The exponential increase of computer capacities, calculation speed and the telecommunication allow new analysistechniques to be implemented in modern process monitoring systems like fuzzy logics and neural networks as tools forautomatical system control and signal classification. The ultimate form of this approach is an expert system, which eventu-ally may lead to a fully automated condition monitoring system including additional rest life estimations and affirmationreferring to the product quality. Nowadays modern vibration monitoring systems often suggest the possibility offaultlessness. As results often failures and alarms occur without giving hints to the original excitation sources.
Therefore this paper describes the practical aspect of vibration phenomena and the measurement requirements of ageneral monitoring system consisting of data collection with data reports in digital manner, followed by the acquisitionphase calculating the statistical values and functions in time and frequency domain with integrated data reduction by faultand operational pattern. The more difficult third phase of automatical fault diagnosis is still under development. Newtechniques like wavelet analysis and neural networks are examined and actually tested.
Shown are basics of comprehensive vibration analysis based on an aimed instrumentation of the unit to be supervisedand the state of art in monitoring using statistical time values for general signal description and threshold comparison,envelope analysis and spectrum, phase and correlation analysis of multi sensor arrangements. Hints are also given to datareduction using cepstral and hocerence analysis in combination with the extraction of machine or fault specific characteristi-cal patterns as input values of vector or neural classification.
In cases of transient vibration signals, e.g. forging, oscillating processes, etc., the traditional methods of data acquisitionand processing at rotating machines or stationary processes have to be adapted using certain signal trigger or sampletechniques as well as special evaluation routines (e.g. the data acquisition system has to be transformed from an “amplitude-time or rotation description” to an “amplitude-distance” or “amplitude-event-description”.
2. Excitation sources and sensors
The aim of all plant operation and monitoring systems should be the threshold of 100% machine’s availability duringoperational time by reliable systems and fast reaction fault management. The mission should be the development ofintegrated strategies, methods and tools of planning and operating production systems by the vision of guaranteed availabil-ity and quality.
The state of art of investigations for early failure detection emphasizes mainly on single system components ofproduction machines, e.g. rolling element bearings, meshing gears, using vibration and acceleration analysis techniques.Actually extensive research work is done on the field of diagnostics of process data and machine control. Using this basicknowledge, actually, the global consideration of process lines has to be looked at, leading to new ways in the field oftransient vibration signal analysis.
The knowledge of the machine’s vibrational signatures and their time dependent behavior are the basics of efficientcondition monitoring. A complex production line consists generally as shown in figure (1) of several driving units (e.g. elec-trical or hydraulic motor, turbine), a transmission unit (e.g. gearbox, coupling), and a processing machine (e.g. generator,compressor, pump, tool, press). Vibrations of machines are the results of the dynamic forces, due to moving parts and struc-tures (e.g. foundation), which are interlinked to the machine and its mechanical properties. Different machine parts willvibrate with various frequencies and amplitudes.
All these components generate specific vibration signatures, which are transmitted and reflected in the machine’sstructure. Machine condition, machine faults and on-going damage can be identified in operating machines by fault symp-toms, e.g. mechanical vibration, air borne noise, and changes in the process parameters like temperatures and efficiency.
In order to optimize fault specific thresholds and determine diagnostic patterns in vibration and acceleration signalsat rotating machines, failure simulations at different test benches are performed, e.g. rubbing simulation in turbo machines,investigation of rolling element and journal bearings, centrifugal pump and turbine supervision, as well as cavitationmonitoring. The obtained signatures serve as a base to determine fault and operation specific signatures of rotating machinesin power plants as steam turbines, boiler feeder pumps, mill fans, steam valves, etc., as well as in industrial application of
quality control systems and production lines. To close the loop of investigation finite element calculations are applied toestimate the vibrational behavior of structure elements or prove excitation sources by fluid flow simulation.
Figure 1. Vibration excitation sources in general and measurement devices
To the fulfillment of the demands on comprehensive vibration analysis, an aimed instrumentation of the unit to besupervised is required whereby displacement, velocity and acceleration pick-ups are used. Mathematically these basicdescriptive values can be transformed one to the other by integration respectively by differentiation. Practically the choiceof sensors depends on the excitations to be determined. Accelerometers show a constant amplitude behavior over a widefrequency range, therefore they can be used to detect low as well as high frequent signal intensities, while velocitytransducers show a 1/f (f = excitation frequency) proportional amplitude damping and displacement pick-ups even dampthe amplitudes by 1/f². Looking at the balance condition of rotors this effect is favorable due to the automatical reductionof high frequent signal amplitudes due to friction, gearing, etc. which superimpose the lower frequent rotational speedcomponent. In case of rolling element bearing defects, which mainly excite high frequent pulses due to the interaction ofrolling elements and raceways, accelerometers fit best.
Summarized the sensor choice largely depends on the frequencies to be analyzed, where acceleration in general coversfrequencies from 0 to 20 kHz, velocity from 2 Hz to 2kHz, and displacement the range from 0 to 300 Hz. Many techniquesexist, which can be used either singly or in combination to identify vibration patterns. Components typically monitored aregears, bearings, couplings, rotors, fans, pumps, turbines, etc. to determine and distinguish several failure causes likeimbalance, looseness, misalignment, wear, poor lubrication, general damage, aero/hydrodynamic forces, cavitation, etc.Finally, the response of the vibration monitoring system to the onset of failures and unfortunate operation conditionsdepends basically on the used instrumentation. The faster the response is required, the more likely a hard-wired system issuggested rather than portable data collectors. Where the consequence of failures is higher, the easier it is to justify thecosts, e.g. a big steam turbine normally is monitored permanently while the auxiliary equipment (e.g. vacuum pumps) maybe inspected by portable units.
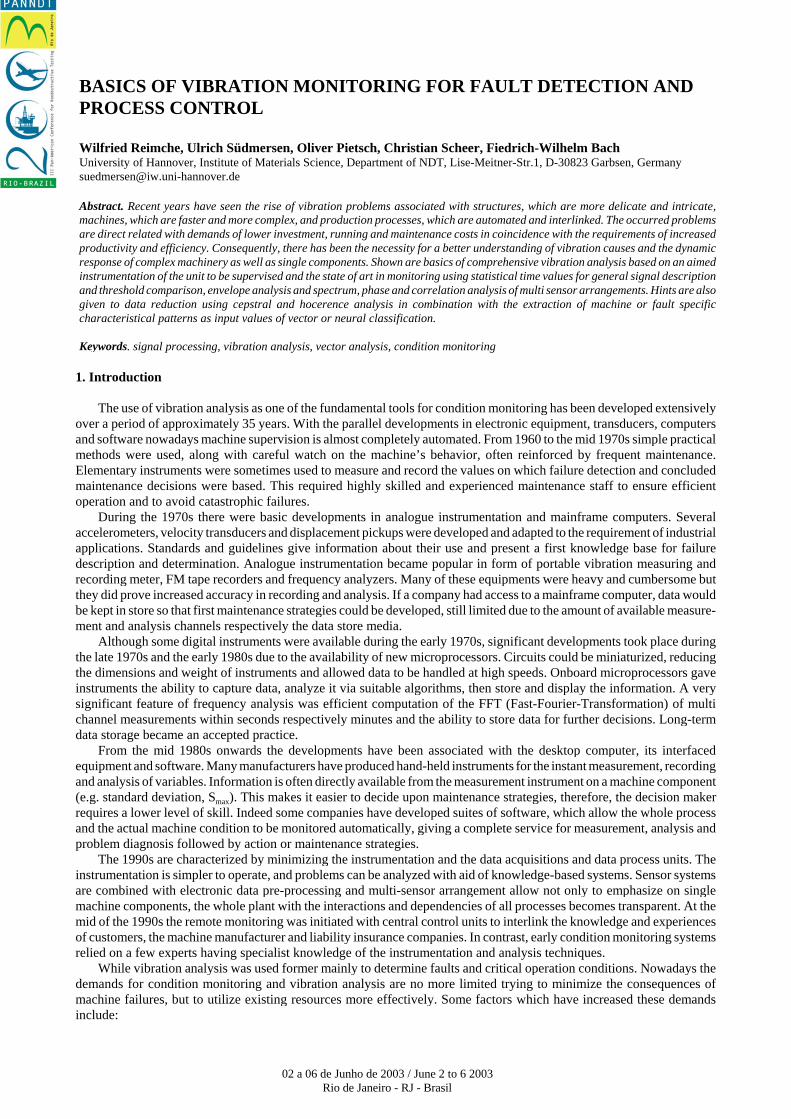
Figure 2. Vibration instrumentation at a steam turbine Dependent on the machine or the single component to be monitored a wide spread of sensor and system applications
are available form handheld meters of one or two channels with direct data evaluation to complex multi channel supervisionwith direct link to the main host process monitoring like one example is shown in Figure (2) by the vibration instrumenta-tion of a 920 MW steam turbine consisting of eddy-probes to determine the relative rotor displacement and expansion,
velocity transducers to monitor the bearing block vibration, and optional accelerometers to measure high frequent excita-tions during rubbing events. In this case additional accelerometers and displacement pick-ups inside the combined ra-dial/axial bearing between HP-IP-parts should help to solve and prove thermal and expansion related alignment problems.
Independent on how sophisticated the equipment may be, the quality of the measurements and their interpretation areuntil now still dependent on the ingenuity of the operator, whereby the data acquisition of vibration signals is consideredin the four sections of:
* basic electrical and electronical principles,* signal types, interference and transmission,* elementary amplifiers and filter design, and* vibration signal acquisition and processing on which this article emphasizes on.
3. Data acquisition and data processing
State of technology in vibration monitoring of rotating machines is related to the calculation of standard deviationand/or maximum values, their comparison with thresholds and their trend behavior to determine increased wear or changesin the operation conditions. Spectrum analysis with special phase constant averaging routines allows to determine machinespecific signatures by magnitude and phase relation. By correlation analysis common information of different vibration sig-nals is evaluated for source localization, and cepstrum analysis is used to quantify periodical information of spectral data.
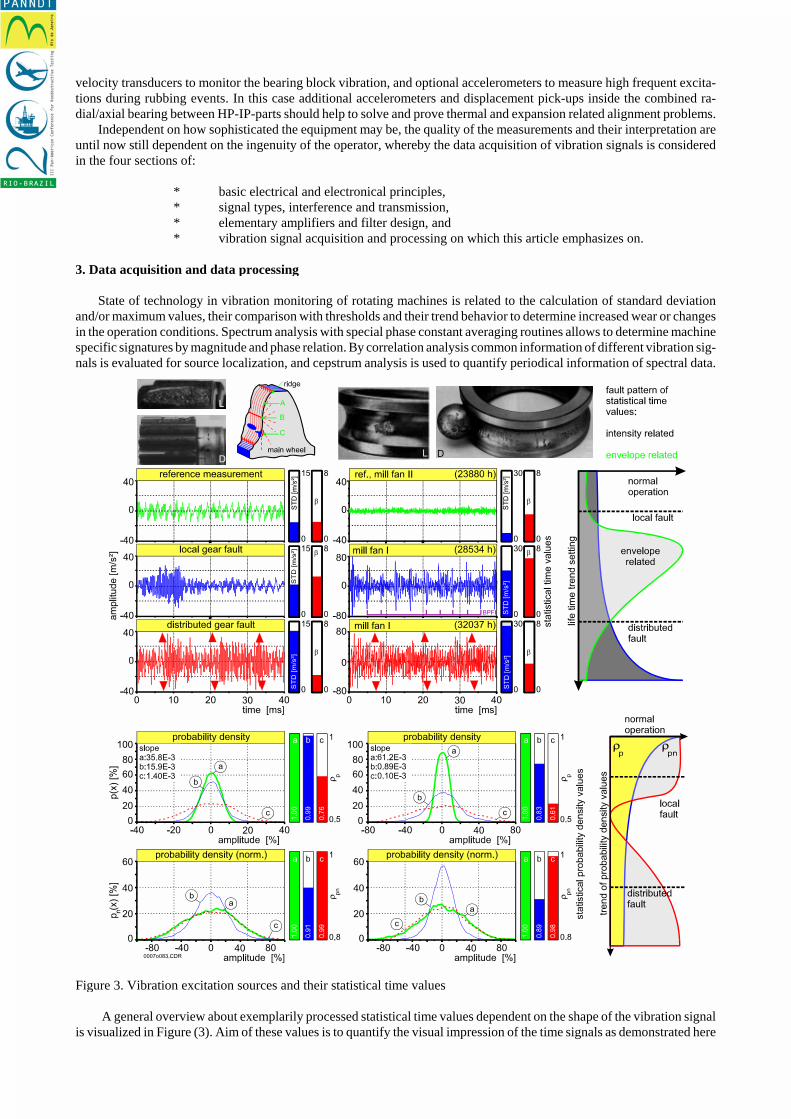
Figure 3. Vibration excitation sources and their statistical time values
A general overview about exemplarily processed statistical time values dependent on the shape of the vibration signalis visualized in Figure (3). Aim of these values is to quantify the visual impression of the time signals as demonstrated here
for local and distributed faults at gears and rolling element bearings. Based on the large statistical variation width in thepure maximum value an integral description of the dynamical signal information is given by the effective value also calledstandard deviation (STD), squared the variance presents the dynamic signal energy. The Crest-factor describes the peakintensity in the signal progress, calculated by the relation of the maximal value to the standard deviation. Through thefourfold exponential weighting of short-time pulse excitation against the energy contained in the signal, the relative loadindependence of the Kurtosis-factor (ß) arises, in contrast to the characteristical values described above. By definition theKurtosis-factor reaches for purely sinusoidal excitation a value of 1.5 (e.g. pure unbalance excitation), in gaussian rustlinga value of 3.0 (e.g. stochastical mechanical/flow friction), while for short time pulses within the time set (e.g. short timerubbing, local rolling element bearing damage, cavitation) values up to 100 can appear. The form-factor, as ratio of thequadratic average (RMS, root mean square value) to the linear average, applies as an analysis tool to share harmonics fromcoupled information in the signal, with a value of 1.11 for purely harmonical signal components. Stepping up additionaldamage specific non-harmonical related signal components in the observation period, or the harmonically components shiftthemselves, this reflects as changes of the form factor. The single calculation algorithms are to be taken from specialliterature.
As a further remedy to the comparison of conditions or signal progresses the correlation coefficient � is available asapplied here to describe changes of probability functions for the two shown faults. It describes whether in the mean of asignal order and/or an observation time interval two time signals are independent from each other, if covariance orcontravariance exists. Calculated from the linear average of the product from both observed time signals, normalized bythe product of the accompanying standard deviation, it compares obviously the changes in the signal’s shape.
To the premature determination of faults and damages of single machine components, the trend setting of certainstatistical time values of the vibration signals suits itself. So the initiating and growing of defects in rolling element bearingsof pumps, compressors, and drive units in most cases are clearly detected by using statistical values as should be demon-strated by the above presented examples.
Due to the regarded results the first impression might lead to conclude that time domain analysis by trend setting ofstatistical values is sufficient to determine faults successfully. Near problems with source localization in complex machin-ery, the example shows that the signatures for the gear faults here are similar to that ones of the bearing fault and superim-posed structure resonances often influence the pure time signal analysis.
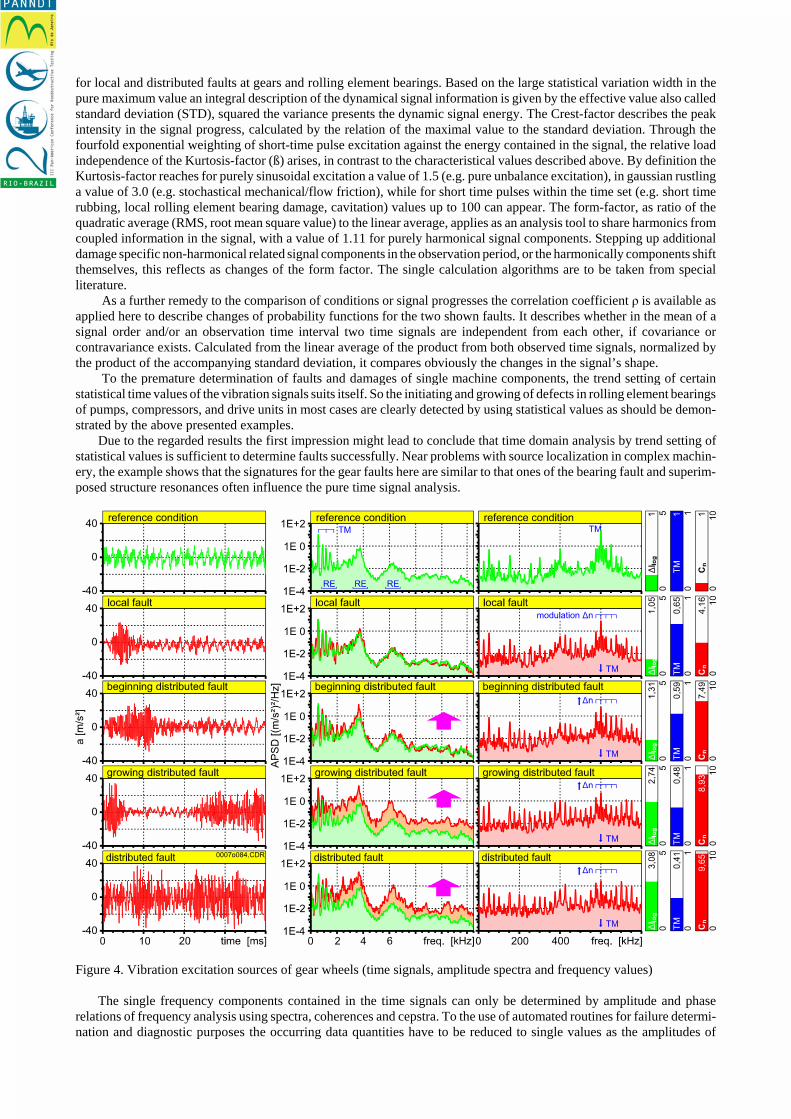
Figure 4. Vibration excitation sources of gear wheels (time signals, amplitude spectra and frequency values)
The single frequency components contained in the time signals can only be determined by amplitude and phaserelations of frequency analysis using spectra, coherences and cepstra. To the use of automated routines for failure determi-nation and diagnostic purposes the occurring data quantities have to be reduced to single values as the amplitudes of
characteristcal frequency components, like the narrow banded spectra information of rotational related excitation asunbalance, misalignment, gear mesh, etc.
The cepstrum, the inverse FFT of the spectrum, summarizes all periodical information within one value, e.g. theamplitude and frequency modulations of bearing, gear, and blade faults become visible at increased gamnitudes of the speedrahmonics. If faults at rotational speed related machine components occur, these modulations are visible at these rahmonics.The combination of excited center frequency, for the fault example the teeth mesh (TM), and the cepstrum gamnitudes (Cn)at the 1st speed rahmonic characterize the fault in Figure (4).
Broad banded information of system and fluid resonances are monitored by FFT-integrals in certain frequency ranges.Friction related information is represented in the spectra ground level (Ilog). Multi sensor systems in combination withcorrelation techniques avoid measurement errors and determine excitation sources. Similar to the cepstrum analysis thehocerence (inverse FFT of the coherence) enables to summarize all periodically related information obtained in two signals.
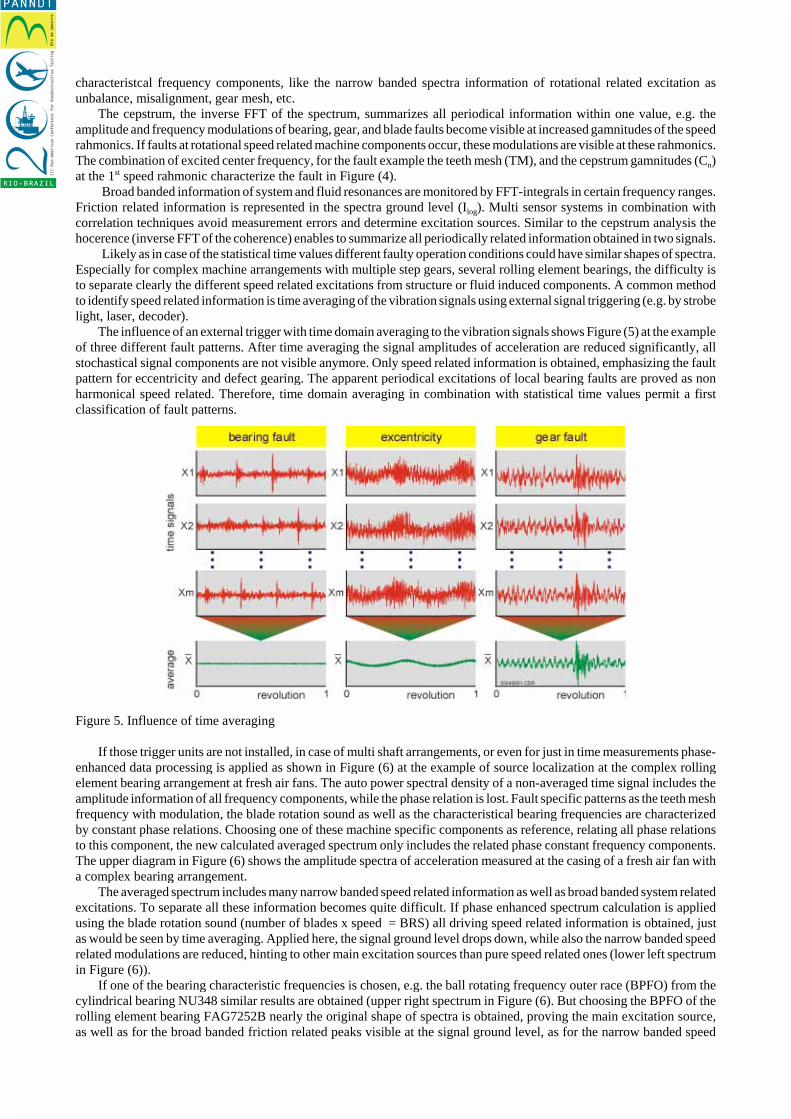
Likely as in case of the statistical time values different faulty operation conditions could have similar shapes of spectra.Especially for complex machine arrangements with multiple step gears, several rolling element bearings, the difficulty isto separate clearly the different speed related excitations from structure or fluid induced components. A common methodto identify speed related information is time averaging of the vibration signals using external signal triggering (e.g. by strobelight, laser, decoder).
The influence of an external trigger with time domain averaging to the vibration signals shows Figure (5) at the exampleof three different fault patterns. After time averaging the signal amplitudes of acceleration are reduced significantly, allstochastical signal components are not visible anymore. Only speed related information is obtained, emphasizing the faultpattern for eccentricity and defect gearing. The apparent periodical excitations of local bearing faults are proved as nonharmonical speed related. Therefore, time domain averaging in combination with statistical time values permit a firstclassification of fault patterns.
Figure 5. Influence of time averaging
If those trigger units are not installed, in case of multi shaft arrangements, or even for just in time measurements phase-enhanced data processing is applied as shown in Figure (6) at the example of source localization at the complex rollingelement bearing arrangement at fresh air fans. The auto power spectral density of a non-averaged time signal includes theamplitude information of all frequency components, while the phase relation is lost. Fault specific patterns as the teeth meshfrequency with modulation, the blade rotation sound as well as the characteristical bearing frequencies are characterizedby constant phase relations. Choosing one of these machine specific components as reference, relating all phase relationsto this component, the new calculated averaged spectrum only includes the related phase constant frequency components.The upper diagram in Figure (6) shows the amplitude spectra of acceleration measured at the casing of a fresh air fan witha complex bearing arrangement.
The averaged spectrum includes many narrow banded speed related information as well as broad banded system relatedexcitations. To separate all these information becomes quite difficult. If phase enhanced spectrum calculation is appliedusing the blade rotation sound (number of blades x speed = BRS) all driving speed related information is obtained, justas would be seen by time averaging. Applied here, the signal ground level drops down, while also the narrow banded speedrelated modulations are reduced, hinting to other main excitation sources than pure speed related ones (lower left spectrumin Figure (6)).
If one of the bearing characteristic frequencies is chosen, e.g. the ball rotating frequency outer race (BPFO) from thecylindrical bearing NU348 similar results are obtained (upper right spectrum in Figure (6). But choosing the BPFO of therolling element bearing FAG7252B nearly the original shape of spectra is obtained, proving the main excitation source,as well as for the broad banded friction related peaks visible at the signal ground level, as for the narrow banded speed
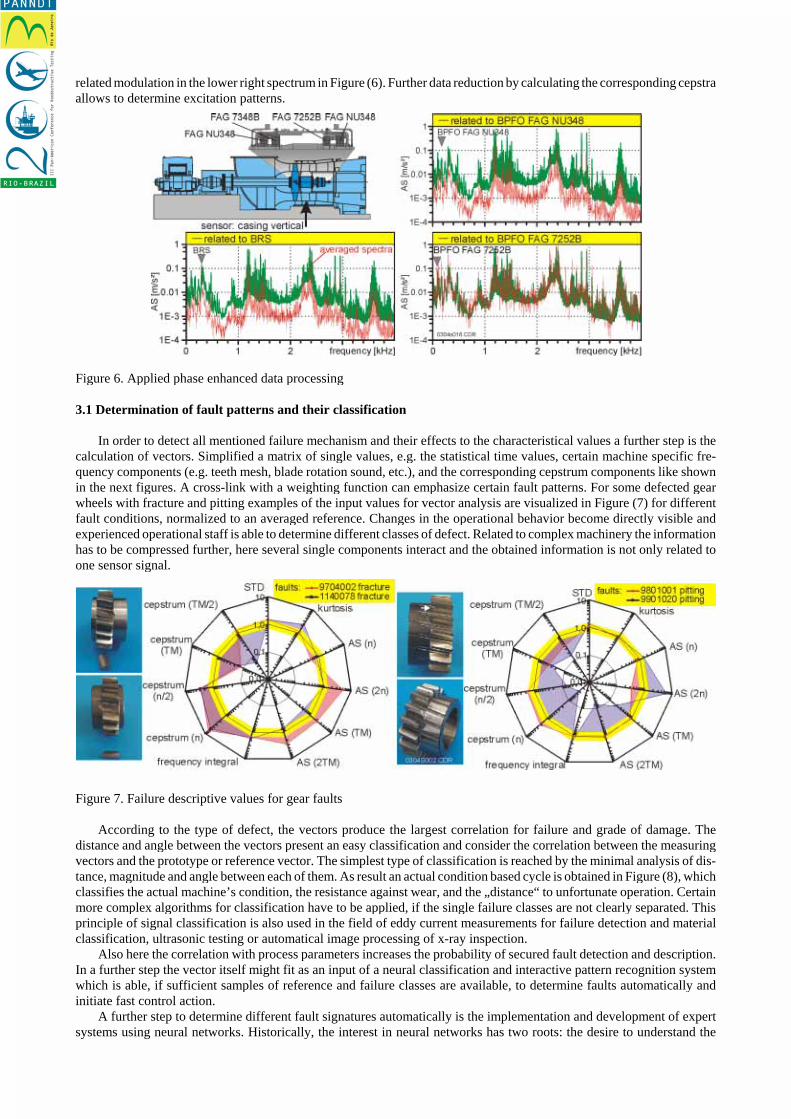
related modulation in the lower right spectrum in Figure (6). Further data reduction by calculating the corresponding cepstraallows to determine excitation patterns.
Figure 6. Applied phase enhanced data processing
3.1 Determination of fault patterns and their classification
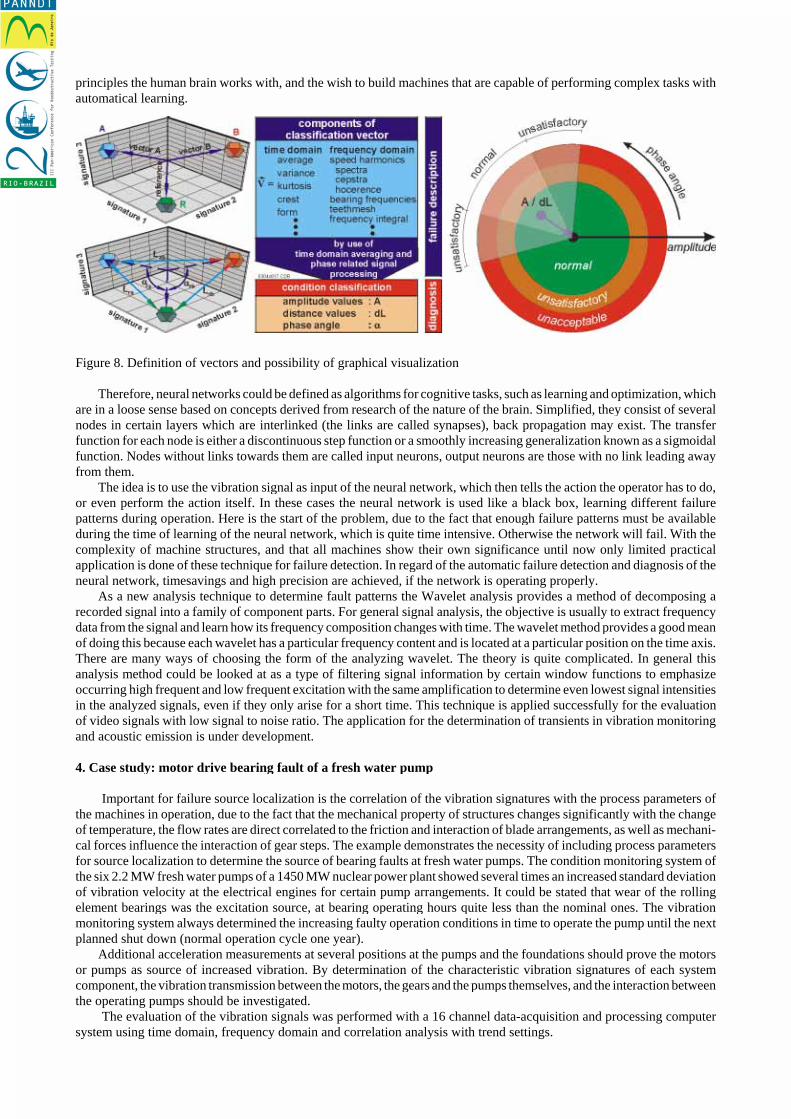
In order to detect all mentioned failure mechanism and their effects to the characteristical values a further step is thecalculation of vectors. Simplified a matrix of single values, e.g. the statistical time values, certain machine specific fre-quency components (e.g. teeth mesh, blade rotation sound, etc.), and the corresponding cepstrum components like shownin the next figures. A cross-link with a weighting function can emphasize certain fault patterns. For some defected gearwheels with fracture and pitting examples of the input values for vector analysis are visualized in Figure (7) for differentfault conditions, normalized to an averaged reference. Changes in the operational behavior become directly visible andexperienced operational staff is able to determine different classes of defect. Related to complex machinery the informationhas to be compressed further, here several single components interact and the obtained information is not only related toone sensor signal.
Figure 7. Failure descriptive values for gear faults
According to the type of defect, the vectors produce the largest correlation for failure and grade of damage. Thedistance and angle between the vectors present an easy classification and consider the correlation between the measuringvectors and the prototype or reference vector. The simplest type of classification is reached by the minimal analysis of dis-tance, magnitude and angle between each of them. As result an actual condition based cycle is obtained in Figure (8), whichclassifies the actual machine’s condition, the resistance against wear, and the „distance“ to unfortunate operation. Certainmore complex algorithms for classification have to be applied, if the single failure classes are not clearly separated. Thisprinciple of signal classification is also used in the field of eddy current measurements for failure detection and materialclassification, ultrasonic testing or automatical image processing of x-ray inspection.
Also here the correlation with process parameters increases the probability of secured fault detection and description.In a further step the vector itself might fit as an input of a neural classification and interactive pattern recognition systemwhich is able, if sufficient samples of reference and failure classes are available, to determine faults automatically andinitiate fast control action.
A further step to determine different fault signatures automatically is the implementation and development of expertsystems using neural networks. Historically, the interest in neural networks has two roots: the desire to understand the
principles the human brain works with, and the wish to build machines that are capable of performing complex tasks withautomatical learning.
Figure 8. Definition of vectors and possibility of graphical visualization
Therefore, neural networks could be defined as algorithms for cognitive tasks, such as learning and optimization, whichare in a loose sense based on concepts derived from research of the nature of the brain. Simplified, they consist of severalnodes in certain layers which are interlinked (the links are called synapses), back propagation may exist. The transferfunction for each node is either a discontinuous step function or a smoothly increasing generalization known as a sigmoidalfunction. Nodes without links towards them are called input neurons, output neurons are those with no link leading awayfrom them.
The idea is to use the vibration signal as input of the neural network, which then tells the action the operator has to do,or even perform the action itself. In these cases the neural network is used like a black box, learning different failurepatterns during operation. Here is the start of the problem, due to the fact that enough failure patterns must be availableduring the time of learning of the neural network, which is quite time intensive. Otherwise the network will fail. With thecomplexity of machine structures, and that all machines show their own significance until now only limited practicalapplication is done of these technique for failure detection. In regard of the automatic failure detection and diagnosis of theneural network, timesavings and high precision are achieved, if the network is operating properly.
As a new analysis technique to determine fault patterns the Wavelet analysis provides a method of decomposing arecorded signal into a family of component parts. For general signal analysis, the objective is usually to extract frequencydata from the signal and learn how its frequency composition changes with time. The wavelet method provides a good meanof doing this because each wavelet has a particular frequency content and is located at a particular position on the time axis.There are many ways of choosing the form of the analyzing wavelet. The theory is quite complicated. In general thisanalysis method could be looked at as a type of filtering signal information by certain window functions to emphasizeoccurring high frequent and low frequent excitation with the same amplification to determine even lowest signal intensitiesin the analyzed signals, even if they only arise for a short time. This technique is applied successfully for the evaluationof video signals with low signal to noise ratio. The application for the determination of transients in vibration monitoringand acoustic emission is under development.
4. Case study: motor drive bearing fault of a fresh water pump
Important for failure source localization is the correlation of the vibration signatures with the process parameters ofthe machines in operation, due to the fact that the mechanical property of structures changes significantly with the changeof temperature, the flow rates are direct correlated to the friction and interaction of blade arrangements, as well as mechani-cal forces influence the interaction of gear steps. The example demonstrates the necessity of including process parametersfor source localization to determine the source of bearing faults at fresh water pumps. The condition monitoring system ofthe six 2.2 MW fresh water pumps of a 1450 MW nuclear power plant showed several times an increased standard deviationof vibration velocity at the electrical engines for certain pump arrangements. It could be stated that wear of the rollingelement bearings was the excitation source, at bearing operating hours quite less than the nominal ones. The vibrationmonitoring system always determined the increasing faulty operation conditions in time to operate the pump until the nextplanned shut down (normal operation cycle one year).
Additional acceleration measurements at several positions at the pumps and the foundations should prove the motorsor pumps as source of increased vibration. By determination of the characteristic vibration signatures of each systemcomponent, the vibration transmission between the motors, the gears and the pumps themselves, and the interaction betweenthe operating pumps should be investigated.
The evaluation of the vibration signals was performed with a 16 channel data-acquisition and processing computersystem using time domain, frequency domain and correlation analysis with trend settings.
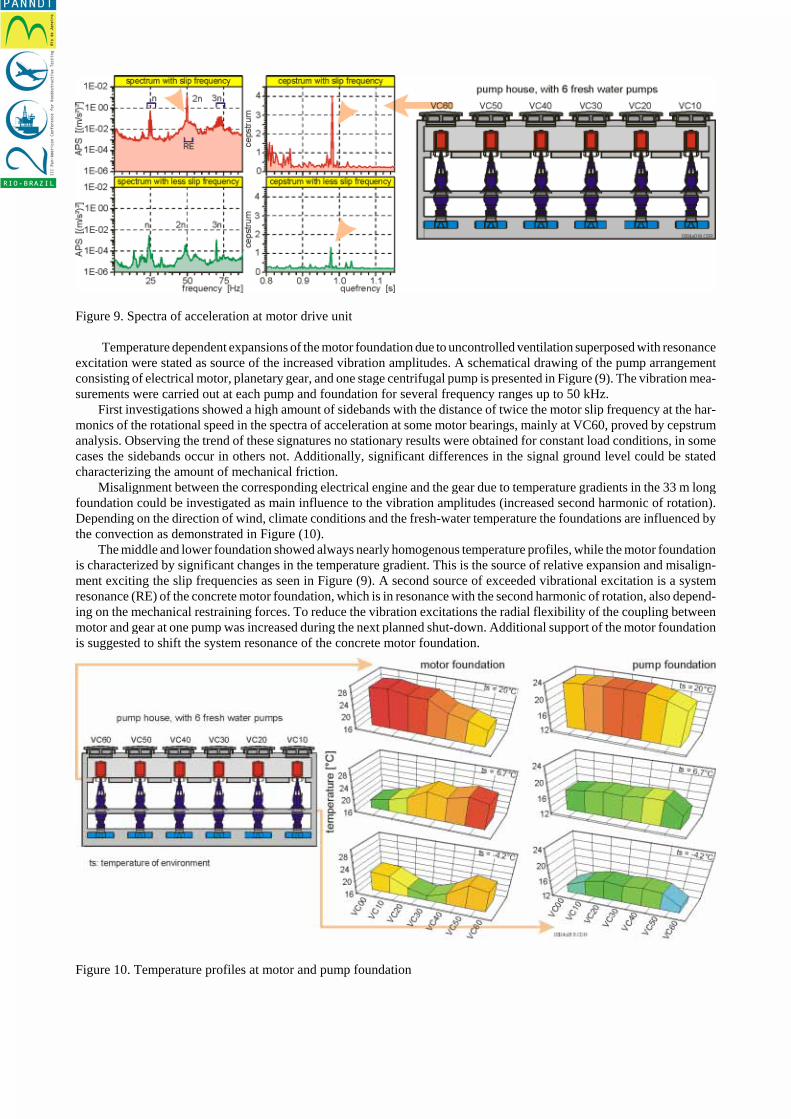
Figure 9. Spectra of acceleration at motor drive unit
Temperature dependent expansions of the motor foundation due to uncontrolled ventilation superposed with resonanceexcitation were stated as source of the increased vibration amplitudes. A schematical drawing of the pump arrangementconsisting of electrical motor, planetary gear, and one stage centrifugal pump is presented in Figure (9). The vibration mea-surements were carried out at each pump and foundation for several frequency ranges up to 50 kHz.
First investigations showed a high amount of sidebands with the distance of twice the motor slip frequency at the har-monics of the rotational speed in the spectra of acceleration at some motor bearings, mainly at VC60, proved by cepstrumanalysis. Observing the trend of these signatures no stationary results were obtained for constant load conditions, in somecases the sidebands occur in others not. Additionally, significant differences in the signal ground level could be statedcharacterizing the amount of mechanical friction.
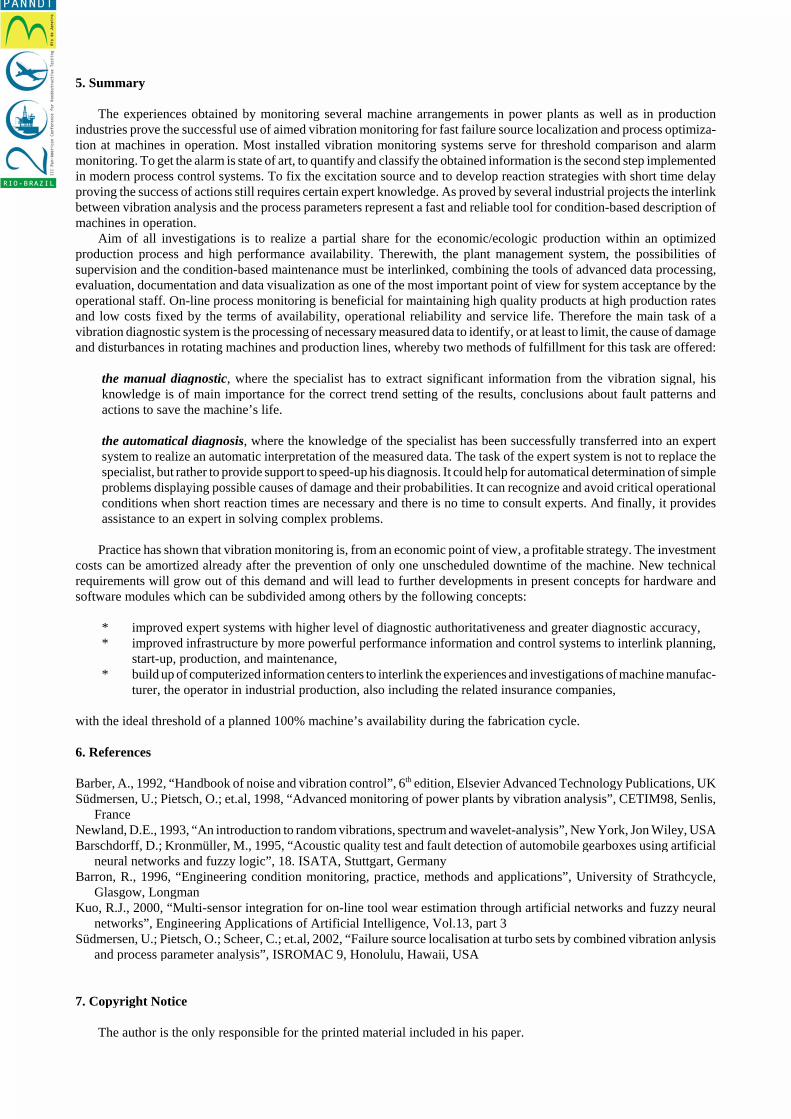
Misalignment between the corresponding electrical engine and the gear due to temperature gradients in the 33 m longfoundation could be investigated as main influence to the vibration amplitudes (increased second harmonic of rotation).Depending on the direction of wind, climate conditions and the fresh-water temperature the foundations are influenced bythe convection as demonstrated in Figure (10).
The middle and lower foundation showed always nearly homogenous temperature profiles, while the motor foundationis characterized by significant changes in the temperature gradient. This is the source of relative expansion and misalign-ment exciting the slip frequencies as seen in Figure (9). A second source of exceeded vibrational excitation is a systemresonance (RE) of the concrete motor foundation, which is in resonance with the second harmonic of rotation, also depend-ing on the mechanical restraining forces. To reduce the vibration excitations the radial flexibility of the coupling betweenmotor and gear at one pump was increased during the next planned shut-down. Additional support of the motor foundationis suggested to shift the system resonance of the concrete motor foundation.
Figure 10. Temperature profiles at motor and pump foundation
5. Summary
The experiences obtained by monitoring several machine arrangements in power plants as well as in productionindustries prove the successful use of aimed vibration monitoring for fast failure source localization and process optimiza-tion at machines in operation. Most installed vibration monitoring systems serve for threshold comparison and alarmmonitoring. To get the alarm is state of art, to quantify and classify the obtained information is the second step implementedin modern process control systems. To fix the excitation source and to develop reaction strategies with short time delayproving the success of actions still requires certain expert knowledge. As proved by several industrial projects the interlinkbetween vibration analysis and the process parameters represent a fast and reliable tool for condition-based description ofmachines in operation.
Aim of all investigations is to realize a partial share for the economic/ecologic production within an optimizedproduction process and high performance availability. Therewith, the plant management system, the possibilities ofsupervision and the condition-based maintenance must be interlinked, combining the tools of advanced data processing,evaluation, documentation and data visualization as one of the most important point of view for system acceptance by theoperational staff. On-line process monitoring is beneficial for maintaining high quality products at high production ratesand low costs fixed by the terms of availability, operational reliability and service life. Therefore the main task of avibration diagnostic system is the processing of necessary measured data to identify, or at least to limit, the cause of damageand disturbances in rotating machines and production lines, whereby two methods of fulfillment for this task are offered:
the manual diagnostic, where the specialist has to extract significant information from the vibration signal, hisknowledge is of main importance for the correct trend setting of the results, conclusions about fault patterns andactions to save the machine’s life.
the automatical diagnosis, where the knowledge of the specialist has been successfully transferred into an expertsystem to realize an automatic interpretation of the measured data. The task of the expert system is not to replace thespecialist, but rather to provide support to speed-up his diagnosis. It could help for automatical determination of simpleproblems displaying possible causes of damage and their probabilities. It can recognize and avoid critical operationalconditions when short reaction times are necessary and there is no time to consult experts. And finally, it providesassistance to an expert in solving complex problems.
Practice has shown that vibration monitoring is, from an economic point of view, a profitable strategy. The investmentcosts can be amortized already after the prevention of only one unscheduled downtime of the machine. New technicalrequirements will grow out of this demand and will lead to further developments in present concepts for hardware andsoftware modules which can be subdivided among others by the following concepts:
* improved expert systems with higher level of diagnostic authoritativeness and greater diagnostic accuracy,* improved infrastructure by more powerful performance information and control systems to interlink planning,
start-up, production, and maintenance, * build up of computerized information centers to interlink the experiences and investigations of machine manufac-
turer, the operator in industrial production, also including the related insurance companies,
with the ideal threshold of a planned 100% machine’s availability during the fabrication cycle.
6. References
Barber, A., 1992, “Handbook of noise and vibration control”, 6th edition, Elsevier Advanced Technology Publications, UKSüdmersen, U.; Pietsch, O.; et.al, 1998, “Advanced monitoring of power plants by vibration analysis”, CETIM98, Senlis,
FranceNewland, D.E., 1993, “An introduction to random vibrations, spectrum and wavelet-analysis”, New York, Jon Wiley, USABarschdorff, D.; Kronmüller, M., 1995, “Acoustic quality test and fault detection of automobile gearboxes using artificial
neural networks and fuzzy logic”, 18. ISATA, Stuttgart, GermanyBarron, R., 1996, “Engineering condition monitoring, practice, methods and applications”, University of Strathcycle,
Glasgow, LongmanKuo, R.J., 2000, “Multi-sensor integration for on-line tool wear estimation through artificial networks and fuzzy neural
networks”, Engineering Applications of Artificial Intelligence, Vol.13, part 3Südmersen, U.; Pietsch, O.; Scheer, C.; et.al, 2002, “Failure source localisation at turbo sets by combined vibration anlysis
and process parameter analysis”, ISROMAC 9, Honolulu, Hawaii, USA
7. Copyright Notice
The author is the only responsible for the printed material included in his paper.