Embed Size (px)
Citation preview
6/23/2014
1
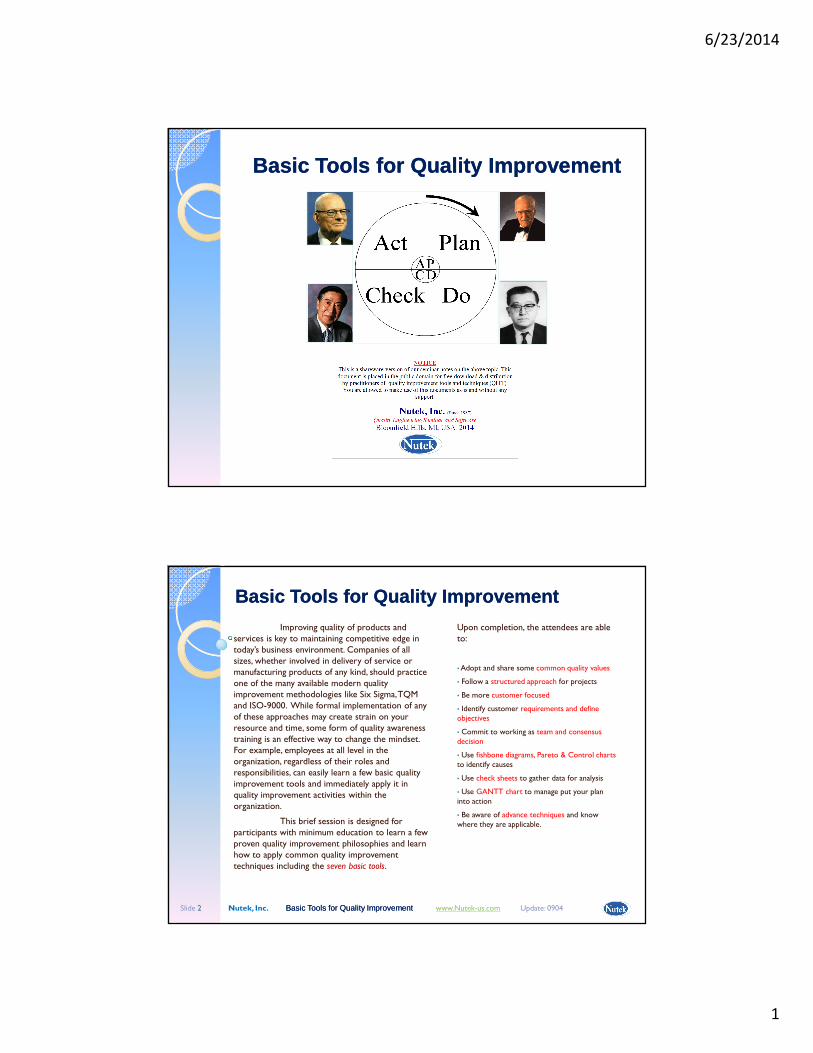
Basic Tools for Quality ImprovementBasic Tools for Quality Improvement
Nutek, Inc. Basic Tools for Quality Improvement Basic Tools for Quality Improvement www.Nutek-us.com Update: 0904 Slide 2
Improving quality of products and services is key to maintaining competitive edge in today’s business environment. Companies of all sizes, whether involved in delivery of service or manufacturing products of any kind, should practice one of the many available modern quality improvement methodologies like Six Sigma, TQM and ISO-9000. While formal implementation of any of these approaches may create strain on your resource and time, some form of quality awareness training is an effective way to change the mindset. For example, employees at all level in the organization, regardless of their roles and responsibilities, can easily learn a few basic quality improvement tools and immediately apply it in quality improvement activities within the organization.
This brief session is designed for participants with minimum education to learn a few proven quality improvement philosophies and learn how to apply common quality improvement techniques including the seven basic tools.
Basic Tools for Quality ImprovementBasic Tools for Quality ImprovementUpon completion, the attendees are able to:
•Adopt and share some common quality values
• Follow a structured approach for projects
• Be more customer focused
• Identify customer requirements and define objectives
• Commit to working as team and consensus decision
• Use fishbone diagrams, Pareto & Control charts to identify causes
• Use check sheets to gather data for analysis
• Use GANTT chart to manage put your plan into action
• Be aware of advance techniques and know where they are applicable.
6/23/2014
2
Nutek, Inc. Basic Tools for Quality Improvement Basic Tools for Quality Improvement www.Nutek-us.com Update: 0904 Slide 3
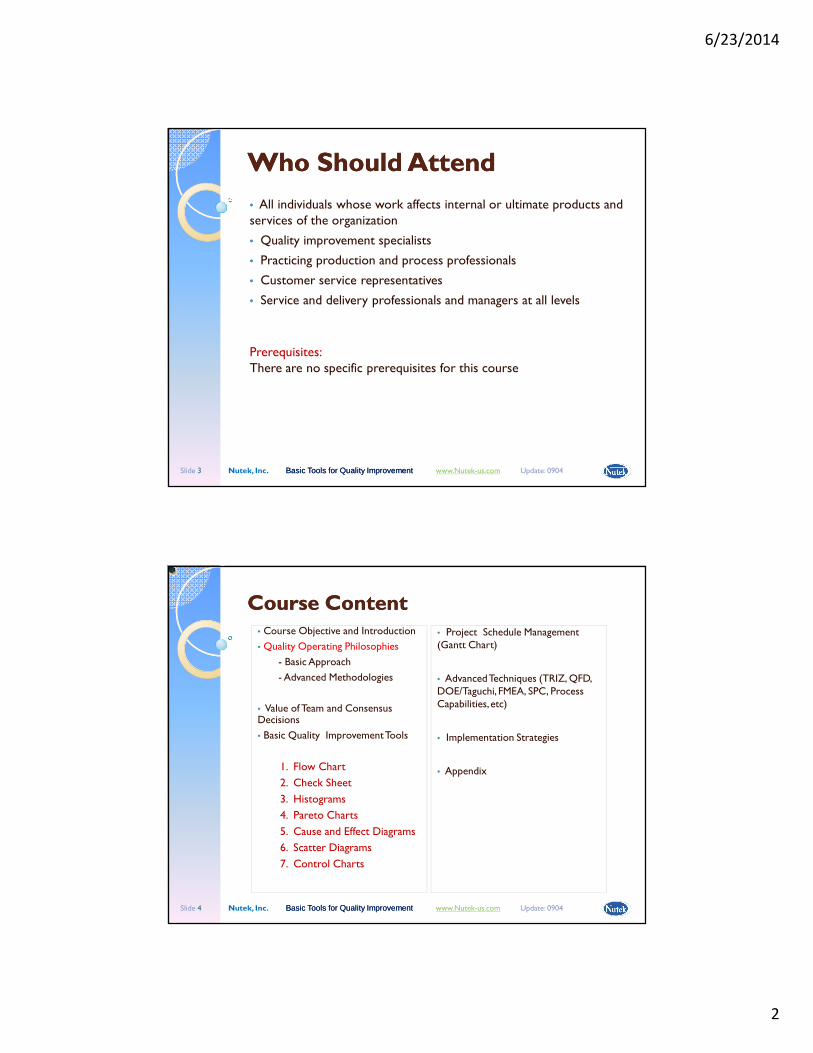
Who Should AttendWho Should Attend
• All individuals whose work affects internal or ultimate products and services of the organization
• Quality improvement specialists
• Practicing production and process professionals
• Customer service representatives
• Service and delivery professionals and managers at all levels
Prerequisites:There are no specific prerequisites for this course
Nutek, Inc. Basic Tools for Quality Improvement Basic Tools for Quality Improvement www.Nutek-us.com Update: 0904 Slide 4
Course ContentCourse Content• Course Objective and Introduction
• Quality Operating Philosophies
- Basic Approach
- Advanced Methodologies
• Value of Team and Consensus Decisions
• Basic Quality Improvement Tools
1. Flow Chart
2. Check Sheet
3. Histograms
4. Pareto Charts
5. Cause and Effect Diagrams
6. Scatter Diagrams
7. Control Charts
• Project Schedule Management (Gantt Chart)
• Advanced Techniques (TRIZ, QFD, DOE/Taguchi, FMEA, SPC, Process Capabilities, etc)
• Implementation Strategies
• Appendix
6/23/2014
3
Nutek, Inc. Basic Tools for Quality Improvement Basic Tools for Quality Improvement www.Nutek-us.com Update: 0904 Slide 5
Principal Instructor Principal Instructor (Course Developers)(Course Developers)
Ranjit Roy, Ph.D., P.E., PMP
• Mechanical engineer
• Industrial experience since 1973 (GM 1976 – 1987)
• Independent consultant since 1987
• Specializes in product and process design improvement technique
• Published books and developed technical software
•Adjunct professor (Oakland University, Rochester, MI since 1976)
• Fellow of American Society for Quality (ASQ)
• Provisionally certified LeadAuditor (ISO/QS-9000)
Nutek, Inc. Basic Tools for Quality Improvement Basic Tools for Quality Improvement www.Nutek-us.com Update: 0904 Slide 6
Team Building ExerciseTeam Building Exercise
Playing cards: 4 x 10 cards into 5 stacks of equal total number.
6/23/2014
4
Nutek, Inc. Basic Tools for Quality Improvement Basic Tools for Quality Improvement www.Nutek-us.com Update: 0904 Slide 7
Quality Operating Philosophies
“Quality operating principles and values are important for any business organization to do well and stay in business. “
Nutek, Inc. Basic Tools for Quality Improvement Basic Tools for Quality Improvement www.Nutek-us.com Update: 0904 Slide 8
Origin of Quality ThinkingOrigin of Quality Thinking
In colonial times Andrew Bradford had the contract for the public printing in Pennsylvania. One day the governor made an important address and Bradford printed it in his usual, careless manner.
Another young printer realized this was the opportunity he’d been waiting for. He printed the speech in elegant form, then mailed a copy with his compliments to the governor and each member of the assembly. The next year Ben Franklin-the young printer who showed concern for his customers-received the contract for all Pennsylvania’s public printing.
Make products or deliver service:
• Better (Delivery, Performance, Looks,
Service life, Shelf life, etc.)
• Faster (Productivity, Down time, etc.)
• Inexpensive (Reduced waste and loss,
maintenance cost, etc)
• Consistent
What is QUALITY as applied to your work?
6/23/2014
5
Nutek, Inc. Basic Tools for Quality Improvement Basic Tools for Quality Improvement www.Nutek-us.com Update: 0904 Slide 9
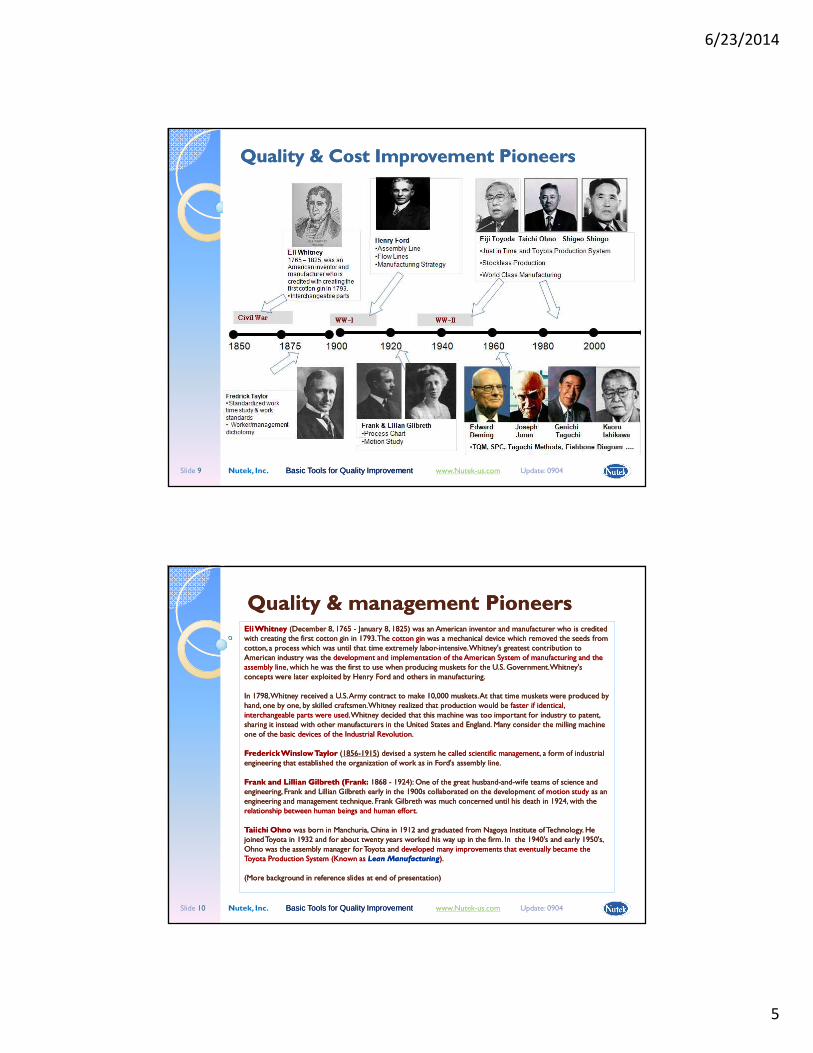
Quality & Cost Improvement PioneersQuality & Cost Improvement Pioneers
Nutek, Inc. Basic Tools for Quality Improvement Basic Tools for Quality Improvement www.Nutek-us.com Update: 0904 Slide 10
Quality & management PioneersQuality & management PioneersEli WhitneyEli Whitney (December 8, 1765 (December 8, 1765 -- January 8, 1825) was an American inventor and manufacturer who is credited January 8, 1825) was an American inventor and manufacturer who is credited with creating the first cotton gin in 1793. The with creating the first cotton gin in 1793. The cotton gincotton gin was a mechanical device which removed the seeds from was a mechanical device which removed the seeds from cotton, a process which was until that time extremely laborcotton, a process which was until that time extremely labor--intensive. Whitney's greatest contribution to intensive. Whitney's greatest contribution to American industry was the American industry was the development and implementation of the American System of manufacturing and the development and implementation of the American System of manufacturing and the assembly lineassembly line, which he was the first to use when producing muskets for the U.S. Government. Whitney's , which he was the first to use when producing muskets for the U.S. Government. Whitney's concepts were later exploited by Henry Ford and others in manufacturing. concepts were later exploited by Henry Ford and others in manufacturing.
In 1798, Whitney received a U.S. Army contract to make 10,000 muskets. At that time muskets were produced by In 1798, Whitney received a U.S. Army contract to make 10,000 muskets. At that time muskets were produced by hand, one by one, by skilled craftsmen. Whitney realized that production would be hand, one by one, by skilled craftsmen. Whitney realized that production would be faster if identical, faster if identical, interchangeable parts were usedinterchangeable parts were used. Whitney decided that this machine was too important for industry to patent, . Whitney decided that this machine was too important for industry to patent, sharing it instead with other manufacturers in the United States and England. Many consider the milling machine sharing it instead with other manufacturers in the United States and England. Many consider the milling machine one of the one of the basic devices of the Industrial Revolutionbasic devices of the Industrial Revolution..
Frederick Winslow TaylorFrederick Winslow Taylor ((18561856--1915)1915) devised a system he devised a system he called scientific managementcalled scientific management, a form of industrial , a form of industrial engineering that established the organization of work as in Ford's assembly line. engineering that established the organization of work as in Ford's assembly line.
Frank and Lillian Gilbreth (Frank:Frank and Lillian Gilbreth (Frank: 1868 1868 -- 1924): One of the great husband1924): One of the great husband--andand--wife teams of science and wife teams of science and engineering, Frank and Lillian Gilbreth early in the 1900s collaborated on the development of engineering, Frank and Lillian Gilbreth early in the 1900s collaborated on the development of motion studymotion study as an as an engineering and management technique. Frank Gilbreth was much concerned until his death in 1924, with the engineering and management technique. Frank Gilbreth was much concerned until his death in 1924, with the relationship between human beings and human effortrelationship between human beings and human effort..
Taiichi OhnoTaiichi Ohno was born in Manchuria, China in 1912 and graduated from Nagoya Institute of Technology. He was born in Manchuria, China in 1912 and graduated from Nagoya Institute of Technology. He joined Toyota in 1932 and for about twenty years worked his way up in the firm. In the 1940's and early 1950's, joined Toyota in 1932 and for about twenty years worked his way up in the firm. In the 1940's and early 1950's, Ohno was the assembly manager for Toyota and Ohno was the assembly manager for Toyota and developed many improvements that eventually became the developed many improvements that eventually became the Toyota Production System (Known as Toyota Production System (Known as Lean ManufacturingLean Manufacturing)). .
(More background in reference slides at end of presentation)(More background in reference slides at end of presentation)
6/23/2014
6
Nutek, Inc. Basic Tools for Quality Improvement Basic Tools for Quality Improvement www.Nutek-us.com Update: 0904 Slide 11
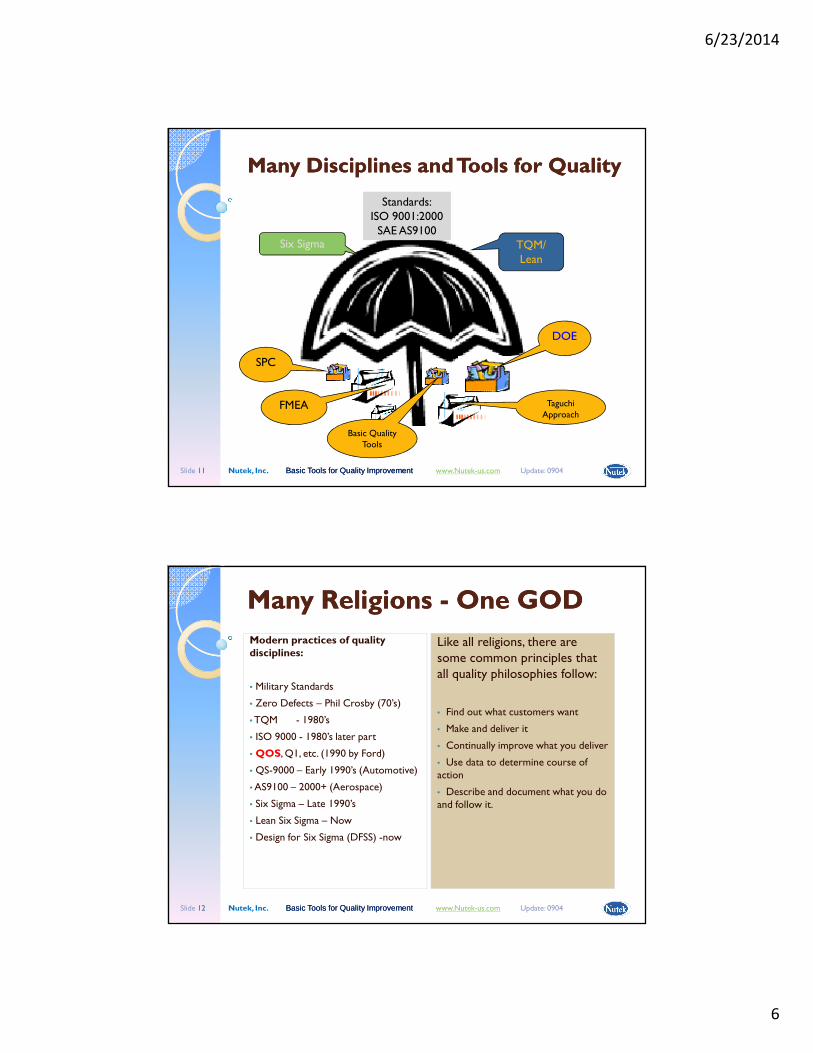
Many Disciplines and Tools for QualityMany Disciplines and Tools for Quality
Taguchi Approach
FMEA
DOE
SPC
Six Sigma TQM/Lean
Standards:ISO 9001:2000SAE AS9100
Basic Quality Tools
Nutek, Inc. Basic Tools for Quality Improvement Basic Tools for Quality Improvement www.Nutek-us.com Update: 0904 Slide 12
Many Religions Many Religions -- One GODOne GOD
Modern practices of quality disciplines:
• Military Standards
• Zero Defects – Phil Crosby (70’s)
•TQM - 1980’s
• ISO 9000 - 1980’s later part
• QOS, Q1, etc. (1990 by Ford)
• QS-9000 – Early 1990’s (Automotive)
• AS9100 – 2000+ (Aerospace)
• Six Sigma – Late 1990’s
• Lean Six Sigma – Now
• Design for Six Sigma (DFSS) -now
Like all religions, there are some common principles that all quality philosophies follow:
• Find out what customers want
• Make and deliver it
• Continually improve what you deliver
• Use data to determine course of action
• Describe and document what you do and follow it.
6/23/2014
7
Nutek, Inc. Basic Tools for Quality Improvement Basic Tools for Quality Improvement www.Nutek-us.com Update: 0904 Slide 13
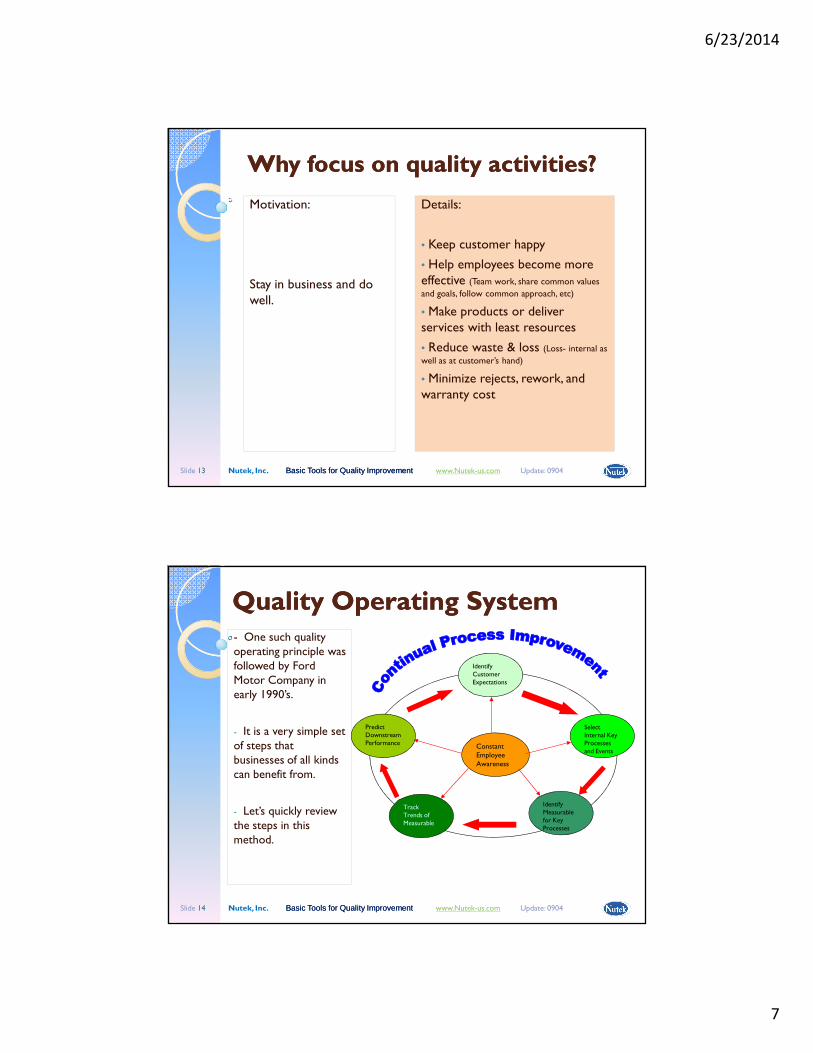
Why focus on quality activities?Why focus on quality activities?
Motivation:
Stay in business and do well.
Details:
• Keep customer happy
• Help employees become more effective (Team work, share common values
and goals, follow common approach, etc)
• Make products or deliver services with least resources
• Reduce waste & loss (Loss- internal as well as at customer’s hand)
• Minimize rejects, rework, and warranty cost
Nutek, Inc. Basic Tools for Quality Improvement Basic Tools for Quality Improvement www.Nutek-us.com Update: 0904 Slide 14
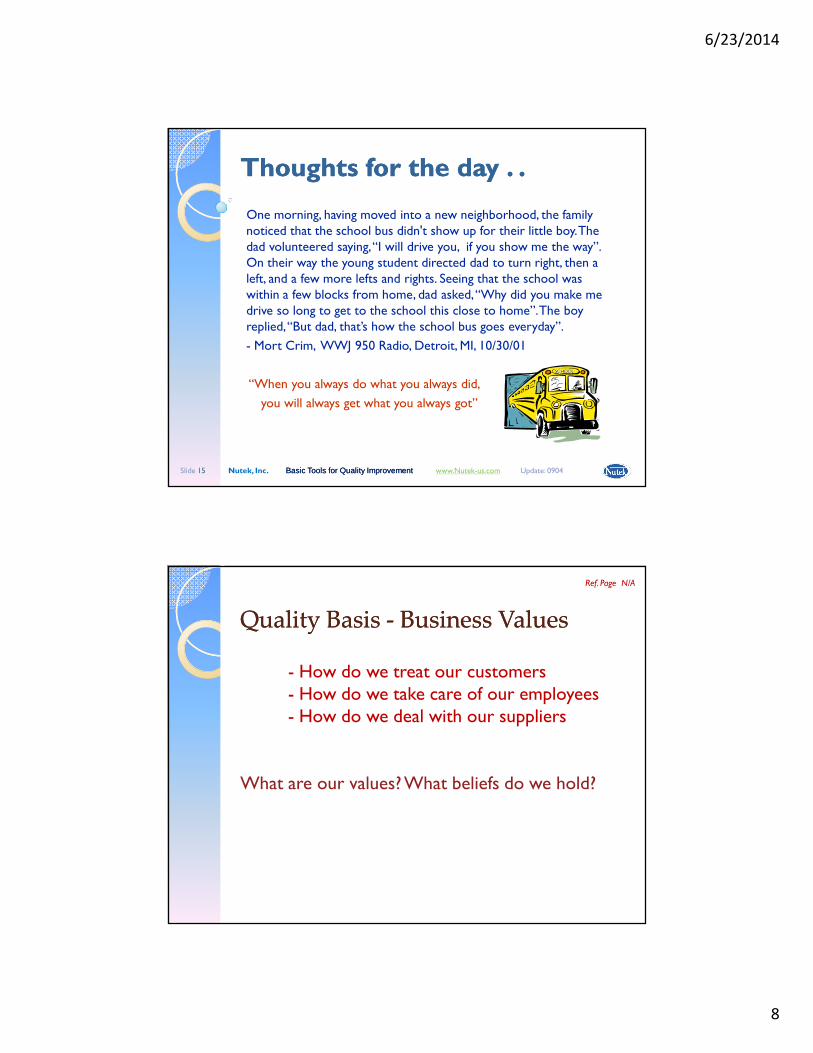
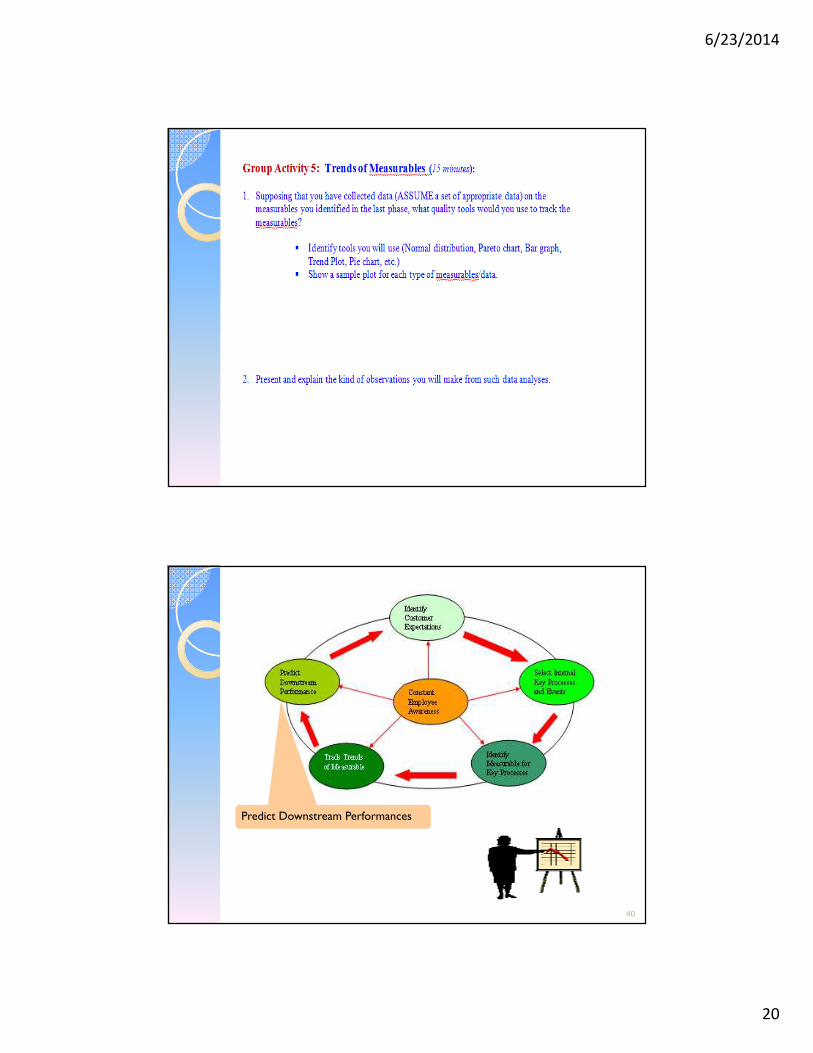
Quality Operating SystemQuality Operating System- One such quality operating principle was followed by Ford Motor Company in early 1990’s.
- It is a very simple set of steps that businesses of all kinds can benefit from.
- Let’s quickly review the steps in this method.
Predict Downstream Performance
Track Trends of Measurable
Select Internal Key Processes and Events
Identify Customer Expectations
Identify Measurable for Key Processes
Constant Employee Awareness
6/23/2014
8
Nutek, Inc. Basic Tools for Quality Improvement Basic Tools for Quality Improvement www.Nutek-us.com Update: 0904 Slide 15
Thoughts for the day . .Thoughts for the day . .
One morning, having moved into a new neighborhood, the family noticed that the school bus didn't show up for their little boy. The dad volunteered saying, “I will drive you, if you show me the way”. On their way the young student directed dad to turn right, then a left, and a few more lefts and rights. Seeing that the school was within a few blocks from home, dad asked, “Why did you make me drive so long to get to the school this close to home”. The boy replied, “But dad, that’s how the school bus goes everyday”.
- Mort Crim, WWJ 950 Radio, Detroit, MI, 10/30/01
“When you always do what you always did,
you will always get what you always got”
Quality Basis Quality Basis -- Business ValuesBusiness Values
- How do we treat our customers- How do we take care of our employees- How do we deal with our suppliers
What are our values? What beliefs do we hold?
Ref. Page N/A
6/23/2014
9
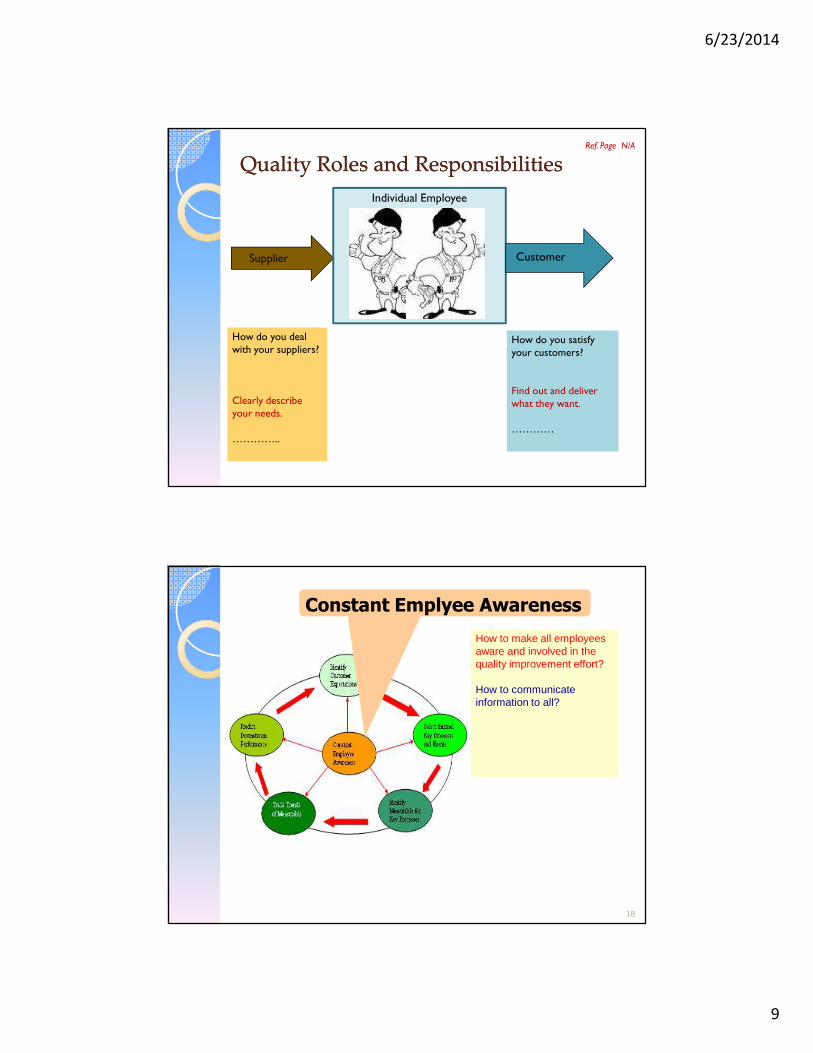
Individual Employee
Supplier Customer
How do you deal with your suppliers?
Clearly describe your needs.
…………..
How do you satisfy your customers?
Find out and deliver what they want.
…………
Ref. Page N/A
Quality Roles and ResponsibilitiesQuality Roles and Responsibilities
18
Constant Emplyee Awareness
How to make all employees aware and involved in the quality improvement effort?
How to communicate information to all?
How to make all employees aware and involved in the quality improvement effort?
How to communicate information to all?
6/23/2014
10
19
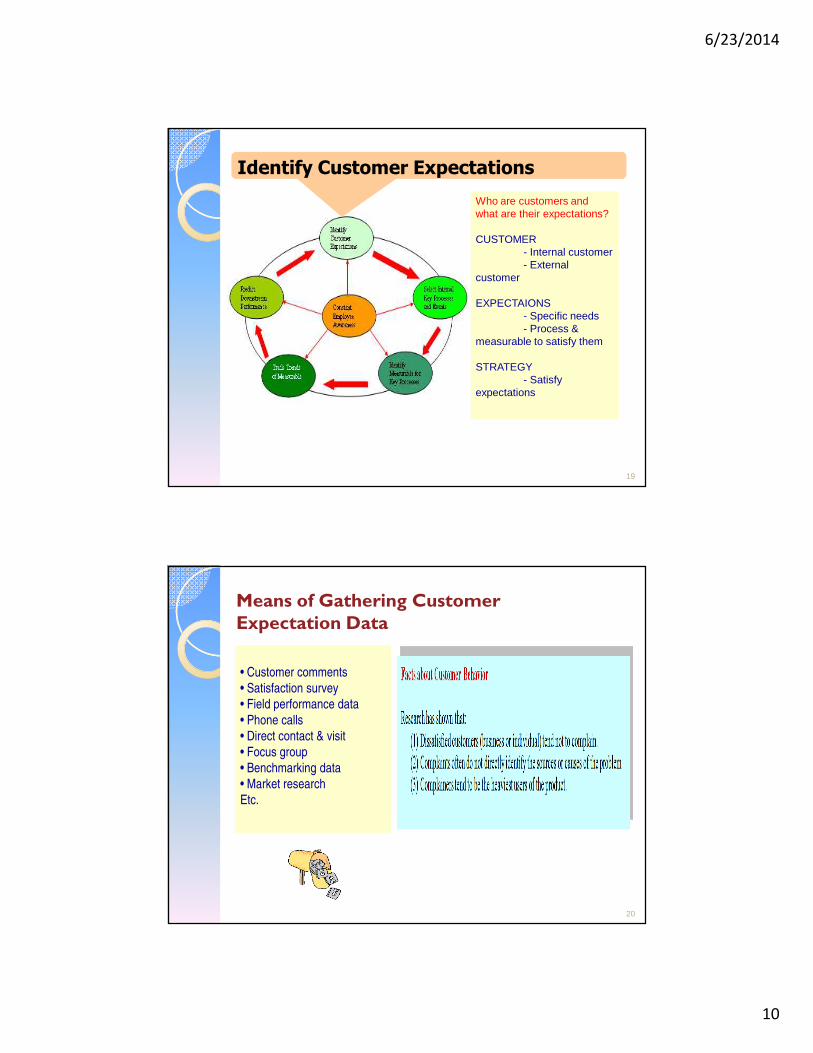
Identify Customer Expectations
Who are customers and what are their expectations?
CUSTOMER- Internal customer- External
customer
EXPECTAIONS- Specific needs- Process &
measurable to satisfy them
STRATEGY- Satisfy
expectations
Who are customers and what are their expectations?
CUSTOMER- Internal customer- External
customer
EXPECTAIONS- Specific needs- Process &
measurable to satisfy them
STRATEGY- Satisfy
expectations
20
Means of Gathering Customer Expectation Data
• Customer comments
• Satisfaction survey
• Field performance data
• Phone calls
• Direct contact & visit
• Focus group
• Benchmarking data
• Market research
Etc.
• Customer comments
• Satisfaction survey
• Field performance data
• Phone calls
• Direct contact & visit
• Focus group
• Benchmarking data
• Market research
Etc.
6/23/2014
11
21
Notes on Customer Expectations
22
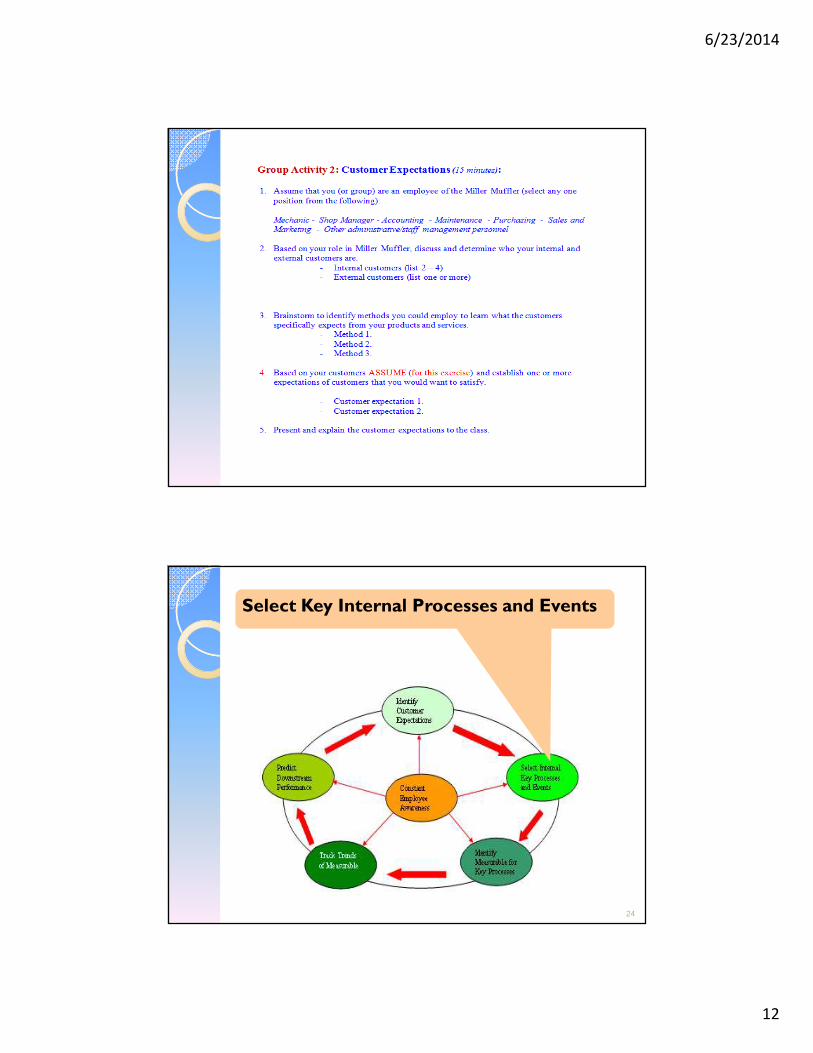
Class Exercise:Miller Muffler
Customer Expectations:1. Assume that you (or group) are an employee of the Miller
Muffler (select any one position from the following):- Mechanic - Shop Manager- Accounting- Maintenance- Purchasing- Other administrative/staff management personnel
2. Based on your role in Miller Muffler, discuss and determinewho your internal and external customers are (list).
3. Brainstorm to identify methods you could employ to specifically learn what the customers specifically expects from your products and services.
6/23/2014
12
24
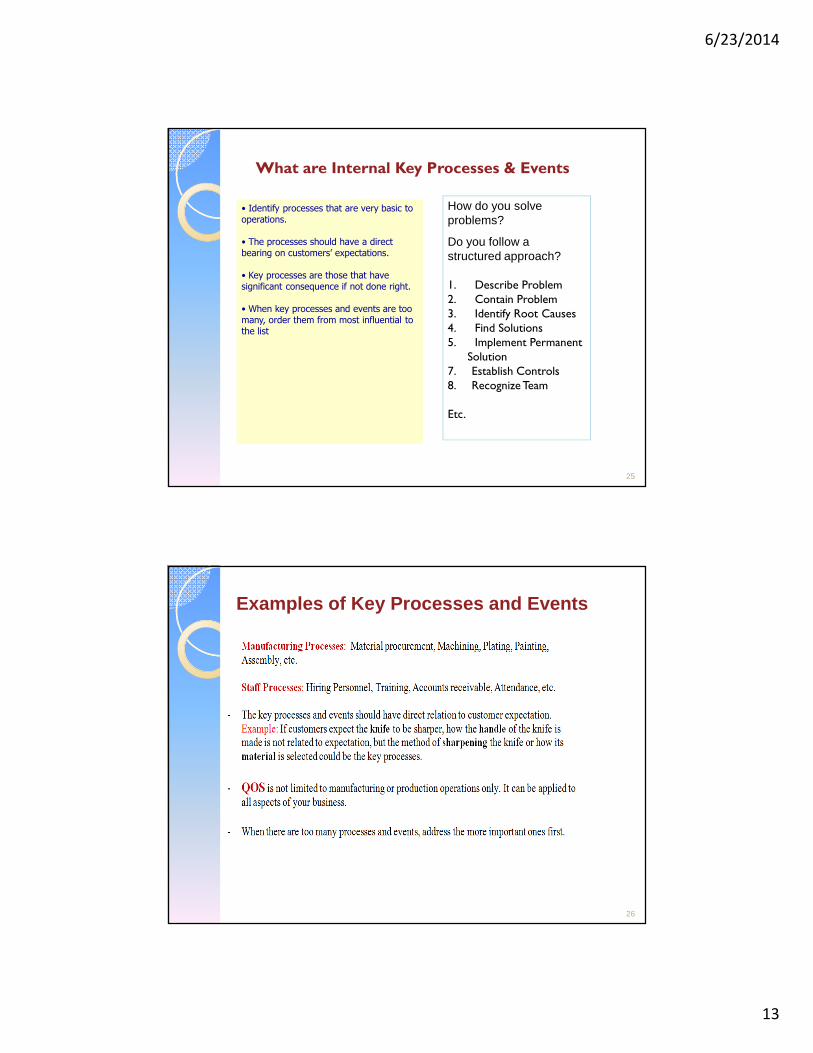
Select Key Internal Processes and Events
6/23/2014
13
25
What are Internal Key Processes & Events
• Identify processes that are very basic to operations.
• The processes should have a direct bearing on customers’ expectations.
• Key processes are those that have significant consequence if not done right.
• When key processes and events are too many, order them from most influential to the list
• Identify processes that are very basic to operations.
• The processes should have a direct bearing on customers’ expectations.
• Key processes are those that have significant consequence if not done right.
• When key processes and events are too many, order them from most influential to the list
How do you solve problems?
Do you follow a structured approach?
1. Describe Problem 2. Contain Problem 3. Identify Root Causes 4. Find Solutions 5. Implement Permanent
Solution7. Establish Controls8. Recognize Team
Etc.
26
Examples of Key Processes and Events
6/23/2014
14
27
Class Exercise: Miller Muffler
Customer Expectations:1. Assuming you (or group) are
the same employee of the Miller Muffler, brainstorm and list all the processes and events within your job responsibilities.
2. Select and prioritize those processes that have direct influence on the customer expectations you identified before.
Customer Expectations:1. Assuming you (or group) are
the same employee of the Miller Muffler, brainstorm and list all the processes and events within your job responsibilities.
2. Select and prioritize those processes that have direct influence on the customer expectations you identified before.
28
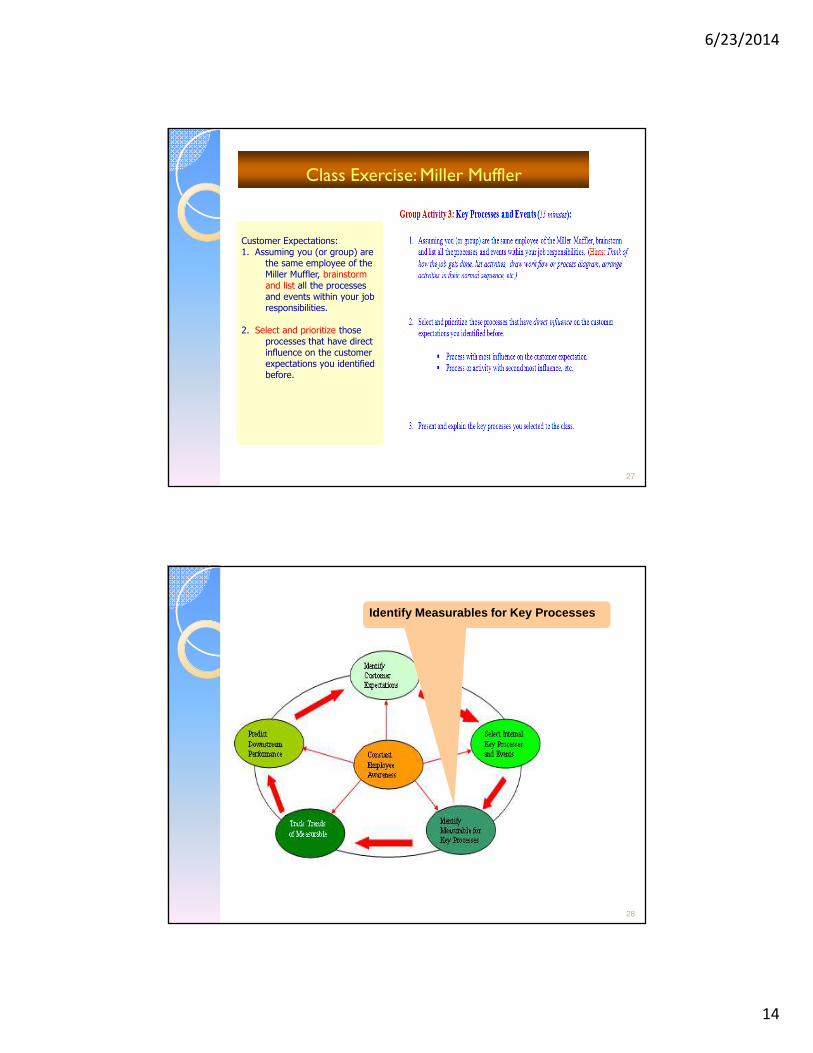
Identify Measurables for Key Processes
6/23/2014
15
29
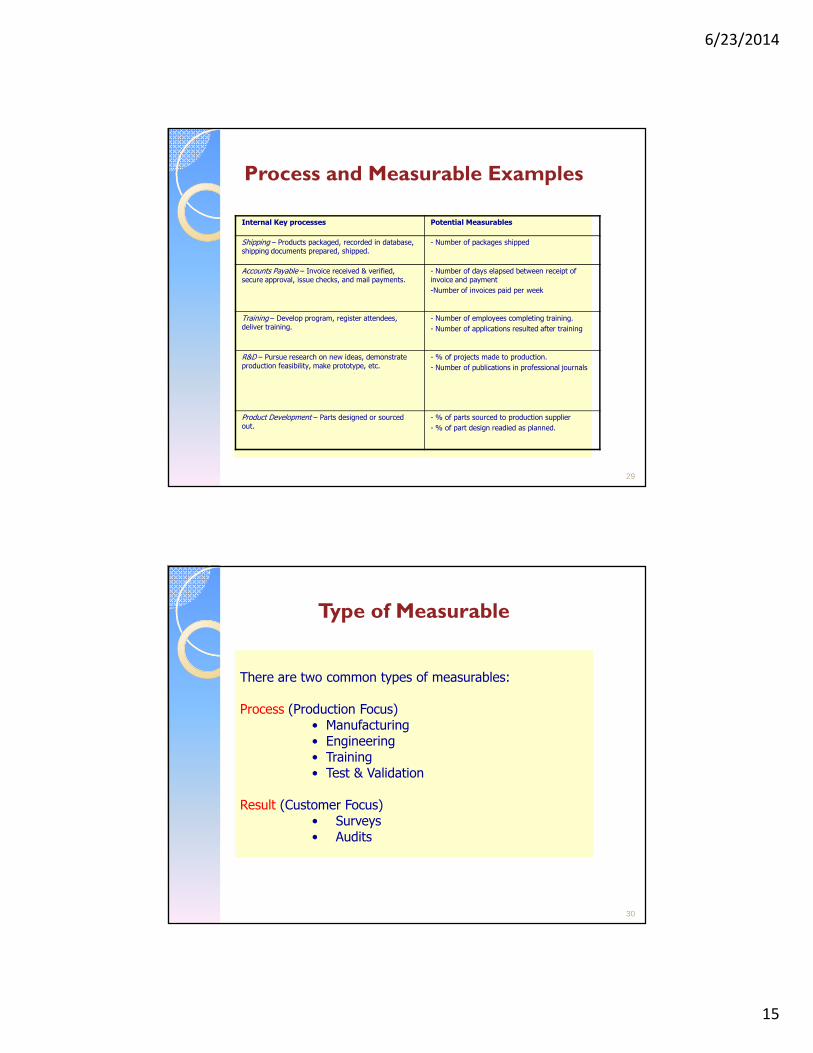
Process and Measurable Examples
Internal Key processes Potential Measurables
Shipping – Products packaged, recorded in database, shipping documents prepared, shipped.
- Number of packages shipped
Accounts Payable – Invoice received & verified, secure approval, issue checks, and mail payments.
- Number of days elapsed between receipt of invoice and payment
-Number of invoices paid per week
Training – Develop program, register attendees, deliver training.
- Number of employees completing training.
- Number of applications resulted after training
R&D – Pursue research on new ideas, demonstrate production feasibility, make prototype, etc.
- % of projects made to production.
- Number of publications in professional journals
Product Development – Parts designed or sourced out.
- % of parts sourced to production supplier
- % of part design readied as planned.
30
Type of Measurable
There are two common types of measurables:
Process (Production Focus)• Manufacturing• Engineering • Training• Test & Validation
Result (Customer Focus)• Surveys• Audits
There are two common types of measurables:
Process (Production Focus)• Manufacturing• Engineering • Training• Test & Validation
Result (Customer Focus)• Surveys• Audits
6/23/2014
16
31
Characteristics of Measurables
32
Class Exercise: Miller Muffler
Measurables for Key Internal Processes:
1. Chose one of your key internal processes. Write a brief (3 – 5 sentences) description of the process including the goal or outcome of this activity.
2. Brainstorm and list some measurables that could be used to indicate how well that process is being accomplished.
6/23/2014
17
34
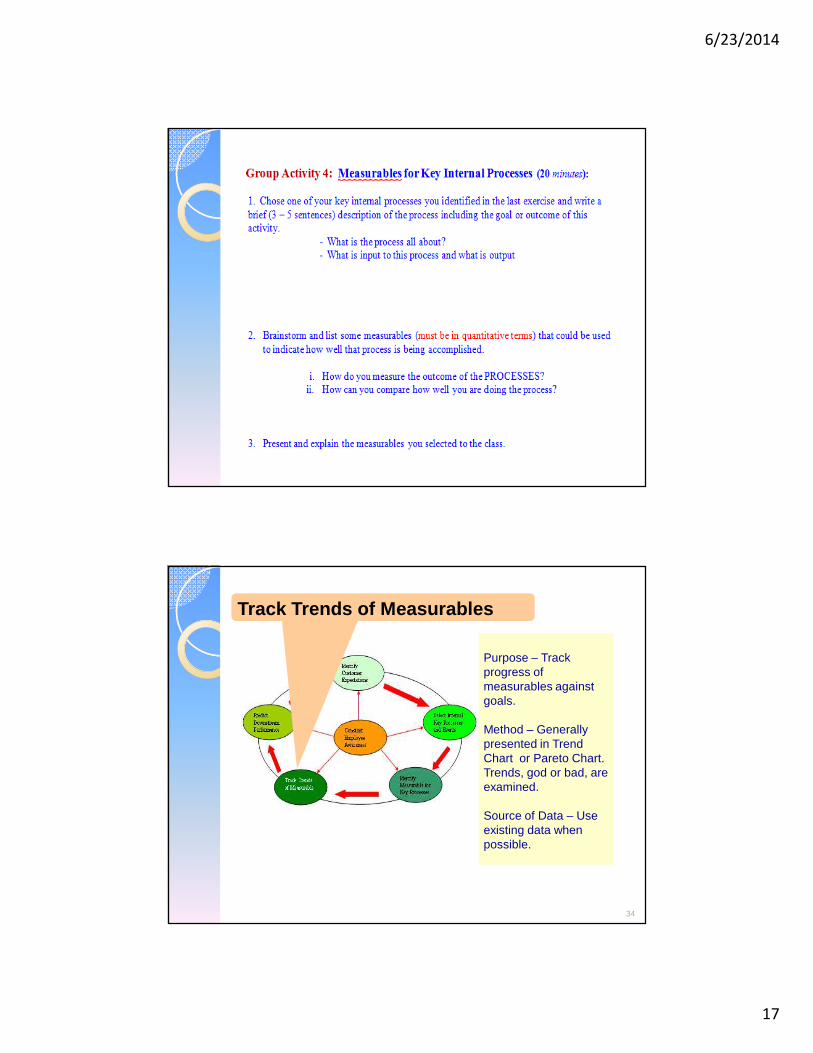
Track Trends of Measurables
Purpose – Track progress of measurables against goals.
Method – Generally presented in Trend Chart or Pareto Chart. Trends, god or bad, are examined.
Source of Data – Use existing data when possible.
Purpose – Track progress of measurables against goals.
Method – Generally presented in Trend Chart or Pareto Chart. Trends, god or bad, are examined.
Source of Data – Use existing data when possible.
6/23/2014
18
35
Charts and Diagrams
36
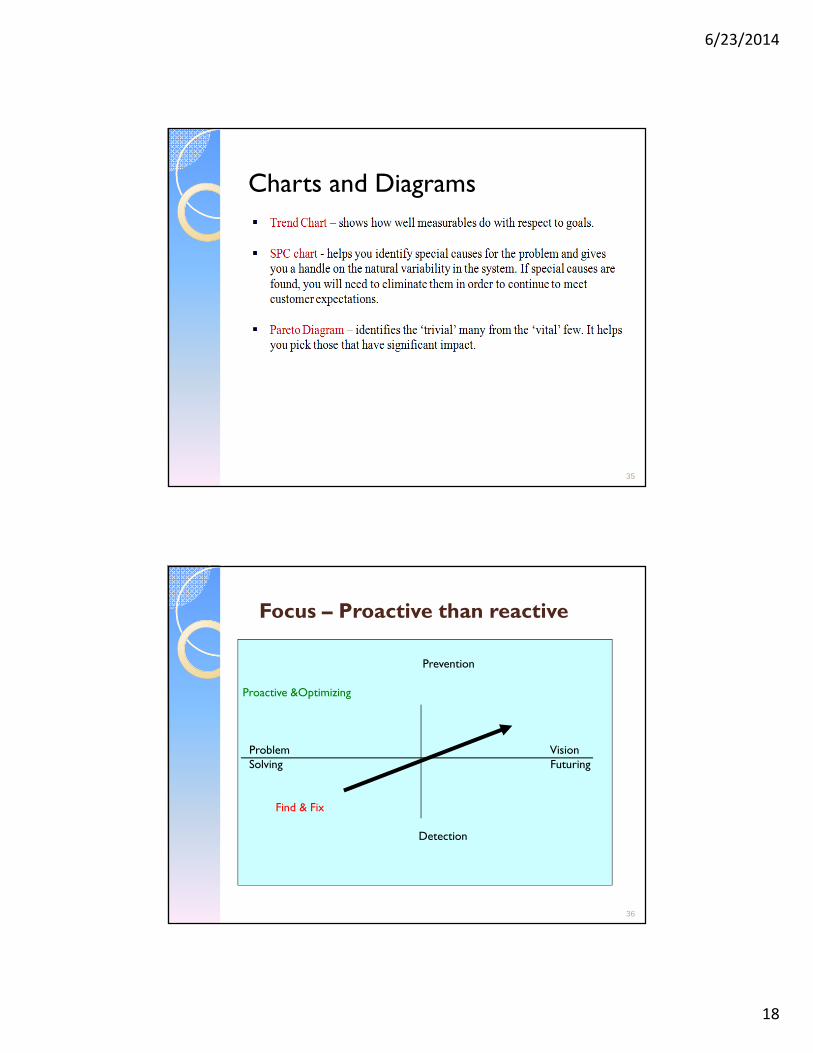
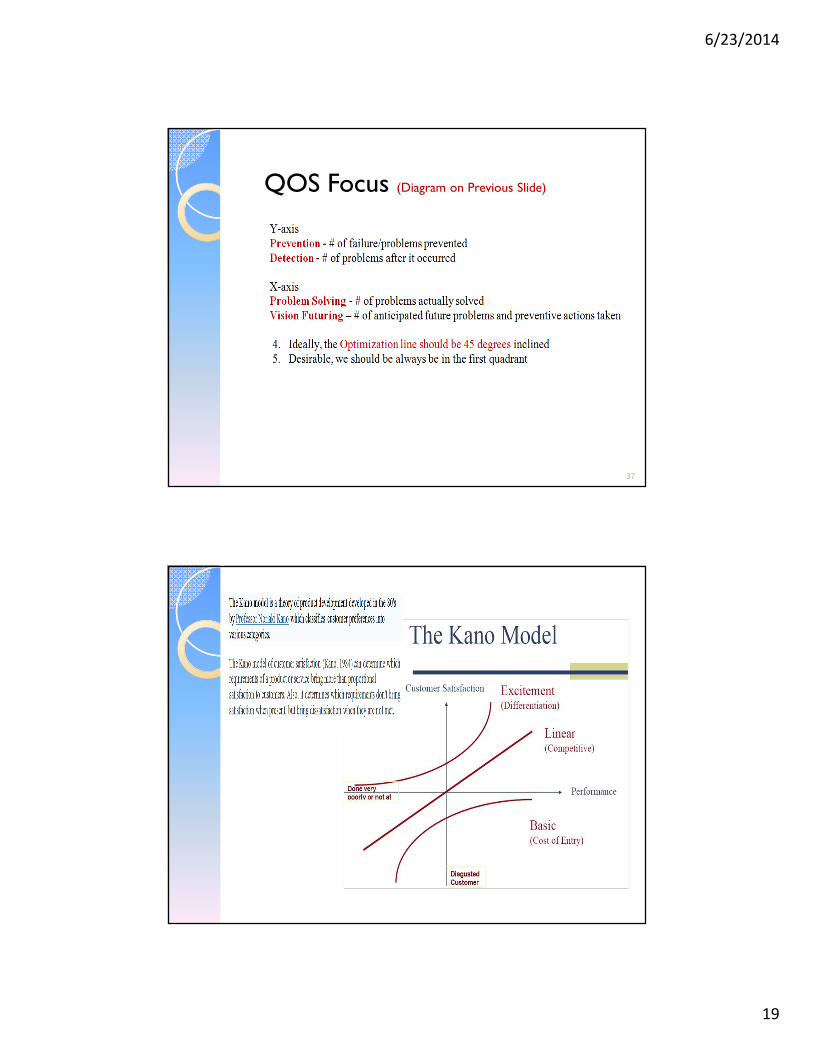
Focus – Proactive than reactive
Prevention
Proactive &Optimizing
Problem VisionSolving Futuring
Find & Fix
Detection
6/23/2014
19
37
QOS Focus (Diagram on Previous Slide)
6/23/2014
20
40
Predict Downstream Performances
6/23/2014
21
Nutek, Inc. Basic Tools for Quality Improvement Basic Tools for Quality Improvement www.Nutek-us.com Update: 0904 Slide 41
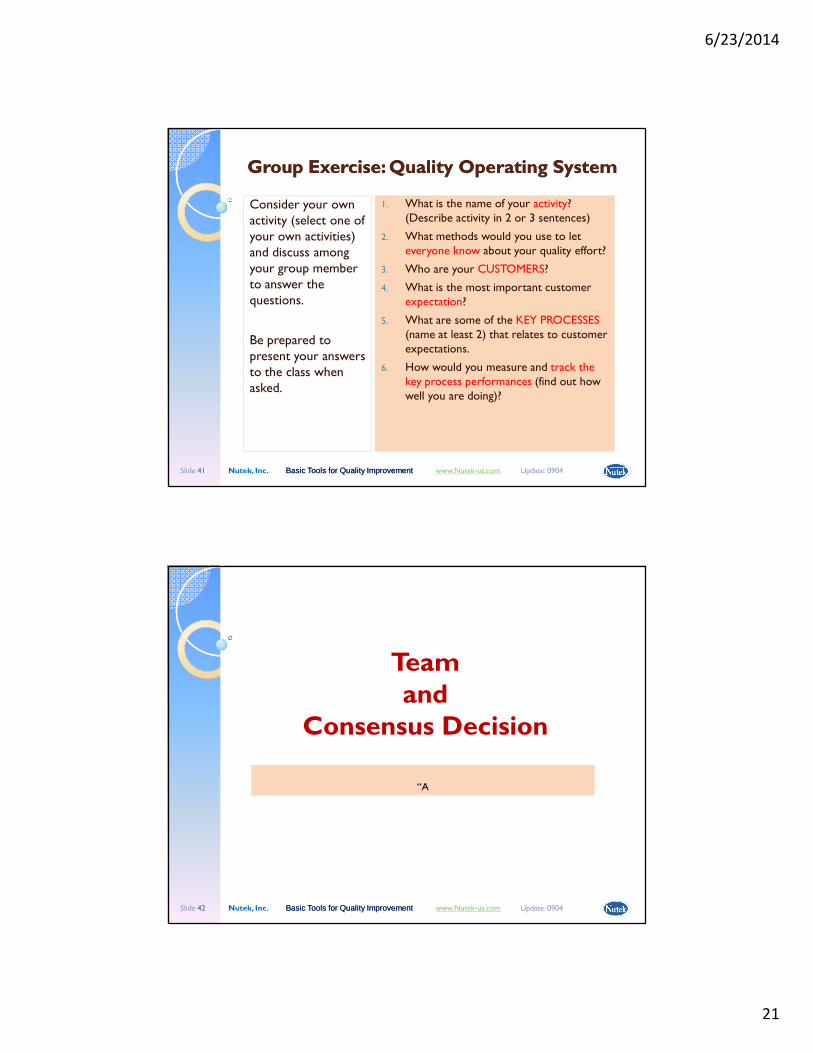
Group Exercise: Quality Operating SystemGroup Exercise: Quality Operating System
Consider your own activity (select one of your own activities) and discuss among your group member to answer the questions.
Be prepared to present your answers to the class when asked.
1. What is the name of your activity? (Describe activity in 2 or 3 sentences)
2. What methods would you use to let everyone know about your quality effort?
3. Who are your CUSTOMERS?
4. What is the most important customer expectation?
5. What are some of the KEY PROCESSES (name at least 2) that relates to customer expectations.
6. How would you measure and track the key process performances (find out how well you are doing)?
Nutek, Inc. Basic Tools for Quality Improvement Basic Tools for Quality Improvement www.Nutek-us.com Update: 0904 Slide 42
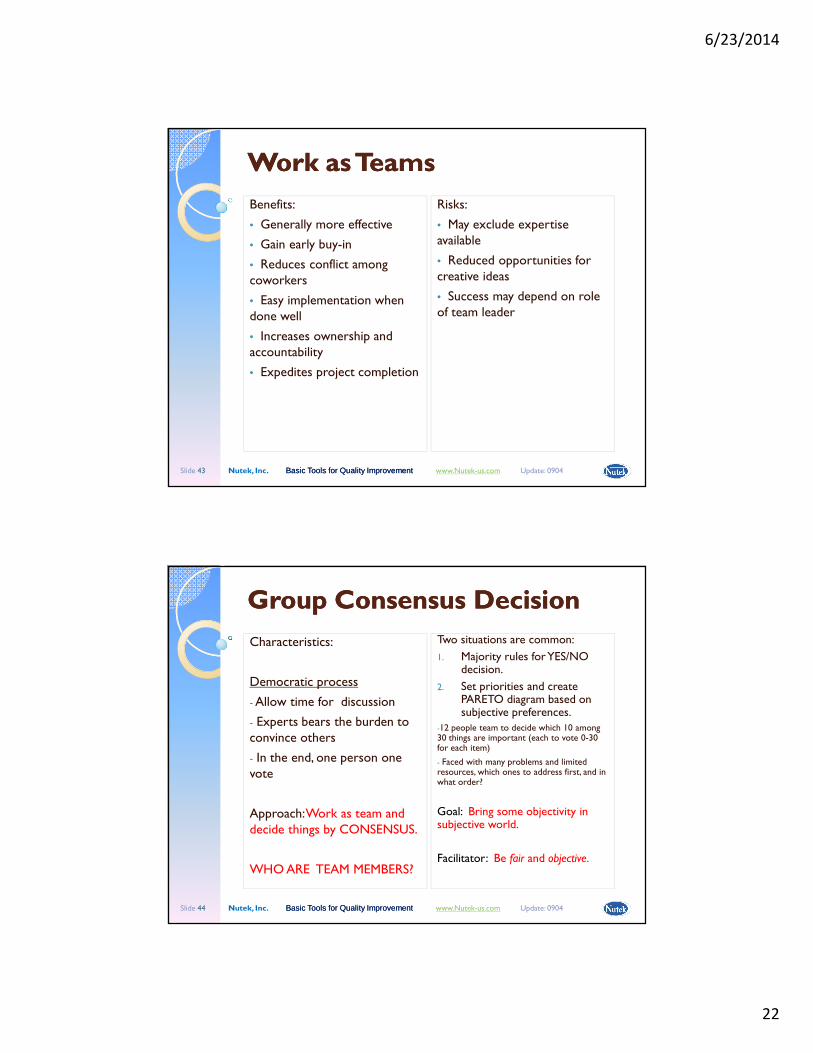
Team and
Consensus Decision
“A
6/23/2014
22
Nutek, Inc. Basic Tools for Quality Improvement Basic Tools for Quality Improvement www.Nutek-us.com Update: 0904 Slide 43
Work as TeamsWork as Teams
Benefits:
• Generally more effective
• Gain early buy-in
• Reduces conflict among coworkers
• Easy implementation when done well
• Increases ownership and accountability
• Expedites project completion
Risks:
• May exclude expertise available
• Reduced opportunities for creative ideas
• Success may depend on role of team leader
Nutek, Inc. Basic Tools for Quality Improvement Basic Tools for Quality Improvement www.Nutek-us.com Update: 0904 Slide 44
Group Consensus DecisionGroup Consensus Decision
Characteristics:
Democratic process
-Allow time for discussion
- Experts bears the burden to convince others
- In the end, one person one vote
Approach: Work as team and decide things by CONSENSUS.
WHO ARE TEAM MEMBERS?
Two situations are common:
1. Majority rules for YES/NO decision.
2. Set priorities and create PARETO diagram based on subjective preferences.
-12 people team to decide which 10 among 30 things are important (each to vote 0-30 for each item)
- Faced with many problems and limited resources, which ones to address first, and in what order?
Goal: Bring some objectivity in subjective world.
Facilitator: Be fair and objective.
6/23/2014
23
Nutek, Inc. Basic Tools for Quality Improvement Basic Tools for Quality Improvement www.Nutek-us.com Update: 0904 Slide 45
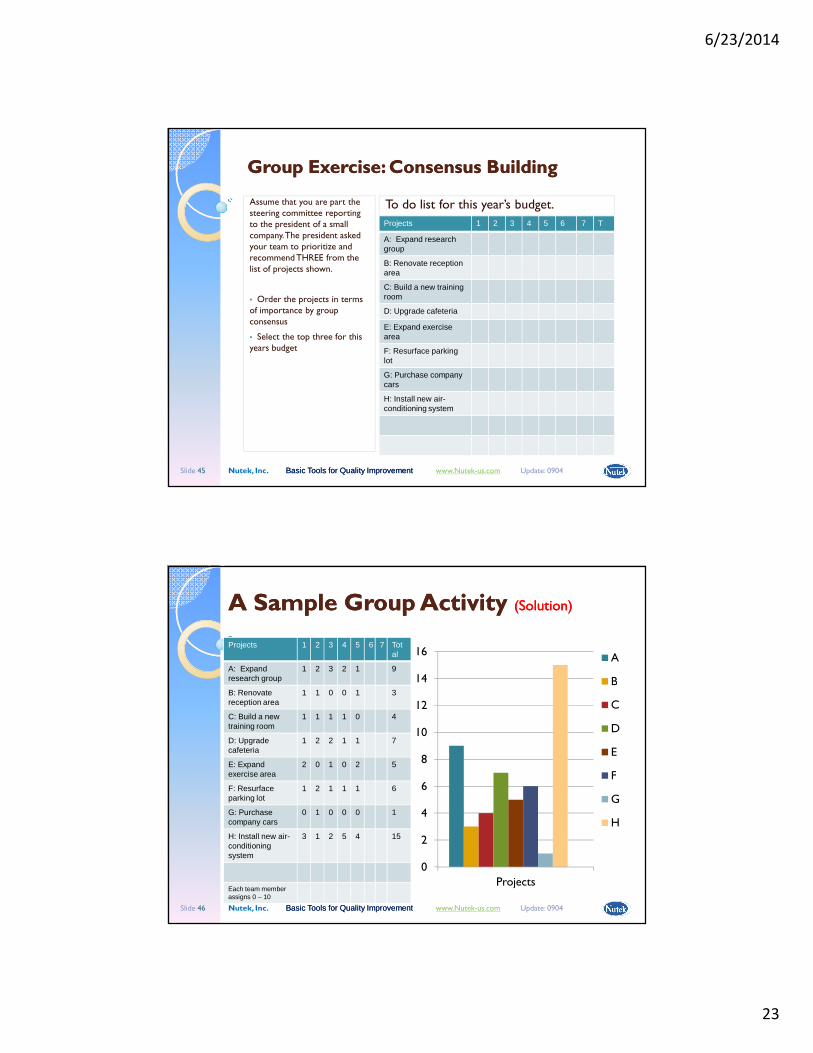
Group Exercise: Consensus BuildingGroup Exercise: Consensus Building
Assume that you are part the steering committee reporting to the president of a small company. The president asked your team to prioritize and recommend THREE from the list of projects shown.
• Order the projects in terms of importance by group consensus
• Select the top three for this years budget
To do list for this year’s budget.
Projects 1 2 3 4 5 6 7 T
A: Expand research group
B: Renovate reception area
C: Build a new training room
D: Upgrade cafeteria
E: Expand exercise area
F: Resurface parking lot
G: Purchase company cars
H: Install new air-conditioning system
Nutek, Inc. Basic Tools for Quality Improvement Basic Tools for Quality Improvement www.Nutek-us.com Update: 0904 Slide 46
A Sample Group Activity A Sample Group Activity (Solution)(Solution)
Projects 1 2 3 4 5 6 7 Total
A: Expand research group
1 2 3 2 1 9
B: Renovate reception area
1 1 0 0 1 3
C: Build a new training room
1 1 1 1 0 4
D: Upgrade cafeteria
1 2 2 1 1 7
E: Expand exercise area
2 0 1 0 2 5
F: Resurface parking lot
1 2 1 1 1 6
G: Purchase company cars
0 1 0 0 0 1
H: Install new air-conditioning system
3 1 2 5 4 15
Each team member assigns 0 – 10
0
2
4
6
8
10
12
14
16
Projects
A
B
C
D
E
F
G
H
6/23/2014
24
Nutek, Inc. Basic Tools for Quality Improvement Basic Tools for Quality Improvement www.Nutek-us.com Update: 0904 Slide 47
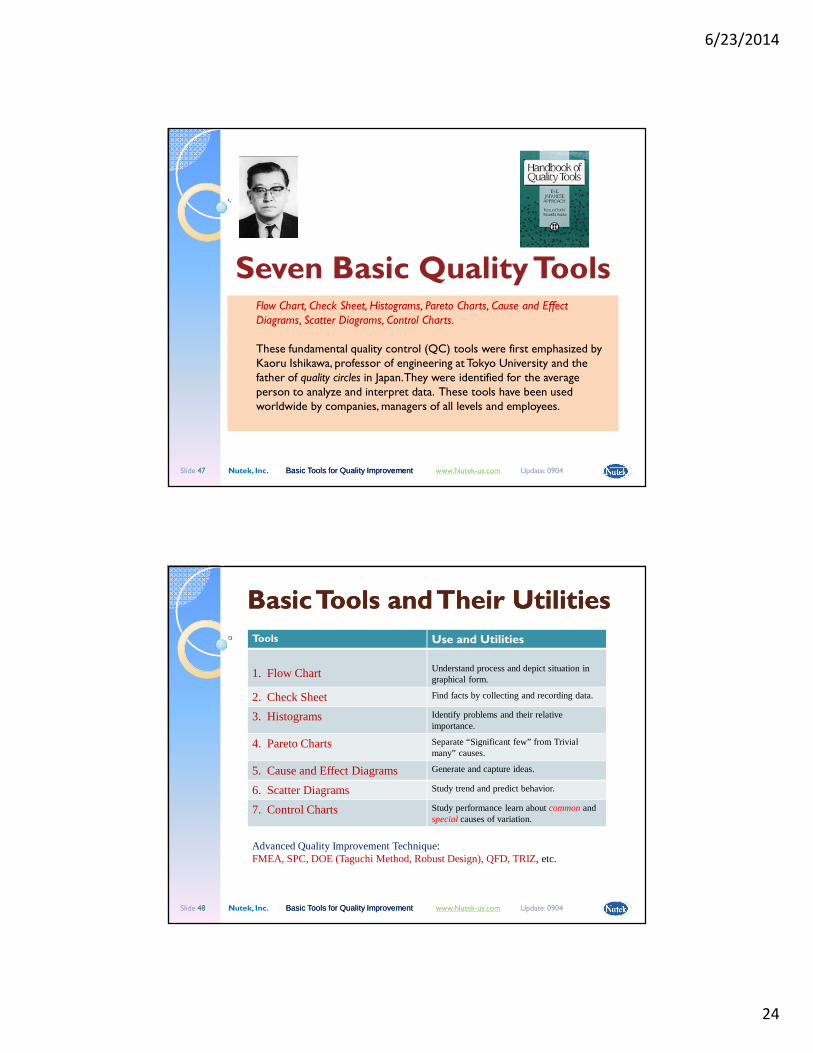
Seven Basic Quality ToolsFlow Chart, Check Sheet, Histograms, Pareto Charts, Cause and Effect Diagrams, Scatter Diagrams, Control Charts.
These fundamental quality control (QC) tools were first emphasized by Kaoru Ishikawa, professor of engineering at Tokyo University and the father of quality circles in Japan. They were identified for the average person to analyze and interpret data. These tools have been used worldwide by companies, managers of all levels and employees.
Nutek, Inc. Basic Tools for Quality Improvement Basic Tools for Quality Improvement www.Nutek-us.com Update: 0904 Slide 48
Basic Tools and Their UtilitiesBasic Tools and Their Utilities
Tools Use and Utilities
1. Flow Chart Understand process and depict situation in graphical form.
2. Check Sheet Find facts by collecting and recording data.
3. Histograms Identify problems and their relative importance.
4. Pareto Charts Separate “Significant few” from Trivial many” causes.
5. Cause and Effect Diagrams Generate and capture ideas.
6. Scatter Diagrams Study trend and predict behavior.
7. Control Charts Study performance learn about common and special causes of variation.
Advanced Quality Improvement Technique:FMEA, SPC, DOE (Taguchi Method, Robust Design), QFD, TRIZ, etc.
6/23/2014
25
Nutek, Inc. Basic Tools for Quality Improvement Basic Tools for Quality Improvement www.Nutek-us.com Update: 0904 Slide 49
1. Flowchart
“A flowchart (also spelled flow-chart and flow chart) is a schematic representation of an algorithm or a process.” -Wikepedia
The process flowchart was first introduced by Frnak Gilbreth in 1921. He used it show as a graphical and structured method for documenting process
activities.
Nutek, Inc. Basic Tools for Quality Improvement Basic Tools for Quality Improvement www.Nutek-us.com Update: 0904 Slide 50
Flow Charts:Flow Charts:Understanding and Communicating How a Process WorksUnderstanding and Communicating How a Process Works
Also known as Process Maps and Process Flow Diagrams
Flow charts are useful tools for communicating how processes work, and for clearly documenting how a particular job is done. It is an effective way to clarify understanding of the process, and helps thinking about where the process can be improved.
It can be used to:
• Define and analyze processes
• Build a step-by-step picture of the process for analysis, discussion, or communication
• Define, standardize or find areas for improvement in a process
Most flow charts are made up of three symbols:
Elongated circles, which signify the start or end of a process;
Rectangles, which show instructions or actions; and
Diamonds, which show decisionsthat must be made
Within each symbol, write down what the symbol represents. This could be the start or finish of the process, the action to be taken, or the decision to be made.
Symbols are connected one to the other by arrows, showing the flow of the process.
Start/Finish
Start/Finish
Decisions
Instructions/Actions
6/23/2014
26
Nutek, Inc. Basic Tools for Quality Improvement Basic Tools for Quality Improvement www.Nutek-us.com Update: 0904 Slide 51
Example: Prescription Medicine Example: Prescription Medicine
In typical run to the drug store, the activities include:
• Drop off prescription
• Shop around while the prescription is being filled (or do other things)
• Check to see if prescription is filled
• Pick up medicine if it is ready
This can be shown in a flowchart as shown at right.
Yes
Start
Pick up medicine
End
Shop around
Drop Prescription to pharmacy
No
Nutek, Inc. Basic Tools for Quality Improvement Basic Tools for Quality Improvement www.Nutek-us.com Update: 0904 Slide 52
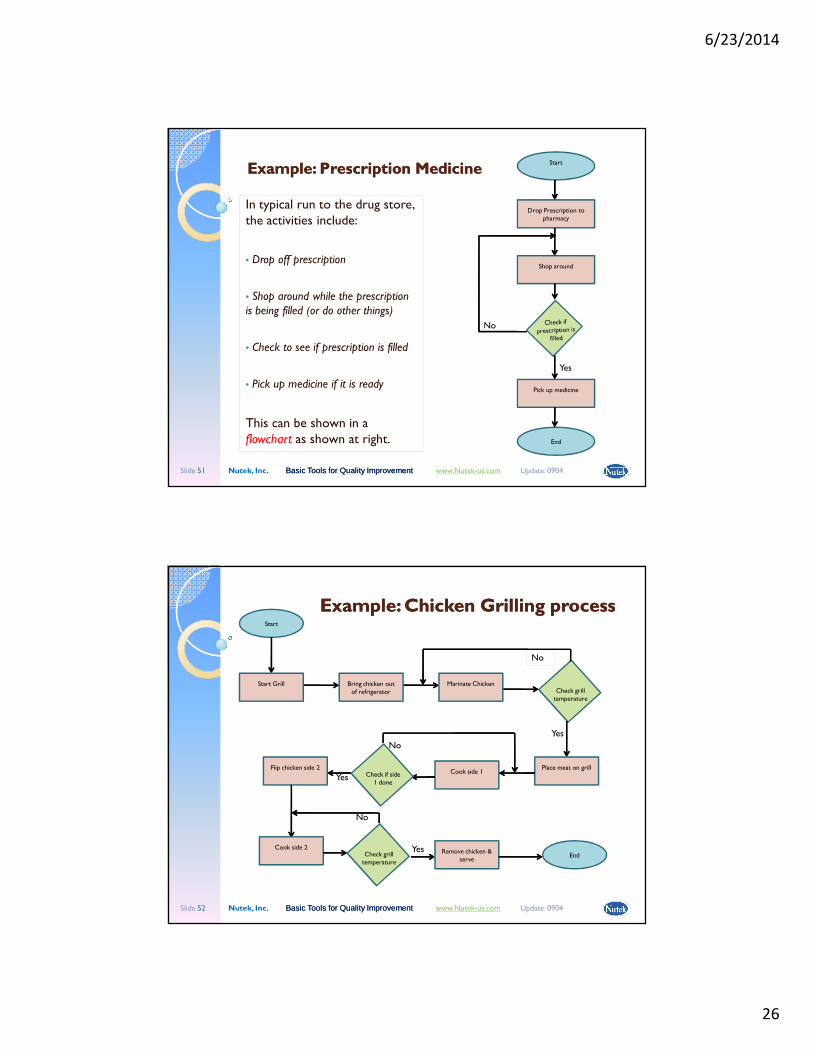
Example: Chicken Grilling processExample: Chicken Grilling process
No
No
Start
Check grill temperature
Flip chicken side 2
End
Cook side 1Place meat on grill
Marinate ChickenBring chicken out of refrigerator
Start Grill
Check grill temperature
Check if side 1 done
Cook side 2Remove chicken &
serve
No
Yes
Yes
Yes
6/23/2014
27
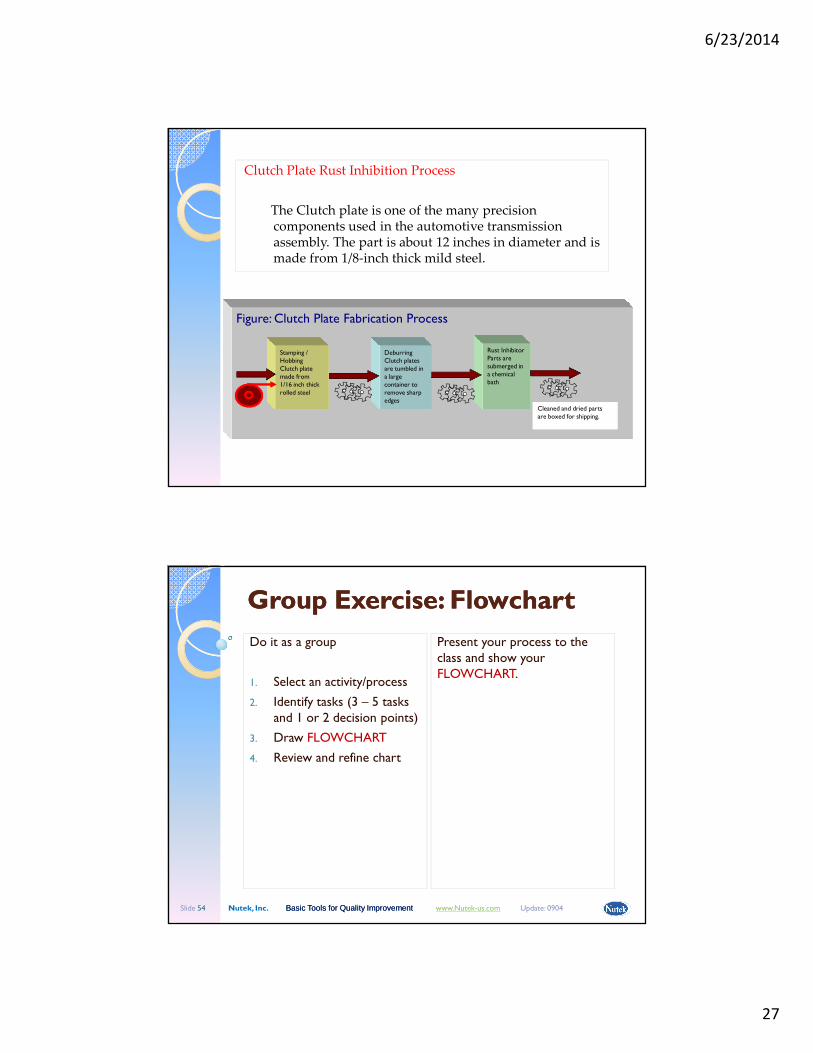
Clutch Plate Rust Inhibition Process
The Clutch plate is one of the many precision components used in the automotive transmission assembly. The part is about 12 inches in diameter and is made from 1/8-inch thick mild steel.
Figure: Clutch Plate Fabrication Process
Stamping /HobbingClutch plate made from 1/16 inch thick rolled steel
DeburringClutch plates are tumbled in a large container to remove sharp edges
Rust InhibitorParts are submerged in a chemical bath
Cleaned and dried parts are boxed for shipping.Cleaned and dried parts are boxed for shipping.
Nutek, Inc. Basic Tools for Quality Improvement Basic Tools for Quality Improvement www.Nutek-us.com Update: 0904 Slide 54
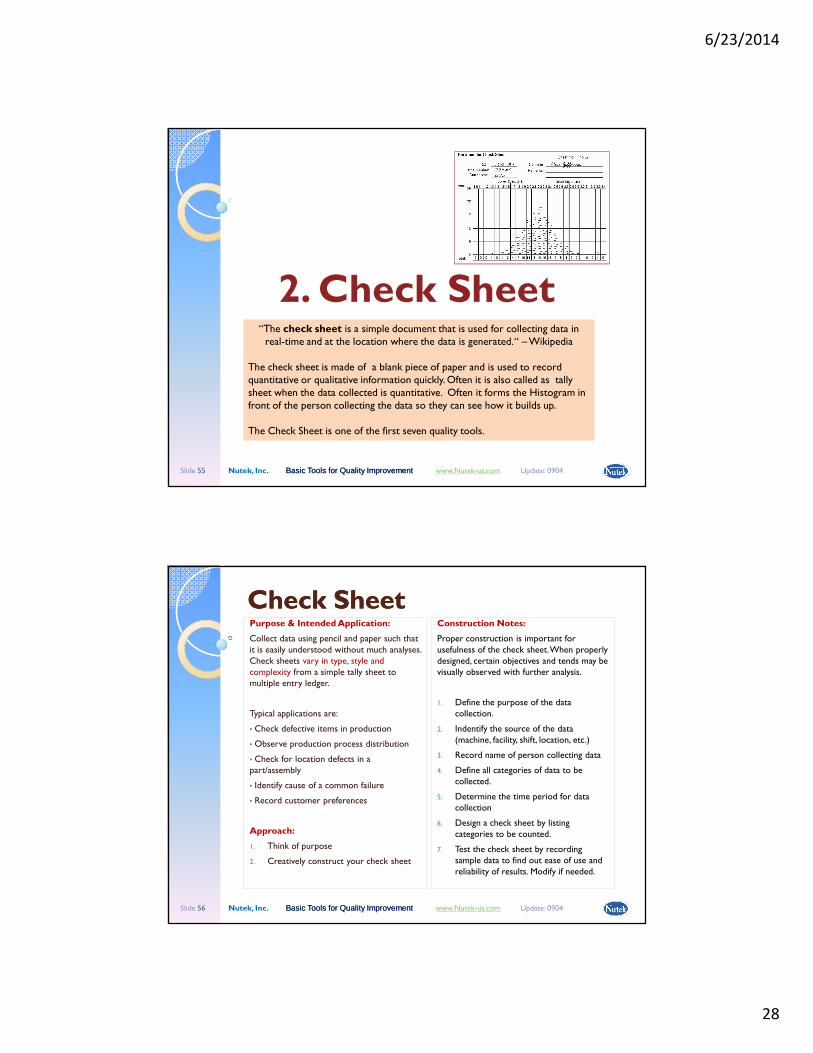
Group Exercise: FlowchartGroup Exercise: Flowchart
Do it as a group
1. Select an activity/process
2. Identify tasks (3 – 5 tasks and 1 or 2 decision points)
3. Draw FLOWCHART
4. Review and refine chart
Present your process to the class and show your FLOWCHART.
6/23/2014
28
Nutek, Inc. Basic Tools for Quality Improvement Basic Tools for Quality Improvement www.Nutek-us.com Update: 0904 Slide 55
2. Check Sheet“The check sheet is a simple document that is used for collecting data in real-time and at the location where the data is generated. “ –Wikipedia
The check sheet is made of a blank piece of paper and is used to record quantitative or qualitative information quickly. Often it is also called as tally sheet when the data collected is quantitative. Often it forms the Histogram in front of the person collecting the data so they can see how it builds up.
The Check Sheet is one of the first seven quality tools.
Nutek, Inc. Basic Tools for Quality Improvement Basic Tools for Quality Improvement www.Nutek-us.com Update: 0904 Slide 56
Check SheetCheck SheetPurpose & Intended Application:
Collect data using pencil and paper such that it is easily understood without much analyses. Check sheets vary in type, style and complexity from a simple tally sheet to multiple entry ledger.
Typical applications are:
• Check defective items in production
• Observe production process distribution
• Check for location defects in a part/assembly
• Identify cause of a common failure
• Record customer preferences
Approach:
1. Think of purpose
2. Creatively construct your check sheet
Construction Notes:
Proper construction is important for usefulness of the check sheet. When properly designed, certain objectives and tends may be visually observed with further analysis.
1. Define the purpose of the data collection.
2. Indentify the source of the data (machine, facility, shift, location, etc.)
3. Record name of person collecting data
4. Define all categories of data to be collected.
5. Determine the time period for data collection
6. Design a check sheet by listing categories to be counted.
7. Test the check sheet by recording sample data to find out ease of use and reliability of results. Modify if needed.
6/23/2014
29
Nutek, Inc. Basic Tools for Quality Improvement Basic Tools for Quality Improvement www.Nutek-us.com Update: 0904 Slide 57
Deciding on Data to be CollectedDeciding on Data to be Collected
To determine categories and capture all necessary information in your check sheet, try to answer the following questions about the events.
•What is observed to have happened?•Who is affected and who might have caused it?•Where and when does it occur?• How long and how does it happen•To what extent does it affect or how much is required to make it happen•Etc.
Involve people who are familiar with the process and or make use of the data. It is a good idea to develop a consensus on what data to be collected.
It is worth remembering:
“Statistics do not lie, people do.”
Nutek, Inc. Basic Tools for Quality Improvement Basic Tools for Quality Improvement www.Nutek-us.com Update: 0904 Slide 58
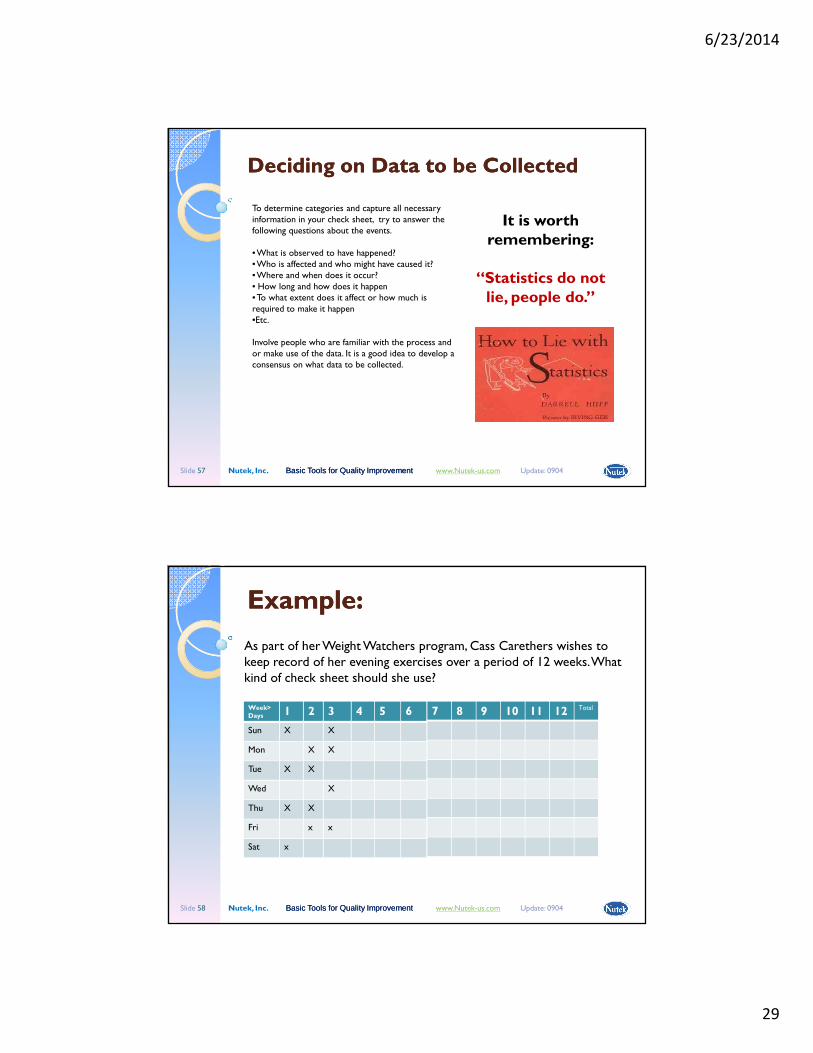
Example:Example:
As part of her Weight Watchers program, Cass Carethers wishes to keep record of her evening exercises over a period of 12 weeks. What kind of check sheet should she use?
Week>Days 1 2 3 4 5 6
Sun X X
Mon X X
Tue X X
Wed X
Thu X X
Fri x x
Sat x
7 8 9 10 11 12 Total
6/23/2014
30
Nutek, Inc. Basic Tools for Quality Improvement Basic Tools for Quality Improvement www.Nutek-us.com Update: 0904 Slide 59
Example: (Group Exercise)Example: (Group Exercise)
In a roll of dice, there is 1/6 probability that a particular number will appear. Statistically speaking, if the die is rolled a large number of times, each face/number has equal probability of occurrence which will displaying a uniform distribution. Create a check sheet to record such data.
Die faces: 1 2 3 4 5 6
Num
ber (
Fre
quen
cy o
f Occ
urre
nce)
Repeat the process by plotting the average of group. Watch what happens to the distribution (Central Limit Theorem – average is normally distributed even if the individual sample data is not.
Nutek, Inc. Basic Tools for Quality Improvement Basic Tools for Quality Improvement www.Nutek-us.com Update: 0904 Slide 60
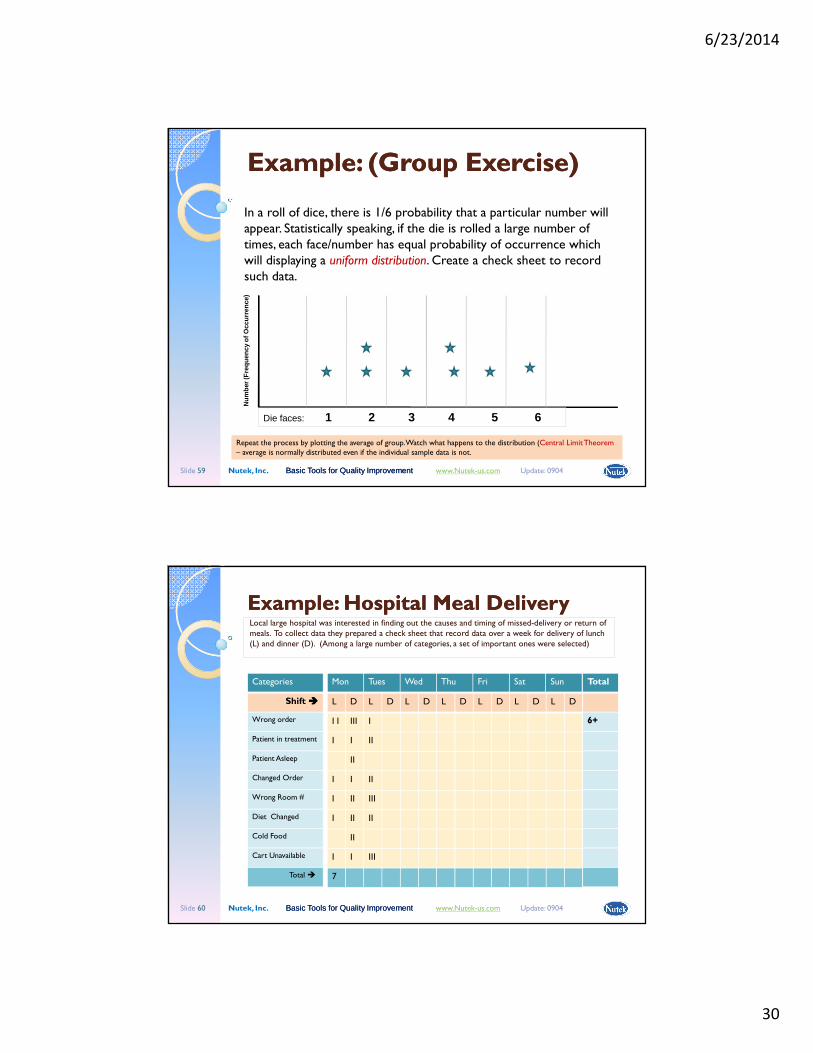
Example: Hospital Meal DeliveryExample: Hospital Meal DeliveryLocal large hospital was interested in finding out the causes and timing of missed-delivery or return of meals. To collect data they prepared a check sheet that record data over a week for delivery of lunch (L) and dinner (D). (Among a large number of categories, a set of important ones were selected)
Categories
Shift ����
Wrong order
Patient in treatment
Patient Asleep
Changed Order
Wrong Room #
Diet Changed
Cold Food
Cart Unavailable
Total �
Mon Tues Wed Thu Fri Sat Sun Total
6+
L D L D L D L D L D L D L D
I I III I
I I II
II
I I II
I II III
I II II
II
I I III
7
6/23/2014
31
Nutek, Inc. Basic Tools for Quality Improvement Basic Tools for Quality Improvement www.Nutek-us.com Update: 0904 Slide 61
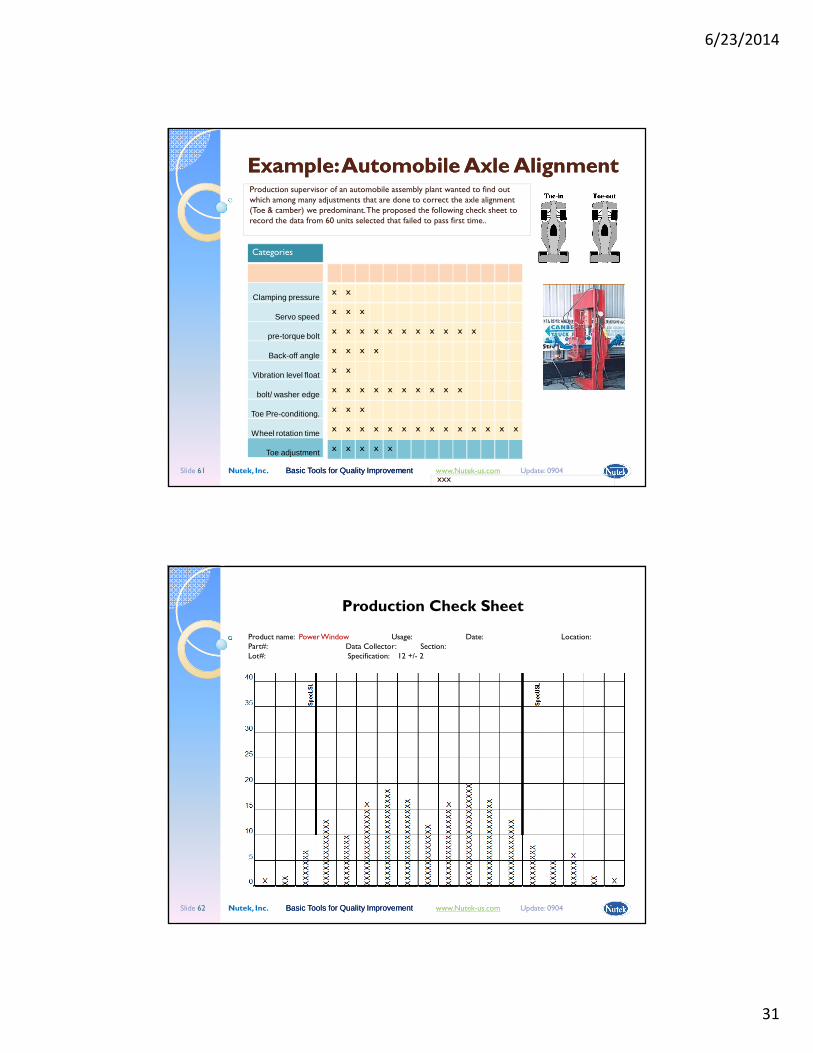
Example: Automobile Axle AlignmentExample: Automobile Axle AlignmentProduction supervisor of an automobile assembly plant wanted to find out which among many adjustments that are done to correct the axle alignment (Toe & camber) we predominant. The proposed the following check sheet to record the data from 60 units selected that failed to pass first time..
xxx
Categories
Clamping pressure
Servo speed
pre-torque bolt
Back-off angle
Vibration level float
bolt/ washer edge
Toe Pre-conditiong.
Wheel rotation time
Toe adjustment
x x
x x x
x x x x x x x x x x x
x x x x
x x
x x x x x x x x x x
x x x
x x x x x x x x x x x x x x
x x x x x
Nutek, Inc. Basic Tools for Quality Improvement Basic Tools for Quality Improvement www.Nutek-us.com Update: 0904 Slide 62
Production Check Sheet
Product name: Power Window Usage: Date: Location:Part#: Data Collector: Section: Lot#: Specification: 12 +/- 2
6/23/2014
32
Nutek, Inc. Basic Tools for Quality Improvement Basic Tools for Quality Improvement www.Nutek-us.com Update: 0904 Slide 63
Other areas of ApplicationsOther areas of Applications
• Customer support group of popular consumer products (Computer, phone system, TV, appliances, etc) use CHECK SHEET to document the frequency of customer call throughout the day. This data allows them to allocate support personnel properly.
• Large grocery retailers can use CHECK SHEET to determine demands of certain products during the week and schedule stocking requirements.
• Emergency room of busy hospital can keep track of patients and type of problems using CHECK SHEET. This data then can be utilized to schedule care giving physicians and nurses appropriately.
Nutek, Inc. Basic Tools for Quality Improvement Basic Tools for Quality Improvement www.Nutek-us.com Update: 0904 Slide 64
Group Exercise: Check SheetGroup Exercise: Check Sheet
Do it as a group
1. Select an activity/process for which you wish to collect data
2. Identify performance and its measure
3. Design Check Sheet
4. Review and refine chart
Present your data collection scheme to the class.
6/23/2014
33
Nutek, Inc. Basic Tools for Quality Improvement Basic Tools for Quality Improvement www.Nutek-us.com Update: 0904 Slide 65
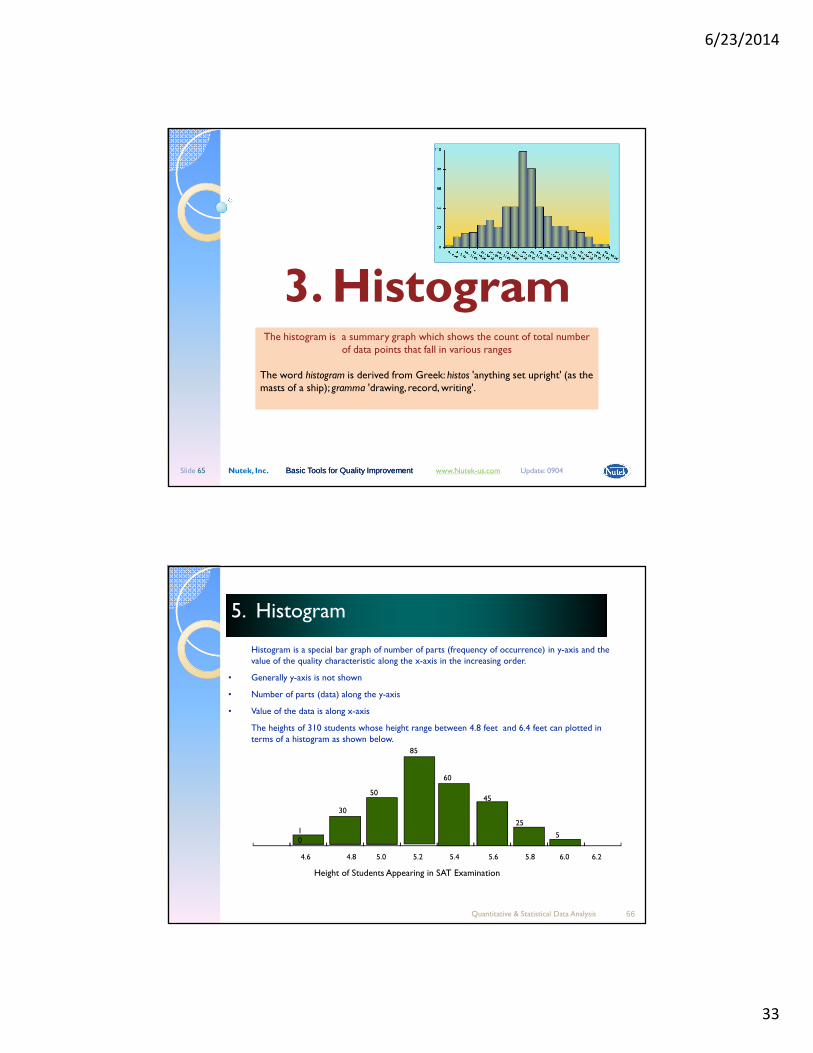
3. HistogramThe histogram is a summary graph which shows the count of total number
of data points that fall in various ranges
The word histogram is derived from Greek: histos 'anything set upright' (as the masts of a ship); gramma 'drawing, record, writing'.
Quantitative & Statistical Data Analysis 66
5. Histogram5. Histogram
Histogram is a special bar graph of number of parts (frequency of occurrence) in y-axis and the value of the quality characteristic along the x-axis in the increasing order.
• Generally y-axis is not shown
• Number of parts (data) along the y-axis
• Value of the data is along x-axis
The heights of 310 students whose height range between 4.8 feet and 6.4 feet can plotted in terms of a histogram as shown below.
4.6 4.8 5.0 5.2 5.4 5.6 5.8 6.0 6.2
Height of Students Appearing in SAT Examination
85
50
60
30
1 0
45
5
25
6/23/2014
34
Quantitative & Statistical Data Analysis 67
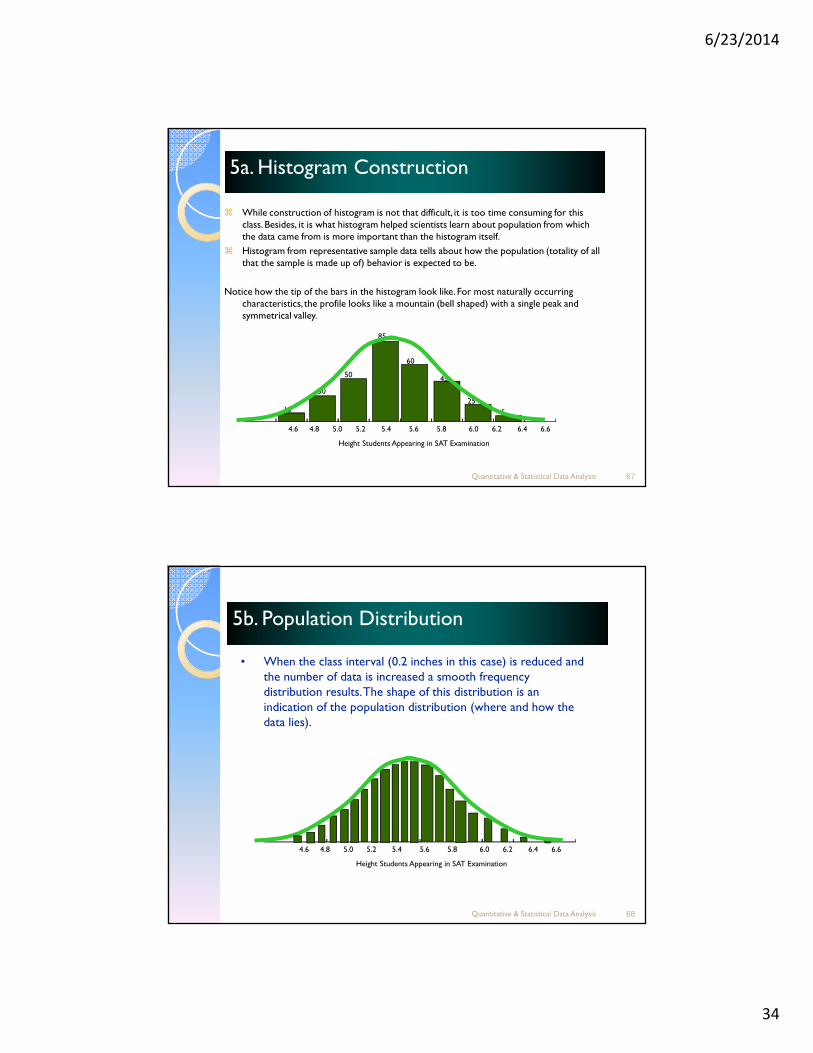
� While construction of histogram is not that difficult, it is too time consuming for this class. Besides, it is what histogram helped scientists learn about population from which the data came from is more important than the histogram itself.
� Histogram from representative sample data tells about how the population (totality of all that the sample is made up of) behavior is expected to be.
Notice how the tip of the bars in the histogram look like. For most naturally occurring characteristics, the profile looks like a mountain (bell shaped) with a single peak and symmetrical valley.
5a. Histogram Construction5a. Histogram Construction
4.6 4.8 5.0 5.2 5.4 5.6 5.8 6.0 6.2 6.4 6.6
Height Students Appearing in SAT Examination
85
50
60
30
10
45
5
25
Quantitative & Statistical Data Analysis 68
5b. Population Distribution5b. Population Distribution
• When the class interval (0.2 inches in this case) is reduced and the number of data is increased a smooth frequency distribution results. The shape of this distribution is an indication of the population distribution (where and how the data lies).
4.6 4.8 5.0 5.2 5.4 5.6 5.8 6.0 6.2 6.4 6.6
Height Students Appearing in SAT Examination
6/23/2014
35
Quantitative & Statistical Data Analysis 69
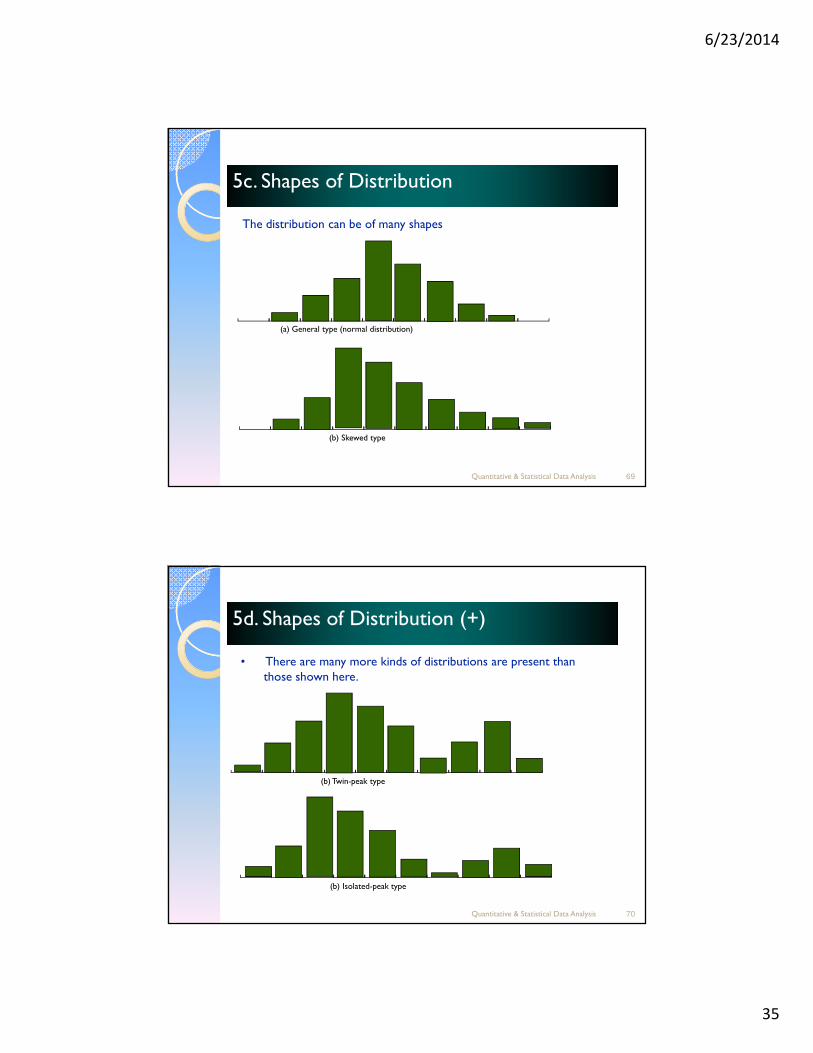
5c. Shapes of Distribution5c. Shapes of Distribution
The distribution can be of many shapes
(a) General type (normal distribution)
(b) Skewed type
Quantitative & Statistical Data Analysis 70
• There are many more kinds of distributions are present than those shown here.
(b) Twin-peak type
(b) Isolated-peak type
5d. Shapes of Distribution (+)5d. Shapes of Distribution (+)
6/23/2014
36
Nutek, Inc. Basic Tools for Quality Improvement Basic Tools for Quality Improvement www.Nutek-us.com Update: 0904 Slide 71
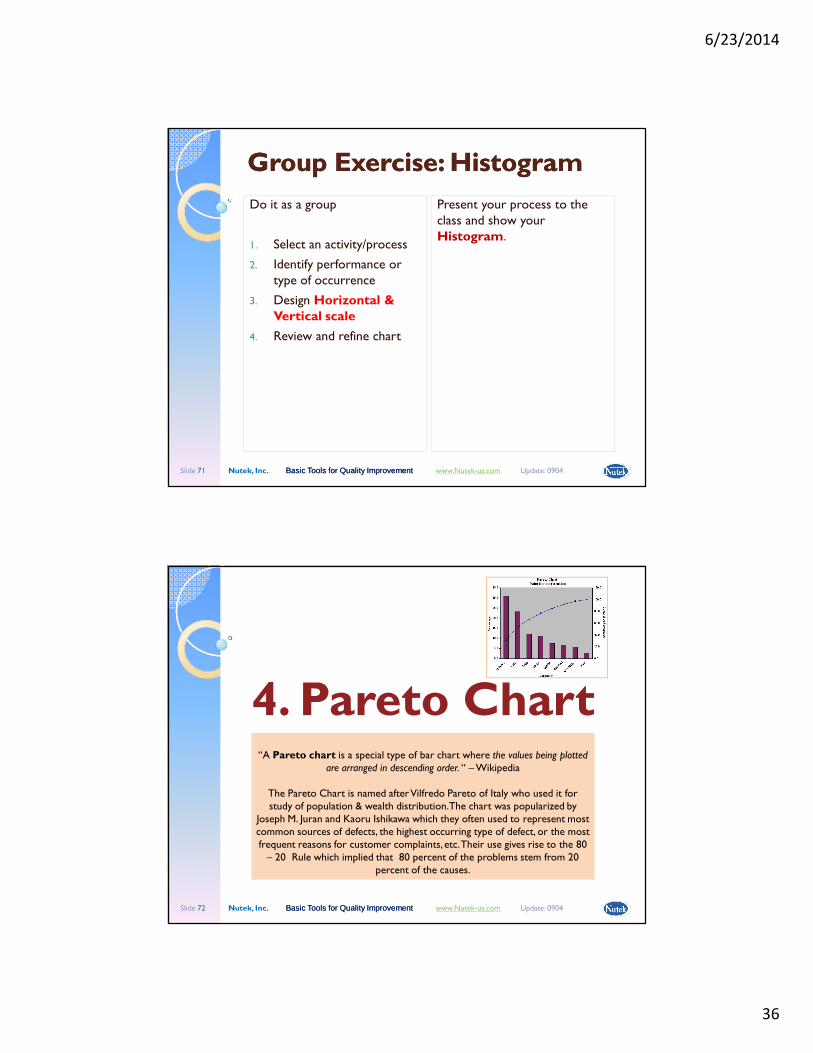
Group Exercise: HistogramGroup Exercise: Histogram
Do it as a group
1. Select an activity/process
2. Identify performance or type of occurrence
3. Design Horizontal & Vertical scale
4. Review and refine chart
Present your process to the class and show your Histogram.
Nutek, Inc. Basic Tools for Quality Improvement Basic Tools for Quality Improvement www.Nutek-us.com Update: 0904 Slide 72
4. Pareto Chart“A Pareto chart is a special type of bar chart where the values being plotted
are arranged in descending order. “ –Wikipedia
The Pareto Chart is named after Vilfredo Pareto of Italy who used it for study of population & wealth distribution. The chart was popularized by
Joseph M. Juran and Kaoru Ishikawa which they often used to represent most common sources of defects, the highest occurring type of defect, or the most frequent reasons for customer complaints, etc. Their use gives rise to the 80 – 20 Rule which implied that 80 percent of the problems stem from 20
percent of the causes.
6/23/2014
37
10/25/2001 Quantitative & Statistical Data Analysis 73
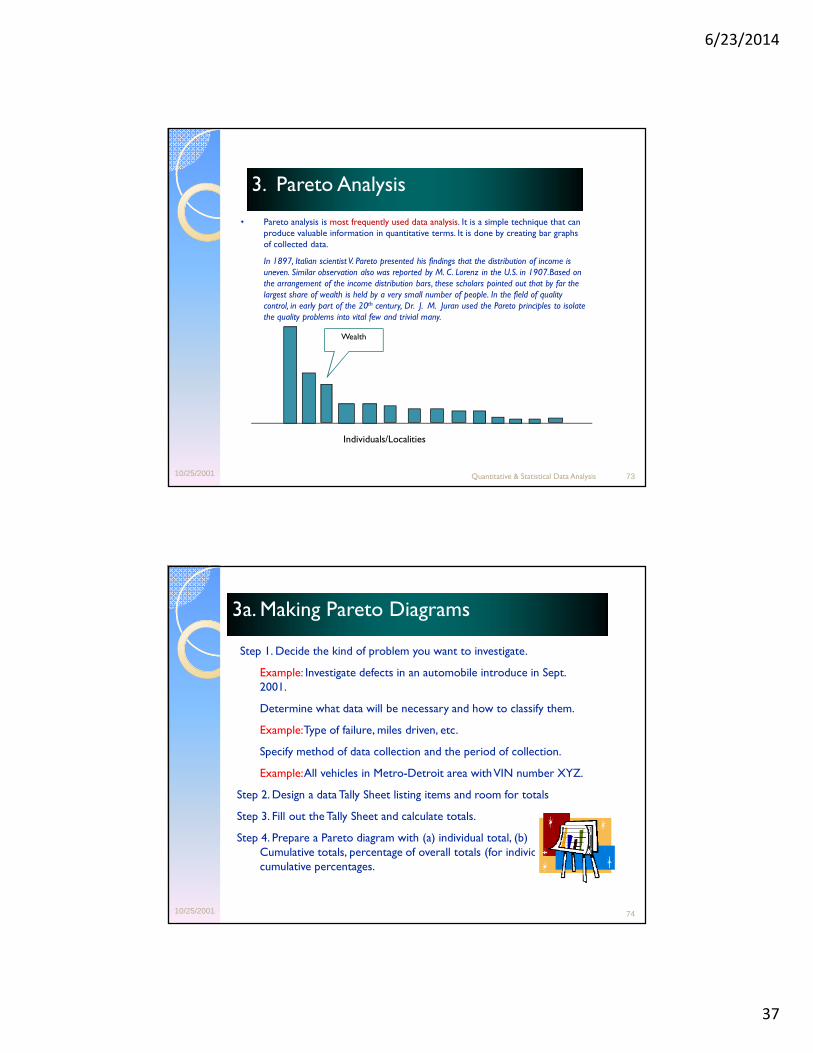
3. Pareto Analysis3. Pareto Analysis
• Pareto analysis is most frequently used data analysis. It is a simple technique that can produce valuable information in quantitative terms. It is done by creating bar graphs of collected data.
In 1897, Italian scientist V. Pareto presented his findings that the distribution of income is uneven. Similar observation also was reported by M. C. Lorenz in the U.S. in 1907.Based on the arrangement of the income distribution bars, these scholars pointed out that by far the largest share of wealth is held by a very small number of people. In the field of quality control, in early part of the 20th century, Dr. J. M. Juran used the Pareto principles to isolate the quality problems into vital few and trivial many.
Individuals/Localities
Wealth
10/25/2001 74
3a. Making Pareto Diagrams3a. Making Pareto Diagrams
Step 1. Decide the kind of problem you want to investigate.
Example: Investigate defects in an automobile introduce in Sept. 2001.
Determine what data will be necessary and how to classify them.
Example:Type of failure, miles driven, etc.
Specify method of data collection and the period of collection.
Example:All vehicles in Metro-Detroit area with VIN number XYZ.
Step 2. Design a data Tally Sheet listing items and room for totals
Step 3. Fill out the Tally Sheet and calculate totals.
Step 4. Prepare a Pareto diagram with (a) individual total, (b) Cumulative totals, percentage of overall totals (for individuals), and cumulative percentages.
6/23/2014
38
10/25/2001 Quantitative & Statistical Data Analysis 75
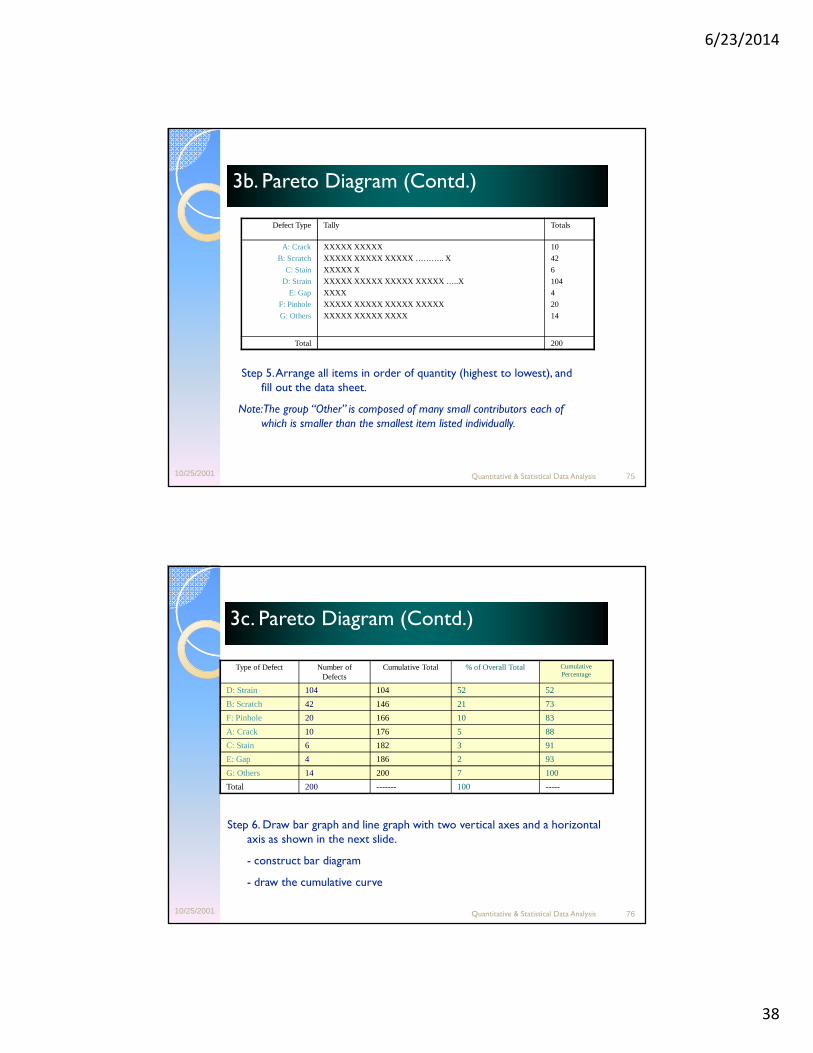
3b. Pareto Diagram (Contd.)3b. Pareto Diagram (Contd.)
Step 5. Arrange all items in order of quantity (highest to lowest), and fill out the data sheet.
Note: The group “Other” is composed of many small contributors each of which is smaller than the smallest item listed individually.
Defect Type Tally Totals
A: Crack
B: Scratch
C: Stain
D: Strain
E: Gap
F: Pinhole
G: Others
XXXXX XXXXX
XXXXX XXXXX XXXXX ……….. X
XXXXX X
XXXXX XXXXX XXXXX XXXXX …..X
XXXX
XXXXX XXXXX XXXXX XXXXX
XXXXX XXXXX XXXX
10
42
6
104
4
20
14
Total 200
10/25/2001 Quantitative & Statistical Data Analysis 76
3c. asdasds3c. asdasds3c. Pareto Diagram (Contd.)3c. Pareto Diagram (Contd.)
Type of Defect Number of Defects
Cumulative Total % of Overall Total Cumulative Percentage
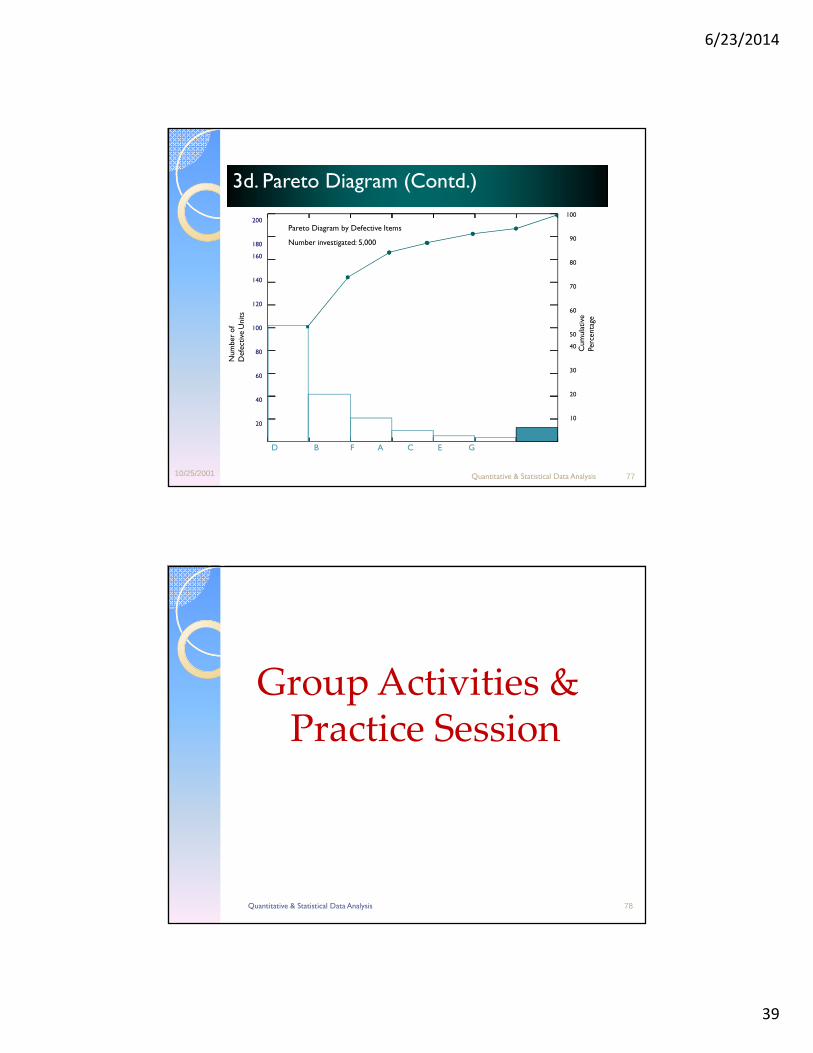
D: Strain 104 104 52 52
B: Scratch 42 146 21 73
F: Pinhole 20 166 10 83
A: Crack 10 176 5 88
C: Stain 6 182 3 91
E: Gap 4 186 2 93
G: Others 14 200 7 100
Total 200 ------- 100 -----
Step 6. Draw bar graph and line graph with two vertical axes and a horizontal axis as shown in the next slide.
- construct bar diagram
- draw the cumulative curve
6/23/2014
39
10/25/2001 Quantitative & Statistical Data Analysis 77
3d. Pareto Diagram (Contd.)3d. Pareto Diagram (Contd.)
200
180
160
140
120
100
80
60
40
20
Number
of
Defec
tive
Units
100
90
80
70
60
50
40
30
20
10
Cumulative
Pe
rcen
tage
D B F A C E G
Pareto Diagram by Defective Items
Number investigated: 5,000
Quantitative & Statistical Data Analysis 78
Group Activities & Practice Session
6/23/2014
40
xSlide 79
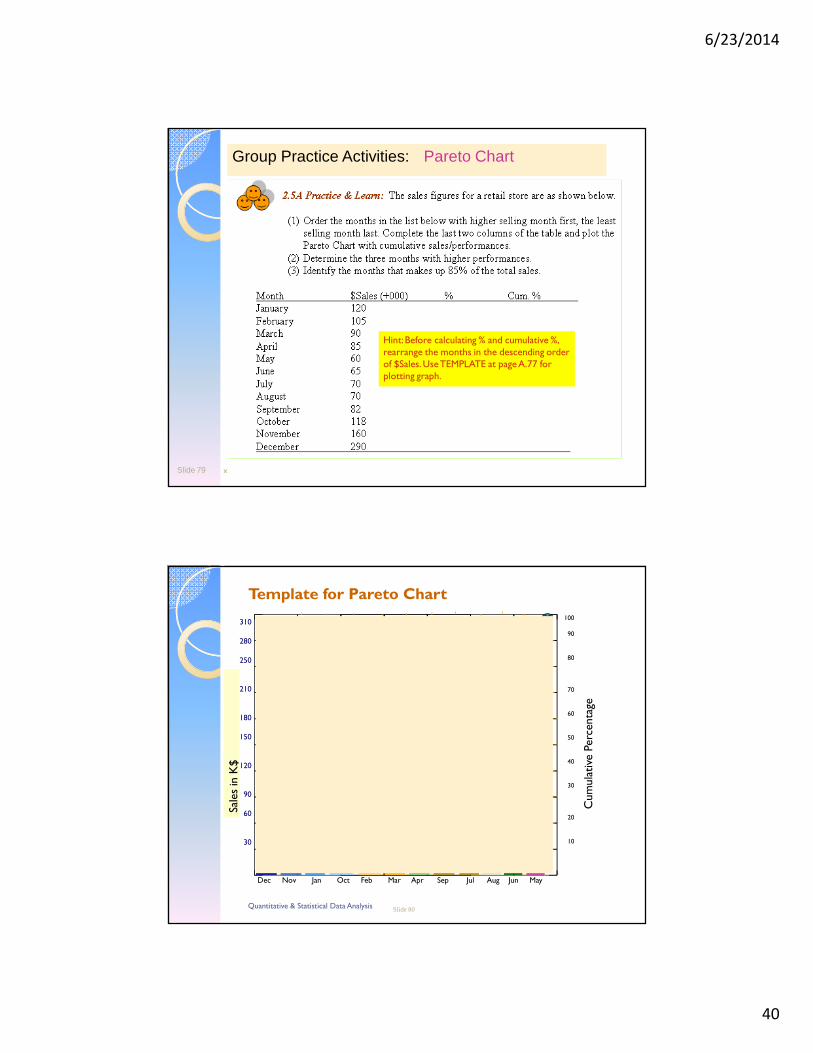
Group Practice Activities: Pareto Chart
Hint: Before calculating % and cumulative %, rearrange the months in the descending order of $Sales. Use TEMPLATE at page A.77 for plotting graph.
Slide 80
Template for Pareto Chart
310
280
250
210
180
150
120
90
60
30
Sales in K
$
100
90
80
70
60
50
40
30
20
10
Cumulative
Perce
ntage
Pareto Diagram.
Dec Nov Jan Oct Feb Mar Apr Sep Jul Aug Jun May
Quantitative & Statistical Data Analysis
6/23/2014
41
Nutek, Inc. Basic Tools for Quality Improvement Basic Tools for Quality Improvement www.Nutek-us.com Update: 0904 Slide 81
Group Exercise: Pareto ChartGroup Exercise: Pareto Chart
Work on an additional project:
1. Select an performance data
2. Show how data will be collected
3. Design plotting scheme
4. Review and refine chart
Present your process to the class and show your Pareto Chart.
Nutek, Inc. Basic Tools for Quality Improvement Basic Tools for Quality Improvement www.Nutek-us.com Update: 0904 Slide 82
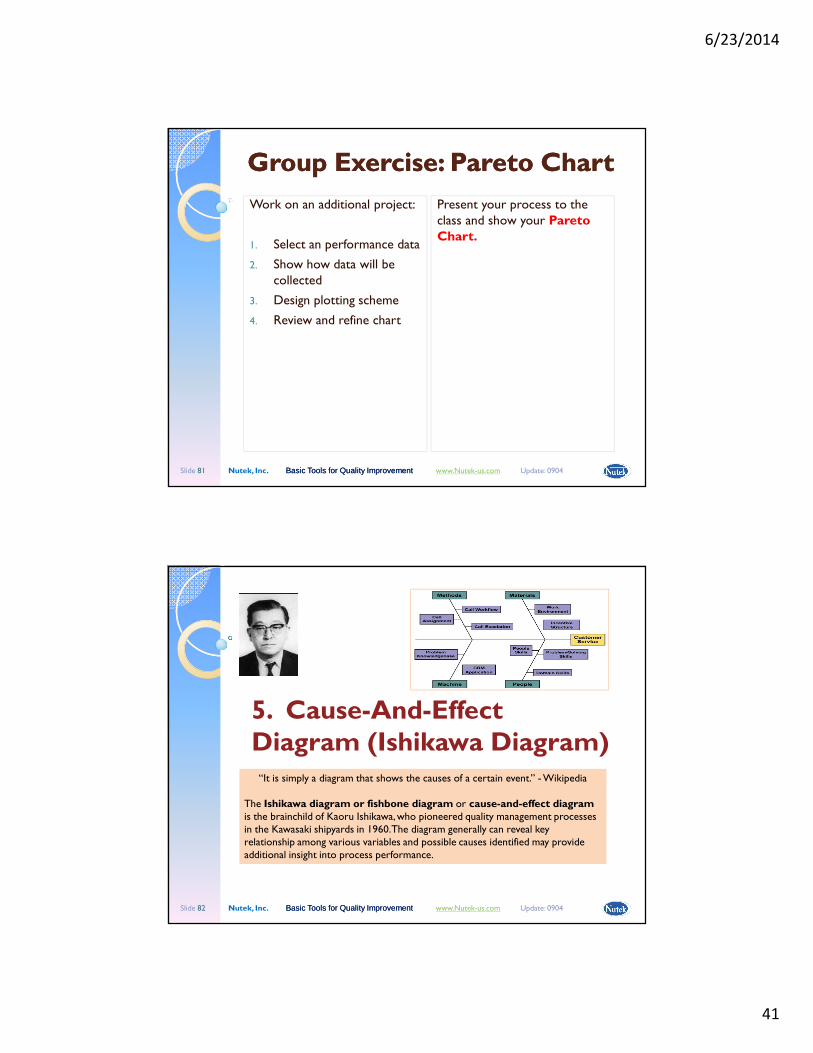
5. Cause-And-Effect Diagram (Ishikawa Diagram)“It is simply a diagram that shows the causes of a certain event.” -Wikipedia
The Ishikawa diagram or fishbone diagram or cause-and-effect diagramis the brainchild of Kaoru Ishikawa, who pioneered quality management processes in the Kawasaki shipyards in 1960. The diagram generally can reveal key relationship among various variables and possible causes identified may provide additional insight into process performance.
6/23/2014
42
Nutek, Inc. Basic Tools for Quality Improvement Basic Tools for Quality Improvement www.Nutek-us.com Update: 0904 Slide 83
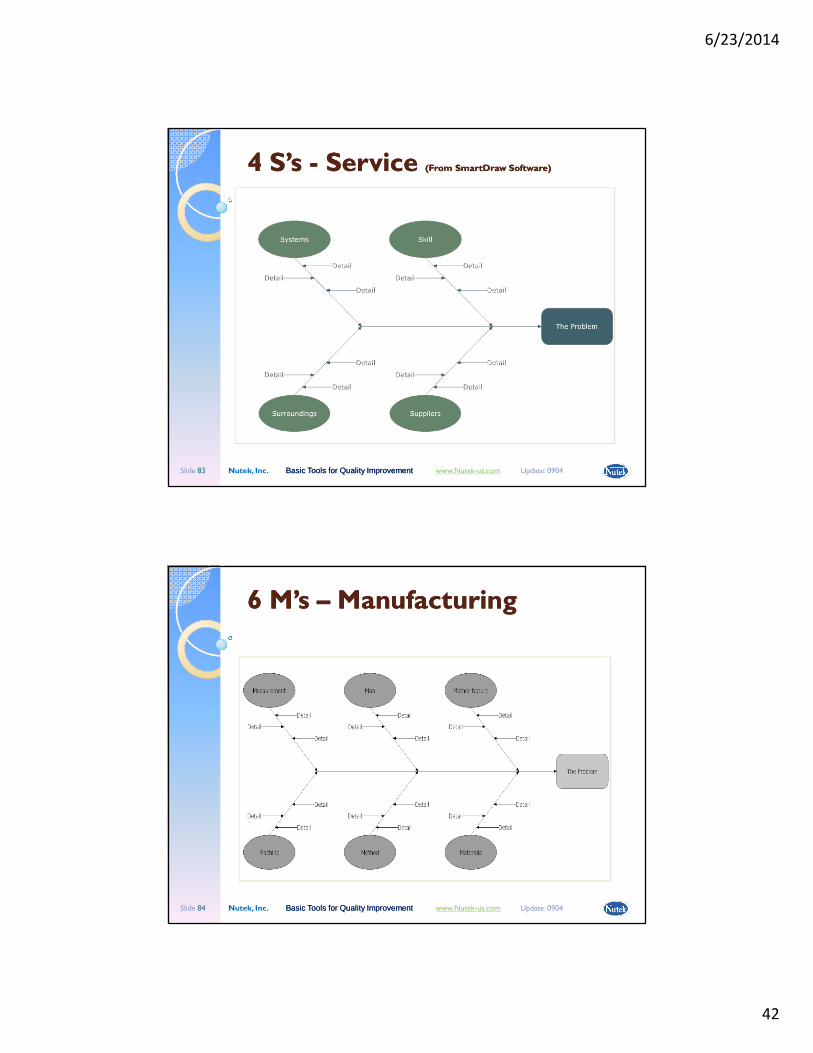
4 S’s 4 S’s -- Service Service (From SmartDraw Software)(From SmartDraw Software)
Nutek, Inc. Basic Tools for Quality Improvement Basic Tools for Quality Improvement www.Nutek-us.com Update: 0904 Slide 84
6 M’s 6 M’s –– ManufacturingManufacturing
6/23/2014
43
Nutek, Inc. Basic Tools for Quality Improvement Basic Tools for Quality Improvement www.Nutek-us.com Update: 0904 Slide 85
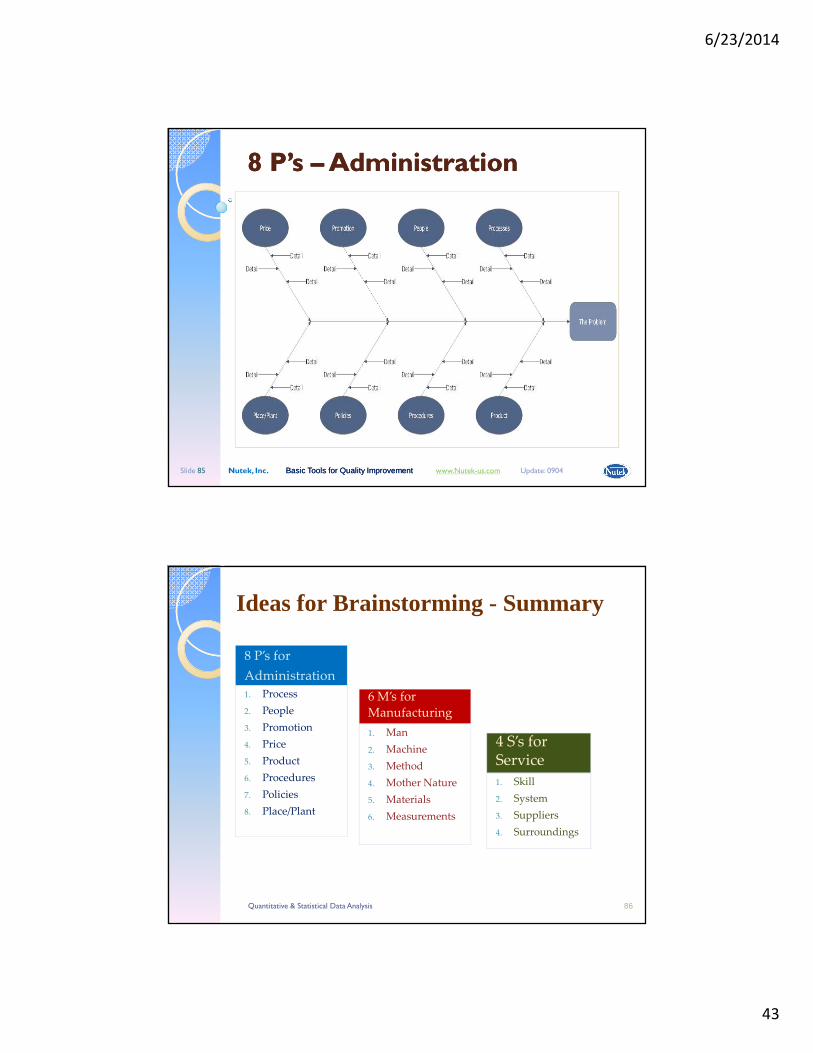
8 P’s 8 P’s ––AdministrationAdministration
Quantitative & Statistical Data Analysis 86
8 P’s for
Administration
1. Process
2. People
3. Promotion
4. Price
5. Product
6. Procedures
7. Policies
8. Place/Plant
6 M’s for
Manufacturing
1. Man
2. Machine
3. Method
4. Mother Nature
5. Materials
6. Measurements
4 S’s forService
1. Skill
2. System
3. Suppliers
4. Surroundings
Ideas for Brainstorming - Summary
6/23/2014
44
Nutek, Inc. Basic Tools for Quality Improvement Basic Tools for Quality Improvement www.Nutek-us.com Update: 0904 Slide 87
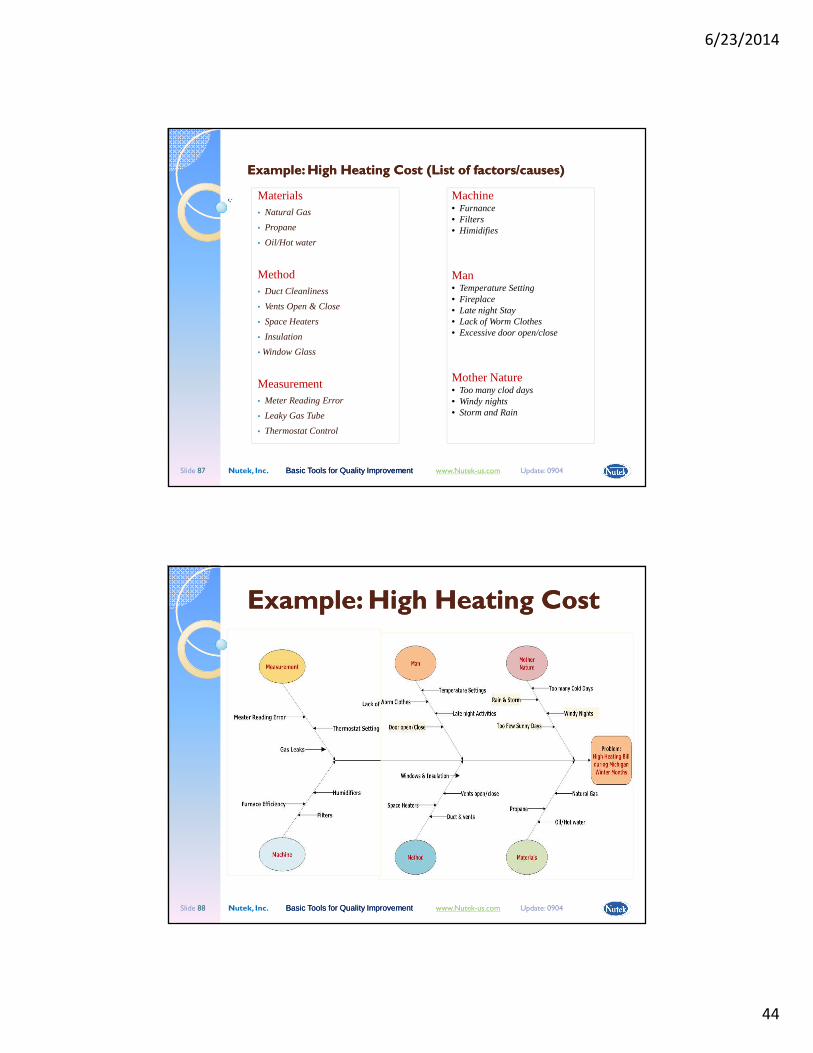
Materials• Natural Gas
• Propane
• Oil/Hot water
Method• Duct Cleanliness
• Vents Open & Close
• Space Heaters
• Insulation
• Window Glass
Measurement• Meter Reading Error
• Leaky Gas Tube
• Thermostat Control
Machine• Furnance• Filters• Himidifies
Man• Temperature Setting• Fireplace• Late night Stay• Lack of Worm Clothes• Excessive door open/close
Mother Nature• Too many clod days• Windy nights• Storm and Rain
Example: High Heating Cost (List of factors/causes)Example: High Heating Cost (List of factors/causes)
Nutek, Inc. Basic Tools for Quality Improvement Basic Tools for Quality Improvement www.Nutek-us.com Update: 0904 Slide 88
Example: High Heating CostExample: High Heating Cost
6/23/2014
45
Nutek, Inc. Basic Tools for Quality Improvement Basic Tools for Quality Improvement www.Nutek-us.com Update: 0904 Slide 89
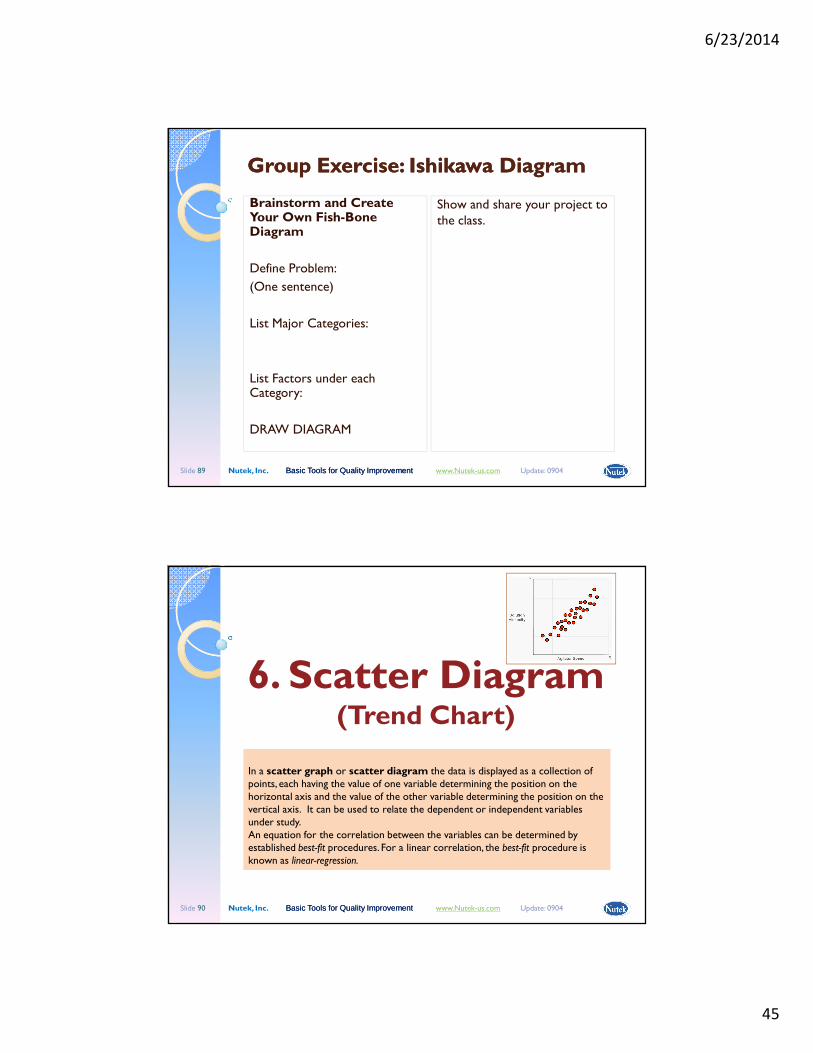
Group Exercise: Ishikawa DiagramGroup Exercise: Ishikawa Diagram
Brainstorm and Create Your Own Fish-Bone Diagram
Define Problem:
(One sentence)
List Major Categories:
List Factors under each Category:
DRAW DIAGRAM
Show and share your project to the class.
Nutek, Inc. Basic Tools for Quality Improvement Basic Tools for Quality Improvement www.Nutek-us.com Update: 0904 Slide 90
6. Scatter Diagram (Trend Chart)
In a scatter graph or scatter diagram the data is displayed as a collection of points, each having the value of one variable determining the position on the horizontal axis and the value of the other variable determining the position on the vertical axis. It can be used to relate the dependent or independent variables under study. An equation for the correlation between the variables can be determined by established best-fit procedures. For a linear correlation, the best-fit procedure is known as linear-regression.
6/23/2014
46
10/25/2001 Quantitative & Statistical Data Analysis 91
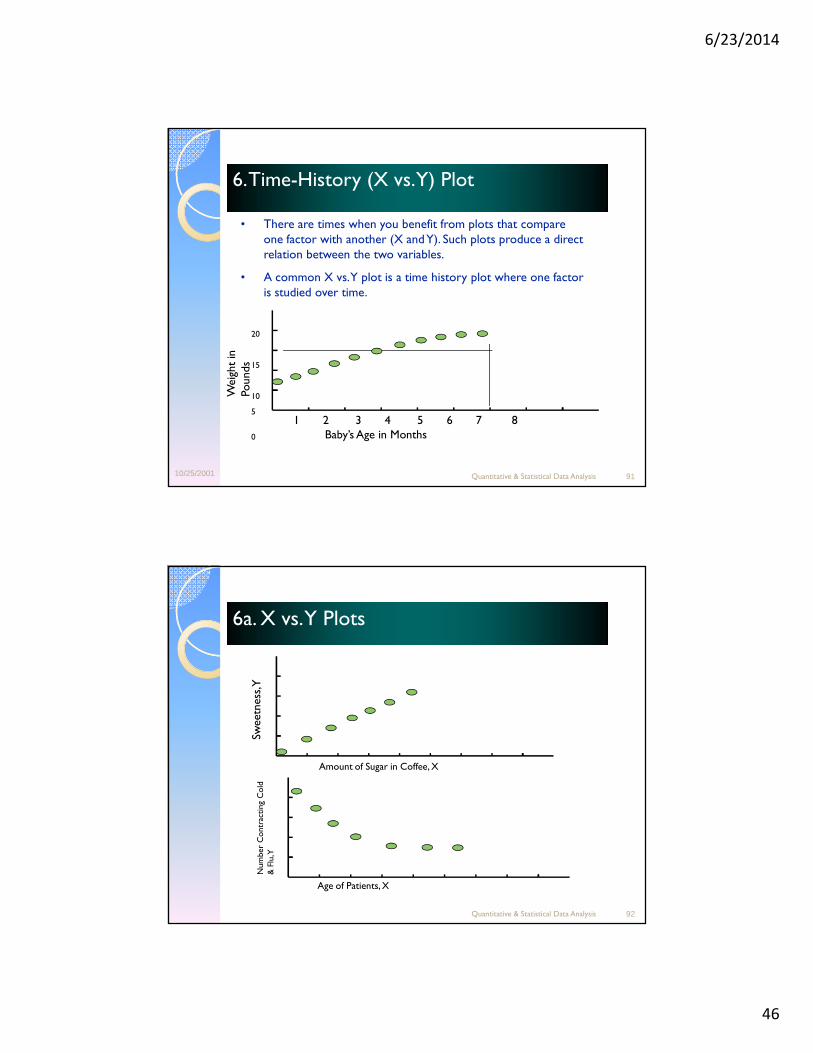
6. Time-History (X vs. Y) Plot6. Time-History (X vs. Y) Plot
• There are times when you benefit from plots that compare one factor with another (X and Y). Such plots produce a direct relation between the two variables.
• A common X vs. Y plot is a time history plot where one factor is studied over time.
1 2 3 4 5 6 7 8 Baby’s Age in Months
Weigh
t in
Pounds
20
15
10
5
0
Quantitative & Statistical Data Analysis 92
6a. X vs. Y Plots6a. X vs. Y Plots
Amount of Sugar in Coffee, X
Swee
tness, Y
Number C
ontracting Cold
& Flu, Y
Age of Patients, X
6/23/2014
47
Quantitative & Statistical Data Analysis 93
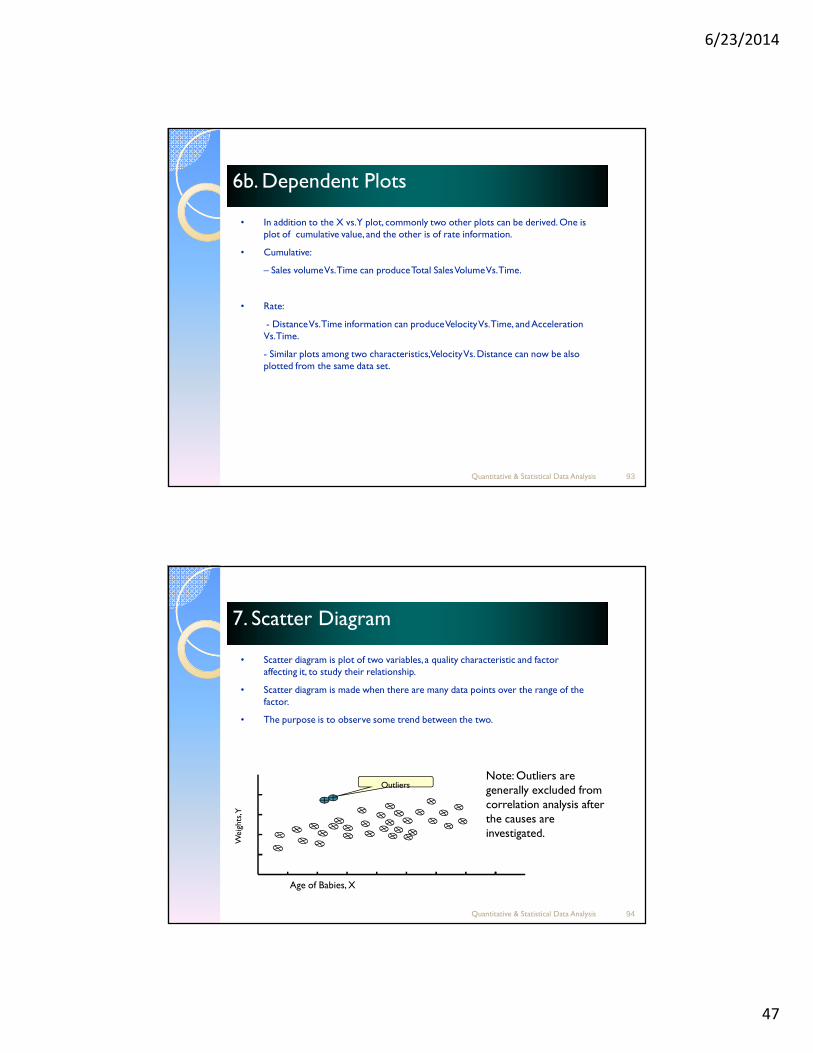
6b. Dependent Plots6b. Dependent Plots
• In addition to the X vs. Y plot, commonly two other plots can be derived. One is plot of cumulative value, and the other is of rate information.
• Cumulative:
– Sales volume Vs. Time can produce Total Sales Volume Vs. Time.
• Rate:
- Distance Vs. Time information can produce Velocity Vs. Time, and Acceleration Vs. Time.
- Similar plots among two characteristics, Velocity Vs. Distance can now be also plotted from the same data set.
Quantitative & Statistical Data Analysis 94
7. Scatter Diagram7. Scatter Diagram
• Scatter diagram is plot of two variables, a quality characteristic and factor affecting it, to study their relationship.
• Scatter diagram is made when there are many data points over the range of the factor.
• The purpose is to observe some trend between the two.
Weigh
ts, Y
Age of Babies, X
OutliersNote: Outliers are generally excluded from correlation analysis after the causes are investigated.
6/23/2014
48
Quantitative & Statistical Data Analysis 95
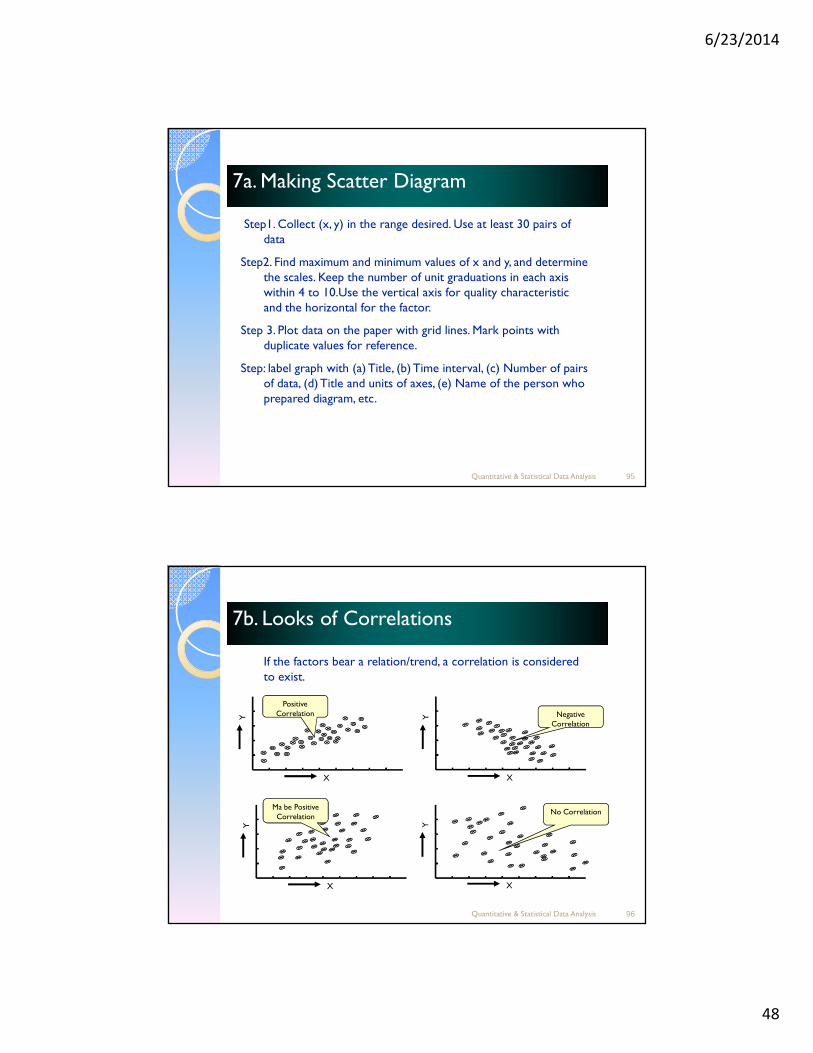
7a. Making Scatter Diagram7a. Making Scatter Diagram
Step1. Collect (x, y) in the range desired. Use at least 30 pairs of data
Step2. Find maximum and minimum values of x and y, and determine the scales. Keep the number of unit graduations in each axis within 4 to 10.Use the vertical axis for quality characteristic and the horizontal for the factor.
Step 3. Plot data on the paper with grid lines. Mark points with duplicate values for reference.
Step: label graph with (a) Title, (b) Time interval, (c) Number of pairs of data, (d) Title and units of axes, (e) Name of the person who prepared diagram, etc.
Quantitative & Statistical Data Analysis 96
7b. Looks of Correlations7b. Looks of Correlations
If the factors bear a relation/trend, a correlation is considered to exist.
Y
X
Positive Correlation Y
X
Negative Correlation
Y
X
Ma be Positive Correlation
Y
X
No Correlation
6/23/2014
49
Quantitative & Statistical Data Analysis 97
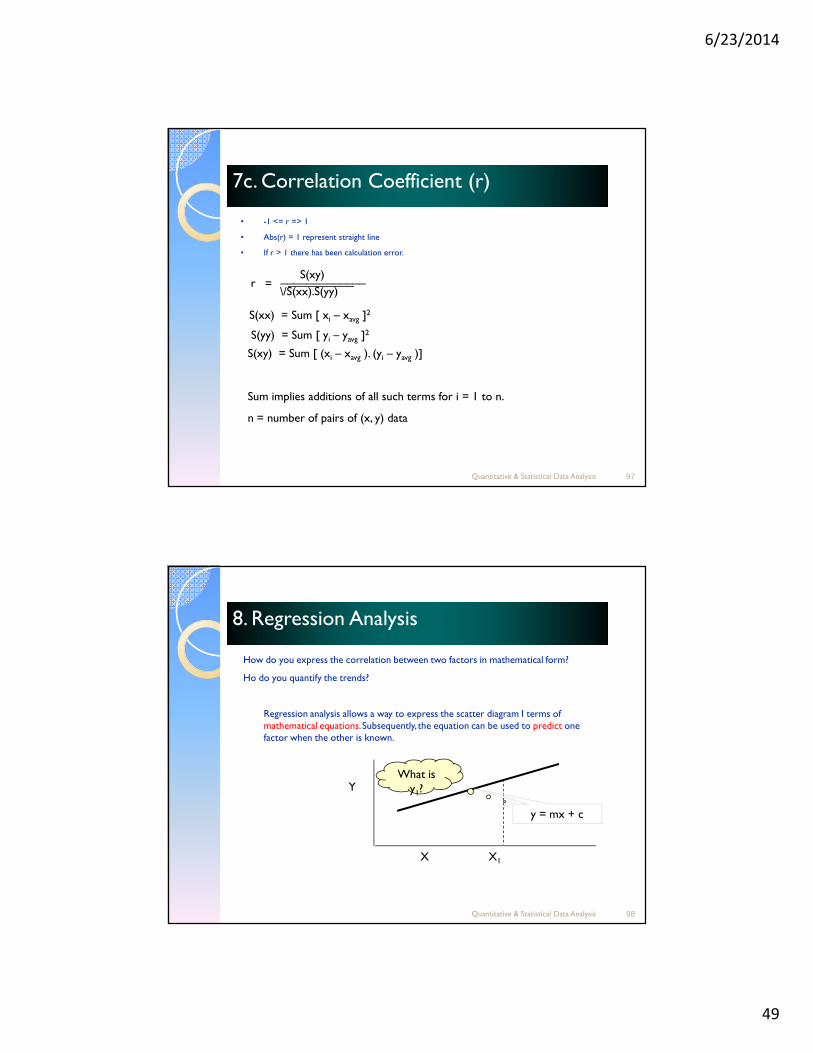
7c. Correlation Coefficient (r)7c. Correlation Coefficient (r)
• -1 <= r => 1
• Abs(r) = 1 represent straight line
• If r > 1 there has been calculation error.
r =S(xy)_____________
\/S(xx).S(yy)__________
S(xx) = Sum [ xi – xavg ]2
S(yy) = Sum [ yi – yavg ]2
S(xy) = Sum [ (xi – xavg ). (yi – yavg )]
Sum implies additions of all such terms for i = 1 to n.
n = number of pairs of (x, y) data
Quantitative & Statistical Data Analysis 98
8. Regression Analysis8. Regression Analysis
How do you express the correlation between two factors in mathematical form?
Ho do you quantify the trends?
Regression analysis allows a way to express the scatter diagram I terms of mathematical equations. Subsequently, the equation can be used to predict one factor when the other is known.
Y
X X1
y = mx + c
What is y1?
6/23/2014
50
Quantitative & Statistical Data Analysis 99
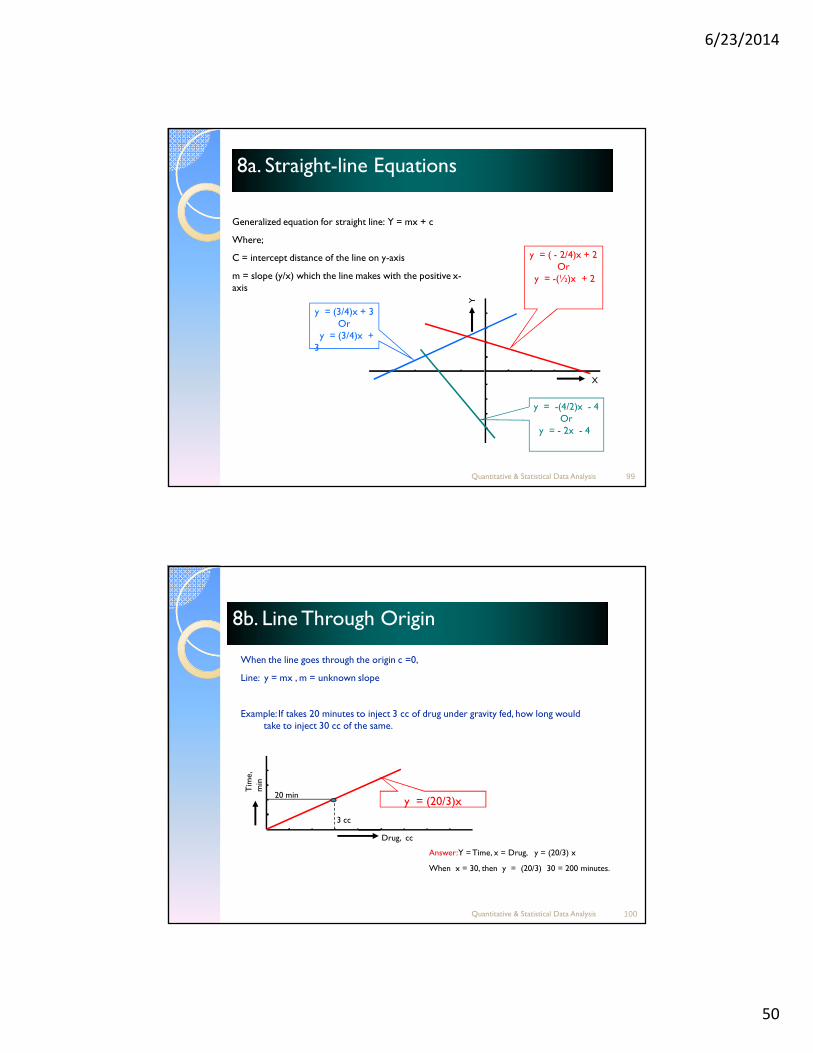
8a. Straight-line Equations8a. Straight-line Equations
X
Y
y = ( - 2/4)x + 2Or
y = -(½)x + 2
y = (3/4)x + 3Or
y = (3/4)x + 3
y = -(4/2)x - 4Or
y = - 2x - 4
Generalized equation for straight line: Y = mx + c
Where;
C = intercept distance of the line on y-axis
m = slope (y/x) which the line makes with the positive x-axis
Quantitative & Statistical Data Analysis 100
8b. Line Through Origin8b. Line Through Origin
When the line goes through the origin c =0,
Line: y = mx , m = unknown slope
Example: If takes 20 minutes to inject 3 cc of drug under gravity fed, how long would take to inject 30 cc of the same.
y = (20/3)x
Drug, cc
Tim
e,
min
20 min
3 cc
Answer:Y = Time, x = Drug, y = (20/3) x
When x = 30, then y = (20/3) 30 = 200 minutes.
6/23/2014
51
Quantitative & Statistical Data Analysis 101
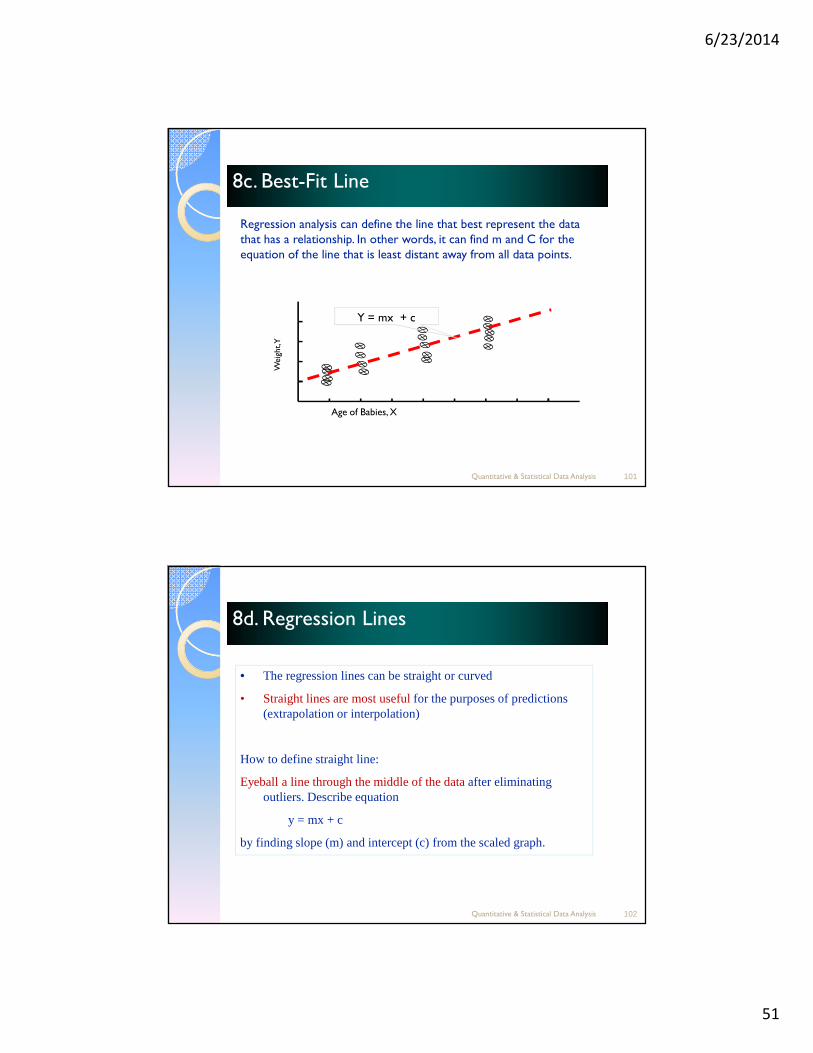
8c. Best-Fit Line8c. Best-Fit Line
Regression analysis can define the line that best represent the data that has a relationship. In other words, it can find m and C for the equation of the line that is least distant away from all data points.
Weigh
t, Y
Age of Babies, X
Y = mx + c
Quantitative & Statistical Data Analysis 102
8d. Regression Lines8d. Regression Lines
• The regression lines can be straight or curved
• Straight lines are most useful for the purposes of predictions (extrapolation or interpolation)
How to define straight line:
Eyeball a line through the middle of the dataafter eliminating outliers. Describe equation
y = mx + c
by finding slope (m) and intercept (c) from the scaled graph.
6/23/2014
52
Quantitative & Statistical Data Analysis 103
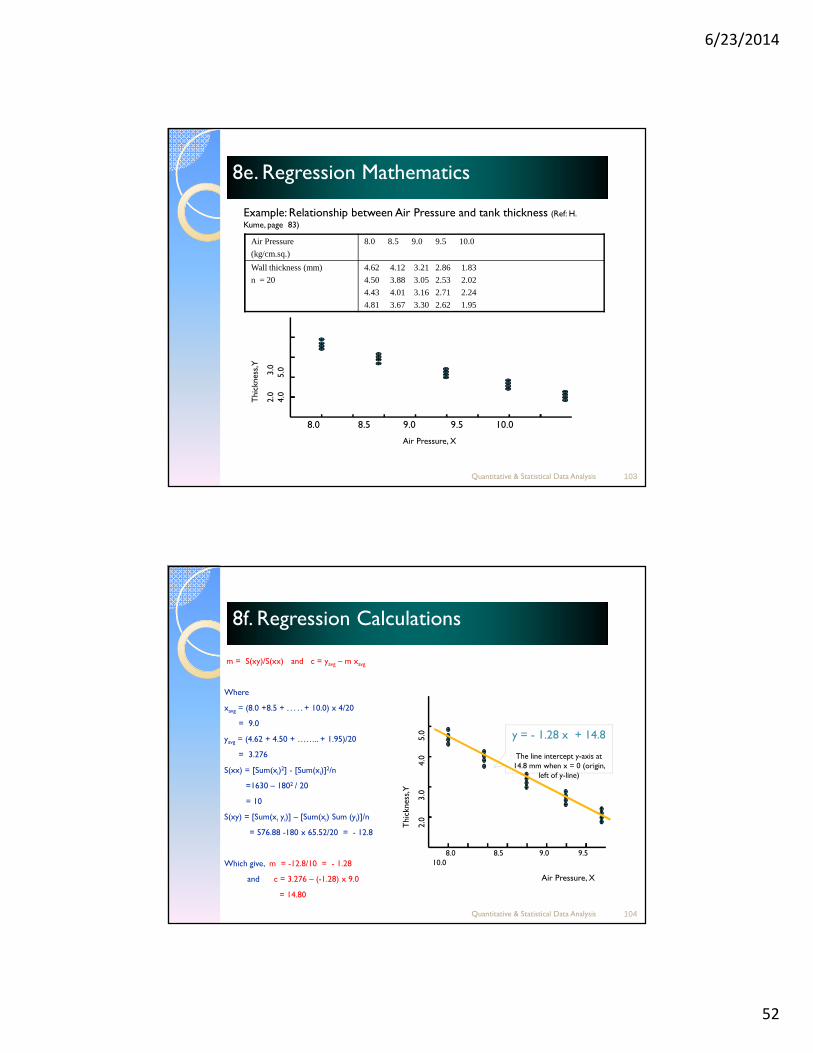
8e. Regression Mathematics8e. Regression Mathematics
Air Pressure
(kg/cm.sq.)
8.0 8.5 9.0 9.5 10.0
Wall thickness (mm)
n = 20
4.62 4.12 3.21 2.86 1.83
4.50 3.88 3.05 2.53 2.02
4.43 4.01 3.16 2.71 2.24
4.81 3.67 3.30 2.62 1.95
Example: Relationship between Air Pressure and tank thickness (Ref: H.
Kume, page 83)
8.0 8.5 9.0 9.5 10.0
Air Pressure, X
Thickn
ess, Y
2.0 3.0
4.0 5.0
Quantitative & Statistical Data Analysis 104
8f. Regression Calculations8f. Regression Calculations
m = S(xy)/S(xx) and c = yavg – m xavg
Where
xavg = (8.0 +8.5 + . . . . . + 10.0) x 4/20
= 9.0
yavg = (4.62 + 4.50 + …….. + 1.95)/20
= 3.276
S(xx) = [Sum(xi)2] - [Sum(xi)]
2/n
=1630 – 1802 / 20
= 10
S(xy) = [Sum(xi yi)] – [Sum(xi) Sum (yi)]/n
= 576.88 -180 x 65.52/20 = - 12.8
Which give, m = -12.8/10 = - 1.28
and c = 3.276 – (-1.28) x 9.0
= 14.80
y = - 1.28 x + 14.8
The line intercept y-axis at 14.8 mm when x = 0 (origin,
left of y-line)
8.0 8.5 9.0 9.5 10.0
Air Pressure, X
Thickn
ess, Y
2.0 3.0 4.0 5.0
6/23/2014
53
Quantitative & Statistical Data Analysis 105
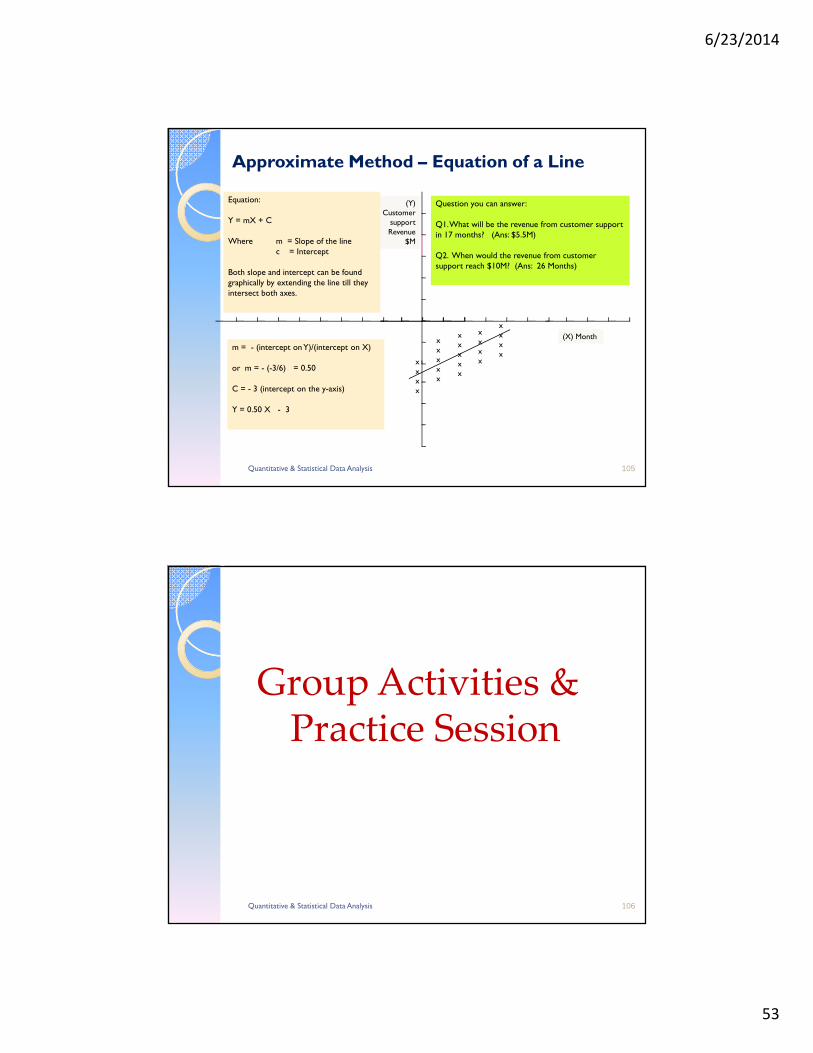
Approximate Method – Equation of a Line
(X) Month
(Y) Customer
support Revenue
$M
xxxx
xxxxx
xxxxx
xxxx
xxxx
Equation:
Y = mX + C
Where m = Slope of the linec = Intercept
Both slope and intercept can be found graphically by extending the line till they intersect both axes.
m = - (intercept on Y)/(intercept on X)
or m = - (-3/6) = 0.50
C = - 3 (intercept on the y-axis)
Y = 0.50 X - 3
Question you can answer:
Q1. What will be the revenue from customer support in 17 months? (Ans: $5.5M)
Q2. When would the revenue from customer support reach $10M? (Ans: 26 Months)
Quantitative & Statistical Data Analysis 106
Group Activities & Practice Session
6/23/2014
54
Quantitative & Statistical Data Analysis 107
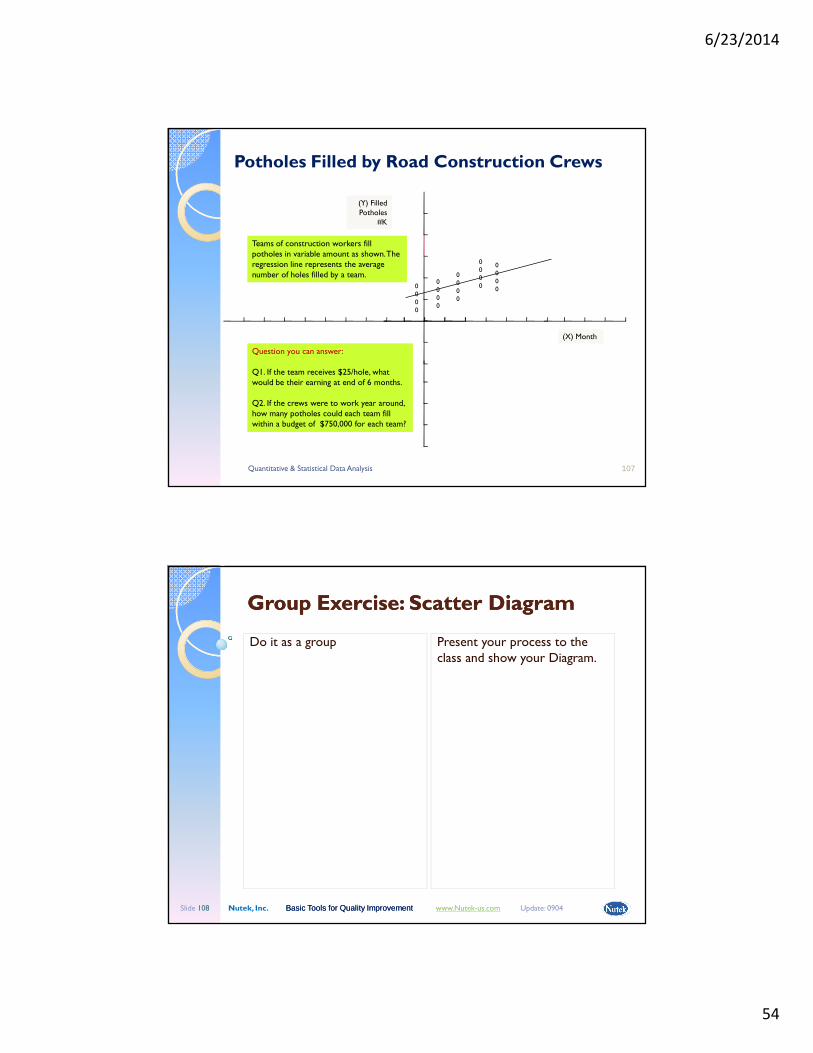
Potholes Filled by Road Construction Crews
(X) Month
(Y) Filled Potholes
#K
0000
Question you can answer:
Q1. If the team receives $25/hole, what would be their earning at end of 6 months.
Q2. If the crews were to work year around, how many potholes could each team fill within a budget of $750,000 for each team?
0000
0000
0000
0000
Teams of construction workers fill potholes in variable amount as shown. The regression line represents the average number of holes filled by a team.
Nutek, Inc. Basic Tools for Quality Improvement Basic Tools for Quality Improvement www.Nutek-us.com Update: 0904 Slide 108
Group Exercise: Scatter DiagramGroup Exercise: Scatter Diagram
Do it as a group Present your process to the class and show your Diagram.
6/23/2014
55
Nutek, Inc. Basic Tools for Quality Improvement Basic Tools for Quality Improvement www.Nutek-us.com Update: 0904 Slide 109
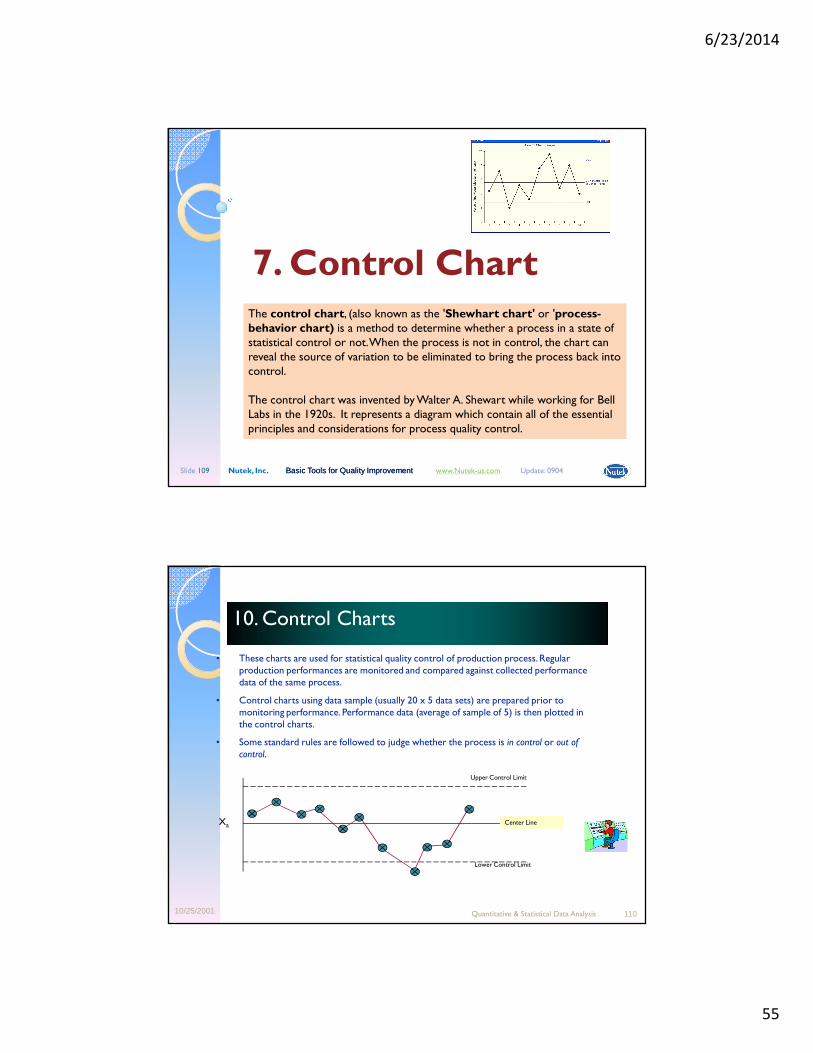
7. Control ChartThe control chart, (also known as the 'Shewhart chart' or 'process-behavior chart) is a method to determine whether a process in a state of statistical control or not. When the process is not in control, the chart can reveal the source of variation to be eliminated to bring the process back into control.
The control chart was invented by Walter A. Shewart while working for Bell Labs in the 1920s. It represents a diagram which contain all of the essential principles and considerations for process quality control.
10/25/2001 Quantitative & Statistical Data Analysis 110
10. Control Charts10. Control Charts
• These charts are used for statistical quality control of production process. Regular production performances are monitored and compared against collected performance data of the same process.
• Control charts using data sample (usually 20 x 5 data sets) are prepared prior to monitoring performance. Performance data (average of sample of 5) is then plotted in the control charts.
• Some standard rules are followed to judge whether the process is in control or out of control.
Lower Control Limit
Center Line
Upper Control Limit
Xa
6/23/2014
56
Quantitative & Statistical Data Analysis 111
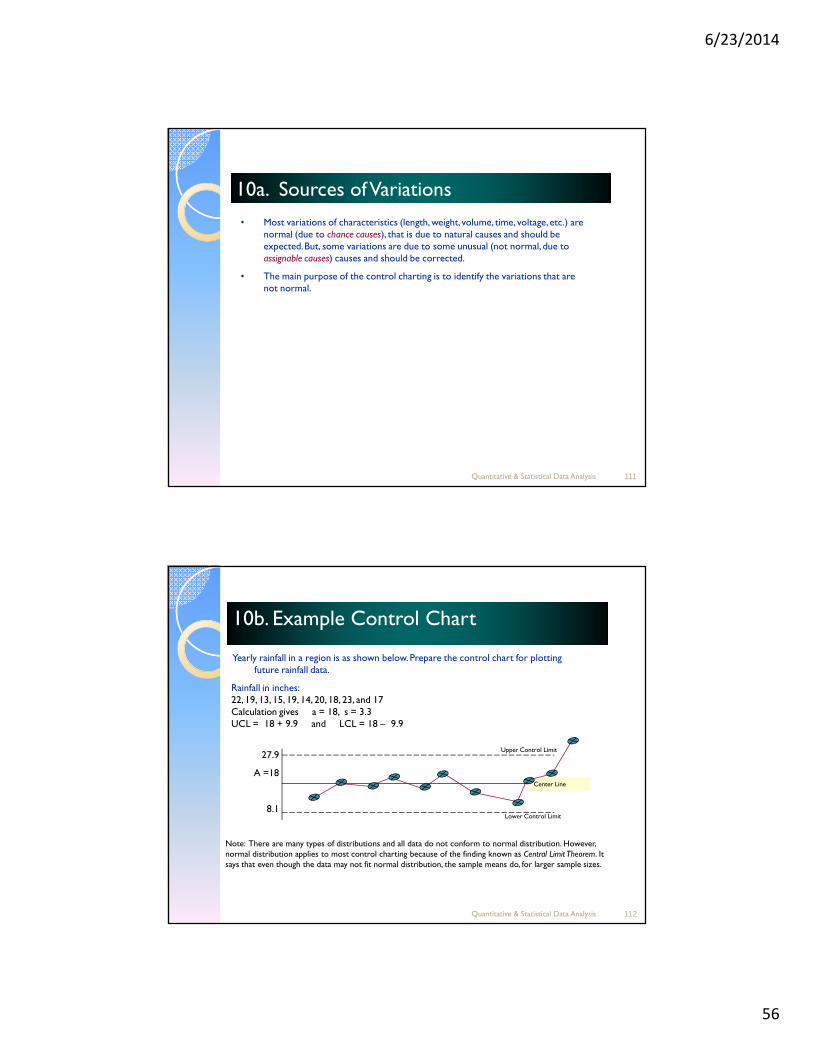
10a. Sources of Variations10a. Sources of Variations
• Most variations of characteristics (length, weight, volume, time, voltage, etc.) are normal (due to chance causes), that is due to natural causes and should be expected. But, some variations are due to some unusual (not normal, due to assignable causes) causes and should be corrected.
• The main purpose of the control charting is to identify the variations that are not normal.
Quantitative & Statistical Data Analysis 112
10b. Example Control Chart10b. Example Control Chart
Yearly rainfall in a region is as shown below. Prepare the control chart for plotting future rainfall data.
Rainfall in inches: 22, 19, 13, 15, 19, 14, 20, 18, 23, and 17Calculation gives a = 18, s = 3.3UCL = 18 + 9.9 and LCL = 18 – 9.9
Lower Control Limit
Center Line
Upper Control Limit27.9
A =18
8.1
Note: There are many types of distributions and all data do not conform to normal distribution. However, normal distribution applies to most control charting because of the finding known as Central Limit Theorem. It says that even though the data may not fit normal distribution, the sample means do, for larger sample sizes.
6/23/2014
57
Quantitative & Statistical Data Analysis 113
Group Activities & Practice Session
Quantitative & Statistical Data AnalysisSlide 114
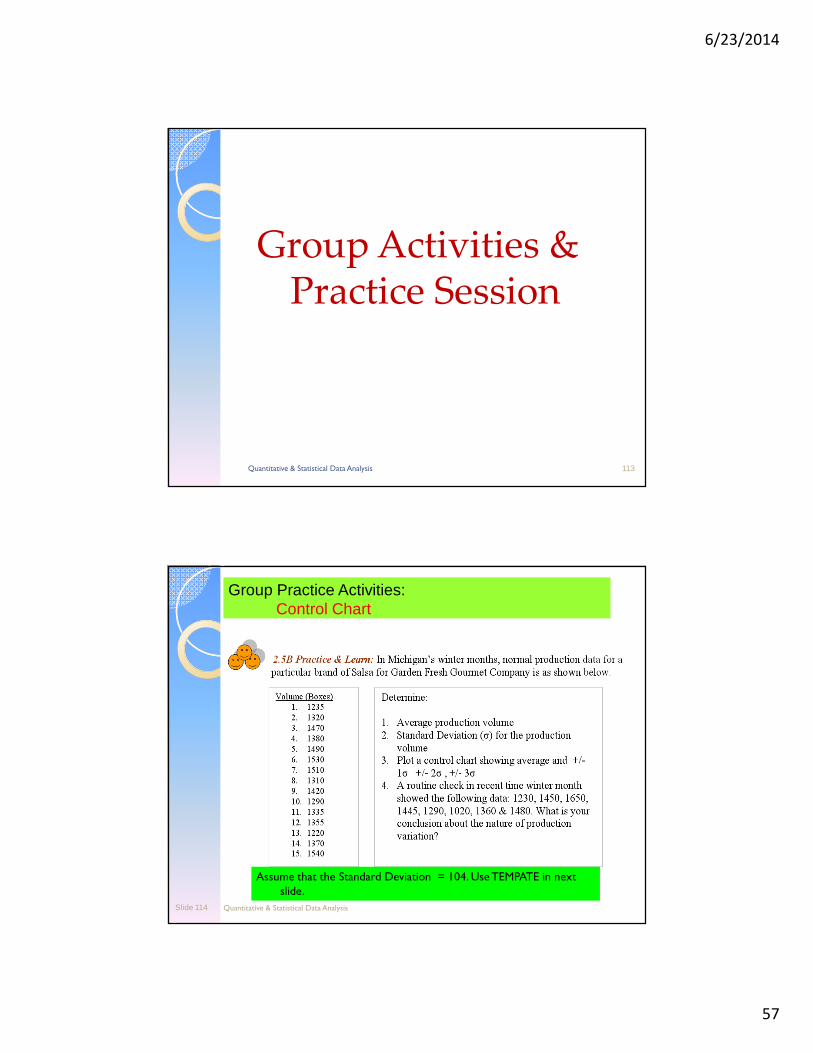
Group Practice Activities:Control Chart
Assume that the Standard Deviation = 104. Use TEMPATE in next slide.
6/23/2014
58
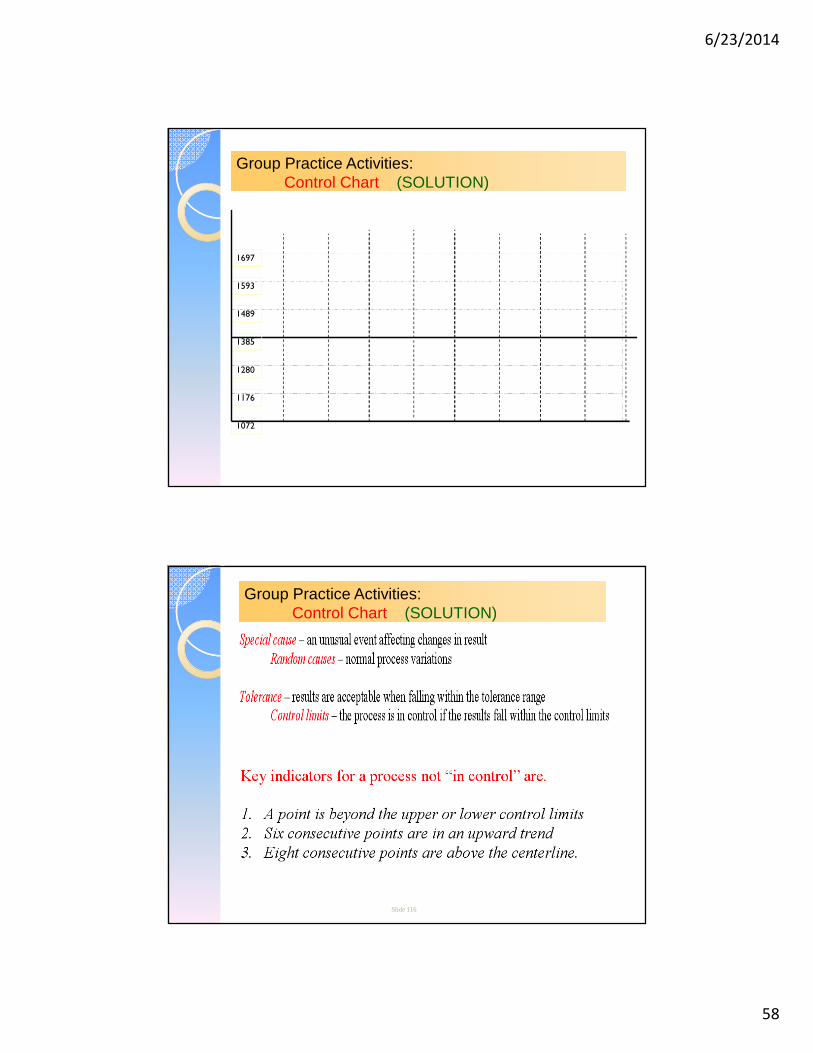
Group Practice Activities:Control Chart (SOLUTION)
1697
1593
1489
1385
1072
1176
1280
Slide 116
Group Practice Activities:Control Chart (SOLUTION)
6/23/2014
59
Quantitative & Statistical Data Analysis 117
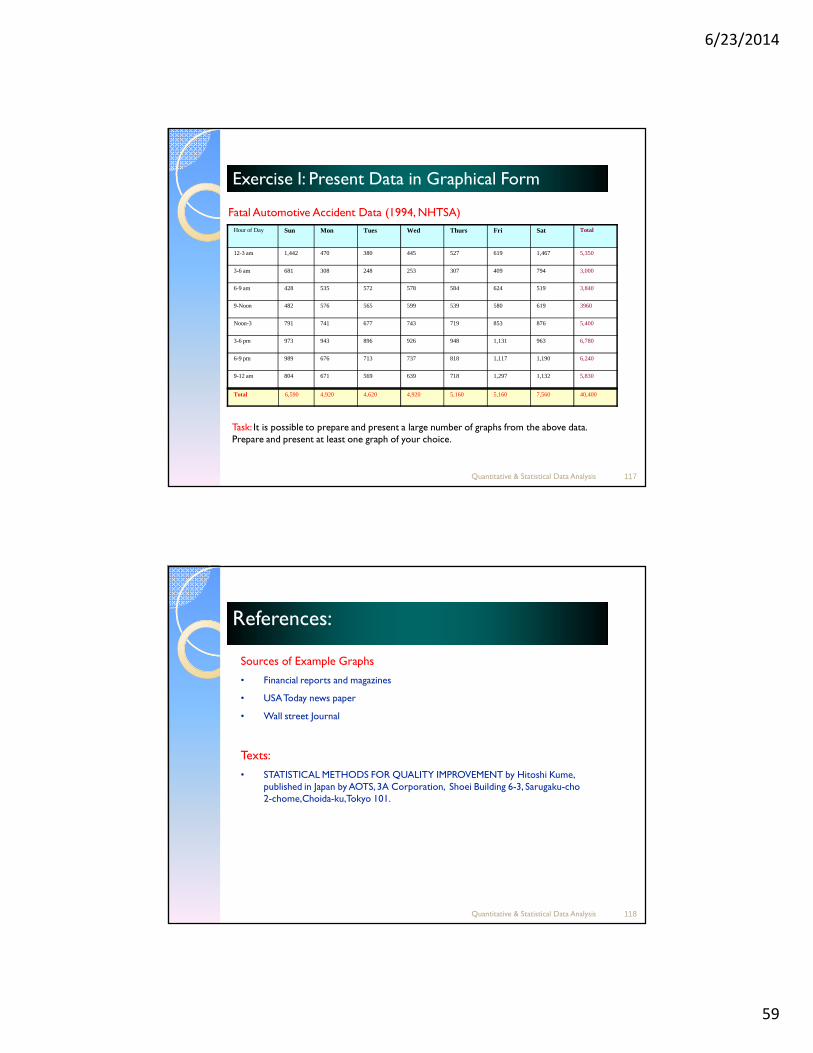
Exercise I: Present Data in Graphical FormExercise I: Present Data in Graphical Form
Fatal Automotive Accident Data (1994, NHTSA)
Hour of Day Sun Mon Tues Wed Thurs Fri Sat Total
12-3 am 1,442 470 380 445 527 619 1,467 5,350
3-6 am 681 308 248 253 307 409 794 3,000
6-9 am 428 535 572 578 584 624 519 3,840
9-Noon 482 576 565 599 539 580 619 3960
Noon-3 791 741 677 743 719 853 876 5,400
3-6 pm 973 943 896 926 948 1,131 963 6,780
6-9 pm 989 676 713 737 818 1,117 1,190 6,240
9-12 am 804 671 569 639 718 1,297 1,132 5,830
Total 6,590 4,920 4,620 4,920 5,160 5,160 7,560 40,400
Task: It is possible to prepare and present a large number of graphs from the above data. Prepare and present at least one graph of your choice.
Quantitative & Statistical Data Analysis 118
References:References:
Sources of Example Graphs
• Financial reports and magazines
• USA Today news paper
• Wall street Journal
Texts:
• STATISTICAL METHODS FOR QUALITY IMPROVEMENT by Hitoshi Kume, published in Japan by AOTS, 3A Corporation, Shoei Building 6-3, Sarugaku-cho 2-chome,Choida-ku, Tokyo 101.
6/23/2014
60
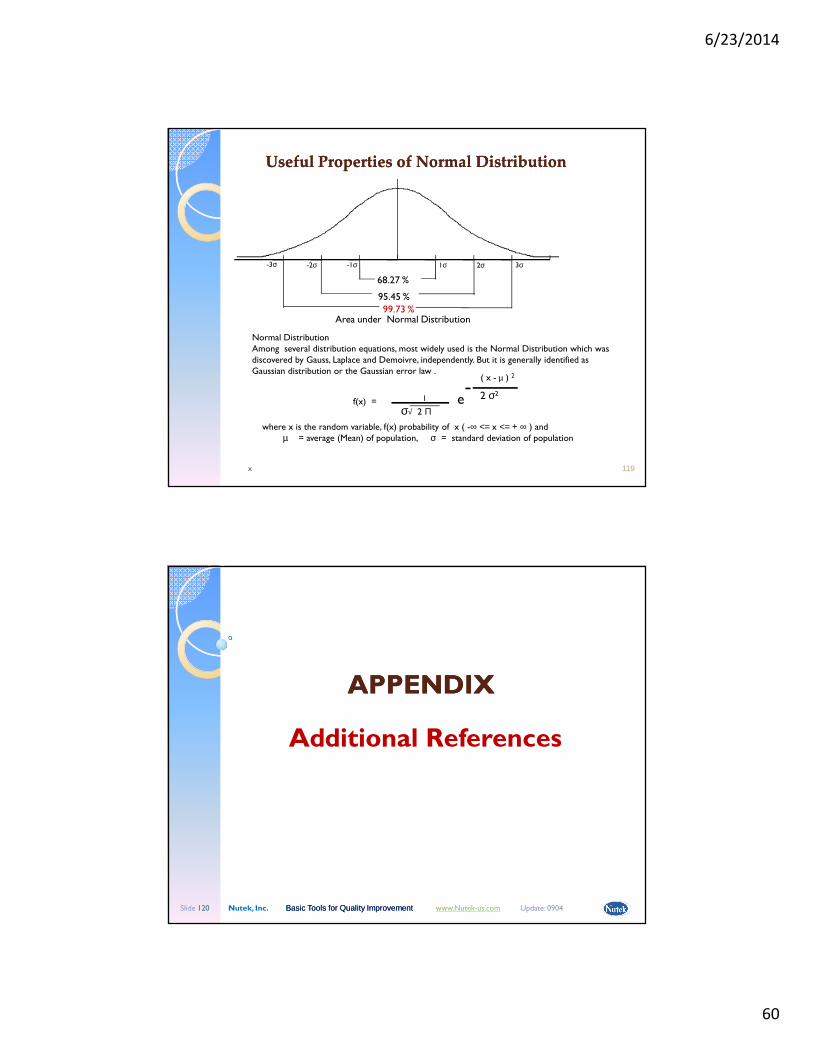
119
99.73 %
95.45 %
68.27 %
1σ-1σ 2σ-2σ 3σ-3σ
Area under Normal Distribution
Useful Properties of Normal DistributionUseful Properties of Normal Distribution
Normal DistributionAmong several distribution equations, most widely used is the Normal Distribution which was discovered by Gauss, Laplace and Demoivre, independently. But it is generally identified as Gaussian distribution or the Gaussian error law .
where x is the random variable, f(x) probability of x ( -∞ <= x <= + ∞ ) andµ = average (Mean) of population, σ = standard deviation of population
1
σ√ 2 Πe
( x - µ ) 2
2 σ2
f(x) =
x
Nutek, Inc. Basic Tools for Quality Improvement Basic Tools for Quality Improvement www.Nutek-us.com Update: 0904 Slide 120
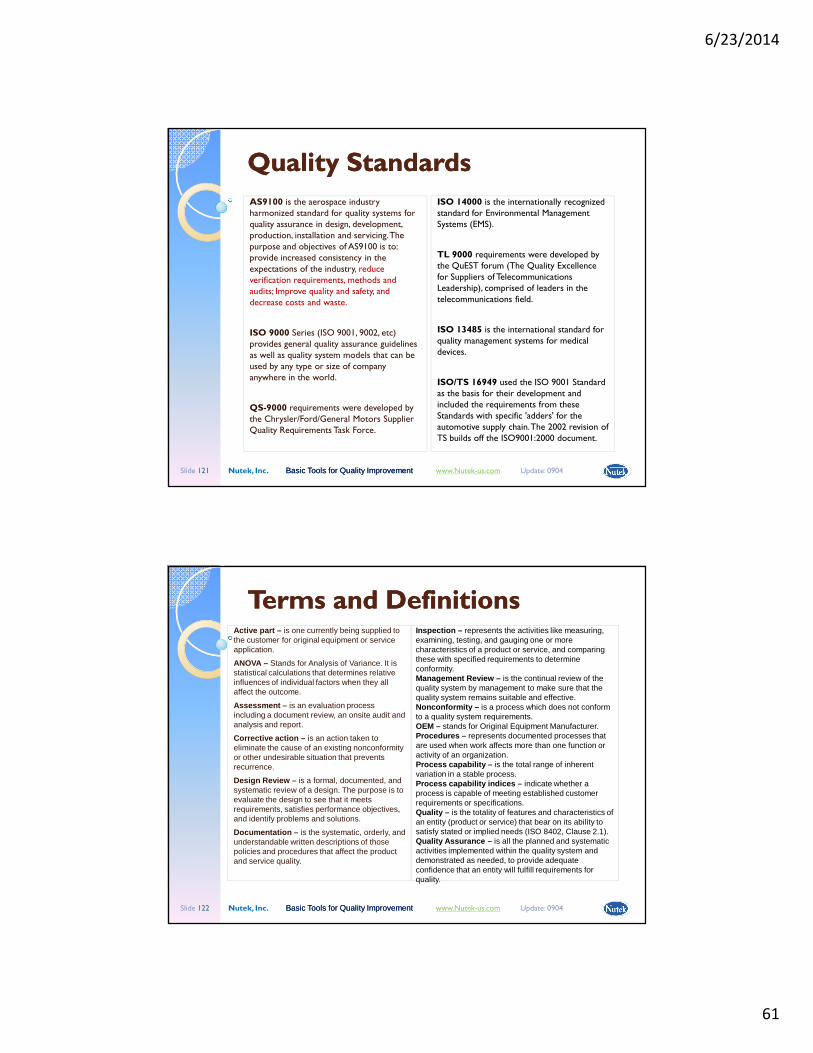
APPENDIXAPPENDIX
Additional References
6/23/2014
61
Nutek, Inc. Basic Tools for Quality Improvement Basic Tools for Quality Improvement www.Nutek-us.com Update: 0904 Slide 121
Quality StandardsQuality Standards
AS9100 is the aerospace industry harmonized standard for quality systems for quality assurance in design, development, production, installation and servicing. The purpose and objectives of AS9100 is to: provide increased consistency in the expectations of the industry, reduce verification requirements, methods and audits; Improve quality and safety, and decrease costs and waste.
ISO 9000 Series (ISO 9001, 9002, etc) provides general quality assurance guidelines as well as quality system models that can be used by any type or size of company anywhere in the world.
QS-9000 requirements were developed by the Chrysler/Ford/General Motors Supplier Quality Requirements Task Force.
ISO 14000 is the internationally recognized standard for Environmental Management Systems (EMS).
TL 9000 requirements were developed by the QuEST forum (The Quality Excellence for Suppliers of Telecommunications Leadership), comprised of leaders in the telecommunications field.
ISO 13485 is the international standard for quality management systems for medical devices.
ISO/TS 16949 used the ISO 9001 Standard as the basis for their development and included the requirements from these Standards with specific 'adders' for the automotive supply chain. The 2002 revision of TS builds off the ISO9001:2000 document.
Nutek, Inc. Basic Tools for Quality Improvement Basic Tools for Quality Improvement www.Nutek-us.com Update: 0904 Slide 122
Terms and DefinitionsTerms and DefinitionsActive part – is one currently being supplied to the customer for original equipment or service application.
ANOVA – Stands for Analysis of Variance. It is statistical calculations that determines relative influences of individual factors when they all affect the outcome.
Assessment – is an evaluation process including a document review, an onsite audit and analysis and report.
Corrective action – is an action taken to eliminate the cause of an existing nonconformity or other undesirable situation that prevents recurrence.
Design Review – is a formal, documented, and systematic review of a design. The purpose is to evaluate the design to see that it meets requirements, satisfies performance objectives, and identify problems and solutions.
Documentation – is the systematic, orderly, and understandable written descriptions of those policies and procedures that affect the product and service quality.
Inspection – represents the activities like measuring, examining, testing, and gauging one or more characteristics of a product or service, and comparing these with specified requirements to determine conformity.Management Review – is the continual review of the quality system by management to make sure that the quality system remains suitable and effective.Nonconformity – is a process which does not conform to a quality system requirements.OEM – stands for Original Equipment Manufacturer.Procedures – represents documented processes that are used when work affects more than one function or activity of an organization.Process capability – is the total range of inherent variation in a stable process.Process capability indices – indicate whether a process is capable of meeting established customer requirements or specifications.Quality – is the totality of features and characteristics of an entity (product or service) that bear on its ability to satisfy stated or implied needs (ISO 8402, Clause 2.1).Quality Assurance – is all the planned and systematic activities implemented within the quality system and demonstrated as needed, to provide adequate confidence that an entity will fulfill requirements for quality.
6/23/2014
62
Nutek, Inc. Basic Tools for Quality Improvement Basic Tools for Quality Improvement www.Nutek-us.com Update: 0904 Slide 123
Terms and DefinitionsTerms and DefinitionsQuality Audit– is a systematic and independent examination to determine whether quality activities and related results comply with planned arrangements and whether these arrangements are implemented effectively and are suitable to achieve objectives (ISO).
Quality management – represents all activities of the overall management functions that determine the quality policy, objectives, and responsibilities, and implement them by means such as quality planning, quality control, quality assurance, and quality improvement within the quality system IISO)
Quality manual – is a document stating the quality policy and describing the quality system of an organization..
Quality plan – is a document that defines the specific quality practices, resources, and sequence of activities relevant to a particular product, project, or contract.
Quality planning – consists of the activities that establish the objectives and requirements for quality and for the application of quality system requirements.
Quality policy – is the overall intentions and direction of an organization with regard to quality, as formally expressed by top management.Quality records – are the documented evidence that the supplier’s processes were executed according to the quality system documentation and records results.Quality system – is the organization structure, procedures, processes, and resources needed to implement quality management.Statistical process control – is the application of statistical technique to the control of processes.Traceability – is the ability to trace the history, application, or location of an entity, by means of recorded identification.Validation - indicates confirmation by examination and provision of objective evidence that the particular requirements for a specific intended use are fulfilled (ISO)Verification - is the confirmation by examination and provision of objective evidence that specified requirements have been fulfilled (ISO)
Nutek, Inc.
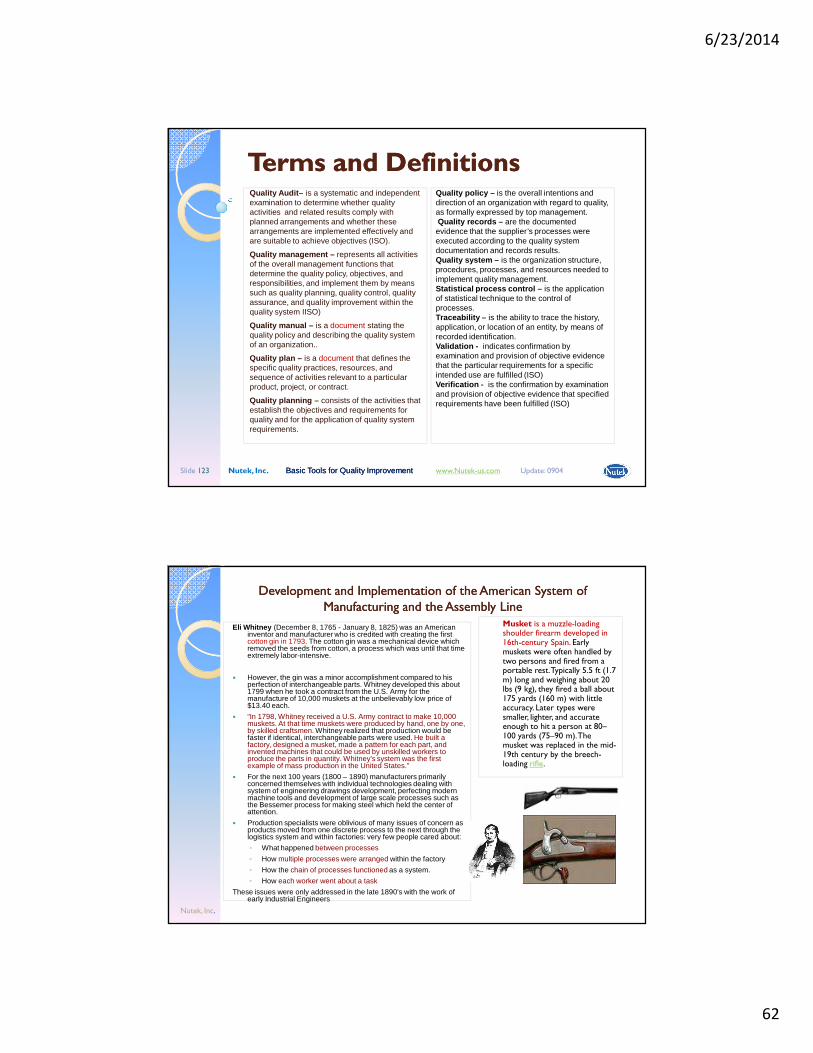
Development and Implementation of the American System of Development and Implementation of the American System of Manufacturing and the Assembly Line Manufacturing and the Assembly Line
Eli Whitney (December 8, 1765 - January 8, 1825) was an American inventor and manufacturer who is credited with creating the first cotton gin in 1793. The cotton gin was a mechanical device which removed the seeds from cotton, a process which was until that time extremely labor-intensive.
� However, the gin was a minor accomplishment compared to his perfection of interchangeable parts. Whitney developed this about 1799 when he took a contract from the U.S. Army for the manufacture of 10,000 muskets at the unbelievably low price of $13.40 each.
� “In 1798, Whitney received a U.S. Army contract to make 10,000 muskets. At that time muskets were produced by hand, one by one, by skilled craftsmen. Whitney realized that production would be faster if identical, interchangeable parts were used. He built a factory, designed a musket, made a pattern for each part, and invented machines that could be used by unskilled workers to produce the parts in quantity. Whitney's system was the first example of mass production in the United States.”
� For the next 100 years (1800 – 1890) manufacturers primarily concerned themselves with individual technologies dealing with system of engineering drawings development, perfecting modern machine tools and development of large scale processes such as the Bessemer process for making steel which held the center of attention.
� Production specialists were oblivious of many issues of concern as products moved from one discrete process to the next through the logistics system and within factories: very few people cared about:
◦ What happened between processes
◦ How multiple processes were arranged within the factory
◦ How the chain of processes functioned as a system.
◦ How each worker went about a task
These issues were only addressed in the late 1890's with the work of early Industrial Engineers
Musket is a muzzle-loading shoulder firearm developed in 16th-century Spain. Early muskets were often handled by two persons and fired from a portable rest. Typically 5.5 ft (1.7 m) long and weighing about 20 lbs (9 kg), they fired a ball about 175 yards (160 m) with little accuracy. Later types were smaller, lighter, and accurate enough to hit a person at 80–100 yards (75–90 m). The musket was replaced in the mid-19th century by the breech-loading rifle.
6/23/2014
63
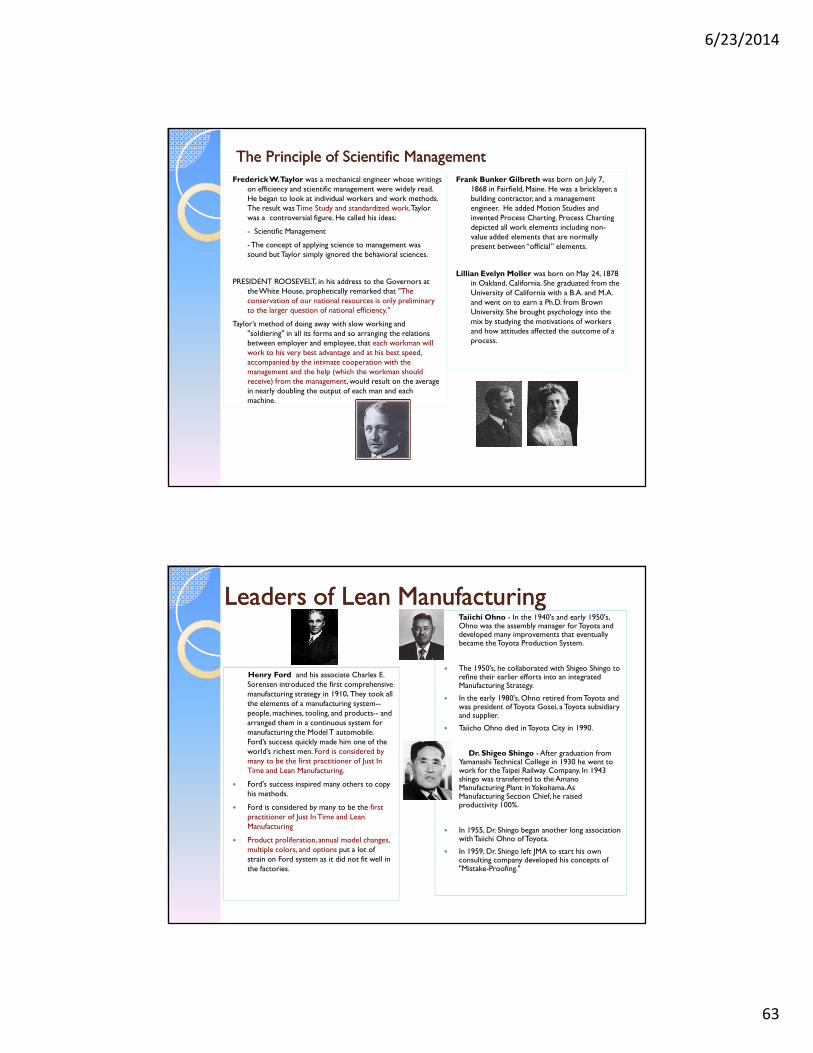
The Principle of Scientific ManagementThe Principle of Scientific Management
Frederick W. Taylor was a mechanical engineer whose writings on efficiency and scientific management were widely read. He began to look at individual workers and work methods. The result was Time Study and standardized work. Taylor was a controversial figure. He called his ideas:
- Scientific Management
-The concept of applying science to management was sound but Taylor simply ignored the behavioral sciences.
PRESIDENT ROOSEVELT, in his address to the Governors at the White House, prophetically remarked that "The conservation of our national resources is only preliminary to the larger question of national efficiency."
Taylor’s method of doing away with slow working and "soldiering" in all its forms and so arranging the relations between employer and employee, that each workman will work to his very best advantage and at his best speed, accompanied by the intimate cooperation with the management and the help (which the workman should receive) from the management, would result on the average in nearly doubling the output of each man and each machine.
Frank Bunker Gilbreth was born on July 7, 1868 in Fairfield, Maine. He was a bricklayer, a building contractor, and a management engineer. He added Motion Studies and invented Process Charting. Process Charting depicted all work elements including non-value added elements that are normally present between “official” elements.
Lillian Evelyn Moller was born on May 24, 1878 in Oakland, California. She graduated from the University of California with a B.A. and M.A. and went on to earn a Ph.D. from Brown University. She brought psychology into the mix by studying the motivations of workers and how attitudes affected the outcome of a process.
Leaders of Lean ManufacturingLeaders of Lean Manufacturing
Henry Ford and his associate Charles E. Sorensen introduced the first comprehensive manufacturing strategy in 1910.They took all the elements of a manufacturing system--people, machines, tooling, and products-- and arranged them in a continuous system for manufacturing the Model T automobile. Ford’s success quickly made him one of the world's richest men. Ford is considered by many to be the first practitioner of Just In Time and Lean Manufacturing.
� Ford's success inspired many others to copy his methods.
� Ford is considered by many to be the first practitioner of Just In Time and Lean Manufacturing
� Product proliferation, annual model changes, multiple colors, and options put a lot of strain on Ford system as it did not fit well in the factories.
Taiichi Ohno - In the 1940's and early 1950's, Ohno was the assembly manager for Toyota and developed many improvements that eventually became the Toyota Production System.
� The 1950's, he collaborated with Shigeo Shingo to refine their earlier efforts into an integrated Manufacturing Strategy.
� In the early 1980's, Ohno retired from Toyota and was president of Toyota Gosei, a Toyota subsidiary and supplier.
� Taiicho Ohno died in Toyota City in 1990.
Dr. Shigeo Shingo - After graduation from Yamanashi Technical College in 1930 he went to work for the Taipei Railway Company. In 1943 shingo was transferred to the Amano Manufacturing Plant in Yokohama. As Manufacturing Section Chief, he raised productivity 100%.
� In 1955, Dr. Shingo began another long association with Taiichi Ohno of Toyota.
� In 1959, Dr. Shingo left JMA to start his own consulting company developed his concepts of "Mistake-Proofing."
6/23/2014
64
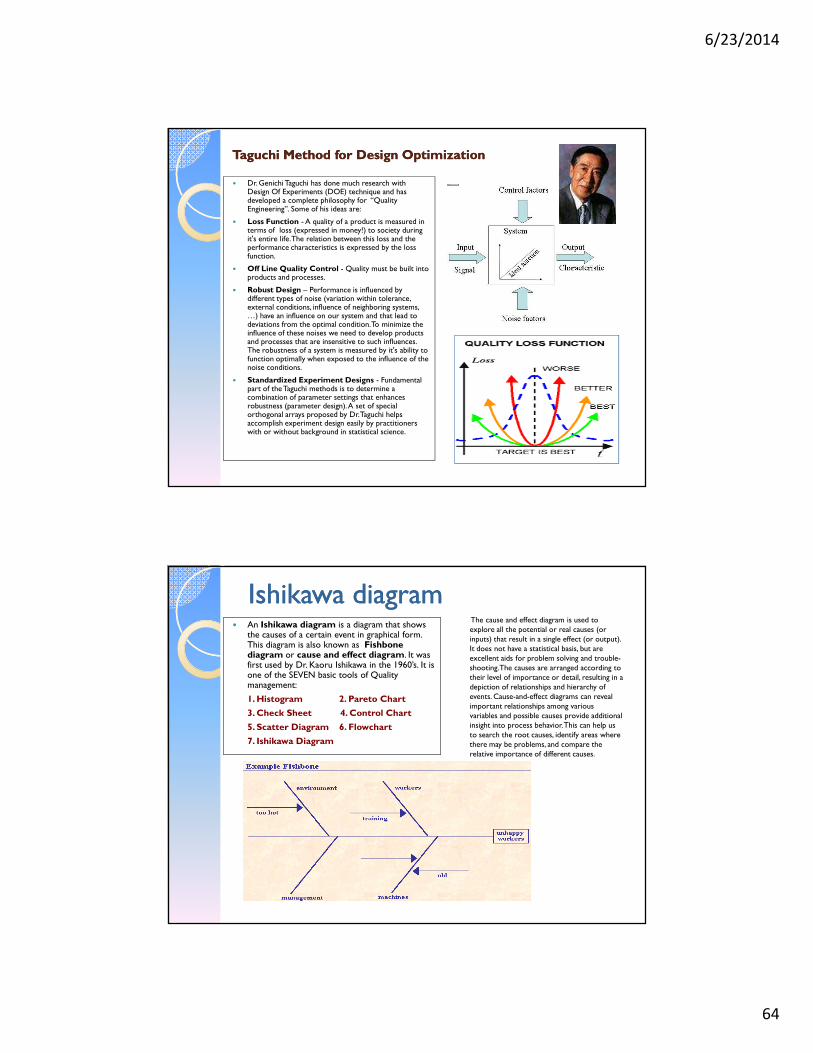
Taguchi Method for Design OptimizationTaguchi Method for Design Optimization
� Dr. Genichi Taguchi has done much research with Design Of Experiments (DOE) technique and has developed a complete philosophy for “Quality Engineering”. Some of his ideas are:
� Loss Function - A quality of a product is measured in terms of loss (expressed in money!) to society during it's entire life. The relation between this loss and the performance characteristics is expressed by the loss function.
� Off Line Quality Control - Quality must be built into products and processes.
� Robust Design – Performance is influenced by different types of noise (variation within tolerance, external conditions, influence of neighboring systems, …) have an influence on our system and that lead to deviations from the optimal condition. To minimize the influence of these noises we need to develop products and processes that are insensitive to such influences. The robustness of a system is measured by it's ability to function optimally when exposed to the influence of the noise conditions.
� Standardized Experiment Designs - Fundamental part of the Taguchi methods is to determine a combination of parameter settings that enhances robustness (parameter design). A set of special orthogonal arrays proposed by Dr. Taguchi helps accomplish experiment design easily by practitioners with or without background in statistical science.
Ishikawa diagramIshikawa diagram� An Ishikawa diagram is a diagram that shows
the causes of a certain event in graphical form. This diagram is also known as Fishbone diagram or cause and effect diagram. It was first used by Dr. Kaoru Ishikawa in the 1960’s. It is one of the SEVEN basic tools of Quality management:
1. Histogram 2. Pareto Chart
3. Check Sheet 4. Control Chart
5. Scatter Diagram 6. Flowchart
7. Ishikawa Diagram
The cause and effect diagram is used to explore all the potential or real causes (or inputs) that result in a single effect (or output). It does not have a statistical basis, but are excellent aids for problem solving and trouble-shooting. The causes are arranged according to their level of importance or detail, resulting in a depiction of relationships and hierarchy of events. Cause-and-effect diagrams can reveal important relationships among various variables and possible causes provide additional insight into process behavior. This can help us to search the root causes, identify areas where there may be problems, and compare the relative importance of different causes.
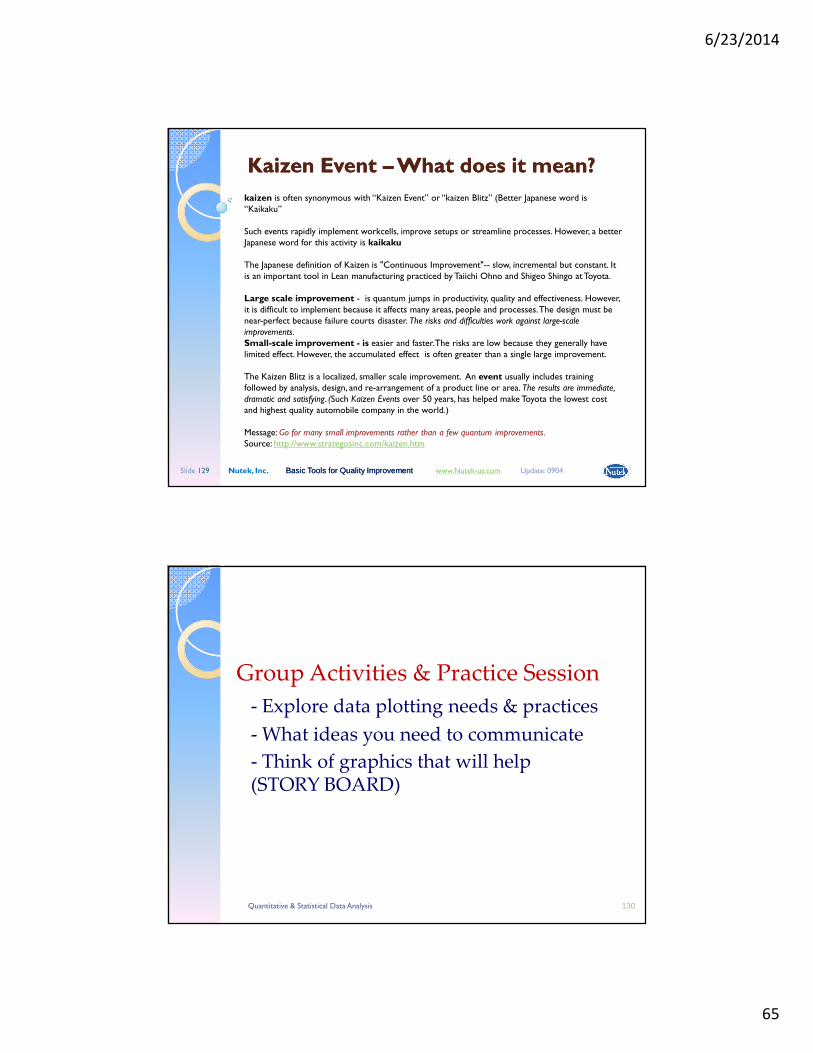
6/23/2014
65
Nutek, Inc. Basic Tools for Quality Improvement Basic Tools for Quality Improvement www.Nutek-us.com Update: 0904 Slide 129
Kaizen Event Kaizen Event ––What does it mean?What does it mean?
kaizen is often synonymous with “Kaizen Event” or “kaizen Blitz” (Better Japanese word is “Kaikaku”
Such events rapidly implement workcells, improve setups or streamline processes. However, a better Japanese word for this activity is kaikaku
The Japanese definition of Kaizen is "Continuous Improvement"-- slow, incremental but constant. It is an important tool in Lean manufacturing practiced by Taiichi Ohno and Shigeo Shingo at Toyota.
Large scale improvement - is quantum jumps in productivity, quality and effectiveness. However, it is difficult to implement because it affects many areas, people and processes. The design must be near-perfect because failure courts disaster. The risks and difficulties work against large-scale improvements.Small-scale improvement - is easier and faster. The risks are low because they generally have limited effect. However, the accumulated effect is often greater than a single large improvement.
The Kaizen Blitz is a localized, smaller scale improvement. An event usually includes training followed by analysis, design, and re-arrangement of a product line or area. The results are immediate, dramatic and satisfying. (Such Kaizen Events over 50 years, has helped make Toyota the lowest cost and highest quality automobile company in the world.)
Message: Go for many small improvements rather than a few quantum improvements.Source: http://www.strategosinc.com/kaizen.htm
Quantitative & Statistical Data Analysis 130
Group Activities & Practice Session
- Explore data plotting needs & practices
- What ideas you need to communicate
- Think of graphics that will help (STORY BOARD)
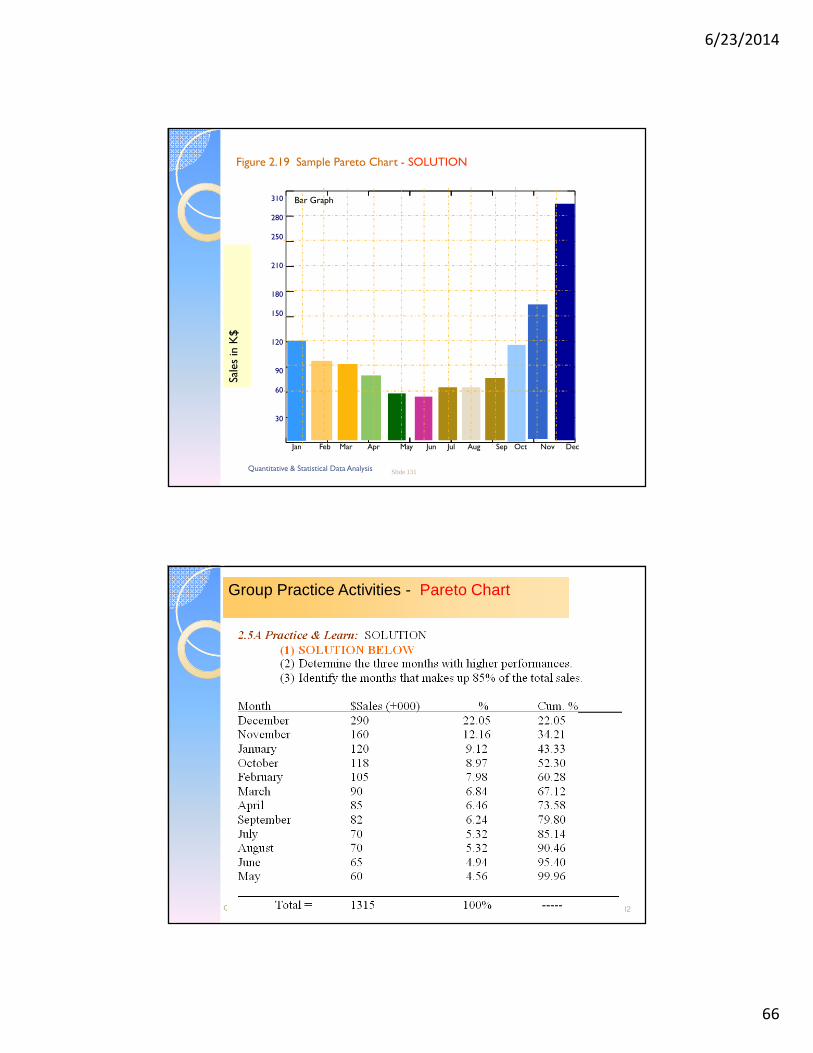
6/23/2014
66
Slide 131
Figure 2.19 Sample Pareto Chart - SOLUTION
310
280
250
210
180
150
120
90
60
30
Sales in K
$
Bar Graph
Jan Feb Mar Apr May Jun Jul Aug Sep Oct Nov Dec
Quantitative & Statistical Data Analysis
Quantitative & Statistical Data Analysis Slide 132
Group Practice Activities - Pareto Chart
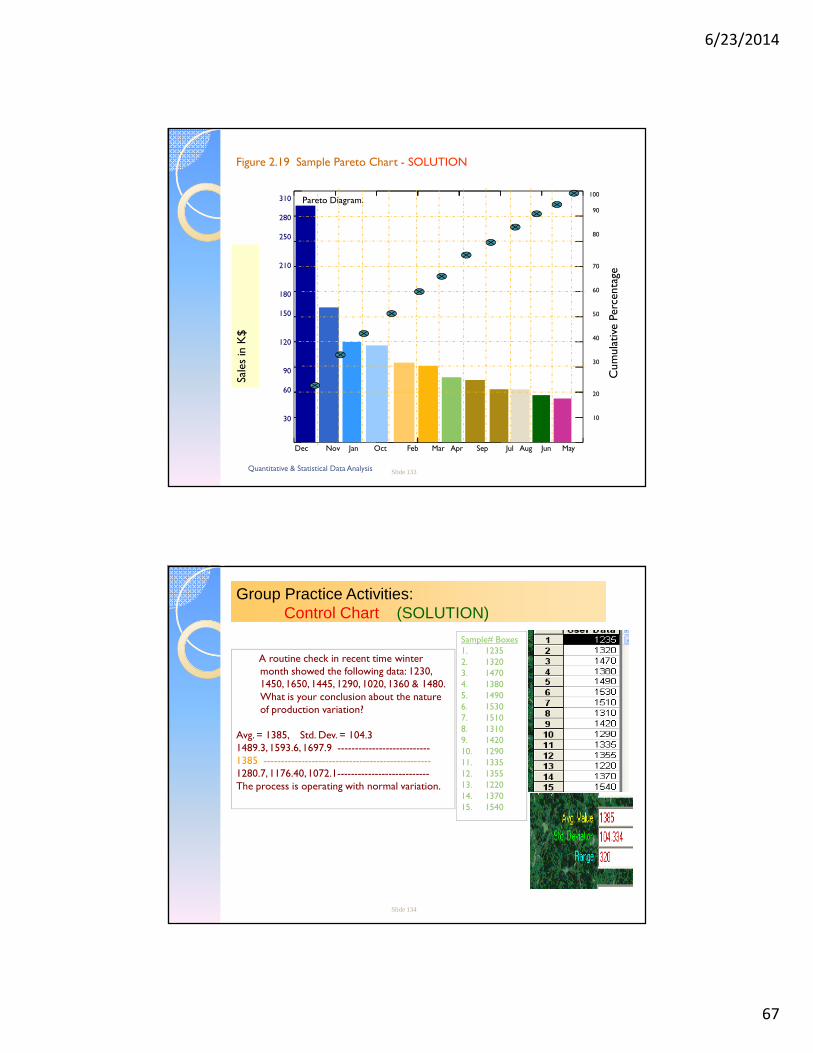
6/23/2014
67
Slide 133
Figure 2.19 Sample Pareto Chart - SOLUTION
310
280
250
210
180
150
120
90
60
30
Sales in K
$
100
90
80
70
60
50
40
30
20
10
Cumulative
Perce
ntage
Pareto Diagram.
Dec Nov Jan Oct Feb Mar Apr Sep Jul Aug Jun May
Quantitative & Statistical Data Analysis
Slide 134
A routine check in recent time winter month showed the following data: 1230, 1450, 1650, 1445, 1290, 1020, 1360 & 1480. What is your conclusion about the nature of production variation?
Avg. = 1385, Std. Dev. = 104.31489.3, 1593.6, 1697.9 ---------------------------1385 -------------------------------------------------1280.7, 1176.40, 1072.1---------------------------The process is operating with normal variation.
Sample# Boxes1. 12352. 13203. 14704. 13805. 14906. 15307. 15108. 13109. 142010. 129011. 133512. 135513. 122014. 137015. 1540
Group Practice Activities:Control Chart (SOLUTION)
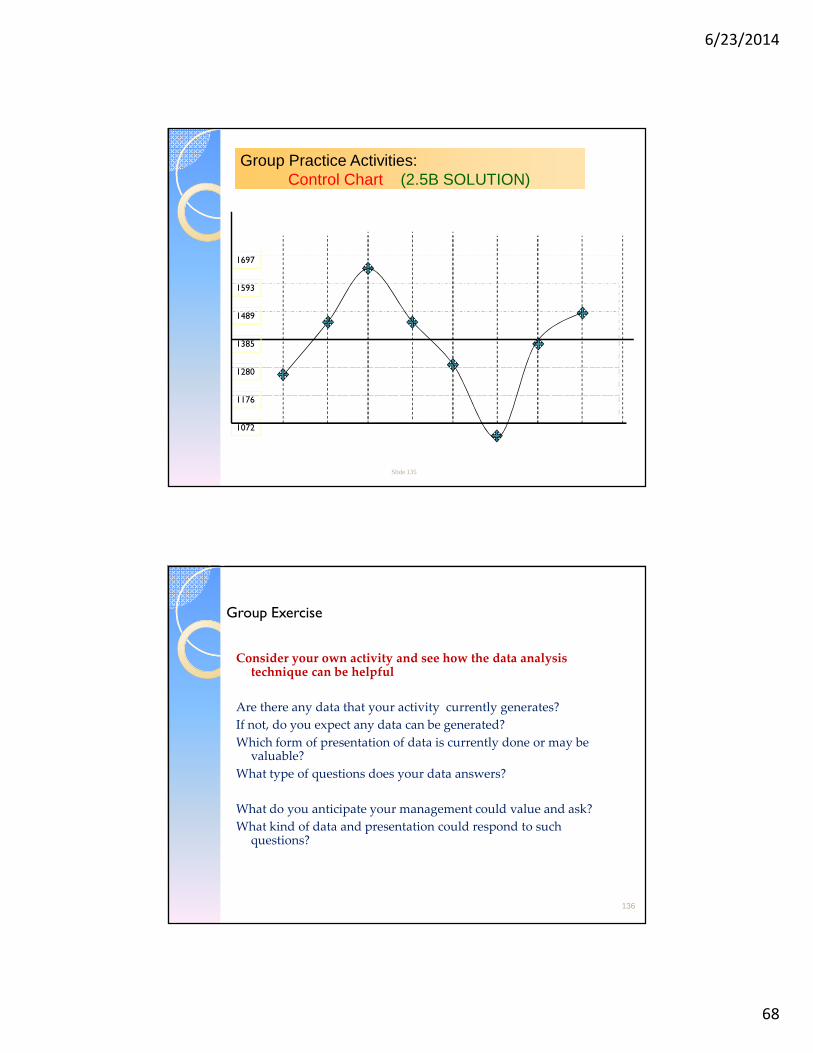
6/23/2014
68
Slide 135
Group Practice Activities:Control Chart (2.5B SOLUTION)
1697
1593
1489
1385
1072
1176
1280
136
Consider your own activity and see how the data analysis technique can be helpful
Are there any data that your activity currently generates?
If not, do you expect any data can be generated?
Which form of presentation of data is currently done or may be valuable?
What type of questions does your data answers?
What do you anticipate your management could value and ask?
What kind of data and presentation could respond to such questions?
Group Exercise