Embed Size (px)
Citation preview

Basic Competencies of the Graduates of BRAC Non-formal Primary Schools Declining
Samir R Nath Senior Research Fellow and
Co-ordinator, Educational Research Unit
January 2003
________________________________________________________________________ Educational Research Unit
Research and Evaluation Division, BRAC BRAC Centre, 75 Mohakhali Dhaka 1212, Bangladesh
Phone: 9881265 (ext. 2707), Fax: 8823542, Email: [email protected]

2
Table of Contents List of Tables and Figures 3 List of Annexes 4 Executive Summary 5 Introduction 7 Methodology 9
Definition of basic competency 9 The instrument to measure basic education 9 Defining the minimum level of competency 10 The study population 10 Sampling 11
Results 13
Socio-economic characteristics of the graduates 13 Basic competencies of the graduates of 2001 13 Trends in basic competencies 17
Overall trends: 1995 to 2001 18 Tracing the graduates of 1995 23 Tracing the graduates of 1997 25 Tracing the graduates of 1999 27 Performance after two years of graduation 28
Discussion and Conclusion 29 References 33 Annexes 35
3
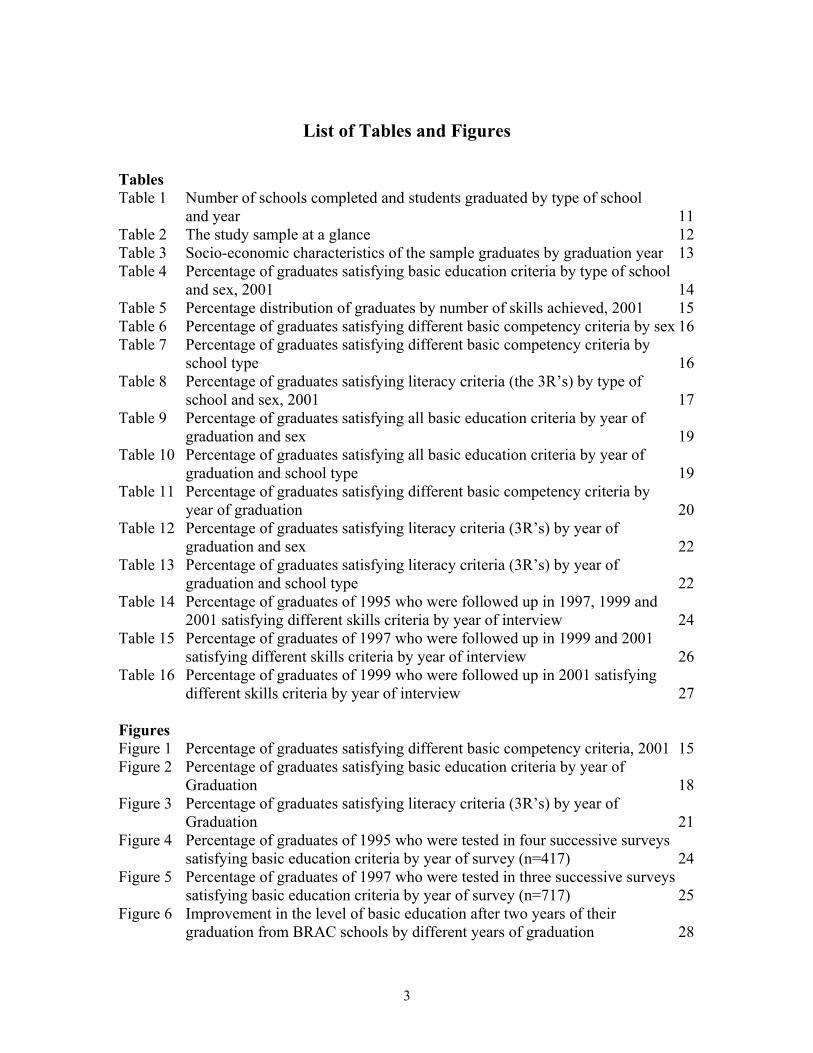
List of Tables and Figures Tables Table 1 Number of schools completed and students graduated by type of school and year 11 Table 2 The study sample at a glance 12 Table 3 Socio-economic characteristics of the sample graduates by graduation year 13 Table 4 Percentage of graduates satisfying basic education criteria by type of school and sex, 2001 14 Table 5 Percentage distribution of graduates by number of skills achieved, 2001 15 Table 6 Percentage of graduates satisfying different basic competency criteria by sex 16 Table 7 Percentage of graduates satisfying different basic competency criteria by school type 16 Table 8 Percentage of graduates satisfying literacy criteria (the 3R’s) by type of school and sex, 2001 17 Table 9 Percentage of graduates satisfying all basic education criteria by year of graduation and sex 19 Table 10 Percentage of graduates satisfying all basic education criteria by year of graduation and school type 19 Table 11 Percentage of graduates satisfying different basic competency criteria by year of graduation 20 Table 12 Percentage of graduates satisfying literacy criteria (3R’s) by year of graduation and sex 22 Table 13 Percentage of graduates satisfying literacy criteria (3R’s) by year of graduation and school type 22 Table 14 Percentage of graduates of 1995 who were followed up in 1997, 1999 and 2001 satisfying different skills criteria by year of interview 24 Table 15 Percentage of graduates of 1997 who were followed up in 1999 and 2001 satisfying different skills criteria by year of interview 26 Table 16 Percentage of graduates of 1999 who were followed up in 2001 satisfying different skills criteria by year of interview 27 Figures Figure 1 Percentage of graduates satisfying different basic competency criteria, 2001 15 Figure 2 Percentage of graduates satisfying basic education criteria by year of Graduation 18 Figure 3 Percentage of graduates satisfying literacy criteria (3R’s) by year of Graduation 21 Figure 4 Percentage of graduates of 1995 who were tested in four successive surveys satisfying basic education criteria by year of survey (n=417) 24 Figure 5 Percentage of graduates of 1997 who were tested in three successive surveys satisfying basic education criteria by year of survey (n=717) 25 Figure 6 Improvement in the level of basic education after two years of their graduation from BRAC schools by different years of graduation 28

4
List of Annexes Annex 1 Number of graduates surveyed and resurveyed in various years by school type and sex 35 Annex 2 Percentage of graduates satisfying different basic competency criteria by type of school and sex, 2001 36 Annex 3 Percentage of graduates satisfying life skills criteria by year of graduation and sex 36 Annex 4 Percentage of graduates satisfying reading skills criteria by year of graduation and sex 37 Annex 5 Percentage of graduates satisfying writing skills criteria by year of graduation and sex 37 Annex 6 Percentage of graduates satisfying numeracy skills criteria by year of graduation and sex 37 Annex 7 Percentage of graduates satisfying life skills criteria by year of graduation and school type 37 Annex 8 Percentage of graduates satisfying reading skills criteria by year of graduation and school type 38 Annex 9 Percentage of graduates satisfying writing skills criteria by year of graduation and school type 38 Annex 10 Percentage of graduates satisfying numeracy skills criteria by year of graduation and school type 38 Annex 00 Percentage distribution of graduates by number of skills achieved and year 38 Annex 11 Percentage of graduates of 1995 who were followed up in 1997, 1999 and 2001 satisfying different skills criteria by sex and year of interview 39 Annex 12 Percentage of graduates of 1995 who were followed up in 1997, 1999 and 2001 satisfying different skills criteria by school type and year of interview 39 Annex 13 Percentage of graduates of 1997 who were followed up in 1999 and 2001 satisfying different skills criteria by sex and year of interview 40 Annex 14 Percentage of graduates of 1997 who were followed up in 1999 and 2001 satisfying different skills criteria by school type and year of interview 40 Annex 15 Percentage of graduates of 1999 who were followed up in 2001 satisfying different skills criteria by sex and year of interview 40 Annex 16 Percentage of graduates of 1999 who were followed up in 2001 satisfying different skills criteria by school type and year of interview 41

5
Executive Summary Based on the Declaration of the World Conference on Education for All held in Jomtien in 1990, BRAC designed an instrument to measure the level of basic education of Bangladeshi children. The Research and Evaluation Division of BRAC regularly monitors the performance of the graduates of BRAC’s non-formal primary schools through this instrument. The instrument has four sections – reading, writing, numeracy and life skills/knowledge. A respondent satisfying the set criteria in all the four areas was considered as having basic education. This report presents the basic educational status of the graduates of four cohorts of 1995, 1997, 1999 and 2001. Four independent samples were drawn from these four cohorts and the graduates were tested after nine/ten months of their graduation. Besides, re-test of the previously assessed graduates were done during the following surveys. Sampling design was similar in each survey. Children from three types of BRAC schools were assessed, these are Non Formal Primary Education (NFPE) and Basic Education for Older Children (BEOC) directly run by BRAC Education Programme, and NFPE under the Education Support Programme (ESP) operated by other NGOs with support from BRAC. The sample size for the four independent surveys was about 1,260 each. Not all former graduates were found in the re-surveys, for instance only a third of the graduates of 1995 were common in all the four surveys. Major findings The graduates of 2001 1. On average, 62.5% of the graduates of 2001 satisfied all the four criteria of basic
education. According to school type, this rate was 65.6% for NFPE, 52.3% for BEOC and 78.7% for NFPE-ESP.
2. Over 19% of the graduates satisfied three criteria, 12.7% satisfied two, 3.8% one, and 1.4% could pass none of the criteria.
3. Gender variation was observed favouring the boys (67.7% vs. 59.6%). Such variation exists in both NFPE and BEOC, but not in NFPE-ESP.
4. Over 70% of the graduates satisfied the literacy criteria i.e., reading, writing and numeracy. Literacy rate was 76.3% among the boys and 68.5% among the girls.
5. Skill-wise analysis showed that, on average, 79% of the graduates satisfied the criteria of life skills, 84.8% reading, 83.1% writing, and 91.2% numeracy.
6. Among the six groups of students the girls of BEOC showed the worst performance, only 49% of them achieved basic education and 63.8% satisfied the literacy criteria.
Overall change: 1995 to 2001 7. The overall performance of the programme is decreasing significantly. On average, the
proportion of graduates satisfying the criteria of basic education was 73.7% in 1995, 69.3% in 1997, 68.7% in 1999, and 62.5% in 2001. The literacy rates were 78.5%, 75.4%, 74.9%, and 71.3% respectively in 1995, 1997, 1999, and 2001.
8. There was no gender variation in the levels of basic education and literacy among the graduates of 1995 and 1997. However, boys outperformed the girls in 1999 first, which continued till 2001. Such gender difference was found only among the graduates of NFPE in 1999, and in both NFPE and BEOC in 2001.
9. Skill-wise analysis shows that the performance declined in three areas viz., life skills/knowledge, reading and numeracy, however was constant in writing.
6
10. Numeracy was the area where gender difference was found among the graduates of all the four cohorts. Boys did significantly better than the girls in all the four surveys.
1995 graduates: 1995 to 2001 11. The level of basic education of the graduates of 1995, who were tested in four successive
surveys, increased over time, 72% in 1995 to 83.6% in 1997, 83.6 in 1999, and 84.6% in 2001. Skill-wise analysis shows improvement in all the four areas.
1997 graduates: 1997 to 2001 12. The performance of the graduates of 1997 who were re-interviewed in the following two
surveys also increased over time, 71.1% in 1997 to 79.9% in 1999, and 81% in 2001. Performance improved in three areas – life skills/knowledge, reading and numeracy.
13. The performance of the graduates of NFPE-ESP was worst in 1997, however it overcome the situation in 1999 and then continued its progress up to 2001.
1999 graduates: 1999 to 2001 14. Basic educational performance of the graduates of 1999 increased in two years, from
68.7% in 1999 to 73.9% in 2001. Conclusions 1. The overall performance of the programme is gradually declining. Higher level of
deterioration was seen in BEOC. 2. Gender gap against girls is gradually increasing. Numeracy is the area where the
performance of the girls was behind the boys in all the four surveys. 3. Incorporation of life skills/knowledge is a strong point in BRAC curriculum.
Performance in life skills/knowledge seriously deteriorated in recent years, especially in BEOC schools.
4. The level of basic education of the former graduates increased over the period due to higher knowledge retention rate and admission in formal schools. Major improvement occurred during the first two years of graduation from BRAC schools.
Recommendations 1. An in-depth study on the BEOC schools is necessary. 2. There is a need to prepare a guideline for teachers and programme organisers which may
help shaping their attitude and behaviour to make it more gender sensitive. This can be a common issue for discussion in the training sessions and grassroots level meetings.
3. A quality monitoring system incorporating indicators on classroom activities, attainment of the students in various subject areas, and gender related matters may be introduced. Results of this system can be used for improvement of pupils’ quality and inequality among them.

7
Introduction The World Conference on Education for All (WCEFA), held in Jomtein, Thailand in
1990, asked the nations to equip their people with basic education. The definition of basic
education was not limited only by 3Rs (reading, writing, and numeracy); the idea of life
skills was also incorporated in it. As a signatory to the declaration of the conference
Bangladesh was committed to impart basic education to at least 80% of her school aged
children by the year 2000 AD. However, like many other developing countries
Bangladesh could not achieve the goal within the time frame mentioned above. A recent
study showed that if the rate of progress in the level of basic education of children
remains as it is, Bangladesh would not achieve the WCEFA goal before 2093 AD (Nath
and Chowdhury, 2002). Bangladesh also participated in the Dakar Conference, and again
refreshed its commitments to achieve Education for All (EFA) by 2015 AD. The
challenge for Bangladesh is to keep its words to do so without postponing the
commitment again.
Although it was not possible for the nation to equip its people with minimum level of
education many attempts have been taken during the 1990s and onwards in the expansion
of primary education in the country. Government accepted a culture of pluralism in this
sector, 11 types of primary schools are there in operation. Food for Education was in
operation and the education ministry provides stipends to increase enrolment. Private
sector is encouraged to open primary schools and the non-governmental organisations
have been operating non-formal primary schools to complement the government
initiatives.
BRAC, a non-governmental development organisation has been operating non-formal
primary education programme since 1985. It has two types of schools. One is called Non
Formal Primary Education (NFPE) and the other is Basic Education for Older Children
(BEOC). The students of NFPE are relatively younger than those of BEOC. Both NFPE
and BEOC had three-year course. Few years back the NFPE has been modified as a four-
year course. Although most of the NFPE schools operate four-year course, some (where

8
teachers are not well equipped to teach the students of Grades IV and V) still run three-
year course. Whatever the case is, the programme organisers of BRAC take the graduates
to enrol in nearby formal schools for further education. Besides, under Education Support
Programme (ESP) BRAC helps (both financial and material) local NGOs to run NFPE
type of schools in their working areas.
After the Jomtein Conference, with financial assistance from UNICEF Bangladesh, the
Research and Evaluation Division (RED) of BRAC developed a simple methodology
called Assessment of Basic Competencies or ABC to monitor basic educational level in
Bangladesh (UNICEF, 1992; Chowdhury et al, 1994). Besides the national surveys,
BRAC launched a systematic and longitudinal assessment of the graduates of its
education programme in 1995. This initiative is known as ‘tracer study’. Under this
system a representative sample of BRAC school graduates of 1995 was first assessed in
the same year. After two years (in 1997) a new cohort of graduates was added with this
and the graduates of 1995 were also attempted to trace and assess. Similarly, in 1999 and
2001, two new cohorts were added and the previously assessed graduates were also traced.
Thus, the graduates of four different cohorts are included in this report.
This report presents primarily the findings from the latest survey. Findings from the
previous surveys were also used for comparison purposes. Data of earlier surveys were
used to show the progress of the ex-graduates of BRAC schools. This report covers the
following.
• Basic educational attainment of BRAC school graduates of 2001;
• Level and trend of basic educational attainment of BRAC school graduates from
1995 to 2001;
• Trends in basic educational attainment of BRAC school graduates of 1995, 1997
and 1999 over the period; and
• Above estimates segregating the data by gender and school type.

9
Methodology The methodology used in this study was developed in Bangladesh and was used twice to
measure the level of basic education nationally (UNICEF, 1992; Chowdhury et al., 1994,
1999; Nath et al., 1993). The process development involved consultation with experts
from different universities and with organisations at home and abroad.
Definition of basic competency
Considering the definition of ‘basic education’, ‘basic learning needs’ and ‘learning
achievement’ by the Inter-Agency Commission of the World Conference on Education
for All (WCEFA, 1990), the advisory group of 1992 ABC survey modelled the following
definition of ‘basic competency’ for Bangladesh:
Basic education will refer to education intended to develop basic learning
skills (i.e., the 3Rs) as well as some basic life skills necessary for the children
to survive, to improve the quality of their lives and to continue learning.
The instrument to measure basic education
The instrument, designed in accordance with the definition, had four sections: reading,
writing, numeracy and life skills/knowledge. A variety of questions were set for each
section. The modified instrument used in the 1993 national survey was used in this
survey with a total of 42 items (questions).
There were ten questions under ‘life skills/knowledge’ section. Six of them were on
health, one on poultry/livestock, one on population, one on basic attitude about gender,
and the last one was on specific knowledge of the outside world.
The ‘reading skills’ section consisted of three parts. The first part contained five words
with different difficulty levels, the second part contained a sentence with five words, and
the third part included a comprehension passage related to life in Bangladesh and
conveyed a development message.

10
The ‘writing skills’ section of the instrument had four parts – writing own name and the
name of the village, words, a sentence, and a letter.
There were six parts in the ‘numeracy skills’ section. These are counting numbers,
reading numbers, writing numbers, addition, subtraction, and mental arithmetic. For
further details on the design and its modification see: Chowdhury et al., 1992 and Nath et
al., 1993.
Information on a number of socio-economic characteristics of the graduates and their
parents and households were also collected from parents/guardians.
Defining the minimum level of competency
Respondents satisfying the following criteria were considered having ‘basic competency’,
as in all previous surveys:
a) answering ‘correctly’ at least seven of the ten life skill questions;
b) answering ‘correctly’ at least three of the four questions from comprehension
passage;
c) ‘correctly’ communicating a given message through writing a letter to his/her father
or any relative; and
d) answering ‘correctly’ at least three of the four mental arithmetic questions.
The study population
The study population consists of four cohorts of BRAC school graduates from three types
of schools – NFPE, BEOC and ESP. Two points might help the readers to understand
more about the study population. Firstly, only the NFPE and BEOC schools located in
rural areas where BRAC development programme (BDP) exists were considered.
Secondly, earlier the NFPE programme was a three years course, so the surveys of 1995,
1997, and 1999 considered only those graduates who completed the three-year
curriculum. The 2001 cohort had nearly 80 percent of the schools continuing fourth grade
in NFPE and rests discontinued after third grade. Many of the students of these

11
discontinued schools might be enrolled in formal schools in grade IV. Table 1 shows the
population size of this study.
Table 1 Number of schools completed and students graduated by type of school and year
Type of school Year
NFPE BEOC NFPE-ESP Total number
of school Approximate number of students graduated
1995 3,008 856 129 3,993 119,790 1997 9,231 2,236 85 11,552 378,708 1999 6,452 2,230 930 9,612 293,166 2001 6,964 3,682 1,010 11,656 372,997
Sampling
The 30 cluster sampling procedure previously used in many educational studies in
Bangladesh including Assessment of Basic Competencies (ABC) at national level was
considered for this study. For NFPE and BEOC schools 30 teams were randomly
selected. Similarly, for ESP schools 30 NGOs were selected. Because, the BRAC
operated schools are clustered in teams at the lower level and the ESP schools are
clustered under the local level NGOs. From each selected team/NGO two schools
completing the course were chosen, one randomly and another one adjacent to the already
selected one. The graduates of these two schools were then grouped sex-wise. Seven
graduates from each group were selected randomly. Altogether 420 graduates (210 boys
and 210 girls) from each type of schools were selected. Each study year a new cohort of
graduates was added with the system and previously surveyed graduates were attempted
to trace for re-survey. However, not all could be traced due to unavailability in the
previous areas. This reduced the sample size in the successive re-surveys. Table 2
presents sample size at a glance and Annex 1 provides the same in detail.
In each survey, the nucleus of data collection was a team of two test administrators.
While one person took the test the rest one kept the noise down and onlookers away. All
the tests were held at the premises of the respondent graduates. Adequate number of
supervisors supervised the field activities. All the four surveys were carried out during

12
October – November of the survey years. Before the surveys, the test administrators and
their supervisors were given three days of intensive training. An instruction manual
describing all details of the ABC test was used in the training sessions.
Table 2 The study sample at a glance
Number of graduates Year of
graduation Surveyed in the year of graduation
Re-surveyed in 1997
Re-surveyed in 1999
Re-surveyed in 2001
Common in all
surveys 1995 1259 945 (75.1) 812 (64.5) 607 (48.2) 417 (33.1) 1997 1259 – 991 (78.7) 827 (65.7) 717 (56.9) 1999 1259 – – 945 (75.1) 945 (75.1) 2001 1256 – – – –
Figures in the parentheses indicate percentage of graduates traced in successive re-surveys. Attempts were made to ensure the quality of test data. Each year a number of sampled
graduates were chosen randomly for re-testing. Instead of repeating the whole test a
section was administered in the re-test. The matching exercise between the data collected
in the test and re-test found that most of the items matched in more than 90 percent of the
cases. This indicates that the data quality was very good. Reliability of the data was also
checked through Kuder-Rechardson formula number 20 (KR 20). The reliability co-
efficient was found 0.88 in 1995, 0.87 in 1997, 0.90 in 1999 and 0.87 in 2001. These
ensure a satisfactory level of data reliability.
The numbers of graduates in different types of schools are not equal, but their
representation in the sample is equal (Tables 1 and 2). Again, the number of boys and
girls are un-equal in these schools. To deal with such situation some weighting factors
need to be used for pooling the data for aggregate estimate. Adequate statistical measures
were taken to deal with this (Cochran, 1977).

13
Results Socio-economic characteristics of the graduates
Collection of socio-economic information of the graduates is a part of the tracer study.
Table 3 provides socio-economic background of the graduates of different years collected
during the surveys of respective years. Average age of the graduates of all the four
cohorts was similar. Parental education of the graduates improved over time, indicating
lesser proportion of children with illiterate parents enrolled in BRAC schools in recent
years. Self-rated food security status and labour selling status of the households also
indicate that graduates of recent years came from slightly better off households compared
to those of previous years.
Table 3 Socio-economic characteristics of the sample graduates by year of graduation
Year of graduation Socio-economic characteristics
1995 1997 1999 2001 Mean age (in year) 12.3 12.4 12.1 12.0 Enrolment in formal school after graduation (%) - - 93.7 92.0 Enrolled in other schools before enrolled in BRAC schools (%) 16.3 12.4 13.9 16.5 Mothers never attended in school (%) 77.8 73.8 70.2 70.1 Fathers never attended in school (%) 59.2 56.3 46.5 51.8 Yearly food security status as deficit (%) 53.9 53.3 54.2 34.7 Households with <50 decimals of land (%) 57.5 63.8 61.5 58.8 Households survive on selling manual labour (%) 54.4 43.9 58.0 48.0 Households with <50 decimals of land or selling manual labour 71.1 69.1 75.9 70.7 Households with NGO membership (%) 54.1 49.7 52.9 46.2 Non-Muslim graduate (%) 4.9 15.5 8.2 9.0
Note: The above information were collected during the surveys of respective years Basic competencies of the graduates of 2001
This section is based on the test results of the graduates of 2001, i.e., the first round test
results of the latest cohort entered into the study. According to the operational definition
of basic competency used in all previous surveys of the similar kind, 62.5 percent of the
BRAC schools graduates of 2001 satisfied all the four criteria of basic competency
(Table 4). The performance significantly varied by school type (p<0.001). For instance,
the graduates of NFPE schools under education support programme (ESP) did the highest
score, 78.7 percent of these graduates satisfied the minimum criteria of the test. On the

14
other hand, this was 65.6 percent among the graduates of NFPE directly operated by
BRAC Education Programme (BEP), and only 52.3 percent for BEOC graduates. Other
way, it can be said that BEP operated NFPE is 13.1 percentage points behind the NFPE
under ESP, and BEOC is 26.4 percentage points behind the same. Difference between
NFPE and BEOC us 13.3 percentage points. School type-wise significant difference also
exists when data were analysed separately for boys and girls (p<0.001).
Table 4
Percentage of graduates satisfying basic education criteria by type of school and sex, 2001
Sex Type of school Boys Girls
Both (weighted)
Level of significance
NFPE 71.4 62.7 65.6 p<0.05 BEOC 58.4 49.0 52.3 p<0.05 NFPE-ESP 78.1 78.8 78.7 ns All (weighted) 67.7 59.6 62.5 p<0.01 Level of significance p<0.001 p<0.001 p<0.001
ns: not significant at p = 0.05
Statistically significant gender difference was observed in the performance of the
graduates of 2001 (p<0.01). Nearly 60 percent of the girls and 67.7 percent of the boys
achieved basic competencies. On the other way, the boys were ahead of the girls with 8.1
percentage points. Gender difference was also seen in the performances of the graduates
of two types of schools directly operated by BEP (i.e., NFPE and BEOC), not in NFPE
under ESP. In both, the boys out-performed the girls. It can be mentioned that less than
half of the girls of BEOC achieved all the four criteria of basic competency.
On average, 1.4 percent of the graduates achieved none of the competencies, 3.8 percent
achieved only one, 12.7 percent achieved two, and 19.6 percent achieved three (Table 5).
Nearly two percent of the girls and 0.2 percent boys achieved none of the basic
competencies. Over a quarter of the BEOC graduates achieved three competencies and
14.5 percent achieved two. Compared to others proportion of graduates achieving two or
three competencies was much higher for BEOC schools (41.2%). This indicates why the

15
graduates of these schools could not go with those of other types of schools in basic
competency running.
Table 5
Percentage distribution of graduates by number of skills achieved, 2001
Sex Type of school Number of skills Boys Girls NFPE BEOC NFPE-ESP
All graduates
Nil 0.2 1.9 1.7 1.2 0.7 1.4 1 3.2 4.1 3.1 5.5 3.1 3.8 2 11.8 13.4 12.8 14.4 5.8 12.7 3 17.1 21.0 16.8 26.6 11.7 19.6 4 67.7 59.6 65.6 52.3 78.7 62.5
Graduates overall performances in each of the four skill areas are presented in Figure 1.
Graduates, on average, did very well in numeracy and poorly in life skills/ knowledge.
Seventy nine percent of the graduates of 2001 satisfied the criteria of life skills, 84.8
percent reading skills, 83.1 percent writing skills and 91.2 percent numeracy skills.
79 84.8 83.191.2
62.5
0
20
40
60
80
100
Life skills Reading skills Writing skills Numeracy skills All four skills
Figure 1 Percentage of graduates satisfying different basic competency criteria,
2001
Statistically significant gender difference favouring boys was observed in reading,
writing and numeracy, not in life skills/ knowledge (Table 6). Such variation was much
higher in numeracy than other skill areas, 95.4 percent boys and 89.2 percent girls

16
achieved the criteria of numeracy (p<0.001). In life skills, the graduates of both gender
performed equally.
Table 6
Percentage of graduates satisfying different basic competency criteria by sex
Sex Skill areas Boys Girls
Both
Level of significance
Life skills 80.6 78.0 79.0 ns Reading skills 87.6 83.3 84.8 p<0.05 Writing skills 85.7 81.7 83.1 p<0.05 Numeracy skills 95.4 89.2 91.2 p<0.001
ns: not significant at p = 0.05 Like overall performance, skills-wise analysis also shows a wide variation by school type
(Table 7). Such variation was observed in three skill areas viz., life skills, reading and
writing. In all the three skill areas, the graduates of NFPE under education support
programme showed best performance and the graduates of BEOC did worst. Of the skill
areas assessed under this study, highest variation by school type was shown in life skills,
over 20 percentage points. In life skills, 70.4 percent of BEOC graduates, 81.9 percent of
NFPE, and 90.7 percent of NFPE-ESP crossed the minimum level of competency. Such a
poor performance of the BEOC graduates in life skills /knowledge lead them to do poorly
in overall competency race. No statistically significant school-wise variation was seen in
numeracy. Ninety percent or more of the graduates of all the three types of schools
achieved numeracy competency.
Table 7
Percentage of graduates satisfying minimum criteria in different skill areas by school type
Type of school Skill areas NFPE BEOC NFPE-ESP
Level of significance
Life skills 81.9 70.4 90.7 p<0.001 Reading skills 86.6 80.0 89.2 p<0.001 Writing skills 83.5 80.2 91.1 p<0.001 Numeracy skills 90.0 93.1 93.5 ns
ns: not significant at p = 0.05

17
Analyses of data by school type and sex are presented in Annex 2. No gender difference
was observed among any group of graduates in two skill areas viz., life skills and writing.
In reading, only the boys of NFPE did better then the girls of similar type of schools. On
the other hand, in numeracy, the boys of all the three types of schools showed better
performance than the girls.
Literacy was defined considering three skill areas viz., reading, writing and numeracy. In
other words, literacy is nothing but ‘basic education’ minus the ‘life skills’. On average,
71.3 percent of the graduates satisfied the criteria of ‘literacy’. Literacy rate was 76.3
percent for boys and 68.5 percent for girls (p<0.001). Similar to basic competency,
school type-wise significant variation was observed in the case of literacy. The graduates
of NFPE-ESP did best and the graduates of BEOC did the worst. Separately, 81.1 percent
of NFPE-ESP, 72.7 percent of NFPE, and 65.9 percent of BEOC graduates had literacy
skills. Statistically significant gender difference favouring boys was observed only
among the graduates of NFPE schools (79% vs. 69.4%; p<0.05).
Table 8
Percentage of graduates satisfying literacy criteria (the 3Rs) by type of school and sex, 2001
Sex Type of school Boys Girls
Both (weighted)
Level of significance
NFPE 79.0 69.4 72.7 p<0.05 BEOC 69.9 63.8 65.9 ns NFPE-ESP 81.9 80.8 81.1 ns All (weighted) 76.3 68.5 71.3 p<0.001 Level of significance p<0.001 p<0.001 p<0.001
ns: not significant at p = 0.05 Trends in basic competencies
This section presents trends and changes in the level of basic competencies of the
graduates of BRAC schools. It has four parts. The first part provides information on
overall trend in basic competency level over the last six years (1995 to 2001). The second
part shows the changes in basic competency level of the graduates of 1995 over a period
of six years, the third part shows such change of the graduates of 1997 over a period of

18
four years (1997 to 2001), and the fourth part shows such change of the graduates of
1999 over a period of two years (1999 to 2001)
Overall trends: 1995 to 2001
Four separate representative samples from the graduates of four different cohorts were
analysed in this part; these are the graduates of 1995, 1997, 1999, and 2001. As each
sample represents the graduates of that cohort this analysis gives an assessment of the
system over the period. Figure 2 presents proportion of graduates satisfying all the basic
education criteria by year of graduation. It shows a statistically significant decline in the
level of basic competencies of the BRAC school graduates (p<0.001). In 1995, the level
of basic competencies was 73.7 percent, which reduced to 69.3 percent in 1997, 68.7
percent in 1999, and 62.5 percent in 2001. In other words, the level of basic competencies
of the BRAC school graduates reduced 11.2 percentage points over the period of six
years (1995 to 2001).
73.7 69.3 68.7 62.5
0
20
40
60
80
1995 1997 1999 2001
Figure 2 Percentage of graduates satisfying basic education criteria by year of
graduation
Separate analyses for boys and girls are presented in Table 9. It shows that the level of
basic education significantly deteriorated among both boys and girls. However,
deterioration was more among the girls than boys (14.4 vs. 5.3 percentage points).
Although there was no gender variation in the level of basic education of the BRAC
school graduates during 1995 and 1997, the boys surpassed the girls afterwards. The boys
of 1999 and 2001 showed significantly better performance compared to the girls. Another

19
observation is that in 1995 the girls were one-percentage points ahead of the boys, but
now the boys are 8.1 percentage points ahead of the girls.
Table 9
Percentage of graduates satisfying all basic education criteria by year of graduation and sex
Year of graduation Sex 1995 1997 1999 2001
Significance
Boys 73.0 68.4 73.9 67.7 p<0.05 Girls 74.0 69.7 66.5 59.6 p<0.001 All 73.7 69.3 68.7 62.5 p<0.001 Significance ns ns p<0.01 p<0.01
ns: not significant at p = 0.05 School type-wise similar analysis is provided in Table 10. The performance of the
graduates of NFPE gradually reduced from 72.9 percent in 1995 to 65.6 percent in 2001,
7.3 percentage points over the period but such reduction was not statistically significant.
The performance of BEOC graduates were slightly better than that of NFPE graduates in
previous three surveys which rigorously reduced in the last survey. Performance of these
graduates was 76.3 percent in 1995 that reduced to 52.3 percent in 2001, 24 percentage
points over the period. Major reduction occurred from 1999 to 2001, 15.7 percentage
points. The case of NFPE-ESP is different from others. In 1995, 75.3 percent of the
graduates of NFPE-ESP had basic education which dropped to only 49 percent in 1997,
again increased to 76.8 percent in 1999 and to 78.7 percent in 2001. No school-wise
variation was observed in the performance in 1995, however such variation occurred in
1997 first and continued afterwards.
Table 10
Percentage of graduates satisfying all basic education criteria by year of graduation and school type
Year of graduation Sex 1995 1997 1999 2001
Significance
NFPE 72.9 69.0 67.9 65.6 ns BEOC 76.3 71.2 68.0 52.3 p<0.001 NFPE-ESP 75.3 49.0 76.8 78.7 p<0.001 All 73.7 69.3 68.7 62.5 p<0.001 Significance ns p<0.001 p<0.01 p<0.001
ns: not significant at p = 0.05

20
Table 11 provides performance of the graduates in different skill areas. On average, the
performance of the graduates significantly declined in three skill areas viz., life skills,
reading and numeracy. No significant variation was observed in writing over the period
of six years. During last six years, graduates performance declined 8.5 percentage points
in life skills, 4.8 percentage points in reading, 1.5 percentage points in writing, and 4.3
percentage points in numeracy. Although the situation declined in all the assessment
areas, major reduction occurred in life skills.
Annexes 3 to 6 provide above analyses for boys and girls separately. No gender
difference was occurred in life skills/ knowledge in any cohort of graduates. This means
that on average, the students in BRAC schools are getting life skills knowledge without
any gender bias. There was no gender variation in reading among the graduates of 1995
and 1997. However, the girls lagged behind the boys in the surveys of 1999 and 2001. No
gender variation was seen in writing among the graduates of 1995 and 1999, but the girls
out performed the boys in 1997 and the boys did so in 2001. In numeracy, the boys
surpassed the girls in all the surveys.
Over the period, the performance of the boys significantly reduced in three assessment
areas viz., life skills, writing and numeracy, but not in reading. On the other hand, girls
performance significantly reduced over the period in all the assessment areas. Major
deterioration occurred in life skills/ knowledge.
Table 11 Percentage of graduates satisfying different basic competency criteria by year of graduation
Year of graduation Skill areas
1995 1997 1999 2001 Level of
significance
Life skills 87.5 87.1 84.7 79.0 p<0.001 Reading skills 89.6 86.5 85.6 84.8 p<0.01 Writing skills 84.6 85.8 85.7 83.1 ns Numeracy skills 95.5 93.6 92.0 91.2 p<0.001
ns: not significant at p = 0.05

21
Similar analyses by school type are provided in Annexes 7 to 10. Although performance
of the graduates of NFPE reduced in all skill areas, however significant reduction was
found only in numeracy. For BEOC, statistically significant reduction was occurred in
all skill areas except writing. On the other hand, performance of the NFPE-ESP graduates
suddenly dropped in 1997. However, they recovered it within a very short period. It is
significant to mention that the graduates of NFPE-ESP showed best performance in 1999
and 2001 compare to those of other two types of schools.
As mentioned earlier, literacy is defined as ‘basic education’ minus ‘life skills/
knowledge’, in other words it is a combination of 3Rs viz., reading, writing and
numeracy. Performance of the graduates reduced in literacy too (Figure 3). The literacy
rate was 77.6 percent in 1995, 74.8 percent in 1997, 73.8 percent in 1999, and 72.7
percent in 2001. Such reduction is slower than that of ‘basic education’. This is because
highest loss of competency occurred in ‘life skills/knowledge’, which is not counted in
measuring ‘literacy’.
78.5 75.4 74.9 71.3
0
20
40
60
80
100
1995 1997 1999 2001
Figure 3 Percentage of graduates satisfying literacy criteria (3R's) by year of
graduation
22
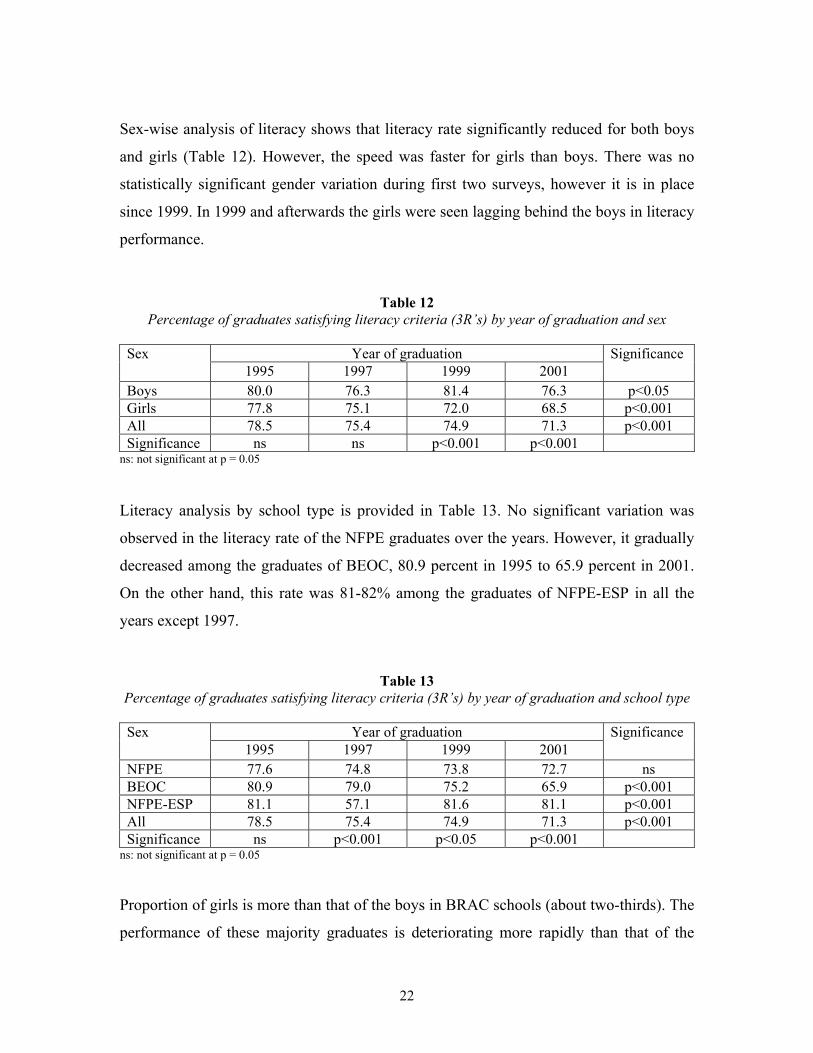
Sex-wise analysis of literacy shows that literacy rate significantly reduced for both boys
and girls (Table 12). However, the speed was faster for girls than boys. There was no
statistically significant gender variation during first two surveys, however it is in place
since 1999. In 1999 and afterwards the girls were seen lagging behind the boys in literacy
performance.
Table 12 Percentage of graduates satisfying literacy criteria (3R’s) by year of graduation and sex
Year of graduation Sex
1995 1997 1999 2001 Significance
Boys 80.0 76.3 81.4 76.3 p<0.05 Girls 77.8 75.1 72.0 68.5 p<0.001 All 78.5 75.4 74.9 71.3 p<0.001 Significance ns ns p<0.001 p<0.001
ns: not significant at p = 0.05 Literacy analysis by school type is provided in Table 13. No significant variation was
observed in the literacy rate of the NFPE graduates over the years. However, it gradually
decreased among the graduates of BEOC, 80.9 percent in 1995 to 65.9 percent in 2001.
On the other hand, this rate was 81-82% among the graduates of NFPE-ESP in all the
years except 1997.
Table 13 Percentage of graduates satisfying literacy criteria (3R’s) by year of graduation and school type
Year of graduation Sex
1995 1997 1999 2001 Significance
NFPE 77.6 74.8 73.8 72.7 ns BEOC 80.9 79.0 75.2 65.9 p<0.001 NFPE-ESP 81.1 57.1 81.6 81.1 p<0.001 All 78.5 75.4 74.9 71.3 p<0.001 Significance ns p<0.001 p<0.05 p<0.001
ns: not significant at p = 0.05 Proportion of girls is more than that of the boys in BRAC schools (about two-thirds). The
performance of these majority graduates is deteriorating more rapidly than that of the

23
boys. This ultimately reflects in the overall performance of BRAC education programme.
Although the performance of the graduates of NFPE-ESP is much better than others, but
their representation in the whole system is tiny. That’s why this sub-system, with its little
strength (number of graduates), could not do much impact on the overall performance of
the system. Very poor performance of the BEOC graduates in life skills/knowledge
caused much in the worsen performance of the latest cohort of graduates.
Tracing the graduates of 1995
This part analyses data on the basic educational performance of the graduates of 1995
who were traced and tested in four successive surveys during 1995, 1997, 1999 and 2001.
As mentioned already that 1,259 graduates of 1995 who were surveyed in the same year
were attempted to trace during the following three surveys. However, the success rate
reduced over the period and only 417 graduates (a third of the original sample) could be
traced and tested in all the four surveys. Thus, the findings of this part are based on the
test results of these 417 graduates of 1995.
The level of basic education of the graduates of 1995 increased over time; from 72
percent in 1995, to 83.6 percent in 1997, 83.6 percent in 1999, and 84.6 percent in 2001
(Figure 4). It was seen that the major increment occurred after two years of their
graduation in 1997. Similar trend was observed in the case of literacy (Table 14). Gender-
wise analyses of data show a smooth upward trend in the performance of the girls (Annex
11). About 72 percent of the girls had basic education in 1995, which increased to 83.4
percent in 1997, 85.2 percent in 1999, and 86 percent in 2001. On the other hand, boys
performance curve was not smooth like as that of the girls. Although the percentage of
boys having basic education increased from 1995 to 1997, it dropped afterwards. Another
dimension of gender-wise analyses is that the boys were ahead of the girls up to 1997.
However, the results reversed afterwards. The 2001 survey shows that 80.9 percent of the
boys and 86 percent of the girls satisfied all the four criteria of basic education.

24
7283.6 83.8 84.6
020406080
100
1995 1997 1999 2001
Figure 4 Percentage of graduates of 1995 who were tested in four successive
surveys satisfying basic education criteria by year of survey (n=417)
An upward trend was also observed when data were analysed for different skill areas
(Table 14). Over 97 percent of the graduates satisfied the criteria of life skills/ knowledge
in 2001, which was 93.4 percent in reading and 91.3 percent in writing. Analysis by
gender also shows similar findings for boys and girls. Performance in writing skills
suddenly dropped in 1999, which again increased in 2001. Again in reading, performance
dropped from 97.4 percent in 1999 to 93.4 percent in 2001. It may be mentioned here that
as proportion of girls was double than that of boys in the population, the performance of
the girls influenced most in the pooled estimates. One interesting observation is that
percentages of graduates achieving basic education and literacy became more or less
equal, which was not seen in first survey. This is because about all students acquired life
skills knowledge by this time.
Table 14
Percentage of graduates of 1995 who were followed up in 1997, 1999 and 2001 satisfying different skills criteria by year of interview
Survey year
Life skills Reading Writing Numeracy Literacy Basic education
1995 1997 1999 2001
86.3 96.2 97.8 97.5
90.5 92.8 97.4 93.4
83.5 89.4 85.5 91.3
94.1 99.1 99.1 98.1
76.7 84.9 85.2 85.7
72.0 83.6 83.8 84.6

25
Similar analyses by school type are presented in Annex 12. Although no smooth trend
was observed in the basic educational performance of any of the sub-systems, an upward
tendency was seen in the overall performances of NFPE and BEOC. However, a big drop
was occurred for NFPE-ESP between 1999 and 2001. Similar findings can be seen in the
case of literacy too.
Tracing the graduates of 1997
This part analyses data on the basic educational performances of the graduates of 1997
who were traced and tested in three successive surveys in 1997, 1999 and 2001. It may be
mentioned here that 1,259 graduates of 1997 who were tested in the same year were
attempted to re-test during the following two surveys. However, the success rate reduced
over the period and only 717 graduates (NFPE 251, BEOC 221 and NFPE-ESP 245)
could be traced and tested in all the three surveys. Thus, the findings of this part are
based on the test results of these 717 graduates of 1997.
71.1 79.9 81
020406080
100
1997 1999 2001
Figure 5 Percentage of graduates of 1997 who were tested in three successive surveys satisfying basic education criteria by year of survey (n=717)
The level of basic education of the graduates of 1997 who were tested in the three
successive surveys increased over time (Figure 5). Over 70 percent of these graduates had
basic education in 1997, which increased to 79.9 percent in 1999 and to 81 percent in

26
2001. The highest increase was occurred during the first and second surveys. Gender
wise analysis of data shows such smooth progress among the girls, from 73 percent in
1997 to 79.1 percent in 1999 and 82.7 percent in 2001. On the other hand, boys
performance increased from 67.1 percent in 1997 to 81.2 percent in 1999, and then
decreased to 77.5 percent in 2001 (Annex 13). Similar trend was observed in literacy.
Overall, the literacy rate was 76.4 percent in 1997, which increased to 83.5 percent in
1999, and to 83.2 percent in 2001 (Table 15). The 2001 survey shows that 79.9 percent
boys and 84.7 percent girls are literate (Annex 13).
Skill-wise analysis shows that performance of the graduates increased in three areas viz.,
life skills knowledge, reading and numeracy (Table 15). Around 95 percent of the
graduates satisfied the minimum criteria in these areas in 2001. Not much change was
occurred in writing. Gender segregated analysis also shows similar trend for both the
boys and girls (Annex 13).
Table 15
Percentage of graduates of 1997 who were followed up in 1999 and 2001 satisfying different skills criteria by year of interview
Survey year
Life skills Reading Writing Numeracy Literacy Basic education
1997 1999 2001
86.5 92.9 94.4
87.2 93.5 94.7
87.8 89.0 87.3
93.7 96.5 96.6
76.4 83.5 83.2
71.1 79.7 81.0
School type-wise analyses of these data are presented in Annex 14. Poor performance of
the graduates of NFPE-ESP at the initial year (i.e., in 1997) is also reflected here. A
considerable improvement of their performance was seen after two years, over 80 percent
of them satisfied the criteria of basic education in 1999; however it dropped at 71 percent
in 2001. This is not the case for other groups of graduates. Among the graduates of
NFPE, 71.1 percent of them had basic education which increased to 80.3 percent in 1999
and again to 81.5 percent in 2001. For BEOC the rate of basic education was 71.8

27
percent, which increased to 75.9 percent in 1999, and 78.9 percent in 2001. More
analyses on different skill areas are available in Annex 14.
Tracing the graduates of 1999
This part presents results of the graduates of 1999 who were tested in the surveys of both
1999 and 2001. Of the 1,259 graduates tested in 1999, 945 (NFPE 321, BEOC 299 and
NFPE-ESP 325) were found and tested in 2001 (52% being girls). This part presents data
of 945 graduates of 1999.
Like other cohorts, basic educational performance of the graduates of 1999 increased
significantly within two years of their graduation. The level of basic education of these
graduates was 68.7 percent in 1999 which increased to 73.9 percent in 2001 (Table 16).
Gender wise analysis shows that the boys were in a better position than girls in the initial
survey (73.2% vs. 67%). However, over the period the level increased only among the
girls (67% to 74%), not among the boys. Similar tendency was seen in literacy.
Skill area-wise analysis shows that improvement occurred in two areas viz., reading and
numeracy (Table 16). The performance of the boys deteriorated in life skills knowledge
while that of the girls improved in numeracy (Annex 15).
Table 16
Percentage of graduates of 1999 who were followed up in 2001 satisfying different skills criteria by year of interview
Survey year
Life skills Reading Writing Numeracy Literacy Basic education
1999 2001
84.3 83.4
86.9 88.6
85.7 85.5
91.4 94.7
75.2 80.0
68.7 73.9
School type-wise analyses noticed improvement in NFPE and NFPE-ESP. The
performance of the graduates of NFPE improved 7.1 percentage points (67.3% to 74.4%),
which was three percentage points for NFPE-ESP graduates (76.3% to 79.3%). Annex 6
provides more analysis.

28
Performance after two years of graduation
As mentioned earlier, three cohorts of graduates viz., 1995, 1997 and 1999 were tested
during the respective year of graduation and again re-tested after two years. As
mentioned earlier, the volume of the sample reduced to three fourths or so during the
second surveys. The basic educational performance of the graduates of BRAC schools
increased over time due to their enrolment in formal schools for further education. Such
performance occurred more during the first two years of graduation. Figure 6 presents a
comparison of such improvements among different cohorts of graduates. The figure
shows that the basic educational performances of the graduates of all three cohorts did
not improve equally. The gaps between the performances (initial and after two years)
became narrower over time. For instance, after two years of graduation the performance
of the graduates of 1995 improved 9.7 percentage points, which was 8.5 percentage
points for the graduates of 1997, and 5.2 percentage points for those of 1999. This
indicates that the former graduates of recent cohorts were performing less compared to
those of earlier cohorts.
72.582.2
71.479.9
68.773.9
0
20
40
60
80
100
1995 1997 1999
Figure 6 Improvement in the level of basic education after two years of their
graduation from BRAC schools by different years of graduation
Initial year After 2 years

29
Discussion and conclusion In order to assess the basic educational performance of the graduates of BRAC non-
formal primary schools the Research and Evaluation Division of BRAC initiated a system
called ‘tracer study’. This is the fourth report of this effort. The instrument used in this
study was developed in Bangladesh after the World Conference held in Jomtien in 1990
(WCEFA, 1990; UNICEF, 1992; Chowdhury et al., 1994). The instrument is based on the
ideas of basic education formulated in the Jomtien Declaration. This system allows us to
see the overall performance of the BRAC schools continuously and also to compare the
performance of one cohort of graduates with others. Quality of data is a major concern in
any educational study. Adequate measures were taken to ensure quality of data collected
for this study. After each survey there was a provision of re-survey of some of the
indicators on some selected sample. Matching of test and re-test data for over 90 percent
cases indicates a high quality of data. Reliability test through Kuder-Rechardson formula
showed over 87% reliability of the data.
Findings of this study have two major parts, one is the trend in overall performance of
BRAC schools and the other is the performance of former graduates over time. The first
part shows performance of an on-going education provision and the second part shows
the sustainability of learning achievement. The second part has some limitations. It was
not possible to trace all the former graduates during resurveys. Sample size reduced over
time, for instance, only a third of the initial sample was common in all four surveys of the
graduates of 1995. Such reduction of sample size has a negative impact on the
representativeness of the sample. There is also a possibility of a section of the sample
with special characteristics to be common in all the surveys. These ultimately increase
sampling error and bias in the estimates. Fortunately, we did not see much difference
among the graduates who were tested in all the four surveys and who were not. Only the
graduates who were younger in age were more likely to be tested more times. No
difference was noticed against other socio-economic characteristics.

30
The findings of the four surveys held during the last six years reveal that overall
performance of BRAC schools is declining. It was found that 62.5 percent of the
graduates of 2001 satisfied all the four criteria of basic education; this was 68.7 percent in
1999, 69.3 percent in 1997, and 73.7 percent in 1995. That is, 11.2 percentage points
reduced over six years, on average nearly two percentage points a year. The earlier report
of this kind written two years back also noticed that overall performance of the BRAC
school graduates is going down (Nath 2000). The report also highlighted that major
deterioration occurred in reading and numeracy. This year’s findings just added a new
area where significant deterioration was seen; this is life skills/knowledge. Such results
indicate that during the last two years no improvement was occurred in any of the skill
areas. Probably the programme did not considered the findings of earlier study seriously
and no effort seems to be given to resist the declining situation.
It is frustrating to see that BRAC schools are doing worse gradually in life skills. During
its early age, incorporation of life skills in the curriculum was a strong point for
justification of BRAC primary education programme. Life skills related competencies are
given more importance in BRAC prepared textbooks, which are used for the students of
first three grades (Ghosh, 1999). Moreover, BRAC school students were seen doing
much better than their government counterpart compared to other areas of assessment
(Nath et al, 1999). Probably, the situation has gradually been changed in practice. Putting
life skills related matters into the textbooks does not ensure its proper delivery to the
students. This study did not see what actually happened in the classrooms, but at least the
end product hints about less emphasis on life skills knowledge. When major deterioration
occurs in BEOC (16.6 percentage points within two years) where no NCTB textbook is
used, one must think about the issue seriously. There is a need to have close monitoring
of classroom activities.
Another important feature of BRAC non-formal primary education programme is its
strong commitment to girls’ education. When there was a wide gap favouring boys
education nationally, going ‘against the wind’, BRAC decided to enrol more girls into its

31
school programme. Still now, two thirds of the students in BRAC schools are girls. Not
only in access, it was possible to ensure girls attainment equally with the boys. The
studies of this series conducted in 1995 and 1997 did not see any gender discrimination in
the basic educational attainment of the graduates of BRAC schools (Nath et al., 1996;
1998). However, sadly, gender discrimination favouring boys was first appeared among
the graduates of 1999 when the third ‘tracer study’ was done (Nath, 2000). It showed that
the girls were behind the boys with 7.4 percentage points (66.5% vs. 73.9%; p<0.01).
This study again showed that such gender discrimination is continuing, the girls were 8.1
percentage points behind the boys in 2001. During last six years, the performance of boys
deteriorated 5.3 percentage points, but for girls it was 14.4 percentage points. The girls
are the majority in BRAC schools and they are gradually doing worse. Such a rapid
deterioration of the girls performance actually geared downward slopping of overall
result.
Skill-wise analysis showed that gender difference against girls was noticed twice in
reading (1999 and 2001) and writing (1997 and 2001), and in numeracy in all the four
surveys. It reveals that the areas of gender discrimination are also increasing day by day.
After the second survey of this series an independent attempt was made to identify the
reasons behind gender difference in mathematics in BRAC non-formal primary schools
(Shahjamal, 2000). This study portrayed how girls are discriminated through the teaching
process, peer interaction, social norms, and believes of the teachers and the pupils. There
is shortage of awareness on this issue among the managers at grassroots level. It is not
known how far the recommendations of the study were translated into practice. However,
we can just reiterate some of those which still needs serious consideration.
1. There is a need to prepare a guideline for the teachers and the programme
organisers which can help them shaping their attitude and behaviour in order to
make it more gender sensitive.
2. Such an issue should be discussed in the training sessions and meetings at all
levels. Monthly refreshers’ training of the teachers, regular meeting of the

32
programme organisers, and parent-teacher meeting could be very important places
for such discussion.
3. Gender segregated analysis should be a common issue in all performance
monitoring, academic supervision, and school evaluation activities.
It should be mentioned here that no gender difference was found in any of the cohort in
life skills/ knowledge.
Three types of BRAC schools are of interest of the ‘tracer study’. BRAC education
programme directly operates the largest two of these (NFPE and BEOC), and the rest one
(NFPE-ESP) some local NGOs. To run the schools BRAC provides training to the
teachers and programme organisers, supplies school materials and provides financial
support to small NGOs through its Education Support Programme (ESP). A team
stationed at BRAC’s Training Division operates the ESP. Interestingly, the schools under
ESP are gradually doing better with exception in 1997, it did very poor at that time (Nath,
1998). The performance of NFPE and BEOC is declining over time. However, BEOC is
declining more rapidly than NFPE. BEOC’s performance in 2001 was seriously
damaging like that of ESP in 1997. A careful investigation is needed to find out the
causes behind such deteriorating performance. Earlier the name of the department of
BRAC, which run education programme, was known as Non-formal Primary Education
(NFPE). It mostly looked after NFPE and BEOC types of schools and did some activities
of continuing education. Some years ago, the name has changed and the areas of
activities increased a lot, including extension of NFPE up to fifth grade. These might
increase the workload of the grassroots level programme organisers of these schools,
which is not the case for the programme organisers under ESP. There is a need to see the
workload of the programme organisers under BEP whether they are able adequately to
look at all the schools within their jurisdiction. Quality of monthly refreshers’ training
should also be investigated. Do we give adequate attention to the BEOC schools? Are the
NFPE schools running up to fifth grade getting more attention? Because NCTB
determined competency tests are done on them only. In-depth studies are needed on each
of these issues.

33
There is a provision of school evaluation in BRAC Education Programme, which is done
by two separate groups of people (monitors and programme organisers). School
evaluation is a good practice if it is done scientifically in order to improve pupils’ quality
and reduce inequity among the students. The issue was discussed in two recent studies
done by the Research and Evaluation Division which identified some of the limitations of
the existing practice (Nath, 2002a, 2002b). It can just be reiterated the need for a
scientific school evaluation system and its use in academic improvement of the school
programme of BRAC. In other words, an attempt may be taken to set up a quality
monitoring system incorporating indicators on classroom activities, attainment of the
students, and gender related matters.
BRAC Education Programme is mostly a donor dependent programme. It faced a serious
financial crisis at the beginning of the year 2000 due to donors’ late commitment for
funds, which continued till September 2000. This affected the human resource of the
education programme especially at the field level. The programme was unable to
continue their service. To cope with the situation a good number of senior as well as
qualified field level manages were transferred to other programmes of BRAC, for
instance in BRAC Development Programme (BDP). In many cases, relatively junior
programme organisers were given the charge of the team offices. In some cases one such
person was made in-charge of two team offices. This might affect in field operations of
school programme. Pedagogical supervision of schools and teachers training might be
deprived at this, which ultimately affected the performance of the students of 2001. If this
is true, the question arose how such a donor dependent non-formal education programme
can continue keeping its quality at an acceptable level. The donors’ consortium for
BRAC education programme has to do something in order to strengthen BRAC’s
capacity to encounter such crisis. Justification for this is that BRAC has proven capacity
to provide quality primary education for the children. We should not compromise with
quality education for which we are committed to.

34
References Chowdhury AMR, Ziegahn L, Haque N, Shreshtha GJ and Ahmed Z (1994). Assessing
basic competencies: a practical methodology. International Review of Education. 40(6): 437-454.
Nath SR (2002). School evaluation mechanism in BRAC education programme. Paper presented in the ANTRIEP policy seminar on school evaluation for quality improvement, held in Kuala Lumpur, Malaysia 2–4 July 2002.
Nath SR and Chowdhury AMR (2002). Level and Trends of basic education in Bangladesh: 1993-1998. Educational Studies, 28(1): 77-92.
Nath SR (2002). Achievement of competencies of the students of BRAC non-formal primary schools. Dhaka: Research and Evaluation Division, BRAC.
Nath SR (2000). Basic competencies of the graduates of BRAC’s non-formal schools: levels and trends from 1995 to 1999. Dhaka: Research and Evaluation Division, BRAC.
Nath SR, Sylva K and Grimes J (1999). Raising basic education levels in Bangladesh: the impact of a non-formal education programme. International Review of education. 45(1): 5-26.
Nath SR, Imam SR and Chowdhury AMR (1998). Levels of basic competencies of the BRAC school graduates of 1995 and 1997. Dhaka: Research and Evaluation Division, BRAC.
Nath SR, Chowdhury AMR (1996). Basic competencies of the graduates of BRAC schools of 1995. Dhaka: Research and Evaluation Division, BRAC.
Nath SR, Mohsin M and Chowdhury AMR (1993). Assessment of basic competencies of the children in Bangladesh 1993. Dhaka: Research and Evaluation Division, BRAC.
Shahjamal MM (2000). Causes behind gender difference in mathematics: an exploratory study in BRAC schools. An unpublished dissertation for the fulfilment of the degree of Master of Education, Institute of Education and Research, University of Dhaka.
UNICEF (1992). Assessment of basic competencies of children in Bangladesh. Dhaka, UNICEF.
WCEFA (1990). World conference on education for all: meeting learning needs. Jomtien, Thailand:
WCEFA (1990). Meeting basic learning needs: a vision for the 1990’s. New York: WCEFA.

35

35
Annex 1 Number of graduates surveyed and resurveyed in various years by school type and sex _____________________________________________________________________________________________________________________ Graduates of 1995 Graduates of 1997 Graduates of 1999 Graduates ________________________________________ ______________________________ ____________________ of 2001 surveyed resurveyed resurveyed resurveyed surveyed resurveyed resurveyed surveyed resurveyed surveyed in 1995 in 1997 in 1999 in 2001 in 1997 in 1999 in 2001 in 1999 in 2001 in 2001 _____________________________________________________________________________________________________________________ NFPE Boys 210 164 (78.1) 143 (68.1) 102 (48.6) 211 174 (82.5) 143 (67.8) 210 152 (72.4) 210 Girls 210 168 (80.0) 132 (62.8) 112 (53.3) 210 168 (80.0) 143 (68.1) 210 169 (80.5) 209 Both 420 332 (79.0) 275 (65.5) 214 (50.9) 421 342 (81.2) 286 (67.9) 420 321 (76.4) 419 BEOC Boys 207 151 (72.9) 129 (62.3) 87 (42.0) 210 168 (80.0) 143 (68.1) 207 144 (69.6) 209 Girls 213 154 (72.3) 120 (56.3) 93 (43.7) 210 154 (73.3) 114 (54.3) 213 155 (72.8) 210 Both 420 305 (72.6) 249 (59.3) 180 (42.8) 420 322 (76.7) 257 (61.2) 420 299 (71.2) 419 NFPE-ESP Boys 191 130 (68.1) 143 (74.9) 104 (54.7) 207 161 (77.8) 146 (70.5) 209 158 (75.6) 210 Girls 228 178 (78.1) 145 (63.6) 109 (47.8) 211 166 (78.7) 138 (65.4) 210 169 (80.5) 208 Both 419 308 (73.5) 288 (68.7) 213 (69.2) 418 327 (78.2) 284 (67.9) 419 325 (77.6) 418 _____________________________________________________________________________________________________________________ Total 1259 945 (75.1) 812 (64.5) 607 (48.2) 1259 991 (78.7) 827 (65.7) 1259 945 (75.1) 1256 _____________________________________________________________________________________________________________________

36
Annex 2: Percentage of graduates satisfying different basic competency criteria by type of school and sex, 2001
Sex Type of school
Boys Girls Both
(weighted) Level of
significance
Life skills NFPE BEOC NFOE-ESP All (weighted) Level of significance
84.8 70.3 89.5 80.6
80.4 70.5 91.3 78.0
81.9 70.4 90.7 79.0
p<0.001
ns ns ns ns
Reading skills NFPE BEOC NFOE-ESP All (weighted) Level of significance
90.5 81.8 89.0 87.6
84.7 79.0 89.4 83.3
86.6 80.0 89.2 84.8
p<0.001
p<0.05
ns ns
p<0.05
Writing skills NFPE BEOC NFOE-ESP All (weighted) Level of significance
85.7 84.2 91.4 85.7
82.3 78.1 90.9 81.7
83.5 80.2 91.1 83.1
p<0.001
ns ns ns
p<0.05
Numeracy skills NFPE BEOC NFOE-ESP All (weighted) Level of significance
94.8 96.2 96.7 95.4
87.6 91.4 91.8 89.2
90.0 93.1 93.5 91.2 ns
p<0.01 p<0.05 p<0.05
p<0.001
Annex 3 Percentage of graduates satisfying life skills criteria by year of graduation and sex
Year of graduation Sex 1995 1997 1999 2001
Significance
Boys 85.9 85.0 84.1 80.6 p<0.05 Girls 88.2 87.9 85.0 78.0 p<0.001 All 87.5 87.1 84.7 79.0 p<0.001 Significance Ns ns ns ns

37
Annex 4 Percentage of graduates satisfying reading skills criteria by year of graduation and sex
Year of graduation Sex
1995 1997 1999 2001 Significance
Boys 90.7 87.2 88.8 87.6 ns Girls 89.1 86.2 84.2 83.3 p<0.05 All 89.6 86.5 85.6 84.8 p<0.01 Significance ns ns p<0.05 p<0.05
Annex 5 Percentage of graduates satisfying writing skills criteria by year of graduation and
sex
Year of graduation Sex 1995 1997 1999 2001
Significance
Boys 83.5 81.2 88.2 85.7 p<0.01 Girls 84.9 87.8 84.7 81.7 p<0.05 All 84.6 85.8 85.7 83.1 ns Significance ns p<0.001 ns p<0.05
Annex 6 Percentage of graduates satisfying numeracy skills criteria by year of graduation
and sex
Year of graduation Sex 1995 1997 1999 2001
Significance
Boys 98.1 97.6 98.7 95.4 p<0.001 Girls 94.5 91.7 89.1 89.2 p<0.01 All 95.5 93.6 92.0 91.2 p<0.001 Significance p<0.001 p<0.001 p<0.001 p<0.001
Annex 7 Percentage of graduates satisfying life skills criteria by year of graduation and
school type
Year of graduation Sex 1995 1997 1999 2001
Significance
NFPE 86.4 87.4 83.1 81.9 ns BEOC 91.5 86.9 87.0 70.4 p<0.001 NFPE-ESP 85.7 69.5 89.3 90.7 p<0.001 All 87.5 87.1 84.7 79.0 p<0.001 Significance p<0.05 p<0.001 p<0.05 p<0.001

38
Annex 8 Percentage of graduates satisfying reading skills criteria by year of graduation and school type
Year of graduation Sex
1995 1997 1999 2001 Significance
NFPE 88.8 86.2 84.0 86.6 ns BEOC 92.9 88.6 88.2 80.0 p<0.001 NFPE-ESP 88.9 72.1 90.0 89.2 p<0.001 All 89.6 86.5 85.6 84.8 p<0.01 Significance ns p<0.001 p<0.05 p<0.001
Annex 9 Percentage of graduates satisfying writing skills criteria by year of graduation and
school type
Year of graduation Sex 1995 1997 1999 2001
Significance
NFPE 84.0 86.9 85.2 83.5 ns BEOC 85.3 82.4 85.8 80.2 ns NFPE-ESP 88.0 66.9 88.5 91.1 p<0.001 All 84.6 85.8 85.7 83.1 ns Significance ns p<0.001 ns p<0.001
Annex 10 Percentage of graduates satisfying numeracy skills criteria by year of graduation
and school type
Year of graduation Sex 1995 1997 1999 2001
Significance
NFPE 95.0 93.3 91.0 90.0 p<0.05 BEOC 97.2 94.8 93.4 93.1 p<0.05 NFPE-ESP 95.4 88.8 95.5 93.5 p<0.001 All 95.5 93.6 92.0 91.2 p<0.001 Significance ns p<0.01 p<0.05 ns
Annex 00 Percentage distribution of graduates by number of skills achieved and year
Year of graduation Number of skills
1995 1997 1999 2001
Nil 0.6 1.2 1.5 1.4 1 3.7 2.5 4.1 3.8 2 7.2 7.8 7.9 12.7 3 14.8 19.2 17.8 19.6 4 73.7 69.3 68.8 62.5

39
Annex 11 Percentage of graduates of 1995 who were followed up in 1997, 1999 and 2001 satisfying different skills criteria by sex and year of interview
Survey year
Life skills Reading Writing Numeracy Literacy Basic education
Boys 1995 1997 1999 2001
82.2 98.1 97.1 97.6
91.9 93.8 94.3 93.8
84.7 90.4 83.7 88.5
100.0 99.5
100.0 99.0
80.8 85.6 82.3 82.7
72.2 84.1 79.9 80.9
Girls 1995 1997 1999 2001
87.7 95.7 97.9 97.5
89.8 92.4 98.7 93.2
83.1 89.0 86.4 92.3
91.9 99.1 98.7 97.9
75.3 84.7 86.4 86.8
71.9 83.4 85.2 86.0
Annex 12 Percentage of graduates of 1995 who were followed up in 1997, 1999 and 2001
satisfying different skills criteria by school type and year of interview Survey year Life skills Reading Writing Numeracy Literacy Basic
education NFPE 1995 1997 1999 2001
85.1 96.3 97.5 98.1
88.9 92.0 97.5 93.8
82.7 91.9 85.7 92.6
93.2 100.0 99.4 98.8
74.7 87.0 85.2 86.4
70.4 85.7 83.9 85.2
BEOC 1995 1997 1999 2001
92.4 97.4 99.1 95.7
98.3 96.6 99.1 91.5
85.5 78.0 84.6 86.3
100.0 95.8 99.1 94.9
84.6 76.1 84.6 83.8
78.0 74.6 83.9 82.9
NFPE-ESP 1995 1997 1999 2001
87.1 93.9 97.3 98.0
89.2 93.2 94.6 91.8
89.1 89.2 86.5 82.3
93.2 94.6 98.6 96.6
83.7 85.0 86.4 77.6
78.4 81.6 85.0 76.9

40
Annex 13 Percentage of graduates of 1997 who were followed up in 1999 and 2001 satisfying different skills criteria by sex and year of interview
Survey year
Life skills Reading Writing Numeracy Literacy Basic education
Boys 1997 1999 2001
83.6 90.5 94.7
85.7 92.8 93.9
81.5 88.1 84.1
97.6 98.7 97.6
73.5 85.4 79.9
67.1 81.2 77.5
Girls 1997 1999 2001
87.7 93.9 94.2
87.7 93.9 95.0
90.8 89.4 88.8
91.6 95.5 96.1
77.7 82.7 84.7
73.0 79.1 82.7
Annex 14 Percentage of graduates of 1997 who were followed up in 1999 and 2001 satisfying
different skills criteria by school type and year of interview Survey year Life skills Reading Writing Numeracy Literacy Basic
education NFPE 1997 1999 2001
86.7 92.8 94.0
87.1 94.0 95.2
88.8 89.6 88.0
93.6 96.8 96.4
76.7 84.3 83.9
71.1 80.3 81.5
BEOC 1997 1999 2001
86.8 92.9 97.2
87.3 91.5 92.5
83.1 86.8 84.0
94.3 95.3 97.6
75.9 79.8 80.2
71.8 75.9 78.9
NFPE-ESP 1997 1999 2001
71.7 90.2 90.2
76.2 93.4 85.7
70.9 89.0 85.7
89.4 96.3 92.6
61.5 85.3 74.6
51.0 80.8 71.0
Annex 15 Percentage of graduates of 1999 who were followed up in 2001 satisfying different
skills criteria by sex and year of interview Survey year
Life skills Reading Writing Numeracy Literacy Basic education
Boys 1999 2001
84.3 80.1
89.4 90.9
88.5 87.2
98.5 98.5
81.5 82.1
73.2 73.5
Girls 1999 2001
84.3 84.7
86.1 87.7
84.7 84.7
88.7 93.2
72.8 79.1
67.0 74.0

41
Annex 16 Percentage of graduates of 1999 who were followed up in 2001 satisfying different skills criteria by school type and year of interview
Survey year Life skills Reading Writing Numeracy Literacy Basic
education NFPE 1999 2001
82.6 82.3
86.0 88.4
84.8 84.8
90.2 94.2
73.8 80.2
67.3 74.4
BEOC 1999 2001
86.8 83.9
88.1 87.8
87.5 85.5
93.4 96.0
76.6 77.6
69.7 70.3
NFPE-ESP 1999 2001
90.0 88.4
90.9 91.5
88.1 89.6
94.8 96.0
81.2 84.1
76.3 79.3