Embed Size (px)
Citation preview
June 2021
Produced by Climate Analytics for Antigua and Barbuda’s Department of Environment, through the NDC Partnership’s Climate Action Enhancement Package (CAEP) Initiative
TOWARDS A JUST TRANSITION OF THE WORKFORCE
Baseline Analysis for the Electricity and Road Transport Sectors in Antigua and Barbuda

2
Produced by Climate Analytics Climate Analytics is an international non-profit climate science and policy institute headquartered in Berlin, Germany with regional offices in Lomé, Togo, Perth, Australia and New York, USA and with associates across Europe, South America, Asia, Africa, the Pacific and the Caribbean. The technical assistance provided for this Report has been through Climate Analytics’ IMPACT project. IMPACT is a cross-cutting, multi-faceted project that is implemented by a wide range of institutions in three regions – the Pacific, West Africa and the Caribbean.
Partner Organisations The Department of Environment (DoE) is a government agency within the Ministry of Health, Wellness and the Environment in the Government of Antigua and Barbuda (GoAB). Its overall mission is to provide technical advice on the environment and to design and implement projects on behalf of the Government and the people of Antigua and Barbuda. The DoE is the national focal point for the multilateral environmental agreements (MEAs) to which the country is Party. It accomplishes its mission inter alia through an integrated environmental planning and management system, efficient implementation of programmes, projects and technical services, provision of accurate council on environmental management as well as effective and consistent enforcement of environmental laws and regulations, and provision of easily accessible information and technical assistance to the public.
The NDC Partnership’s Climate Action Enhancement Package (CAEP) Initiative, through which this technical assistance has been channelled, is an offering of the NDC Partnership designed to deliver targeted, fast-track support to countries to enhance the quality, increase the ambition, and implement nationally determined contributions.
Towards a Just Transition of the Workforce – Baseline Analysis for the Electricity and Road Transport Sectors in Antigua and Barbuda Technical assistance supported by: Climate Analytics and the IMPACT Project, the German Federal Ministry for the Environment, Nature Conservation Building and Nuclear Safety, and the EU Marie-Curie Fellowship 838667 – INTERACTION Authors: Dr. Anne Zimmer, Charlotte Plinke, Dr. Robert Brecha, Frances Fuller
Prepared under the guidance of: Antigua and Barbuda’s Department of Environment, Ministry of Health, Wellness and the Environment Reviewers: Ezra Christopher, Michai Robertson, Melissa LeBlanc, Dudley Williams, Vekash Khan, Daniel Perreira, Santana Lewis, Alejandra Padin-Dujon, Rashauna Adams-Matthew, and Janeil Johnston Support to Department of Environment provided by: Accelerating a transformational pipeline of Direct Access climate adaptation and mitigation projects in Antigua and Barbuda (funded by the Green Climate Fund (Readiness 4)), and the 4th National Communications Project (funded by Global Environmental Facility)
Support provided through the: NDC-Partnership’s Climate Action Enhancement Package
Finalised on: June 24, 2021
Citation: Climate Analytics (2021). Towards a Just Transition of the Workforce – Baseline Analysis for the Electricity and Road Transport Sectors in Antigua and Barbuda.

3
Table of Contents
TABLE OF CONTENTS ............................................................................................................................................ 3 LIST OF TABLES ..................................................................................................................................................... 5 LIST OF FIGURES ................................................................................................................................................... 6 LIST OF ACRONYMS .............................................................................................................................................. 7 SUMMARY FOR POLICYMAKERS ........................................................................................................................... 9 1. INTRODUCTION ......................................................................................................................................... 12 2. CONTEXT ON CURRENT ECONOMIC STRUCTURE AND EMPLOYMENT IN GENERAL ..................................... 13
BACKGROUND ON ANTIGUA AND BARBUDA ...................................................................................................................... 13 Socio-economics ................................................................................................................................................ 13 Macro-economics .............................................................................................................................................. 14
STRUCTURE OF THE ECONOMY ....................................................................................................................................... 15 GENERAL EMPLOYMENT INDICATORS ............................................................................................................................... 17
Labour market overview .................................................................................................................................... 17 Labour force and employment indicators .......................................................................................................... 18 Unemployment and labour underutilization ..................................................................................................... 19 Salaries and general working conditions ........................................................................................................... 21
3. EMPLOYMENT IMPACTS FOR A TRANSITION OF THE ROAD TRANSPORT AND ELECTRICITY SECTORS ......... 22 ABOUT THE CURRENT STRUCTURE OF THE TRANSPORT AND ELECTRICITY SECTOR ....................................................................... 22
Fuel import dependency of the energy sector ................................................................................................... 22 Electricity sector ................................................................................................................................................ 24 Transport Sector - Vehicle fleet and infrastructure ........................................................................................... 26
SCENARIO DESCRIPTION AND STAGES OF TRANSITION PROCESS .............................................................................................. 28 Draft NDC targets and NDC scenario characteristics ........................................................................................ 28 Business-As-Usual (BAU) Scenario ..................................................................................................................... 30 Scenario comparison ......................................................................................................................................... 31
METHODOLOGY FOR THE EMPLOYMENT ANALYSIS .............................................................................................................. 33 Quantitative analysis ......................................................................................................................................... 33 Complementary qualitative analysis ................................................................................................................. 35
IMPACTS ON DIRECT EMPLOYMENT BY SECTOR AND JOB CATEGORY ........................................................................................ 36 Electricity sector employment impacts by job category and technology .......................................................... 36
Construction and Installation of new & dismantling of old power generation infrastructure ........................................ 36 Operation and Maintenance of power generation capacity ........................................................................................... 40 Electricity transmission and distribution ......................................................................................................................... 42 Fuel supply for power generation ................................................................................................................................... 43
Overview on employment impacts in the electricity sector ............................................................................... 44 Road transport impacts by job category ........................................................................................................... 46
Construction and installation of transport infrastructure ............................................................................................... 46 Operation and maintenance of vehicles and transport infrastructure ............................................................................ 47 Vehicle Sales .................................................................................................................................................................... 50 Fuel or electricity supply for transport ............................................................................................................................ 51
Overview on employment impacts in road transport ........................................................................................ 51 TOTAL ESTIMATED EMPLOYMENT IMPACTS – ELECTRICITY AND TRANSPORT ............................................................................ 53
4. RECOMMENDATIONS FOR A POLICY FRAMEWORK FOR A JUST TRANSITION OF THE WORKFORCE AND NEXT STEPS ........................................................................................................................................................ 54
ADDRESSING POTENTIAL MISALIGNMENTS IN SKILLS AND TIMING ........................................................................................... 55
4
CHALLENGES AND OPPORTUNITIES FOR GENDER EQUALITY ................................................................................................... 56 CHALLENGES AND OPPORTUNITIES FOR SOCIAL INCLUSION ................................................................................................... 58 OTHER CHALLENGES AND OPPORTUNITIES ........................................................................................................................ 59 NEXT STEPS: ENGAGING STAKEHOLDER AND DEVELOPING JUST TRANSITION PLANS ................................................................... 61
5. ANNEXES ................................................................................................................................................... 63 ANNEX A: TECHNICAL ANNEX - METHODOLOGY AND ASSUMPTIONS ..................................................................................... 63
Methodology for estimating impacts on employment In the electricity sector ................................................. 63 Overview on assumptions and employment factors used - electricity sector .................................................... 65 Methodology for estimating impacts on employment related to road transport ............................................. 71 Overview on assumptions and amployment factors used – road transport ...................................................... 73
ANNEX B: DATA ......................................................................................................................................................... 77 Historical data and status quo .......................................................................................................................... 77 Scenario data ..................................................................................................................................................... 81
ANNEX C: SENSITIVITY ANALYSES .................................................................................................................................... 82 Alternative assumptions on solar PV ................................................................................................................. 82 Alternative assumptions on fossil-based thermal power plants O&M .............................................................. 83 Alternative assumptions on EV charging infrastructure .................................................................................... 84 Alternative assumptions on EV repair ............................................................................................................... 85
ANNEX D: INTERVIEW LIST ............................................................................................................................................ 86 6. REFERENCES .............................................................................................................................................. 88
5
List of Tables
Table 1: Labour market indicators (2015 and 2018) ....................................................................... 17
Table 2: Overview on fossil-fuel power plants. ............................................................................... 25
Table 3: Overview on employment categories analysed ................................................................ 34
Table 4: Guiding questions for the qualitative analysis for employment impacts ......................... 35
Table 5: Technology-specific and activity-specific employment factors from Ram et al. (2020) ... 66
Table 6: Overview on methodological assumptions for the quantitative employment impact estimation for the electricity sector in Antigua and Barbuda ......................................................... 66
Table 7: Categorization on job types related to road transport for the employment analysis ...... 72
Table 8: Overview on methodological assumptions for the quantitative employment impact estimation for road transportation in Antigua and Barbuda .......................................................... 73
Table 9: Fuels sales (in million liters) in Antigua and Barbuda ........................................................ 77
Table 10: Historical Capacities (in MW) of fossil fuel-based power plants in Antigua and Barbuda .......................................................................................................................................................... 78
Table 11: Historical generation (in MWh) of fossil fuel-based power plants in Antigua and Barbuda .......................................................................................................................................................... 78
Table 12: Historical Capacities (in MW) of Renewable Energy installations in Antigua and Barbuda .......................................................................................................................................................... 78
Table 13: Overview on vehicles by type. ......................................................................................... 79
Table 14: Vehicle characteristics by type (2018) ............................................................................. 79
Table 15: List of interviewed experts and stakeholders .................................................................. 86
Table 16: Interview candidates contacted which did not engage in the interviews ...................... 87
6
List of Figures
Figure 1: Age pyramid by gender for Antigua and Barbuda. ........................................................... 13
Figure 2: Recent GDP growth trends in Antigua & Barbuda. .......................................................... 15
Figure 3: Employment by industry and profession in 2018. ........................................................... 19
Figure 4: Unemployment by age group and parish, differentiated by gender in 2018. ................. 21
Figure 5: Energy consumption by sector in 2012. ........................................................................... 22
Figure 6: Electricity system schematic for Antigua and Barbuda. ................................................... 23
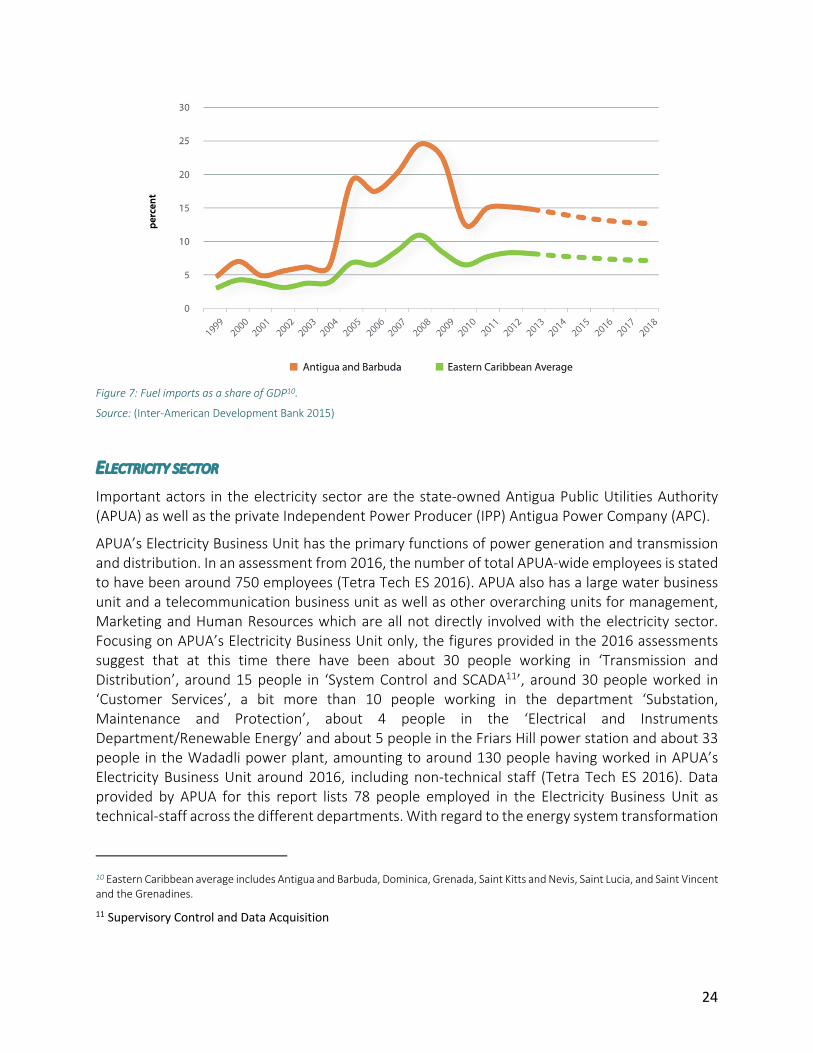
Figure 7: Fuel imports as a share of GDP. ........................................................................................ 24
Figure 8: Distribution of vintages for different types of vehicles. ................................................... 27
Figure 9: Overview on electricity generation capacities in the Business-as-Usual (BAU) compared to the NDC Scenario. ........................................................................................................................ 31
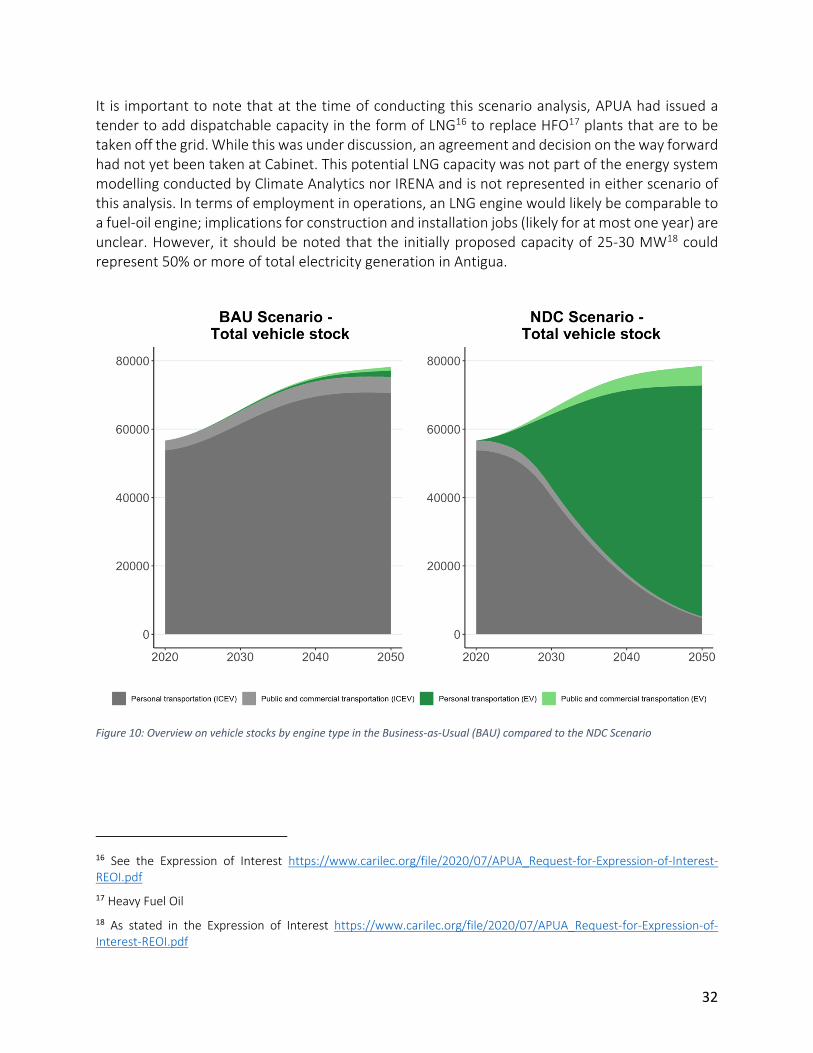
Figure 10: Overview on vehicle stocks by engine type in the Business-as-Usual (BAU) compared to the NDC Scenario ............................................................................................................................. 32
Figure 11: Estimated jobs in construction & installation of electricity generation facilities for Business-as-Usual (BAU) scenario and the NDC scenario ............................................................... 37
Figure 12: Estimated jobs in decommissioning of electricity generation facilities for the Business-as-Usual (BAU) scenario and the NDC scenario ............................................................................... 40
Figure 13: Estimated jobs in operation and maintenance (O&M) by technology and scenario .... 42
Figure 14: Estimated jobs in fuel supply for electricity generation by technology and scenario .. 44
Figure 15: Estimated total jobs in electricity generation by technology and scenario .................. 45
Figure 16: Estimated total jobs in electricity generation by job type and scenario ....................... 45
Figure 17: Estimated jobs in construction and installation of EV charging systems by charger type and scenario ..................................................................................................................................... 47
Figure 18: Estimated jobs in operation and maintenance of vehicles and transport infrastructure by job type and scenario .................................................................................................................. 50
Figure 19: Estimated jobs in transport fuel supply by scenario ...................................................... 51
Figure 20: Estimated total jobs in road transport by job type and scenario .................................. 53
Figure 21: Total employment impacts – electricity sector and road transport sector combined for BAU and NDC scenario. .................................................................................................................... 54
Figure 22: General overview on methodology. ............................................................................... 64
Figure 23: Disaggregated overview of the methodology. ............................................................... 64
Figure 24: Map with gas stations and Electric vehicle (EV) charging station in Antigua. ............... 80
7
Figure 25: Estimated total jobs in electricity generation by technology and scenario (sensitivity analysis: higher solar C&I factors) .................................................................................................... 82
Figure 26: Estimated total jobs in electricity generation by technology and scenario (sensitivity analysis: lower HFO O&M factors) ................................................................................................... 83
Figure 27: Estimated total jobs in road transport by job type and scenario (sensitivity analysis: lower EV charging) ........................................................................................................................... 84
Figure 28: Estimated total jobs in road transport by job type and scenario (sensitivity analysis: lower EV repair) ................................................................................................................................ 85
List of Acronyms
APC Antigua Power Company APUA Antigua Public Utilities Authority BAU Business-as-Usual C&I Construction and installation CAEP Climate Action Enhancement Package CIA Central Intelligence Agency COVID-19 Coronavirus disease 2019 DoE Department of Environment (government agency within the Ministry of Health,
Wellness and the Environment in the Government of Antigua and Barbuda) EC$ Eastern-Caribbean Dollar ECCB Eastern Caribbean Central Bank EU European Union EV Electric vehicle GARD Center Gilbert Agricultural and Rural Development Center GDP Gross domestic product GGGI Global Green Growth Institute GHG Greenhouse gas GoAB Government of Antigua and Barbuda GWh Gigawatt-hour HDI Human Development Index HFO Heavy Fuel Oil ICE; ICEV internal combustion engine; internal combustion engine vehicle ICT Information and Communication Technology ILO International Labour Organization IPP Independent Power Producer IRENA International Renewable Energy Agency kW; kWh Kilowatt; kilowatt-hour LDCs Least Developed Countries LFS Labour Force Survey
8
LNG Liquefied natural gas LPG Liquefied petroleum gas MEA Multilateral Environmental Agreement MW; MWh Megawatt; Megawatt-hour NDC Nationally Determined Contribution NSWMA National Solid Waste Management Authority O&M Operation and maintenance PPA Purchasing Power Agreement PPP Purchasing power parity PV Photovoltaic RE Renewable energy SIDS Small Island Developing States TVET Technical and Vocational Education and Training UNFCCC United Nations Framework Convention on Climate Change WDI World Development Indicators WIOC West Indies Oil Company Ltd.
9
Summary for Policymakers
Countries are called to communicate enhanced “nationally determined contributions” (NDCs) to work towards the Paris Agreement goals. The revised draft NDC for Antigua and Barbuda establishes a number of targets and sub-targets primarily within the electricity and transport sectors. For electricity, by 2030, 86% of electricity demand is to be met through renewable energy sources. In the transport sector, the use of internal combustion engines is to be phased out by 2040. Moreover, a Just Transition of the workforce by 2030 is envisioned.
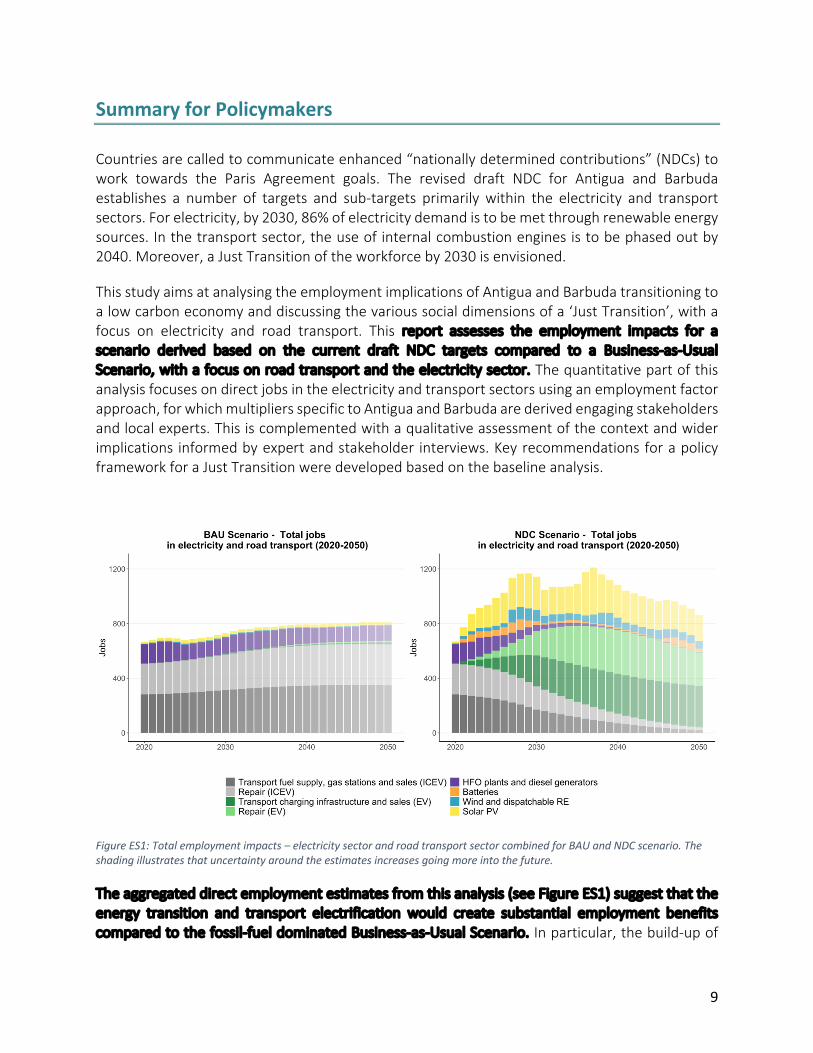
This study aims at analysing the employment implications of Antigua and Barbuda transitioning to a low carbon economy and discussing the various social dimensions of a ‘Just Transition’, with a focus on electricity and road transport. This report assesses the employment impacts for a scenario derived based on the current draft NDC targets compared to a Business-as-Usual Scenario, with a focus on road transport and the electricity sector. The quantitative part of this analysis focuses on direct jobs in the electricity and transport sectors using an employment factor approach, for which multipliers specific to Antigua and Barbuda are derived engaging stakeholders and local experts. This is complemented with a qualitative assessment of the context and wider implications informed by expert and stakeholder interviews. Key recommendations for a policy framework for a Just Transition were developed based on the baseline analysis.
Figure ES1: Total employment impacts – electricity sector and road transport sector combined for BAU and NDC scenario. The shading illustrates that uncertainty around the estimates increases going more into the future.
The aggregated direct employment estimates from this analysis (see Figure ES1) suggest that the energy transition and transport electrification would create substantial employment benefits compared to the fossil-fuel dominated Business-as-Usual Scenario. In particular, the build-up of
10
new infrastructure – with substantial amounts of renewable energy and battery storage installations as well as electric vehicle charging infrastructure to be installed – is expected to create new and ‘greener’ jobs as compared to the Business-as-Usual case, replacing fossil-related jobs. In the longer term, when the new infrastructure is already mostly built, jobs in typically less labour-intensive operations and maintenance would dominate. At the same time, learning effects would also increase productivity over time and the employment impacts may settle at a more moderate level similar to the employment in the BAU. The employment impacts have been estimated based on available data for current employment and expected trends in the electricity generation sector and road transport sector. Consultation with local experts and stakeholders provided input and feedback on underlying assumptions. To reflect the sensitivity of the results to the underlying assumptions, results are presented with alternative underlying assumptions in the Annex.
As in every transition process, while certain job groups will benefit from the change, the required changes will negatively affect certain types of jobs and certain groups of people currently working in fossil-related jobs and will require dedicated interventions by the government to support their transition to new job opportunities. While the overall employment impact of the energy and transport transitions is expected to be positive, several potential risks of educational and temporal misalignments can be identified when looking into the sector- and job-type-specific results. A detailed break-down of estimates by job type and technology can be found in the report chapters. The main insights and implications are summarised below.
Measures need to be taken to adequately train the local workforce for renewable energy-related tasks, while planning is needed to provide more permanent employment opportunities in the longer term. The ambitious buildout of renewable energy (RE) capacity, especially solar PV, within the next decade is expected to create high demand for workers in construction and installation of new RE systems, likely exceeding the to-date limited local capacity of adequately qualified staff. Measures to foster adequate, affordable and accessible training for local workers, as well as maintaining high quality standards, will need to be implemented with support from the government. However, the ambitious expansion of RE capacity in the short term also has potential implications for temporal misalignments. With learning effects and new PV installations slowing down after 2030, the local workforce newly trained in solar PV installation would partly need to find employment in operation and maintenance of RE installations, which may require some retraining. However, as the construction and installation process is typically considered more labour-intensive, but is of a non-permanent nature, the estimated number of solar-related jobs in the early 2030s drops considerably in the NDC scenario. Policy makers will need to plan the energy transition process accordingly to provide a more stable long-term perspective for the local workforce in PV as well as other RE technologies. This requires the proactive development of active labour market programs that anticipate demand for skills as well as workforce development, including (re-) training opportunities and assistance in the job search process as well as support to self-employed workers.
Mechanics in ICEV repair and servicing may be a group that could be most severely affected by the transition process. The repair of electric vehicles (EVs) requires additional technical skills due to a larger share of electronical components. While the majority of mechanics that have been
11
trained to conduct combustion engine vehicle repair could be retrained to also repair and service EVs, self-employed and informal ‘hands-on’ mechanics may find it more challenging to access and undergo re-retraining towards EV repair. Moreover, in the longer term EVs are expected to require less repair and maintenance work, potentially maintaining fewer jobs in the long term.
Employees working in servicing tasks in gas stations, especially affecting vulnerable groups, will need to find an alternative job which matches their skills – potentially in other sectors. With EV charging stations typically used in self-servicing, there is no obvious equivalent of EV-related jobs that people currently working in gas stations could transition to. As these service jobs in gas stations do not require a high level of technical skills, most newly created technology-related jobs in renewable energy or the build-up of EV charging infrastructure are likely not an option for these workers. Employees may therefore be required to look for job opportunities beyond their sector.
With regard to gender equality, challenges as well as opportunities are identified in the analysis. To facilitate a transition of the current workforce in the electricity and road transport sector, which is strongly dominated by men, it is important to account for different backgrounds and gender attitudes to overcome potential resistance to change and to support adapting to new employment opportunities. The transition process also offers opportunities to increase the participation of women in technology-related jobs. While current female participation in technical jobs is sectors like solar power is very low, the transition process could be used as an opportunity to encourage and support females to seek a career in the renewable energy sector or EV-related business.
With regard to social inclusion, challenges as well as opportunities are identified in the analysis. Opportunities for affordable and attractive skills development for poorer households will need to be created, e.g., by offering flexible and affordable training courses and awareness-raising measures in vulnerable communities about career opportunities in line with the energy transition, particularly addressing young people. Moreover, people working in informal employment or are self-employed are typically less skilled and more vulnerable to economic challenges. Especially in view of the severe impacts of the COVID-19 pandemic on the tourism sector, it is important to provide people employed in this sector with alternative employment opportunities. The transition of the energy and transport sectors can offer opportunities here.
This analysis is an initial step identifying expected trends and potential challenges and opportunities towards a Just Transition of the workforce in Antigua and Barbuda. This will need to be followed up with further analysis including other sectors as well as stakeholder engagement, additional structured data collection for developing detailed Just Transition plans and improving the basis for future impact assessments measuring effectivity as well as developing sector-level action plans with targeted training and re-training programmes.

12
1. Introduction
Five years on from the signing of the Paris Agreement, countries are called to communicate enhanced “nationally determined contributions” (NDCs) in order to limit global warming to 1.5°C. As a small island developing state, the focus of Antigua and Barbuda’s main mitigation actions are focussed within the energy sector, primarily within electricity and transport. The revised NDC to be submitted in 2021 establishes a number of targets and sub-targets for these sectors. For electricity, by 2030, 86% of electricity demand is to be met through renewable energy sources. In the transport sector, the use of internal combustion engines is to be phased out by 2040. Moreover, a Just Transition of the workforce by 2030 is envisioned.
The transition to a fossil-free society implies changes on several levels and needs to be accompanied with adequate policies to ensure sustainable and socially inclusive growth. Enabling a just transition for workers and communities needs to be at the core of transition policies. With its transformation from an agrarian to a service-oriented economy and the liberalization of the telecommunications industry, Antigua and Barbuda has experienced two substantial transitions in its relatively recent history (internal document from the Department of the Environment). Similar to these, the transition in electricity and transport has great potential for encouraging economic growth and creating decent jobs if managed properly.
In its guidance note on the Just Transition of the workforce (Department of Environment 2020b), the Department of Environment (DOE), which, as the United Nations Framework Convention on Climate Change (UNFCCC) Focal Point, is leading the coordination of Antigua and Barbuda’s low-carbon energy transition, emphasises that a Just Transition must be inclusive, involve relevant stakeholders and promote economic diversification.
This study aims at analysing the employment implications of Antigua and Barbuda transitioning to a low carbon economy, with a focus on the electricity and transport sectors. To assess the various dimensions of a socially and economically ‘Just Transition’, we combine quantitative approaches assessing impacts for direct employment in electricity generation and road transport complemented with qualitative elements discussing the underlying social dimensions.
The analysis is structured in three parts. The first part provides relevant background information for the socio-economic context, including an overview on the current economic structure and general employment situation in Antigua and Barbuda. The second part covers the main analysis of assessing the employment impacts with a focus on road transport and the electricity sector. It conducts a scenario analysis assessing the employment impacts for a scenario derived based on the current draft NDC targets compared to a Business-as-Usual Scenario. The quantitative part of this analysis focuses on direct jobs in the electricity and transport sectors using an employment factor approach, for which multipliers specific to Antigua and Barbuda are derived whenever data availability or information from expert interviews allowed. This is complemented with a qualitative assessment of the context and wider implications. The third part discusses the results and derives recommendations for a policy framework for a Just Transition.
13
2. Context on current economic structure and employment in general
Background on Antigua and Barbuda
SOCIO-ECONOMICS
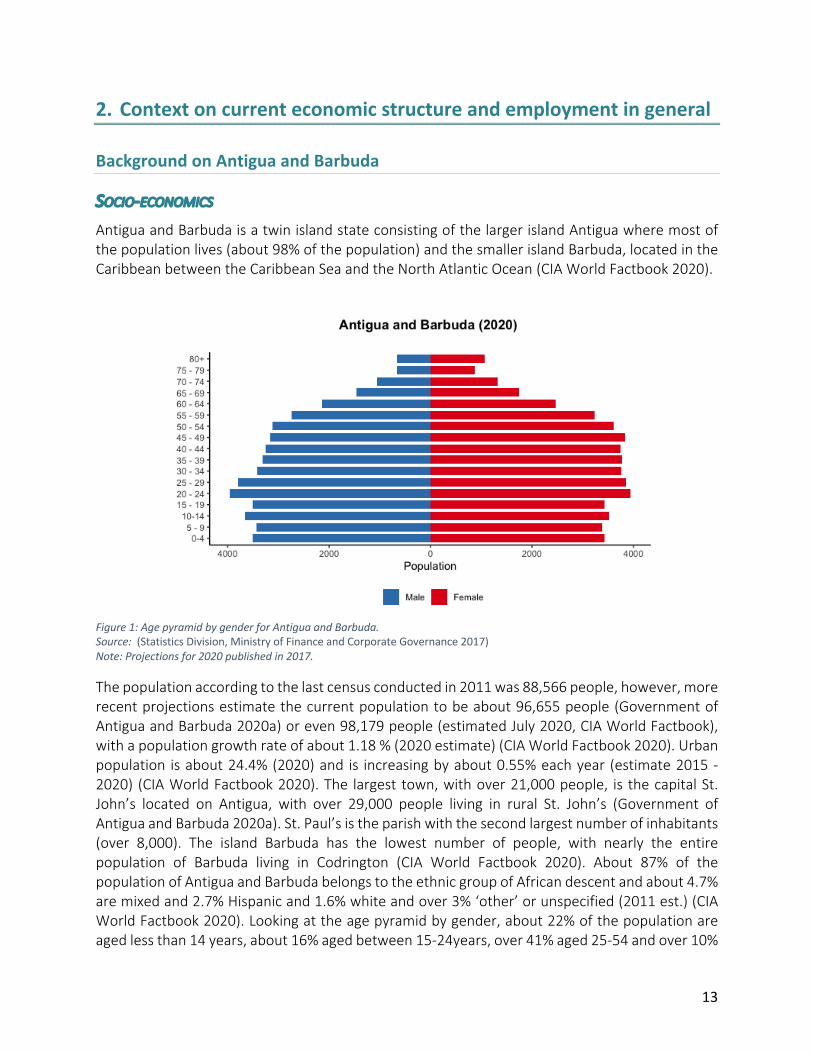
Antigua and Barbuda is a twin island state consisting of the larger island Antigua where most of the population lives (about 98% of the population) and the smaller island Barbuda, located in the Caribbean between the Caribbean Sea and the North Atlantic Ocean (CIA World Factbook 2020).
Figure 1: Age pyramid by gender for Antigua and Barbuda. Source: (Statistics Division, Ministry of Finance and Corporate Governance 2017) Note: Projections for 2020 published in 2017.
The population according to the last census conducted in 2011 was 88,566 people, however, more recent projections estimate the current population to be about 96,655 people (Government of Antigua and Barbuda 2020a) or even 98,179 people (estimated July 2020, CIA World Factbook), with a population growth rate of about 1.18 % (2020 estimate) (CIA World Factbook 2020). Urban population is about 24.4% (2020) and is increasing by about 0.55% each year (estimate 2015 -2020) (CIA World Factbook 2020). The largest town, with over 21,000 people, is the capital St. John’s located on Antigua, with over 29,000 people living in rural St. John’s (Government of Antigua and Barbuda 2020a). St. Paul’s is the parish with the second largest number of inhabitants (over 8,000). The island Barbuda has the lowest number of people, with nearly the entire population of Barbuda living in Codrington (CIA World Factbook 2020). About 87% of the population of Antigua and Barbuda belongs to the ethnic group of African descent and about 4.7% are mixed and 2.7% Hispanic and 1.6% white and over 3% ‘other’ or unspecified (2011 est.) (CIA World Factbook 2020). Looking at the age pyramid by gender, about 22% of the population are aged less than 14 years, about 16% aged between 15-24years, over 41% aged 25-54 and over 10%
14
aged 55-64 and only 8.9% aged over 65 years, with males slightly dominating the younger age groups up to 24 years but females dominating for the older age groups (see Figure 1).
Antigua and Barbuda is in the category of countries with high human development, reaching a Human Development Index (HDI) of 0.778 in 2019, ranking it 78 out of 189 countries in the world (UNDP 2020). It has increased its life expectancy at birth from 71.5 years (1990) to 77.0 years (2019) (UNDP 2020) and education rates have also improved (CIA World Factbook 2020).
The National Country Poverty Assessment Report of 2007 finds that about 18% of the population lives below the poverty line of individuals whose expenditure is less than EC$6,318 (US$2,366) per year. Over 28% are moreover considered to be at risk of falling into poverty (Government of Antigua and Barbuda 2020a).
Antigua and Barbuda has achieved universal access to electricity (World Bank 2020). However, electricity prices1 in Antigua and Barbuda are among the highest in the Caribbean region (Department of Environment 2020a), with the cost of electricity having increased to over 40US cents per kWh (Government of Antigua and Barbuda 2020a). These high electricity prices harm the provision of essential services, small businesses and also low- and middle-income households with the poorest decile spending more than 20% of their income on electricity (Global Green Growth Institute 2021). 98.75% of the country’s population had access to clean fuels and technologies for cooking in 2016 (World Bank 2020).
From June to November, Antigua and Barbuda typically experiences hurricanes and tropical storms, with the majority of storms happening between August to November. In early September 2017, the devastating Hurricane Irma hit the island of Barbuda destroying almost all structures and vegetation on the smaller island (CIA World Factbook 2020).
MACRO-ECONOMICS
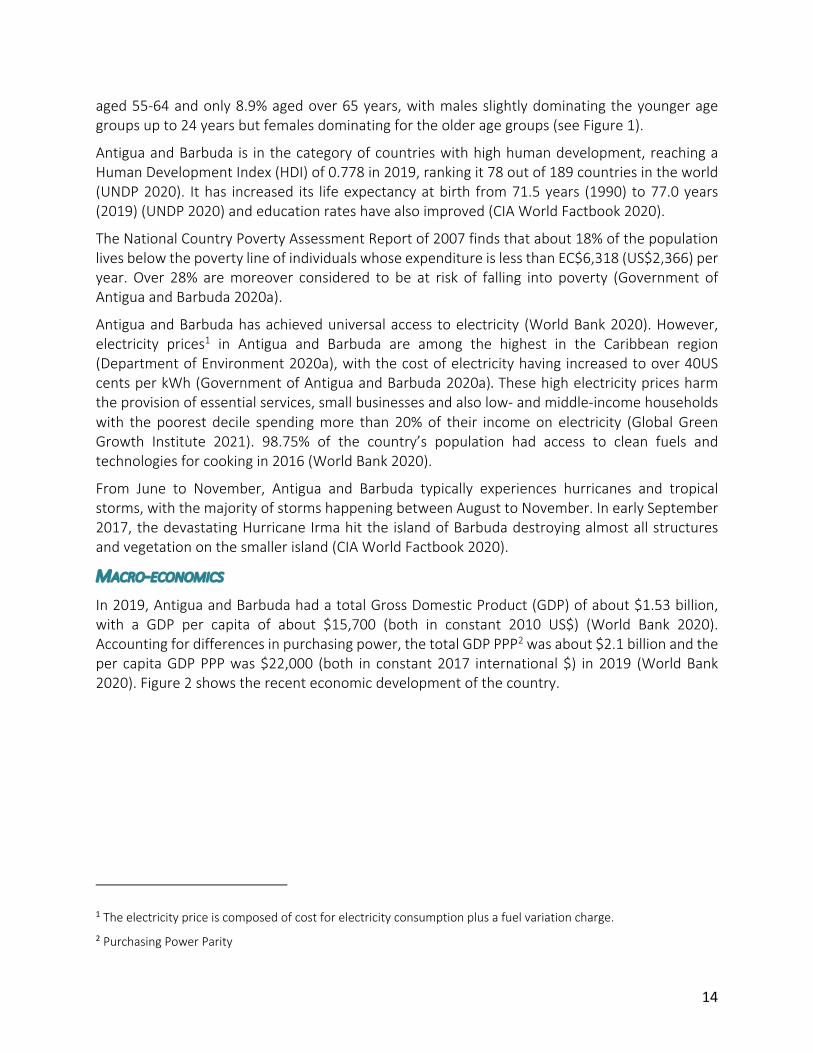
In 2019, Antigua and Barbuda had a total Gross Domestic Product (GDP) of about $1.53 billion, with a GDP per capita of about $15,700 (both in constant 2010 US$) (World Bank 2020). Accounting for differences in purchasing power, the total GDP PPP2 was about $2.1 billion and the per capita GDP PPP was $22,000 (both in constant 2017 international $) in 2019 (World Bank 2020). Figure 2 shows the recent economic development of the country.
1 The electricity price is composed of cost for electricity consumption plus a fuel variation charge. 2 Purchasing Power Parity
15
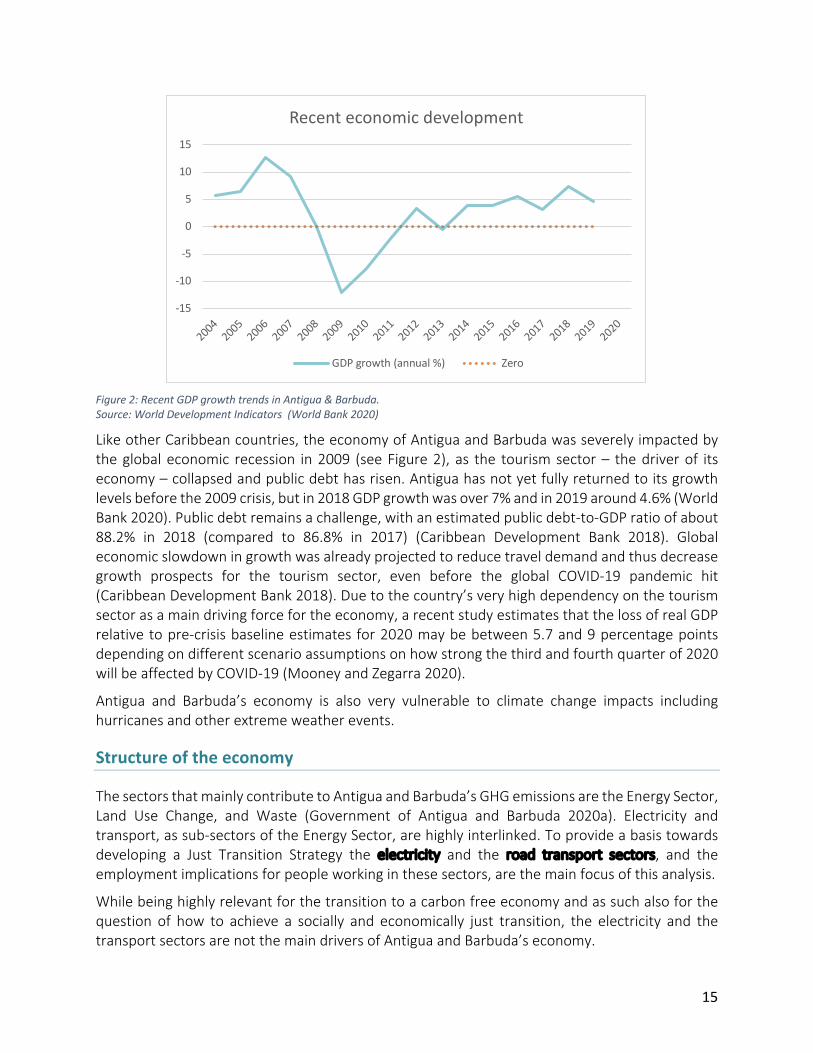
Figure 2: Recent GDP growth trends in Antigua & Barbuda. Source: World Development Indicators (World Bank 2020)
Like other Caribbean countries, the economy of Antigua and Barbuda was severely impacted by the global economic recession in 2009 (see Figure 2), as the tourism sector – the driver of its economy – collapsed and public debt has risen. Antigua has not yet fully returned to its growth levels before the 2009 crisis, but in 2018 GDP growth was over 7% and in 2019 around 4.6% (World Bank 2020). Public debt remains a challenge, with an estimated public debt-to-GDP ratio of about 88.2% in 2018 (compared to 86.8% in 2017) (Caribbean Development Bank 2018). Global economic slowdown in growth was already projected to reduce travel demand and thus decrease growth prospects for the tourism sector, even before the global COVID-19 pandemic hit (Caribbean Development Bank 2018). Due to the country’s very high dependency on the tourism sector as a main driving force for the economy, a recent study estimates that the loss of real GDP relative to pre-crisis baseline estimates for 2020 may be between 5.7 and 9 percentage points depending on different scenario assumptions on how strong the third and fourth quarter of 2020 will be affected by COVID-19 (Mooney and Zegarra 2020).
Antigua and Barbuda’s economy is also very vulnerable to climate change impacts including hurricanes and other extreme weather events.
Structure of the economy
The sectors that mainly contribute to Antigua and Barbuda’s GHG emissions are the Energy Sector, Land Use Change, and Waste (Government of Antigua and Barbuda 2020a). Electricity and transport, as sub-sectors of the Energy Sector, are highly interlinked. To provide a basis towards developing a Just Transition Strategy the electricity and the road transport sectors, and the employment implications for people working in these sectors, are the main focus of this analysis.
While being highly relevant for the transition to a carbon free economy and as such also for the question of how to achieve a socially and economically just transition, the electricity and the transport sectors are not the main drivers of Antigua and Barbuda’s economy.
-15
-10
-5
0
5
10
15
20042005
20062007
20082009
20102011
20122013
20142015
20162017
20182019
2020
Recent economic development
GDP growth (annual %) Zero
16
Tourism is the main driving force for economic growth in Antigua and Barbuda, accounting for almost 60% of GDP and 40% of investments (before COVID-19) (CIA World Factbook 2020). According to the ECCB, the Hotels and Restaurants industry alone contributed almost 15% of GDP in 2019 (ECCB 2020). A recent study ranked Antigua and Barbuda 4th in its Tourist Dependency Index, exhibiting the second highest index value among countries in Latin America and the Caribbean (Mooney and Zegarra 2020). In 2018, the direct employment in the tourism sector was about 5,000 people, amounting to almost 13.6% of employment in Antigua and Barbuda (Mooney and Zegarra 2020).
As the industry is highly dependent on tourism, a decline in visitors poses a substantial threat to the economic stability of Antigua and Barbuda (Government of Antigua and Barbuda 2020a). In 2016, the total expenditures of visitors was estimated to account for up to 28% of the country’s total GDP (Government of Antigua and Barbuda 2020a). It is expected that the pandemic will likely have severe impacts on employment, estimating that the share of the tourism sector in total employment may go down between 5.9 and 9.4 percentage points (Mooney and Zegarra 2020). Early evidence of the impact of COVID-19 on hotels and restaurants showed a decline in economic activity in the hotels and restaurant sector by almost -62%. With a limited recovery in the tourism industry, overall GDP was projected to decline by 18% in 2020 (Ministry of Finance and Corporate Governance 2020).
Similar to other Caribbean islands, Antigua and Barbuda has a high financial sector ratio relative to its size, with the financial sector accounting for about 10% of the total GDP in 2012, which is, however, decreasing (for 2018 it was expected to be at about 9.15%) (Government of Antigua and Barbuda 2020a).
The production in the country’s agricultural sector mainly focuses on the domestic market and is subject to water supply limitations and also a shortage of labour supply as it needs to compete with higher wages in the tourism and construction sector (CIA World Factbook 2020).
The industry sector is strongly dependent on the importation of final goods and products, as Antigua and Barbuda has relatively few processing industries (Government of Antigua and Barbuda 2020a). Apart from several quarries, there is no relevant mining sector in Antigua and Barbuda as it has no known relevant minerals or fossil resources.
The waste sector is growing in importance. All solid waste3 is managed by the National Solid Waste Management Authority (NSWMA). Antigua and Barbuda does not have a centralized sewerage system nor a centralized facility to treat sewage. As a consequence, many households have soakaway and septic tanks and, in some circumstances, the sewage collected (in septic tanks) is transported by NSWMA and brought to the landfill facility. Most hotels have centralised sewage and wastewater treatment facilities on their properties. Waste such as industrial wastewater, edible oils and fat are largely managed by different private actors, among others biofuel conversion facilities (Government of Antigua and Barbuda 2020a).
3 Solid waste is divided into the following categories: biodegradable organic material, other organic material, paper, plastics, metals, glass, hazardous, green waste/agricultural, and construction/demolition (Government of Antigua and Barbuda 2020a).
17
General employment indicators
Following the categorization of the International Labour Organization, this section analyses the general status of Antigua and Barbuda’s employment situation before COVID-19. To provide background, we summarize the insights from the latest two Labour Force Surveys. Readers who are already familiar with the surveys may proceed to Section 3.
LABOUR MARKET OVERVIEW
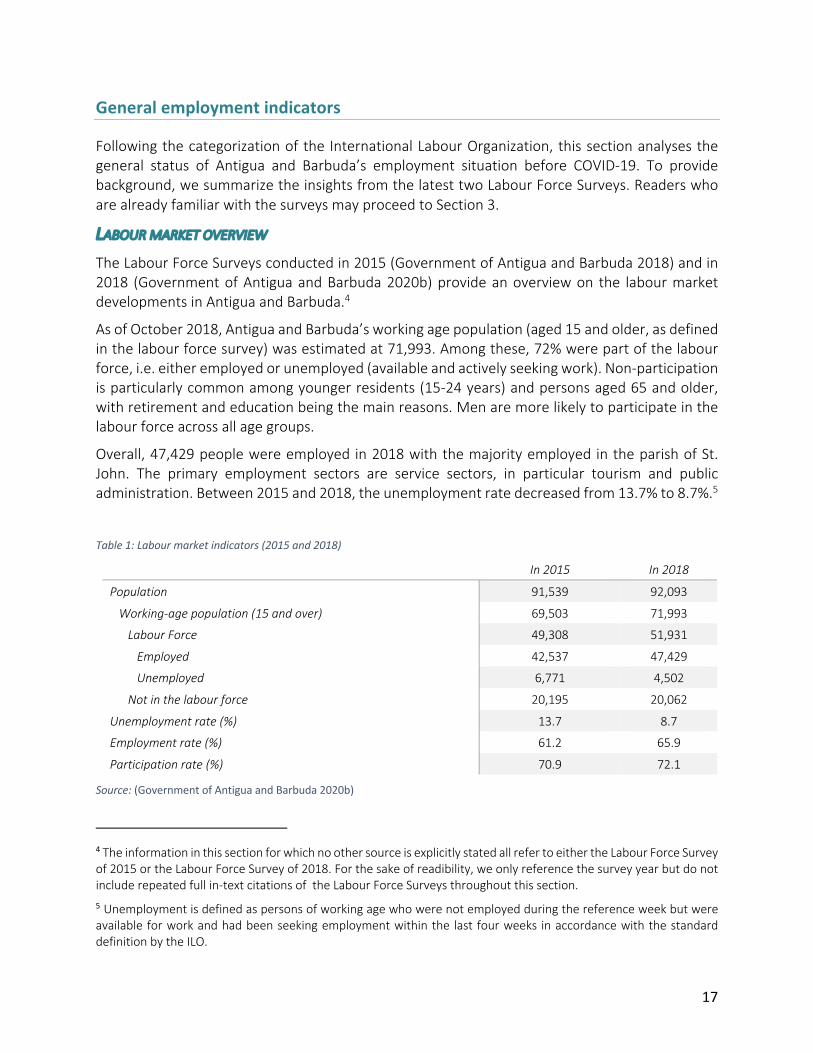
The Labour Force Surveys conducted in 2015 (Government of Antigua and Barbuda 2018) and in 2018 (Government of Antigua and Barbuda 2020b) provide an overview on the labour market developments in Antigua and Barbuda.4
As of October 2018, Antigua and Barbuda’s working age population (aged 15 and older, as defined in the labour force survey) was estimated at 71,993. Among these, 72% were part of the labour force, i.e. either employed or unemployed (available and actively seeking work). Non-participation is particularly common among younger residents (15-24 years) and persons aged 65 and older, with retirement and education being the main reasons. Men are more likely to participate in the labour force across all age groups.
Overall, 47,429 people were employed in 2018 with the majority employed in the parish of St. John. The primary employment sectors are service sectors, in particular tourism and public administration. Between 2015 and 2018, the unemployment rate decreased from 13.7% to 8.7%.5
Table 1: Labour market indicators (2015 and 2018)
Source: (Government of Antigua and Barbuda 2020b)
4 The information in this section for which no other source is explicitly stated all refer to either the Labour Force Survey of 2015 or the Labour Force Survey of 2018. For the sake of readibility, we only reference the survey year but do not include repeated full in-text citations of the Labour Force Surveys throughout this section. 5 Unemployment is defined as persons of working age who were not employed during the reference week but were available for work and had been seeking employment within the last four weeks in accordance with the standard definition by the ILO.
In 2015 In 2018
Population 91,539 92,093
Working-age population (15 and over) 69,503 71,993
Labour Force 49,308 51,931
Employed 42,537 47,429
Unemployed 6,771 4,502
Not in the labour force 20,195 20,062
Unemployment rate (%) 13.7 8.7
Employment rate (%) 61.2 65.9
Participation rate (%) 70.9 72.1
18
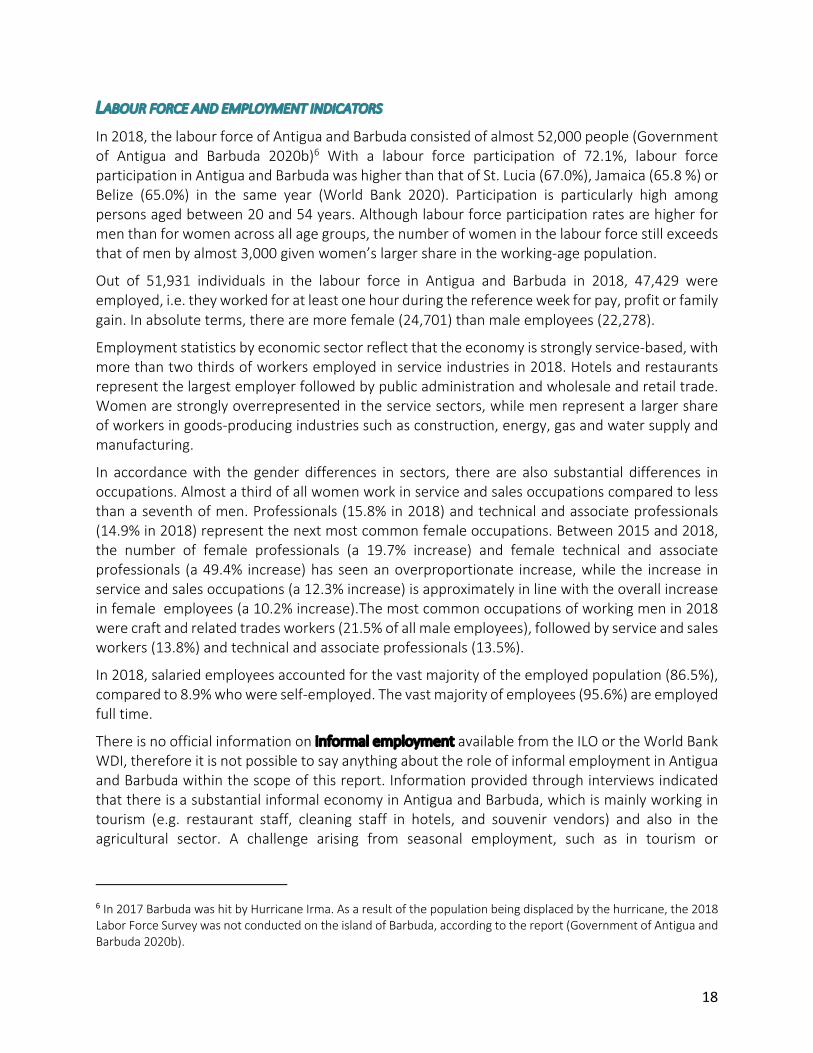
LABOUR FORCE AND EMPLOYMENT INDICATORS
In 2018, the labour force of Antigua and Barbuda consisted of almost 52,000 people (Government of Antigua and Barbuda 2020b)6 With a labour force participation of 72.1%, labour force participation in Antigua and Barbuda was higher than that of St. Lucia (67.0%), Jamaica (65.8 %) or Belize (65.0%) in the same year (World Bank 2020). Participation is particularly high among persons aged between 20 and 54 years. Although labour force participation rates are higher for men than for women across all age groups, the number of women in the labour force still exceeds that of men by almost 3,000 given women’s larger share in the working-age population.
Out of 51,931 individuals in the labour force in Antigua and Barbuda in 2018, 47,429 were employed, i.e. they worked for at least one hour during the reference week for pay, profit or family gain. In absolute terms, there are more female (24,701) than male employees (22,278).
Employment statistics by economic sector reflect that the economy is strongly service-based, with more than two thirds of workers employed in service industries in 2018. Hotels and restaurants represent the largest employer followed by public administration and wholesale and retail trade. Women are strongly overrepresented in the service sectors, while men represent a larger share of workers in goods-producing industries such as construction, energy, gas and water supply and manufacturing.
In accordance with the gender differences in sectors, there are also substantial differences in occupations. Almost a third of all women work in service and sales occupations compared to less than a seventh of men. Professionals (15.8% in 2018) and technical and associate professionals (14.9% in 2018) represent the next most common female occupations. Between 2015 and 2018, the number of female professionals (a 19.7% increase) and female technical and associate professionals (a 49.4% increase) has seen an overproportionate increase, while the increase in service and sales occupations (a 12.3% increase) is approximately in line with the overall increase in female employees (a 10.2% increase).The most common occupations of working men in 2018 were craft and related trades workers (21.5% of all male employees), followed by service and sales workers (13.8%) and technical and associate professionals (13.5%).
In 2018, salaried employees accounted for the vast majority of the employed population (86.5%), compared to 8.9% who were self-employed. The vast majority of employees (95.6%) are employed full time.
There is no official information on informal employment available from the ILO or the World Bank WDI, therefore it is not possible to say anything about the role of informal employment in Antigua and Barbuda within the scope of this report. Information provided through interviews indicated that there is a substantial informal economy in Antigua and Barbuda, which is mainly working in tourism (e.g. restaurant staff, cleaning staff in hotels, and souvenir vendors) and also in the agricultural sector. A challenge arising from seasonal employment, such as in tourism or
6 In 2017 Barbuda was hit by Hurricane Irma. As a result of the population being displaced by the hurricane, the 2018 Labor Force Survey was not conducted on the island of Barbuda, according to the report (Government of Antigua and Barbuda 2020b).

19
agriculture, is that income of these workers is also seasonal, though some banks and credit unions seem to offer seasonal repayment options for loans.
Figure 3: Employment by industry and profession in 2018. Source: 2018 Labour Force Survey (Government of Antigua and Barbuda 2020b)
UNEMPLOYMENT AND LABOUR UNDERUTILIZATION
The unemployment rate in Antigua and Barbuda has seen a volatile development over the last decade, from below 5% in 2007, 10.2% in 2011, 13.7% in 2015 to 8.9% in 2018 (James et al. 2019;
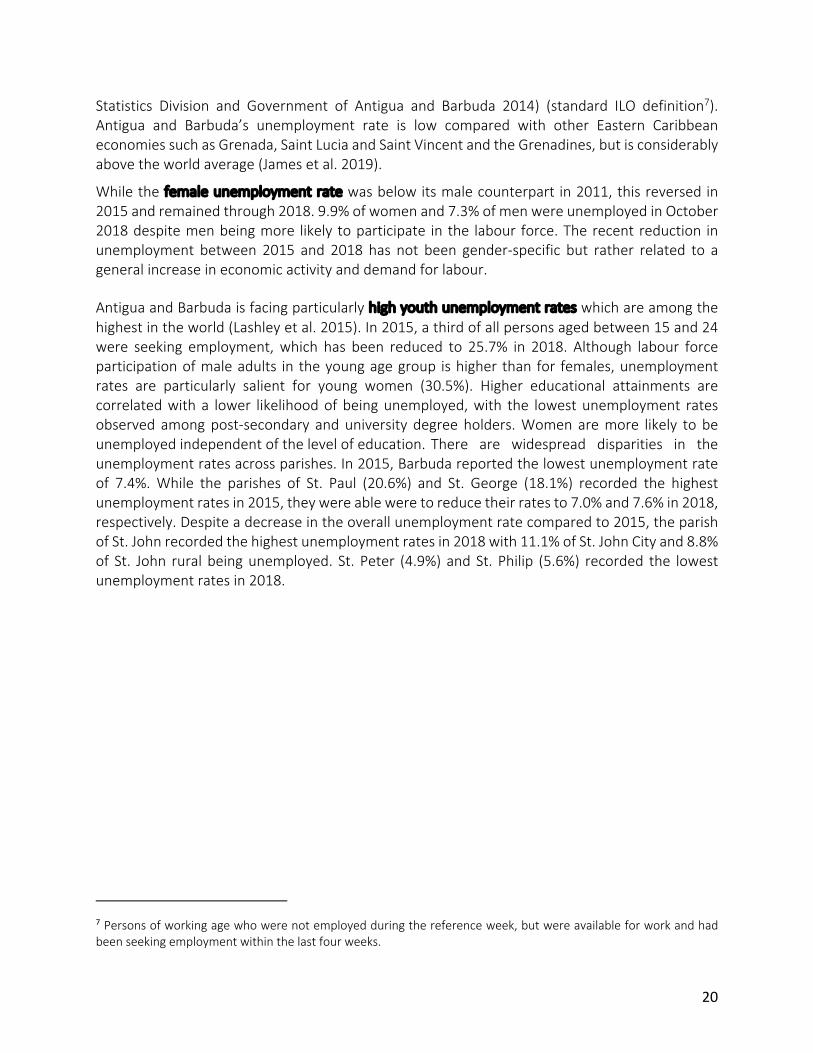
20
Statistics Division and Government of Antigua and Barbuda 2014) (standard ILO definition7). Antigua and Barbuda’s unemployment rate is low compared with other Eastern Caribbean economies such as Grenada, Saint Lucia and Saint Vincent and the Grenadines, but is considerably above the world average (James et al. 2019).
While the female unemployment rate was below its male counterpart in 2011, this reversed in 2015 and remained through 2018. 9.9% of women and 7.3% of men were unemployed in October 2018 despite men being more likely to participate in the labour force. The recent reduction in unemployment between 2015 and 2018 has not been gender-specific but rather related to a general increase in economic activity and demand for labour.
Antigua and Barbuda is facing particularly high youth unemployment rates which are among the highest in the world (Lashley et al. 2015). In 2015, a third of all persons aged between 15 and 24 were seeking employment, which has been reduced to 25.7% in 2018. Although labour force participation of male adults in the young age group is higher than for females, unemployment rates are particularly salient for young women (30.5%). Higher educational attainments are correlated with a lower likelihood of being unemployed, with the lowest unemployment rates observed among post-secondary and university degree holders. Women are more likely to be unemployed independent of the level of education. There are widespread disparities in the unemployment rates across parishes. In 2015, Barbuda reported the lowest unemployment rate of 7.4%. While the parishes of St. Paul (20.6%) and St. George (18.1%) recorded the highest unemployment rates in 2015, they were able were to reduce their rates to 7.0% and 7.6% in 2018, respectively. Despite a decrease in the overall unemployment rate compared to 2015, the parish of St. John recorded the highest unemployment rates in 2018 with 11.1% of St. John City and 8.8% of St. John rural being unemployed. St. Peter (4.9%) and St. Philip (5.6%) recorded the lowest unemployment rates in 2018.
7 Persons of working age who were not employed during the reference week, but were available for work and had been seeking employment within the last four weeks.

21
a) unemployment rate by age groups b) unemployment rate by parish
Figure 4: Unemployment by age group and parish, differentiated by gender in 2018. Source: 2018 Labour Survey (Government of Antigua and Barbuda 2020b)
As the tourism sector plays an important role for employment in Antigua and Barbuda, and it is a very seasonal sector, there is substantial seasonal unemployment (Government of Antigua and Barbuda 2020a).
The applied definition of unemployment may mask the fact that workers may work fewer hours than their availability and preference, so-called underemployment8. A more accurate picture of the underutilisation of the productive potential of the country's labour force can be obtained by adding the number of underemployed, i.e., those involuntarily working less than 35 hours per week. In 2018, more than a third (36.8%) of part-time employees were involuntarily employed part-time. The underemployment rate was higher among women, workers aged 15 to 24 and those with lower educational attainment, signalling that labour under-utilization is prevalent in particular for labour market entrants.
SALARIES AND GENERAL WORKING CONDITIONS
According to the 2018 Labour Force Survey, the majority of employees earned a monthly gross income between $1200 and $3999. The likelihood of reporting higher incomes increases with the employees’ age. There is a clear gender pattern in earnings, with men being overrepresented in the high-income groups (> $2000) and women being overrepresented in the low-income groups. This relates to a large part of female employees being employed in service jobs which are typically associated with lower wages.
8 The underemployment rate is defined as the number of involuntary part-time workers as a percentage of the employed population. We here only consider time-related underemployment due to data limitations.

22
3. Employment impacts for a transition of the road transport and electricity sectors
About the current structure of the transport and electricity sector
FUEL IMPORT DEPENDENCY OF THE ENERGY SECTOR
Figure 5: Energy consumption by sector in 2012. Source: (Inter-American Development Bank 2015)
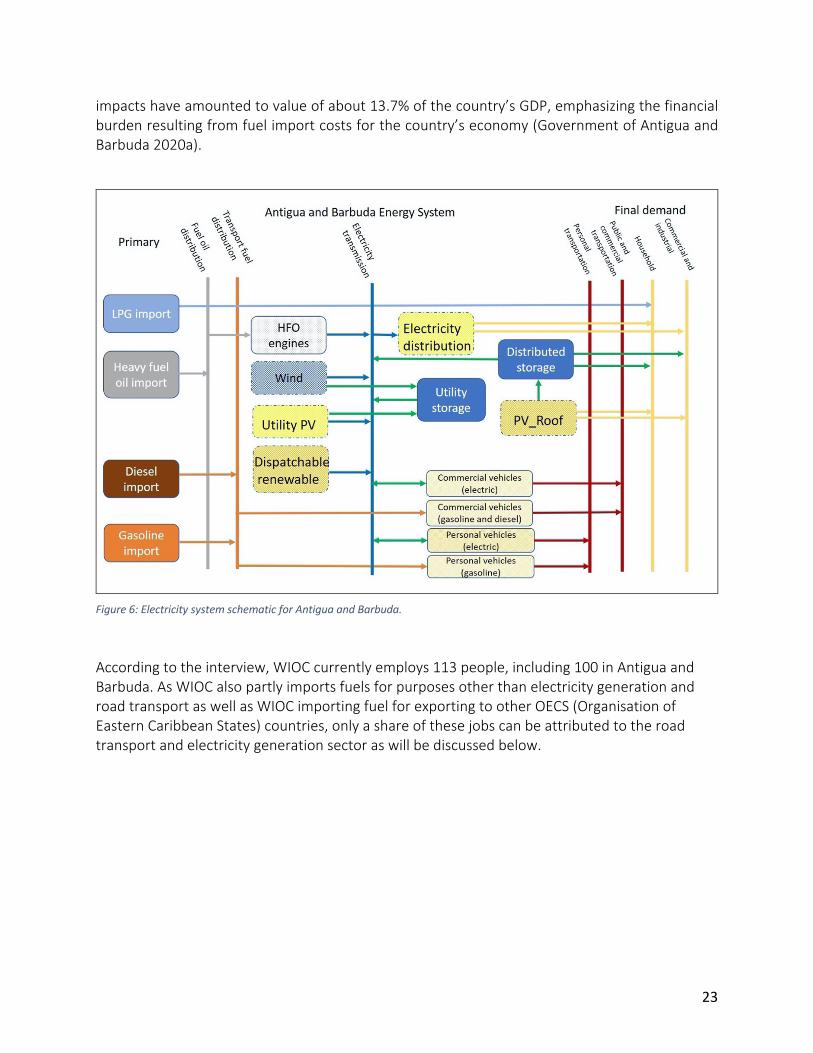
The energy sector includes electricity generation and fuel use in transportation and fuel use for commercial or domestic consumption by households. Electricity may again be used to supply several sectors, the residential sector (households), industry, businesses and services (e.g. tourism), and electricity for e-mobility in the transport sector. Figure 5 shows the shares of the different end-use sectors of energy for 2012. Figure 6 illustrates the structure and interlinkages of the sectors in Antigua & Barbuda.
Antigua and Barbuda has a high fossil fuel import dependency. As it does not have any known fossil fuel resources, Antigua and Barbuda imports 100% of the petroleum-based products it uses. Fuel types imported (see Table 9 in the Data Annex (Annex B)) are used for different purposes: Motor gasoline and diesel are used in road transport, with diesel also being used for diesel generators and marine transport. Fuel oil is mainly heavy fuel oil (HFO) used in power plants for electricity generation. Other fuel types not relevant for this analysis are LPG which is often used for cooking and water heating, Kerosene used for lighting, and jet fuel which is used in aviation. The sole supplier of fuel importation in Antigua and Barbuda is the West Indies Oil Company Ltd. (WIOC), which is owned by three stakeholders: the Government of Antigua and Barbuda (51%) and two other private entities (24% and 25% respectively) (Inter-American Development Bank 2015). Most of the fuel is used for electricity generation and transport (road vehicles and aviation). Fuel imports9 average 4,500 barrels per day, and the estimated value of imported oil was US$160.1 million in 2015 (Government of Antigua and Barbuda 2020a). In 2013, the costs of fossil fuel
9 Note that Antigua and Barbuda’s WIOC also partly imports for exporting to other OECS (Organisation of Eastern Caribbean States) countries.
23
impacts have amounted to value of about 13.7% of the country’s GDP, emphasizing the financial burden resulting from fuel import costs for the country’s economy (Government of Antigua and Barbuda 2020a).
Figure 6: Electricity system schematic for Antigua and Barbuda.
According to the interview, WIOC currently employs 113 people, including 100 in Antigua and Barbuda. As WIOC also partly imports fuels for purposes other than electricity generation and road transport as well as WIOC importing fuel for exporting to other OECS (Organisation of Eastern Caribbean States) countries, only a share of these jobs can be attributed to the road transport and electricity generation sector as will be discussed below.
24
Figure 7: Fuel imports as a share of GDP10.
Source: (Inter-American Development Bank 2015)
ELECTRICITY SECTOR
Important actors in the electricity sector are the state-owned Antigua Public Utilities Authority (APUA) as well as the private Independent Power Producer (IPP) Antigua Power Company (APC).
APUA’s Electricity Business Unit has the primary functions of power generation and transmission and distribution. In an assessment from 2016, the number of total APUA-wide employees is stated to have been around 750 employees (Tetra Tech ES 2016). APUA also has a large water business unit and a telecommunication business unit as well as other overarching units for management, Marketing and Human Resources which are all not directly involved with the electricity sector. Focusing on APUA’s Electricity Business Unit only, the figures provided in the 2016 assessments suggest that at this time there have been about 30 people working in ‘Transmission and Distribution’, around 15 people in ‘System Control and SCADA11’, around 30 people worked in ‘Customer Services’, a bit more than 10 people working in the department ‘Substation, Maintenance and Protection’, about 4 people in the ‘Electrical and Instruments Department/Renewable Energy’ and about 5 people in the Friars Hill power station and about 33 people in the Wadadli power plant, amounting to around 130 people having worked in APUA’s Electricity Business Unit around 2016, including non-technical staff (Tetra Tech ES 2016). Data provided by APUA for this report lists 78 people employed in the Electricity Business Unit as technical-staff across the different departments. With regard to the energy system transformation
10 Eastern Caribbean average includes Antigua and Barbuda, Dominica, Grenada, Saint Kitts and Nevis, Saint Lucia, and Saint Vincent and the Grenadines.
11 Supervisory Control and Data Acquisition
25
it can be expected that not all of the departments of APUA’s electricity Business Unit will be affected in the same way by a transition away from fossil fuels.
Electricity generation in Antigua and Barbuda has so far been mainly supplied by fossil fuel-based power plants run by the private independent power producer APC under a Purchasing Power Agreement (PPA), as well as power plants that are run by the state-ownedAPUA.
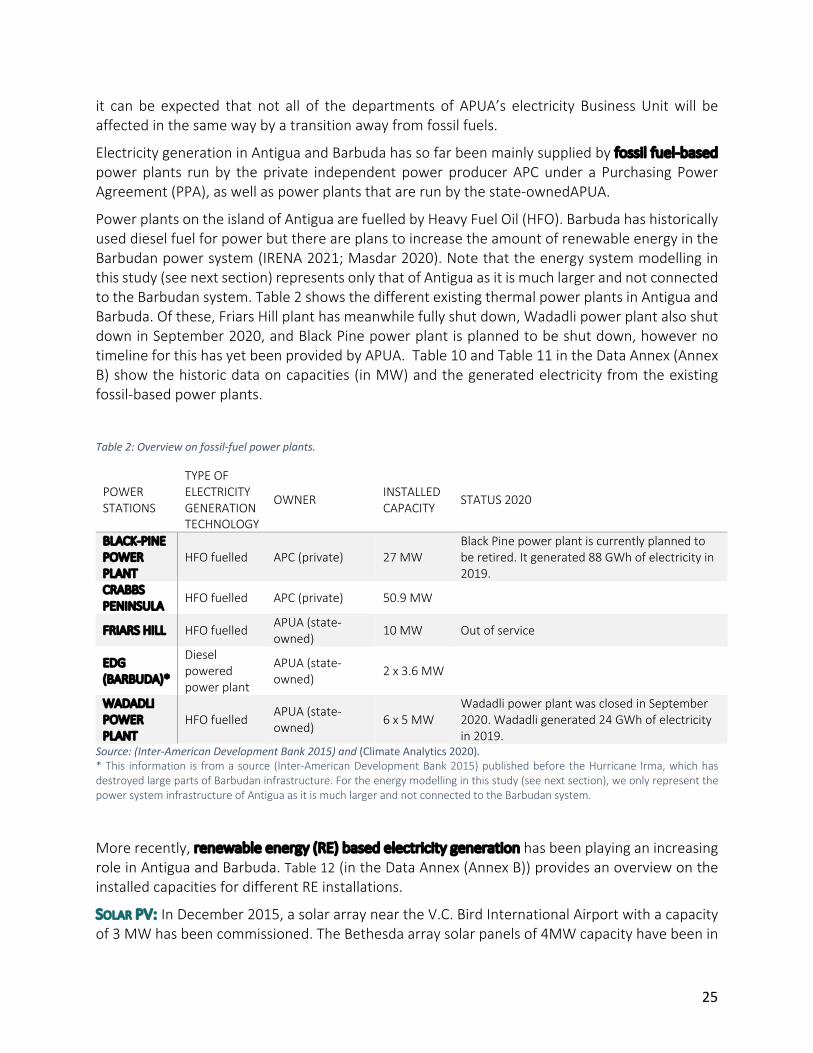
Power plants on the island of Antigua are fuelled by Heavy Fuel Oil (HFO). Barbuda has historically used diesel fuel for power but there are plans to increase the amount of renewable energy in the Barbudan power system (IRENA 2021; Masdar 2020). Note that the energy system modelling in this study (see next section) represents only that of Antigua as it is much larger and not connected to the Barbudan system. Table 2 shows the different existing thermal power plants in Antigua and Barbuda. Of these, Friars Hill plant has meanwhile fully shut down, Wadadli power plant also shut down in September 2020, and Black Pine power plant is planned to be shut down, however no timeline for this has yet been provided by APUA. Table 10 and Table 11 in the Data Annex (Annex B) show the historic data on capacities (in MW) and the generated electricity from the existing fossil-based power plants.
Table 2: Overview on fossil-fuel power plants.
POWER STATIONS
TYPE OF ELECTRICITY GENERATION TECHNOLOGY
OWNER INSTALLED CAPACITY
STATUS 2020
BLACK-PINE POWER PLANT
HFO fuelled APC (private) 27 MW Black Pine power plant is currently planned to be retired. It generated 88 GWh of electricity in 2019.
CRABBS PENINSULA
HFO fuelled APC (private) 50.9 MW
FRIARS HILL HFO fuelled APUA (state-owned)
10 MW Out of service
EDG (BARBUDA)*
Diesel powered power plant
APUA (state-owned)
2 x 3.6 MW
WADADLI POWER PLANT
HFO fuelled APUA (state-owned) 6 x 5 MW
Wadadli power plant was closed in September 2020. Wadadli generated 24 GWh of electricity in 2019.
Source: (Inter-American Development Bank 2015) and (Climate Analytics 2020). * This information is from a source (Inter-American Development Bank 2015) published before the Hurricane Irma, which has destroyed large parts of Barbudan infrastructure. For the energy modelling in this study (see next section), we only represent the power system infrastructure of Antigua as it is much larger and not connected to the Barbudan system.
More recently, renewable energy (RE) based electricity generation has been playing an increasing role in Antigua and Barbuda. Table 12 (in the Data Annex (Annex B)) provides an overview on the installed capacities for different RE installations.
SOLAR PV: In December 2015, a solar array near the V.C. Bird International Airport with a capacity of 3 MW has been commissioned. The Bethesda array solar panels of 4MW capacity have been in
26
operation since 2017. Moreover, a growing number of distributed solar PV (rooftop) have been installed. On Barbuda, electricity generation by APUA uses solar PV mini-grid plant servicing a peak demand of 0.5 MW, which is backed by diesel-power.
WIND: The project Sustainable Pathways – Protected Areas, Renewable Energy (SPPARE) is piloting the use of wind generators within the next years to explore the feasibility of wind energy for Antigua and Barbuda (Government of Antigua and Barbuda 2020a).
BATTERY STORAGE capacity is currently not yet playing a large role in Antigua and Barbuda. A very small number of residential homes already have battery storage with PV. However, there are plans to install battery storage in the near future. According to APUA, a battery installation of 11 MWhs is planned to stabilize the grid to address intermittency from solar PV.12
Antigua Public Utilities Authority (APUA) is exclusively responsible for electricity transmission and services in Antigua and Barbuda. The company derives its mandate from the Public Utilities Act (No. 10 of 1973).
TRANSPORT SECTOR - VEHICLE FLEET AND INFRASTRUCTURE
The transport sector in Antigua and Barbuda is undergoing substantial transformation processes. The Biennial Update Report prepared by the Department of Environment and submitted to the United Nations Framework Convention on Climate Change (UNFCCC) describes three major trends: electrification, shared mobility and automation of vehicles (Government of Antigua and Barbuda 2020a).
At present, Antigua and Barbuda’s road transport fleet consists of approximately 50,000 vehicles with gasoline or diesel internal combustion engines (ICEs). The fleet can be divided into motorcycles, private vehicles, light duty vehicles, heavy-duty vehicles and buses. These include personal as well as commercial or public vehicles (see Data Annex (Annex B)). Private passenger cars mostly fuelled with gasoline constitute the largest part of all vehicles. Corresponding to the dominant use of second-hand cars and a lack of vehicle efficiency standards, the vintage structure of the vehicle fleet shows that vehicles have a relatively high average age of 13 – 18 years, depending on vehicle type.
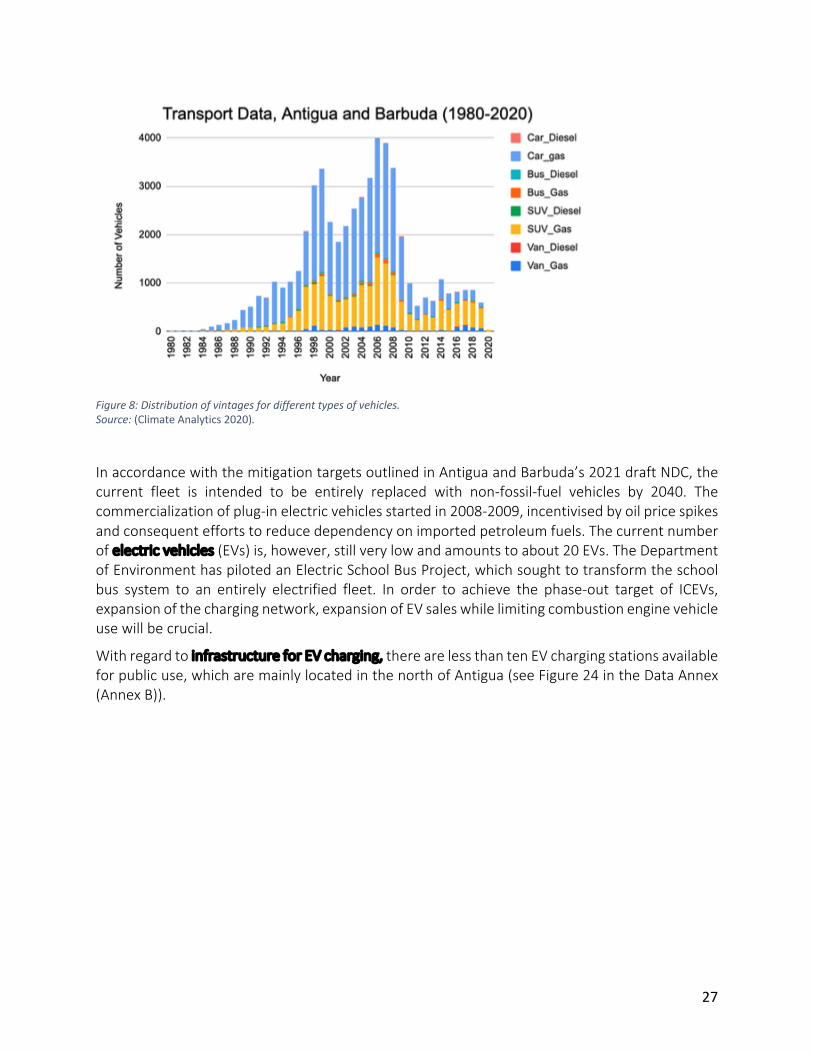
Figure 8 shows the development of vintages by vehicle type over time with Table 14 showing vehicle characteristics by type for 2018.
12 APUA Expression of Interest https://www.carilec.org/file/2020/07/APUA_Request-for-Expression-of-Interest-REOI.pdf
27
Figure 8: Distribution of vintages for different types of vehicles. Source: (Climate Analytics 2020).
In accordance with the mitigation targets outlined in Antigua and Barbuda’s 2021 draft NDC, the current fleet is intended to be entirely replaced with non-fossil-fuel vehicles by 2040. The commercialization of plug-in electric vehicles started in 2008-2009, incentivised by oil price spikes and consequent efforts to reduce dependency on imported petroleum fuels. The current number of electric vehicles (EVs) is, however, still very low and amounts to about 20 EVs. The Department of Environment has piloted an Electric School Bus Project, which sought to transform the school bus system to an entirely electrified fleet. In order to achieve the phase-out target of ICEVs, expansion of the charging network, expansion of EV sales while limiting combustion engine vehicle use will be crucial.
With regard to infrastructure for EV charging, there are less than ten EV charging stations available for public use, which are mainly located in the north of Antigua (see Figure 24 in the Data Annex (Annex B)).
28
Scenario description and stages of transition process
For the scenario analysis, the employment implications of a low-carbon transition in the electricity and road transportation sectors are assessed.
The transition scenario analyzed here has been derived based on the interpretation of Antigua and Barbuda’s draft NDC targets and is compared to the estimated employment development for a Business-as-Usual Scenario, as well as available data on the current employment situation in these sectors. This section describes the baseline and the transition scenario assumptions and the temporal dimension in more detail. Note that the energy system modelling in this study focuses on Antigua as it is much larger and not connected to the Barbudan system. Moreover, the power system in Barbuda is expected to undergo substantial changes in the next years which are still to be defined (IRENA 2021; Masdar 2020).
Note that while estimates are presented until 2050 to cover the entire time horizon of the transition process, the presented numbers are estimates that are subject to increasingly high uncertainty as they extend further into the future. The numbers presented should, therefore, not be interpreted as accurate predictions of the future, but rather as an indication of the expected orders of magnitude and development processes.
DRAFT NDC TARGETS AND NDC SCENARIO CHARACTERISTICS
On March 18, 2021, the draft NDC targets submitted by the Department of Environment (DOE) were approved by the Cabinet. This NDC draft contains a list of targets and sub-targets and outlines the strategic direction of Antigua and Barbuda.
For the electricity sector, the NDC draft sets the overarching target of achieving 86% of renewable energy by 2030. It moreover defines a range of sub-targets indicating strategic priorities. One of these is government operations being based on 100% renewables by 2030. To reflect this strategic direction in our NDC scenario, we assume that about 18MW of 100kW installations on government buildings as well as tourist resorts will be installed by the end of 2030 (i.e., about 180 installations) in the NDC scenario. The NDC also includes a sub-target on RE-based back-up power in residential homes.13 For our NDC scenario, we interpreted this target by assuming that by the end of 2030 20,000 residential houses will be equipped with 2.5kW solar PV installations summing up to 50MW. After 2030, additional 2.5kW installations are installed to match the NDC scenario solar PV roof capacity data. Each of these homes will also have a battery backup system of 10kWh; although this storage capacity would correspond to four hours of storage at full solar output capacity (2.5kW x 4 hrs), in reality 10kWh represents the average daily electricity consumption for a home in Antigua and therefore a 10kWh battery represents a full day of energy storage.
13 The text of the NDC draft as of late March 2021 defined that “30,000 homes or 50% of pre-2020 homes to have back-up renewable energy systems for at least 4–6 hours of energy“. To be on the conservative side, we assume 20,000 homes (roughly resulting from the ‘50% of pre-2020 homes’ target) for our scenario implementation.
29
The NDC draft moreover mentions the intention of wind power to play a larger role, setting the goal of having 20MW of wind-powered energy generation by 2030. In the NDC scenario used for this study, the installed wind capacity is approximately 25MW to reflect this strategic direction. The NDC sub-target of having “100 MW of renewable energy generation capacity available to the grid” is moreover reflected by having approximately 80MW of solar PV utility-scale in addition to wind capacities by 2030, implying that this target would be achieved even without connecting the PV rooftop installations to the grid.
For the transport sector, the NDC defines the overarching target of [road] transport being based 100% on renewable energy by 2040. It moreover defines the sub-targets to ban the importation of new internal combustion engine vehicles by 2028 (with an indicative start year of 2025) and have 100% of the government vehicle fleet to be electric vehicles by 2035. To reflect these targets, the NDC scenario assumes that no ICEVs are sold in Antigua and Barbuda after 2029 while from 2021 onwards the sales of EVs accelerate.
Transition Stages
For a successful and full transition of the electricity and road transportation sector, the National Greenhouse Gas Reduction Report (Climate Analytics 2020) identified four stages that characterize the required transition processes.
• Transition stage one (initiating the transformation) mainly affects the power sector and is characterized by a strong expansion of renewable energy technologies replacing aging fossil-based power generation infrastructure to kick-start the short-term decarbonization of the electricity generation. This is accompanied by a parallel upgrading and modernization of the grid to prepare it for higher renewable energy shares as well as electric vehicles, and grid interactivity among centralized and decentralized production and consumption of power. In this first stage, the expansion of solar photovoltaic (PV) will play a key role (both utility-scale arrays as well as a large number of rooftop solar installations of different capacities). Getting started with wind power planning and first installations will also be part of this initial stage.
• Transition stage two describes the inclusion of the transport sector and the coupling of the power sector to electric vehicles. The transformation of the transport sectors will take place in parallel to the continuous transformation of the power sector, establishing the linkage between sector transformations. The transformation of the transport sectors will be characterized by a process of vehicle stock turnover away from combustion engines towards electric vehicles. While the overall turnover process will take at least two decades, a rapid near-term increase in EV sales as well as a phase out of new sales of ICEVs is crucial. A timeline of ending new sales of ICEV by 2030 and phasing out ICEVs in the vehicle stock around 2040 is envisioned. To achieve this, adequate incentives have to be set and policies need to be implemented that foster an increasing penetration of EVs in the vehicle stock. Any progress in decarbonizing the transport sectors by shifting to EVs is building on a successful decarbonization of electricity generation in parallel while increasing the demand for electricity at the same time. As a consequence, it is important to further increase renewable energy capacities substantially, including a detailed planning
30
for sustainable technologies complementary to wind and solar will need to take place.14 Likewise, it is important to pay early attention to the coupling of the sectors as well as continuous efforts in ramping up renewable energy. Integrated planning can allow to exploit the potential for two-way communication between EVs and the grid or households, taking advantage of distributed storage and generation to reduce the need for centralized capacity.
• Transition stage three, building upon the successful implementation of stage one including the modernization of the grid infrastructure, this stage further progresses with the phase-out of centralized fossil-fuel generation as well as ICEVs in the transport sector. For electricity generation, existing thermal power plants will need to be phased out. The integration of other renewable energy technologies as well as storage capacities play an increasing role with reaching higher RE shares. Solar PV will continue to play a large role here, but decisions will have to be made with stakeholders about the balance between wind and solar power, as well as about other renewable energy technologies and the integration of battery or hydrogen storage to satisfy demand and energy system requirements. In the transport sectors, sales of ICEVs will need to be stopped, and a phasing out of ICEVs in the vehicle stock needs to be achieved in the longer term.
• Transition stage four includes the complete phase out of fossil fuels from electricity generation and road transport and requires full integration of RE and battery storage into interactive grid.
BUSINESS-AS-USUAL (BAU) SCENARIO
The NDC scenario described above is compared to a ‘business-as-usual’ scenario. The assumptions of this BAU scenario are as follows.
• Electricity: o The development of total electricity demand is assumed to be the same as in the
NDC scenario. There are no additional energy efficiency measures in the NDC scenario compared to the BAU.
o Also, in the BAU, we assume that the role of renewable energy will increase somewhat, but significantly less than in the NDC scenario. RE generation is assumed to grow to a share of about 15% of overall electricity generation by 2030 in the BAU and continues to increase thereafter.
o In the BAU, the power generation system remains dominated by HFO-based electricity generation including distributed diesel generators.
• Transportation: o Overall demand for transportation is assumed to be the same in the NDC scenario
and the BAU. That is, it is assumed that transportation patterns do not change,
14 Since Antigua & Barbuda does not have hydropower, geothermal or other resources, either other technologies such as wave power, or storage of energy through hydrogen and batteries will need to be built.
31
there are no modal shifts15 and the overall number of vehicle sales are the same between scenarios, with the difference that the type of car, van or bus is changed from ICEVs (BAU) to EVs (NDC).
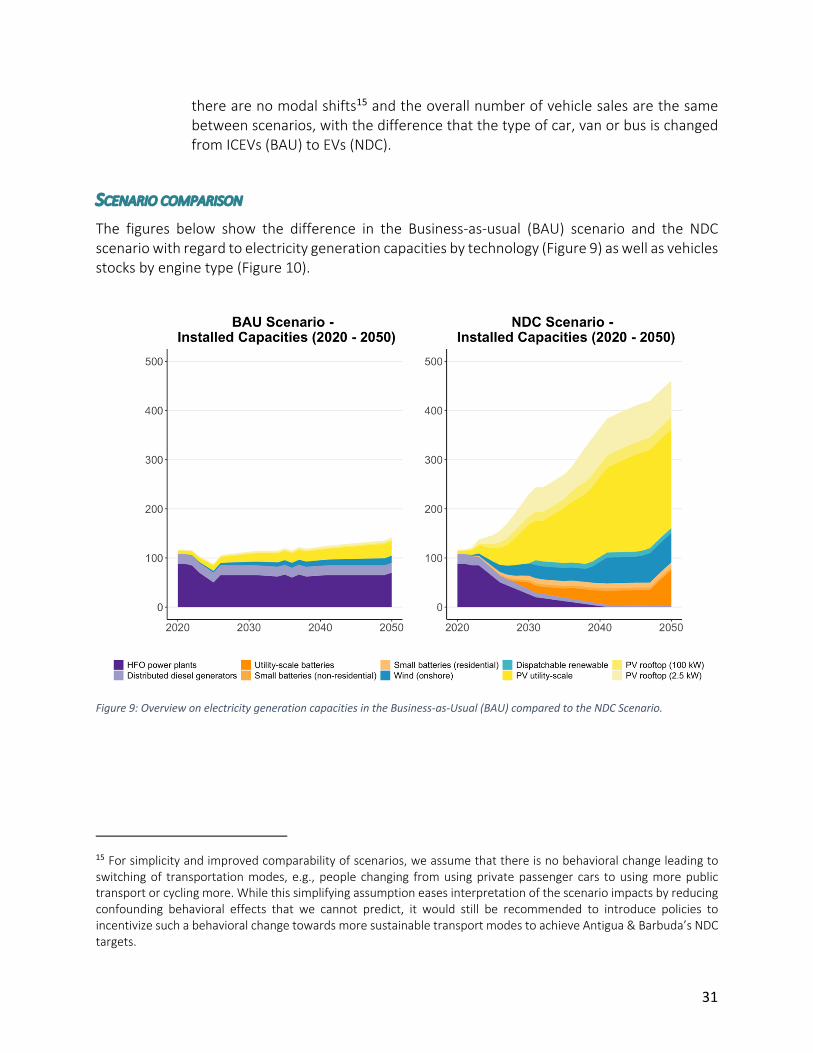
SCENARIO COMPARISON
The figures below show the difference in the Business-as-usual (BAU) scenario and the NDC scenario with regard to electricity generation capacities by technology (Figure 9) as well as vehicles stocks by engine type (Figure 10).
Figure 9: Overview on electricity generation capacities in the Business-as-Usual (BAU) compared to the NDC Scenario.
15 For simplicity and improved comparability of scenarios, we assume that there is no behavioral change leading to switching of transportation modes, e.g., people changing from using private passenger cars to using more public transport or cycling more. While this simplifying assumption eases interpretation of the scenario impacts by reducing confounding behavioral effects that we cannot predict, it would still be recommended to introduce policies to incentivize such a behavioral change towards more sustainable transport modes to achieve Antigua & Barbuda’s NDC targets.
32
It is important to note that at the time of conducting this scenario analysis, APUA had issued a tender to add dispatchable capacity in the form of LNG16 to replace HFO17 plants that are to be taken off the grid. While this was under discussion, an agreement and decision on the way forward had not yet been taken at Cabinet. This potential LNG capacity was not part of the energy system modelling conducted by Climate Analytics nor IRENA and is not represented in either scenario of this analysis. In terms of employment in operations, an LNG engine would likely be comparable to a fuel-oil engine; implications for construction and installation jobs (likely for at most one year) are unclear. However, it should be noted that the initially proposed capacity of 25-30 MW18 could represent 50% or more of total electricity generation in Antigua.
Figure 10: Overview on vehicle stocks by engine type in the Business-as-Usual (BAU) compared to the NDC Scenario
16 See the Expression of Interest https://www.carilec.org/file/2020/07/APUA_Request-for-Expression-of-Interest-REOI.pdf 17 Heavy Fuel Oil 18 As stated in the Expression of Interest https://www.carilec.org/file/2020/07/APUA_Request-for-Expression-of-Interest-REOI.pdf
33
Methodology for the employment analysis
The analysis of the employment impacts and implications of Just Transition of the workforce is combining two elements. A quantitative analysis estimates the impacts on direct jobs for the electricity sector and road transport sector in Antigua and Barbuda, comparing the employment estimates of the Business-as-Usual scenario with the employment estimates of the NDC scenario. This quantification of employment impacts is complemented by a qualitative analysis putting results into the respective context and discussing implications. Both the quantitative analysis and the qualitative analysis are described in more detail below.
A vital input to both elements has been interviews that have been conducted with a range of local stakeholders or experts familiar with the context of Antigua and Barbuda or SIDS in general. A list of entities interviewed can be found in Annex D.
QUANTITATIVE ANALYSIS
The focus of the quantitative assessment is on direct jobs in the electricity generation and road transport. Implications for impacts on indirect jobs further down the supply chain or in other sectors are not quantified here as this is beyond the scope of this study. Wider implications beyond direct job impacts are, however, partly discussed in the qualitative analysis.
The methodology of the quantitative analysis of the employment impacts builds on the employment factor approach. This employment factor approach for the electricity sector is based on the general approach proposed by (Rutovitz, Dominish, and Downes 2015). The basic methodology proposes to use employment factors to assess the employment impacts of an energy transition. The general approach based on employment factors has been applied and developed further in other studies for different global analyses (see e.g. (Ram, Aghahosseini, and Breyer (2020), (Greenpeace et al., 2015), (Teske (Editor), 2019) or (Dominish et al. 2019)). Apart from global analyses, the approach has also been applied to specific countries with country specific employment factors (e.g. Australia (Briggs et al. 2020), Spain (Moreno and López 2008), South Africa (Oyewo et al. 2019), Nigeria (Tambari, Dioha, and Failler 2020)). While the approach by Rutovitz et al. (2015) originally focuses on the electricity generation sector, the basic rational has been adjusted to also be applied to the transport sector for this study, as the available literature and suitable methodologies on employment impacts in the transport sector is much scarcer.
Advantages of the approach are that assumptions can be made very transparent and impact chains are clearly laid out. Moreover, it allows high flexibility in adjusting the respective factors to the local context if data is available. As a first step, the relevant literature has been reviewed to identify employment factors and information on other parameters relevant for the analysis based on available empirical literature. Whenever possible, employment factors from the literature have been replaced and adjusted to the Antigua and Barbuda-specific context based on available data and feedback in interviews with local experts and stakeholders (see list on interviewed entities in Annex). Employment factors or parameters from the literature were used only in cases where better local estimates were not available or for technologies that play a very minor role for the scenarios. In the Technical Annex (Annex A), the methodology and underlying assumptions on employment factors and other parameters are described in detail for the electricity sector and the
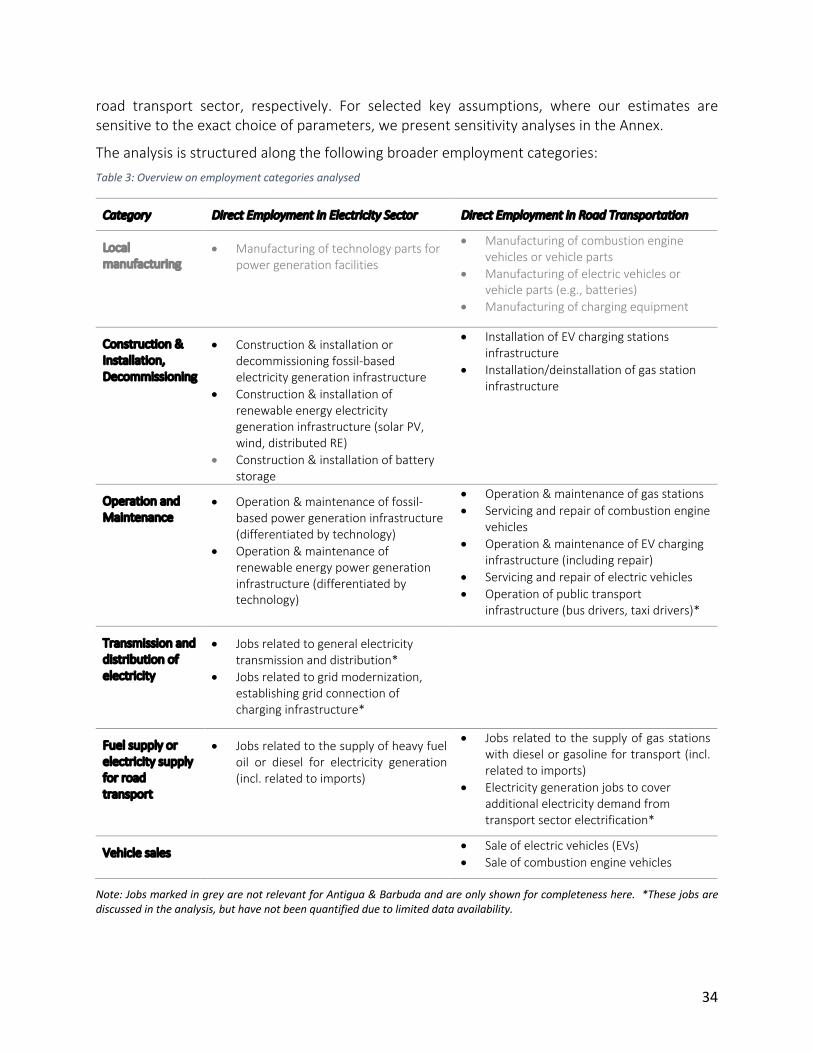
34
road transport sector, respectively. For selected key assumptions, where our estimates are sensitive to the exact choice of parameters, we present sensitivity analyses in the Annex.
The analysis is structured along the following broader employment categories: Table 3: Overview on employment categories analysed
Category Direct Employment in Electricity Sector Direct Employment in Road Transportation
Local manufacturing
• Manufacturing of technology parts for power generation facilities
• Manufacturing of combustion engine vehicles or vehicle parts
• Manufacturing of electric vehicles or vehicle parts (e.g., batteries)
• Manufacturing of charging equipment
Construction & Installation, Decommissioning
• Construction & installation or decommissioning fossil-based electricity generation infrastructure
• Construction & installation of renewable energy electricity generation infrastructure (solar PV, wind, distributed RE)
• Construction & installation of battery storage
• Installation of EV charging stations infrastructure
• Installation/deinstallation of gas station infrastructure
Operation and Maintenance
• Operation & maintenance of fossil-based power generation infrastructure (differentiated by technology)
• Operation & maintenance of renewable energy power generation infrastructure (differentiated by technology)
• Operation & maintenance of gas stations • Servicing and repair of combustion engine
vehicles • Operation & maintenance of EV charging
infrastructure (including repair) • Servicing and repair of electric vehicles • Operation of public transport
infrastructure (bus drivers, taxi drivers)*
Transmission and distribution of electricity
• Jobs related to general electricity transmission and distribution*
• Jobs related to grid modernization, establishing grid connection of charging infrastructure*
Fuel supply or electricity supply for road transport
• Jobs related to the supply of heavy fuel oil or diesel for electricity generation (incl. related to imports)
• Jobs related to the supply of gas stations with diesel or gasoline for transport (incl. related to imports)
• Electricity generation jobs to cover additional electricity demand from transport sector electrification*
Vehicle sales • Sale of electric vehicles (EVs) • Sale of combustion engine vehicles
Note: Jobs marked in grey are not relevant for Antigua & Barbuda and are only shown for completeness here. *These jobs are discussed in the analysis, but have not been quantified due to limited data availability.
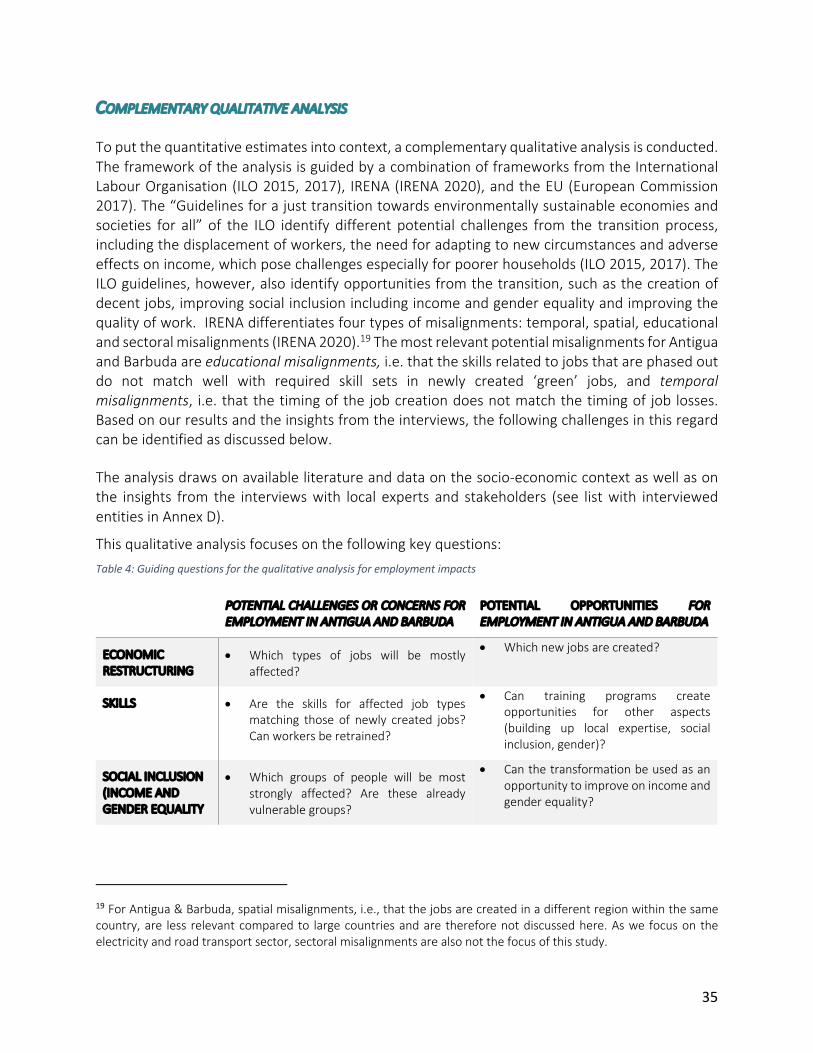
35
COMPLEMENTARY QUALITATIVE ANALYSIS
To put the quantitative estimates into context, a complementary qualitative analysis is conducted. The framework of the analysis is guided by a combination of frameworks from the International Labour Organisation (ILO 2015, 2017), IRENA (IRENA 2020), and the EU (European Commission 2017). The “Guidelines for a just transition towards environmentally sustainable economies and societies for all” of the ILO identify different potential challenges from the transition process, including the displacement of workers, the need for adapting to new circumstances and adverse effects on income, which pose challenges especially for poorer households (ILO 2015, 2017). The ILO guidelines, however, also identify opportunities from the transition, such as the creation of decent jobs, improving social inclusion including income and gender equality and improving the quality of work. IRENA differentiates four types of misalignments: temporal, spatial, educational and sectoral misalignments (IRENA 2020).19 The most relevant potential misalignments for Antigua and Barbuda are educational misalignments, i.e. that the skills related to jobs that are phased out do not match well with required skill sets in newly created ‘green’ jobs, and temporal misalignments, i.e. that the timing of the job creation does not match the timing of job losses. Based on our results and the insights from the interviews, the following challenges in this regard can be identified as discussed below.
The analysis draws on available literature and data on the socio-economic context as well as on the insights from the interviews with local experts and stakeholders (see list with interviewed entities in Annex D).
This qualitative analysis focuses on the following key questions: Table 4: Guiding questions for the qualitative analysis for employment impacts
POTENTIAL CHALLENGES OR CONCERNS FOR EMPLOYMENT IN ANTIGUA AND BARBUDA
POTENTIAL OPPORTUNITIES FOR EMPLOYMENT IN ANTIGUA AND BARBUDA
ECONOMIC RESTRUCTURING
• Which types of jobs will be mostly affected?
• Which new jobs are created?
SKILLS • Are the skills for affected job types matching those of newly created jobs? Can workers be retrained?
• Can training programs create opportunities for other aspects (building up local expertise, social inclusion, gender)?
SOCIAL INCLUSION (INCOME AND GENDER EQUALITY
• Which groups of people will be most strongly affected? Are these already vulnerable groups?
• Can the transformation be used as an opportunity to improve on income and gender equality?
19 For Antigua & Barbuda, spatial misalignments, i.e., that the jobs are created in a different region within the same country, are less relevant compared to large countries and are therefore not discussed here. As we focus on the electricity and road transport sector, sectoral misalignments are also not the focus of this study.

36
QUALITY OF WORK • Which challenges with regard to salary levels or job-related risks emerge for newly created jobs?
• Can the work conditions be improved for newly created jobs?
Impacts on direct employment by sector and job category
This section is presenting results of the estimated impacts on direct employment for electricity generation and road transport complemented with a qualitative discussion of the implications and challenges and opportunities resulting from the transition of the workforce which are relevant to consider when designing a ‘Just Transition’.
Results are shown and discussed by sector and job category and in the end as total direct employment impacts bringing electricity generation and road transportation jobs together.
ELECTRICITY SECTOR EMPLOYMENT IMPACTS BY JOB CATEGORY AND TECHNOLOGY
The analysed impacts on direct employment in the electricity sector focus on: (i) jobs in construction and installation (C&I) of new and dismantling of retired power generation infrastructure, (ii) jobs in operation and maintenance (O&M) of power generation infrastructure, (iii) jobs related to fuel supply for power generation, and (iv) jobs in electricity transmission and distribution. Employment in local manufacturing of technology parts for electricity generation does not play a role for Antigua and Barbuda. The employment estimates by job category are discussed in detail below.
Construction and Installation of new & dismantling of old power generation infrastructure
Adding new power generation as well as battery storage capacities involves jobs in construction and installation of these new capacities over the duration of the technology-specific construction period. For power generation capacities that are phased out, this typically also involves jobs in decommissioning of retired capacities.
According to data collected by the DoE for this study, there are currently at least nine solar companies in Antigua and Barbuda engaging in residential and/or commercial PV installations, with between one and four installers working for each of the four solar companies that provided information. Given these data limitations, we estimated jobs in solar PV construction and installation based on local employment factors which we derived based on information based on consultations with local experts on their experience of how many employees and how much time they need to install solar facilities for different sizes. This is described in more detail below as well as in the Technical Annex. Given the limited existing experience with building up onshore wind in Antigua and Barbuda, jobs related to construction and installation of onshore wind have been estimated based on (regionally adjusted) employment factors from the literature. To our knowledge, there is very limited existing local experience regarding employment related to
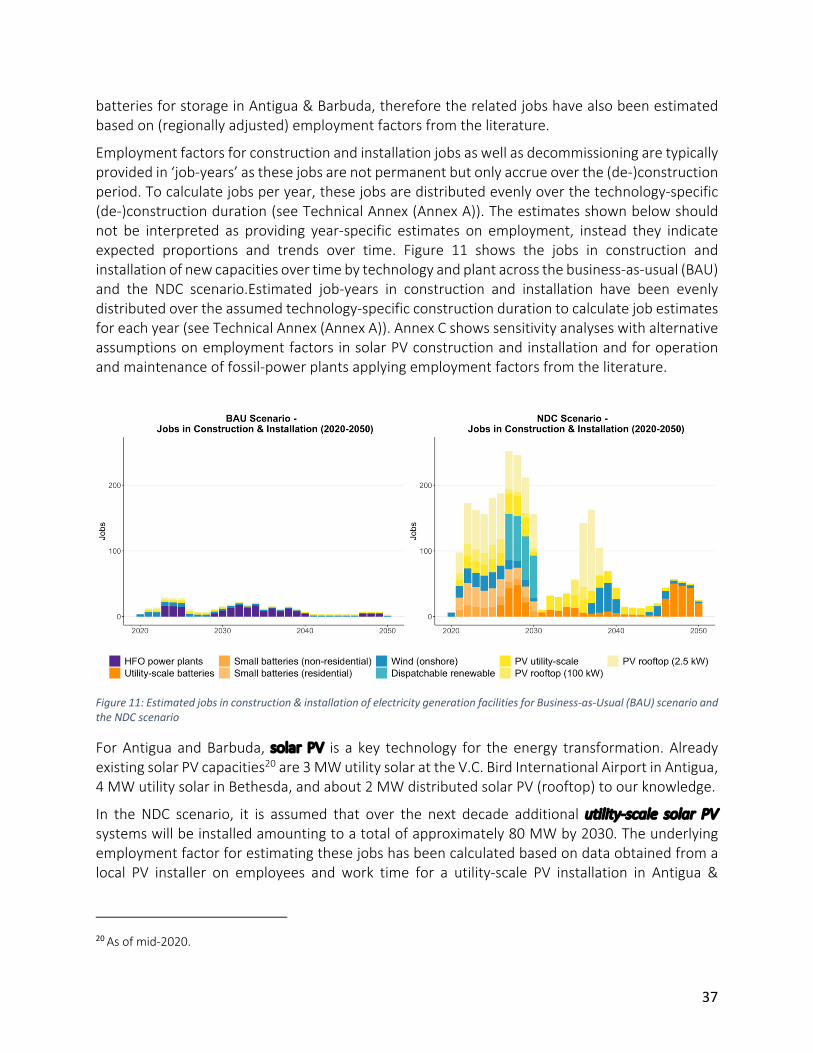
37
batteries for storage in Antigua & Barbuda, therefore the related jobs have also been estimated based on (regionally adjusted) employment factors from the literature.
Employment factors for construction and installation jobs as well as decommissioning are typically provided in ‘job-years’ as these jobs are not permanent but only accrue over the (de-)construction period. To calculate jobs per year, these jobs are distributed evenly over the technology-specific (de-)construction duration (see Technical Annex (Annex A)). The estimates shown below should not be interpreted as providing year-specific estimates on employment, instead they indicate expected proportions and trends over time. Figure 11 shows the jobs in construction and installation of new capacities over time by technology and plant across the business-as-usual (BAU) and the NDC scenario.Estimated job-years in construction and installation have been evenly distributed over the assumed technology-specific construction duration to calculate job estimates for each year (see Technical Annex (Annex A)). Annex C shows sensitivity analyses with alternative assumptions on employment factors in solar PV construction and installation and for operation and maintenance of fossil-power plants applying employment factors from the literature.
Figure 11: Estimated jobs in construction & installation of electricity generation facilities for Business-as-Usual (BAU) scenario and the NDC scenario
For Antigua and Barbuda, solar PV is a key technology for the energy transformation. Already existing solar PV capacities20 are 3 MW utility solar at the V.C. Bird International Airport in Antigua, 4 MW utility solar in Bethesda, and about 2 MW distributed solar PV (rooftop) to our knowledge.
In the NDC scenario, it is assumed that over the next decade additional utility-scale solar PV systems will be installed amounting to a total of approximately 80 MW by 2030. The underlying employment factor for estimating these jobs has been calculated based on data obtained from a local PV installer on employees and work time for a utility-scale PV installation in Antigua &
20 As of mid-2020.
38
Barbuda that has already been carried out. Using this relatively conservative21 employment factor, jobs are estimated in construction and installation of utility-scale PV to be about 3.422 job-years per MW added capacity (in 2020) adding up to approximately 440 job-years until 2050.23 Complementary to utility-scale PV installations, it is assumed that utility-scale battery storage will be installed, which additionally creates approximately 410 job-years in construction and installation over the time horizon until 2050.
Additional to building up capacities in utility-scale solar PV, rooftop solar PV is playing a key role in the NDC scenario, with total installed capacities already increasing from about 2 MW in 2020 to more than 62 MW in 2030. Antigua and Barbuda has defined a target on residential houses being equipped with solar PV in the submitted updated NDC draft and is also planning to make progress with installing PV roof installations on government buildings and tourist resorts. To reflect these, the analysis differentiates between PV rooftop installations of two sizes (2.5kW and 100kW) with different employment intensity. In the modelling, for residential rooftop PV systems, it was assumed that 20,000 houses will be equipped with solar rooftop installations of 2.5kW each by 2030 (see Section on ‘Scenario Description and Stages’).24 For non-residential buildings, including government buildings and tourist resorts, it is assumed that 100kW installations are installed adding up to approximately 18MW in total by 2030. Given that small installations are relatively more work intensive, it is assumed that, currently, for each 2.5 kW installation, structural work requires two technicians for one day and electrical work requires one electrician for up to 5 days. For 100kW installations, the analysis assumes that currently 12 workers for up to 14 days are needed. This information has been provided by a local PV installer. As for other renewable energy employment factors, it is assumed that there will be a learning effect increasing productivity over time over the next decade. Based on this, it is estimated more than 830 job-years are created in construction and installations of residential rooftop solar PV in the NDC scenario until 2050 as opposed to approximately 30 job-years in the BAU scenario.25 It is estimated that PV installations on roofs of government buildings and resorts will generate almost 180 job-years in construction and installation in the NDC scenario until 2050 compared to almost 20 in the BAU scenario. In the decade after 2030, additional 8MW of non-residential rooftop is installed, as well as additional 25MW of 2.5kW systems on residential houses. As for the purposes of the analysis, it is assumed
21 The resulting jobs factor is relatively conservative (i.e. less jobs/MW) compared to applying an employment factor for 2020 from Ram et al (2020) locally adjusted to South America. For a sensitivity analysis how our employment estimates compare using the higher employment factor, see Annex C ‘Sensitivity analyses’. For more details on the underlying assumptions see the Technical Annex). 22 Assuming that there will be learning effects over time, we apply an employment factor derived based on data from the interviews of 3.43 jobs years/MW added capacity in 2020, declining to 1.46 in 2050. 23 See Annex C for a sensitivity analysis applying employment factors from the literature for solar PV construction and installation which are higher than the factors derived based on interviews with local experts. 24 The text of the NDC draft as of late March 2021 defined that “30,000 homes or 50% of pre-2020 homes to have back-up renewable energy systems for at least 4–6 hours of energy“. To be on the conservative side, we assume 20,000 homes (roughly resulting from the ‘50% of pre-2020 homes’ target) for our scenario implementation. 25 See Annex C for a sensitivity analysis applying employment factors from the literature for solar PV construction and installation which are higher than the factors derived based on interviews with local experts.
39
that from 2040 onwards suitable roofs are already equipped with PV installations in the NDC scenario such that no additional jobs are created in construction and installation of non-residential solar PV systems.
Both residential rooftop solar PV and solar PV in commercial or government buildings would ideally be complemented by installation of battery storage capacity, which again contributes to job creation given that local workers will be trained on installing these. Currently, based on the data collected for this analysis, there are no notable capacities in battery storage related to rooftop solar PV already installed in Antigua and Barbuda. Until 2050, prosumer battery storage installation in both residential and non-residential buildings are estimated to account for an additional job-creation of approximately 350 job-years in the NDC scenario based on empirical employment factors from the literature. For the BAU scenario with comparably low shares of renewable generation capacities, it is assumed that battery storage will not play a role and thus not create jobs.
In addition to the RE jobs in solar PV, it is estimated that about 340 job-years in construction and installation of new onshore wind capacities and about 270 job-years in dispatchable renewables are created in the NDC until 2050. For dispatchable renewables, the specific technology to be used is uncertain and therefore, the related employment impacts would differ from the calculation within this analysis. For this scenario analysis, employment factors for ‘waste-to-energy’ have been applied as one potential technology that could represent the jobs for a to-be-defined dispatchable low-emissions technology since this was explicitly mentioned in Antigua and Barbuda’s first NDC as an option. Alternative dispatchable RE technologies in Antigua and Barbuda are limited, with no hydropower or geothermal resources available. Other potential options include wave energy or perhaps parabolic trough concentrating solar power with molten salt storage, although these are as yet unexplored. As another option to provide flexibility, IRENA explored the use of renewable energy to produce hydrogen in Antigua, to be then used in fuel cells for generating electricity (IRENA 2021).
One main insight from our scenario analysis on employment in Construction and Installation is that the ambitious scaling up of solar PV capacities within one decade may lead to the challenge of a large demand in skilled workforce in construction and installation of solar PV and related battery storage in the very short term,26 while after 2030 the demand for these workers would decrease substantially. To ensure that the envisaged installations of solar PV and related battery storage can be achieved in the short term, a sufficient number of local workers would need to be trained adequately to be able to conduct these installations. Alternatively, support from trained workers from abroad would be needed, which would however not contribute to the creation of local jobs. In the medium term, when the number of newly installed PV installations decreases, new employment prospects will need to be created for workers specialized in the installation of solar PV systems to provide them with a long-term perspective. Likewise, for jobs specialized in wind energy, it would be beneficial to plan new installations of wind farms in a way that more evenly distributes the workload for local workers.
26 Note that this is being taken into consideration in Component 2 of the GCF Build Project.
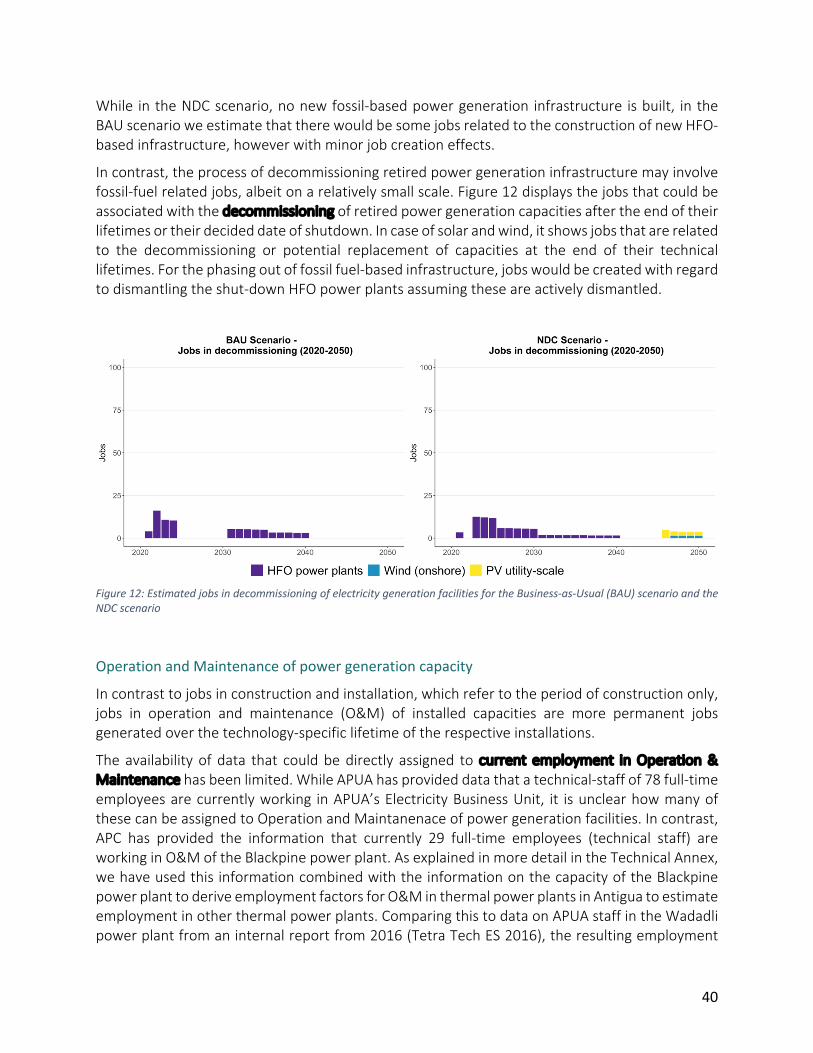
40
While in the NDC scenario, no new fossil-based power generation infrastructure is built, in the BAU scenario we estimate that there would be some jobs related to the construction of new HFO-based infrastructure, however with minor job creation effects.
In contrast, the process of decommissioning retired power generation infrastructure may involve fossil-fuel related jobs, albeit on a relatively small scale. Figure 12 displays the jobs that could be associated with the decommissioning of retired power generation capacities after the end of their lifetimes or their decided date of shutdown. In case of solar and wind, it shows jobs that are related to the decommissioning or potential replacement of capacities at the end of their technical lifetimes. For the phasing out of fossil fuel-based infrastructure, jobs would be created with regard to dismantling the shut-down HFO power plants assuming these are actively dismantled.
Figure 12: Estimated jobs in decommissioning of electricity generation facilities for the Business-as-Usual (BAU) scenario and the NDC scenario
Operation and Maintenance of power generation capacity
In contrast to jobs in construction and installation, which refer to the period of construction only, jobs in operation and maintenance (O&M) of installed capacities are more permanent jobs generated over the technology-specific lifetime of the respective installations.
The availability of data that could be directly assigned to current employment in Operation & Maintenance has been limited. While APUA has provided data that a technical-staff of 78 full-time employees are currently working in APUA’s Electricity Business Unit, it is unclear how many of these can be assigned to Operation and Maintanenace of power generation facilities. In contrast, APC has provided the information that currently 29 full-time employees (technical staff) are working in O&M of the Blackpine power plant. As explained in more detail in the Technical Annex, we have used this information combined with the information on the capacity of the Blackpine power plant to derive employment factors for O&M in thermal power plants in Antigua to estimate employment in other thermal power plants. Comparing this to data on APUA staff in the Wadadli power plant from an internal report from 2016 (Tetra Tech ES 2016), the resulting employment
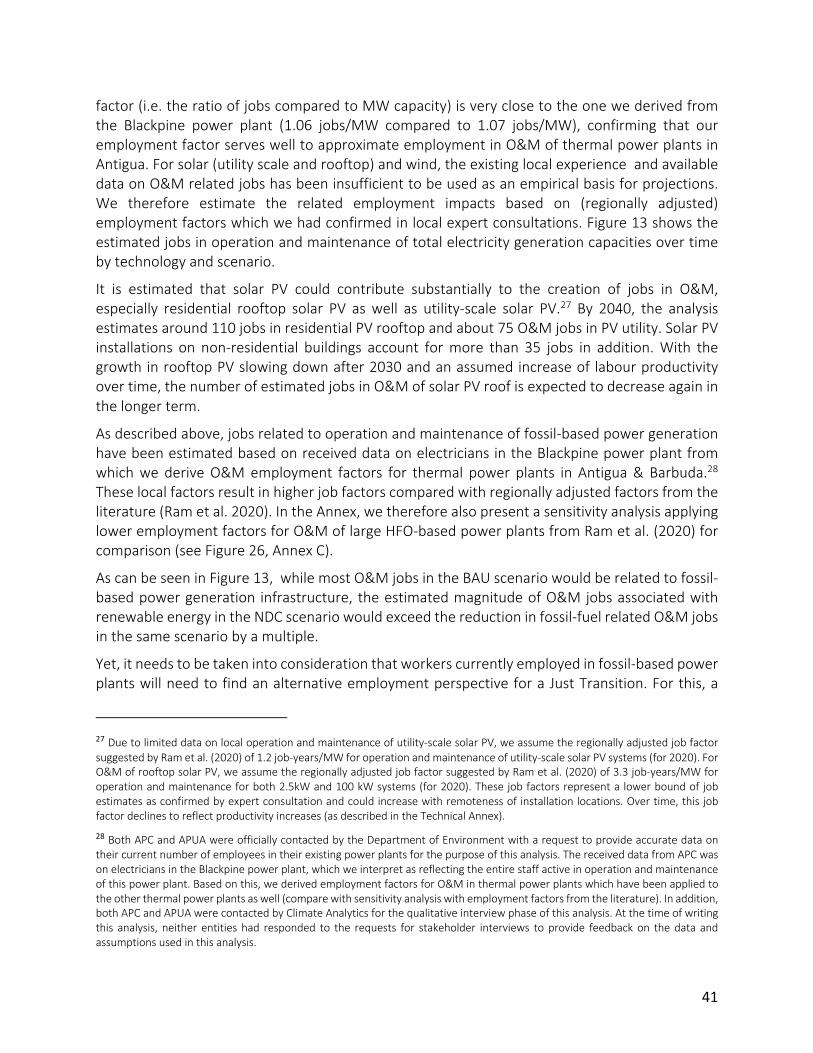
41
factor (i.e. the ratio of jobs compared to MW capacity) is very close to the one we derived from the Blackpine power plant (1.06 jobs/MW compared to 1.07 jobs/MW), confirming that our employment factor serves well to approximate employment in O&M of thermal power plants in Antigua. For solar (utility scale and rooftop) and wind, the existing local experience and available data on O&M related jobs has been insufficient to be used as an empirical basis for projections. We therefore estimate the related employment impacts based on (regionally adjusted) employment factors which we had confirmed in local expert consultations. Figure 13 shows the estimated jobs in operation and maintenance of total electricity generation capacities over time by technology and scenario.
It is estimated that solar PV could contribute substantially to the creation of jobs in O&M, especially residential rooftop solar PV as well as utility-scale solar PV.27 By 2040, the analysis estimates around 110 jobs in residential PV rooftop and about 75 O&M jobs in PV utility. Solar PV installations on non-residential buildings account for more than 35 jobs in addition. With the growth in rooftop PV slowing down after 2030 and an assumed increase of labour productivity over time, the number of estimated jobs in O&M of solar PV roof is expected to decrease again in the longer term.
As described above, jobs related to operation and maintenance of fossil-based power generation have been estimated based on received data on electricians in the Blackpine power plant from which we derive O&M employment factors for thermal power plants in Antigua & Barbuda.28 These local factors result in higher job factors compared with regionally adjusted factors from the literature (Ram et al. 2020). In the Annex, we therefore also present a sensitivity analysis applying lower employment factors for O&M of large HFO-based power plants from Ram et al. (2020) for comparison (see Figure 26, Annex C).
As can be seen in Figure 13, while most O&M jobs in the BAU scenario would be related to fossil-based power generation infrastructure, the estimated magnitude of O&M jobs associated with renewable energy in the NDC scenario would exceed the reduction in fossil-fuel related O&M jobs in the same scenario by a multiple.
Yet, it needs to be taken into consideration that workers currently employed in fossil-based power plants will need to find an alternative employment perspective for a Just Transition. For this, a
27 Due to limited data on local operation and maintenance of utility-scale solar PV, we assume the regionally adjusted job factor suggested by Ram et al. (2020) of 1.2 job-years/MW for operation and maintenance of utility-scale solar PV systems (for 2020). For O&M of rooftop solar PV, we assume the regionally adjusted job factor suggested by Ram et al. (2020) of 3.3 job-years/MW for operation and maintenance for both 2.5kW and 100 kW systems (for 2020). These job factors represent a lower bound of job estimates as confirmed by expert consultation and could increase with remoteness of installation locations. Over time, this job factor declines to reflect productivity increases (as described in the Technical Annex).
28 Both APC and APUA were officially contacted by the Department of Environment with a request to provide accurate data on their current number of employees in their existing power plants for the purpose of this analysis. The received data from APC was on electricians in the Blackpine power plant, which we interpret as reflecting the entire staff active in operation and maintenance of this power plant. Based on this, we derived employment factors for O&M in thermal power plants which have been applied to the other thermal power plants as well (compare with sensitivity analysis with employment factors from the literature). In addition, both APC and APUA were contacted by Climate Analytics for the qualitative interview phase of this analysis. At the time of writing this analysis, neither entities had responded to the requests for stakeholder interviews to provide feedback on the data and assumptions used in this analysis.
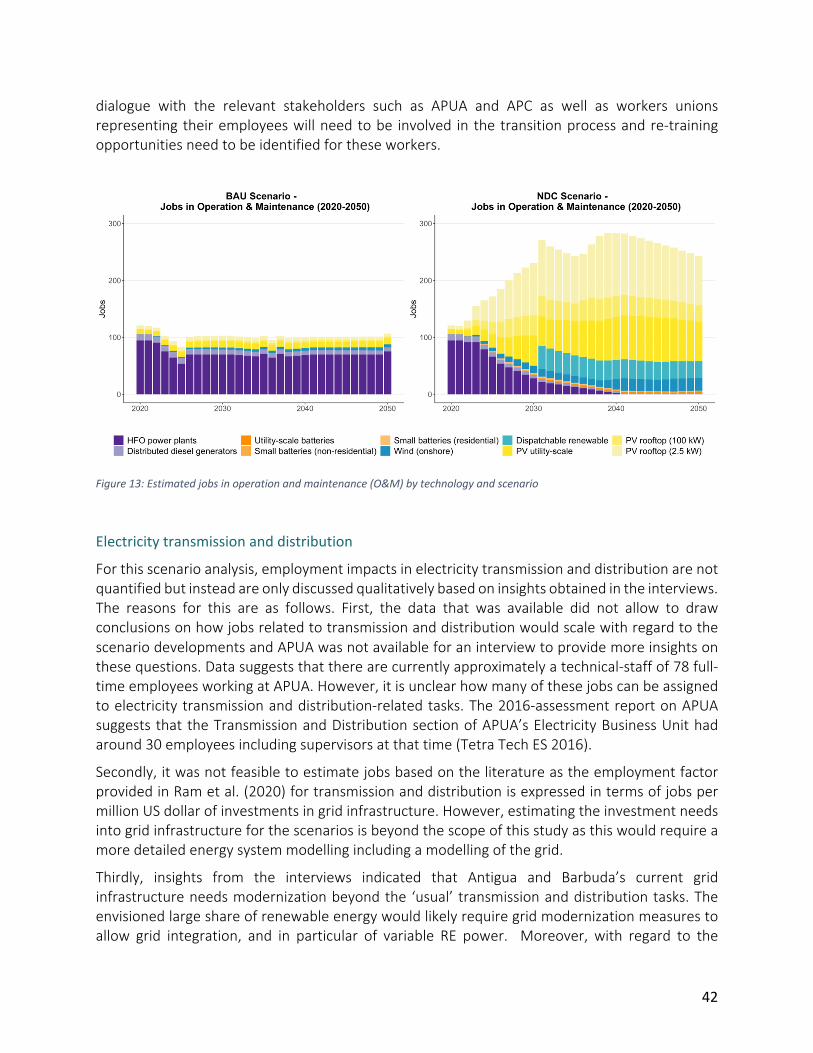
42
dialogue with the relevant stakeholders such as APUA and APC as well as workers unions representing their employees will need to be involved in the transition process and re-training opportunities need to be identified for these workers.
Figure 13: Estimated jobs in operation and maintenance (O&M) by technology and scenario
Electricity transmission and distribution
For this scenario analysis, employment impacts in electricity transmission and distribution are not quantified but instead are only discussed qualitatively based on insights obtained in the interviews. The reasons for this are as follows. First, the data that was available did not allow to draw conclusions on how jobs related to transmission and distribution would scale with regard to the scenario developments and APUA was not available for an interview to provide more insights on these questions. Data suggests that there are currently approximately a technical-staff of 78 full-time employees working at APUA. However, it is unclear how many of these jobs can be assigned to electricity transmission and distribution-related tasks. The 2016-assessment report on APUA suggests that the Transmission and Distribution section of APUA’s Electricity Business Unit had around 30 employees including supervisors at that time (Tetra Tech ES 2016).
Secondly, it was not feasible to estimate jobs based on the literature as the employment factor provided in Ram et al. (2020) for transmission and distribution is expressed in terms of jobs per million US dollar of investments in grid infrastructure. However, estimating the investment needs into grid infrastructure for the scenarios is beyond the scope of this study as this would require a more detailed energy system modelling including a modelling of the grid.
Thirdly, insights from the interviews indicated that Antigua and Barbuda’s current grid infrastructure needs modernization beyond the ‘usual’ transmission and distribution tasks. The envisioned large share of renewable energy would likely require grid modernization measures to allow grid integration, and in particular of variable RE power. Moreover, with regard to the
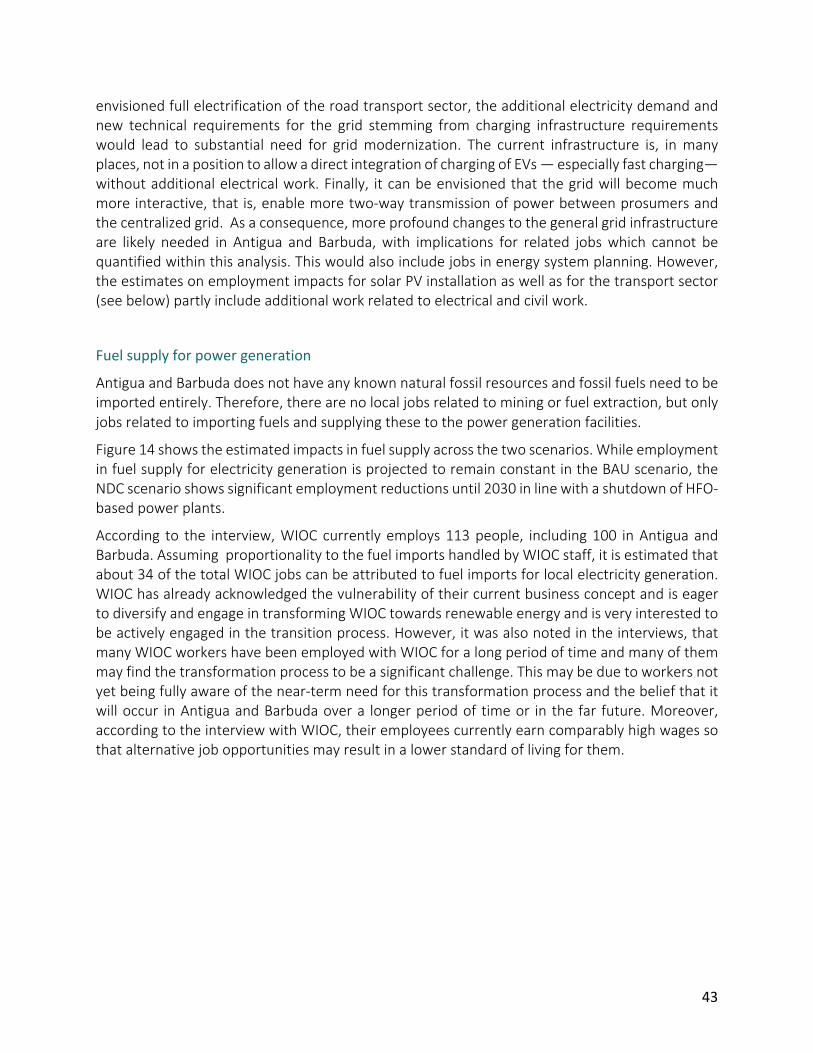
43
envisioned full electrification of the road transport sector, the additional electricity demand and new technical requirements for the grid stemming from charging infrastructure requirements would lead to substantial need for grid modernization. The current infrastructure is, in many places, not in a position to allow a direct integration of charging of EVs — especially fast charging— without additional electrical work. Finally, it can be envisioned that the grid will become much more interactive, that is, enable more two-way transmission of power between prosumers and the centralized grid. As a consequence, more profound changes to the general grid infrastructure are likely needed in Antigua and Barbuda, with implications for related jobs which cannot be quantified within this analysis. This would also include jobs in energy system planning. However, the estimates on employment impacts for solar PV installation as well as for the transport sector (see below) partly include additional work related to electrical and civil work.
Fuel supply for power generation
Antigua and Barbuda does not have any known natural fossil resources and fossil fuels need to be imported entirely. Therefore, there are no local jobs related to mining or fuel extraction, but only jobs related to importing fuels and supplying these to the power generation facilities.
Figure 14 shows the estimated impacts in fuel supply across the two scenarios. While employment in fuel supply for electricity generation is projected to remain constant in the BAU scenario, the NDC scenario shows significant employment reductions until 2030 in line with a shutdown of HFO-based power plants.
According to the interview, WIOC currently employs 113 people, including 100 in Antigua and Barbuda. Assuming proportionality to the fuel imports handled by WIOC staff, it is estimated that about 34 of the total WIOC jobs can be attributed to fuel imports for local electricity generation. WIOC has already acknowledged the vulnerability of their current business concept and is eager to diversify and engage in transforming WIOC towards renewable energy and is very interested to be actively engaged in the transition process. However, it was also noted in the interviews, that many WIOC workers have been employed with WIOC for a long period of time and many of them may find the transformation process to be a significant challenge. This may be due to workers not yet being fully aware of the near-term need for this transformation process and the belief that it will occur in Antigua and Barbuda over a longer period of time or in the far future. Moreover, according to the interview with WIOC, their employees currently earn comparably high wages so that alternative job opportunities may result in a lower standard of living for them.

44
Figure 14: Estimated jobs in fuel supply for electricity generation by technology and scenario
OVERVIEW ON EMPLOYMENT IMPACTS IN THE ELECTRICITY SECTOR
Figure 15 shows the total employment estimates with a focus on the electricity sector differentiated by technology (summing up across job types related to the respective technology). Figure 16 also shows total employment estimates but broken down by the type of job (construction & installation, decommissioning, operation & maintenance and fuel supply) independent of the underlying technology. These estimates on total jobs in electricity generation result from aggregating the detailed estimates provided in the previous sections (Figure 11 to Figure 14).
In Figure 15 it can be seen that jobs in solar PV play a key role in job creation in the NDC scenario. The estimate suggests that ramping up both utility scale and rooftop PV could create substantial employment potential, with jobs in Construction and Installation playing a larger role in the shorter term, while jobs in Operation and Maintenance being expected to dominate in the longer term when the build-up of new solar capacities slows down (Figure 11 and Figure 13). The general trend of jobs in Construction and Installation providing substiantial employment potential mainly in the shorter term in the NDC scenario, while employment in Operation and Maintenance dominates for the longer term also hold more generally as can be see in Figure 16 aggregating job type-estimates across technologies.
Overall, calculated results suggest that the estimated total employment potential is notably higher in the NDC scenario compared to the Business-as-Usual Scenario which is mainly dominated by employment in Operation & Maintenance of fossil-fuel power plants.
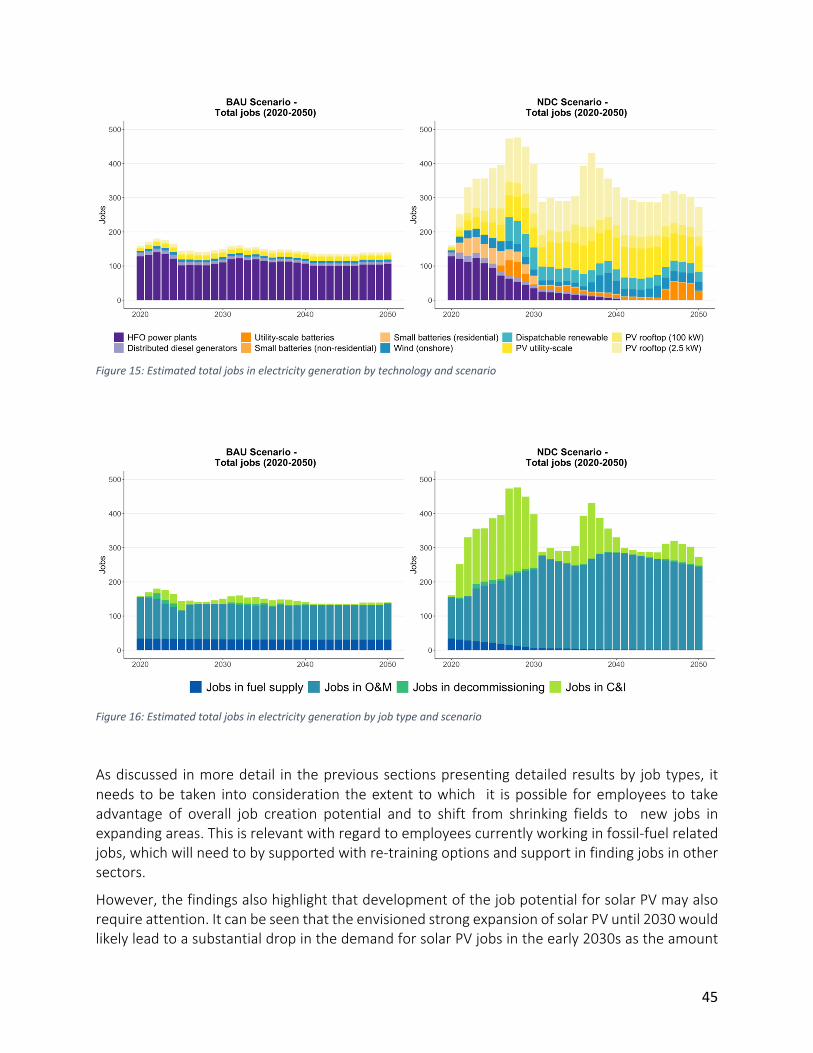
45
Figure 15: Estimated total jobs in electricity generation by technology and scenario
Figure 16: Estimated total jobs in electricity generation by job type and scenario
As discussed in more detail in the previous sections presenting detailed results by job types, it needs to be taken into consideration the extent to which it is possible for employees to take advantage of overall job creation potential and to shift from shrinking fields to new jobs in expanding areas. This is relevant with regard to employees currently working in fossil-fuel related jobs, which will need to by supported with re-training options and support in finding jobs in other sectors.
However, the findings also highlight that development of the job potential for solar PV may also require attention. It can be seen that the envisioned strong expansion of solar PV until 2030 would likely lead to a substantial drop in the demand for solar PV jobs in the early 2030s as the amount
46
of added capacities being installed slows down considerably. While some workers coming from solar PV installations may be able to transition to working on the maintenance of solar PV installations as similar skills are required for many tasks, the total number of PV related jobs (both O&M and C&I) would still be lower than in the next decade. A more evenly distributed build-up of solar PV capacities could support providing a longer-term stable employment opportunity to local solar workers, even if the number initially would be smaller.
It should also be noted that part of the buildout of new RE capacities stem from an increased demand for electricity from the transport sector electrification coupled with the envisioned target to use 100% renewables also for the transport sector in the long term.
The job impacts that are directly related to the transport sector are discussed in the following section.
ROAD TRANSPORT IMPACTS BY JOB CATEGORY
The analysed impacts on direct employment in the road transport sector focus on: (i) jobs in construction and installation of charging infrastructure for electric vehicles (EVs) and gas stations for internal combustion engine vehicles (ICEVs), (ii) jobs in operation and maintenance (O&M) of EV charging infrastructure and gas stations as well as vehicle repair (EVs and ICEVs) and operation of public transport, (iii) jobs related to fuel supply for transport fuels, and (iv) vehicle sales (EVs and ICEVs). Employment in local manufacturing of technology parts for road transport does not play a role for Antigua and Barbuda. The employment estimates by job category are discussed in detail below.
Construction and installation of transport infrastructure
In this job category, we group jobs related to the installation of EV charging stations and related grid infrastructure as well as the installation or deinstallation of gas station infrastructure. For the new installation of gas stations, we assume based on our interviews that the current infrastructure of gas stations would not be extended further – in both the BAU and NDC scenarios, therefore we do not estimate any new jobs related to this. With a transition towards electric vehicles and thus a decreasing share of internal combustion engine vehicles (ICEVs) in the NDC scenario, the demand for gas stations may decrease proportionately, leading to a potential deinstallation of gas stations over time. Due to lack of reliable data, we however do not quantify the jobs that would likely be related to deinstallations of existing gas stations.
To estimate jobs with regard to the installation of EV charging infrastructure in our NDC scenario, we differentiate between three different types of chargers for EVs (see Technical Annex for details on assumptions). Home chargers, workplace chargers (short ‘work chargers’) and public parking charging stations. For the NDC scenario, we assume that in the beginning, all purchasers of an EV will also install a home charger. In parallel, we assume that the infrastructure of workplace charging stations and public parking charging stations will be built in proportion to the development of the stock of electric vehicles (see Annex A for details (Technical Annex)). With more non-homeowners purchasing EVs and also more public and work charging infrastructure
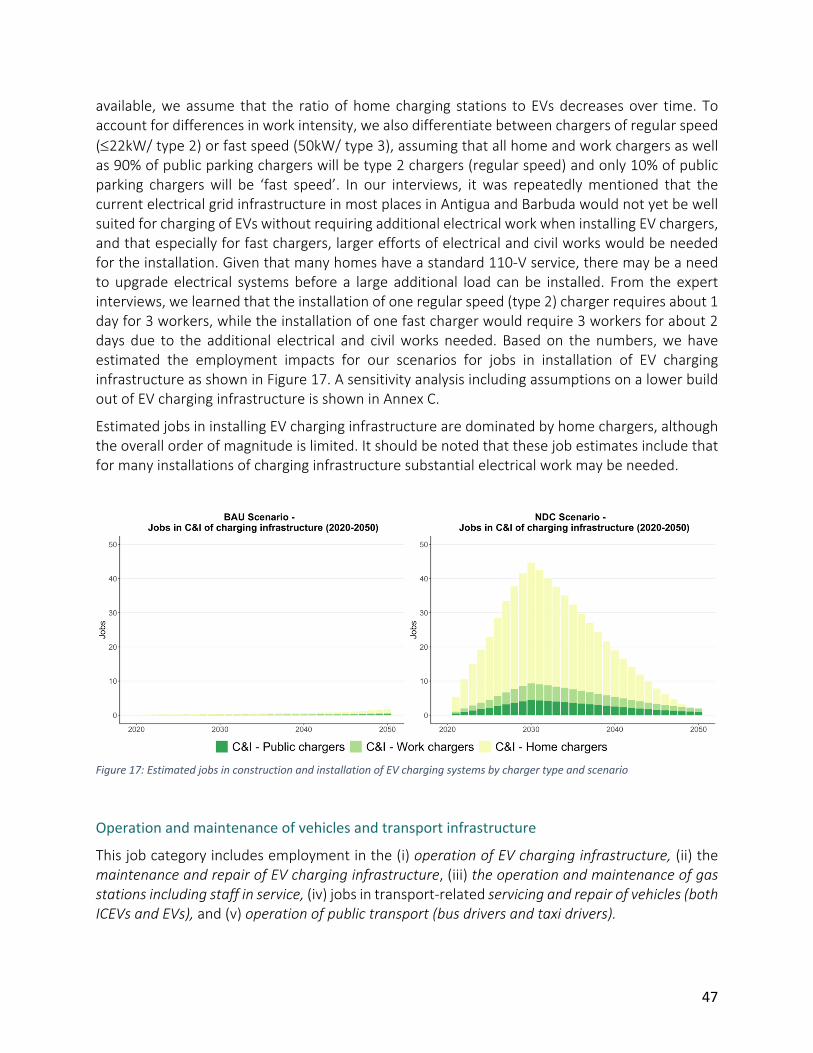
47
available, we assume that the ratio of home charging stations to EVs decreases over time. To account for differences in work intensity, we also differentiate between chargers of regular speed (£22kW/ type 2) or fast speed (50kW/ type 3), assuming that all home and work chargers as well as 90% of public parking chargers will be type 2 chargers (regular speed) and only 10% of public parking chargers will be ‘fast speed’. In our interviews, it was repeatedly mentioned that the current electrical grid infrastructure in most places in Antigua and Barbuda would not yet be well suited for charging of EVs without requiring additional electrical work when installing EV chargers, and that especially for fast chargers, larger efforts of electrical and civil works would be needed for the installation. Given that many homes have a standard 110-V service, there may be a need to upgrade electrical systems before a large additional load can be installed. From the expert interviews, we learned that the installation of one regular speed (type 2) charger requires about 1 day for 3 workers, while the installation of one fast charger would require 3 workers for about 2 days due to the additional electrical and civil works needed. Based on the numbers, we have estimated the employment impacts for our scenarios for jobs in installation of EV charging infrastructure as shown in Figure 17. A sensitivity analysis including assumptions on a lower build out of EV charging infrastructure is shown in Annex C.
Estimated jobs in installing EV charging infrastructure are dominated by home chargers, although the overall order of magnitude is limited. It should be noted that these job estimates include that for many installations of charging infrastructure substantial electrical work may be needed.
Figure 17: Estimated jobs in construction and installation of EV charging systems by charger type and scenario
Operation and maintenance of vehicles and transport infrastructure
This job category includes employment in the (i) operation of EV charging infrastructure, (ii) the maintenance and repair of EV charging infrastructure, (iii) the operation and maintenance of gas stations including staff in service, (iv) jobs in transport-related servicing and repair of vehicles (both ICEVs and EVs), and (v) operation of public transport (bus drivers and taxi drivers).
48
According to the interviews conducted, the operation of EV charging infrastructure needs to be differentiated from the maintenance jobs. The operation of the charging infrastructure is not very work intensive and requires only about 1 worker per over 226 charging stations, as this is mainly done from the back office. For the maintenance and repair of EV charging infrastructure, more travelling to the different sites would be required so that about one worker for every 50 chargers would be needed to take care of the existing charging infrastructure. Given our assumptions on the development of the stock of chargers installed over time, we estimate about 250 jobs related to the operation and maintenance of charging infrastructure in 2050 (see Figure 18). In case down-times of chargers want to be kept very minimal or charging infrastructure would be subject to vandalism, more workers would be needed for the same stock of charging infrastructure.
The operation of gas stations in Antigua and Barbuda does not only include jobs at the cashier and in administration but also a substantial number of jobs that have the task to support with the service of fuelling the car for the customer. Data suggests that about 190 people currently work in gas stations in Antigua and Barbuda.29 According to our interviews, these jobs are often occupied by female household heads, including single mothers. With an envisaged phase out of ICEVs in the NDC scenario, we expect the demand for this kind of job to go down proportionately to the decrease in the ICEV stock. For these service jobs, there is no direct equivalent which would require comparable skills with regard to charging of EVs. This group of employees would therefore likely be strongly affected by a transition to EVs away from ICEVs and need to be targeted with adequate policy measures to support them in finding new employment opportunities which are suitable for their skill sets and respective family circumstances.
Another important job category are jobs in transport-related servicing and repair of vehicles, which includes the servicing (e.g. regular check-ups, change of tires) and repair of EVs as well as combustion engine vehicles (ICEVs). The literature suggests that Battery Electric Vehicles30 are less repair-intensive as they have fewer moving parts and do not need to change oil or filters and thus require less maintenance compared to ICEVs (FTI Intelligence 2018; Hagman et al. 2016; Propfe et al. 2012). Expert interviews confirmed that in the long term, EVs are less repair intensive than ICEVs. However, current experience from the EV dealer Megapower for Antigua and Barbuda but also for Barbados suggests that – to ensure good servicing quality especially when EVs are still relatively new in the respective market – ideally there would be at least 1 mechanic that is trained on EVs for up to 100 EVs in the beginning, while over time this ratio is expected to decrease with a maturing market and learning (here assumed to be 1:300 in 2050, see Technical Annex (Annex A) for more details). In Barbados, 3 EV-mechanics at Megapower currently take care of a stock of about 720 EVs. A sensitivity analysis with a more conservative assumption on the ratio of
29 According to the data collected by the DoE for this report, there are currently about twenty gas stations. Based on the average number of employees reported by gas stations that provided data, we estimate that currently about 190 people are employed in these gas stations assuming that non-responding gas stations do not differ systematically. 30 Hybrid vehicles in contrast to full Battery EVs still have combustion engine components that need maintenance. Yet, Propfe and co-authors still conclude that also hybrid EVs would still benefit from lower repair and maintenance costs compared to ICEVs (Propfe et al. 2012).
49
mechanics to EVs is presented in the Annex B (see ‘Sensitivity Analyses’). Data31 suggests that currently there are about 90 employed mechanics in Antigua and Barbuda, with the large majority in ICEV repair and servicing as the current EV stock in Antigua and Barbuda is only about 20 EVs. However, according to our interviews, there is a substantial number of self-employed or informally employed mechanics for ICEVs which are likely not represented in the data available for this analysis. Based on an estimate from an interviewed expert, it is therefore estimated that the actual number of jobs related to ICEV repair including self-employed and informal mechanics is likely around 225 jobs. According to our interviews, it would be possible to retrain mechanics that are currently specialized in ICEVs to work on EVs, provided they have the general required technical understanding that most formally trained mechanics would typically have. Megapower has already conducted these kinds of re-trainings for EV repair. However, a higher share of electronic components as compared to mechanical components requires different and additional skills for EVs as compared to ICEVs, including training for proper and save handling of high voltage components (FTI Intelligence 2018). Interview partners highlighted that many of the self-employed or informally employed mechanics have often not undergone formal training for repairing cars and may find it challenging to access or afford successful formal retraining to acquire these skills and transition to EV repair. Moreover, with EVs typically being less repair intensive compared to ICEVs (FTI Intelligence 2018; Hagman et al. 2016; Propfe et al. 2012), the overall number of mechanics needed may decrease for the same total vehicle stock in the long term. The job group of (ICEV) mechanics – especially those that lack access to formal (re-)training – are likely a vulnerable group which requires attention for a Just Transition plan.
We do not quantify the impact on jobs in operation of public transport infrastructure, including bus drivers and taxi drivers, as both the NDC and the BAU scenario assume that there is no modal shift, so we assume that there are no relevant differences in public transport-related O&M jobs between the two scenarios. Assuming that bus drivers or taxi drivers operating a combustion engine-driven bus or taxi are also capable of driving an electric bus or taxi with minor or no re-training needed, this means that our NDC scenario would not have any direct impact on these jobs. However, there may be indirect effects which go beyond the scope of this study. The phase out of ICEVs as planned in the NDC scenario would require private bus companies and taxi owners to invest into purchasing a (new) Electric Vehicle which not all of them may be able to afford or
31 According to the data collected by the DoE for this report, there are currently about 33 companies related to vehicle repair and servicing which are employing mechanics. Additionally, many car dealerships also employ mechanics additional to the employees working in sales and in the administration. Based on the average number of mechanics reported by companies that provided data, we estimate that currently about 90 mechanics are employed in companies related to vehicle repair, servicing or sales, assuming that non-responding companies do not differ systematically. The data moreover indicates that theses mechanics are predominantly male and that their educational background ranges from primary to tertiary level. Out of the mechanics for which education levels are reported, less than 10% report to have primary education level, while over 45% report to have secondary or tertiary education respectively. Of the respondents, the large majority had over 10 years of work experience (over 40% 20 years or more, over 35% between 10 and 20 years). However, given the large number of non-respondents for which no information on educational level nor work experience is available, these numbers need to be interpreted with caution. Moreover, it can be expected that the educational levels reported for mechanics employed in companies do not represent the educational levels of self-employed or informally employed mechanics not represented in the data.
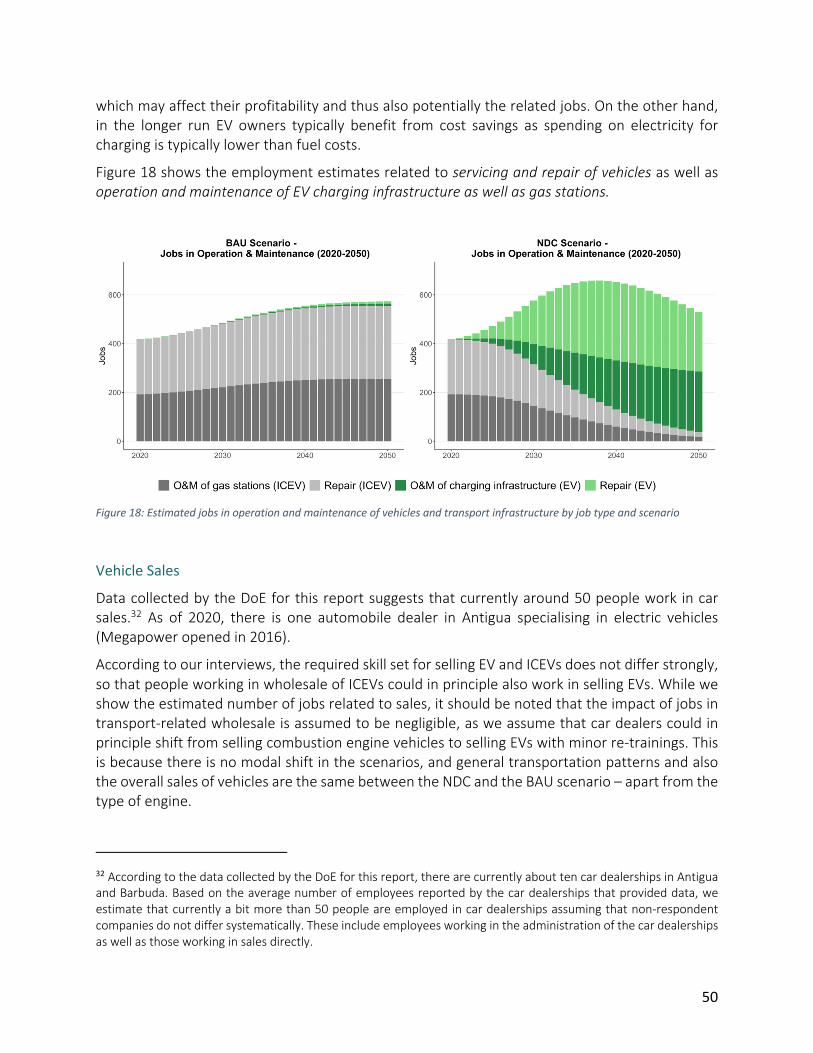
50
which may affect their profitability and thus also potentially the related jobs. On the other hand, in the longer run EV owners typically benefit from cost savings as spending on electricity for charging is typically lower than fuel costs.
Figure 18 shows the employment estimates related to servicing and repair of vehicles as well as operation and maintenance of EV charging infrastructure as well as gas stations.
Figure 18: Estimated jobs in operation and maintenance of vehicles and transport infrastructure by job type and scenario
Vehicle Sales
Data collected by the DoE for this report suggests that currently around 50 people work in car sales.32 As of 2020, there is one automobile dealer in Antigua specialising in electric vehicles (Megapower opened in 2016).
According to our interviews, the required skill set for selling EV and ICEVs does not differ strongly, so that people working in wholesale of ICEVs could in principle also work in selling EVs. While we show the estimated number of jobs related to sales, it should be noted that the impact of jobs in transport-related wholesale is assumed to be negligible, as we assume that car dealers could in principle shift from selling combustion engine vehicles to selling EVs with minor re-trainings. This is because there is no modal shift in the scenarios, and general transportation patterns and also the overall sales of vehicles are the same between the NDC and the BAU scenario – apart from the type of engine.
32 According to the data collected by the DoE for this report, there are currently about ten car dealerships in Antigua and Barbuda. Based on the average number of employees reported by the car dealerships that provided data, we estimate that currently a bit more than 50 people are employed in car dealerships assuming that non-respondent companies do not differ systematically. These include employees working in the administration of the car dealerships as well as those working in sales directly.
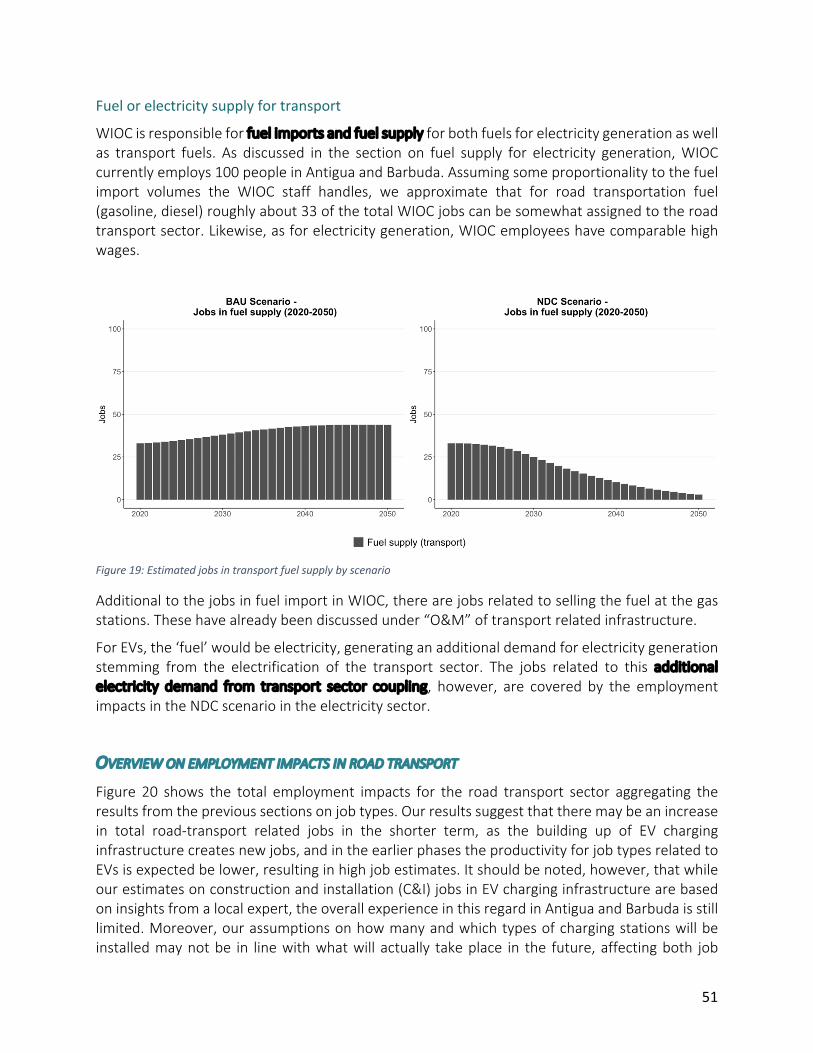
51
Fuel or electricity supply for transport
WIOC is responsible for fuel imports and fuel supply for both fuels for electricity generation as well as transport fuels. As discussed in the section on fuel supply for electricity generation, WIOC currently employs 100 people in Antigua and Barbuda. Assuming some proportionality to the fuel import volumes the WIOC staff handles, we approximate that for road transportation fuel (gasoline, diesel) roughly about 33 of the total WIOC jobs can be somewhat assigned to the road transport sector. Likewise, as for electricity generation, WIOC employees have comparable high wages.
Figure 19: Estimated jobs in transport fuel supply by scenario
Additional to the jobs in fuel import in WIOC, there are jobs related to selling the fuel at the gas stations. These have already been discussed under “O&M” of transport related infrastructure.
For EVs, the ‘fuel’ would be electricity, generating an additional demand for electricity generation stemming from the electrification of the transport sector. The jobs related to this additional electricity demand from transport sector coupling, however, are covered by the employment impacts in the NDC scenario in the electricity sector.
OVERVIEW ON EMPLOYMENT IMPACTS IN ROAD TRANSPORT
Figure 20 shows the total employment impacts for the road transport sector aggregating the results from the previous sections on job types. Our results suggest that there may be an increase in total road-transport related jobs in the shorter term, as the building up of EV charging infrastructure creates new jobs, and in the earlier phases the productivity for job types related to EVs is expected be lower, resulting in high job estimates. It should be noted, however, that while our estimates on construction and installation (C&I) jobs in EV charging infrastructure are based on insights from a local expert, the overall experience in this regard in Antigua and Barbuda is still limited. Moreover, our assumptions on how many and which types of charging stations will be installed may not be in line with what will actually take place in the future, affecting both job

52
estimates in construction and installation as well as operation & maintenance (O&M) of EV charging infrastructure. The presented employment estimates for construction and installation account for the expectation that substantial electrical or civil work may be needed for installing EV charging infrastructure given that the current electrical grid in Antigua and Barbuda is in many places not yet in a position to sustain EV charging. In the Annex, we show a sensitivity analysis applying alternative assumptions on EV charging infrastructure (see Figure 27, Annex C).
In the longer term, we expect the productivity to increase due to learning effects and also the construction and installation of new charging infrastructure to slow down and jobs in O&M of the EV charging infrastructure to replace construction and installation related jobs. While our estimates are based on information from a local expert, there is high uncertainty on the actual stock of EV charging stations to be installed in the future and the existing experience on the employment intensity with regard to O&M of EV charging infrastructure in Antigua and Barbuda is still very limited with very few charging stations already in place. Our estimates therefore need to be taken with caution and may potentially over- or underestimate the true employment impacts in O&M of EV charging stations. A sensitivity analysis with more conservative assumptions related to EV-charging infrastructure and related jobs is presented in the Annex C.
Compared to the estimated jobs in other areas, job estimates in EV repair are expected to dominate total employment after 2030 in our NDC scenario analysis. However, these estimates also need to be interpreted with caution. First, the number of self-employed or informally employed people working in ICEV repair is unknown and could be substantially larger than what we assume. Second, given the limited global as well as local experience with EVs up to now, the related employment impacts and assumed learning curve in EV repair are subject to high uncertainty. While the employment factors used have been derived based on insights from a local expert, there was also large agreement in the interviews – in line with what the literature suggests - that EVs are generally less repair intense and thus would likely lead to less jobs in EV repair in the longer term, especially when learning has increased the productivity of mechanics. In Annex C, we show results for a sensitivity analysis with more conservative assumptions on the ratio of mechanics needed for EV repair (see Figure 28).
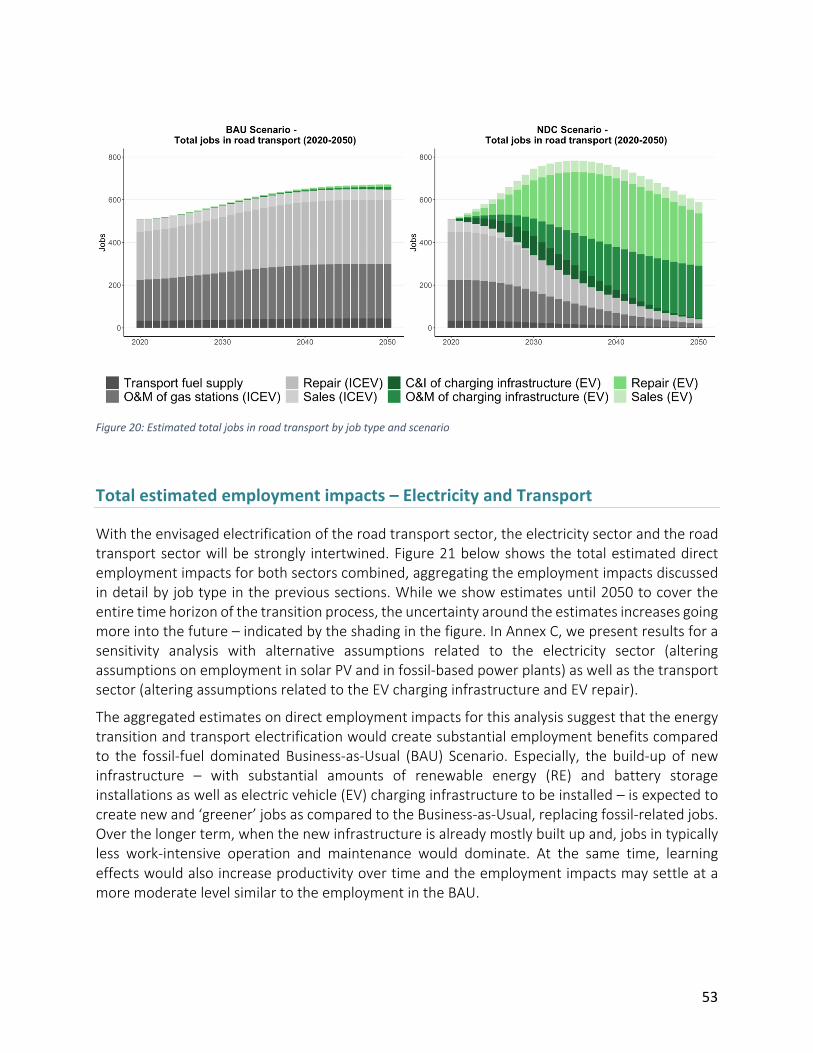
53
Figure 20: Estimated total jobs in road transport by job type and scenario
Total estimated employment impacts – Electricity and Transport
With the envisaged electrification of the road transport sector, the electricity sector and the road transport sector will be strongly intertwined. Figure 21 below shows the total estimated direct employment impacts for both sectors combined, aggregating the employment impacts discussed in detail by job type in the previous sections. While we show estimates until 2050 to cover the entire time horizon of the transition process, the uncertainty around the estimates increases going more into the future – indicated by the shading in the figure. In Annex C, we present results for a sensitivity analysis with alternative assumptions related to the electricity sector (altering assumptions on employment in solar PV and in fossil-based power plants) as well as the transport sector (altering assumptions related to the EV charging infrastructure and EV repair).
The aggregated estimates on direct employment impacts for this analysis suggest that the energy transition and transport electrification would create substantial employment benefits compared to the fossil-fuel dominated Business-as-Usual (BAU) Scenario. Especially, the build-up of new infrastructure – with substantial amounts of renewable energy (RE) and battery storage installations as well as electric vehicle (EV) charging infrastructure to be installed – is expected to create new and ‘greener’ jobs as compared to the Business-as-Usual, replacing fossil-related jobs. Over the longer term, when the new infrastructure is already mostly built up and, jobs in typically less work-intensive operation and maintenance would dominate. At the same time, learning effects would also increase productivity over time and the employment impacts may settle at a more moderate level similar to the employment in the BAU.

54
Figure 21: Total employment impacts – electricity sector and road transport sector combined for BAU and NDC scenario. Note: The shading illustrates that uncertainty around the estimates increases going more into the future.
4. Recommendations for a Policy Framework for a Just Transition of the workforce and next steps
The analysis of the employment impacts illustrates that the envisaged energy transition and an electrification of road transport as outlined in Antigua’s draft NDC could create substantial employment opportunities in the area of renewable energy (RE) and electric vehicles (EVs) for Antigua and Barbuda.
However, as in every transition process, while certain job groups will benefit from the change, the required changes will negatively affect certain types of jobs and certain groups of people currently working in fossil-related jobs and will require dedicated interventions by the government to support their transition to new job opportunities. For a successful transition process, it is thus of utmost importance to be inclusive and to take measures to enable a ‘Just Transition’. This requires identifying potential challenges and collecting targeted data in order to be prepared to pro-actively address them and engage affected groups early. At the same time, it also allows for the creation of jobs in existing and new industries, which may partly be in sectors not covered in this study, and creates an opportunity to address other socio-economic issues such as social or gender inequality. This would require diversification of economies to support the transformation process.
While the presented analysis cannot predict the future and the estimates of the employment impacts of such a transition are only indicative, it clearly provides valuable insights on the potential challenges as well as opportunities to be aware of when designing Just Transition plans. This section discusses the findings presented above from a policy perspective.

55
Addressing potential misalignments in skills and timing
While the overall employment impact of the energy and transport transitions is expected to be positive, there is still a potential for different misalignments (IRENA 2020). The most relevant potential misalignments for Antigua and Barbuda are educational misalignments, i.e. that the skills related to jobs that are phased out do not match well with required skill sets in newly created ‘green’ jobs and temporal misalignments, i.e. that the timing of the job creation does not match the timing of job losses. Based on our results and the insights from the interviews, the following challenges in this regard can be identified.
Measures will need to be taken to train the local workforce adequately for RE-related tasks, while planning is needed to provide them with more permanent employment opportunities in the longer term. The ambitious buildout of RE capacity, especially solar PV, within the next decade is expected to create high demand for workers in construction and installation of new RE systems. While this entails potential for job creation, local experience in solar PV and even more in wind power or other RE technologies in Antigua and Barbuda is to date very limited. Only a few installers are currently technically qualified based on internationally recognized standards, and there are no certification requirements to date for PV installers to be listed with APUA, according to our interviews. While some existing solar companies would be willing to take trainees with suitable qualifications, the staff at the existing vocational institutions in Antigua are so far not certified, so ‘Train the Trainers’ will be needed to meet TVET requirements according to our interviews. Moreover, for individuals seeking training, the cost of trainings is currently quite high, and trainees often only earn wages at the level of internship rates, which are too low to afford a decent living. Measures to foster adequate training of local workers and quality standards will need to be implemented with support from the government. While this need is already acknowledged in Antigua and Barbuda’s NDC draft33, the measures to achieve this remain to be defined. In the short-term it will likely be challenging to cover the high demand for skilled workers in RE construction & installation fully by local workers. While skilled workers from abroad could support the ambitious scaling up of RE capacities in the early stages and could also support the ‘on-the-job’ learning of local workers, the benefits in terms of creating local jobs and progressing the process of a Just Transition would then be reduced. The ambitious expansion of RE capacity in the short term also has potential implications for temporal misalignments. With new PV installations slowing down after 2030 and learning effects increasing productivity of workers, the local workforce newly trained in solar PV installation would partly need to find employment in operation and maintenance of RE installations, which may require some retraining. However, as the construction and installation process is typically considered more work intensive, but is of a non-permanent nature, the estimated number of solar-related jobs in the early 2030s drops considerably in our NDC scenario. Policy makers will need to plan the energy transition process accordingly to provide a more stable long-term perspective for the local workforce in PV as well as other RE technologies. This requires the proactive development of active labour market
33 The NDC draft contains a sub-target “100% of the affected parts of the national workforce are trained to use new mitigation technologies for a low greenhouse gas emissions transition by 2025”
56
programs that anticipate demand for skills as well as workforce development, including (re-) training opportunities and assistance in the job search process as well as support to self-employed workers.
Repair of electric vehicles (EVs) is considered less work intensive and requires additional technical skills due to a larger share of electronical components. While the majority of mechanics that have been trained to conduct combustion engine vehicle repair could be retrained to also repair and service EVs, self-employed and informal ‘hands-on’ mechanics may find it more challenging to transition to EV repair. In our interviews, there was large agreement that mechanics in ICEV repair and servicing may be a group that could be most severely affected by the transition process. Literature comparing repair of ICEVs and EVs support this expectations (FTI Intelligence 2018; Hagman et al. 2016; Propfe et al. 2012). One factor for this is that EVs are typically considered less repair-intensive compared to combustion engine vehicles, thus it is expected that at least in the longer term less jobs in vehicle repair and servicing will be needed. In the shorter term, this effect may not yet play a substantial role as in the beginning, people (both EV owners and mechanics) are not yet very familiar with EVs and may thus seek the service of mechanics more often, and mechanics themselves may also need more time for EV repair in the beginning until learning increases productivity. How fast this learning process will be remains to be seen (see also Annex C for a sensitivity analysis on EV repair assumptions). However, with the vehicle stock transitioning to EVs, the average age of the vehicles stock will go down, likely also decreasing the demand for repair. It was highlighted in our interviews that one group that is expected to be particularly vulnerable in the transition process are the many self-employed or informally employed mechanics. While our interviewed experts agreed that it is possible to retrain mechanics to switch to EV repair, it was emphasised that EV repair requires acquiring additional skills especially for dealing with a larger share of (partly high voltage) electrical components, which may be less challenging for mechanics that have undergone formal training and already possess more sophisticated technical skills. A large part of the self-employed or informally employed mechanics, however, are likely not formally trained but have learned ‘on the job’. For these, accessing re-retraining and the transitioning towards EV repair will likely be challenging.
Employees working in servicing tasks in gas stations will need to find an alternative job which matches their skills. With EV charging stations typically used in self-servicing, there is no obvious equivalent of EV-related jobs that people currently working in gas stations could transition to. As these jobs in service in gas stations do not require a high level of technical skills, most newly created technology-related jobs in renewable energy or the build-up of EV charging infrastructure are likely not an option for these workers. Employees may therefore be required to look for job opportunities in other sectors.
Challenges and opportunities for gender equality
Gender-sensitive measures need to be taken to facilitate a transition. The current workforce in the electricity and road transport sector is strongly dominated by men, including fossil fuel-related jobs that will be primarily affected by the transition. To overcome potential resistance to change and support those mainly affected by potential job loss from a phase out of fossil fuels in the
57
process of the changing work environment and adapting to new employment opportunities, it is important to account for different backgrounds and gender attitudes. A recent gender assessment survey found that – while concerns about using EVs have been primarily coming from a lack of information or misinformation – women were found to be more sceptical with regard to using EVs (Department of Environment of Antigua and Barbuda - Project Management Unit 2021).
Many employees currently working in gas stations are women or even single mothers, for whom losing their job would be particularly challenging. In the interviews, it was raised repeatedly, that a large share of the staff employed in taking care of the service of refuelling vehicles in gas stations are female and, in addition, many of them are breadwinners with dependents to take care of. These women are a specifically vulnerable group that needs to be provided with alternative employment opportunities in the transition process.
The transition process offers opportunities to increase the participation of women in technology-related jobs. According to a survey conducted by the partner institute GGGI as part of the CAEP project34, only about 14% of full- or part-time employees in the local solar sector in Antigua are women35. This share remains below the labour force participation rate of 68,9% for women in Antigua (Government of Antigua and Barbuda 2020b)and is less than half compared to the global average of 32% according to IRENA (IRENA 2019).None of the few women employed in the local solar business are currently in technical or engineering jobs according to the GGGI survey. Different studies analysing the various barriers for women in the workforce in general (ILO 2019) and specifically in transport-related job (Ng and Acker 2020) and renewable energy related employment (IRENA 2019) provide valuable insights into the potential underlying reasons for the underrepresentation of women and ways to overcome those. The transition process could be used as an opportunity to encourage females to seek a career in the renewable energy sector or EV-related business. Providing options for childcare assistance could lower potential barriers for families with children and especially for single parents to participate in such training.36 The draft NDC acknowledges this opportunity for increasing gender equality37. However, the measures and policies towards achieving this will need to be defined in the Just Transition process.
34 Insights have been obtained based on the draft Policy Paper “Policy Guide to Inclusive Investment Opportunities in Renewable Energy in Antigua and Barbuda 2020-2025” from GGGI written as part of the CAEP project as well as email conversations with Catherine Allinson (GGGI). 35 These insights are based on a stakeholder consultation of GGGI with the domestic solar sector a spart oft he CAEP project. The survey from GGGI had received answers from 6 out of 10 solar companies. 36 The Department of Labour has taken into consideration to introduce childcare in training programms under its active labour market programme supported by a World Bank project. The development of the Just Transition strategy may build on these discussions. 37 The NDC drafts includes the following sub-targets related to gender-issues: “Develop a gender-responsive approach to the just transition of men in the energy and construction sectors (Baseline: currently approximately 95% men in these sectors) by 2024”; “100% of female-headed households have all barriers removed to access back-up renewable energy generation and storage systems (i.e., 20,000 homes) by 2030”; “20% increase in the number of women-led businesses implementing renewable energy and adaptation interventions by 2030”.

58
Challenges and opportunities for social inclusion
Purchasing RE-installations or EVs requires up-front investments. It is important to not leave less wealthy households behind in the transition process. While the NDC emphasises the role of PV on residential rooftops, not every household will be able to afford the substantial up-front investments needed to install a solar panel on their roof. Likewise, not every household will have the financial means to purchase a (new) electric vehicle. It will be important to enable access to affordable financing also for less wealthy families.38 Dwellings with poorer quality of the electrical infrastructure will moreover require more work – and thus higher costs – for installing EV charging or solar panels as more electrical work may be needed. Furthermore, access to information on renewable energy solutions need to be facilitated for all citizens, including less educated and less affluent groups, to enable equal participation in the transition process and address energy poverty (Global Green Growth Institute 2021) .
Opportunities for affordable and attractive skills development for poorer households need to be created. People that are economically more vulnerable will typically choose to earn money to cover their expenses in the short term instead of investing into developing their skills further by doing trainings. Fees for training courses are often high (e.g. US$ 1000-1200 for a training related to PV for a duration of 10 weeks according to our interviews). Even if a funded course is complimentary, there is a registration fee of EC$50 (for the case of GARD, this may vary for other institutions). More flexible courses or online courses are partly offered; however, many poorer households do not have the required ICT39-infrastructure to participate in online courses as they mainly rely on using their mobile phones. Moreover, it was mentioned in our interviews that another disadvantage for poorer people with regard to engaging in solar energy jobs is that insurance costs are not necessarily covered and poorer trainees for solar roof installations cannot afford insurance themselves, placing them at risk when doing on the job training on roof tops according to one of our interviewees. Vulnerable communities, and especially younger people within those, are often not yet aware of the developments with regard to renewable energy and it being potentially a promising career opportunity for them.
People working in informal employment or are self-employed are typically less skilled and more vulnerable to economic challenges. Many of the self-employed vehicle mechanics which have likely not undergone formal training and are affected by a phase out of ICEVs are likely economically more vulnerable. Moreover, more generally, people with lower incomes and potentially lower education levels often engage in seasonal work, such as in the tourism sector or in agriculture. The seasonality of their employment can prevent them from taking part in (academic) courses as they would need to drop out of the course during the harvest season or tourism high season. Especially in view of the severe impacts of the COVID-19 pandemic on the tourism sector, it is important to
38 As part of the SIRFF (Sustainable Island Resource Framework Fund), the climate change programme is planning to provide the opportunity of accessing financial support options for purchasing Electrical Vehicles in order to overcome barriers of up-front costs (Department of Environment of Antigua and Barbuda - Project Management Unit 2021). 39 Information and Communication Technology

59
provide people employed in this sector with alternative employment opportunities. The transition of the energy and transport sectors can offer opportunities here.
Other challenges and opportunities
While this analysis focuses on direct employment in the electricity and road transport sectors, additional elements beyond the scope of this study need to be considered for the further process on Just Transition and require further investigation, as highlighted below.
Indirect effects and feedback effects may affect additional jobs. This study focuses on the direct employment effects. The transition process will however entail profound economic restructuring and will likely also cause additional indirect effects, which are beyond the scope of this study. Potential effects can range from impacts on local fuel prices due to changes in demand and fuel availability impacting jobs related to heavy-duty vehicles to impacts on other sectors. Further analyses will be needed to assess economy-wide impacts and interactions.
Feedback effects on household expenditures on fuel expenses and electricity bills need to be taken into consideration. While it is beyond the scope of this study to analyse the impacts on electricity prices or fuel prices and the related effects on household budgets, as well as profitability of businesses, it will be important to evaluate and monitor these developments throughout the transition process. According to a draft brief of the DoE on the socio-economic impact of electricity costs (Department of Environment 2020a), Antigua and Barbuda is currently among the countries with the highest electricity prices in the Caribbean region, mainly due to fuel price fluctuations as well as damages to the electrical grid from hurricanes.40 Low-income households are at particular risk of energy poverty, with 10 percent of households spending more than a fifth of their income on electricity (Global Green Growth Institute 2021). In this regard, the transition may bring both challenges as well as opportunities; while high upfront investments such as in solar PV rooftop installations or electric vehicles strain the budgets of households and businesses at least in the short run, reduced fuel bills as well as self-generated solar electricity will reduce the financial burden over time, likely leading to savings in the longer term. Access to this information and affordable financing will be of primary importance for private investment and participation in the transition.
Investments into the grid and electrical infrastructure will be needed to create technical conditions that allow a successful transition. The current electrical infrastructure in Antigua and Barbuda is not yet well-equipped. The installation of solar panels or charging stations for EVs often requires more profound electrical or even civil work to build up the technical conditions. In particular, installing a larger number of fast-charging stations would likely pose a challenge. A high share of renewable energy requires modernization measures for grid integration, and the sector coupling with the transport sector imposes additional requirements on the grid infrastructure. Without progress on these fronts, a successful transition process will be challenging. Given the high
40 Briefing draft from the DoE from April 2020 “Socio-Economic Impact of Electricity Costs in Antigua and Barbuda”

60
vulnerability of the current grid to damages from climate change impacts, these grid modernization processes need to go hand in hand with investments into making the grid resilient to the impacts of climate change.
Incentives have to be set to encourage purchasing EVs and solar rooftop panels. Currently it is still more expensive to buy an EV than it is to buy an internal combustion engine vehicle (ICEV). Taxation structures have to be redesigned in a way that they incentivise a transition towards EVs and enable a successful phase out of ICEVs. Schemes for scrapping ICEVs may also be considered to foster the phase out of ICEVs from the vehicle fleet. Moreover, an important aspect for SIDS could be industrialised countries around the world divesting from ICEVs, potentially leading to larger supply of used ICEVs on the global market. Policies restricting imports of old ICEVs may be needed to ensure a successful phase out of ICEVs in Antigua and Barbuda.
Changing people’s mindsets and sensitizing them for the required transition and its benefits will be needed. In our interviews, it was mentioned several times that many people in Antigua and Barbuda are not yet aware that the energy and transport transition will already occur in the near future. Information campaigns to communicate why this transition is an important step in the right direction and what the benefits are for the people could improve the local understanding of the situation significantly. Antigua and Barbuda is an “entrepreneurial society” as one of our interviewees called it; the transition has to be discovered as an opportunity for the many self-employed and small businesses to create new business opportunities. Providing information can significantly accelerate the necessary shift in thinking, and enable entrepreneurs to reap the benefits that the transition brings, such as savings on both fuel costs and electricity bills. Given the significant importance of cars in Antigua and Barbuda, encouraging the enthusiasm for new technologies and electric vehicles will be of particular importance for the transition in transport. While this is likely to occur naturally as global vehicle manufacturing evolves with many manufacturers beginning to phase out ICEVs and increase their development and manufacturing of EVs, the timeframe outlined within Antigua and Barbuda’s draft NDC will require significant support to facilitate the transition in the targeted time period.
The regulatory environment needs to be improved. Antigua and Barbuda currently lacks an effective oversight or regulatory mechanism, implemented by an independent regulatory body or commission. The oversight and guidance provided by such an entity is important for the key players in the energy transition, including APUA and any independent power producers. Other countries in the region, such as Grenada, have seen benefit from establishing independent regulatory commissions. While WIOC has shown active engagement and a willingness to contribute to the transition process, APUA and APC have not responded to our invitations to represent their views in this analysis.
Sustainable budgetary options have to be created for financing. According to the interview, a substantial share of the government budget is currently funded through a tax on fuels. In the current situation, with the COVID-19 crisis strongly affecting the tourism sector— the main economic sector— the relevance of this fuel tax for the government budget has increased. With a transition away from fossil fuels, an alternative funding mechanism that does not create
61
disincentives for purchasing EVs or investing in renewable energy will need to be found. In its NDC draft, Antigua and Barbuda mentions the “elimination of the fuel surcharge tax on electricity bills by 2030”. However, it remains unclear through which funding sources this will be replaced. It will be important to conduct a detailed economic analysis of the potential impact of the transition on the government budget.41 With the COVID-19 pandemic driving up the nation’s debt-to-GDP ratio, sustainable approaches need to be found to cover the required investment costs into clean technologies.42 Reducing fuel import dependency on the other hand creates an opportunity for decreasing vulnerability to fluctuations in market prices for fuel imports and reducing the budgetary burden.
Additional benefits could be reaped from incentivizing people to shift transport modes. The transport sector is typically associated with a range of negative externalities, such as traffic accidents, air pollution and congestion which negatively affect people’s health. While our scenario assumes that there is no modal shift, i.e. no switch from using a private car (independent of the engine type) towards public transport or biking, an analysis from the World Health Organization suggests that there could not only be health benefits but even job creation potential from switching to public transport, cycling or even walking (WHO 2014). While the benefits to Antigua and Barbuda specifically would need to be explored in more detail, policies may consider investing in improving low-carbon transport options (including public transport, biking infrastructure and shared mobility).
Next steps: Engaging stakeholder and developing Just Transition plans
While this analysis has provided valuable insights on the challenges and opportunities the transition process may bring with regard to a Just Transition of the workforce, it is only the starting point for a (longer-term) process that will need to be followed by dialogues and strategy development. Further investigation and additional structured data collection will be needed to allow more detailed planning and for improving the basis for impact assessments of planned and implemented measures. While our analysis has focused on direct employment in the electricity sector and road transportation sector only, the follow-up process will need to take a more holistic perspective on the economy, including implications for other sectors and indirect effects, including wider effects on communities and businesses as well as opportunities for economic diversification and resilience.
The Just Transition Guidelines of the International Labour Organization (ILO) recommend that governments provide a stable and coherent framework for sustainable enterprises and decent
41 Studies in this direction are already under discussion as part of the UNDP Climate Promise Initiative and will potentially be proposed under the GCF Readiness programme. 42 See e.g. recent Reuters article from March 15, 2021 “Green transition in islands hamstrung by debt, says Antigua & Barbuda PM” https://www.reuters.com/article/us-climate-change-caribbean-energy/green-transition-in-islands-hamstrung-by-debt-says-antigua-barbuda-pm-idUSKBN2B726H

62
work and “promote and engage in social dialogue, at all stages from policy design to implementation and evaluation”, at all levels (ILO 2015; International Labour Organization 2018).
Building on this analysis, the International Labour Organization has agreed to move forward with the follow-up process for developing strategies and plans for a Just Transition and engage the relevant stakeholders in this (long-term) process. In our interviews, the Antigua and Barbuda Workers Union representing employees of APUA has signalled a strong interest in being engaged in the follow-up process and discussions. Moreover, the employer associations have been mentioned as important stakeholders to be involved. Moreover, while the Ministry of Social Transformation, the Ministry of Energy and the Labour Department did not respond to the interview request to provide their views for this study, they will also be important actors in the discussion process for shaping the transition process and should be involved as the Just Transition policies are developed. We recommend inviting affected and relevant interested parties to contribute to the discussion as well.
The national transition plan to be developed by Antigua and Barbuda with the support of the ILO over the course of the upcoming years will need to address a variety of aspects which go beyond the scope of this study, including economy-wide impacts and second-order feedback effects, accounting for age structures of the affected workforce, education levels and skills including retraining needs, identifying options for financing the transition, ensuring that aspects of gender equality and social inclusion are considered and supported appropriately. It is recommended to develop sector-level action plans with targeted training and re-training programmes. Most importantly, a social dialogue will need to play an essential role in shaping the institutional framework for policy making and implementation, ensuring that the voices of all relevant stakeholders are heard on all levels.
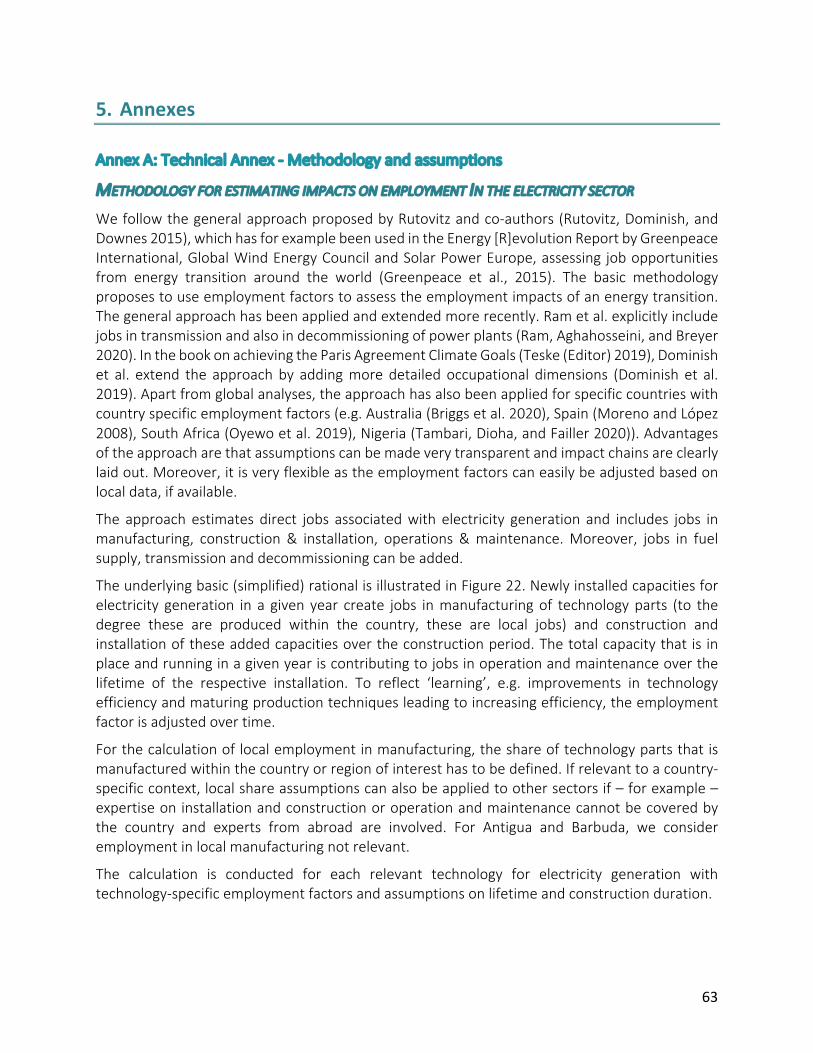
63
5. Annexes
Annex A: Technical Annex - Methodology and assumptions
METHODOLOGY FOR ESTIMATING IMPACTS ON EMPLOYMENT IN THE ELECTRICITY SECTOR
We follow the general approach proposed by Rutovitz and co-authors (Rutovitz, Dominish, and Downes 2015), which has for example been used in the Energy [R]evolution Report by Greenpeace International, Global Wind Energy Council and Solar Power Europe, assessing job opportunities from energy transition around the world (Greenpeace et al., 2015). The basic methodology proposes to use employment factors to assess the employment impacts of an energy transition. The general approach has been applied and extended more recently. Ram et al. explicitly include jobs in transmission and also in decommissioning of power plants (Ram, Aghahosseini, and Breyer 2020). In the book on achieving the Paris Agreement Climate Goals (Teske (Editor) 2019), Dominish et al. extend the approach by adding more detailed occupational dimensions (Dominish et al. 2019). Apart from global analyses, the approach has also been applied for specific countries with country specific employment factors (e.g. Australia (Briggs et al. 2020), Spain (Moreno and López 2008), South Africa (Oyewo et al. 2019), Nigeria (Tambari, Dioha, and Failler 2020)). Advantages of the approach are that assumptions can be made very transparent and impact chains are clearly laid out. Moreover, it is very flexible as the employment factors can easily be adjusted based on local data, if available.
The approach estimates direct jobs associated with electricity generation and includes jobs in manufacturing, construction & installation, operations & maintenance. Moreover, jobs in fuel supply, transmission and decommissioning can be added.
The underlying basic (simplified) rational is illustrated in Figure 22. Newly installed capacities for electricity generation in a given year create jobs in manufacturing of technology parts (to the degree these are produced within the country, these are local jobs) and construction and installation of these added capacities over the construction period. The total capacity that is in place and running in a given year is contributing to jobs in operation and maintenance over the lifetime of the respective installation. To reflect ‘learning’, e.g. improvements in technology efficiency and maturing production techniques leading to increasing efficiency, the employment factor is adjusted over time.
For the calculation of local employment in manufacturing, the share of technology parts that is manufactured within the country or region of interest has to be defined. If relevant to a country-specific context, local share assumptions can also be applied to other sectors if – for example – expertise on installation and construction or operation and maintenance cannot be covered by the country and experts from abroad are involved. For Antigua and Barbuda, we consider employment in local manufacturing not relevant.
The calculation is conducted for each relevant technology for electricity generation with technology-specific employment factors and assumptions on lifetime and construction duration.
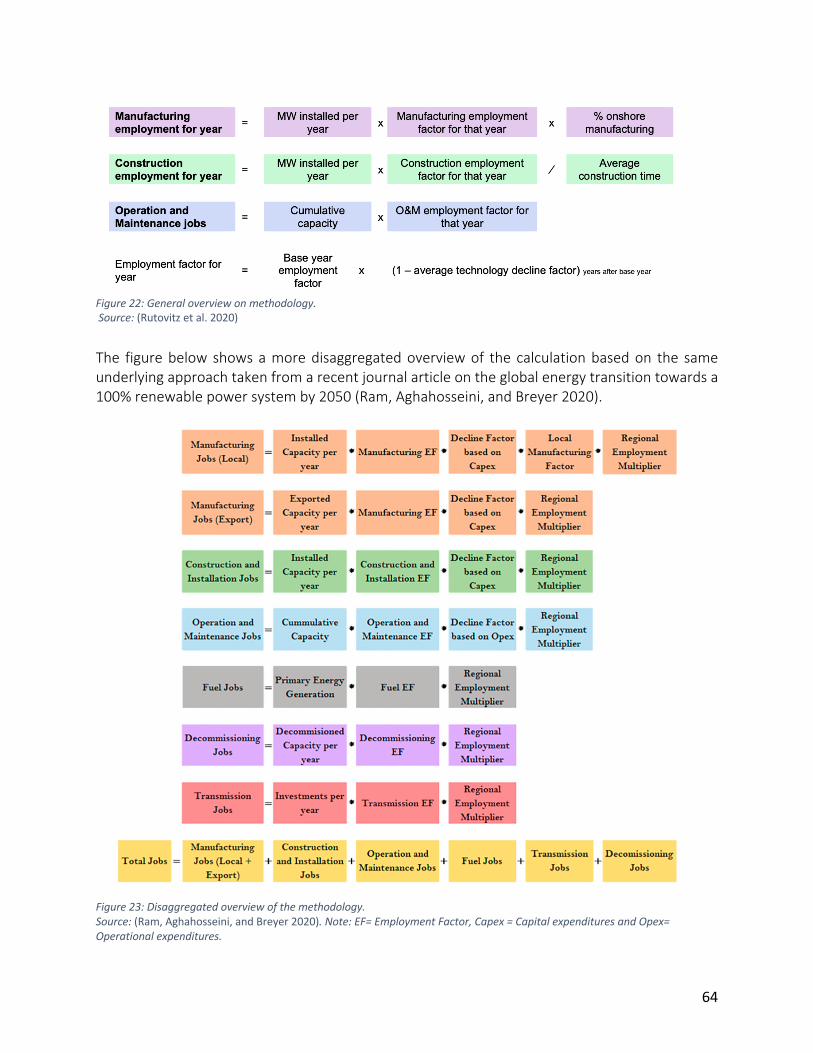
64
Figure 22: General overview on methodology. Source: (Rutovitz et al. 2020)
The figure below shows a more disaggregated overview of the calculation based on the same underlying approach taken from a recent journal article on the global energy transition towards a 100% renewable power system by 2050 (Ram, Aghahosseini, and Breyer 2020).
Figure 23: Disaggregated overview of the methodology. Source: (Ram, Aghahosseini, and Breyer 2020). Note: EF= Employment Factor, Capex = Capital expenditures and Opex= Operational expenditures.
65
As Ram et al. (2020) as well as Rutovitz et al (2015) estimate employment impacts globally, they apply regional employment multipliers to adjust the ‘base’- employment factors for each technology and job activity with regional adjustment factors to account for differences in productivity between regions.
To assess the employment impacts of different energy transition scenarios, the approach requires input on scenarios providing data on (future) newly installed capacities as well as total already installed capacity for the relevant technologies. For the analysis of the Just Transition of Antigua and Barbuda, data on historical installed capacities as well as future capacity scenarios are based on the results of energy system modelling using LEAP and partly HOMER.
Note that the employment factor approach typically focuses on direct employment only, and does not quantify indirect employment further down the supply chain nor employment induced by the spending of wages throughout the economy. Still, a comparison of jobs for the different technologies over time can yield an indicative picture of the overall developments and employment effects for the analysed scenarios. However, the estimates should not be interpreted as a projection of net employment effects.
There is a broad range of literature estimating employment factors for different countries and technologies. There are several meta analyses on employment effects for renewable energy available (Cameron and van der Zwaan 2015; Meyer and Wolfgang 2014; Rutovitz, Dominish, and Downes 2015). Most employment factor estimates have been derived on data for OECD countries and only very few on less developed countries, as there is a scarcer literature basis for the latter. However, the flexibility of the approach allows to replace employment factors with factors that are considered to better describe the country context. Moreover, the approach also allows for transparent sensitivity analyses to assess how sensitive results are with regard to assumptions on key technologies.
For this study, country-specific employment factors for each technology and employment sector were derived dependent on data availability and insights from expert interviews. Whenever the available information did not allow to derive country-specific factors, the employment factors from Ram et al. (2020) have been applied. For a detailed overview on the assumptions and factors used for the analysis see Annex section “Overview on assumptions” in this Annex.
OVERVIEW ON ASSUMPTIONS AND EMPLOYMENT FACTORS USED - ELECTRICITY SECTOR
Employment factors and other relevant parameters have been derived based on local data or expert interviews. Whenever data availability did not allow, the regionally and temporally adjusted employment factors from Ram et al (2020) have been applied for our scenario analysis of Antigua and Barbuda. The resulting adjusted employment factors from Ram et al. (2020) applying the regional adjustment factor for South America as well as the decline factor to account for productivity increases over time, are shown in Table 5.
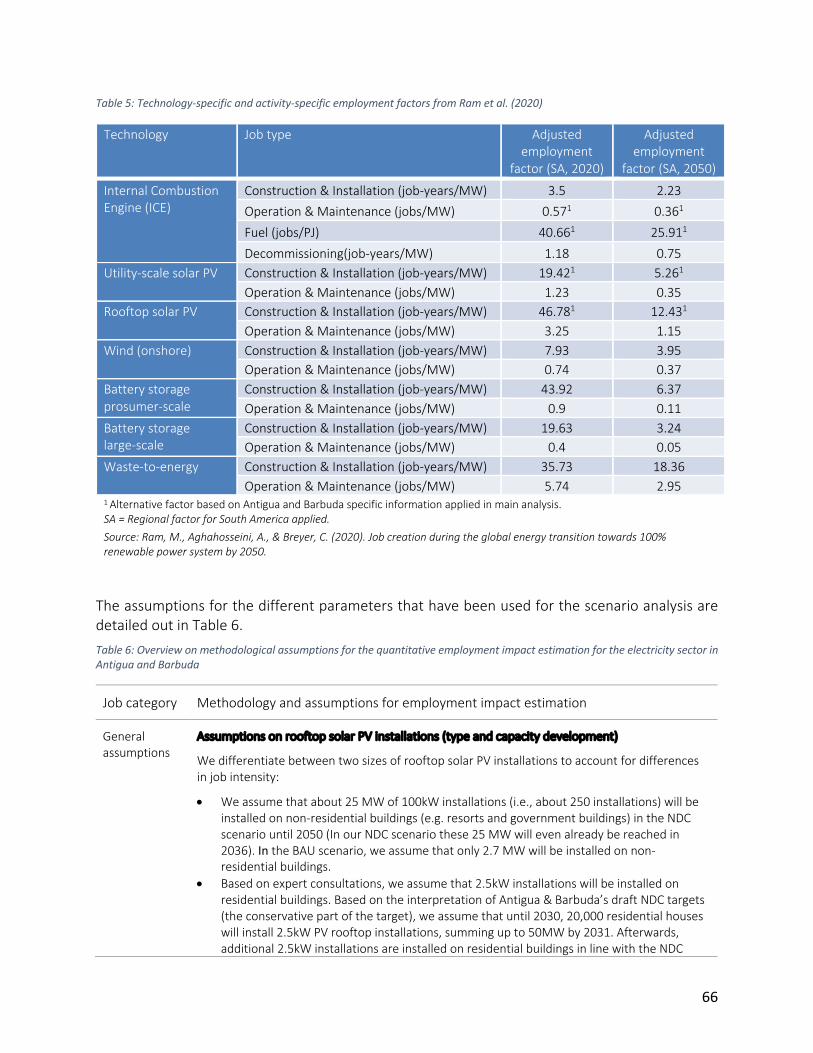
66
Table 5: Technology-specific and activity-specific employment factors from Ram et al. (2020)
Technology Job type Adjusted employment
factor (SA, 2020)
Adjusted employment
factor (SA, 2050)
Internal Combustion Engine (ICE)
Construction & Installation (job-years/MW) 3.5 2.23 Operation & Maintenance (jobs/MW) 0.571 0.361 Fuel (jobs/PJ) 40.661 25.911 Decommissioning(job-years/MW) 1.18 0.75
Utility-scale solar PV Construction & Installation (job-years/MW) 19.421 5.261 Operation & Maintenance (jobs/MW) 1.23 0.35
Rooftop solar PV Construction & Installation (job-years/MW) 46.781 12.431 Operation & Maintenance (jobs/MW) 3.25 1.15
Wind (onshore) Construction & Installation (job-years/MW) 7.93 3.95 Operation & Maintenance (jobs/MW) 0.74 0.37
Battery storage prosumer-scale
Construction & Installation (job-years/MW) 43.92 6.37 Operation & Maintenance (jobs/MW) 0.9 0.11
Battery storage large-scale
Construction & Installation (job-years/MW) 19.63 3.24 Operation & Maintenance (jobs/MW) 0.4 0.05
Waste-to-energy Construction & Installation (job-years/MW) 35.73 18.36 Operation & Maintenance (jobs/MW) 5.74 2.95
1 Alternative factor based on Antigua and Barbuda specific information applied in main analysis. SA = Regional factor for South America applied.
Source: Ram, M., Aghahosseini, A., & Breyer, C. (2020). Job creation during the global energy transition towards 100% renewable power system by 2050.
The assumptions for the different parameters that have been used for the scenario analysis are detailed out in Table 6. Table 6: Overview on methodological assumptions for the quantitative employment impact estimation for the electricity sector in Antigua and Barbuda
Job category Methodology and assumptions for employment impact estimation
General assumptions
Assumptions on rooftop solar PV installations (type and capacity development)
We differentiate between two sizes of rooftop solar PV installations to account for differences in job intensity:
• We assume that about 25 MW of 100kW installations (i.e., about 250 installations) will be installed on non-residential buildings (e.g. resorts and government buildings) in the NDC scenario until 2050 (In our NDC scenario these 25 MW will even already be reached in 2036). In the BAU scenario, we assume that only 2.7 MW will be installed on non-residential buildings.
• Based on expert consultations, we assume that 2.5kW installations will be installed on residential buildings. Based on the interpretation of Antigua & Barbuda’s draft NDC targets (the conservative part of the target), we assume that until 2030, 20,000 residential houses will install 2.5kW PV rooftop installations, summing up to 50MW by 2031. Afterwards, additional 2.5kW installations are installed on residential buildings in line with the NDC
67
scenario rooftop solar PV capacity data. In 2039, a capacity of 75MW small-scale rooftop solar is reached in our NDC scenario. In the BAU scenario, the build-out of residential rooftop solar PV is substantially lower reaching 3.5 MW in 2031 and 4.7 MW in 2050.
Assumptions on wind
It is assumed that it is onshore wind that will be installed in Antigua and Barbuda.
Assumptions on battery storage capacities
Battery storage capacities have been approximated based on modelling with HOMER and LEAP.
Assumptions on capacity build-out for each year
Total capacities are attributed to the succeeding year such that jobs associated with operation and maintenance will only be created when construction is completed.
Learning and productivity improvements (decline factors)
To account for improvements in labor productivity over time (‘learning’), we assume that job factors decrease over time based on technology-specific decline factors:
• For construction and installation of rooftop solar PV systems, we derived the decline factors based on expert consultation. We assume that between 2020 and 2030 the job factor decreases by 25%, assuming a linear decline over time. After 2030, productivity increases are offset by more demanding installation requirements (e.g. due to less favourable infrastructure) such that no decline factors are applied.
• For all other technologies, we apply technology-specific decline factors based on Ram et al. (2020), which are based on capital expenditure (CAPEX) and operational expenditures (OPEX). Decline factors are applied to construction and installation jobs (based on CAPEX) as well as operation and maintenance jobs (based on OPEX). No decline factors are assumed for fuel jobs and decommissioning jobs.
• We apply time-dependent regional adjustment factors for South America for those factors derived from Ram et al. (2020) in order to reflect region-specific productivity increases.
Local manufacturing
Jobs in local manufacturing of technology parts for power generation are considered not relevant for Antigua and Barbuda.
Construction and Installation
Job factors for construction and installation of rooftop solar PV
Rooftop solar PV plays a key role in the NDC scenario. To approximate the jobs in construction and installations of newly installed rooftop solar PV installations, we have derived the following assumptions based on consultations with local experts:
• For 2.5kW installations: We assume that in 2020, 2 workers are needed for 1 day each for structural work, plus 1 worker needed for 5 days to cover the electrical work for one installation of 2.5kW.
• For 100kW installations: We assume that currently 12 workers for 14 days each are needed for one installation of 100kW.
• Resulting job factors per MW added capacity: Assuming that workers also spend a part of their work year on tasks other than installations of PV (e.g. securing sales, admin tasks), we assume 200 work days spent on installations per year. Based on this, a job factor (in full-time equivalents) of 14 job-years/MW is calculated for 2.5kW installations and of 8.4 job-years/MW for 100kW installations. As we assume a construction duration of £1 year for rooftop solar PV, this translates to the same employment factors in jobs/MW of newly added capacity for the respective year. Over time, these job factors decline as described above.
68
• For comparison, Ram et al. (2020) assume a job factor (regionally adjusted for South America of 46.78 job years/MW for construction and installation of rooftop solar PV systems (in 2020). Our assumptions therefore reflect a conservative labour demand estimate. A sensitivity analysis using these higher employment factors is presented in Figure 25.
• We assume a construction period of £1 year.
Jobs in construction and installation of utility-scale solar PV
• We empirically derive the job factor for utility-scale solar PV based on expert consultation of an existing utility-scale solar PV project in Antigua. Assuming no time spent on tasks other than installation, we assume 240 work-days spent on the project per year. Based on this, a job factor (in full-time equivalents of 3.43 job-years/MW is calculated. Over time, this job factor declines as described above.
• For comparison, Ram et al. (2020) assumes a job factor (regionally adjusted for South America) of 19.42 job-years/MW for construction and installation of utility-scale solar PV systems (for 2020). Our assumptions therefore reflect a conservative labour demand estimate. A sensitivity analysis using these higher employment factors is presented in Figure 25.
• We assume a construction period of 1 year.
Jobs in construction and installation of onshore wind
• As there is only very limited experience with wind power in Antigua and Barbuda so far, the empirical basis to derive country-specific employment factors is not given. As wind moreover only plays a minor role in the NDC scenario, we assume that the regionally adjusted employment factor for wind onshore from Ram et al. (2020) sufficiently approximates job implications for Antigua and Barbuda. For 2020, the Ram et al. (2020) job factor is 7.93 job-years/MW added capacity for the construction of onshore wind turbines in 2020 (applying regional adjustment factors for South America and decline factors).
• We assume a construction period of 2 years.
Jobs in construction and installation of dispatchable renewables
• In the NDC scenario, a limited amount of dispatchable renewable energy is added to the system in 2030. As no comparable dispatchable renewable technology currently exists in Antigua & Barbuda, we assume the regionally adjusted job factors for waste-to-energy from Ram et al. (2020) of 25.88 (35.73) job-years/MW in 2030 (2020). Over time, this job factor declines as described above. The job factor of waste-to-energy is chosen as an exemplary renewable dispatchable technology.
• We assume a construction period of 4 years.
Jobs in construction and installation of new fossil infrastructure
• In our business-as-usual scenario, additional HFO-based infrastructure is added to the system. Due to limited local data availability, we assume the regionally adjusted job factors for construction and installation of internal combustion engine infrastructure of 3.5 job-years/MW added in 2020. Over time, this job factor declines as described above.
• We assume a construction period of 3 years. • In 2020, APUA has requested Expressions of Interests for a potential LNG-fueled power
plant. Given the large uncertainties of implementation, this analysis does not take into account any employment related to this tender.
Jobs in construction and installation of battery storage
• Due to the limited experience in Antigua and Barbuda with regard to already installed battery capacity, we apply the employment factors from Ram et al. (2020) differentiating

69
between ‘small-scale’ (‘prosumer’) related to residential and public/commercial PV rooftop) and ‘large scale’ battery storage related to utility PV (see Table 5 ).
• We assume a construction duration of 1 year for ‘small-scale’ battery installations and 2 years for ‘large-scale’ battery installations.
Operation and Maintenance
Jobs in operation and maintenance of rooftop solar PV
• Due to limited data on local operation and maintenance of rooftop solar PV, we assume the regionally adjusted job factor suggested by Ram et al. (2020) of 3.25 job-years/MW for operation and maintenance for both 2.5kW and 100 kW systems (for 2020). This job factor represents a lower bound of job estimates as confirmed by local expert consultation, and could increase with remoteness of installation locations. Over time, this job factor declines as described above.
Jobs in operation and maintenance of utility-scale solar PV
• Due to limited data on local operation and maintenance of utility-scale solar PV, we assume the regionally adjusted job factor suggested by Ram et al. (2020) of 1.23 job-years/MW for operation and maintenance of utility-scale solar PV systems (for 2020). This job factor represents a lower bound of job estimates as confirmed by local expert consultation, and could increase with remoteness of installation locations. Over time, this job factor declines as described above.
Jobs in operation and maintenance of onshore wind
• As there is only very limited experience with wind power in Antigua and Barbuda so far, the empirical basis to derive country-specific employment factors is not given. As wind moreover only plays a minor role in the NDC scenario, we assume that the regionally adjusted employment factor for wind onshore from Ram et al. (2020) sufficiently approximates job implications for Antigua and Barbuda. For 2020, the Ram et al. (2020) job factor is 0.74 job-years/MW added capacity for the construction of onshore wind turbines in 2020 (applying regional adjustment factors for South America and decline factors).
Jobs in operation and maintenance of dispatchable renewables
• In our NDC scenario, a limited amount of dispatchable renewable energy is added to the system in 2030. As no comparable dispatchable renewable technology currently exists in Antigua & Barbuda, we assume the regionally adjusted job factors for waste-to-energy from Ram et al. (2020) of 4.16 (5.74) job-years/MW in 2030 (2020). Over time, this job factor declines as described above.
Jobs in operation and maintenance of fossil infrastructure
• We derive a local employment factor from data on electricians in Blackpine power plant provided by APC. This translates into 1.07 jobs/MW. This factor is applied to operation and maintenance of all HFO-fueled power plants.
• For comparison, Ram et al. (2020) assume a job factor (regionally adjusted for South America) of 0.57 jobs/MW for internal combustion engine power plants. A sensitivity analysis using the lower employment factors is presented in Figure 26.
Jobs in operation and maintenance of battery storage
• Due to the limited experience in Antigua and Barbuda with regard to already installed battery capacity, we apply the employment factors for O&M from Ram et al. (2020) differentiating between ‘small-scale’ (‘prosumer’) related to residential and public/commercial PV rooftop and ‘large scale’ battery storage related to utility PV (see Table 5).
70
Fuel supply for power generation
Jobs in fuel supply of fossil infrastructure
• We use the most recent available data (from 2016) on total fuel imports from WIOC to determine the relative shares of fuels for electricity generation (i.e. fuel oil) in all fuel imports (34%). Based on local employment data in fossil fuel imports (from 2020) and historical generation of HFO power plants and distributed diesel generators in the same year, we then derive an empirical ratio of 0.097 (full-time equivalent) jobs/GWh in fuel supply for power generation. No decline factor is applied.
Electricity Transmission and Distribution
Jobs in transmission and distribution
Jobs in transmission and distribution are not quantified due to data limitations.
71
METHODOLOGY FOR ESTIMATING IMPACTS ON EMPLOYMENT RELATED TO ROAD TRANSPORT
The literature on estimating the employment impacts of a transition to sustainable transportation is scarce and there is no established methodology available. To our knowledge, there are no analyses estimating the transport-related employment impacts of an energy transition for small island developing states.
Following a similar structure as the analysis of the electricity sector, we assign job types relevant to the transport sector to the broader groups jobs in transport-related “manufacturing”, “construction and installation”, “operation and maintenance (including repair)” and “fuel or electricity supply”, adding the additional category “sales”. Note that our analysis focuses on road transport and transport modes such as shipping, aviation as well as railway are not considered in this analysis.
Table 7 provides an overview on the general job group structure and the job types assigned to them. Moreover, jobs can be differentiated into “jobs in low-carbon road transport” – provided that the decarbonization of the electricity generation is successfully pursued as described in the analysis of the electricity sector – and “jobs in combustion-engine-based road transport”. Marked in grey are jobs that we do not consider in our analysis. These are, on the one hand, job types that we do not consider relevant for the specific case of Antigua and Barbuda, i.e. mainly jobs in manufacturing, as Antigua and Barbuda does currently not have relevant transport-related manufacturing capacities and associated jobs, which we assume will not change. On the other hand, jobs marked in grey are jobs that are expected to be the same in the NDC scenario and the BAU scenario due to the assumption of no modal shift, i.e. no switch in transport mode from cars to cycling or to increased usage of public transport – and for which insufficient data was available. For example, the overall number of bus drivers for public transport, taxi drivers or car dealers should not differ between the scenarios, however, the type of engine of the respective vehicle they are driving or selling would shift from combustion engine to electric while this should not affect the general nature of these job types. This also includes jobs related to the construction of (electrified or conventional) public transport infrastructure and bike lanes, maintenance43 of this infrastructure (e.g. cleaning) as well as bicycles wholesale and repair of bicycles. In blue, we marked jobs jobs in the electricity sector that stem from the increased electricity demand from transport sector electrification. To avoid double counting, these jobs are reported as part of the electricity sector jobs in our analysis but will be discussed and referenced in the transport sector analysis. Also marked in blue are jobs in transmission and distribution which we discussed qualitatively.
43 Repair of public transport vehicles would be differentiated here and included under servicing and repair of EVs or combustion engine vehicles.

72
Table 7: Categorization on job types related to road transport for the employment analysis
Category Jobs in low-carbon44 road transport Jobs in combustion-engine-based road transport
Local manufacturing
• Manufacturing of electric vehicles (including electrified public transport vehicles and scooters etc.) or vehicle parts (e.g. batteries)
• Manufacturing of bicycles • Manufacturing of charging equipment
• Manufacturing of combustion engine vehicles or vehicle parts (freight transport, private transport and combustion-engine based public transport)
Construction and Installation of transport infrastructure
• Installation of EV charging stations infrastructure
• Construction of electrified public transport infrastructure
• Construction of bike lanes
• Installation/deinstallation of gas station infrastructure
• Construction of conventional public transport infrastructure
Vehicle sales
• Wholesale of EVs (electric passenger cars, motorcycles, busses, vans)
• Wholesale of bicycles
• Wholesale of combustion engine vehicles (passenger cars, motorcycles, busses, vans)
Operation and Maintenance
• Operation & maintenance of EV charging infrastructure (including repair)
• Servicing and repair of electric vehicles (passenger cars, busses, vans, including vehicles for public transport)
• Operation & maintenance of gas stations
• Servicing and repair of combustion engine vehicles (passenger cars, busses, vans, including vehicles for public transport)
• Operation of public transport infrastructure (bus drivers, taxi drivers) • Maintenance of public transport infrastructure (e.g. cleaning staff)
Fuel or electricity supply for road transport
• Jobs generated in the electricity sector to cover additional electricity demand (àpart of electricity sector job analysis) o Electricity generation jobs to cover
additional electricity demand o Jobs related to general electricity
transmission and distribution o Jobs related to grid modernization,
establishing grid connection of charging infrastructure
• Jobs related to the supply of gas stations with diesel or gasoline (incl. related to imports)
Note: Grey – not relevant for Antigua and Barbuda or considered of minor relevance and beyond the scope of this analysis; Blue – jobs which are included in the analysis, however not quantified in the scenario analysis due to limited data availability.
For the quantitative analysis of job impacts, we derive empirical job factors from the available Antigua and Barbuda-specific data whenever possible and additionally build on insights from the literature and other countries. The following section provides a detailed overview on the underlying assumptions and calculation methodology used for the transport sector analysis.
44 Assuming a successful decarbonization of the electricity sector.
73
OVERVIEW ON ASSUMPTIONS AND AMPLOYMENT FACTORS USED – ROAD TRANSPORT
Table 8 details out the underlying assumptions and sources for the parameters used for the analysis. Table 8: Overview on methodological assumptions for the quantitative employment impact estimation for road transportation in Antigua and Barbuda
Job category Methodology and assumptions for employment impact estimation
General assumptions
Assumptions on type of EV charging stations
For newly installed charging infrastructure, we differentiate between three different types of charging infrastructure types:
• Home chargers: We assume that in 2020 for every new personal EV sold, a home charging station will be installed, reflecting that 100% of EV owners are likely homeowners that install their own private home charger. We assume that this share will decrease over time when the available additional charging infrastructure increases and also non-homeowners purchase EVs. For this we assume that the ratio of home chargers to EVs to decrease linearly to 0.7:1 in 2050. This assumption has been confirmed in expert interviews. We assume all home chargers to be of regular speed (3.7-22kW).
• Work charging stations: We assume that for every ten personal, commercial and public EVs one work charging station is installed (ratio EV to work charger 10:1). We assume all work chargers to be of regular speed (3.7-22kW).
• Public parking charging stations: We assume that for every ten personal, commercial and public EVs one public charging station is installed (ratio EV to work charger 10:1). We assume that 10% of public parking chargers installed are fast chargers (50kW, ‘type 3’), while 90% are regular speed (‘type 2’, £22kW).
• A sensitivity analysis with more conservative assumptions on the number of installed chargers is presented in Figure 27. The sensitivity analysis reduces the ratio of EVs to work chargers to 20:1, the ratio of EVs to public chargers to 20:1 and the ratio of home chargers to EVs to 0.5:1 in 2050.
Categorization on vehicles
• We assume that busses and vans are ‘commercial and public transportation’ and passenger cars, pick-ups and SUVs are ‘personal transportation’. Motorcycles and scooters are not included in the analysis.
Local manufacturing
Jobs in local manufacturing of transport-related technology parts (batteries, charging equipment, vehicle manufacturing, etc.) are considered not relevant for Antigua and Barbuda.
Construction and Installation of transport infrastructure
Jobs in installation of EV charging stations infrastructure
• We approximate the number of jobs in installation of charging stations based on the number of newly added charging stations of each type (see ‘general assumptions’ under ‘type of EV charging stations’) in each period multiplied with a job factor derived from expert consultation:
o Home chargers, work chargers and public chargers of regular speed (type 2, £22KW): We assume that for the installation of a regular speed charger (home charger, work or public parking) 3 workers need about one day each to install one new charger. Assuming that a work year has 240 work days, this results in one
74
worker (full-time equivalent) installing 80 regular speed chargers per year. We assume a productivity increase by 25% until 2030, resulting in one worker (full-time equivalent) installing 100 regular chargers per year. After 2030, productivity increases are offset by more demanding installation requirements (e.g. due to remoteness).
o Fast chargers (type 3, 50kW): Installing fast chargers is typically more work intensive as more electrical and civil work is required to installed the required electrical infrastructure for fast charging. We assume that 3 workers need 2 days each to install one fast charger. Assuming that a work year has 240 work days, this results in one worker (full-time equivalent) installing 40 fast chargers per year. We assume a productivity increase by 25% until 2030, resulting in one worker (full-time equivalent) installing 50 fast chargers per year. After 2030, productivity increases are offset by more demanding installation requirements (e.g. due to remoteness).
• Additional backoffice jobs: We assume an additional full-time equivalent job for every 100 charger installations (independent of charger type) to account for related tasks (administering bills, adding costumers to network, etc.).
Jobs in installation of gas station infrastructure
• Based on expert consultation, we assume that no additional gas stations will be built in none of the investigated scenarios.
Jobs in deinstallation of gas station infrastructure
• As the complete phase out of combustion engine vehicles from the car fleet is a long process, we make the conservative assumption that job generation from deinstalling the existing gas station infrastructure is negligible for our analysis.
Vehicle sales
Wholesale of EVs or combustion engine vehicles for personal transportation
• The number of jobs in car dealerships is derived based on data on vehicle sales of personal transport vehicles and estimates45 on current jobs related to vehicle sales. We then apply the derived multipliers to the scenario data on vehicle sales, assuming that this ratio is not affected by the type of engine (combustion-based or electric) that is inside the vehicles that are sold. This assumption has been confirmed in expert interviews. Based on the scenario data information differentiating between EVs and ICEVs, we can assign the jobs to the ‘low carbon transport’ or ‘combustion-engine-based transport’ categorization.
• The derived factor results in 1 employee in sales for every 82 vehicles sold (applied to both ICEV and EV sales). We assume a minimum of 1 job in EV sales if the amount of EVs sold is greater than 0 for a given year.
• We neglect sales in vehicles for public transport or commercial transport as a simplifying assumption.
Operation and Maintenance
Operation/maintenance of EV charging infrastructure
• Operation of charging points: The number of jobs is approximated by the number of public charging stations that can on average be operated by a single employee. It is then multiplied with the calculated number of total charging points needed (see assumptions on charging point type above). We assume that one employee for the operation of 226 public chargers is needed, based on an analysis of the European Association of Electrical Contractors. This factor has been confirmed as reasonable by local experts.
45 Missing data is imputed based on averages from obtained data.
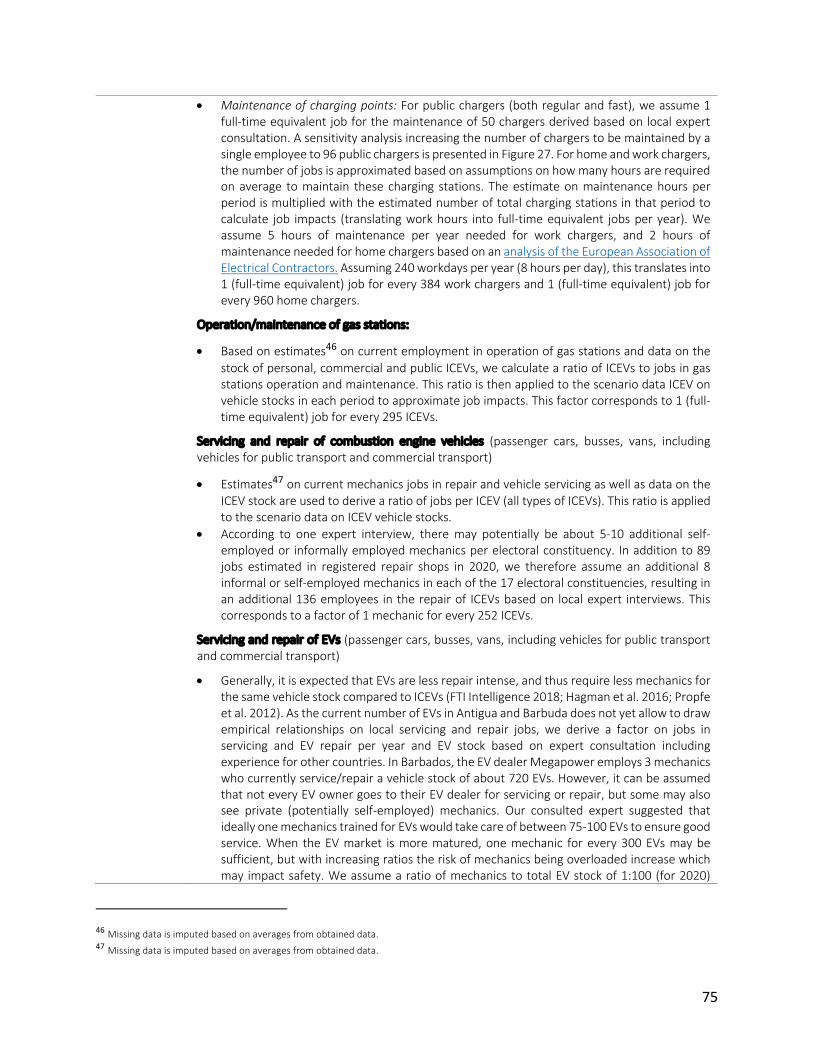
75
• Maintenance of charging points: For public chargers (both regular and fast), we assume 1 full-time equivalent job for the maintenance of 50 chargers derived based on local expert consultation. A sensitivity analysis increasing the number of chargers to be maintained by a single employee to 96 public chargers is presented in Figure 27. For home and work chargers, the number of jobs is approximated based on assumptions on how many hours are required on average to maintain these charging stations. The estimate on maintenance hours per period is multiplied with the estimated number of total charging stations in that period to calculate job impacts (translating work hours into full-time equivalent jobs per year). We assume 5 hours of maintenance per year needed for work chargers, and 2 hours of maintenance needed for home chargers based on an analysis of the European Association of Electrical Contractors. Assuming 240 workdays per year (8 hours per day), this translates into 1 (full-time equivalent) job for every 384 work chargers and 1 (full-time equivalent) job for every 960 home chargers.
Operation/maintenance of gas stations:
• Based on estimates46 on current employment in operation of gas stations and data on the stock of personal, commercial and public ICEVs, we calculate a ratio of ICEVs to jobs in gas stations operation and maintenance. This ratio is then applied to the scenario data ICEV on vehicle stocks in each period to approximate job impacts. This factor corresponds to 1 (full-time equivalent) job for every 295 ICEVs.
Servicing and repair of combustion engine vehicles (passenger cars, busses, vans, including vehicles for public transport and commercial transport)
• Estimates47 on current mechanics jobs in repair and vehicle servicing as well as data on the ICEV stock are used to derive a ratio of jobs per ICEV (all types of ICEVs). This ratio is applied to the scenario data on ICEV vehicle stocks.
• According to one expert interview, there may potentially be about 5-10 additional self-employed or informally employed mechanics per electoral constituency. In addition to 89 jobs estimated in registered repair shops in 2020, we therefore assume an additional 8 informal or self-employed mechanics in each of the 17 electoral constituencies, resulting in an additional 136 employees in the repair of ICEVs based on local expert interviews. This corresponds to a factor of 1 mechanic for every 252 ICEVs.
Servicing and repair of EVs (passenger cars, busses, vans, including vehicles for public transport and commercial transport)
• Generally, it is expected that EVs are less repair intense, and thus require less mechanics for the same vehicle stock compared to ICEVs (FTI Intelligence 2018; Hagman et al. 2016; Propfe et al. 2012). As the current number of EVs in Antigua and Barbuda does not yet allow to draw empirical relationships on local servicing and repair jobs, we derive a factor on jobs in servicing and EV repair per year and EV stock based on expert consultation including experience for other countries. In Barbados, the EV dealer Megapower employs 3 mechanics who currently service/repair a vehicle stock of about 720 EVs. However, it can be assumed that not every EV owner goes to their EV dealer for servicing or repair, but some may also see private (potentially self-employed) mechanics. Our consulted expert suggested that ideally one mechanics trained for EVs would take care of between 75-100 EVs to ensure good service. When the EV market is more matured, one mechanic for every 300 EVs may be sufficient, but with increasing ratios the risk of mechanics being overloaded increase which may impact safety. We assume a ratio of mechanics to total EV stock of 1:100 (for 2020)
46 Missing data is imputed based on averages from obtained data. 47 Missing data is imputed based on averages from obtained data.

76
which decreases linearly to 1:300 until 2050. A sensitivity analysis assuming a more conservative ratio of 1:200 in 2020 decreasing to 1:400 in 2050 is presented in Figure 28.
Operation of public transport infrastructure (bus drivers and taxis)
• Employment impacts for bus drivers and taxi drivers are not quantified.
Fuel or electricity supply for road transport
Jobs generated in the electricity sector to cover additional electricity demand
• These jobs are calculated as part of the electricity sector analysis. Employment factor relevant to jobs in electricity transmission and distribution are applied. Job implications related to grid modernization and sector coupling are discussed based on expert consultations.
Jobs related to the supply of gas stations with diesel or gasoline including fuel imports for transportation
• We use the most recent available data (2016) on total fuel imports from WIOC to determine the relative shares of fuels for transport (i.e. motor gasoline, diesel and ultra-low sulphur diesel) in all fuel imports (33%). Based on local employment data in fossil fuel imports (in 2020) and the fleet of ICEVs (including personal, public and commercial vehicles) in the same year, we derive an empirical job multiplier for fuel supply for road transport. The derived job factor corresponds to 1 (full-time equivalent) job for every 1716 ICEVs. No decline factor is applied.
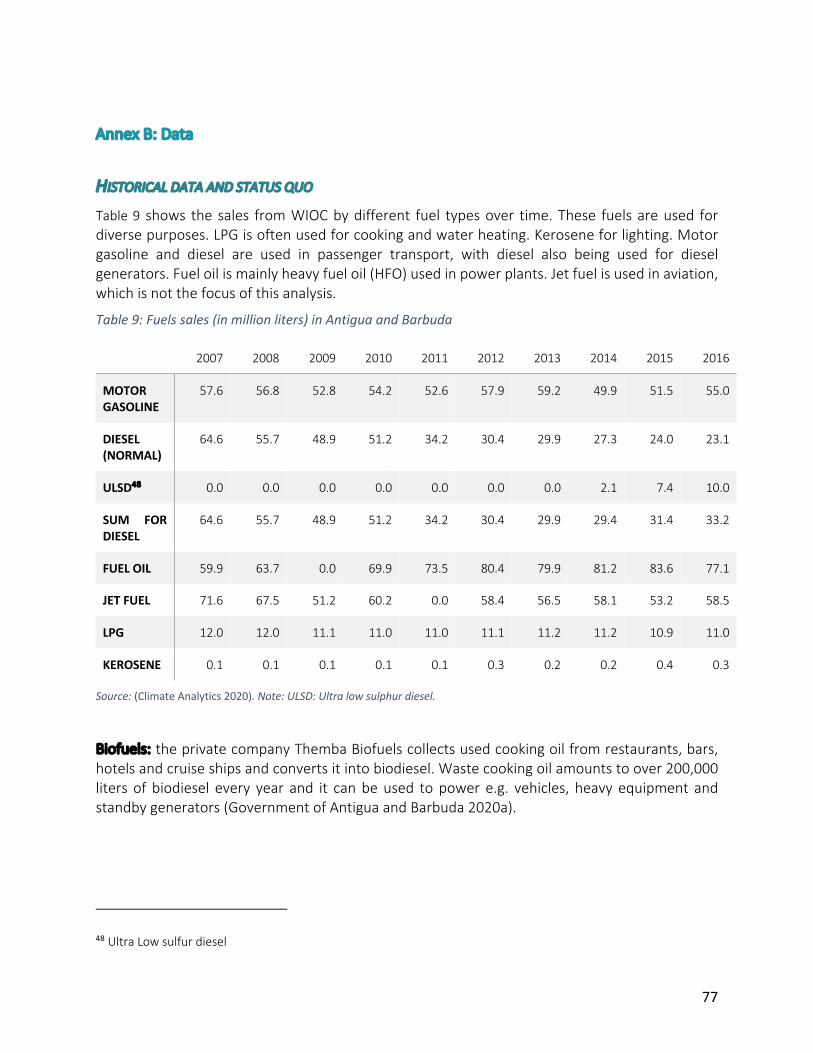
77
Annex B: Data
HISTORICAL DATA AND STATUS QUO
Table 9 shows the sales from WIOC by different fuel types over time. These fuels are used for diverse purposes. LPG is often used for cooking and water heating. Kerosene for lighting. Motor gasoline and diesel are used in passenger transport, with diesel also being used for diesel generators. Fuel oil is mainly heavy fuel oil (HFO) used in power plants. Jet fuel is used in aviation, which is not the focus of this analysis.
Table 9: Fuels sales (in million liters) in Antigua and Barbuda
2007 2008 2009 2010 2011 2012 2013 2014 2015 2016
MOTOR GASOLINE
57.6 56.8 52.8 54.2 52.6 57.9 59.2 49.9 51.5 55.0
DIESEL (NORMAL)
64.6 55.7 48.9 51.2 34.2 30.4 29.9 27.3 24.0 23.1
ULSD48 0.0 0.0 0.0 0.0 0.0 0.0 0.0 2.1 7.4 10.0
SUM FOR DIESEL
64.6 55.7 48.9 51.2 34.2 30.4 29.9 29.4 31.4 33.2
FUEL OIL 59.9 63.7 0.0 69.9 73.5 80.4 79.9 81.2 83.6 77.1
JET FUEL 71.6 67.5 51.2 60.2 0.0 58.4 56.5 58.1 53.2 58.5
LPG 12.0 12.0 11.1 11.0 11.0 11.1 11.2 11.2 10.9 11.0
KEROSENE 0.1 0.1 0.1 0.1 0.1 0.3 0.2 0.2 0.4 0.3
Source: (Climate Analytics 2020). Note: ULSD: Ultra low sulphur diesel.
Biofuels: the private company Themba Biofuels collects used cooking oil from restaurants, bars, hotels and cruise ships and converts it into biodiesel. Waste cooking oil amounts to over 200,000 liters of biodiesel every year and it can be used to power e.g. vehicles, heavy equipment and standby generators (Government of Antigua and Barbuda 2020a).
48 Ultra Low sulfur diesel
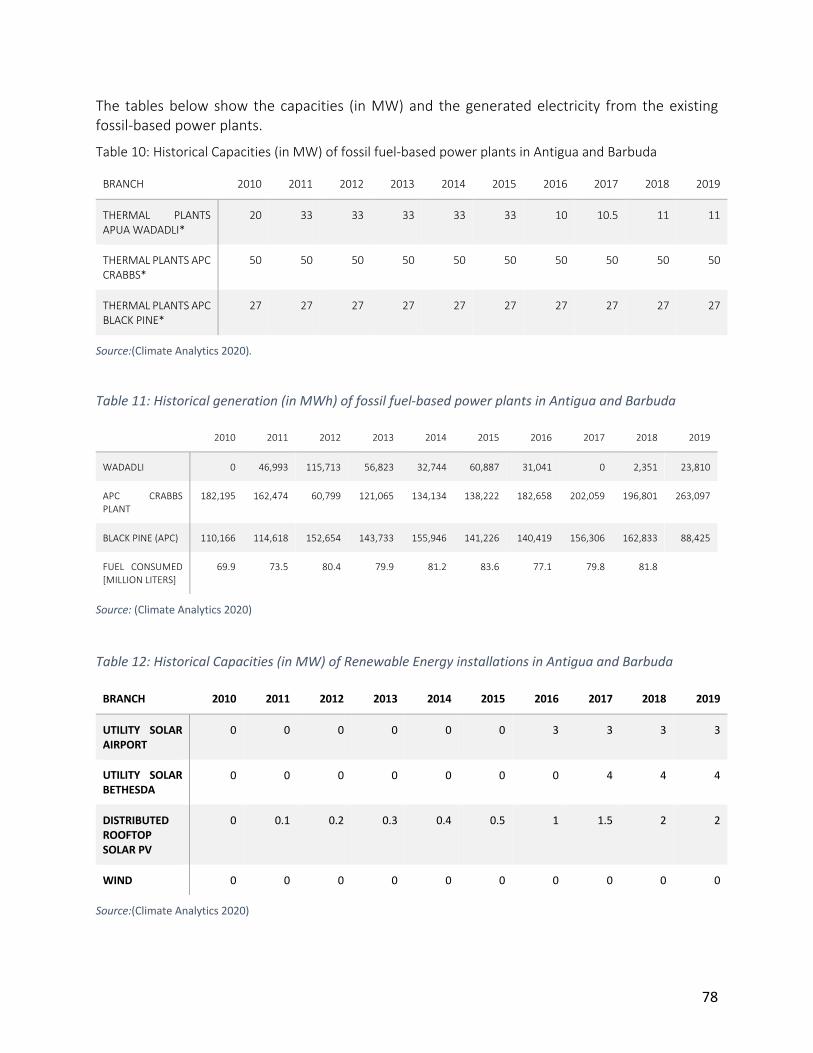
78
The tables below show the capacities (in MW) and the generated electricity from the existing fossil-based power plants.
Table 10: Historical Capacities (in MW) of fossil fuel-based power plants in Antigua and Barbuda
BRANCH 2010 2011 2012 2013 2014 2015 2016 2017 2018 2019
THERMAL PLANTS APUA WADADLI*
20 33 33 33 33 33 10 10.5 11 11
THERMAL PLANTS APC CRABBS*
50 50 50 50 50 50 50 50 50 50
THERMAL PLANTS APC BLACK PINE*
27 27 27 27 27 27 27 27 27 27
Source:(Climate Analytics 2020).
Table 11: Historical generation (in MWh) of fossil fuel-based power plants in Antigua and Barbuda
2010 2011 2012 2013 2014 2015 2016 2017 2018 2019
WADADLI 0 46,993 115,713 56,823 32,744 60,887 31,041 0 2,351 23,810
APC CRABBS PLANT
182,195 162,474 60,799 121,065 134,134 138,222 182,658 202,059 196,801 263,097
BLACK PINE (APC) 110,166 114,618 152,654 143,733 155,946 141,226 140,419 156,306 162,833 88,425
FUEL CONSUMED [MILLION LITERS]
69.9 73.5 80.4 79.9 81.2 83.6 77.1 79.8 81.8
Source: (Climate Analytics 2020)
Table 12: Historical Capacities (in MW) of Renewable Energy installations in Antigua and Barbuda
BRANCH 2010 2011 2012 2013 2014 2015 2016 2017 2018 2019
UTILITY SOLAR AIRPORT
0 0 0 0 0 0 3 3 3 3
UTILITY SOLAR BETHESDA
0 0 0 0 0 0 0 4 4 4
DISTRIBUTED ROOFTOP SOLAR PV
0 0.1 0.2 0.3 0.4 0.5 1 1.5 2 2
WIND 0 0 0 0 0 0 0 0 0 0
Source:(Climate Analytics 2020)
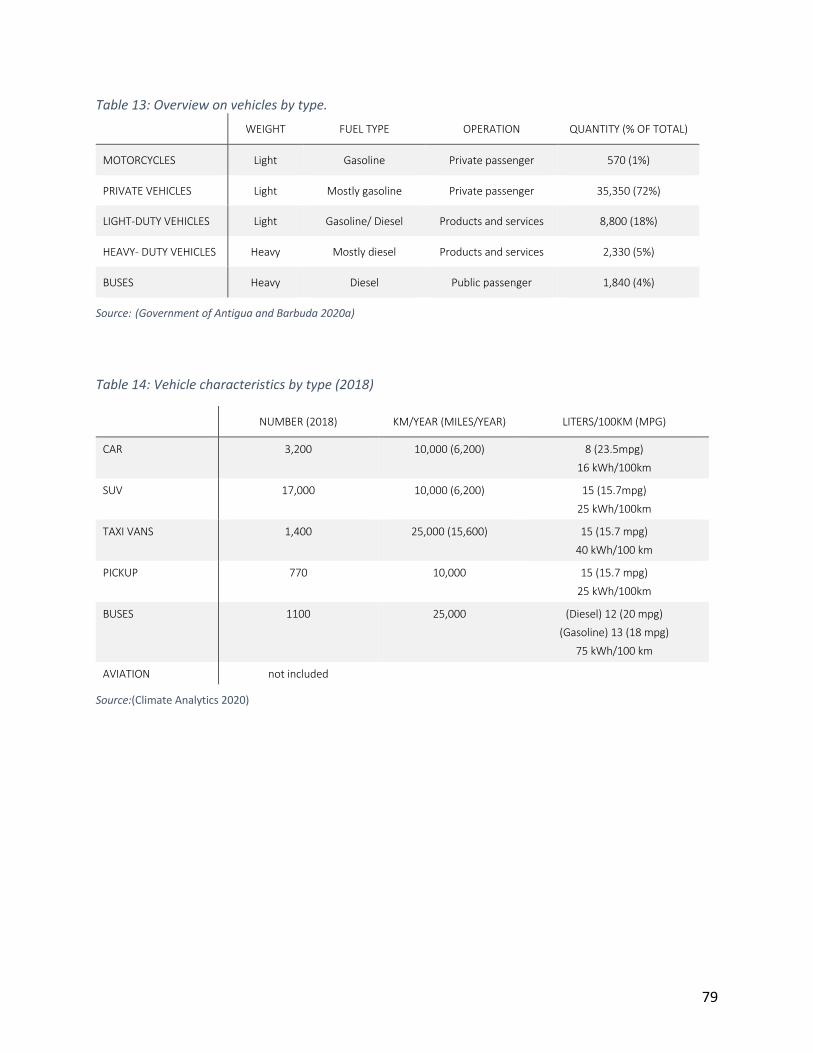
79
Table 13: Overview on vehicles by type.
WEIGHT FUEL TYPE OPERATION QUANTITY (% OF TOTAL)
MOTORCYCLES Light Gasoline Private passenger 570 (1%)
PRIVATE VEHICLES Light Mostly gasoline Private passenger 35,350 (72%)
LIGHT-DUTY VEHICLES Light Gasoline/ Diesel Products and services 8,800 (18%)
HEAVY- DUTY VEHICLES Heavy Mostly diesel Products and services 2,330 (5%)
BUSES Heavy Diesel Public passenger 1,840 (4%)
Source: (Government of Antigua and Barbuda 2020a)
Table 14: Vehicle characteristics by type (2018)
NUMBER (2018) KM/YEAR (MILES/YEAR) LITERS/100KM (MPG)
CAR 3,200 10,000 (6,200) 8 (23.5mpg)
16 kWh/100km
SUV 17,000 10,000 (6,200) 15 (15.7mpg)
25 kWh/100km
TAXI VANS 1,400 25,000 (15,600) 15 (15.7 mpg)
40 kWh/100 km
PICKUP 770 10,000 15 (15.7 mpg)
25 kWh/100km
BUSES 1100 25,000 (Diesel) 12 (20 mpg)
(Gasoline) 13 (18 mpg)
75 kWh/100 km
AVIATION not included
Source:(Climate Analytics 2020)

80
Figure 24: Map with gas stations and Electric vehicle (EV) charging station in Antigua. Source: Department of Environment.
GAS STATIONS IN ANTIGUA
l
l
l
l
l
l
l
l
l l
l
l
l
ll
l
l
l
ll
ll
l
l
l
ll
l
l
l
l
d
d
d
d
d
d
Swetes
Bolans
Parham
Bendals
Urlings
Jennings
Old Road
Freetown
Cades Bay
Willikies
All Saints
Falmouth
St. John's
John Hughes
General Reference Map Showing Locations ofGas Stations, Fuel Docks, and EV Charging Stations in Antigua.
Published by the Department of Environment, Government of Antigua & BarbudaCreated by Janeil Johnston, 21 August 2020
0 5.5 112.75Km
#DOE/ATG/107
This map is for information purposes only and is not suitable for legal, engineering, or surveyingpurposes. Data sourced from the Environmental Information Management & Advisory System (EIMAS) and/or data points collected in the field using GPS Technology.
Base Map: EIMAS.
oCoordinate System: WGS 1984 UTM Zone 20NProjection: Transverse MercatorDatum: WGS 1984False Easting: 500,000.0000False Northing: 0.0000Central Meridian: -63.0000Scale Factor: 0.9996Latitude Of Origin: 0.0000Units: Meter
LegendMajor Roads
Parish Boundaries
Gas Stationsl Gas Station
l Fuel Dock
EV Charging Stationd Public
d Private
d Government

81
SCENARIO DATA
See excel file (submitted together with report, available upon request for readers) for the information on
• Capacities • Vehicle stocks • Employment estimates
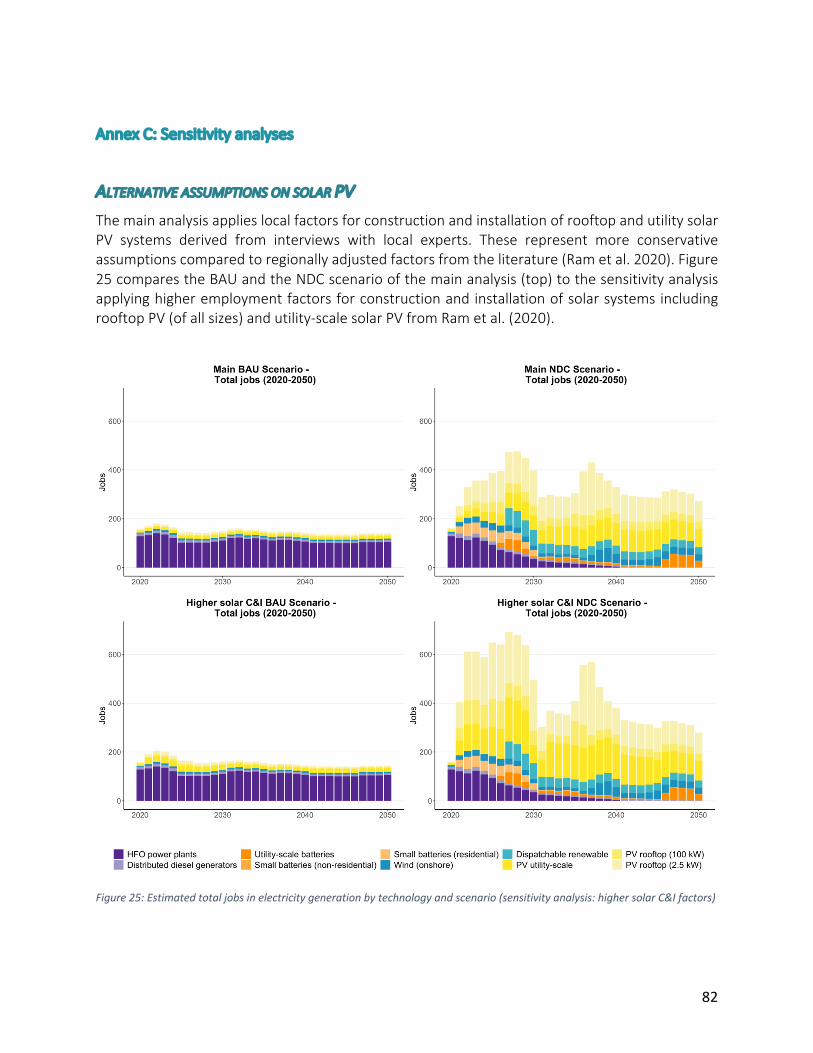
82
Annex C: Sensitivity analyses
ALTERNATIVE ASSUMPTIONS ON SOLAR PV
The main analysis applies local factors for construction and installation of rooftop and utility solar PV systems derived from interviews with local experts. These represent more conservative assumptions compared to regionally adjusted factors from the literature (Ram et al. 2020). Figure 25 compares the BAU and the NDC scenario of the main analysis (top) to the sensitivity analysis applying higher employment factors for construction and installation of solar systems including rooftop PV (of all sizes) and utility-scale solar PV from Ram et al. (2020).
Figure 25: Estimated total jobs in electricity generation by technology and scenario (sensitivity analysis: higher solar C&I factors)

83
ALTERNATIVE ASSUMPTIONS ON FOSSIL-BASED THERMAL POWER PLANTS O&M
The main analysis applies local factors for operation and maintenance of HFO-based power plants, derived from current data on electricians employed in Blackpine power plant. The local factors result in higher job factors compared with regionally adjusted factors from the literature (Ram et al. 2020). Figure 26 compares the BAU and the NDC scenario of the main analysis (top) to the sensitivity analysis applying lower employment factors for O&M of large HFO-based power plants.
Figure 26: Estimated total jobs in electricity generation by technology and scenario (sensitivity analysis: lower HFO O&M factors)
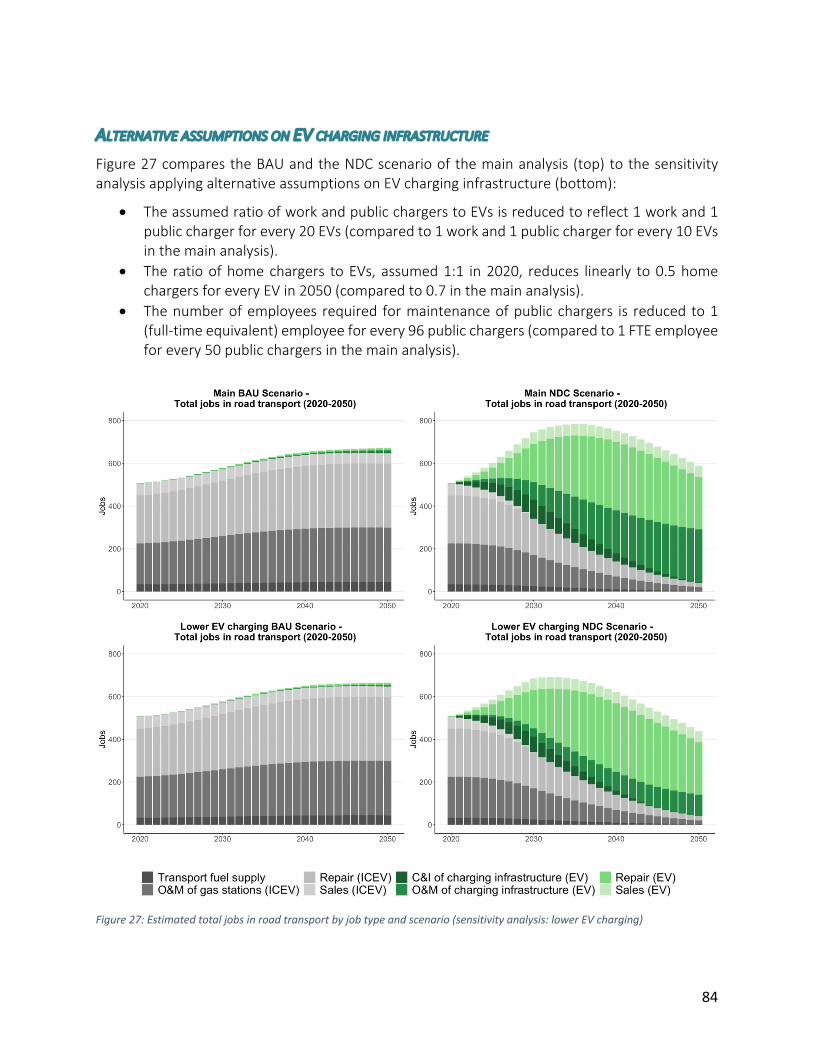
84
ALTERNATIVE ASSUMPTIONS ON EV CHARGING INFRASTRUCTURE
Figure 27 compares the BAU and the NDC scenario of the main analysis (top) to the sensitivity analysis applying alternative assumptions on EV charging infrastructure (bottom):
• The assumed ratio of work and public chargers to EVs is reduced to reflect 1 work and 1 public charger for every 20 EVs (compared to 1 work and 1 public charger for every 10 EVs in the main analysis).
• The ratio of home chargers to EVs, assumed 1:1 in 2020, reduces linearly to 0.5 home chargers for every EV in 2050 (compared to 0.7 in the main analysis).
• The number of employees required for maintenance of public chargers is reduced to 1 (full-time equivalent) employee for every 96 public chargers (compared to 1 FTE employee for every 50 public chargers in the main analysis).
Figure 27: Estimated total jobs in road transport by job type and scenario (sensitivity analysis: lower EV charging)
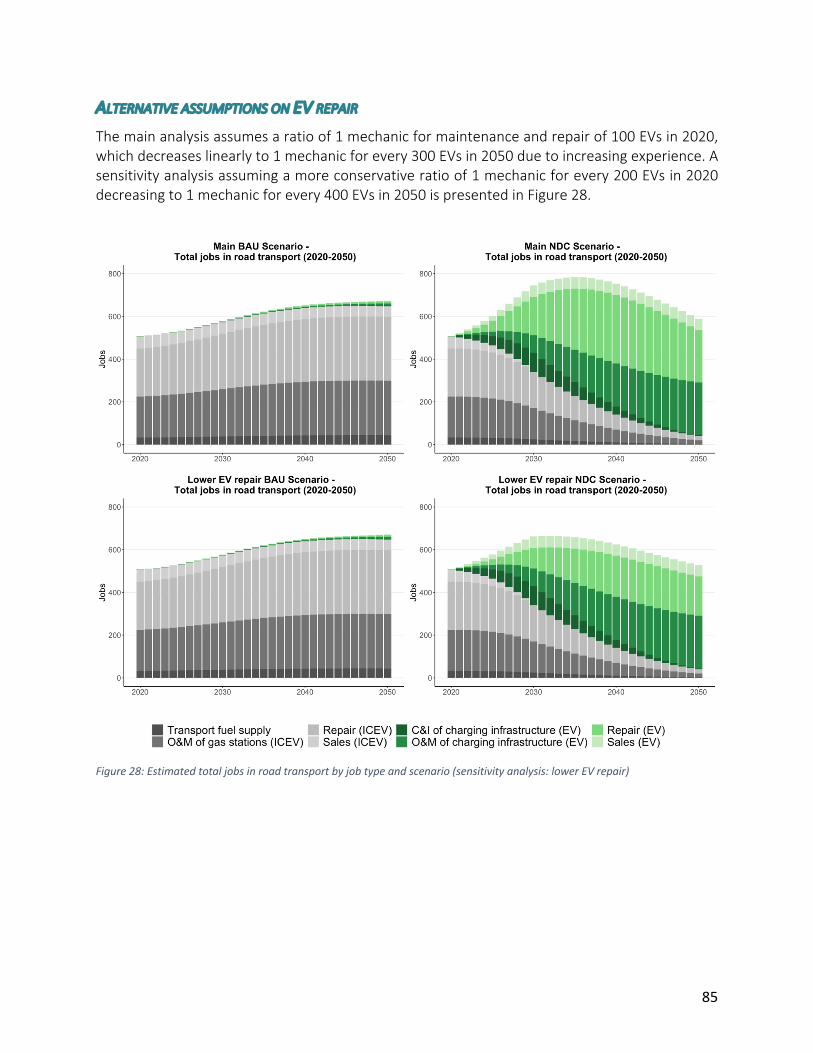
85
ALTERNATIVE ASSUMPTIONS ON EV REPAIR
The main analysis assumes a ratio of 1 mechanic for maintenance and repair of 100 EVs in 2020, which decreases linearly to 1 mechanic for every 300 EVs in 2050 due to increasing experience. A sensitivity analysis assuming a more conservative ratio of 1 mechanic for every 200 EVs in 2020 decreasing to 1 mechanic for every 400 EVs in 2050 is presented in Figure 28.
Figure 28: Estimated total jobs in road transport by job type and scenario (sensitivity analysis: lower EV repair)
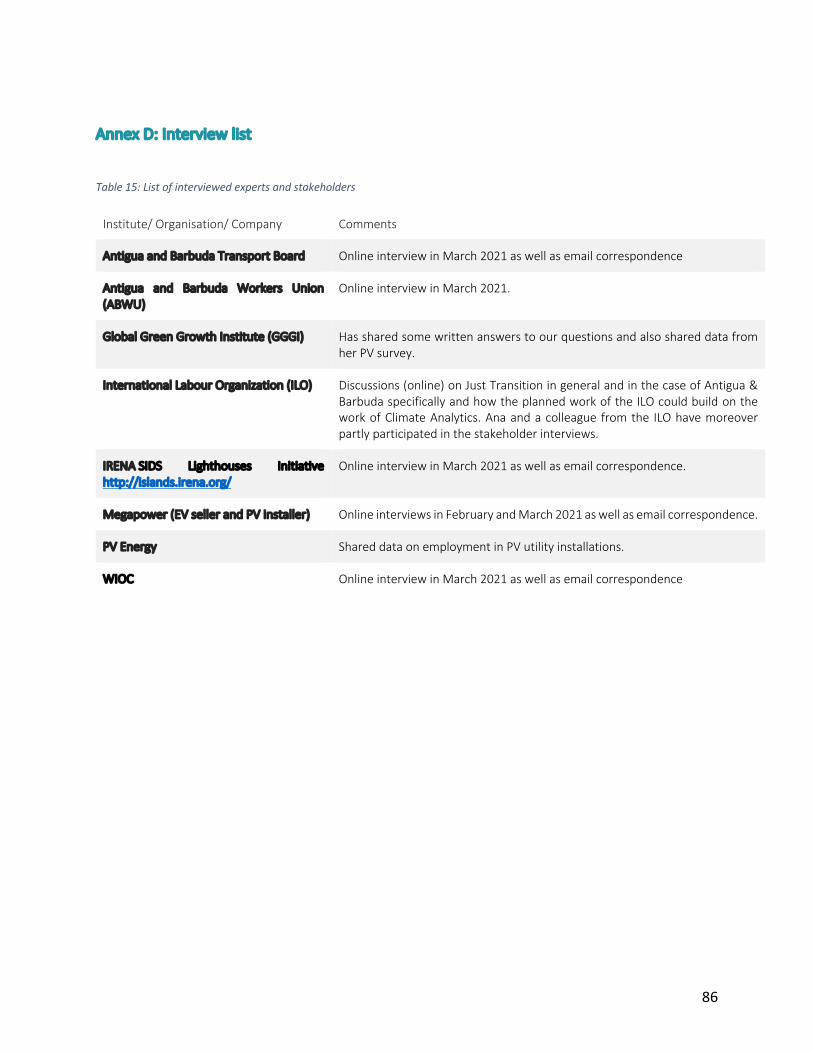
86
Annex D: Interview list
Table 15: List of interviewed experts and stakeholders
Institute/ Organisation/ Company Comments
Antigua and Barbuda Transport Board Online interview in March 2021 as well as email correspondence
Antigua and Barbuda Workers Union (ABWU)
Online interview in March 2021.
Global Green Growth Institute (GGGI) Has shared some written answers to our questions and also shared data from her PV survey.
International Labour Organization (ILO) Discussions (online) on Just Transition in general and in the case of Antigua & Barbuda specifically and how the planned work of the ILO could build on the work of Climate Analytics. Ana and a colleague from the ILO have moreover partly participated in the stakeholder interviews.
IRENA SIDS Lighthouses Initiative http://islands.irena.org/
Online interview in March 2021 as well as email correspondence.
Megapower (EV seller and PV installer) Online interviews in February and March 2021 as well as email correspondence.
PV Energy Shared data on employment in PV utility installations.
WIOC Online interview in March 2021 as well as email correspondence
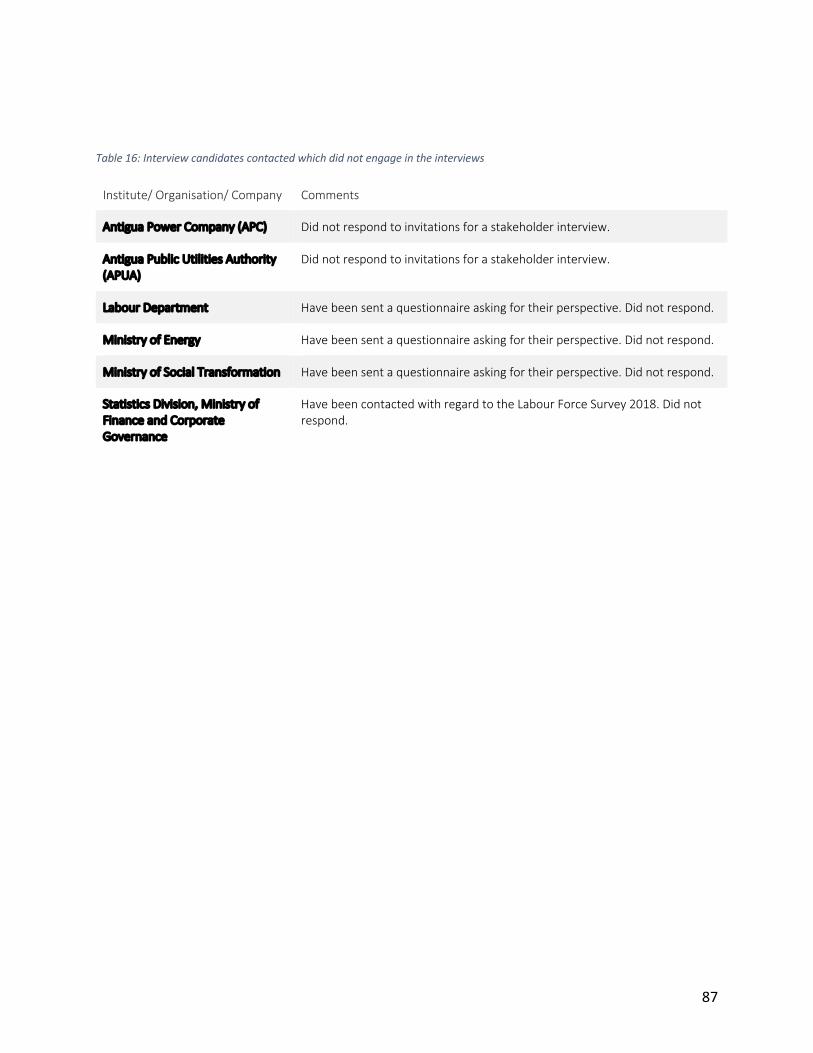
87
Table 16: Interview candidates contacted which did not engage in the interviews
Institute/ Organisation/ Company Comments
Antigua Power Company (APC) Did not respond to invitations for a stakeholder interview.
Antigua Public Utilities Authority (APUA)
Did not respond to invitations for a stakeholder interview.
Labour Department Have been sent a questionnaire asking for their perspective. Did not respond.
Ministry of Energy Have been sent a questionnaire asking for their perspective. Did not respond.
Ministry of Social Transformation Have been sent a questionnaire asking for their perspective. Did not respond.
Statistics Division, Ministry of Finance and Corporate Governance
Have been contacted with regard to the Labour Force Survey 2018. Did not respond.

88
6. References
Briggs, Chris, Jay Rutovitz, Elsa Dominish, and Kriti Nagrath. 2020. Prepared for the Clean Energy Council by the Institute for Sustainable Futures, University of Technology Sydney Renewable Energy Jobs in Australia - Stage One. https://www.uts.edu.au/research-and-teaching/our-research/institute-sustainable-futures/our-research/energy-futures/renewable-energy-employment-australia (March 29, 2021).
Cameron, Lachlan, and Bob van der Zwaan. 2015. “Employment Factors for Wind and Solar Energy Technologies: A Literature Review.” Renewable and Sustainable Energy Reviews 45: 160–72. https://www.sciencedirect.com/science/article/pii/S1364032115000118 (September 11, 2018).
Caribbean Development Bank. 2018. Country Economic Review: Antigua and Barbuda. https://www.caribank.org/sites/default/files/publication-resources/CDB Economic Brief 2018 - Antigua and Barbuda_0.pdf.
CIA World Factbook. 2020. “CIA World Factbook - Antigua and Barbuda.” https://www.cia.gov/library/publications/the-world-factbook/geos/ac.html (August 19, 2020).
Climate Analytics. 2020. Antigua and Barbuda’s National Greenhouse Gas Reduction Report.
Department of Environment. 2020a. 04 [Draft] Socio-Economic Impact of Electricity Costs in Antigua and Barbuda.
———. 2020b. GUIDANCE NOTE ON THE JUST TRANSITION OF THE WORKFORCE.
Department of Environment of Antigua and Barbuda - Project Management Unit. 2021. NATIONAL GENDER ASSESSMENT SURVEY: THE ECONOMIC IMPACT OF CLIMATE CHANGE ON MEN AND WOMEN IN ANTIGUA AND BARBUDA.
Dominish, Elsa, Chris Briggs, Sven Teske, and Franziska Mey. 2019. “Just Transition: Employment Projections for the 2.0 °C and 1.5 °C Scenarios.” In Achieving the Paris Climate Agreement Goals, Cham: Springer International Publishing, 413–35. http://link.springer.com/10.1007/978-3-030-05843-2_10 (February 5, 2019).
ECCB. 2020. “Contribution of Gross Domestic Product by Economic Activity in Constant Prices In Percentage (%).” https://www.eccb-centralbank.org/statistics/gdp-datas/country-report/6.
European Commission. 2017. Better Regulation Toolbox. https://ec.europa.eu/info/sites/info/files/better-regulation-toolbox_2.pdf (November 5, 2020).
FTI Intelligence. 2018. IMPACT OF ELECTRICALLY CHARGEABLE VEHICLES ON JOBS AND GROWTH

89
IN THE EU Particular Focus on the EU Automotive Manufacturing and Value Chain. https://www.fticonsulting.com/~/media/Files/us-files/intelligence/intelligence-research/impact-electrically-chargeable-vehicles-jobs-growth-eu.pdf.
Global Green Growth Institute. 2021. Acceptability and Affordability of Renewable Energy Household Survey Report.
Government of Antigua and Barbuda. 2018. Antigua and Barbuda 2015 Labour Force Survey Report - Statistics Division. https://statistics.gov.ag/wp-content/uploads/2018/11/2015-Antigua-and-Barbuda-LFS-Report.pdf.
———. 2020a. Antigua and Barbuda’s First Biennial Update Report.
———. 2020b. Antigua and Barbuda 2018 Labour Force Survey Report. https://statistics.gov.ag/wp-content/uploads/2020/10/2018-Antigua-and-Barbuda-LFS-Report.pdf (November 5, 2020).
Hagman, Jens, Sofia Ritzén, Jenny Janhager Stier, and Yusak Susilo. 2016. “Total Cost of Ownership and Its Potential Implications for Battery Electric Vehicle Diffusion.” Research in Transportation Business and Management 18: 11–17.
ILO. 2015. Guidelines for a Just Transition towards Environmentally Sustainable Economies and Societies for All. https://www.ilo.org/wcmsp5/groups/public/---ed_emp/---emp_ent/documents/publication/wcms_432859.pdf (November 5, 2020).
———. 2017. Greening with Jobs. How to Measure and Model Social and Employment Outcomes of Climate and Sustainable Development Policies. https://www.ilo.org/wcmsp5/groups/public/---ed_emp/documents/publication/wcms_613934.pdf (November 5, 2020).
———. 2019. A Quantum Leap For Gender Equality: For a Better Future of Work For All. www.ilo.org/publns.
Inter-American Development Bank. 2015. Challenges and Opportunities for the Energy Sector in the Eastern Caribbean: Antigua and Barbuda Energy Dossier.
International Labour Organization. 2018. “Just Transition towards Environmentally Sustainable Economies and Societies for All - ILO ACTRAV Policy Brief.” American Journal of Political Science.
IRENA. 2019. Resolving Cyprus Renewable Energy: A Gender Perspective. https://www.irena.org/publications/2019/Jan/Renewable-Energy-A-Gender-Perspective.
———. 2020. Measuring the Socio-Economics of Transition: Focus on Jobs. https://www.irena.org/-/media/Files/IRENA/Agency/Publication/2020/Feb/IRENA_Transition_jobs_2020.pdf (November 5, 2020).
———. 2021. Antigua and Barbuda: Renewable Energy Roadmap. Abu Dhabi: International Renewable Energy Agency. https://www.irena.org/publications/2021/March/Antigua-and-Barbuda-Renewable-Energy-Roadmap.

90
James, Ronald et al. 2019. “Explaining High Unemployment in ECCU Countries.” IMF Working Papers 19(144): 1.
Lashley, Jonathan G.; et al. 2015. “Youth Are the Future the Imperative of Youth Employment for Sustainable Development in the Caribbean.” (October). http://www.caribank.org/wp-content/uploads/2015/05/Youth-Study-Imperative-of-Employment-CDB-2015.pdf.
Masdar. 2020. “Construction Begins on Hurricane-Resistant Clean Energy Power Plant in Antigua and Barbuda under US$50m UAE-Caribbean Renewable Energy Fund.” 29 Sep 2020. https://news.masdar.ae/en/news/2020/09/30/08/41/construction-begins-on-hurricane-resistant-clean-energy-power-plant-in-antigua-and-barbuda (June 2, 2021).
Meyer, Ina, and Mark Wolfgang. 2014. Employment Effects of Renewable Energy Supply: A Meta Analysis.
Ministry of Finance and Corporate Governance. 2020. “Medium Term Fiscal Strategy 2021-2023.”
Mooney, Henry, and María Alejandra Zegarra. 2020. “Extreme Outlier: The Pandemic’s Unprecedented Shock to Tourism in Latin America and the Caribbean.” COVID-19 in Developing Economies (June): 112–26.
Moreno, Blanca, and Ana Jesús López. 2008. “The Effect of Renewable Energy on Employment. The Case of Asturias (Spain).” Renewable and Sustainable Energy Reviews 12(3): 732–51.
Ng, Wei-Shiuen, and Ashley Acker. 2020. The Gender Dimension of the Transport Workforce. www.itf-oecd.org.
Oyewo, Ayobami Solomon et al. 2019. “Pathway towards Achieving 100% Renewable Electricity by 2050 for South Africa.” Solar Energy 191(September): 549–65. https://doi.org/10.1016/j.solener.2019.09.039.
Propfe, Bernd, Martin Redelbach, Danilo J. Santini, and Horst Friedrich. 2012. “Cost Analysis of Plug-in Hybrid Electric Vehicles Including Maintenance & Repair Costs and Resale Values.” World Electric Vehicle Journal 5(4): 886–95.
Ram, Manish, Arman Aghahosseini, and Christian Breyer. 2020. “Job Creation during the Global Energy Transition towards 100% Renewable Power System by 2050.” Technological Forecasting and Social Change 151: 119682. http://www.sciencedirect.com/science/article/pii/S0040162518314112.
Rutovitz, Jay, Chris Briggs, Elsa Dominish, and Kriti Nagrath. 2020. Renewable Energy Employment in Australia : Methodology. Prepared for the Clean Energy Council by the Institute for Sustainable Futures, University of Technology Sydney.
Rutovitz, Jay, Elsa Dominish, and Jenni Downes. 2015. Prepared for Greenpeace International by the Institute for Sustainable Futures (UTS) Calculating Global Energy Sector Jobs: 2015 Methodology Update.
Statistics Division, and Government of Antigua and Barbuda. 2014. “Antigua and Barbuda 2011 Population and Housing Census.” https://wedocs.unep.org/bitstream/handle/20.500.11822/9273/-Antigua and Barbuda:
91
2011 Population and Housing Census-2014Antigua and Barbuda_population census_2011.pdf?sequence=3&isAllowed=.
Statistics Division Ministry of Finance and Corporate Governance. 2017. “Population Projections by Age Group, Annual 1991-2026.” https://statistics.gov.ag/wp-content/uploads/2017/12/Population-Projections-by-Age-Group-Annual-1991-2026.xlsx.
Tambari, Ishaya T, Michael O Dioha, and Pierre Failler. 2020. “Renewable Energy Scenarios for Sustainable Electricity Supply in Nigeria.” Energy and Climate Change 1(July): 100017. https://doi.org/10.1016/j.egycc.2020.100017.
Teske (Editor), Sven. 2019. Achieving the Paris Climate Agreement Goals Achieving the Paris Climate Agreement Goals.
Tetra Tech ES. 2016. Comprehensive Assessment of the Antigua Public Utility Authority FINAL Consultancy on Antigua and Barbuda Roadmap to Improve Water and Energy Services.
UNDP. 2020. “Human Development Report 2020 Antigua and Barbuda.” http://hdr.undp.org/sites/all/themes/hdr_theme/country-notes/ATG.pdf (May 25, 2021).
WHO. 2014. Jobs in Green and Healthy Transport.
World Bank. 2020. “World Development Indicators | DataBank.” https://databank.worldbank.org/source/world-development-indicators (August 23, 2020).