Embed Size (px)
Citation preview

Basel III Pillar 3 Disclosures Report
For the Quarterly Period Ended December 31, 2015
BASEL III PILLAR 3 DISCLOSURES REPORT For the quarterly period ended December 31, 2015
Table of Contents Page
1 Morgan Stanley ..................................................................................................................................................... 1
2 Capital Framework ............................................................................................................................................... 1
3 Capital Structure ................................................................................................................................................... 2
4 Capital Adequacy .................................................................................................................................................. 2
5 Credit Risk ............................................................................................................................................................ 4
5.1 Credit Risk: General Disclosures .......................................................................................................................... 4
5.2 Credit Risk: General Disclosure for Impaired Loans ............................................................................................ 6
5.3 Portfolios Subject to Internal Ratings-Based Risk-Based Capital Formulas ........................................................ 7
5.4 General Disclosure for Wholesale Counterparty Credit Risk of Derivative Contracts, Repo-Style Transactions and Margin Lending ........................................................................................................................ 9
5.5 Credit Risk Mitigation .......................................................................................................................................... 13
6 Equities Not Subject to Market Risk Capital Rule ................................................................................................ 14
7 Securitization Exposures ....................................................................................................................................... 15
7.1 Accounting and Valuation .................................................................................................................................... 16
7.2 Securitization and Resecuritization Exposures in the Banking Book ................................................................... 16
7.3 Securitization and Resecuritization Exposures in the Trading Book .................................................................... 19
8 Interest Rate Risk Sensitivity Analysis ................................................................................................................. 20
9 Market Risk........................................................................................................................................................... 21
9.1 Model Methodology, Assumptions and Exposure Measures ................................................................................ 21
9.2 Model Limitations ................................................................................................................................................. 24
9.3 Model Validation .................................................................................................................................................. 24
9.4 Regulatory VaR Backtesting ................................................................................................................................ 25
9.5 Covered Positions ................................................................................................................................................. 25
9.6 Stress Testing of Covered Positions ...................................................................................................................... 25
10 Operational Risk ................................................................................................................................................... 26
11 Supplementary Leverage Ratio ............................................................................................................................. 26
12 Disclosure Map ..................................................................................................................................................... 30

MORGAN STANLEY
Basel III Pillar 3 Disclosures Report
For the Quarterly Period Ended December 31, 2015
1
1 Morgan Stanley Morgan Stanley is a global financial services firm that, through its subsidiaries and affiliates, provides a wide variety of products and services to a large and diversified group of clients and customers, including corporations, governments, financial institutions and individuals. Unless the context otherwise requires, the terms “Morgan Stanley” or the “Company” mean Morgan Stanley (the “Parent”) together with its consolidated subsidiaries. Morgan Stanley was originally incorporated under the laws of the State of Delaware in 1981, and its predecessor companies date back to 1924. The Company is a financial holding company under the Bank Holding Company Act of 1956, as amended (the “BHC Act”), and is subject to the regulation and oversight of the Board of Governors of the Federal Reserve System (the “Federal Reserve”). The Company conducts its business from its headquarters in and around New York City, its regional offices and branches throughout the United States of America (“U.S.”) and its principal offices in London, Tokyo, Hong Kong and other world financial centers. The basis of consolidation for accounting and regulatory purposes is materially the same. The Federal Reserve establishes capital requirements for the Company, including well-capitalized standards, and evaluates the Company’s compliance with such capital requirements. The Office of the Comptroller of the Currency (the “OCC”) establishes similar capital requirements and standards for the Company’s U.S. bank operating subsidiaries Morgan Stanley Bank, N.A. and Morgan Stanley Private Bank, National Association (collectively, “U.S. Bank Subsidiaries”). At December 31, 2015, the Company’s insurance subsidiaries surplus capital included in the total capital of the consolidated group was $28 million. At December 31, 2015, none of the Company’s subsidiaries had capital less than the minimum required capital amount. For descriptions of the Company’s business, see “Business” in Part I, Item 1 of the Company’s Annual Report on Form 10-K for the year ended December 31, 2015 (“2015 Form 10-K”). 2 Capital Framework In December 2010, the Basel Committee on Banking Supervision (“Basel Committee”) established a new risk-based capital, leverage ratio and liquidity framework, known as “Basel III.” In July 2013, the U.S. banking regulators issued a final rule to implement many aspects of Basel III (“U.S. Basel III”). Although the Company and its U.S. Bank Subsidiaries became subject to U.S. Basel III beginning on January 1, 2014, certain requirements of U.S. Basel III will be phased in over several years. On February 21, 2014, the Federal Reserve and the OCC approved the Company’s and its U.S. Bank Subsidiaries’ respective use of the U.S. Basel III advanced internal ratings-based approach for determining credit risk capital requirements and advanced measurement approaches for determining operational risk capital requirements to calculate and publicly disclose their risk-based capital ratios beginning with the second quarter of 2014, subject to the “capital floor” discussed below (the “Advanced Approach”). As a U.S. Basel III Advanced Approach banking organization, the Company is required to compute risk-based capital ratios using both (i) standardized approaches for calculating credit risk weighted assets (“RWAs”) and market risk RWAs (the “Standardized Approach”); and (ii) an advanced internal ratings-based approach for calculating credit risk RWAs, an advanced measurement approach for calculating operational risk RWAs, and an advanced approach for market risk RWAs calculated under Basel III. For a further discussion of the regulatory capital framework applicable to the Company, see “Management’s Discussion and Analysis of Financial Condition and Results of Operations (“MD&A”)—Liquidity and Capital Resources—Regulatory Requirements” in Part II, Item 7 of the 2015 Form 10-K. U.S. Basel III requires banking organizations that calculate risk-based capital ratios using the Advanced Approach, including the Company, to make qualitative and quantitative disclosures regarding their capital and RWAs on a quarterly basis (“Pillar 3 Disclosures”). This report contains the Company’s Pillar 3 Disclosures for its credit, market and operational risks for the quarter ended December 31, 2015, in accordance with the U.S. Basel III, 12 C.F.R. § 217.171 through 217.173 and 217.212. The Company’s Pillar 3 Disclosures are not required to be, and have not been, audited by the Company’s independent registered public accounting firm. The Company’s Pillar 3 Disclosures were based on its current understanding of U.S. Basel III and other factors, which may be subject to change as the Company receives additional clarification and implementation guidance from regulators relating to U.S. Basel III, and as the interpretation of the final rule evolves over time. Some measures of exposures contained in this report may not be consistent with accounting principles generally accepted in the U.S. (“U.S. GAAP”), and may not be comparable with measures reported in the 2015 Form 10-K.

MORGAN STANLEY
Basel III Pillar 3 Disclosures Report
For the Quarterly Period Ended December 31, 2015
2
3 Capital Structure The Company has issued a variety of capital instruments to meet its regulatory capital requirements and to maintain a strong capital base. These capital instruments include common stock that qualifies as Common Equity Tier 1 capital, non-cumulative perpetual preferred stock that qualifies as Additional Tier 1 capital and subordinated debt that qualifies as Tier 2 capital, each under U.S. Basel III. For a discussion of the Company’s capital instruments, see Note 11 (Borrowings and Other Secured Financings) and Note 15 (Total Equity) to the consolidated financial statements in Part II, Item 8 as well as “MD&A—Liquidity and Capital Resources—Regulatory Requirements—Implementation of U.S. Basel III—Regulatory Capital Ratios” in Part II, Item 7 of the 2015 Form 10-K.1 4 Capital Adequacy Capital strength is fundamental to the Company’s operation as a credible and viable market participant. To assess the amount of capital necessary to support the Company’s current and prospective risk profile, which ultimately informs the Company’s capital distribution capacity, the Company determines its overall capital requirement under normal and stressed operating environments, both on a current and forward-looking basis. For a further discussion on the Company’s required capital framework, see “MD&A—Liquidity and Capital Resources—Regulatory Requirements—Required Capital” in Part II, Item 7 of the 2015 Form 10-K. In determining its overall capital requirement, the Company classifies its exposures as either “banking book” or “trading book.” Banking book positions, which may be accounted for at amortized cost, lower of cost or market, fair value or under the equity method, are subject to credit risk capital requirements which are discussed in Section 5 “Credit Risk” included herein. Trading book positions represent positions the Company holds as part of its market-making and underwriting businesses. These positions, which reflect assets or liabilities that are accounted for at fair value, and certain banking book positions which are subject to both credit risk and market risk charges, (collectively, “covered positions”) as well as certain non-covered positions included Value-at-Risk (“VaR”), are subject to market risk capital requirements, which are discussed in Section 9 “Market Risk” included herein. Some trading book positions, such as derivatives, are also subject to counterparty credit risk capital requirements. Credit and market risks related to securitization exposures are discussed in Section 7 “Securitization Exposures” included herein.
1Regulatory requirements, including capital requirements and certain covenants contained in various agreements governing indebtedness of the Company may restrict the Company’s ability to access capital from its subsidiaries. For discussions of restrictions and other major impediments to transfer of funds or capital, see “Risk Factors—Liquidity and Funding Risk” in Part I, Item 1A, “Quantitative and Qualitative Disclosures about Market Risk—Risk Management—Liquidity and Funding Risk” in Part II, Item 7A and Note 14 (Regulatory Requirements) to the consolidated financial statements in Part II, Item 8 of the 2015 Form 10-K. For further information on the Company’s capital structure in accordance with U.S. Basel III, see “MD&A—Liquidity and Capital Resources—Regulatory Requirements” in Part II, Item 7 of the 2015 Form 10-K.

MORGAN STANLEY
Basel III Pillar 3 Disclosures Report
For the Quarterly Period Ended December 31, 2015
3
The following table presents components of the Company’s RWAs in accordance with the Advanced Approach, subject to transitional provisions:
Risk-weighted assets by U.S. Basel III exposure category At
December 31, 2015(1)
(dollars in millions)
Credit risk RWAs:
Wholesale exposures ................................................................................................................................$ 97,329 Retail exposures: Residential mortgage ................................................................................................................................ 944 Qualifying revolving ................................................................................................................................ 15 Other retail ................................................................................................................................ 3,503 Securitization exposures: Subject to Supervisory Formula Approach ................................................................................................ 3,325 Subject to Simplified Supervisory Formula Approach ................................................................ 7,850 Subject to 1,250% risk weight ................................................................................................ 142 Cleared transactions ................................................................................................................................ 1,715 Equity exposures: Subject to the Simple Risk-Weighted Approach ................................................................................................ 15,519 Subject to the Alternative Modified Look-Through Approach ................................................................ 2,960 Other assets(2) ................................................................................................................................ 22,225 Credit valuation adjustment ................................................................................................................................ 18,059 Total credit risk RWAs(3) ................................................................................................................................$ 173,586 Market risk RWAs: Regulatory VaR ................................................................................................................................$ 7,683 Regulatory stressed VaR ................................................................................................................................ 20,765 Incremental risk charge................................................................................................................................ 3,847 Comprehensive risk measure ................................................................................................................................ 8,403 Specific risk: Non-securitizations ................................................................................................................................ 16,357 Securitizations ................................................................................................................................ 14,421 Total market risk RWAs(4) ................................................................................................................................$ 71,476 Total operational risk RWAs ................................................................................................................................ 139,100 Total RWAs ................................................................................................................................$ 384,162 _____________ (1) For information on the Company’s credit risk RWAs, market risk RWAs and operational risk RWAs roll-forward from December 31, 2014 to December 31,
2015, see “MD&A—Liquidity and Capital Resources—Regulatory Requirements—Implementation of U.S. Basel III—Regulatory Capital Ratios” in Part II, Item 7 of the 2015 Form 10-K.
(2) Amount reflects assets not in a defined category of $19,988 million, non-material portfolios of exposures of $1,012 million and unsettled transactions of $1,225 million.
(3) In accordance with U.S. Basel III, credit risk RWAs with the exception of Credit Valuation Adjustment (“CVA”), reflect a 1.06 multiplier. (4) For more information on the Company’s measure for market risk and market risk RWAs, see Section 9 “Market Risk” herein.

MORGAN STANLEY
Basel III Pillar 3 Disclosures Report
For the Quarterly Period Ended December 31, 2015
4
The following table presents the risk-based capital ratios for the Company and its U.S. Bank Subsidiaries at December 31, 2015. Each ratio represents the lower of risk-based capital ratios (on a transitional basis) calculated using a U.S. Basel III transitional numerator and RWAs computed under the Standardized Approach or under the Advanced Approach. At December 31, 2015, the Company’s risk-based capital ratios were lower under the Advanced Approach transitional rules; however, the risk-based capital ratios for the Company’s U.S. Bank Subsidiaries were lower under the Standardized Approach transitional rules.
At December 31, 2015
Risk-based capital ratios Common Equity
Tier 1 capital ratio Tier 1
capital ratio Total
capital ratio
Morgan Stanley ................................................................................................ 15.5% 17.4% 20.7%Morgan Stanley Bank, N.A.(1) ................................................................ 15.1% 15.1% 17.1%Morgan Stanley Private Bank, National Association(1) ................................ 26.5% 26.5% 26.7%_____________ (1) At December 31, 2015, risk-based capital ratios calculated using a U.S. Basel III transitional numerator and RWAs computed under the Advanced Approach
were as follows: Morgan Stanley Bank, N.A.: Common Equity Tier 1 capital ratio: 23.9%; Tier 1 capital ratio: 23.9% and Total capital ratio: 26.8%; and Morgan Stanley Private Bank, National Association: Common Equity Tier 1 capital ratio: 44.8%; Tier 1 capital ratio: 44.8% and Total capital ratio: 44.8%.
Risk Management Objectives, Structure and Policies For a discussion of the Company’s risk management objectives, structure and policies, including its risk management strategies and processes, the structure and organization of its risk management function, the scope and nature of its risk reporting and measurement systems, and its policies for hedging and mitigating risk and strategies and processes for monitoring the continuing effectiveness of hedges and mitigants, see “Quantitative and Qualitative Disclosures about Market Risk—Risk Management” in Part II, Item 7A of the 2015 Form 10-K. 5 Credit Risk 5.1 Credit Risk: General Disclosures Credit risk refers to the risk of loss arising when a borrower, counterparty or issuer does not meet its financial obligations to the Company. Credit risk includes Country risk, which is the risk that events in, or affecting a foreign country might adversely affect the Company. “Foreign country” means any country other than the U.S. 2 The Company primarily incurs credit risk exposure to institutions and individual investors through its Institutional Securities and Wealth Management business segments. In order to help protect the Company from losses, the Credit Risk Management Department establishes Company-wide practices to evaluate, monitor and control credit risk exposure at the transaction, obligor and portfolio levels. The Credit Risk Management Department approves extensions of credit, evaluates the creditworthiness of the Company’s counterparties and borrowers on a regular basis, and ensures that credit exposure is actively monitored and managed. For a further discussion of the Company’s credit risk and credit risk management framework, see “Quantitative and Qualitative Disclosures about Market Risk—Risk Management—Credit Risk” in Part II, Item 7A of the 2015 Form 10-K. For a discussion of the Company’s risk governance structure, see “Quantitative and Qualitative Disclosures about Market Risk—Risk Management—Overview—Risk Governance Structure” in Part II, Item 7A of the 2015 Form 10-K.
The following tables present certain of the Company’s on- and off-balance sheet positions for which the Company is subject to credit risk exposure. These amounts do not include the effects of certain credit risk mitigation techniques (e.g., collateral and netting not permitted under U.S. GAAP), equity investments or liability positions that also would be subject to credit risk capital calculations, and amounts related to items that are deducted from regulatory capital.
2 U.S. includes the District of Columbia, Puerto Rico, and U.S. territories and possessions.

MORGAN STANLEY
Basel III Pillar 3 Disclosures Report
For the Quarterly Period Ended December 31, 2015
5
The following tables are presented on a U.S. GAAP basis and reflect amounts by product type, region (based on the legal domicile of the counterparty), remaining contractual maturity and counterparty or industry type. Credit Risk Exposures by Product Type and Geographic Region
At December 31, 2015
Product Type Americas
Europe, Middle East and Africa Asia-Pacific Netting Total
Quarterly Average(1)
(dollars in millions)
Cash(2) ................................................................$ 50,501 $ 19,289 $ 13,488 $ - $ 83,278 $ 86,293 Derivative and other contracts(3) ................................155,090 291,048 25,440 (442,965) 28,613 31,207 Available for sale debt and held to maturity securities ................................................................71,707 241 28 - 71,976 68,327 Securities financing transactions(3)(4) ................................187,054 56,520 39,585 (53,086) 230,073 250,954 Loans(5) ................................................................110,516 8,654 2,424 - 121,594 118,538 Other(6) ................................................................ 15,455 9,263 10,973 - 35,691 37,645 Total on-balance sheet ................................$ 590,323 $ 385,015 $ 91,938 $ (496,051)$ 571,225 $ 592,964
Commitments(7) ................................................................$ 79,364 $ 35,609 $ 19,928 $ - $ 134,901 $ 160,835 Guarantees(8) ................................................................11,918 388 - - 12,306 12,535 Total off-balance sheet ................................$ 91,282 $ 35,997 $ 19,928 $ - $ 147,207 $ 173,370
Remaining Contractual Maturity Breakdown by Product Type At December 31, 2015
Years to Maturity
Product Type Less
than 1 1-5 Over 5 Netting Total (dollars in millions)
Cash(2) ................................................................................................$ 83,278 $ - $ - $ - $ 83,278 Derivative and other contracts(3) ................................................................ 86,830 122,500 262,248 (442,965) 28,613 Available for sale debt and held to maturity securities ................................ 6,731 34,327 30,918 - 71,976 Securities financing transactions(3)(4) ................................ 281,973 1,186 - (53,086) 230,073 Loans(5) ................................................................................................ 58,770 33,442 29,382 - 121,594 Other(6) ................................................................................................ 20,883 6,643 8,165 - 35,691 Total on-balance sheet ................................................................$ 538,465 $ 198,098 $ 330,713 $ (496,051)$ 571,225
Commitments(7) ................................................................$ 53,496 $ 74,039 $ 7,366 $ - $ 134,901 Guarantees(8) ................................................................ 3,901 2,535 5,870 - 12,306 Total off-balance sheet ................................................................$ 57,397 $ 76,574 $ 13,236 $ - $ 147,207

MORGAN STANLEY
Basel III Pillar 3 Disclosures Report
For the Quarterly Period Ended December 31, 2015
6
Distribution of Exposures by Product Type and Counterparty or Industry Type
At December 31, 2015
Wholesale
Product Type Bank(9) Sovereign Corporate
and Other(10) Retail Netting Total
(dollars in millions)
Cash(2) ................................................................$ 28,429 $ 40,512 $ 14,337 $ - $ - $ 83,278 Derivative and other contracts(3) ................................228,200 9,900 233,478 - (442,965) 28,613 Available for sale debt and held to maturity securities ................................................................- 62,981 8,995 - - 71,976 Securities financing transactions(3)(4) ................................25,695 24,953 232,511 - (53,086) 230,073 Loans(5) ................................................................263 - 57,004 64,327 - 121,594 Other(6) ................................................................- 5,454 30,237 - - 35,691 Total on-balance sheet ................................$ 282,587 $ 143,800 $ 576,562 $ 64,327 $ (496,051)$ 571,225
Commitments(7) ................................................................$ 11,909 $ - $ 117,828 $ 5,164 $ - $ 134,901 Guarantees(8) ................................................................3 - 12,303 - - 12,306 Total off-balance sheet ................................$ 11,912 $ - $ 130,131 $ 5,164 $ - $ 147,207 _____________ (1) Average balances are calculated based on month-end balances or, where month-end balances are unavailable, quarter-end balances. (2) Amounts include Cash and due from banks, Interest bearing deposits with banks, and Cash deposited with clearing organizations or segregated under federal and
other regulations or requirements, and exclude money market funds. (3) For further discussions on master netting agreements and collateral agreements, see Note 4 (Derivative Instruments and Hedging Activities) and Note 6
(Collateralized Transactions) to the consolidated financial statements in Part II, Item 8 of the 2015 Form 10-K. (4) Amounts reflect Securities purchased under agreements to resell and Securities borrowed. (5) Amounts reflect loans held for investment, loans held for sale and banking book loans designated at fair value, as well as margin lending and employee loans. (6) Amounts primarily reflect banking book Customer and other receivables, Intangible Assets, Premises, equipment and software costs and banking book U.S.
government and agency securities designated at fair value. (7) Amounts reflect lending commitments and Forward starting reverse repurchase agreements and securities borrowing agreements. For a further discussion on the
Company’s commitments, see Note 11 (Commitments, Guarantees and Contingencies) to the consolidated financial statements in Part II, Item 8 of the 2015 Form 10-K.
(8) Amounts reflect Standby letters of credit and other financial guarantees issued and Liquidity facilities. For a further discussion on the Company’s guarantees, see Note 11 (Commitments, Guarantees and Contingencies) to the consolidated financial statements in Part II, Item 8 of the 2015 Form 10-K.
(9) Bank counterparties primarily include banks and depository institutions. (10) Corporate and Other counterparties include exchanges and clearing houses.
5.2 Credit Risk: General Disclosure for Impaired Loans The Company provides loans or lending commitments within its Institutional Securities and Wealth Management business segments. The Company accounts for loans using the following designations: loans held for investment, loans held for sale and loans at fair value. The allowance for loan losses estimates probable losses inherent in the held for investment portfolio as well as probable losses related to loans specifically identified as impaired. For a discussion of the Company’s loan disclosures (including current and comparable prior period loan information by product type), such as the allowance for loan losses, impaired loans, reconciliation of changes in allowance for loan losses, and credit quality indicators, see Note 7 (Loans and Allowance for Credit Losses) to the consolidated financial statements in Part II, Item 8 of the 2015 Form 10-K. For a discussion of the Company’s determination of past due or delinquency status, placing of loans on nonaccrual status, returning of loans to accrual status, identification of impaired loans for financial accounting purposes, methodology for estimating allowance for loan losses, and charge-offs of uncollectible amounts, see Note 2 (Significant Accounting Policies) to the consolidated financial statements in Part II, Item 8 of the 2015 Form 10-K.

MORGAN STANLEY
Basel III Pillar 3 Disclosures Report
For the Quarterly Period Ended December 31, 2015
7
The following tables are presented on a U.S. GAAP basis and reflect details on impaired and past due loans along with allowances and charge-offs for the Company’s loans held for investment. The tables also include loans held for sale and loans held in the banking book designated at fair value.
At December 31, 2015
Bank(1) Sovereign Corporate
and Other(2) Retail Total
(dollars in millions)
Impaired loans with allowance................................................................$ - $ - $ 39 $ - $ 39 Impaired loans without allowance(3) ................................ - - 89 17 106 Past due 90 days loans and on nonaccrual ................................ - - 20 21 41 Past due 90 days loans and still accruing................................ - - 18 - 18 Allowance for loan losses ................................................................1 - 202 22 225 Net charge-offs for the quarter ended December 31, 2015 ................................- - - - - _____________ (1) Bank counterparties primarily include banks and depository institutions. (2) Corporate and Other counterparties include exchanges and clearing houses. (3) At December 31, 2015, no allowance was outstanding for these loans as the present value of the expected future cash flows (or alternatively, the observable
market price of the loan or the fair value of the collateral held) exceeded or equaled the carrying value.
At December 31, 2015
Americas
Europe, Middle East and Africa Asia-Pacific Total
(dollars in millions)
Impaired loans ................................................................................................$ 108 $ 12 $ 25 $ 145 Past due 90 days loans and on nonaccrual ................................................................22 8 11 41 Allowance for loan losses ................................................................ 183 34 8 225 Loans Past Due and on nonaccrual by Counterparty or Industry Type At December 31, 2015
Counterparty Type 90 - <120
Days 120 - <180
Days 180 Days or more Total
(dollars in millions)
Bank ................................................................................................$ - $ - $ - $ - Sovereign ................................................................................................ - - - - Corporate and other ................................................................................................ - - 20 20 Retail ................................................................................................ 4 3 14 21 Total ................................................................................................$ 4 $ 3 $ 34 $ 41 5.3 Portfolios Subject to Internal Ratings-Based Risk-Based Capital Formulas
The Company utilizes its internal ratings system in the calculation of RWAs for the purpose of determining Basel III regulatory capital requirements for wholesale and retail exposures, as well as other internal risk management processes such as determining credit limits. Internal Ratings System Design As a core part of its responsibility for the independent management of credit risk, the Credit Risk Management Department maintains a control framework to evaluate the risk of obligors and the structure of credit facilities (for loans, derivatives, securities financing transactions, etc.), both at inception and periodically thereafter. For both wholesale and retail exposures, the Company has internal ratings methodologies that assign a Probability of Default (“PD”) and a Loss Given Default (“LGD”). These risk parameters, along with Exposure at Default (“EAD”), are used to compute credit risk RWAs under the Advanced Approach. Internal credit ratings serve as the Credit Risk Management Department’s independent assessment of

MORGAN STANLEY
Basel III Pillar 3 Disclosures Report
For the Quarterly Period Ended December 31, 2015
8
credit risk, and the basis for a comprehensive credit limits framework used to control credit risk. The Company uses quantitative models and expert judgment to estimate the various risk parameters related to each obligor and/or credit facility. Internal ratings procedures, methodologies, models and credit limits frameworks are all independently and formally governed, and models are reviewed by an independent oversight function. The PD represents a through the cycle likelihood of default of an obligor. The LGD is an estimate of the expected economic loss incurred by the Company during an economic downturn in the event of default by an obligor, expressed as a percentage of EAD. EAD is the estimated amount due at the time of default. EAD for certain products may be reduced by certain credit risk mitigants. Contingent liabilities, such as undrawn commitments and standby letters of credit, are considered in determining EAD. Internal Ratings System Process The performance of the overall internal ratings system is monitored on a quarterly basis. This involves a review of key performance measures that include rating overrides, accuracy ratio and comparison of internal ratings versus applicable agency ratings. The review is performed by an independent group, and the results and conclusions are reported to corresponding credit risk governance committees. The overall effectiveness of the internal ratings system is assessed annually and the evaluation results go through a rigorous challenge process by various governance committees before they are presented to the Company’s Board of Directors. Wholesale Exposures Wholesale exposures are credit risk exposures to institutions and individual investors that may arise from a variety of business activities, including, but not limited to, entering into swap or other derivative contracts under which counterparties have obligations to make payments to the Company; extending credit to clients through various lending commitments; providing short-term or long-term funding that is secured by physical or financial collateral whose value may at times be insufficient to fully cover the loan repayment amount; and posting margin and/or collateral and/or deposits to clearing houses, clearing agencies, exchanges, banks, securities companies and other financial counterparties. The Credit Risk Management Department evaluates wholesale obligors (including but not limited to: companies, individuals, sovereign entities or other government entities) and assigns them internal credit ratings using a “through the cycle” methodology that reflects credit quality expectation over a medium-term horizon. The Credit Risk Management Department rates wholesale counterparties based on an analysis of the obligor and industry- or sector-specific qualitative and quantitative factors. The ratings process typically includes an analysis of the obligor’s financial statements, evaluation of its market position, strategy, management, legal and environmental issues; and consideration of industry dynamics affecting its performance. The Credit Risk Management Department also considers securities prices and other financial markets to assess financial flexibility of the obligor. The Credit Risk Management Department collects relevant information to rate an obligor. If the available information for an obligor is limited, a conservative rating is assigned to reflect uncertainty arising from the limited information. Retail Exposures Retail exposures generally include exposures to individuals and exposures to small businesses that are managed as part of a pool of exposures with similar risk characteristics, and not on an individual exposure basis. The Company incurs retail exposure credit risk within its Wealth Management residential mortgage business by making single-family residential mortgage loans in the form of conforming, nonconforming or home equity lines of credit (“HELOC”). In addition, the Company grants loans to certain Wealth Management employees primarily in conjunction with a program to retain and recruit such employees. The primary source of the Company’s retail exposure is concentrated in two of three Basel III retail exposure categories: Residential Mortgages and Other Retail Exposures. The third Basel III retail category, Qualifying Revolving Exposures, is not currently relevant to the Company as it has no assets related to this category. Retail exposures consist of many small loans, thereby making it generally inefficient to assign ratings to each individual loan. Individual loans, therefore, are segmented and aggregated into pools. The Credit Risk Management Department develops the methodology to assign PD, LGD and EAD estimates to these pools of exposures with similar risk characteristics, using factors that may include the Fair Isaac Corporation (“FICO”) scores of the borrowers.

MORGAN STANLEY
Basel III Pillar 3 Disclosures Report
For the Quarterly Period Ended December 31, 2015
9
Internal Ratings System Exposures The following table provides a summary of the distribution of Internal Ratings Based Advanced Approach risk parameters that the Company uses to calculate credit risk RWAs for wholesale and retail exposures. The table also provides average risk weighted values across obligor types and rating grades. The Company currently does not have any high volatility commercial real estate or qualifying revolving exposures.
At December 31, 2015
Subcategory PD Band (%) Average PD
(%)(1) Average LGD
%(1)(2) Undrawn
Commitment EAD(2)
Average Counterparty
EAD(3) Average risk weight (%)
(dollars in millions)
Wholesale
Exposures ................................0.00 ≤ PD < 0.35 ................................ 0.07% 38.38%$ 79,534 $ 267,977 $ 10,607 20.54% 0.35 ≤ PD < 1.35 ................................ 0.85% 40.34% 16,053 22,817 189 80.32% 1.35 ≤ PD < 10.00 ................................ 5.09% 37.53% 9,449 14,087 166 132.97% 10.00 ≤ PD < 100.00 ................................ 26.85% 29.66% 381 2,796 256 170.94% 100 (Default) ................................ 100.00% N/A 243 895 76 106.00% Sub-total ................................................................................................$ 105,660 $ 308,572 $ 11,294 Residential
Mortgages ................................0.00 ≤ PD < 0.15 ................................ 0.05% 17.99%$ 304 $ 18,491 $ 1 2.70% 0.15 ≤ PD < 0.35 ................................ 0.32% 16.45% 3 1,816 3 9.72% 0.35 ≤ PD < 1.35 ................................ 1.33% 13.01% 0 833 5 20.67% 1.35 ≤ PD < 10.00 ................................ 2.08% 13.14% 1 209 1 27.60% 10.00 ≤ PD < 100.00 ................................ 25.76% 17.77% - 34 2 109.63% 100 (Default) ................................ 100.00% N/A 0 17 3 106.62% Sub-total ................................................................................................$ 308 $ 21,400 $ 15 Other Retail Exposures ................................0.00 ≤ PD < 1.50 ................................ 0.00% 0.00%$ - $ - $ - 0.00% 1.50 ≤ PD < 3.00 ................................ 2.21% 100.00% - 62 33 39.66% 3.00 ≤ PD < 5.00 ................................ 3.30% 44.33% - 1,815 2 66.34% 5.00 ≤ PD < 8.00 ................................ 6.18% 42.33% - 2,938 - 67.47% 8.00 ≤ PD < 100.00 ................................ 9.63% 13.41% - 35 - 23.58% 100 (Default) ................................ 100.00% N/A - 268 1 106.00% Sub-total ................................................................................................$ - $ 5,118 $ 36
Total ................................................................................................$ 105,968 $ 335,090 $ 11,345 _____________ N/A—Not Applicable (1) Amounts reflect the effect of eligible guarantees and eligible credit derivatives. (2) Under U.S. Basel III, credit risk mitigation in the form of collateral may be applied by reducing EAD or adjusting the LGD. The Company may apply one or the
other approach depending on product type. (3) Amounts represent the weighted average EAD per counterparty within the respective PD band, weighted by its pro rata EAD contribution. 5.4 General Disclosure for Wholesale Counterparty Credit Risk of Derivative Contracts, Repo-Style
Transactions and Eligible Margin Lending Counterparty Credit Risk Overview Counterparty credit exposure arises from the risk that parties are unable to meet their payment obligations under derivative contracts, repo-style transactions and eligible margin loans. Repo-style transactions include securities sold under agreements

MORGAN STANLEY
Basel III Pillar 3 Disclosures Report
For the Quarterly Period Ended December 31, 2015
10
to repurchase (“repurchase agreements”) and securities lending transactions. Derivative contracts and securities underlying repo-style transactions have a risk of increased potential future counterparty exposure from changes in movements in market prices and other risk factors. Potential future exposure is mitigated by the use of netting and collateral agreements. The Company uses internal models to compute expected exposure that includes the mitigating effects of netting and collateral in valuing over-the-counter (“OTC”) and exchange-traded derivative contracts and repo-style transactions. For eligible margin lending, the Company uses either internal models or the collateral haircut approach (“CHA”) as prescribed in the U.S. Basel III rules. The use of netting, collateral, internal models methodology (“IMM”) and CVAs are discussed further below, in addition to other counterparty credit risk management practices. Derivative Contracts The Company actively manages its credit exposure through the application of collateral arrangements and readily available market instruments such as credit derivatives. The use of collateral in managing derivative risk is standard in the market place, and is governed by appropriate documentation such as the Credit Support Annex to the International Swaps and Derivatives Association, Inc. (“ISDA”) documentation. In line with these standards, the Company generally accepts only cash, government bonds, corporate debt and main index equities as collateral. The Company has policies and procedures for reviewing the legal enforceability of credit support documents in accordance with applicable rules. Repo-Style Transactions The Company enters into securities purchased under agreements to resell (“reverse repurchase agreements”), repurchase agreements, securities borrowed and securities loaned transactions to, among other things, acquire securities to cover short positions and settle other securities obligations, to accommodate customers’ needs and to finance the Company’s inventory positions. The Company manages credit exposure arising from such transactions by, in appropriate circumstances, entering into master netting agreements and collateral agreements with counterparties that provide the Company, in the event of a counterparty default, (such as bankruptcy or a counterparty’s failure to pay or perform), with the right to net a counterparty’s rights and obligations under such agreement and liquidate and set off collateral held by the Company against the net amount owed by the counterparty. Under these agreements and transactions, the Company either receives or provides collateral, including U.S. government and agency securities, other sovereign government obligations, corporate and other debt, and corporate equities. Eligible Margin Lending The Company also engages in customer margin lending and securities-based lending to its Institutional Securities and Wealth Management clients that allow clients to borrow against the value of qualifying securities. This lending activity is included within Customer and other receivables or Loans in the consolidated statements of financial condition. The Company monitors required margin levels and established credit terms daily and, pursuant to such guidelines, requires customers to deposit additional collateral or reduce positions, when necessary. Netting The Company recognizes netting in its estimation of EAD where it has a master netting agreement in place and other relevant requirements are met. The ISDA Master Agreement is an industry-standard master netting agreement that is typically used to document derivative transactions. The Company generally uses the ISDA Master Agreement and similar master netting agreements to document derivative and repo-style transactions. For a discussion of the Company’s master netting agreements, see Note 4 (Derivative Instruments and Hedging Activities) and Note 6 (Collateralized Transactions) to the consolidated financial statements in Part II, Item 8 of the 2015 Form 10-K. Collateral The Company may require collateral depending on the credit profile of the Company’s counterparties. There is an established infrastructure to manage, maintain and value collateral on a daily basis. Collateral held is managed in accordance with the Company’s guidelines and the relevant underlying agreements. For a discussion of the Company’s use of collateral as a credit risk mitigant, including with respect to derivatives, repo-style transactions and eligible margin loans, see Note 4 (Derivative Instruments and Hedging Activities) and Note 6 (Collateralized
MORGAN STANLEY
Basel III Pillar 3 Disclosures Report
For the Quarterly Period Ended December 31, 2015
11
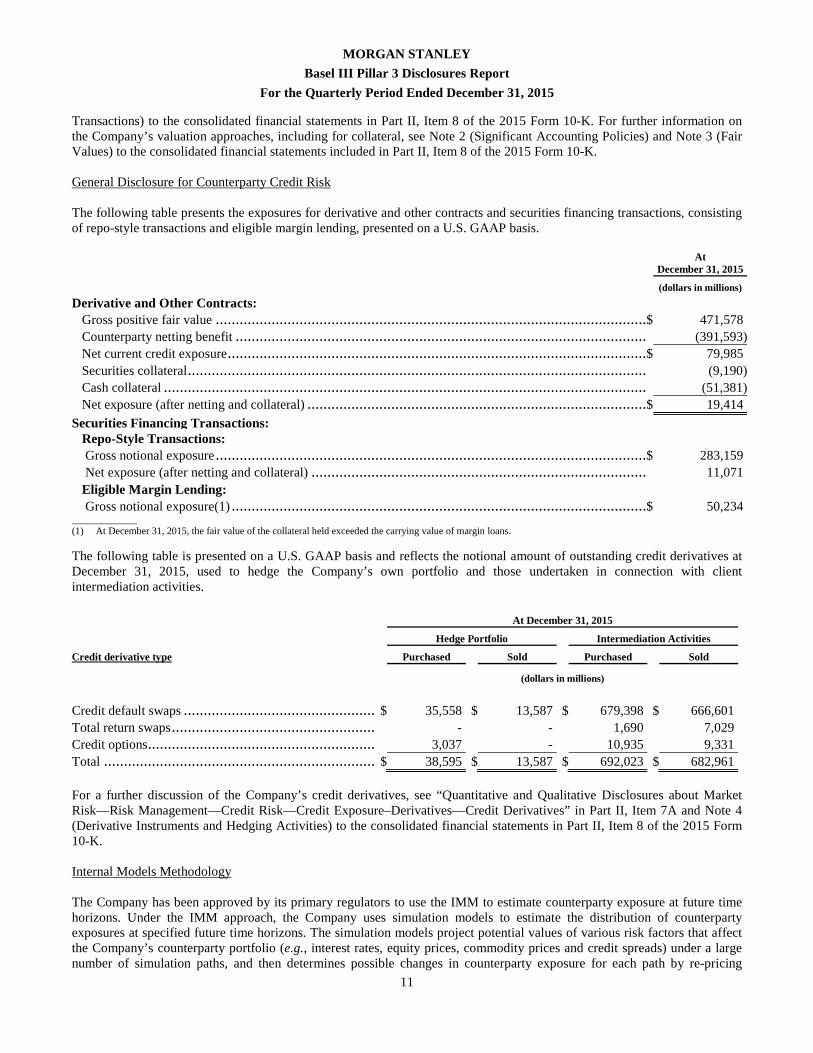
Transactions) to the consolidated financial statements in Part II, Item 8 of the 2015 Form 10-K. For further information on the Company’s valuation approaches, including for collateral, see Note 2 (Significant Accounting Policies) and Note 3 (Fair Values) to the consolidated financial statements included in Part II, Item 8 of the 2015 Form 10-K. General Disclosure for Counterparty Credit Risk The following table presents the exposures for derivative and other contracts and securities financing transactions, consisting of repo-style transactions and eligible margin lending, presented on a U.S. GAAP basis.
At
December 31, 2015
(dollars in millions)
Derivative and Other Contracts: Gross positive fair value ................................................................................................................................$ 471,578 Counterparty netting benefit ................................................................................................................................ (391,593) Net current credit exposure ................................................................................................................................$ 79,985 Securities collateral ................................................................................................................................ (9,190) Cash collateral ................................................................................................................................ (51,381) Net exposure (after netting and collateral) ................................................................................................$ 19,414
Securities Financing Transactions: Repo-Style Transactions: Gross notional exposure ................................................................................................................................$ 283,159 Net exposure (after netting and collateral) ................................................................................................ 11,071 Eligible Margin Lending: Gross notional exposure(1) ................................................................................................................................$ 50,234 _____________ (1) At December 31, 2015, the fair value of the collateral held exceeded the carrying value of margin loans.
The following table is presented on a U.S. GAAP basis and reflects the notional amount of outstanding credit derivatives at December 31, 2015, used to hedge the Company’s own portfolio and those undertaken in connection with client intermediation activities.
At December 31, 2015
Hedge Portfolio Intermediation Activities
Credit derivative type Purchased Sold Purchased Sold
(dollars in millions)
Credit default swaps ................................................................$ 35,558 $ 13,587 $ 679,398 $ 666,601 Total return swaps ................................................................ - - 1,690 7,029 Credit options................................................................ 3,037 - 10,935 9,331 Total ................................................................................................$ 38,595 $ 13,587 $ 692,023 $ 682,961 For a further discussion of the Company’s credit derivatives, see “Quantitative and Qualitative Disclosures about Market Risk—Risk Management—Credit Risk—Credit Exposure–Derivatives—Credit Derivatives” in Part II, Item 7A and Note 4 (Derivative Instruments and Hedging Activities) to the consolidated financial statements in Part II, Item 8 of the 2015 Form 10-K. Internal Models Methodology The Company has been approved by its primary regulators to use the IMM to estimate counterparty exposure at future time horizons. Under the IMM approach, the Company uses simulation models to estimate the distribution of counterparty exposures at specified future time horizons. The simulation models project potential values of various risk factors that affect the Company’s counterparty portfolio (e.g., interest rates, equity prices, commodity prices and credit spreads) under a large number of simulation paths, and then determines possible changes in counterparty exposure for each path by re-pricing

MORGAN STANLEY
Basel III Pillar 3 Disclosures Report
For the Quarterly Period Ended December 31, 2015
12
transactions with that counterparty under the projected risk factor values. A counterparty’s expected positive exposure profile is determined from the resulting modeled exposure distribution to estimate EAD in calculating credit risk RWAs for regulatory capital ratio purposes. For a small population of exposures not modeled under this simulation method, the Company calculates EAD for regulatory capital purposes using a more conservative but less risk-sensitive method. The internal models incorporate the effects of legally enforceable netting and collateral agreements in estimating counterparty exposure. Collateral Haircut Approach Methodology For certain eligible margin loans, EAD is adjusted to reflect the risk mitigating effect of financial collateral in line with the CHA as prescribed in the U.S. Basel III rules. CVA and other counterparty credit risk management practices are discussed further below. The table below presents the EAD used for the Company’s determination of regulatory capital for derivative and other contracts and securities financing transactions, excluding default fund contributions. At December 31, 2015
Internal Models Methodology CHA Methodology Total
EAD RWA EAD RWA EAD RWA
(dollars in millions)
Derivative and other contracts(1) ................................$ 67,771 $ 25,411 $ - $ - $ 67,771 $ 25,411 Securities financing transactions ................................ 31,628 5,538 1,677 3,302 33,305 8,840 Other ................................................................ 1,548 33 - - 1,548 33
Total ................................................................$ 100,947 $ 30,982 $ 1,677 $ 3,302 $ 102,624 $ 34,284 _____________ (1) Amount includes client exposures related to cleared transactions.
Other Counterparty Credit Risk Management Practices Credit Valuation Adjustment CVA refers to the fair value adjustment to reflect counterparty credit risk in the valuation of bilateral (i.e., non-cleared) OTC derivative contracts. U.S. Basel III requires the Company to calculate RWAs for CVA. The Company establishes a CVA for bilateral OTC derivative transactions based on expected credit losses given the probability and severity of a counterparty default. The adjustment is determined by evaluating the credit exposure to the counterparty and by taking into account the market value of a counterparty’s credit risk as implied by credit spreads, and the effect of allowances for any credit risk mitigants such as legally enforceable netting and collateral agreements. CVA is recognized in profit and loss on a daily basis and effectively represents an adjustment to reflect the credit component of the fair value of the derivatives receivable. Given that the previously recognized CVA reduces the potential loss faced in the event of a counterparty default, exposure metrics are reduced for CVA. Credit Limits Framework The Company employs an internal comprehensive and global Credit Limits Framework as one of the primary tools used to evaluate and manage credit risk levels across the Company. The Credit Limits Framework includes single-name limits and portfolio concentration limits by country, industry and product type. The limits within the Credit Limits Framework are calibrated to the Company’s risk tolerance and reflect factors that include the Company’s capital levels and the risk attributes of the exposures managed by the limits. Credit exposure is actively monitored against the relevant credit limits, and excesses are escalated in accordance with established governance thresholds. In addition, credit limits are evaluated and reaffirmed at least annually or more frequently as necessary.

MORGAN STANLEY
Basel III Pillar 3 Disclosures Report
For the Quarterly Period Ended December 31, 2015
13
Additional Collateral Requirements Due to Credit Rating Downgrade For a discussion of the additional collateral or termination payments that may be called in the event of a future credit rating downgrade of the Company, see “MD&A—Liquidity and Capital Resources—Credit Ratings” in Part II, Item 7 of the 2015 Form 10-K. Wrong-Way Risk The Company incorporates the effect of specific wrong-way risk in its calculation of the counterparty exposure. Specific wrong-way risk arises when a transaction is structured in such a way that the exposure to the counterparty is positively correlated with the PD of the counterparty; for example, a counterparty writing put options on its own stock or a counterparty collateralized by its own or related party stock. The Company considers specific wrong-way risk when approving transactions. The Company also monitors general wrong-way risk, which arises when the counterparty PD is correlated with general market or macroeconomic factors. The credit assessment process identifies these correlations and manages the risk accordingly. 5.5 Credit Risk Mitigation
Overview In addition to the use of netting and collateral for mitigating counterparty credit risk discussed above, the Company may seek to mitigate credit risk from its lending and derivatives transactions in multiple ways, including through the use of guarantees and hedges. At the transaction level, the Company seeks to mitigate risk through management of key risk elements such as size, tenor, financial covenants, seniority and collateral. The Company actively hedges its lending and derivatives exposure through various financial instruments that may include single-name, portfolio and structured credit derivatives. Additionally, the Company may sell, assign or syndicate funded loans and lending commitments to other financial institutions in the primary and secondary loan market. In connection with its derivative and other contracts and securities financing transaction activities, the Company generally enters into master netting agreements and collateral arrangements with counterparties. These agreements provide the Company with the ability to demand collateral, as well as to liquidate collateral and offset receivables and payables covered under the same master netting agreement in the event of a counterparty default. For further information on the impact of netting on the Company’s credit exposures, see “Collateral” in Section 5.4 herein and “Quantitative and Qualitative Disclosures about Market Risk—Risk Management—Credit Risk” in Part II, Item 7A of the 2015 Form 10-K. Loan Collateral Recognition and Management Collateralizing loans significantly reduces the credit risk to the Company. As part of the credit evaluation process, the Credit Risk Management Department assesses the ability of obligors to grant collateral. The Credit Risk Management Department may consider the receipt of collateral as a factor when approving loans, as applicable. Loans secured by customer margin accounts, a source of credit exposure, are collateralized in accordance with internal and regulatory guidelines. The Company monitors required margin levels and established credit limits daily and pursuant to such guidelines, requires customers to deposit additional collateral, or reduce positions, when necessary. Factors considered in the review of margin loans are the amount of the loan, the intended purpose, the degree of leverage being employed in the account, and overall evaluation of the portfolio to ensure proper diversification or, in the case of concentrated positions, appropriate liquidity of the underlying collateral or potential hedging strategies to reduce risk. Additionally, transactions relating to concentrated or restricted positions require a review of any legal impediments to liquidation of the underlying collateral. Underlying collateral for margin loans is reviewed with respect to the liquidity of the proposed collateral positions, valuation of securities, historic trading range, volatility analysis and an evaluation of industry concentrations. With respect to first and second mortgage loans, including HELOC loans, a loan evaluation process is adopted within a framework of the credit underwriting policies and collateral valuation. Loan-to-collateral value ratios are determined based on independent third-party property appraisal/valuations, and the security lien position is established through title/ownership reports.

MORGAN STANLEY
Basel III Pillar 3 Disclosures Report
For the Quarterly Period Ended December 31, 2015
14
Guarantees and Credit Derivatives The Company may accept or request guarantees from related or third parties to mitigate credit risk for wholesale obligors. Such arrangements represent obligations for the guarantor to make payments to the Company if the counterparty fails to fulfill its obligation under a borrowing arrangement or other contractual obligation. The Company typically accepts guarantees from corporate entities and financial institutions within its Institutional Securities business segment, and individuals and their small- and medium-sized domestic businesses within its Wealth Management business segment. The Company may also hedge certain exposures using credit derivatives. The Company enters into credit derivatives, principally through credit default swaps, under which it receives or provides protection against the risk of default on a set of debt obligations issued by a specified reference entity or entities. A majority of the Company’s hedge counterparties are banks, broker-dealers, insurance and other financial institutions. The Company recognizes certain credit derivatives and third-party guarantees for the reduction of capital requirements under the Advanced Approach. At December 31, 2015, the aggregate EAD amount of the Company’s wholesale exposure hedged by such credit derivatives or third-party guarantees, excluding CVA hedges, was $2,794 million. 6 Equities Not Subject to Market Risk Capital Rule Overview The Company from time to time makes equity investments that may include business facilitation or other investing activities. Such investments are typically strategic investments undertaken by the Company to facilitate core business activities. From time to time, the Company may also make equity investments and capital commitments to public and private companies, funds and other entities. Additionally, the Company sponsors and manages investment vehicles and separate accounts for clients seeking exposure to private equity, infrastructure, mezzanine lending and real estate-related and other alternative investments. The Company may also invest in and provide capital to such investment vehicles. Valuation for equity investments not subject to market risk capital rule The Company’s equity investments include investments in private equity funds, real estate funds and hedge funds (which include investments made in connection with certain employee deferred compensation plans), as well as direct investments in equity securities, which are recorded at fair value. The Company applies the Alternative Modified Look-Through Approach for equity exposures to investment funds. Under this approach, the adjusted carrying value of an equity exposure to an investment fund is assigned on a pro rata basis to different risk weight categories based on the information in the fund’s prospectus or related documents. For all other equity exposures, the Company applies the Simple Risk-Weight Approach (“SRWA”). Under SRWA, the RWA for each equity exposure is calculated by multiplying the adjusted carrying value of the equity exposure by the applicable regulatory prescribed risk weight.

MORGAN STANLEY
Basel III Pillar 3 Disclosures Report
For the Quarterly Period Ended December 31, 2015
15
The following table consists of U.S. GAAP amounts disclosed in the Company’s balance sheet of investments and the types and nature of investments, capital requirements by appropriate equity groupings, realized gains/(losses) from sales and liquidations in the reporting period, and total unrealized gains/(losses) on available for sale (“AFS”) equity securities reflected in Accumulated other comprehensive income (loss) (“AOCI”), net of tax, including unrecognized gains/(losses) related to investments carried at cost and unrealized gains/(losses) included in Tier 1 and/or Tier 2 capital. At December 31, 2015
Type of Equity Investments Total
On-balance Sheet(1) Risk
Weight % RWAs(2)
(dollars in millions)
Simple Risk-Weight Approach: Exposures in the 0% risk weight category ................................................................$ 328 0% $ - Exposures in the 20% risk weight category ................................................................37 20% 8 Community development equity exposures ................................................................1,848 100% 2,068
Non-significant equity exposures ................................................................4,491 100% 5,159 Significant investments in unconsolidated financial institutions(3) ................................4,104 100% 4,678 Publicly traded equity exposures ................................................................ - 300% - Non-publicly traded equity exposures ................................................................- 400% -
Exposures in the 600% risk weight category ................................................................484 600% 3,606 Sub-total ................................................................................................$ 11,292 N/A $ 15,519
Equity exposures to investment funds: Alternative Modified Look-Through Approach ................................ 3,175 N/A 2,960
Total Equities Not Subject to Market Risk Capital Rule ................................$ 14,467 N/A $ 18,479
Quarter-to-date realized gains/(losses) from sales and liquidations(4) ................................................................$ 139 Total unrealized gains/(losses) on AFS equity securities reflected in AOCI(4) ................................................................(6)Unrecognized gains/(losses) related to investments carried at cost(4) ................................................................ (4)Unrealized gains/(losses) included in Tier 1 and/or Tier 2 capital ................................................................ (6)____________ N/A—Not Applicable (1) The total on-balance sheet amount reflects $10,150 million and $4,317 million of non-publicly traded and publicly traded investments, respectively, at December
31, 2015. The on-balance sheet amounts reflect approximate fair value of these exposures and are presented on a U.S. GAAP basis, which include investments in the Company’s own capital instruments and investments in the capital instruments of unconsolidated financial institutions that are subject to capital deductions under U.S. Basel III. At December 31, 2015, the amount of Equities Not Subject to Market Risk Capital Rule that was deducted from Total capital was $31 million, which also includes certain deductions applicable under the Volcker Rule. For a discussion of the Company’s deductions under the Volcker Rule, see “Business—Supervision and Regulation—Financial Holding Company—Activities Restrictions under the Volcker Rule” in Part I, Item 1 of the 2015 Form 10-K. For further information on the Company’s valuation techniques related to investments, see Note 2 (Significant Accounting Policies) to the consolidated financial statements in Part II, Item 8 of the 2015 Form 10-K.
(2) In accordance with U.S. Basel III, RWAs reflect a 1.06 multiplier and include both on- and off-balance sheet equity exposures. (3) Under the Advanced Approach, significant investments in unconsolidated financial institutions in the form of common stock, which are not deducted from
Common Equity Tier 1, are assigned a 250% risk weight. Between 2014 and 2017, under the transitional rules, a 100% risk weight is applied. In 2018, the 250% risk weight comes into effect on a fully phased-in basis.
(4) For the quarter ended December 31, 2015.
7 Securitization Exposures A securitization exposure is defined (in line with the U.S. Basel III definition) as a transaction in which:
• All or a portion of the credit risk of the underlying exposures is transferred to third parties, and has been separated into two or more tranches reflecting different levels of seniority;
• The performance of the securitization depends upon the performance of the underlying exposures; • All or substantially all of the underlying exposures are financial exposures; and • The underlying exposures are not owned by an operating company or certain other issuers.
Securitization exposures include on- or off-balance sheet exposures (including credit enhancements) that arise from a traditional securitization or synthetic securitization (including a re-securitization transaction); or an exposure that directly or indirectly references a securitization exposure (e.g., a credit derivative). A re-securitization is a securitization which has more than one underlying exposure and in which one or more of the underlying exposures is itself a securitization exposure.

MORGAN STANLEY
Basel III Pillar 3 Disclosures Report
For the Quarterly Period Ended December 31, 2015
16
On-balance sheet exposures include securitization notes purchased and loans made to securitization trusts. Off-balance sheet exposures include liquidity commitments and derivatives (including tranched credit derivatives and derivatives for which the reference obligation is a securitization).
Securitization exposures are classified as either traditional or synthetic. In a traditional securitization, risk is transferred other than through the use of credit derivatives or guarantees. Typically, the originator establishes a special purpose entity (“SPE”) and sells assets (either originated or purchased) off its balance sheet into the SPE, which issues securities to investors. In a synthetic securitization, credit risk is transferred to an investor through the use of credit derivatives or guarantees. The Company does not manage or advise entities that invest in securitizations sponsored by the Company. Except for (i) the AFS securities portfolios, for which the Company purchases mostly highly rated tranches of commercial mortgage and other securitizations not sponsored by the Company, and (ii) warehouse loans and liquidity commitments to client sponsored SPEs, the Company engages in securitizations primarily as a trading activity. The Company retains securities issued in some of the securitization transactions it sponsors, and it purchases securities issued in securitization transactions sponsored by others as part of its trading inventory. These interests are included in the consolidated statements of financial condition at fair value with mark-to-market changes reported in net income. For further information on securitization transactions in which the Company holds any exposure in either the banking book or the trading book, see Note 13 (Variable Interest Entities and Securitization Activities) to the consolidated financial statements in Part II, Item 8 of the 2015 Form 10-K. 7.1 Accounting and Valuation
For a discussion of the Company’s accounting and valuation techniques related to securitization, see Note 2 (Significant Accounting Policies), Note 3 (Fair Values) and Note 13 (Variable Interest Entities and Securitization Activities) to the consolidated financial statements in Part II, Item 8 of the 2015 Form 10-K. 7.2 Securitization and Resecuritization Exposures in the Banking Book The following table presents the total outstanding exposures securitized by the Company as a sponsor for which the Company has retained credit or counterparty exposures in the banking book at December 31, 2015. This excludes securities held in the Company’s trading book and this table is primarily comprised of transactions in which the Company transferred assets and entered into a derivative transaction with the securitization SPE. For residential mortgage and commercial mortgage transactions, these derivatives are interest rate and/or currency swaps. Traditional securitization exposures reflect unpaid principal balances of the underlying collateral, and synthetic securitization exposures reflect notional amounts.
At December 31, 2015
Traditional
Exposure type Amounts Sold by
the Company
Amounts Sold by Third Parties in
Transactions Sponsored by the Company Synthetic
(dollars in millions)
Commercial mortgages ................................................................$ 7,570 $ 4,772 $ - Residential mortgages ................................................................ 688 - - Corporate debt ................................................................................................ - - - Asset-backed securitizations and other ................................................................ - - - Total ................................................................................................$ 8,258 $ 4,772 $ -

MORGAN STANLEY
Basel III Pillar 3 Disclosures Report
For the Quarterly Period Ended December 31, 2015
17
The following table is presented on a U.S. GAAP basis and reflects a summary of the Company’s securitization activity during 2015, regardless of whether the Company retained credit or counterparty exposure, including the amount of exposures securitized (by exposure type), and the corresponding recognized gain or loss on sale. This table includes assets transferred by unaffiliated co-depositors into these transactions. Year Ended December 31, 2015
Exposure type Amounts Sold by the Company(1)
Recognized Gain/(Loss)
on Sale
Amounts Sold by Third Parties in
Transactions Sponsored by the Company
(dollars in millions)
Commercial mortgages ................................................................$ 7,888 $ 39 $ 11,408 Residential mortgages ................................................................ 1,091 - - Corporate debt ................................................................................................ - - - Asset-backed securitizations and other ................................................................ - - - Total ................................................................................................$ 8,979 $ 39 $ 11,408 _____________ (1) Amounts represent notional value of assets which the Company contributed to the securitization.
The following table is presented on a U.S. GAAP basis and reflects a summary of the Company’s securitization activity during 2015, for those transactions in which the Company has not retained an interest, including the amount of exposures securitized (by exposure type), and the corresponding recognized gain or loss on sale. This table includes assets transferred by unaffiliated co-depositors into these transactions. Year Ended December 31, 2015
Exposure type Amounts Sold by the Company(1)
Recognized Gain/(Loss)
on Sale
Amounts Sold by Third Parties in
Transactions Sponsored by the Company
(dollars in millions)
Commercial mortgages ................................................................$ 2,876 $ 14 $ 7,128 Residential mortgages ................................................................ 402 - - Corporate debt ................................................................................................ - - - Asset-backed securitizations and other ................................................................ - - - Total ................................................................................................$ 3,278 $ 14 $ 7,128 _____________ (1) Amounts represent notional value of assets which the Company contributed to the securitization.
The following tables primarily include securities held in the Company’s AFS securities portfolios, warehouse loans and liquidity commitments made to securitization entities and transactions in which the Company entered into derivative transactions with a securitization issuer. The tables do not include securities held in the Company’s trading book. For information on securities held in the Company’s trading book, see “Securitization and Resecuritization Exposures in the Trading Book” in Section 7.3 herein. The Company did not retain any senior or subordinate tranches, nor recognized related credit losses in the banking book. During the quarter ended December 31, 2015, the Company did not have material impaired/past due exposures or losses on securitized assets. In addition, the Company may enter into derivative contracts, such as interest rate swaps with securitization SPEs. These derivative transactions generally represent senior obligations of the SPEs, senior to the most senior beneficial interest outstanding in the securitized exposures, and are included in the Company’s consolidated statements of financial condition primarily at fair value.

MORGAN STANLEY
Basel III Pillar 3 Disclosures Report
For the Quarterly Period Ended December 31, 2015
18
The following table is presented on a U.S. GAAP basis and reflects the outstanding exposures intended to be securitized:
Exposure type At December 31, 2015
(dollars in millions)
Commercial mortgages ................................................................................................................................$ 934 Residential mortgages ................................................................................................................................ - Corporate debt ................................................................................................................................ 8 Asset-backed securitizations and other ................................................................................................ - Total ................................................................................................................................................................$ 942
The following table presents the aggregate EAD amount of the Company’s outstanding on- and off-balance sheet securitization positions by exposure type: At December 31, 2015 Exposure type On-balance sheet Off-balance sheet Total
(dollars in millions)
Commercial mortgages ................................................................$ 5,097 $ 1,256 $ 6,353 Residential mortgages ................................................................ 2,024 16 2,040 Corporate debt ................................................................ 942 384 1,326 Asset-backed securitizations and other(1) ................................ 10,285 3,020 13,305 Total ................................................................................................$ 18,348 $ 4,676 $ 23,024 _____________ (1) Amounts primarily reflect student loans, auto receivables, servicer advance receivables, municipal bonds and credit card receivables.
The following tables present the aggregate EAD amount of securitization exposures retained or purchased and the associated RWAs for these exposures, categorized between securitization and re-securitization exposures. In addition, these exposures are further categorized into risk weight bands and by risk-based capital approaches. The Company employs the Supervisory Formula Approach and the Simplified Supervisory Formula Approach to calculate counterparty credit capital for securitization exposures in the Company’s banking book. The Supervisory Formula Approach uses internal models to calculate the risk weights for securitization exposures. The Simplified Supervisory Formula Approach is a simplified version of the Supervisory Formula Approach under which the risk weights for securitization exposures are determined using supervisory risk weights and other inputs. In those cases where the Company does not apply either of the Supervisory Formula Approach or the Simplified Supervisory Formula Approach, then the securitization exposures will be assigned to the 1,250% risk weight category. At December 31, 2015
Securitizations
Supervisory Formula Approach Simplified Supervisory
Formula Approach 1,250% Risk Weight Category
Risk Weight EAD RWAs EAD RWAs EAD RWAs
(dollars in millions)
0% to <=20% ................................$ 12,999 $ 2,756 $ 6,284 $ 1,332 $ - $ - >20% to <=100% ................................ 1,196 376 239 160 - - >100% to <=500% ................................ 51 193 1,889 3,433 - - >500% to <1250% ................................ - - 330 2,839 - - 1,250% ................................ - - - - 11 140 Total ................................$ 14,246 $ 3,325 $ 8,742 $ 7,764 $ 11 $ 140

MORGAN STANLEY
Basel III Pillar 3 Disclosures Report
For the Quarterly Period Ended December 31, 2015
19
At December 31, 2015 Re-securitizations
Supervisory Formula Approach Simplified Supervisory
Formula Approach 1,250% Risk Weight Category
Risk Weight EAD RWAs EAD RWAs EAD RWAs
(dollars in millions)
0% to <=20%................. $ - $ - $ - $ - $ - $ - >20% to =100%............ - - - - - - >100% to =500%.......... - - 26 86 - - >500% to 1250%.......... - - - - - - 1250%.............................
- - - - - 2 Total ................................$ - $ - $ 26 $ 86 $ - $ 2 At December 31, 2015, the amount of exposures that was deducted from Tier 1 common capital, representing the after-tax gain on sale resulting from securitization was $32 million. The following table presents the aggregate EAD amount of re-securitization exposures retained or purchased, categorized according to exposures to which credit risk mitigation is applied and those not applied.
At December 31, 2015
(dollars in millions)
Re-securitization exposures:
Re-securitization exposure to which credit risk mitigation is applied ................................................................$ - Re-securitization exposure to which credit risk mitigation is not applied ................................................................ 26 Total re-securitization exposures retained or purchased ................................................................$ 26 Total re-securitization exposure to guarantors ................................................................................................$ - Total re-securitization exposure not to guarantors ................................................................................................ 26 Total re-securitization exposures retained or purchased ................................................................$ 26
The credit risk of the Company’s securitizations and re-securitizations is controlled by actively monitoring and managing the associated credit exposures. The Company evaluates collateral quality, credit subordination levels and structural characteristics of securitization transactions at inception and on an ongoing basis, and manages exposures against internal concentration limits. 7.3 Securitization and Resecuritization Exposures in the Trading Book The Company also engages in securitization activities related to commercial and residential mortgage loans, corporate bonds and loans, municipal bonds and other types of financial instruments. The Company records such activities in the trading book.

MORGAN STANLEY
Basel III Pillar 3 Disclosures Report
For the Quarterly Period Ended December 31, 2015
20
The following table presents the Net Market Value of the Company’s aggregate on- and off-balance sheet securitization positions by exposure type, inclusive of hedges, in the trading book: At December 31, 2015
Exposures Net Market Value(1)
(dollars in millions)
Commercial mortgages ................................................................................................................................$ 1,658 Residential mortgages ................................................................................................................................ 1,817 Corporate debt(2) ................................................................................................................................ 1,385 Asset-backed securitizations and other ................................................................................................ 458 Total ................................................................................................................................$ 5,318
_____________
(1) Net Market Value represents the fair value for cash instruments and the replacement value for derivative instruments. (2) Amount includes correlation trading positions that are not eligible for Comprehensive Risk Measure (“CRM”) surcharge. For more information on CRM, see
Section 9.1 “Comprehensive Risk Measure” included herein.
The Company closely monitors the price, basis and liquidity risk in the covered securitization and resecuritization positions that are held in the trading book. Each position falls into at least one or more trading limits that have been set to limit the aggregate, concentration and basis risk in the portfolio to acceptable levels. Holdings are monitored against these limits on a daily basis. The inherent market risk of these positions are captured in various risk measurement models including Regulatory VaR, Regulatory stressed VaR and stress loss scenarios which are calculated and reviewed on a daily basis. Further, the Company regularly performs additional analysis to comprehend various risks in its securitization and resecuritization portfolio, and changes in these risks. Analysis is performed in accordance with U.S. Basel III to understand structural features of the portfolio and the performance of underlying collateral. The Company calculates the standard specific risk regulatory capital for securitization and resecuritization positions under the Simplified Supervisory Formula Approach. Under this approach, a risk weight assigned to each position is calculated based on a prescribed regulatory methodology. The resulting capital charge represents the higher of the total net long or net short capital charge calculated after applicable netting. In addition, the Company uses a variety of hedging strategies to mitigate credit spread and default risk for the securitization and resecuritization positions. Hedging decisions are based on market conditions, and are evaluated within the Company’s risk governance structure.
8 Interest Rate Risk Sensitivity Analysis The Company believes that the Net Interest Income Sensitivity Analysis is an appropriate representation of the Company’s U.S. Bank Subsidiaries’ interest rate risk for non-trading activities. For information on the interest rate risk sensitivity analysis, see “Quantitative and Qualitative Disclosures about Market Risk—Risk Management—Market Risk—Non-trading Risks – Interest Rate Risk Sensitivity” in Part II, Item 7A of the 2015 Form 10-K.
9 Market Risk Market risk refers to the risk that a change in the level of one or more market prices, rates, indices, implied volatilities (the price volatility of the underlying instrument imputed from option prices), correlations or other market factors, such as market liquidity, will result in losses for a position or portfolio. Generally, the Company incurs market risk as a result of trading, investing and client facilitation activities, principally within its Institutional Securities business segment where the substantial majority of the Company’s market risk capital is required. In addition, the Company incurs trading-related market risk within its Wealth Management business segment. The Company’s Investment Management business segment incurs principally Non-trading market risk primarily from investments in real estate funds and investments in private equity vehicles.

MORGAN STANLEY
Basel III Pillar 3 Disclosures Report
For the Quarterly Period Ended December 31, 2015
21
The following table presents the Company’s measure for market risk and market risk RWAs in accordance with the Advanced Approach, categorized by component type. RWAs for market risk are computed using either regulator-approved internal models or standardized methods that involve applying risk-weighting factors prescribed by regulators. Pursuant to U.S. Basel III, multiplying the measure for market risk by 12.5 results in market risk RWAs.
At December 31, 2015
Components of measure for market risk and market risk RWAs Measure for Market Risk RWAs(1)
(dollars in millions)
Regulatory VaR(2) ................................................................................................$ 615 $ 7,683 Regulatory stressed VaR(3) ................................................................................................ 1,661 20,765 Incremental risk charge(3) ................................................................................................ 308 3,847 Comprehensive risk measure(3)(4) ................................................................................................ 672 8,403 Specific risk: Non-securitizations(5) ................................................................................................ 1,308 16,357 Securitizations(6) ................................................................................................ 1,154 14,421 Total market risk ................................................................................................................................$ 5,718 $ 71,476 _____________ (1) For information on the Company’s market risk RWAs roll-forward from December 31, 2014 to December 31, 2015, see “MD&A—Liquidity and Capital
Resources—Regulatory Requirements—Implementation of U.S. Basel III— Regulatory Capital Ratios” in Part II, Item 7 of the 2015 Form 10-K. (2) Per regulatory requirements, the daily average of the previous 60 business days from the period-end date is utilized in the regulatory capital calculation. (3) Per regulatory requirements, the weekly average of the previous 12 weeks from the period-end date is utilized in the regulatory capital calculation. (4) Amounts include an 8% CRM surcharge computed under the standardized approach for positions eligible for CRM. As of the most recent reporting date, the
CRM surcharge related to RWAs was $5,987 million. For more information on CRM, see Section 9.1 “Comprehensive Risk Measure” included herein. (5) Non-securitization specific risk charges calculated using regulatory-prescribed risk-weighting factors for certain debt and equity positions. The prescribed risk-
weighting factors are generally based on, among other things, the Organization for Economic Cooperation and Development’s country risk classifications for the relevant home country (in the case of public sector and depository institution debt positions), the remaining contractual maturity and internal assessments of creditworthiness. Additionally, amounts include a De Minimis RWA for positions not captured in the VaR model.
(6) For information on market risk related to securitizations, see Section 7.3 “Securitization and Resecuritization Exposures in the Trading Book” included herein.
9.1 Model Methodology, Assumptions and Exposure Measures Regulatory VaR The Company estimates VaR using an internal model based on volatility-adjusted historical simulation for general market risk factors and Monte Carlo simulation for name-specific risk in corporate shares, bonds, loans and related derivatives. The model constructs a distribution of hypothetical daily changes in the value of trading portfolios based on the following: historical observation of daily changes in key market indices or other market risk factors; and information on the sensitivity of the portfolio values to these market risk factor changes. The Company’s VaR model uses four years of historical data with a volatility adjustment to reflect current market conditions. The Company utilizes the same VaR model for risk management purposes as well as regulatory capital calculations. The portfolio of positions used for the Company’s VaR for risk management purposes (“Management VaR”) differs from that used for regulatory capital requirements (“Regulatory VaR”), as it contains certain positions that are excluded from Regulatory VaR. Examples include counterparty CVAs and loans that are carried at fair value and associated hedges. For regulatory capital purposes, Regulatory VaR is computed at a 99% level of confidence over a 10-day time horizon. The Company’s Management VaR is computed at a 95% level of confidence over a one-day time horizon, which is a useful indicator of possible trading losses resulting from adverse daily market moves. For more information about the Company’s Management VaR model, related statistics and limit monitoring process, see “Quantitative and Qualitative Disclosures about Market Risk—Risk Management—Market Risk” in Part II, Item 7A of the 2015 Form 10-K.

MORGAN STANLEY
Basel III Pillar 3 Disclosures Report
For the Quarterly Period Ended December 31, 2015
22
The following table presents the period-end, daily average, and high and low Regulatory VaR by risk category for a 10-day holding period for the quarter ended December 31, 2015. Additionally, the daily average Regulatory VaR for a one-day holding period is shown for comparison. The metrics below are calculated over the calendar quarter and therefore may not coincide with the period applied in the regulatory capital calculations.
99% Regulatory VaR
Quarter Ended December 31, 2015
One-Day
Holding Period 10-Day Holding Period
Daily
Average(1) Period End Daily
Average(1) High Low
(dollars in millions)
Interest rate ................................................................$ 40 $ 98 $ 126 $ 174 $ 95 Credit spread ................................................................ 35 104 111 138 96 Equity price ................................................................ 26 78 84 115 71 Foreign exchange rate ................................................................ 15 27 48 87 27 Commodity price ................................................................ 17 36 53 94 32 Less: Diversification benefit(2)(3) ................................ (67) (174) (213) N/A N/ATotal Regulatory VaR ................................................................$ 66 $ 169 $ 209 $ 259 $ 169 _____________ N/A–Not Applicable (1) The daily average shown is calculated over the entire quarter. Per regulatory requirements, the daily average of the previous 60 business days from the period-
end date is utilized in the regulatory capital calculation. (2) Diversification benefit equals the difference between the total Regulatory VaR and the sum of the component VaRs. This benefit arises because the simulated
one-day losses for each of the components occur on different days; similar diversification benefits also are taken into account within each component. (3) The high and low VaR values for the total Regulatory VaR and each of the component VaRs might have occurred on different days during the quarter, and
therefore the diversification benefit is not an applicable measure.
Regulatory Stressed VaR Regulatory stressed VaR is calculated using the same methodology and portfolio composition as Regulatory VaR. However, Regulatory stressed VaR is based on a continuous one-year historical period of significant market stress, appropriate to the Company’s portfolio. The Company’s selection of the one-year stressed window is evaluated on an ongoing basis.

MORGAN STANLEY
Basel III Pillar 3 Disclosures Report
For the Quarterly Period Ended December 31, 2015
23
The following table presents the period-end, weekly average, and high and low Regulatory stressed VaR for a 10-day holding period for the quarter ended December 31, 2015. Additionally, the weekly average Regulatory stressed VaR for a one-day holding period is shown for comparison. The metrics below are calculated over the calendar quarter and therefore may not coincide with the period applied in the regulatory capital calculations.
99% Regulatory Stressed VaR
Quarter Ended December 31, 2015
One-Day
Holding Period 10-Day Holding Period
Weekly
Average(1) Period End Weekly
Average(1) High Low (dollars in millions)
Total Regulatory stressed VaR ................................$ 177 $ 469 $ 559 $ 694 $ 469 _____________ (1) The weekly average shown is calculated over the entire quarter. Per regulatory requirements, the weekly average of the previous 12 weeks from the period-end
date is utilized in the regulatory capital calculation.
Incremental Risk Charge The Incremental Risk Charge (“IRC”) is an estimate of default and migration risk of unsecuritized credit products in the trading book. The IRC also captures recovery risk, and assumes that average recoveries are lower when default rates are higher. A Monte Carlo simulation-based model is used to calculate the IRC at a 99.9% level of confidence over a one-year time horizon. A constant level of risk assumption is imposed which ensures that all positions in the IRC portfolio are evaluated over the full one-year time horizon. The IRC model differentiates the underlying traded instruments by liquidity horizons, with the minimum liquidity horizon set to 3 months. Lower rated issuers receive longer liquidity horizons of between 6 and 12 months. In addition to the ratings-based liquidity horizon, the Company also applies liquidity horizon penalties to positions that are deemed concentrated. The following table presents the period-end, weekly average, and high and low IRC for the quarter ended December 31, 2015. The metrics below are calculated over the calendar quarter and therefore may not coincide with the period applied in the regulatory capital calculations. Quarter Ended December 31, 2015
Period End Weekly
Average(1) High Low (dollars in millions)
Total Incremental Risk Charge ................................................................$ 308 $ 222 $ 308 $ 126 _____________ (1) The weekly average shown is calculated over the entire quarter. Per regulatory requirements, the weekly average of the previous 12 weeks from the period-end
date is utilized in the regulatory capital calculation.
Comprehensive Risk Measure Comprehensive Risk Measure (“CRM”) is an estimate of risk in the correlation trading portfolio, taking into account credit spread, correlation, basis, recovery and default risks. A Monte Carlo simulation-based model is used to calculate the CRM at a 99.9% level of confidence over a one-year time horizon, applying the constant level of risk assumption. All positions in the CRM portfolio are given a liquidity horizon of 6 months. Positions eligible for CRM are also subject to an 8% capital surcharge, which is reflected in “Comprehensive risk measure” in the “Components of measure for market risk and market risk RWAs” table in Section 9 herein. Correlation Trading Positions A correlation trading position is a securitization position for which all or substantially all of the value of the underlying exposure is based on the credit quality of a single company for which a two-way market exists, or on commonly traded indices based on such exposures for which a two-way market exists on the indices. Hedges of correlation trading positions

MORGAN STANLEY
Basel III Pillar 3 Disclosures Report
For the Quarterly Period Ended December 31, 2015
24
are also considered correlation trading positions. For the quarter ended December 31, 2015, the Company’s aggregate CRM eligible correlation trading positions had a Net Market Value3 of $1,320 million, which is comprised of net long market values of $400 million and net short market values of $920 million. The net long and net short market values are inclusive of netting permitted under U.S. Basel III. The following table presents the period-end, weekly average, and high and low CRM for the quarter ended December 31, 2015. The metrics below are calculated over the calendar quarter and therefore may not coincide with the period applied in the regulatory capital calculations. Quarter Ended December 31, 2015
Period End Weekly
Average(1) High(2) Low(2) (dollars in millions)
Comprehensive Risk Measure Modeled ................................................................$ 209 $ 196 $ 233 $ 146 Comprehensive Risk Measure Surcharge ................................ 384 485 552 384 Total Comprehensive Risk Measure ................................................................$ 593 $ 681 $ 784 $ 593 _____________ (1) The weekly average shown is calculated over the entire quarter. Per regulatory requirements, the weekly average of the previous 12 weeks from the period-end
date is utilized in the regulatory capital calculation. (2) The high and low measures for the modeled and surcharge measures are evaluated independently. As a result, the high and low measures can occur on different
reporting dates and may not be additive to the total charge.
9.2 Model Limitations The Company uses VaR and Stressed VaR as components in a range of risk management tools. Among their benefits, VaR models permit estimation of a portfolio’s aggregate market risk exposure, incorporating a range of varied market risks and portfolio assets. However, VaR has various limitations, which include, but are not limited to: use of historical changes in market risk factors, which may not be accurate predictors of future market conditions, and may not fully incorporate the risk of extreme market events that are outsized relative to observed historical market behavior or reflect the historical distribution of results beyond the 99% confidence interval; and reporting of losses over a defined time horizon, which does not reflect the risk of positions that cannot be liquidated or hedged over that defined horizon. The Company also uses IRC and CRM models to measure default and migration risk of credit spread and correlation trading positions in the trading book. Among their benefits, these models permit estimation of a portfolio’s aggregate exposure to default and migration risk, incorporating a range of market risk factors in a period of financial stress. However, the IRC and CRM models have various limitations, which include, but are not limited to: use of historical default rates, credit spread movements, correlation and recovery rates, which may not be accurate predictors of future credit environments, and may not fully incorporate the risk of extreme credit events that are outsized relative to observed historical behavior or reflect the historical distribution of results beyond the 99.9% confidence interval. Regulatory VaR, Regulatory stressed VaR, IRC and CRM numbers are not readily comparable across firms because of differences in the firms’ portfolios, modeling assumptions and methodologies. In IRC and CRM, those differences may be particularly pronounced because of the long risk horizon measured by these models as well as the difficulty in performing backtesting. These differences can result in materially different numbers across firms for similar portfolios. As a result, the model-based numbers tend to be more useful when interpreted as indicators of trends in a firm's risk profile rather than as an absolute measure of risk to be compared across firms. 9.3 Model Validation The Company validates its Regulatory VaR model, Regulatory stressed VaR model, IRC model and CRM model on an ongoing basis. The Company’s model validation process is independent of the internal models’ development, implementation and operation. The validation process includes, among other things, an evaluation of the conceptual soundness of the internal models.
3 Net Market Value represents the fair value for cash instruments and the replacement value for derivative instruments.

MORGAN STANLEY
Basel III Pillar 3 Disclosures Report
For the Quarterly Period Ended December 31, 2015
25
The Company’s Regulatory VaR model, Regulatory stressed VaR model, IRC model and CRM model have all been approved for use by the Company’s regulators. 9.4 Regulatory VaR Backtesting One method of evaluating the reasonableness of the Company’s VaR model as a measure of the Company’s potential volatility of net revenue is to compare the VaR with the hypothetical buy-and-hold trading revenue. Assuming no intra-day trading, for a 99%/one-day VaR, the expected number of times that trading losses should exceed VaR during the year is two to three times, and, in general, if trading losses were to exceed VaR more than ten times in a year, the adequacy of the VaR model would be questioned. For days where losses exceed the VaR statistic, the Company examines the drivers of trading losses to evaluate the VaR model’s accuracy relative to realized trading results. The Company regularly conducts a comparison of its VaR-based estimates with buy-and-hold gains or losses experienced (“backtesting”). The buy-and-hold gains or losses are defined in the U.S. Basel III as profits or losses on covered positions, as defined in Section 9.5 below, excluding fees, commissions, reserves, net interest income and intraday trading. The buy-and-hold gains or losses utilized for Regulatory VaR backtesting differs from the daily net trading revenue as disclosed in “Quantitative and Qualitative Disclosures about Market Risk—Risk Management—Market Risk” in Part II, Item 7A of the 2015 Form 10-K. The Company had no Regulatory VaR backtesting exceptions during the quarter ended December 31, 2015. 9.5 Covered Positions During the quarter ended December 31, 2015, the Company had exposures to a wide range of interest rates, credit spread, equity prices, foreign exchange rates and commodity prices—and the associated implied volatilities and spreads—related to the global markets in which it conducts its trading activities. For more information about such exposures, see “Quantitative and Qualitative Disclosures about Market Risk—Risk Management—Market Risk—Sales and Trading and Related Activities” in Part II, Item 7A of the 2015 Form 10-K. Under U.S. Basel III, covered positions include trading assets or liabilities held by the Company for the purpose of short-term resale or with the intent of benefiting from actual or expected price movements related to its market-making activities, as well as, foreign exchange and commodity exposure of certain banking book assets. CVA is not a covered position under U.S. Basel III and as a result, hedges to the non-covered CVA are themselves not eligible to be covered positions. The Company manages its covered positions by employing a variety of risk mitigation strategies. These strategies include diversification of risk exposures and hedging. Hedging activities consist of the purchase or sale of positions in related securities and financial instruments, including a variety of derivative products (e.g., futures, forwards, swaps and options). Hedging activities may not always provide effective mitigation against trading losses due to differences in the terms, specific characteristics or other basis risks that may exist between the hedge instrument and the risk exposure that is being hedged. The Company manages the market risk associated with its trading activities on a Company-wide basis, on a world-wide trading division level and on an individual product basis. The Company manages and monitors its market risk exposures in such a way as to maintain a portfolio that the Company believes is well-diversified in the aggregate with respect to market risk factors and that reflects the Company’s aggregate risk tolerance as established by the Company’s senior management. Valuation Policies, Procedures, and Methodologies for Covered Positions For more information on the Company’s valuation policies, procedures, and methodologies for covered positions (trading assets and trading liabilities), see Note 2 (Significant Accounting Policies) and Note 3 (Fair Values) to the consolidated financial statements in Part II, Item 8 of the 2015 Form 10-K. 9.6 Stress Testing of Covered Positions The Company stress tests the market risk of its covered positions at a frequency appropriate to each portfolio and in no case less frequently than quarterly. The stress tests take into account concentration risk, illiquidity under stressed market conditions and other risks arising from the Company’s trading activities. In addition, the Company utilizes a proprietary economic stress testing methodology that comprehensively measures the Company’s market and credit risk. The methodology simulates many stress scenarios based on more than 25 years of

MORGAN STANLEY
Basel III Pillar 3 Disclosures Report
For the Quarterly Period Ended December 31, 2015
26
historical data and attempts to capture the different liquidities of various types of general and specific risks. Event and default risks for relevant credit portfolios are also captured. Furthermore, as part of the Federal Reserve’s annual Comprehensive Capital Analysis and Review, commonly referred to as “CCAR,” the Company is required to perform annual capital stress testing under scenarios prescribed by the Federal Reserve. The stress testing results are submitted to the Federal Reserve and a summary of the results under the severely adverse economic scenario is publicly disclosed. For more information on the Company’s capital plans and stress tests, see “MD&A—Liquidity and Capital Resources—Regulatory Requirements” in Part II, Item 7 of the 2015 Form 10-K. 10 Operational Risk
As defined by Basel III, operational risk is the risk of loss resulting from inadequate or failed internal processes, people, and systems or from external events (including legal risk but excluding strategic and reputational risk). The Company may incur operational risk across the full scope of its business activities, including revenue-generating activities (e.g., sales and trading) and support and control groups (e.g., information technology and trade processing). For a further discussion of the Company’s operational risk, see “Quantitative and Qualitative Disclosures about Market Risk—Risk Management—Operational Risk” in Part II, Item 7A of the 2015 Form 10-K. As an advanced approach banking organization, the Company is required to compute operational risk RWAs using an advanced measurement approach. The Company has established an operational risk framework to identify, measure, monitor and control risk across the Company. Effective operational risk management is essential to reducing the impact of operational risk incidents and mitigating legal and regulatory risks. The framework is continually evolving to account for changes in the Company and to respond to the changing regulatory and business environment. The Company has implemented operational risk data and assessment systems to monitor and analyze internal and external operational risk events, to assess business environment and internal control factors and to perform scenario analysis. The collected data elements are incorporated in the Company’s operational risk capital model. The model encompasses both quantitative and qualitative elements. Internal loss data and scenario analysis results are direct inputs to the capital models, while external operational risk incidents and business environment and internal control factors are evaluated as part of the scenario analysis process. The Company maintains governance, review, and validation processes of its advanced measurement approach framework. The Company uses the Loss Distribution Approach to model operational risk exposures. In this approach, loss frequency and severity distributions are separately modeled using the Company’s internal loss data experience and combined to produce an Aggregate Loss Distribution at various confidence levels over a one-year period. Regulatory Operational Risk capital is calculated at the 99.9% confidence level. The model also includes Scenario Analysis estimates to complement the Internal Loss Data model. Scenario Analysis is a forward-looking systematic process to obtain plausible high severity and low frequency estimates of operational risk losses based on expert opinion. This modeling process is performed separately on each of the units of measure. The results are aggregated across all units of measure, taking into account diversification, to determine operational risk regulatory capital. In addition, the Company employs a variety of risk processes and mitigants to manage its operational risk exposures. These include a strong governance framework, a comprehensive risk management program and insurance. The Company continually undertakes measures to improve infrastructure and mitigate operational risk. The goal of the Company’s operational risk management framework is to identify and assess significant operational risks and to ensure that appropriate mitigation actions are undertaken. Operational risks and associated risk exposures are assessed relative to the risk tolerance established by the Company’s Board of Directors and are prioritized accordingly. The breadth and range of operational risk are such that the types of mitigating activities are wide-ranging. Examples of activities include the enhancing defenses against cyberattacks, use of legal agreements and contracts to transfer and/or limit operational risk exposures; due diligence; implementation of enhanced policies and procedures; exception management processing controls; and segregation of duties. See “Capital Adequacy” in Section 4 herein for the Company’s operational risk RWAs at December 31, 2015. 11 Supplementary Leverage Ratio The Company and its U.S. Bank Subsidiaries are required to publicly disclose their U.S. Basel III Supplementary Leverage Ratios (“SLR”), which will become effective as a capital standard on January 1, 2018. In addition to the SLR, the Company is also subject to a Tier 1 leverage ratio capital standard that is currently in effect.

MORGAN STANLEY
Basel III Pillar 3 Disclosures Report
For the Quarterly Period Ended December 31, 2015
27
The Tier 1 leverage ratio and SLR are capital measures that are both computed under U.S. Basel III transitional rules, with the primary difference between the two being that the SLR denominator includes off-balance sheet exposures. The SLR denominator is calculated for each reporting period based on the average daily balance of consolidated on-balance sheet assets under U.S. GAAP during the calendar quarter less certain amounts deducted from Tier 1 capital at quarter-end. The SLR denominator also includes the arithmetic mean of month-end balances during the calendar quarter of certain off-balance sheet exposures associated with derivatives (including derivatives that are centrally cleared for clients and sold credit protection), repo-style transactions and other off-balance sheet items. For more information on the supplementary leverage ratio, see “MD&A—Liquidity and Capital Resources—Regulatory Requirements—Supplementary Leverage Ratio” in Part II, Item 7 of the 2015 Form 10-K. Summary comparison of accounting assets and pro forma supplementary leverage ratio: The following table presents the consolidated total assets under U.S. GAAP and the pro forma supplementary leverage exposure.
At
December 31, 2015
(dollars in millions)
Total consolidated assets(1) ................................................................................................................................$ 787,465 Consolidated daily average total assets(2) ................................................................................................$ 813,715 Adjustment for investments in banking, financial, insurance or commercial entities that are consolidated for accounting purposes but outside the scope of regulatory consolidation................................ - Adjustment for fiduciary assets recognized on balance sheet but excluded from total leverage exposure ................................................................................................................................ - Adjustment for derivative exposures(3) ................................................................................................ 216,317 Adjustment for repo-style transactions(3) ................................................................................................ 15,064 Adjustment for off-balance sheet exposures(3)................................................................................................ 62,850 Other adjustments(4) ................................................................................................................................ (10,141) Pro forma supplementary leverage exposure ................................................................................................$ 1,097,805 _____________ (1) Total consolidated on-balance sheet assets under U.S. GAAP. (2) Computed as the average daily balance of consolidated total assets under U.S. GAAP during the calendar quarter. (3) Computed as the arithmetic mean of the month-end balances over the calendar quarter. (4) Reflects adjustments to Tier 1 capital, including disallowed goodwill, transitional intangible assets, certain deferred tax assets, certain investments in the capital
instruments of unconsolidated financial institutions and other adjustments.

MORGAN STANLEY
Basel III Pillar 3 Disclosures Report
For the Quarterly Period Ended December 31, 2015
28
Supplementary leverage ratio: The following table presents the Company’s Tier 1 leverage ratio, as well as the detailed components of the SLR computation, under U.S. Basel III transitional rules.
At
December 31, 2015
(dollars in millions)
On-balance-sheet exposures
On-balance sheet assets (excluding on-balance sheet assets for repo-style transactions and derivative
exposures, but including cash collateral received in derivative transactions)(1) ................................$ 532,653 Less: Amounts deducted from tier 1 capital(2) ................................................................................................ (10,141) Total on-balance sheet exposures (excluding on-balance sheet assets for repo style transactions and derivatives exposures, but including cash collateral received in in derivative transactions) ................................................................................................................................$ 522,512 Derivative disclosures Replacement cost for derivative exposures (net of cash variation margin)(1) ................................................................$ 30,457 Add-on amounts for potential future exposure (PFE) for derivatives(3) ................................................................ 167,526 Gross-up for cash collateral posted if deducted from the on-balance sheet assets, except for cash variation margin that meets qualifying criteria(3) ................................................................................................ 6,173 Less: Deductions of receivable assets for cash variation margin posted in derivative transactions, if included in on-balance sheet assets ................................................................ - Less: Exempted CCP leg of client-cleared transactions(4) ................................................................ - Effective notional principal amount of sold credit protection(3) ................................................................ 793,170 Less: Effective notional principal amount offsets and PFE adjustments for sold credit protection(3) ................................................................................................................................ (750,552) Total derivatives exposures ................................................................................................................................$ 246,774 Repo-style transactions On-balance sheet assets for repo-style transactions, including the gross value of receivables for reverse repurchase transactions and the value of securities that qualified for sales treatment, and excluding the value of securities received in a security-for-security repo-style transaction where the securities lender has not sold or re-hypothecated the securities received(1) ................................$ 316,950 Less: Reduction of the gross value of receivables in reverse repurchase transactions by cash payables in repurchase transactions under netting agreements(1) ................................................................ (66,345) Counterparty credit risk for all repo-style transactions(3) ................................................................ 15,064 Exposure for repo-style transactions where a banking organization acts as an agent ................................ - Total repo-style transactions ................................................................................................................................$ 265,669 Other off-balance sheet exposures Off-balance sheet exposures at gross notional amounts(3)(5) ................................................................$ 130,811 Less: Adjustments for conversion to credit equivalent amounts(3) ................................................................ (67,961) Total off-balance sheet exposures ................................................................................................$ 62,850 Pro forma supplementary leverage exposure ................................................................................................$ 1,097,805 Tier 1 capital(6) ................................................................................................................................ 66,722 Pro forma supplementary leverage ratio(7) ................................................................................................ 6.1%
Tier 1 leverage ratio(8)................................................................................................................................ 8.3% ________

MORGAN STANLEY
Basel III Pillar 3 Disclosures Report
For the Quarterly Period Ended December 31, 2015
29
(1) Computed as the average daily balance of consolidated total assets under U.S. GAAP during the calendar quarter. (2) Reflects adjustments to Tier 1 capital, including disallowed goodwill, transitional intangible assets, certain deferred tax assets, certain investments in the capital
instrument of unconsolidated financial institutions and other adjustments. (3) Computed as the arithmetic mean of the month-end balances over the calendar quarter. (4) In accordance with U.S. GAAP, the Central Counterparty (CCP)-facing leg of client-cleared transactions is not included in on-balance sheet asset; therefore, an
adjustment is not required under the SLR rules. (5) Off-balance sheet exposures primarily include lending commitments, forward starting reverse repurchase agreements, standby letters of credit and other
unfunded commitments and guarantees. (6) Amount represents Tier 1 capital calculated under U.S. Basel III transitional rules. (7) The supplementary leverage ratio equals Tier 1 capital (calculated under U.S. Basel III transitional rules) divided by the pro forma supplementary leverage
exposure. (8) The Tier 1 leverage ratio equals Tier 1 capital (calculated under U.S. Basel III transitional rules) divided by the average daily balance of consolidated on-balance
sheet assets under U.S. GAAP during the calendar quarter, adjusted for disallowed goodwill, transitional intangible assets, certain deferred tax assets, certain investments in the capital instruments of unconsolidated financial institutions and other adjustments in accordance with U.S. Basel III rules.

MORGAN STANLEY
Basel III Pillar 3 Disclosures Report
For the Quarterly Period Ended December 31, 2015
30
12 Disclosure Map
2015 Annual Report on Form 10-K
For the quarterly period ended December 31, 2015
Basel III Pillar 3 Requirement Description
Basel III Pillar 3 Report
(Disclosure starts on page number)
Scope of Application Business ................................................................ 1 1 Regulatory capital framework ................................................................ 85 1 Capital Structure Capital instruments ................................................................ 87, 194, 218 2 Restrictions and other major impediments to transfer of funds or capital ................................ 16, 119, 214 2 Capital structure ................................................................ 89 2 Capital Adequacy Required capital framework ................................................................ 95 2 Credit risk, market risk and operational risk RWAs roll-forwards ................................ 91 3 Risk management objectives, structure and policies ................................ 98 4 Credit Risk Credit risk and credit risk management framework ................................ 107 4 Risk governance structure ................................................................ 98 4 Master netting agreements and collateral agreements ................................ 167, 181 6 Guarantees ................................................................ 199 6 Reconciliation of changes in allowance for loan losses ................................ 189 6 Credit quality indicator................................................................ 186 6 Determination of past due or delinquency status ................................ 187 6 Identification of impaired loans for financial accounting purposes ................................ 138 6 General Disclosure for Wholesale Counterparty Credit Risk of Derivative Contracts, Repo-Style Transactions and Margin Lending
Use of collateral as a credit risk mitigants and master netting agreements ................................ 167, 181 9 Valuation approaches ................................................................ 131, 141 10 Credit derivatives ................................................................ 114, 173 11 Additional collateral requirements due to credit rating downgrade ................................ 82 12
Credit Risk Mitigation Impact of netting on the Company's credit exposures ................................ 107 13 Equities Not Subject to Market Risk Capital Rule
Valuation techniques related to investments ................................ 131 15 Deductions under the Volcker Rule ................................................................ 3 15
Securitization Securitization transactions ................................................................ 212 16 Accounting and valuation techniques related to securitization ................................ 129, 141, 205 16 Interest Rate Risk for Non-Trading Activities
Interest rate risk sensitivity analysis ................................................................ 106 20
Market Risk Management VaR model, related statistics and limit monitoring process ................................ 102 21 Daily net trading revenues ................................................................ 106 24 Primary market risk exposures and market risk management ................................ 102 25 Valuation policies, procedures and methodologies for covered positions ................................ 131, 141 25 Capital plans and stress tests ................................................................ 93 25
Operational Risk Operational Risk ................................................................ 118 26 Supplementary Leverage Ratio Supplementary Leverage Ratio ................................................................ 94 27