Embed Size (px)
Citation preview

138943.4
Basel III - Pillar 3
Semiannual Disclosures
As at 30th June 2017
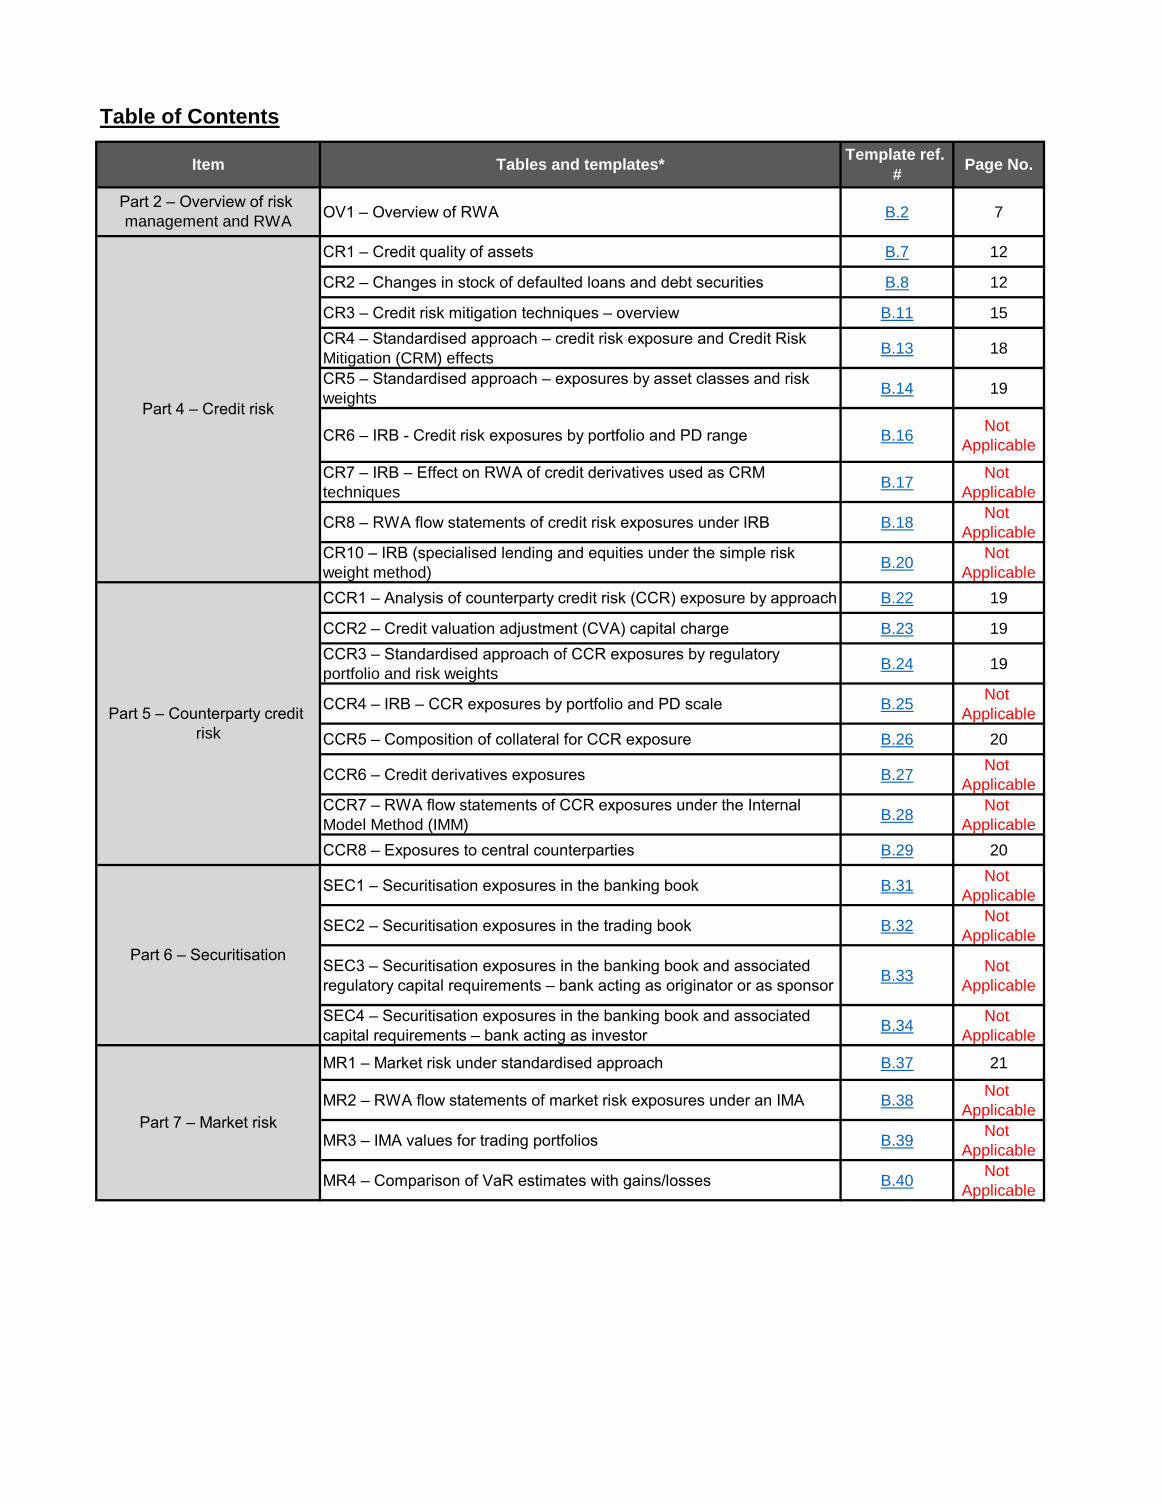
Table of Contents
OV1 – Overview of RWA B.2 7
CR1 – Credit quality of assets B.7 12
CR2 – Changes in stock of defaulted loans and debt securities B.8 12
CR3 – Credit risk mitigation techniques – overview B.11 15
CR4 – Standardised approach – credit risk exposure and Credit Risk
Mitigation (CRM) effects B.13 18
CR5 – Standardised approach – exposures by asset classes and risk
weights B.14 19
CR6 – IRB - Credit risk exposures by portfolio and PD range B.16Not
Applicable
CR7 – IRB – Effect on RWA of credit derivatives used as CRM
techniques B.17
Not
Applicable
CR8 – RWA flow statements of credit risk exposures under IRB B.18Not
Applicable
CR10 – IRB (specialised lending and equities under the simple risk
weight method) B.20
Not
Applicable
CCR1 – Analysis of counterparty credit risk (CCR) exposure by approach B.22 19
CCR2 – Credit valuation adjustment (CVA) capital charge B.23 19
CCR3 – Standardised approach of CCR exposures by regulatory
portfolio and risk weights B.24 19
CCR4 – IRB – CCR exposures by portfolio and PD scale B.25Not
Applicable
CCR5 – Composition of collateral for CCR exposure B.26 20
CCR6 – Credit derivatives exposures B.27Not
Applicable
CCR7 – RWA flow statements of CCR exposures under the Internal
Model Method (IMM) B.28
Not
Applicable
CCR8 – Exposures to central counterparties B.29 20
SEC1 – Securitisation exposures in the banking book B.31Not
Applicable
SEC2 – Securitisation exposures in the trading book B.32Not
Applicable
SEC3 – Securitisation exposures in the banking book and associated
regulatory capital requirements – bank acting as originator or as sponsor B.33
Not
Applicable
SEC4 – Securitisation exposures in the banking book and associated
capital requirements – bank acting as investor B.34
Not
Applicable
MR1 – Market risk under standardised approach B.37 21
MR2 – RWA flow statements of market risk exposures under an IMA B.38Not
Applicable
MR3 – IMA values for trading portfolios B.39Not
Applicable
MR4 – Comparison of VaR estimates with gains/losses B.40Not
Applicable
Part 2 – Overview of risk
management and RWA
Part 7 – Market risk
Item Tables and templates*Template ref.
#Page No.
Part 5 – Counterparty credit
risk
Part 6 – Securitisation
Part 4 – Credit risk
SAR '000
a b c
T
Jun-17
T-1
Mar-17
T
Jun-17
1 Credit risk (excluding counterparty credit risk) (CCR) 84,522,362 87,982,782 6,761,787
2 Of which standardised approach (SA) 84,522,362 87,982,782 6,761,787
3 Of which internal rating-based (IRB) approach -
4 Counterparty credit risk 1,736,793 1,890,776 138,943
5 Of which standardised approach for counterparty credit risk (SA-CCR)* 1,736,793 1,890,776 138,943
6 Of which internal model method (IMM) -
7 Equity positions in banking book under market-based approach - -
8 Equity investments in funds – look-through approach -
9 Equity investments in funds – mandate-based approach -
10 Equity investments in funds – fall-back approach -
11 Settlement risk -
12 Securitisation exposures in banking book - - -
13 Of which IRB ratings-based approach (RBA) -
14 Of which IRB Supervisory Formula Approach (SFA) -
15 Of which SA/simplified supervisory formula approach (SSFA) -
16 Market risk 238,718 167,242 19,097
17 Of which standardised approach (SA) 238,718 167,242 19,097
18 Of which internal model approaches (IMM) - -
19 Operational risk 5,834,538 5,684,463 466,763
20 Of which Basic Indicator Approach -
21 Of which Standardised Approach 5,834,538 5,684,463 466,763
22 Of which Advanced Measurement Approach -
23 Amounts below the thresholds for deduction (subject to 250% risk weight) -
24 Floor adjustment -
25 Total (1+4+7+8+9+10+11+12+16+19+23+24) 92,332,411 95,725,263 7,386,591
B.2 - Template OV1: Overview of RWA
RWA
Minimum
capital
requirements
Explanation of signficant drivers behind differences in reporting periods T and T-1:
There is no significant movement in RWA between the periods, however the RWAs are lower for the quarter ended 30th June 2017 due to
reduction in the loans and advances portfolio and the reduction of the Residential Mortgage risk weight from 100% to 75%, effective from 1st
April 2017 as per regulatory requirement.
a b c d
Defaulted exposures Non-defaulted exposures
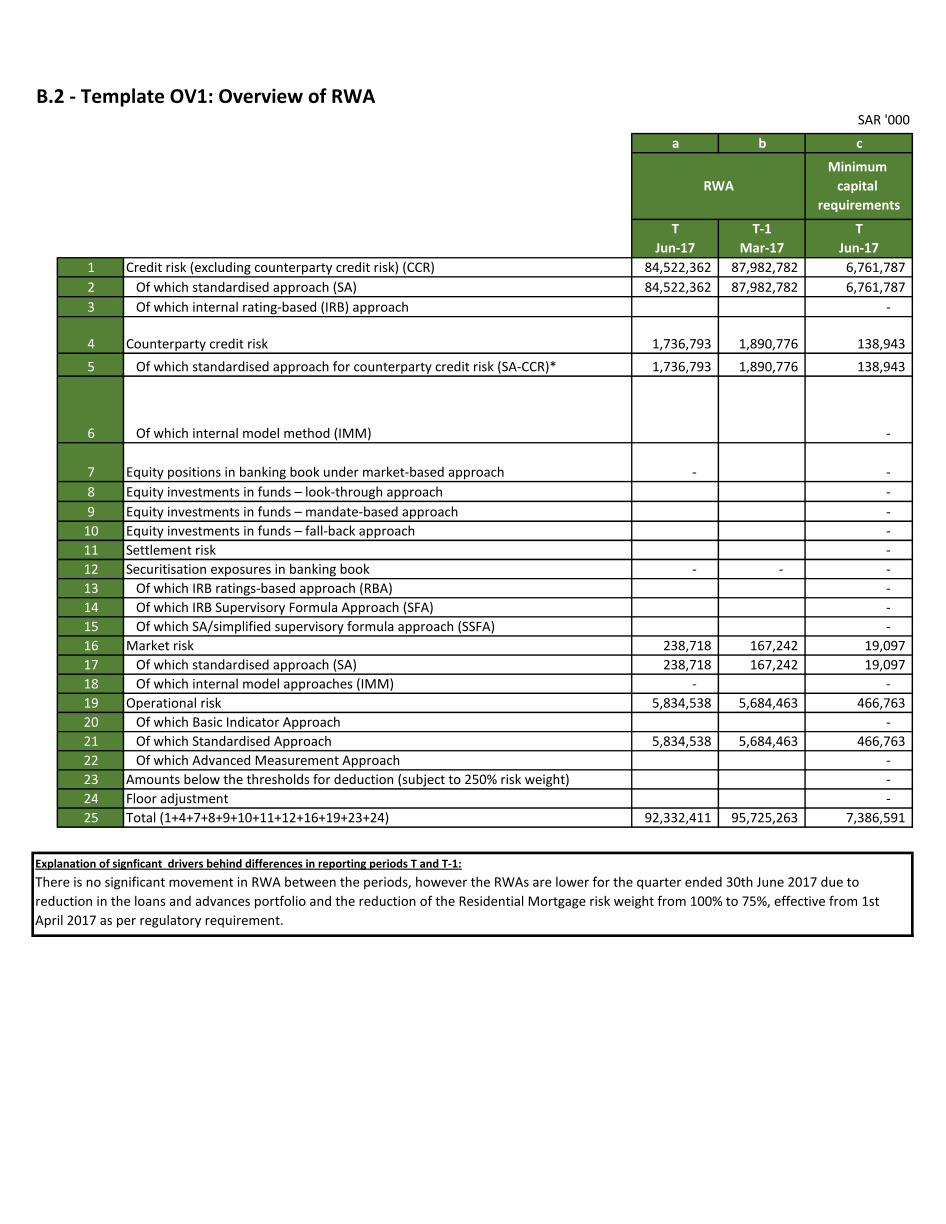
1 Loans 1,969,898 71,361,765 2,592,651 70,739,012
2 Debt Securities - 14,837,113 - 14,837,113
3 Off-balance sheet exposures - 27,176,261 - 27,176,261
4 Total 1,969,898 113,375,139 2,592,651 112,752,386
Cross validation 1,969,898
Difference -
B.7 - Template CR1: Credit quality of assets
A specific allowance for credit losses due to impairment of a loan or any other financial assets held at amortised cost is established if there is objective
evidence that the Group will not be able to collect all amounts due.
Consumer loans/Home finance are considered to be impaired when a payment is overdue for 90 days and above.
Allowances/
impairments
Gross carrying values ofNet values
(a+b-c)
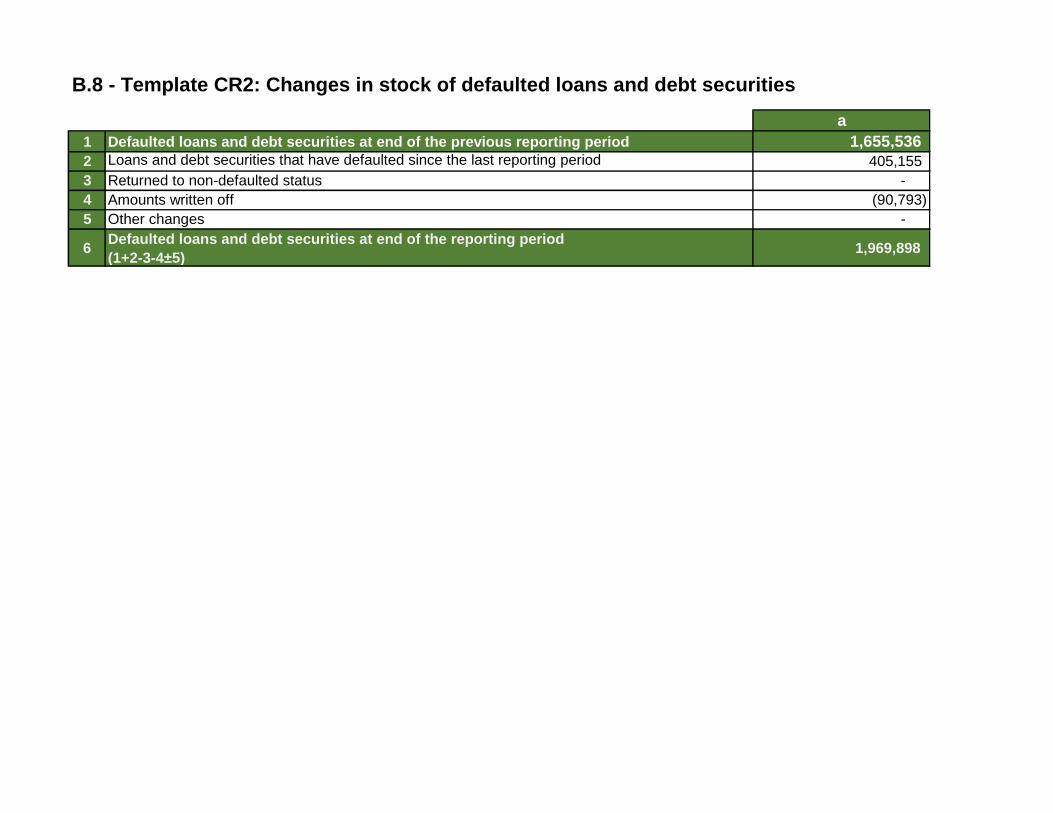
B.8 - Template CR2: Changes in stock of defaulted loans and debt securities
a
1 Defaulted loans and debt securities at end of the previous reporting period 1,655,536
2 Loans and debt securities that have defaulted since the last reporting period 405,155
3 Returned to non-defaulted status -
4 Amounts written off (90,793)
5 Other changes -
6Defaulted loans and debt securities at end of the reporting period
(1+2-3-4±5) 1,969,898
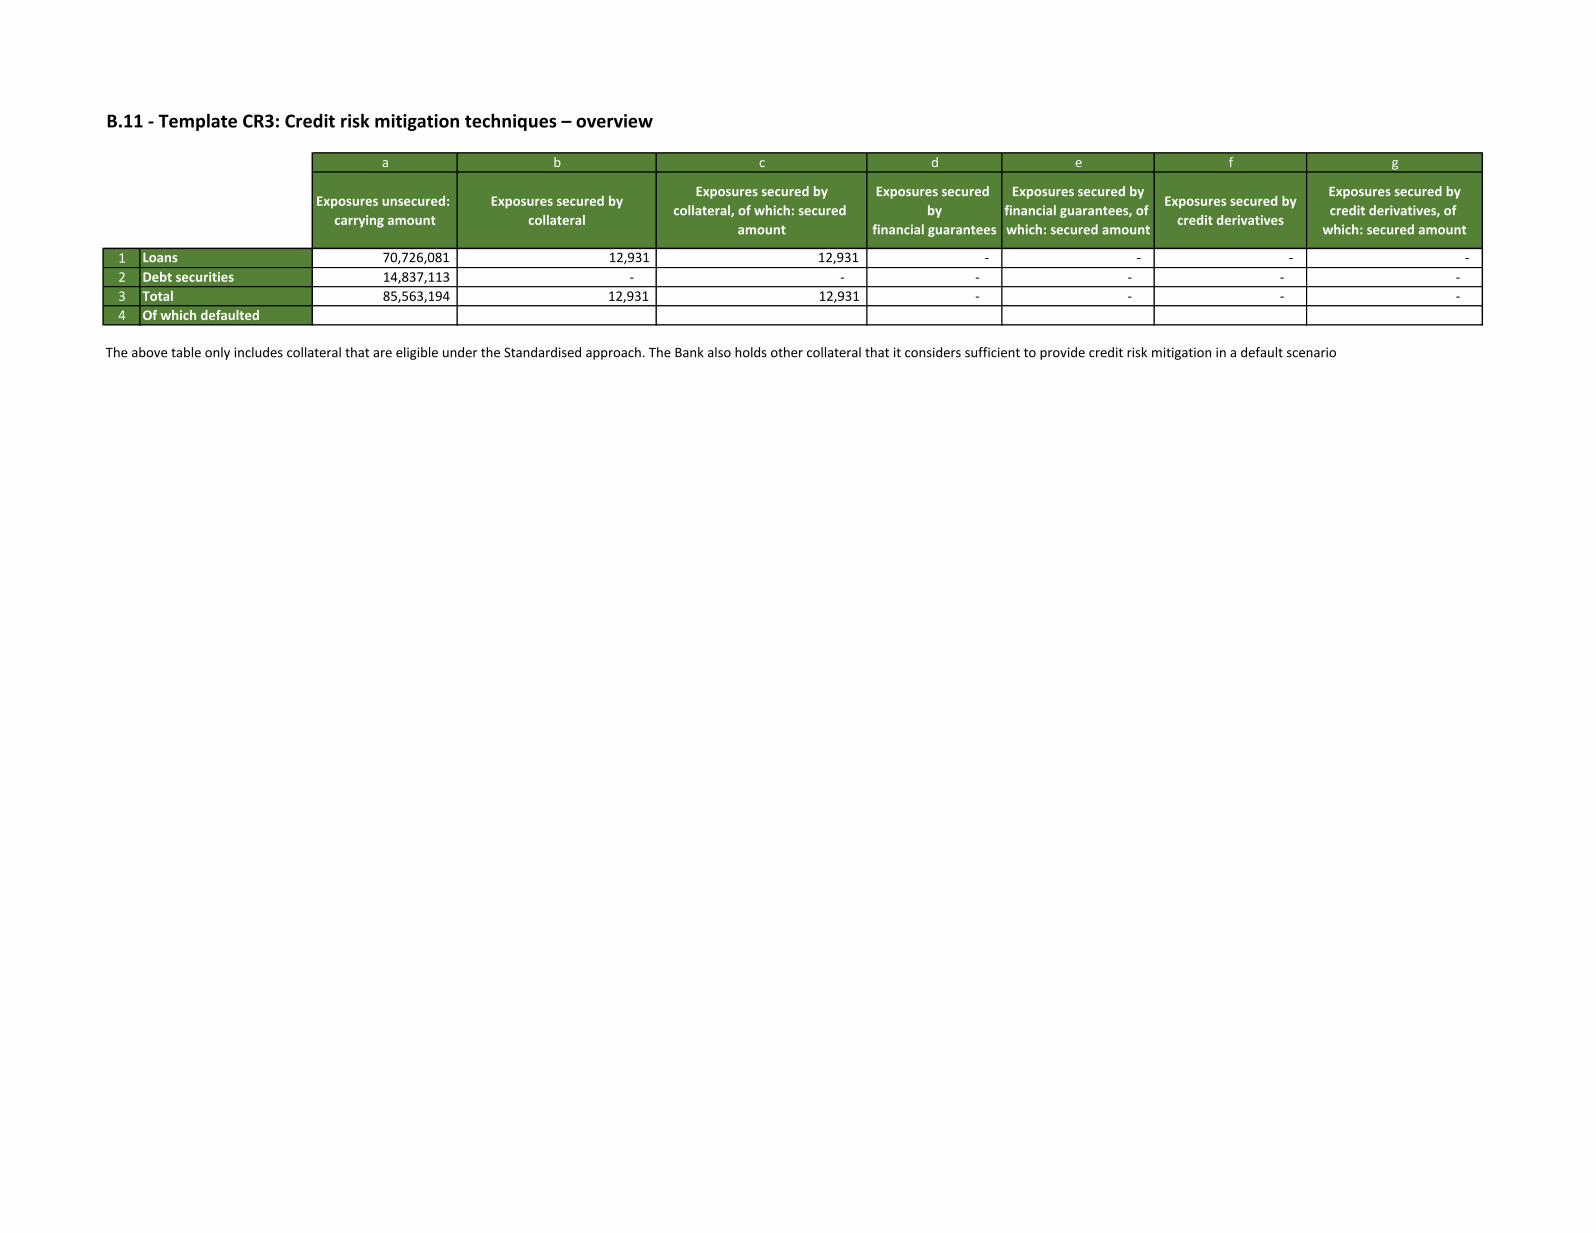
a b c d e f g
Exposures unsecured:
carrying amount
Exposures secured by
collateral
Exposures secured by
collateral, of which: secured
amount
Exposures secured
by
financial guarantees
Exposures secured by
financial guarantees, of
which: secured amount
Exposures secured by
credit derivatives
Exposures secured by
credit derivatives, of
which: secured amount
1 Loans 70,726,081 12,931 12,931 - - - -
2 Debt securities 14,837,113 - - - - - -
3 Total 85,563,194 12,931 12,931 - - - -
4 Of which defaulted
The above table only includes collateral that are eligible under the Standardised approach. The Bank also holds other collateral that it considers sufficient to provide credit risk mitigation in a default scenario
B.11 - Template CR3: Credit risk mitigation techniques – overview
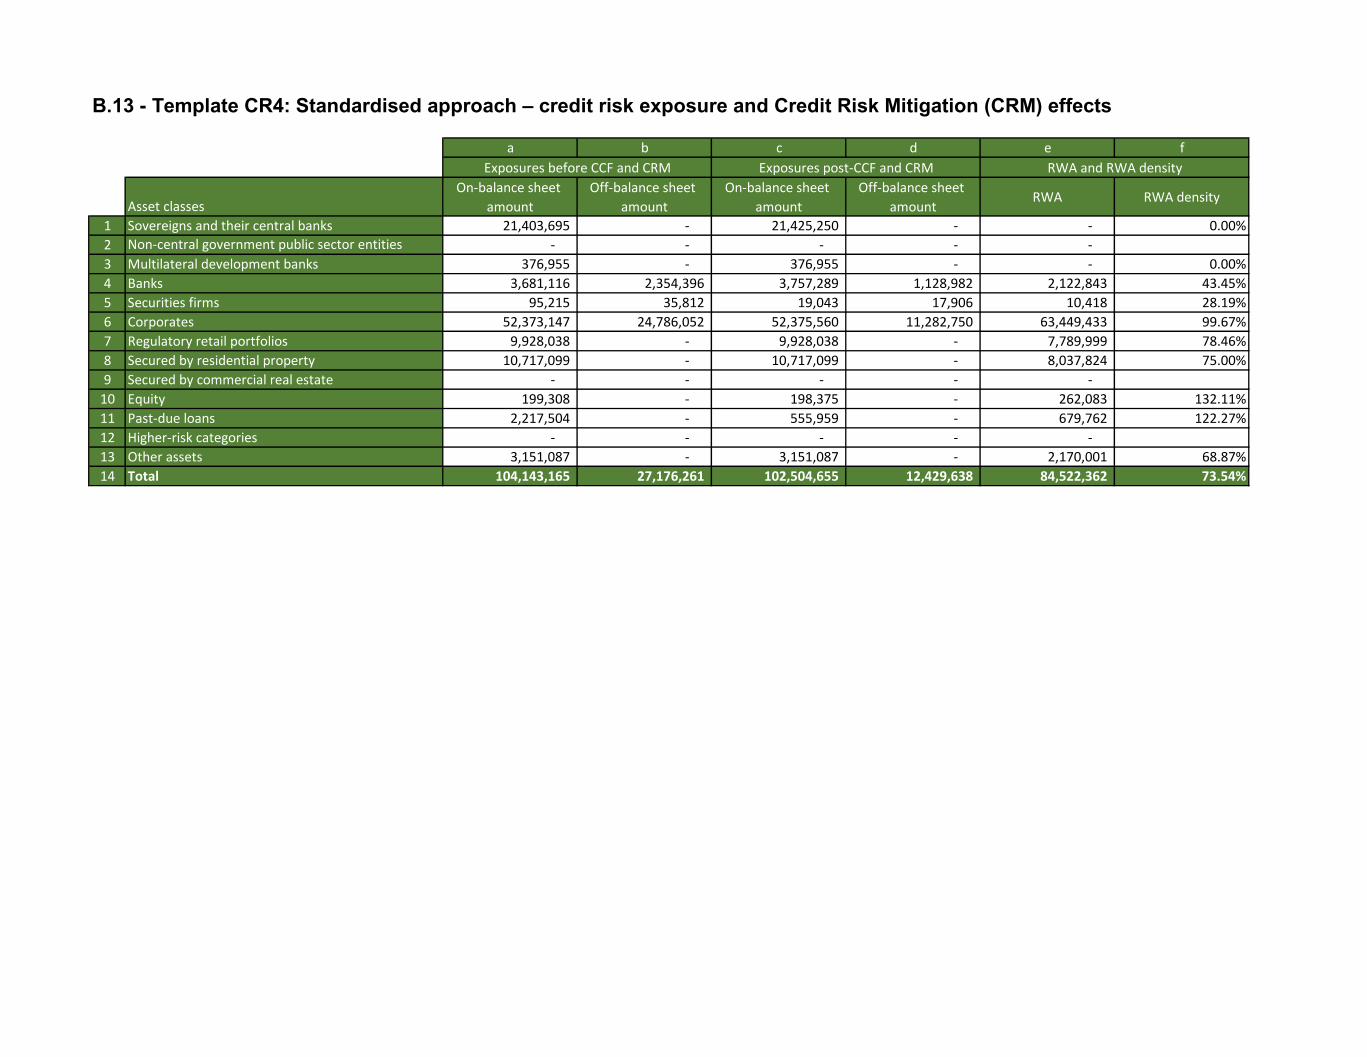
B.13 - Template CR4: Standardised approach – credit risk exposure and Credit Risk Mitigation (CRM) effects
a b c d e f
Asset classes
On-balance sheet
amount
Off-balance sheet
amount
On-balance sheet
amount
Off-balance sheet
amountRWA RWA density
1 Sovereigns and their central banks 21,403,695 - 21,425,250 - - 0.00%
2 Non-central government public sector entities - - - - -
3 Multilateral development banks 376,955 - 376,955 - - 0.00%
4 Banks 3,681,116 2,354,396 3,757,289 1,128,982 2,122,843 43.45%
5 Securities firms 95,215 35,812 19,043 17,906 10,418 28.19%
6 Corporates 52,373,147 24,786,052 52,375,560 11,282,750 63,449,433 99.67%
7 Regulatory retail portfolios 9,928,038 - 9,928,038 - 7,789,999 78.46%
8 Secured by residential property 10,717,099 - 10,717,099 - 8,037,824 75.00%
9 Secured by commercial real estate - - - - -
10 Equity 199,308 - 198,375 - 262,083 132.11%
11 Past-due loans 2,217,504 - 555,959 - 679,762 122.27%
12 Higher-risk categories - - - - -
13 Other assets 3,151,087 - 3,151,087 - 2,170,001 68.87%
14 Total 104,143,165 27,176,261 102,504,655 12,429,638 84,522,362 73.54%
Exposures before CCF and CRM Exposures post-CCF and CRM RWA and RWA density
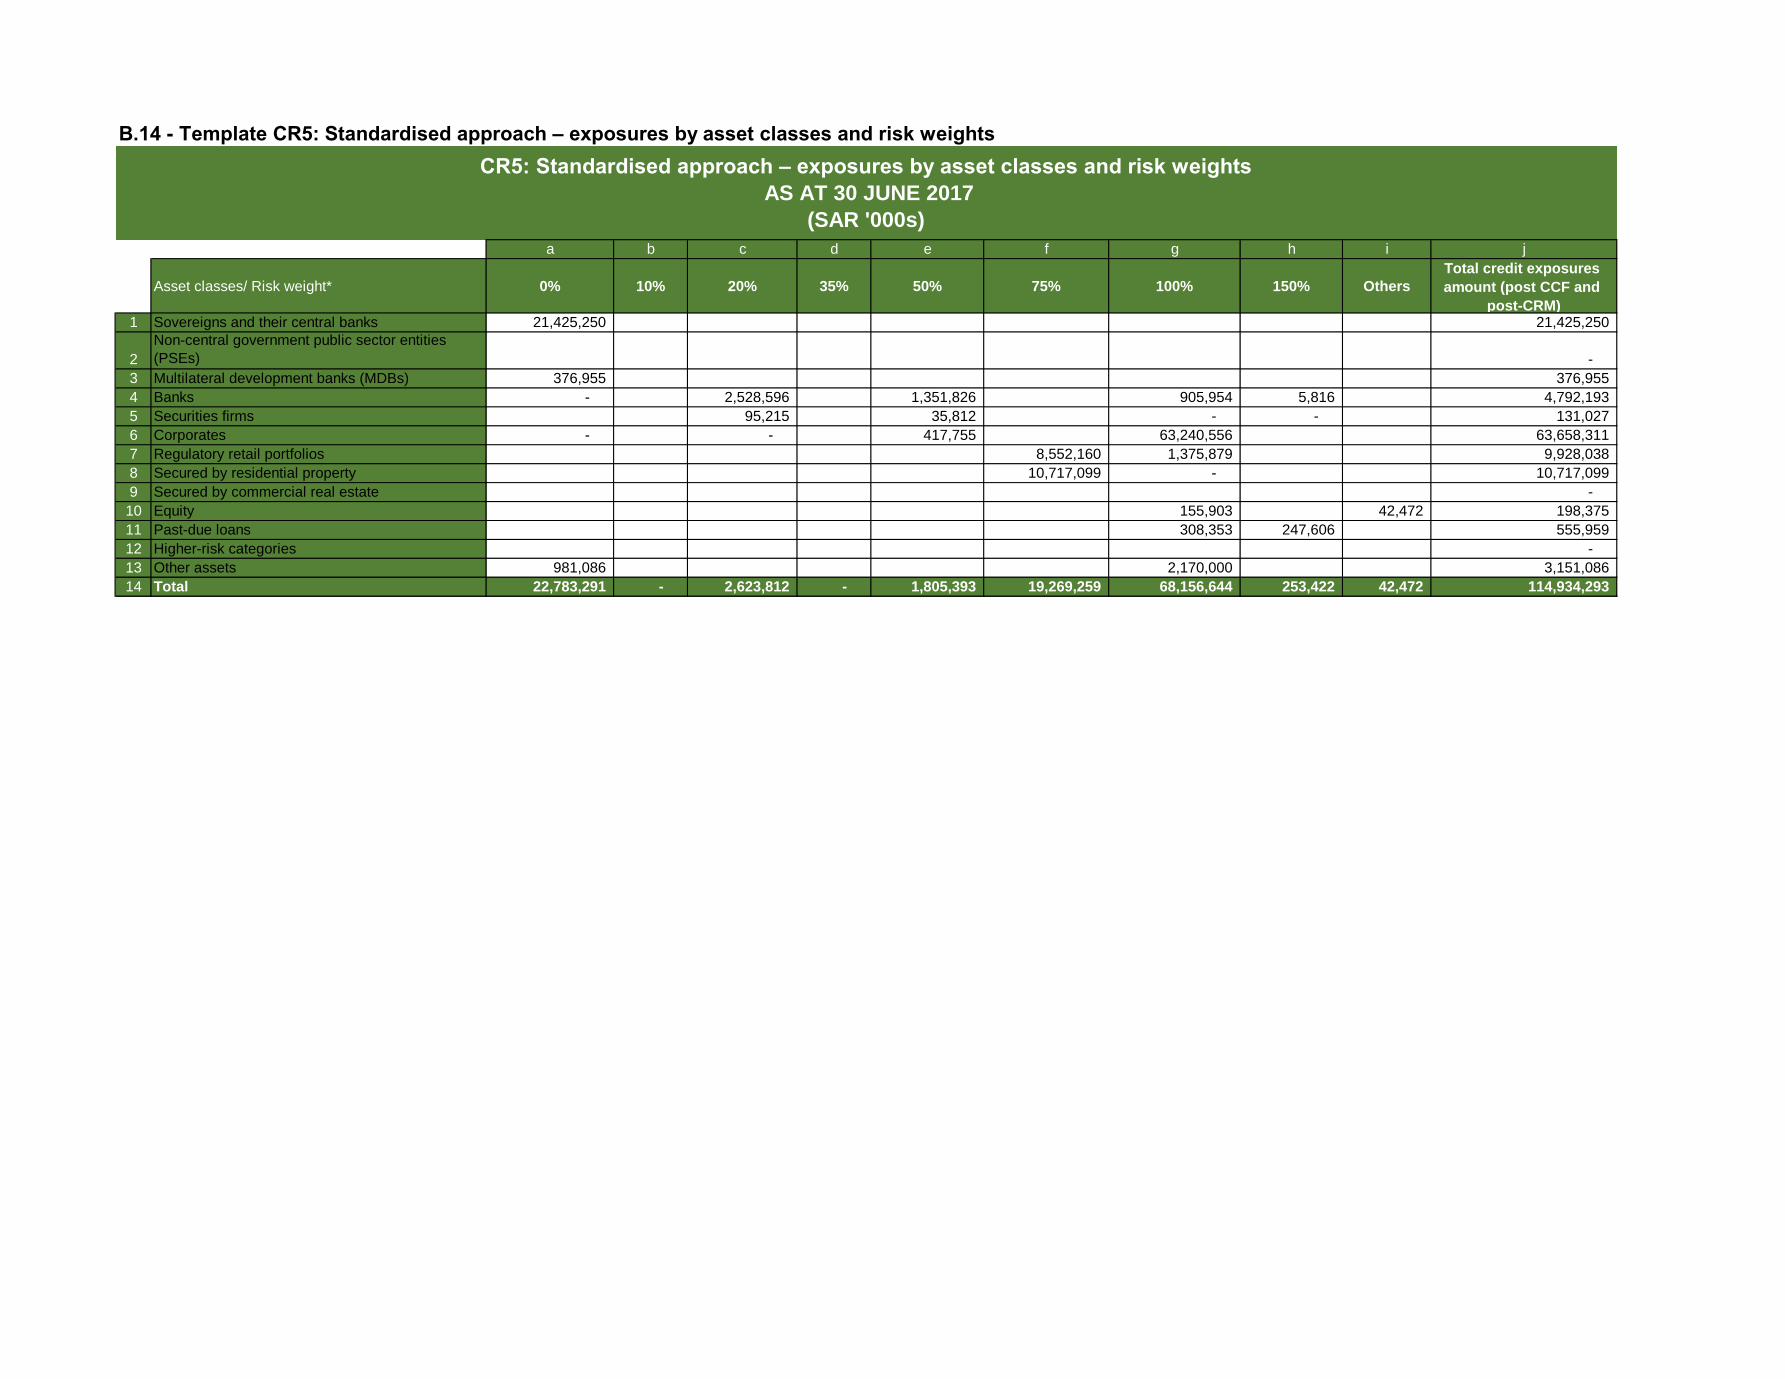
B.14 - Template CR5: Standardised approach – exposures by asset classes and risk weights
a b c d e f g h i j
Asset classes/ Risk weight* 0% 10% 20% 35% 50% 75% 100% 150% Others
Total credit exposures
amount (post CCF and
post-CRM)1 Sovereigns and their central banks 21,425,250 21,425,250
2
Non-central government public sector entities
(PSEs) -
3 Multilateral development banks (MDBs) 376,955 376,955
4 Banks - 2,528,596 1,351,826 905,954 5,816 4,792,193
5 Securities firms 95,215 35,812 - - 131,027
6 Corporates - - 417,755 63,240,556 63,658,311
7 Regulatory retail portfolios 8,552,160 1,375,879 9,928,038
8 Secured by residential property 10,717,099 - 10,717,099
9 Secured by commercial real estate -
10 Equity 155,903 42,472 198,375
11 Past-due loans 308,353 247,606 555,959
12 Higher-risk categories -
13 Other assets 981,086 2,170,000 3,151,086
14 Total 22,783,291 - 2,623,812 - 1,805,393 19,269,259 68,156,644 253,422 42,472 114,934,293
CR5: Standardised approach – exposures by asset classes and risk weights
AS AT 30 JUNE 2017
(SAR '000s)
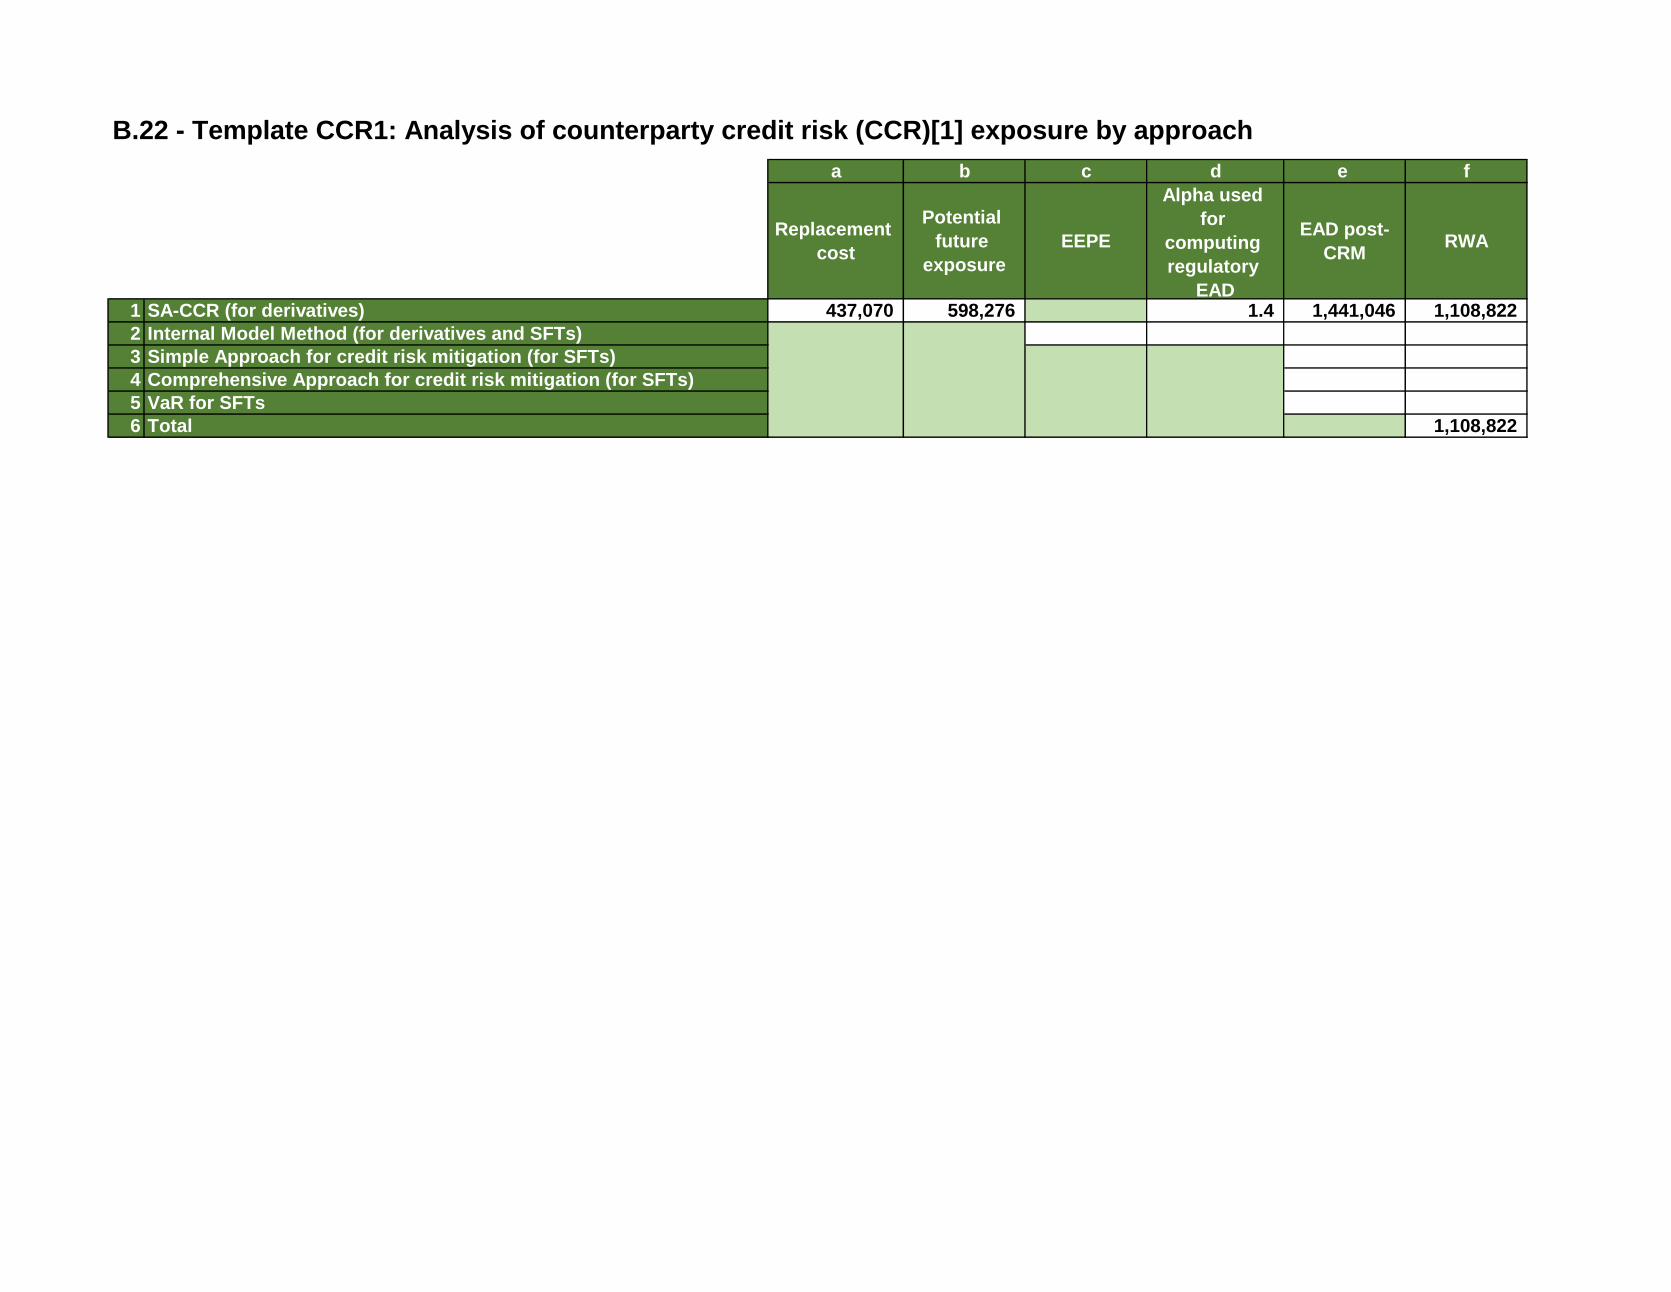
a b c d e f
Replacement
cost
Potential
future
exposure
EEPE
Alpha used
for
computing
regulatory
EAD
EAD post-
CRMRWA
1 SA-CCR (for derivatives) 437,070 598,276 1.4 1,441,046 1,108,822
2 Internal Model Method (for derivatives and SFTs)
3 Simple Approach for credit risk mitigation (for SFTs)
4 Comprehensive Approach for credit risk mitigation (for SFTs)
5 VaR for SFTs
6 Total 1,108,822
B.22 - Template CCR1: Analysis of counterparty credit risk (CCR)[1] exposure by approach
Summary
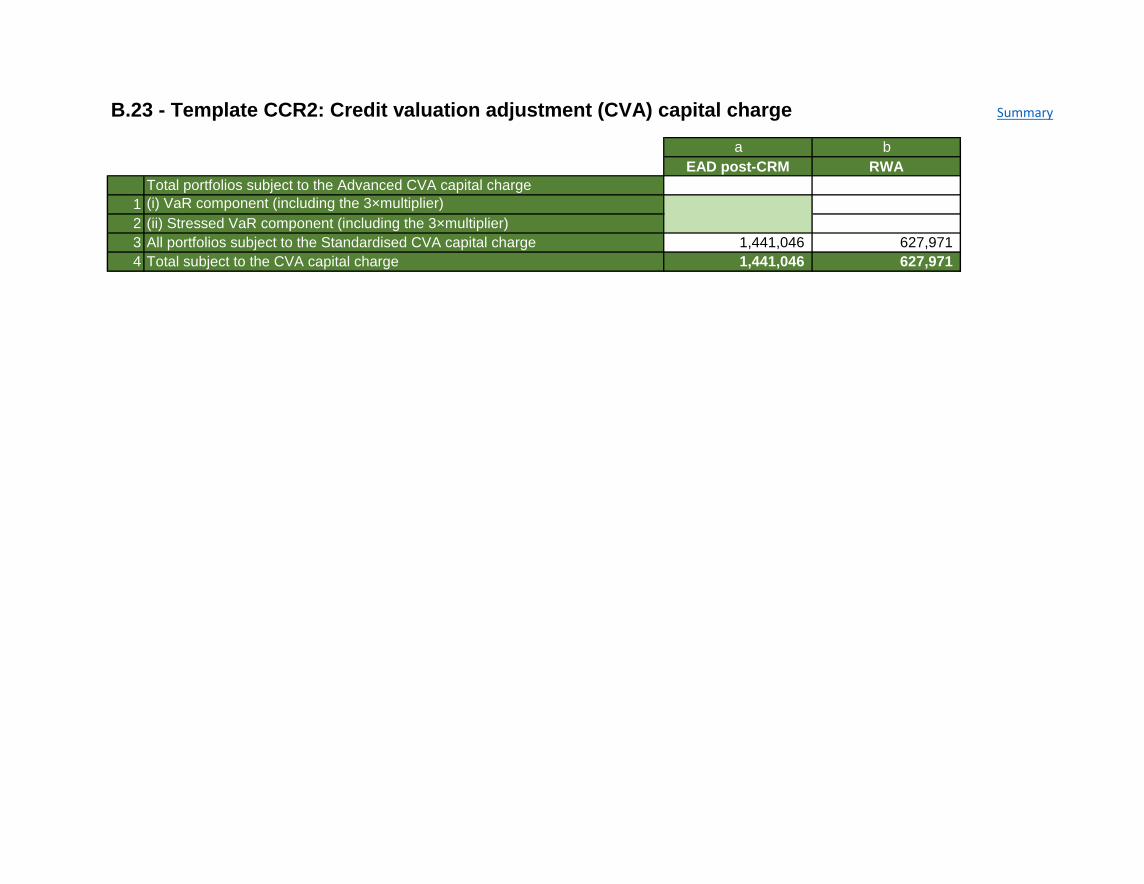
a b
EAD post-CRM RWA
Total portfolios subject to the Advanced CVA capital charge
1 (i) VaR component (including the 3×multiplier)
2 (ii) Stressed VaR component (including the 3×multiplier)
3 All portfolios subject to the Standardised CVA capital charge 1,441,046 627,971
4 Total subject to the CVA capital charge 1,441,046 627,971
B.23 - Template CCR2: Credit valuation adjustment (CVA) capital charge
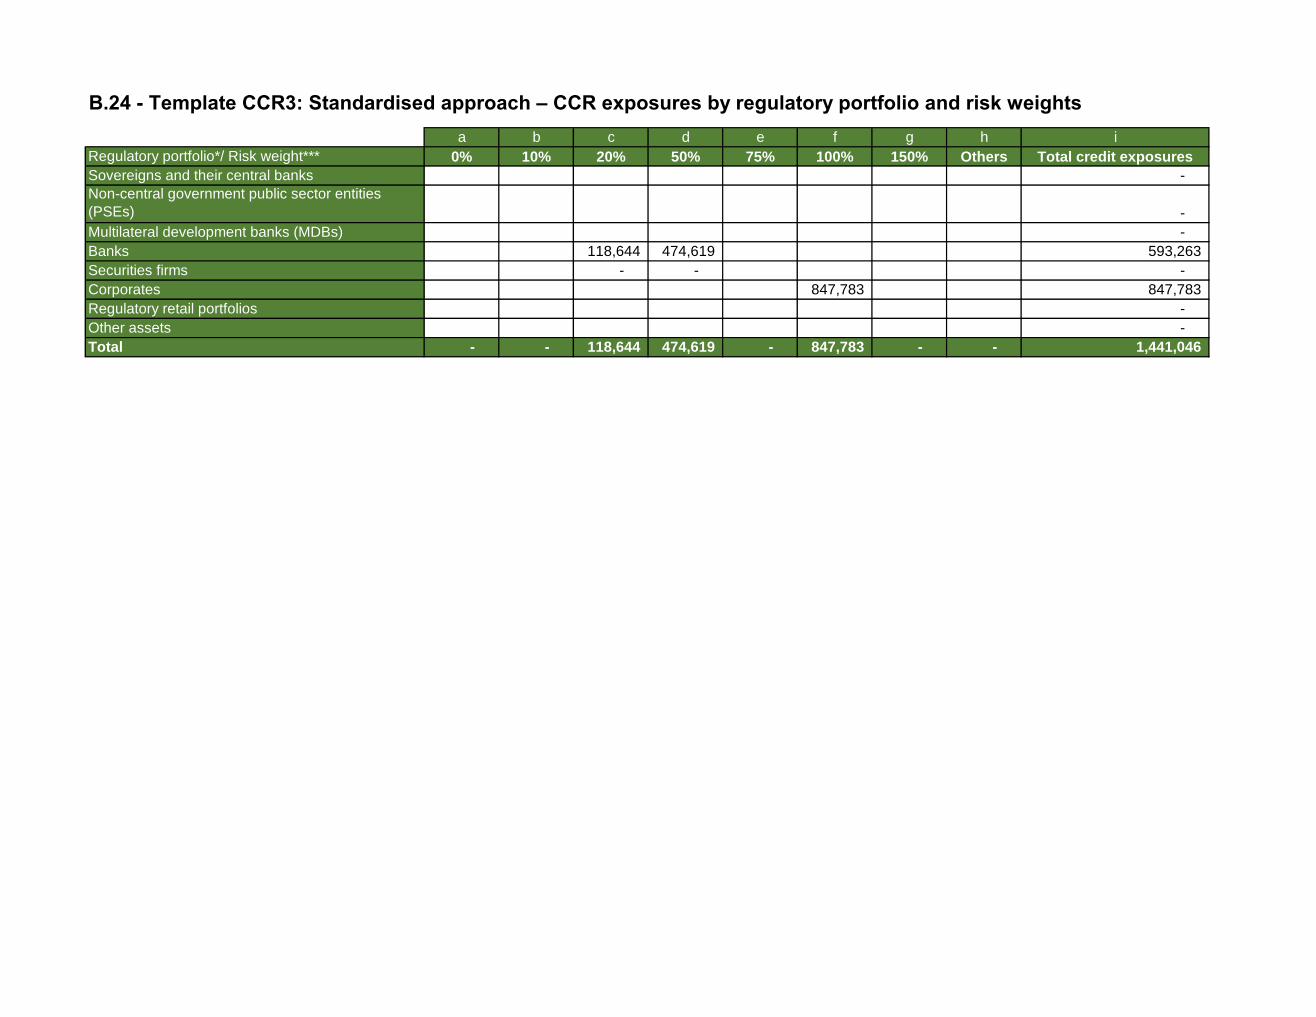
a b c d e f g h i
Regulatory portfolio*/ Risk weight*** 0% 10% 20% 50% 75% 100% 150% Others Total credit exposures
Sovereigns and their central banks -
Non-central government public sector entities
(PSEs) -
Multilateral development banks (MDBs) -
Banks 118,644 474,619 593,263
Securities firms - - -
Corporates 847,783 847,783
Regulatory retail portfolios -
Other assets -
Total - - 118,644 474,619 - 847,783 - - 1,441,046
B.24 - Template CCR3: Standardised approach – CCR exposures by regulatory portfolio and risk weights
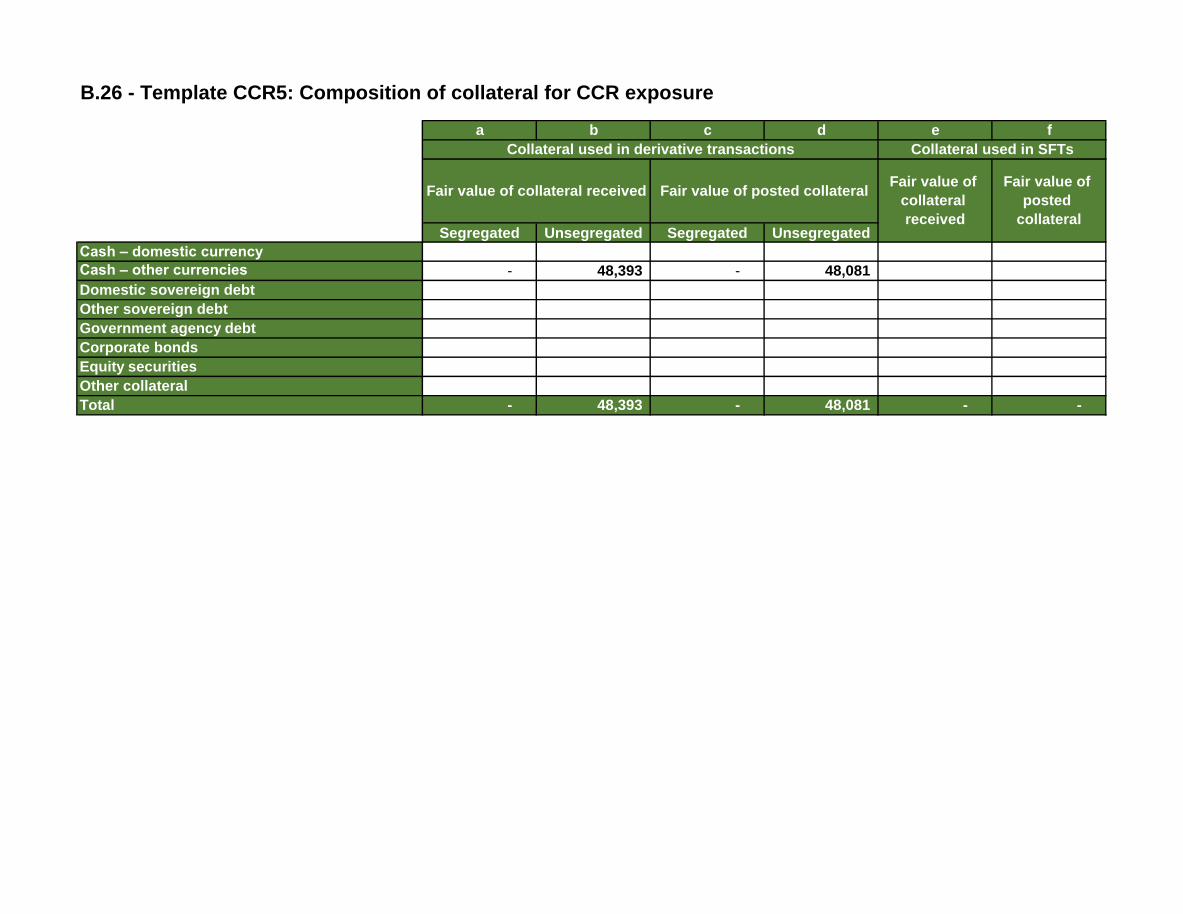
a b c d e f
Segregated Unsegregated Segregated Unsegregated
Cash – domestic currency
Cash – other currencies - 48,393 - 48,081
Domestic sovereign debt
Other sovereign debt
Government agency debt
Corporate bonds
Equity securities
Other collateral
Total - 48,393 - 48,081 - -
B.26 - Template CCR5: Composition of collateral for CCR exposure
Collateral used in derivative transactions
Fair value of collateral received Fair value of posted collateral
Collateral used in SFTs
Fair value of
collateral
received
Fair value of
posted
collateral
a b
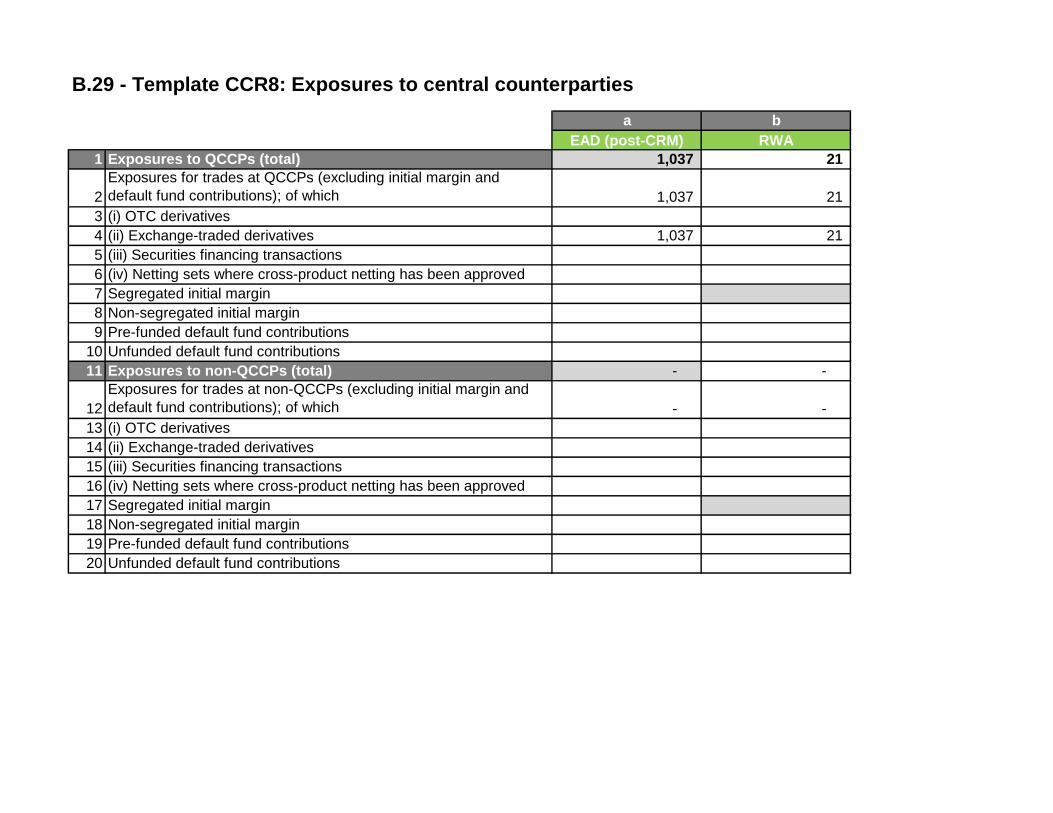
EAD (post-CRM) RWA
1 Exposures to QCCPs (total) 1,037 21
2
Exposures for trades at QCCPs (excluding initial margin and
default fund contributions); of which 1,037 21
3 (i) OTC derivatives
4 (ii) Exchange-traded derivatives 1,037 21
5 (iii) Securities financing transactions
6 (iv) Netting sets where cross-product netting has been approved
7 Segregated initial margin
8 Non-segregated initial margin
9 Pre-funded default fund contributions
10 Unfunded default fund contributions
11 Exposures to non-QCCPs (total) - -
12
Exposures for trades at non-QCCPs (excluding initial margin and
default fund contributions); of which - -
13 (i) OTC derivatives
14 (ii) Exchange-traded derivatives
15 (iii) Securities financing transactions
16 (iv) Netting sets where cross-product netting has been approved
17 Segregated initial margin
18 Non-segregated initial margin
19 Pre-funded default fund contributions
20 Unfunded default fund contributions
B.29 - Template CCR8: Exposures to central counterparties
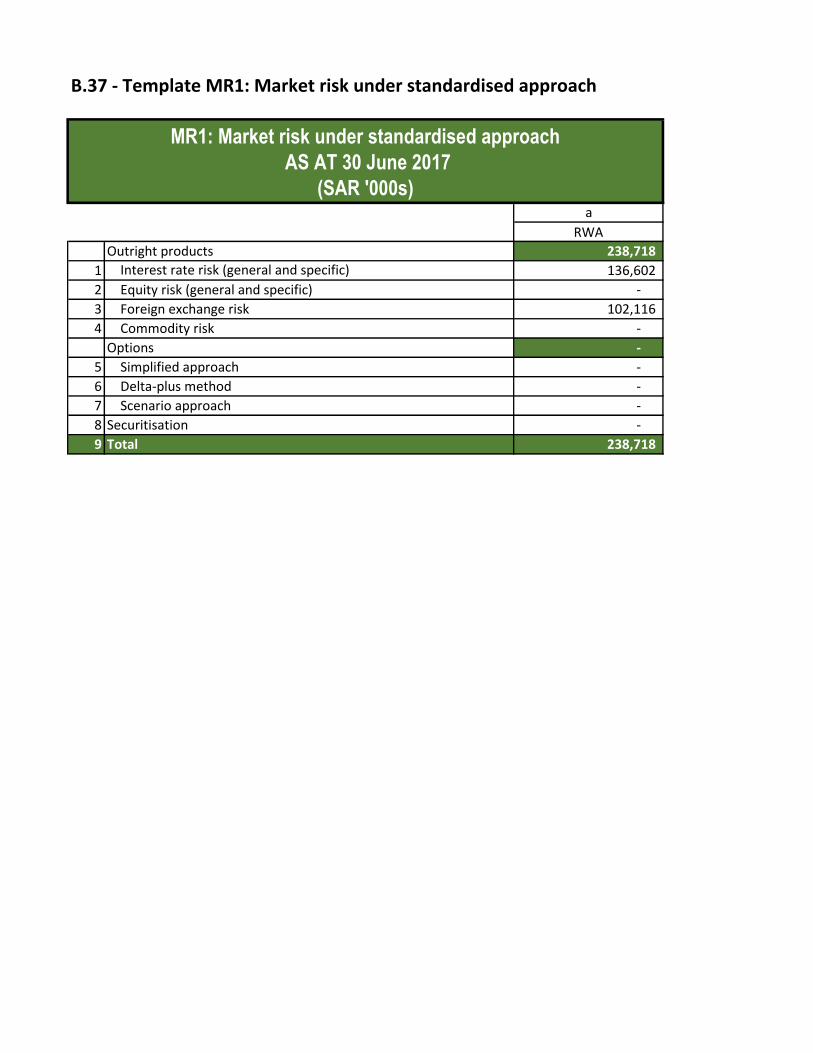
a
RWA
Outright products 238,718
1 Interest rate risk (general and specific) 136,602
2 Equity risk (general and specific) -
3 Foreign exchange risk 102,116
4 Commodity risk -
Options -
5 Simplified approach -
6 Delta-plus method -
7 Scenario approach -
8 Securitisation -
9 Total 238,718
B.37 - Template MR1: Market risk under standardised approach
MR1: Market risk under standardised approach
AS AT 30 June 2017
(SAR '000s)