Embed Size (px)
Citation preview

Basel II Pillar 31H09

Contents
1 Corporate calendar and information sources
2 Introduction
5 Capital
6 Capital adequacy
6 Capital components
7 Segmentation of risk-weighted assets
9 Risk exposures
10 Credit risk10 Credit risk exposures and risk-weighted assets11 Regulatory gross credit exposure13 Derivation of regulatory net credit exposure14 Advanced IRB approach15 Standardized approach16 Impairment, default and credit loss17 Other credit risk tables
19 Equity exposures outside trading book19 Equity exposures for banking book positions
20 Market risk20 Value at Risk21 Backtesting
22 Operational risk
23 Securitization23 Securitization activity 23 Total outstanding exposures securitized – synthetic securitizations23 Amount of impaired / past due assets securitized – synthetic securitizations24 Losses recognized on originated transactions24 Securitization exposures retained or purchased24 Capital charge for securitization exposures retained or purchased
Contents

Corporate calendar and information sources
Reporting publications
Annual publications: Annual report (SAP no. 80531; German and English). Includes a letter to shareholders and a description of: UBS’s strategy, performance and responsibility; the strategy and performance of the business divisions and the Corporate Center; risk, treasury and capital management at UBS; corpo-rate governance and executive compensation; and financial in-formation, including the financial statements. Review (SAP no. 80530; English, German, French and Italian). The booklet con-tains key information on UBS’s strategy and financials. Compen-sation report (SAP no. 82307; English and German). Compen-sation of senior management and the Board of Directors.
Quarterly publications: Letter to shareholders (English, Ger-man, French and Italian). The letter provides a quarterly update from UBS’s executive management on the firm’s strat egy and performance. Financial report (SAP no. 80834; English). This report provides a detailed description of UBS’s strategy and performance for the respective quarter.
How to order reports: The annual and quarterly publications are available in PDF format on the internet at www.ubs.com/investors/topics in the reporting section. Printed copies can be ordered from the investor services section of the website. Al-ternatively, they can be ordered by quoting the SAP number and the language preference, where applicable, from UBS AG, Information Center, P.O. Box, CH-8098 Zurich, Switzerland.
Other information
The Investor Relations website: www.ubs.com/investors. This provides the following information on UBS: financial informa-tion (including results-related SEC filings); corporate informa-tion; UBS share price charts and data and dividend information; the UBS event calendar; and the latest presentations by man-agement for investors and financial analysts. Available in Eng-lish and German, with some sections also available in French and Italian.
Results presentations: UBS’s quarterly results presen tations are webcast live. A playback of the most recent presentation is downloadable at www.ubs.com/presentations.
Messaging service / UBS news alert: On the www.ubs.com/newsalert website, it is possible to subscribe to receive news alerts about UBS via SMS or e-mail. Messages are sent in English, German, French or Italian and it is possible to state preferences for the theme of the alerts received.
Corporate calendarPublication of third quarter 2009 results Tuesday, 3 November 2009
Publication of fourth quarter 2009 results Tuesday, 9 February 2010
Annual general meeting Wednesday, 14 April 2010
Publication of first quarter 2010 results Tuesday, 4 May 2010
Contacts
Switchboards
Zurich +41 44 234 1111 London +44 20 7568 0000
New York +1 212 821 3000 Hong Kong +852 2971 8888
Investor Relations
UBS AG, Investor Relations P.O. Box, CH-8098 Zurich, [email protected]/investors
Zurich +41 44 234 4100
New York +1 212 882 5734
Fax (Zurich) +41 44 234 3415
Media Relations
Zurich +41 44 234 8500 [email protected]
London +44 20 7567 4714 [email protected]
New York +1 212 821 3000 [email protected]
Hong Kong +852 2971 8888 [email protected]
Shareholder Services
UBS AG, Shareholder Services P.O. Box, CH-8098 Zurich, [email protected]
Hotline +41 44 235 6202
Fax (Zurich) +41 44 235 3154
US Transfer Agent
BNY Mellon Shareowner Services 480 Washington BoulevardJersey City, NJ 07310, [email protected]
Calls from the US: +866 541 9689
Calls outside the US: +1 201 680 6578
Fax +1 201 680 4675
Corporate calendar and information sources
1
2
Introduction
Basel II capital adequacy framework
UBS operates under the Basel II capital adequacy frame-work. This framework consists of three pillars, each of which focuses on a different aspect of capital adequacy. Pillar 1 provides a framework for measuring minimum cap-ital requirements for the credit, market and operational risks faced by banks. Pillar 2 addresses the principles of the supervisory review process, emphasizing the need for a qualitative approach to supervising banks. The aim of Basel II Pillar 3 is to encourage market discipline by requiring banks to publish a range of disclosures on risk and capital.
Basis of UBS’s Pillar 3 disclosures as of 30 June 2009
The Swiss Financial Market Supervisory Authority (FINMA) requires UBS to publish comprehensive quantitative and qualitative Pillar 3 disclosures at least annually, as well as an update of quantitative disclosures and any significant chang-es to qualitative information at least semi-annually. This re-port presents UBS’s Basel II Pillar 3 disclosures as of 30 June 2009 and consists of quantitative disclosures with explana-tory text where needed.
This report should be read in conjunction with UBS’s sec-ond quarter 2009 financial report published on 4 August 2009. In particular, some of the information shown in this report has been disclosed in UBS’s second quarter 2009 finan-
cial report, where further explanations on the information can be found. Qualitative disclosures that provide a general sum-mary of the firm’s risk management objectives and policies, reporting system and definitions were previously published in the “Risk and Treasury Management” section of UBS’s restat-ed 2008 annual report and will be published annually. As of 30 June 2009, there are no significant changes to the qualita-tive Basel II Pillar 3 information published in UBS’s restated 2008 annual report, except the changes to the methodology for designation of a reclassified security as an “impaired loan”, as described in the “Credit risk” section in this report.
UBS’s Basel II Pillar 3 disclosures are based on the mea-sures of risk exposure that are used to calculate the regula-tory capital that is required to underpin those risks. As not-ed in this report, in certain cases, however, UBS’s Pillar 3 disclosures may differ from the way UBS assesses and man-ages the risks of the bank and how these are disclosed in UBS’s quarterly and annual reports.
The naming conventions for the “Exposure segments” used in the following tables are based on the Bank for International Settlements (BIS) rules and differ from those under Swiss and EU regulations. “Sovereigns” under the BIS naming convention equate to “Central governments and central banks” as used under the Swiss and EU regu-lations. Similarly, “Banks” equate to “Institutions” and “Residential mortgages” equate to “Claims secured on res-idential real estate”.
Introduction
This report is an update as of 30 June 2009 of UBS’s Basel II Pillar 3 quantitative disclosures published in UBS’s restated 2008 annual report.

3
Category UBS approach
Credit risk Under the Advanced Internal Ratings Based (Advanced IRB) approach applied by UBS for the majority of its businesses, credit risk weights are determined by reference to internal counterparty ratings and loss-given default estimates. UBS uses internal models, approved by FINMA, to measure the credit risk expo-sures to third parties on over-the-counter derivatives and repurchase-style (repo-style) transactions. For a subset of its credit portfolio, UBS applies the Standardized approach, based on external ratings.
Non-counterparty related risk
Non-counterparty related assets such as UBS premises, other properties and equipment require capital underpinning according to prescribed regulatory risk weights.
Settlement risk Capital requirements for failed transactions are determined according to the rules for failed trades and non-delivery-versus- payment transactions under the BIS Basel II framework.
Equity exposures outside trading book
Simple risk weight method under the IRB approach.
Market risk Regulatory capital requirement is derived from UBS‘s Value at Risk (VaR) model, which is approved by FINMA.
Operational risk UBS has developed a model to quantify operational risk, which meets the regulatory capital standard under the Basel II Advanced Measurement Approach (AMA) and is approved by FINMA.
Securitization exposures Securitization exposures in the banking book are assessed using the Ratings Based approach under the IRB, applying risk weights based on external ratings.
Capital requirements under Basel II
Measures of risk exposureMeasures of risk exposure may differ depending on the pur-pose for which exposures are calculated: financial account-ing under International Financial Reporting Standards (IFRS), determination of regulatory capital or UBS’s internal man-agement. UBS’s Basel II Pillar 3 disclosures are based on the measures of risk exposure that are used to calculate the reg-ulatory capital that is required to underpin those risks. The table below provides a more detailed summary of the approaches used by UBS for the main risk categories for the determination of regulatory capital.


5
Capital

6
Capital
Capital adequacy
Although UBS determines published risk-weighted assets (RWA) according to the Basel II Capital Accord (BIS guidelines), the calculation of UBS’s regulatory capital requirement is based on the regulations of FINMA, which result in higher RWA. Eligible capital is the same under BIS guidelines and FINMA regulations. This table provides an overview of UBS’s capital adequacy.
Capital
Capital components
In order to determine eligible BIS tier 1 and total capital, specific adjustments must be made to equity attributable to UBS shareholders as defined by IFRS and shown on UBS’s balance sheet. The most notable adjustments are the deductions for goodwill, intangible assets, investments in unconsolidated entities engaged in banking and financial activities, and own credit effects on liabilities designated at fair value. There is no difference in eligible capital between the BIS guidelines and FINMA regulations. This table provides an overview of the components of UBS’s BIS tier 1 capital.
CHF million 30.6.09 31.12.08
Core capital prior to deductions 47,514 48,758
of which: paid-in share capital 323 293
of which: share premium, retained earnings, currency translation differences and other elements 39,651 41,072
of which: non-innovative capital instruments 1,843 1,810
of which: innovative capital instruments 5,697 5,583
Less: treasury shares / deduction for own shares 1,2 (1,179) (1,488)
Less: goodwill & intangible assets (12,365) (12,950)
Less: other deduction items 3 (1,329) (1,167)
BIS tier 1 capital 32,640 33,154
Upper tier 2 capital 881 1,090
Lower tier 2 capital 11,679 12,290
Less: other deduction items 3 (1,329) (1,167)
BIS total capital 43,871 45,367
1 Consists of: i) net long position in own shares held for trading purposes; ii) own shares bought for cancellation (second trading line) and for unvested or upcoming share awards; iii) other treasury share positions net of delta-weighted obligations arising out of employee stock options granted prior to August 2006. 2 Netting of own shares with share-based payment obligations is subject to a grand-fathering agreement with the Swiss Financial Market Supervisory Authority (FINMA). 3 Positions to be deducted 50% from BIS tier 1 and 50% from total capital mainly consist of: net long position of non- consolidated participations in the finance sector; expected loss less general provisions (if positive) for the Advanced Internal Ratings Based (Advanced IRB) approach; expected loss for equities (simple risk weight method); and first loss positions from securitization exposures.
CHF million, except where indicated 30.6.09 31.12.08
BIS tier 1 capital 32,640 33,154
of which: hybrid tier 1 capital 7,540 7,393
BIS total capital 43,871 45,367
BIS tier 1 capital ratio (%) 13.2 11.0
BIS total capital ratio (%) 17.7 15.0
BIS risk-weighted assets 247,976 302,273
7
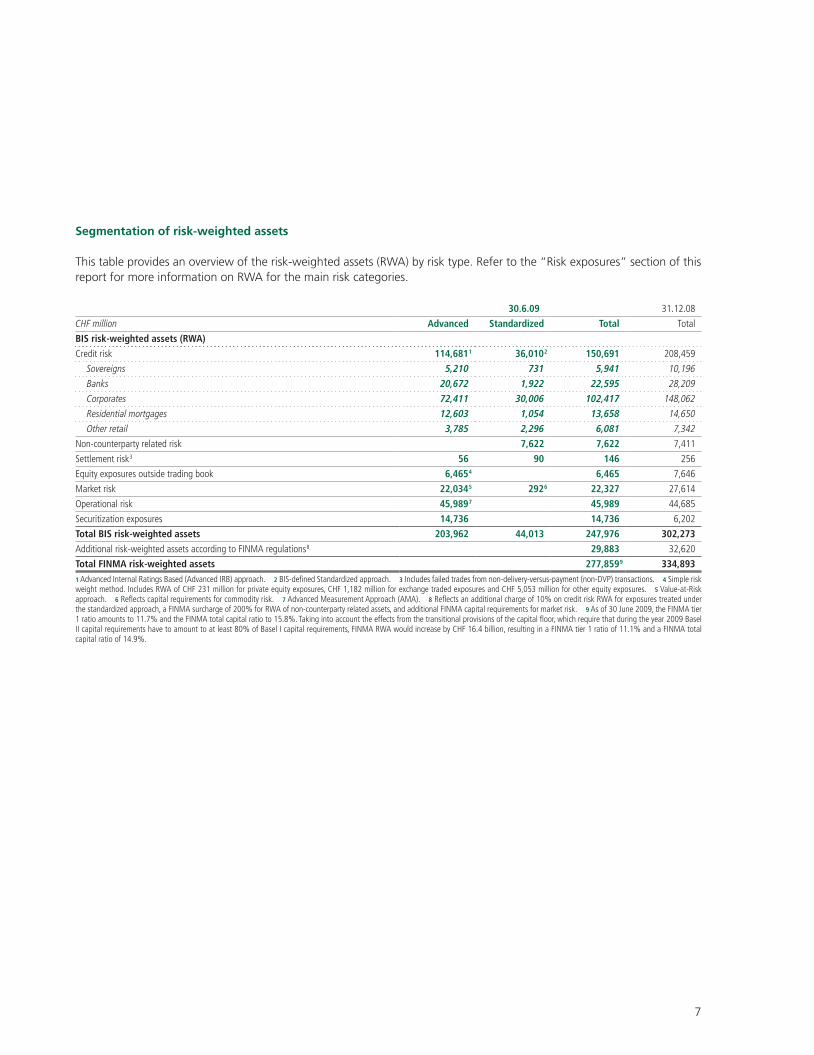
Segmentation of risk-weighted assets
This table provides an overview of the risk-weighted assets (RWA) by risk type. Refer to the “Risk exposures” section of this report for more information on RWA for the main risk categories.
30.6.09 31.12.08
CHF million Advanced Standardized Total Total
BIS risk-weighted assets (RWA)
Credit risk 114,681 1 36,010 2 150,691 208,459
Sovereigns 5,210 731 5,941 10,196
Banks 20,672 1,922 22,595 28,209
Corporates 72,411 30,006 102,417 148,062
Residential mortgages 12,603 1,054 13,658 14,650
Other retail 3,785 2,296 6,081 7,342
Non-counterparty related risk 7,622 7,622 7,411
Settlement risk 3 56 90 146 256
Equity exposures outside trading book 6,465 4 6,465 7,646
Market risk 22,034 5 292 6 22,327 27,614
Operational risk 45,989 7 45,989 44,685
Securitization exposures 14,736 14,736 6,202
Total BIS risk-weighted assets 203,962 44,013 247,976 302,273
Additional risk-weighted assets according to FINMA regulations 8 29,883 32,620
Total FINMA risk-weighted assets 277,859 9 334,8931 Advanced Internal Ratings Based (Advanced IRB) approach. 2 BIS-defined Standardized approach. 3 Includes failed trades from non-delivery-versus-payment (non-DVP) transactions. 4 Simple risk weight method. Includes RWA of CHF 231 million for private equity exposures, CHF 1,182 million for exchange traded exposures and CHF 5,053 million for other equity exposures. 5 Value-at-Risk approach. 6 Reflects capital requirements for commodity risk. 7 Advanced Measurement Approach (AMA). 8 Reflects an additional charge of 10% on credit risk RWA for exposures treated under the standardized approach, a FINMA surcharge of 200% for RWA of non-counterparty related assets, and additional FINMA capital requirements for market risk. 9 As of 30 June 2009, the FINMA tier 1 ratio amounts to 11.7% and the FINMA total capital ratio to 15.8%. Taking into account the effects from the transitional provisions of the capital floor, which require that during the year 2009 Basel II capital requirements have to amount to at least 80% of Basel I capital requirements, FINMA RWA would increase by CHF 16.4 billion, resulting in a FINMA tier 1 ratio of 11.1% and a FINMA total capital ratio of 14.9%.


Risk exposures

10
Risk exposuresCredit risk
Credit risk
UBS’s Basel II Pillar 3 disclosure presents the details on the parameters and input data used in its regulatory capital calculation. Although the parameters applied under the Advanced Internal Ratings Based (Advanced IRB) approach are generally deter-mined using the same methodologies, data and systems as UBS uses for internal risk quantification, there are nevertheless several differences due to regulatory floors, multi pliers, eligibility criteria and exposure definitions that cause the figures pre-sented in this section to deviate from the information disclosed within the “Risk management and control” section of UBS’s restated 2008 annual report and UBS’s second quarter 2009 financial report. The regulatory gross credit risk exposure also dif-fers from that required to be reported under IFRS.
Credit risk exposures and risk-weighted assets
This table provides an overview of UBS’s risk-weighted assets attributable to regulatory gross credit exposure.
ExposureAverage regulatory
risk-weighting 2Risk-weighted
assets
CHF millionRegulatory gross
credit exposure
Less: regulatory credit risk offsets and adjustments 1
Regulatory net credit exposure
Cash and balances with central banks 35,380 (30) 35,350 1% 400
Due from banks 27,550 (2,669) 24,881 22% 5,401
Loans 271,604 (13,067) 258,537 21% 54,762
Financial assets designated at fair value 11,233 (6,176) 5,057 26% 1,314
Off-balance sheet 3 44,021 (531) 43,490 25% 11,011
Banking products 389,788 (22,472) 367,316 20% 72,888
Derivatives 118,594 118,594 42% 49,781
Securities financing 61,620 61,620 12% 7,330
Traded products 180,214 180,214 32% 57,111
Trading portfolio assets 25,316 (74) 25,242 33% 8,380
Financial investments available-for-sale 4 3,015 3,015 10% 311
Accrued income and prepaid expenses 6,079 (221) 5,858 87% 5,120
Other assets 7,187 (13) 7,174 96% 6,882
Other products 41,596 (307) 41,289 50% 20,693
Total 30.6.09 611,598 (22,779) 588,819 26% 150,691
Total 31.12.08 715,064 (33,116) 681,947 31% 208,459
1 Regulatory credit risk offsets and adjustments mainly include margin accounts for derivatives. 2 The calculation of risk-weighted assets is based on the various credit risk parameters of the Advanced Internal Ratings Based (Advanced IRB) approach and the Standardized approach respectively. 3 Includes contingent claims and undrawn irrevocable credit facilities. 4 Financial investments available-for-sale exclude equity positions.

11
Regulatory gross credit exposure
Regulatory gross credit exposure by geographical regionThis table provides a breakdown of UBS’s credit risk portfolio by major types of credit exposure according to classes of financial instruments and also by geographical regions. The geographical breakdown below is based on the legal domicile of the cus-tomer.
Regulatory gross credit exposure by counterparty typeThis table provides a breakdown of UBS’s credit risk portfolio by major types of credit exposure according to classes of finan-cial instruments and also by counterparty type. Note that the classification of counterparty type is based on UBS’s internal classifications and not the Basel II defined exposure segments used in certain other tables in this section.
CHF million SwitzerlandOther
EuropeNorth
America 1Latin
America Asia / PacificAfrica /
Middle East
Total regulatory gross credit exposure
Total regulatory net credit exposure
Cash and balances with central banks 17,926 14,448 145 13 2,848 0 35,380 35,350
Due from banks 370 15,373 5,992 82 5,470 263 27,550 24,881
Loans 160,508 26,012 63,663 4,535 13,660 3,225 271,604 258,537
Financial assets designated at fair value 51 2,075 8,789 42 252 25 11,233 5,057
Off-balance sheet 6,584 9,328 25,360 668 1,734 347 44,021 43,490
Banking products 185,439 67,236 103,948 5,340 23,965 3,860 389,788 367,316
Derivatives 7,160 48,335 50,850 737 9,957 1,554 118,594 118,594
Securities financing 6,505 20,801 20,644 104 13,255 311 61,620 61,620
Traded products 13,665 69,136 71,494 841 23,212 1,865 180,214 180,214
Trading portfolio assets 2,172 14,442 6,834 634 1,108 126 25,316 25,242
Financial investments available-for-sale 2 28 2,310 472 3 2 199 3,015 3,015
Accrued income and prepaid expenses 443 1,016 4,321 66 206 27 6,079 5,858
Other assets 3,605 1,444 1,504 259 368 7 7,187 7,174
Other products 6,248 19,212 13,131 963 1,684 358 41,596 41,289
Total regulatory gross credit exposure 30.6.09 205,352 155,584 188,573 7,144 48,861 6,083 611,598 588,819
Total regulatory gross credit exposure 31.12.08 208,777 184,294 257,654 8,887 48,037 7,415 715,064 681,947
1 North America includes the Caribbean. 2 Financial investments available-for-sale exclude equity positions.
CHF millionPrivate
individuals Corporates 1
Public entities (including sovereigns
and central banks)
Banks and multilateral institutions
Total regulatory gross credit exposure
Total regulatory net credit exposure
Cash and balances with central banks 35,263 117 35,380 35,350
Due from banks 205 27,345 27,550 24,881
Loans 154,373 109,546 7,685 271,604 258,537
Financial assets designated at fair value 6,286 42 4,904 11,233 5,057
Off-balance sheet 3,145 38,604 865 1,406 44,021 43,490
Banking products 157,518 154,438 44,061 33,773 389,788 367,316
Derivatives 546 64,335 20,438 33,275 118,594 118,594
Securities financing 112 31,269 17,678 12,562 61,620 61,620
Traded products 658 95,604 38,116 45,836 180,214 180,214
Trading portfolio assets 10,190 14,362 764 25,316 25,242
Financial investments available-for-sale 2 4 267 2,638 106 3,015 3,015
Accrued income and prepaid expenses 4,368 1,403 30 278 6,079 5,858
Other assets 1,490 4,724 157 816 7,187 7,174
Other products 5,862 16,584 17,187 1,963 41,596 41,289
Total regulatory gross credit exposure 30.6.09 164,038 266,624 99,363 81,572 611,598 588,819
Total regulatory gross credit exposure 31.12.08 165,016 344,012 89,627 116,408 715,064 681,947
1 Includes corporates and non-bank financial institutions. 2 Financial investments available-for-sale exclude equity positions.

12
Risk exposuresCredit risk
Regulatory gross credit exposure by residual contractual maturityThis table provides a breakdown of UBS’s portfolio by major types of credit exposure according to classes of financial instruments and also by maturity. The breakdown below is based on residual contractual tenor.
Regulatory gross credit exposure segment covered by guarantees and credit derivativesThis table provides a breakdown of collateral information, showing exposures covered by guarantees and those covered by credit derivatives, according to Basel II defined exposure segments.
CHF millionDue in
1 year or lessDue over
1 to 5 yearsDue over
5 years Other 1
Total regulatory gross credit exposure
Total regulatory net
credit exposure
Cash and balances with central banks 35,380 35,380 35,350
Due from banks 3,431 278 140 23,701 27,550 24,881
Loans 104,880 79,520 43,871 43,332 271,604 258,537
Financial assets designated at fair value 2,616 6,611 1,429 577 11,233 5,057
Off-balance sheet 10,600 31,230 1,321 870 44,021 43,490
Banking products 121,528 117,638 46,761 103,860 389,788 367,316
Derivatives 38,575 31,087 48,931 1 118,594 118,594
Securities financing 18,696 80 119 42,725 61,620 61,620
Traded products 57,271 31,167 49,050 42,726 180,214 180,214
Trading portfolio assets 19,460 3,371 2,271 214 25,316 25,242
Financial investments available-for-sale 2 2,617 17 378 3 3,015 3,015
Accrued income and prepaid expenses 6,079 6,079 5,858
Other assets 7,187 7,187 7,174
Other products 22,077 3,387 2,650 13,482 41,596 41,289
Total regulatory gross credit exposure 30.6.09 200,876 152,193 98,461 160,068 611,598 588,819
Total regulatory gross credit exposure 31.12.08 247,904 171,558 125,600 170,001 715,064 681,947
1 Includes positions without an agreed residual contractual maturity, for example loans without a fixed term, on which notice of termination has not been given. 2 Financial investments available-for-sale exclude equity positions.
CHF millionExposure covered
by guarantees 1Exposure covered
by credit derivatives
Exposure segment
Corporates 3,668 27,832
Sovereigns 147 167
Banks 476 133
Residential mortgages 13 0
Other retail 737 0
Total regulatory gross credit exposure 30.6.09 5,040 28,131
Total regulatory gross credit exposure 31.12.08 4,302 28,368
1 Includes guarantees and standby letters of credit provided by third parties, mainly banks.
13
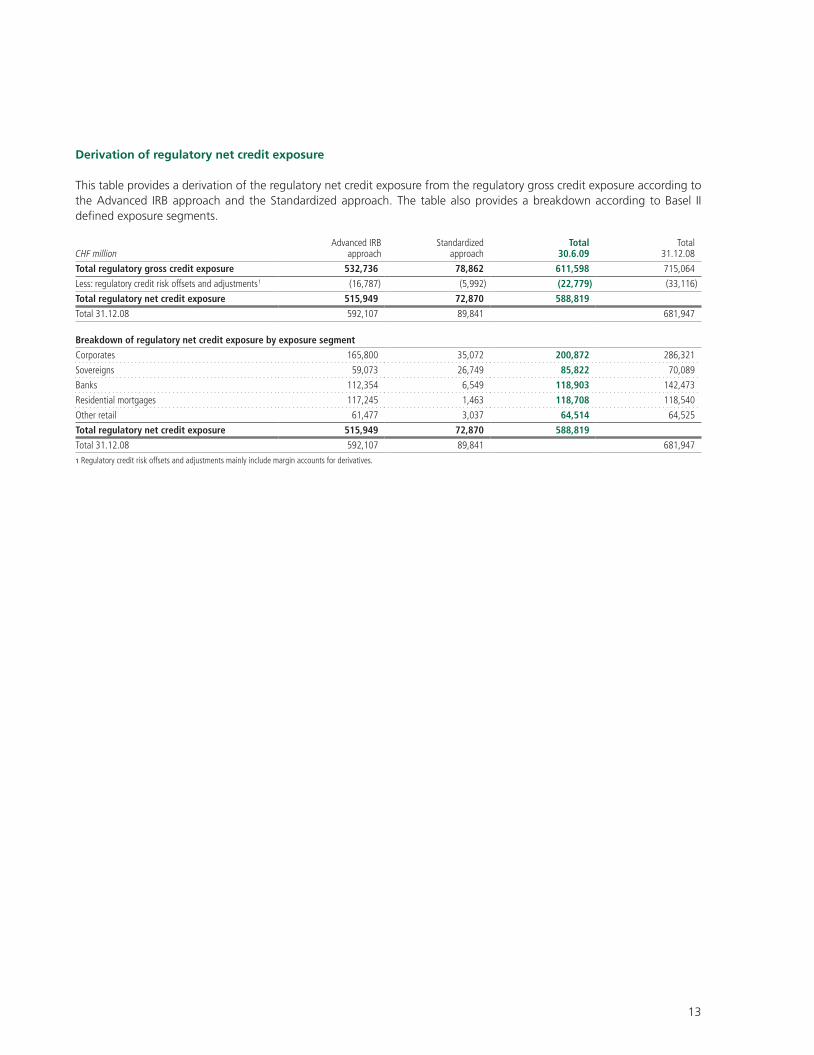
Derivation of regulatory net credit exposure
This table provides a derivation of the regulatory net credit exposure from the regulatory gross credit exposure according to the Advanced IRB approach and the Standardized approach. The table also provides a breakdown according to Basel II defined exposure segments.
CHF millionAdvanced IRB
approachStandardized
approachTotal
30.6.09Total
31.12.08
Total regulatory gross credit exposure 532,736 78,862 611,598 715,064
Less: regulatory credit risk offsets and adjustments 1 (16,787) (5,992) (22,779) (33,116)
Total regulatory net credit exposure 515,949 72,870 588,819
Total 31.12.08 592,107 89,841 681,947
Breakdown of regulatory net credit exposure by exposure segment
Corporates 165,800 35,072 200,872 286,321
Sovereigns 59,073 26,749 85,822 70,089
Banks 112,354 6,549 118,903 142,473
Residential mortgages 117,245 1,463 118,708 118,540
Other retail 61,477 3,037 64,514 64,525
Total regulatory net credit exposure 515,949 72,870 588,819
Total 31.12.08 592,107 89,841 681,947
1 Regulatory credit risk offsets and adjustments mainly include margin accounts for derivatives.

14
Risk exposuresCredit risk
Advanced IRB approach
Advanced IRB approach: regulatory net credit exposure by UBS-internal ratingThis table provides a breakdown of the regulatory net credit exposure of UBS’s credit portfolio using the Advanced IRB approach according to UBS-internal rating classes.
Advanced IRB approach: exposure-weighted average loss given default (LGD) by UBS-internal ratingThis table provides a breakdown of the net exposure-weighted average loss given default (LGD) for UBS’s credit portfolio exposures calculated using the Advanced IRB approach, according to UBS-internal rating classes.
Advanced IRB approach: exposure-weighted average risk weight by UBS-internal ratingThis table provides a breakdown of the net exposure-weighted average risk weight for UBS’s credit portfolio exposures calculated using the Advanced IRB approach according to UBS-internal rating classes.
UBS-internal rating
Investment grade Sub-investment grade Defaulted 1Total regulatory net
credit exposure
CHF million, unless otherwise stated 0/1 2/3 4/5 6–8 9–13 30.6.09 31.12.08
Regulatory net credit exposure- weighted average (probability of default) 0.004 % 0.060 % 0.268 % 0.990 % 5.177 % 0.485% 0.484 %
Exposure segment
Corporates 4,384 66,314 37,740 37,607 14,211 5,544 165,800 237,704
Sovereigns 36,723 21,861 427 25 30 8 59,073 45,270
Banks 4,880 84,462 21,029 1,434 379 169 112,354 130,493
Residential mortgages 2 5,447 52,137 52,956 5,894 809 117,245 116,539
Other retail 51,988 4,150 4,375 745 219 61,477 62,101
Total 30.6.09 45,990 230,071 115,483 96,397 21,259 6,749 515,949
Total 31.12.08 61,691 261,108 134,083 102,651 24,929 7,644 592,107
1 Values of defaulted derivative contracts are based on replacement values, including “add-ons” used in the calculation of regulatory capital.
UBS-internal rating
Investment grade Sub-investment gradeRegulatory net credit exposure-weighted
average LGD (%)
0/1 2/3 4/5 6–8 9–13 30.6.09 31.12.08
Regulatory net credit exposure-weighted average LGD (%)
Corporates 33 37 35 33 27 36 35
Sovereigns 38 47 74 36 18 41 37
Banks 34 29 34 41 47 31 26
Residential mortgages 10 10 10 10 10 10 11
Other retail 20 20 18 20 20 16
Average 30.6.09 37 31 23 20 22 27
Average 31.12.08 25 28 26 21 26 26
UBS-internal rating
Investment grade Sub-investment gradeRegulatory net credit exposure-weighted
average risk weight (%)
0/1 2/3 4/5 6–8 9–13 30.6.09 31.12.08
Regulatory net credit exposure-weighted average risk weight (%)
Corporates 13 17 34 64 79 40 39
Sovereigns 1 18 46 64 60 8 19
Banks 14 12 28 78 157 17 17
Residential mortgages 1 2 5 12 27 10 10
Other retail 3 11 22 30 6 8
Average 30.6.09 4 12 19 34 64 20
Average 31.12.08 8 13 28 35 87 24
15
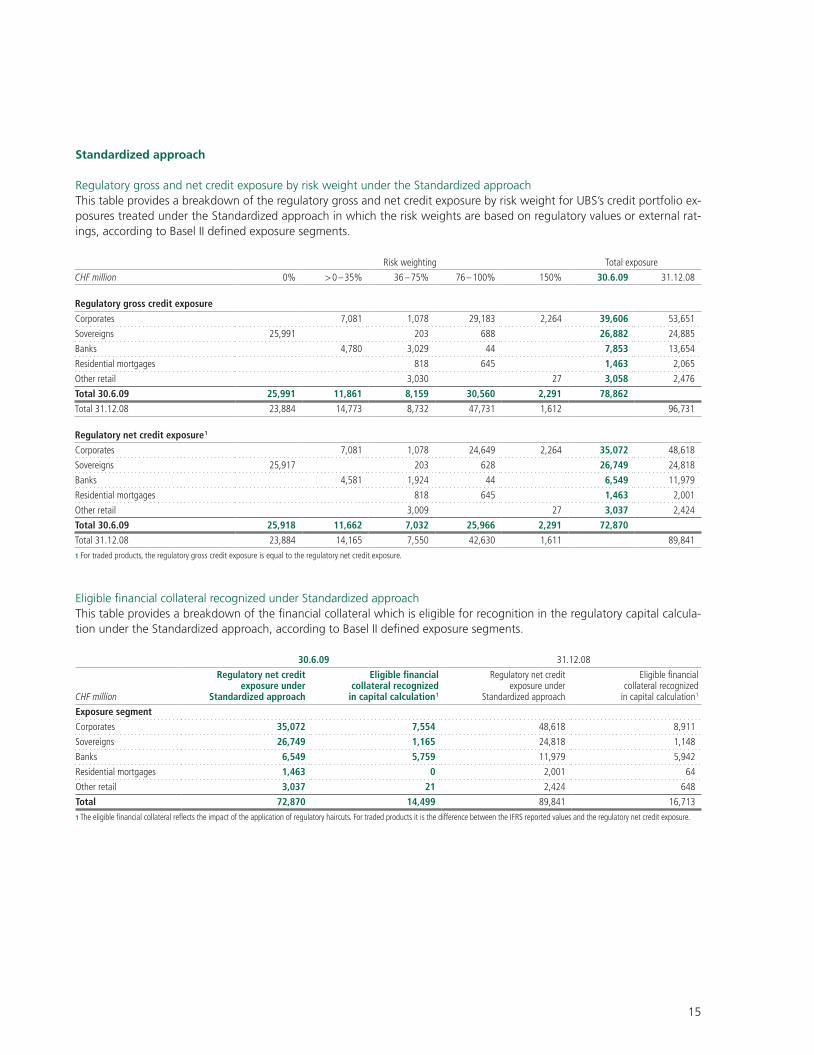
Standardized approach
Regulatory gross and net credit exposure by risk weight under the Standardized approachThis table provides a breakdown of the regulatory gross and net credit exposure by risk weight for UBS’s credit portfolio ex-posures treated under the Standardized approach in which the risk weights are based on regulatory values or external rat-ings, according to Basel II defined exposure segments.
Eligible financial collateral recognized under Standardized approachThis table provides a breakdown of the financial collateral which is eligible for recognition in the regulatory capital calcula-tion under the Standardized approach, according to Basel II defined exposure segments.
Risk weighting Total exposure
CHF million 0% > 0 – 35% 36 – 75% 76 – 100% 150% 30.6.09 31.12.08
Regulatory gross credit exposure
Corporates 7,081 1,078 29,183 2,264 39,606 53,651
Sovereigns 25,991 203 688 26,882 24,885
Banks 4,780 3,029 44 7,853 13,654
Residential mortgages 818 645 1,463 2,065
Other retail 3,030 27 3,058 2,476
Total 30.6.09 25,991 11,861 8,159 30,560 2,291 78,862
Total 31.12.08 23,884 14,773 8,732 47,731 1,612 96,731
Regulatory net credit exposure 1
Corporates 7,081 1,078 24,649 2,264 35,072 48,618
Sovereigns 25,917 203 628 26,749 24,818
Banks 4,581 1,924 44 6,549 11,979
Residential mortgages 818 645 1,463 2,001
Other retail 3,009 27 3,037 2,424
Total 30.6.09 25,918 11,662 7,032 25,966 2,291 72,870
Total 31.12.08 23,884 14,165 7,550 42,630 1,611 89,841
1 For traded products, the regulatory gross credit exposure is equal to the regulatory net credit exposure.
30.6.09 31.12.08
CHF million
Regulatory net credit exposure under
Standardized approach
Eligible financial collateral recognized
in capital calculation 1
Regulatory net credit exposure under
Standardized approach
Eligible financial collateral recognized
in capital calculation 1
Exposure segment
Corporates 35,072 7,554 48,618 8,911
Sovereigns 26,749 1,165 24,818 1,148
Banks 6,549 5,759 11,979 5,942
Residential mortgages 1,463 0 2,001 64
Other retail 3,037 21 2,424 648
Total 72,870 14,499 89,841 16,713
1 The eligible financial collateral reflects the impact of the application of regulatory haircuts. For traded products it is the difference between the IFRS reported values and the regulatory net credit exposure.

16
Risk exposuresCredit risk
Impairment, default and credit loss
Impaired asset exposures include loans, off-balance sheet claims, securities financing transactions, derivative contracts and certain assets and securities that were reclassified from “Held for trading” to “Loans and receivables” in fourth quarter 2008 and first quarter 2009.
Methodology for designation of a reclassified security as an “impaired loan”UBS periodically revises its estimated cash flows associated with the portfolio of reclassified securities backed by multiple assets. Adverse revisions in cash flow estimates are recognized in profit or loss as credit loss expenses. Increases in estimated future cash receipts as a result of increased recoverability are recognized as an adjustment to the effective interest rate on the loan from the date of the change.
Effective 1 April 2009, UBS implemented a threshold for designating a reclassified security as an “impaired loan”. Under this policy, a reclassified security is considered impaired if the carrying value at balance sheet date is on a cumulative basis 5% or more below the carrying value at reclassification date adjusted for redemptions. Refer to the “Risk management and con-trol” section of UBS’s second quarter 2009 financial report for more information on this policy. In order to provide comparabil-ity, UBS has restated its impaired lending portfolio as at 31 December 2008 to CHF 13.9 billion from CHF 15.7 billion.
Impaired assets by geographical regionThis table provides a breakdown of credit exposures arising from impaired assets and allowances / provisions by geographical region, based on the legal domicile of the customer.
Impaired assets by exposure segmentThis table provides a breakdown of credit exposures arising from impaired assets and allowances / provisions according to Basel II defined exposure segments.
CHF millionRegulatory gross
credit exposure Impaired assets 1
Specific allowances,
provisions and credit valuation
adjustments
Exposure net of specific
allowances, provisions and
credit valuation adjustments
Collective allowances and
provisions
Total allowances,
provisions and specific
credit valuation adjustments
Total allowances, provisions and specific credit
valuation adjustments
31.12.08
Switzerland 205,352 1,387 (856) 530 (41) (897) (873)
Other Europe 155,584 2,697 (1,416) 1,281 (1,416) (1,138)
North America 2 188,573 8,708 (4,883) 3,825 (4,883) (4,808)
Latin America 7,144 143 (66) 76 (66) (56)
Asia / Pacific 48,861 1,357 (731) 626 (731) (361)
Africa / Middle East 6,083 86 (34) 53 (34) (41)
Total 30.6.09 611,598 14,378 (7,986) 6,391 (41) (8,027)
Total 31.12.08 715,064 13,947 (7,252) 6,695 (23) (7,275)
1 Values of defaulted derivative contracts (CHF 5,710 million) are based on replacement values and do not include “add-ons” used in the calculation of regulatory capital. 2 North America includes the Caribbean.
CHF millionRegulatory gross
credit exposureof which:
impaired assets 1
Specific allowances,
provisions and credit valuation
adjustments
Collective allowances and
provisions 2
Total allowances,
provisions and specific
credit valuation adjustments 2 Write-offs 3
Total allowances, provisions and specific credit
valuation adjustments
31.12.08
Corporates 244,390 13,325 (7,503) (7,503) (742) (6,777)
Sovereigns 87,490 14 (10) (10) (2) (12)
Banks 96,258 68 (51) (51) (1) (20)
Residential mortgages 118,804 338 (100) (100) (103)
Other retail 64,656 633 (322) (322) (24) (340)
Not allocated segment 4 (41) (41) (23)
Total 30.6.09 611,598 14,378 (7,986) (41) (8,027) (769)
Total 31.12.08 715,064 13,947 (7,252) (23) (7,275) (868) (7,275)
1 Values of defaulted derivative contracts (CHF 5,710 million) are based on replacement values and do not include “add-ons” used in the calculation of regulatory capital. 2 Collective credit valuation adjustments of CHF 5.1 billion are partially included in the upper tier 2 capital and therefore not included in this table. 3 The write-offs refer to those recorded during the period from 1 January 2009 to 30 June 2009. 4 Collective loan loss allowances & provisions are not allocated to individual counterparties and thus also not to exposure segments.
17
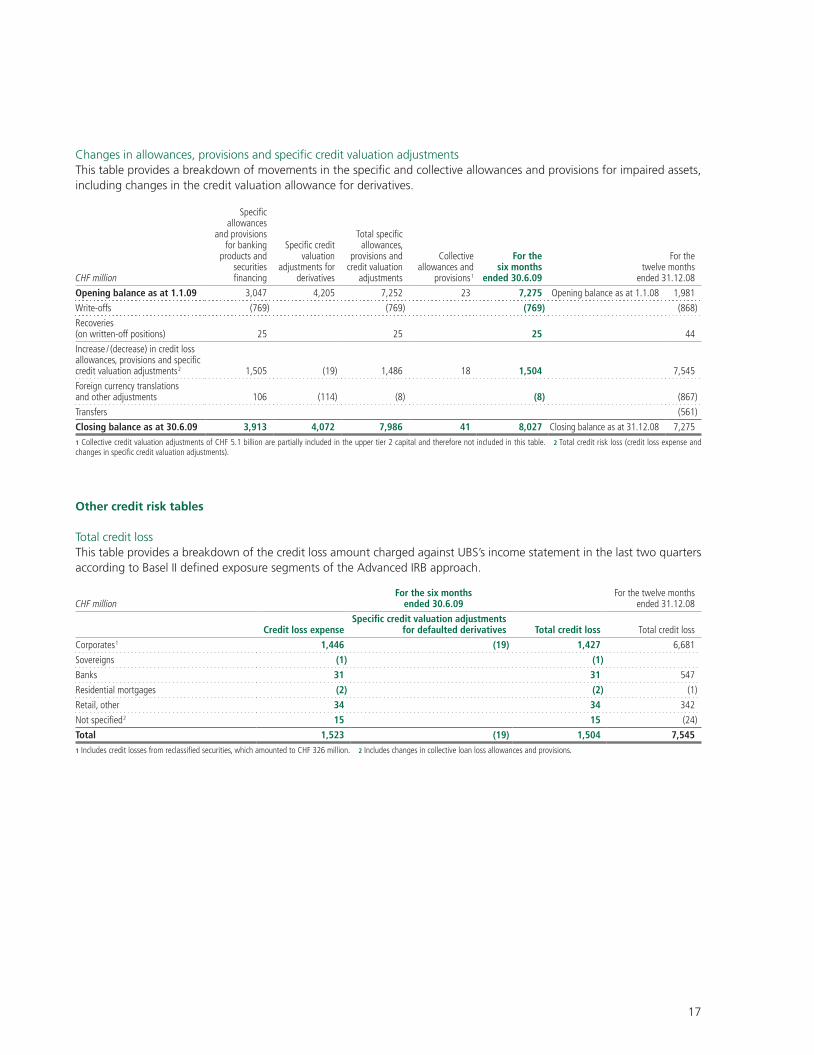
Changes in allowances, provisions and specific credit valuation adjustmentsThis table provides a breakdown of movements in the specific and collective allowances and provisions for impaired assets, including changes in the credit valuation allowance for derivatives.
Other credit risk tables
Total credit lossThis table provides a breakdown of the credit loss amount charged against UBS’s income statement in the last two quarters according to Basel II defined exposure segments of the Advanced IRB approach.
CHF millionFor the six months
ended 30.6.09For the twelve months
ended 31.12.08
Credit loss expenseSpecific credit valuation adjustments
for defaulted derivatives Total credit loss Total credit loss
Corporates 1 1,446 (19) 1,427 6,681
Sovereigns (1) (1)
Banks 31 31 547
Residential mortgages (2) (2) (1)
Retail, other 34 34 342
Not specified 2 15 15 (24)
Total 1,523 (19) 1,504 7,5451 Includes credit losses from reclassified securities, which amounted to CHF 326 million. 2 Includes changes in collective loan loss allowances and provisions.
CHF million
Specific allowances
and provisions for banking
products and securities financing
Specific credit valuation
adjustments for derivatives
Total specific allowances,
provisions and credit valuation
adjustments
Collective allowances and
provisions 1
For the six months
ended 30.6.09
For the twelve months
ended 31.12.08
Opening balance as at 1.1.09 3,047 4,205 7,252 23 7,275 Opening balance as at 1.1.08 1,981
Write-offs (769) (769) (769) (868)
Recoveries (on written-off positions) 25 25 25 44
Increase / (decrease) in credit loss allowances, provisions and specific credit valuation adjustments 2 1,505 (19) 1,486 18 1,504 7,545
Foreign currency translations and other adjustments 106 (114) (8) (8) (867)
Transfers (561)
Closing balance as at 30.6.09 3,913 4,072 7,986 41 8,027 Closing balance as at 31.12.08 7,275
1 Collective credit valuation adjustments of CHF 5.1 billion are partially included in the upper tier 2 capital and therefore not included in this table. 2 Total credit risk loss (credit loss expense and changes in specific credit valuation adjustments).
18
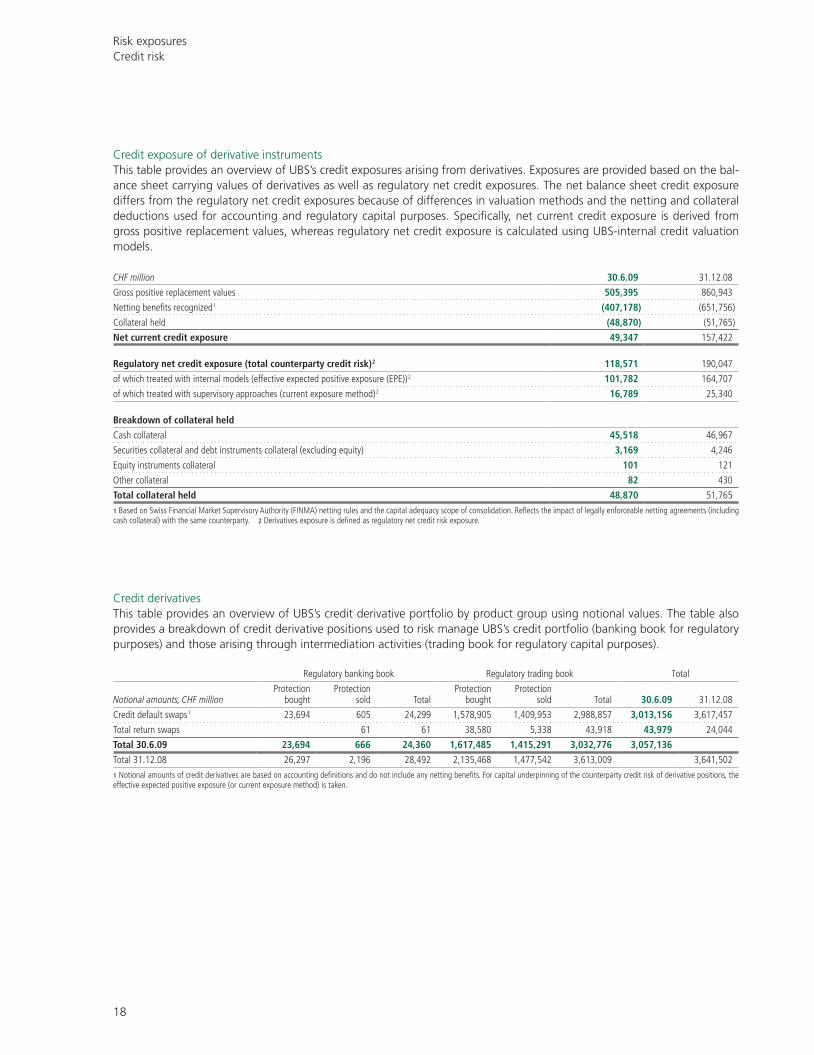
Risk exposuresCredit risk
Credit exposure of derivative instrumentsThis table provides an overview of UBS’s credit exposures arising from derivatives. Exposures are provided based on the bal-ance sheet carrying values of derivatives as well as regulatory net credit exposures. The net balance sheet credit exposure differs from the regulatory net credit exposures because of differences in valuation methods and the netting and collateral deductions used for accounting and regulatory capital purposes. Specifically, net current credit exposure is derived from gross positive replacement values, whereas regulatory net credit exposure is calculated using UBS-internal credit valuation models.
Credit derivativesThis table provides an overview of UBS’s credit derivative portfolio by product group using notional values. The table also provides a breakdown of credit derivative positions used to risk manage UBS’s credit portfolio (banking book for regulatory purposes) and those arising through intermediation activities (trading book for regulatory capital purposes).
CHF million 30.6.09 31.12.08
Gross positive replacement values 505,395 860,943
Netting benefits recognized 1 (407,178) (651,756)
Collateral held (48,870) (51,765)
Net current credit exposure 49,347 157,422
Regulatory net credit exposure (total counterparty credit risk) 2 118,571 190,047
of which treated with internal models (effective expected positive exposure (EPE)) 2 101,782 164,707
of which treated with supervisory approaches (current exposure method) 2 16,789 25,340
Breakdown of collateral held
Cash collateral 45,518 46,967
Securities collateral and debt instruments collateral (excluding equity) 3,169 4,246
Equity instruments collateral 101 121
Other collateral 82 430
Total collateral held 48,870 51,765
1 Based on Swiss Financial Market Supervisory Authority (FINMA) netting rules and the capital adequacy scope of consolidation. Reflects the impact of legally enforceable netting agreements (including cash collateral) with the same counterparty. 2 Derivatives exposure is defined as regulatory net credit risk exposure.
Regulatory banking book Regulatory trading book Total
Notional amounts, CHF millionProtection
boughtProtection
sold TotalProtection
boughtProtection
sold Total 30.6.09 31.12.08
Credit default swaps 1 23,694 605 24,299 1,578,905 1,409,953 2,988,857 3,013,156 3,617,457
Total return swaps 61 61 38,580 5,338 43,918 43,979 24,044
Total 30.6.09 23,694 666 24,360 1,617,485 1,415,291 3,032,776 3,057,136
Total 31.12.08 26,297 2,196 28,492 2,135,468 1,477,542 3,613,009 3,641,502
1 Notional amounts of credit derivatives are based on accounting definitions and do not include any netting benefits. For capital underpinning of the counterparty credit risk of derivative positions, the effective expected positive exposure (or current exposure method) is taken.
19
Risk exposuresEquity exposures outside trading book
Equity exposures outside trading book
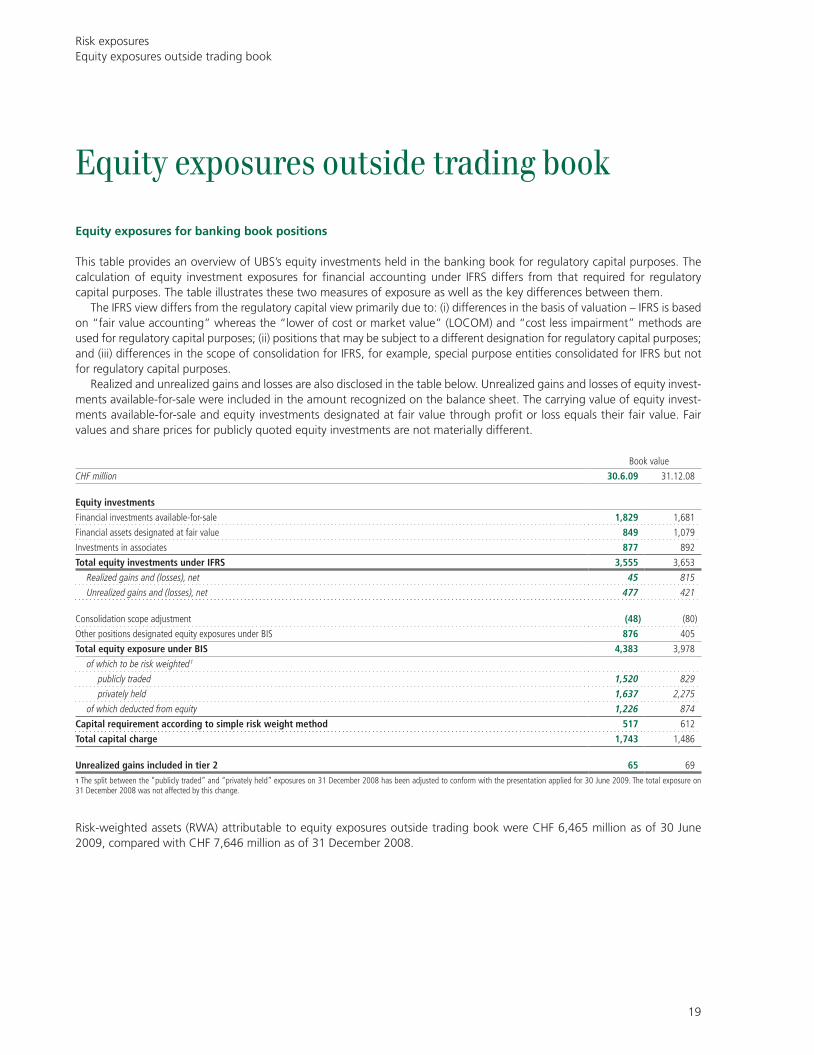
Equity exposures for banking book positions
This table provides an overview of UBS’s equity investments held in the banking book for regulatory capital purposes. The calculation of equity investment exposures for financial accounting under IFRS differs from that required for regulatory capital purposes. The table illustrates these two measures of exposure as well as the key differences between them.
The IFRS view differs from the regulatory capital view primarily due to: (i) differences in the basis of valuation – IFRS is based on “fair value accounting” whereas the “lower of cost or market value” (LOCOM) and “cost less impairment” methods are used for regulatory capital purposes; (ii) positions that may be subject to a different designation for regulatory capital purposes; and (iii) differences in the scope of consolidation for IFRS, for example, special purpose entities consolidated for IFRS but not for regulatory capital purposes.
Realized and unrealized gains and losses are also disclosed in the table below. Unrealized gains and losses of equity invest-ments available-for-sale were included in the amount recognized on the balance sheet. The carrying value of equity invest-ments available-for-sale and equity investments designated at fair value through profit or loss equals their fair value. Fair values and share prices for publicly quoted equity investments are not materially different.
Book value
CHF million 30.6.09 31.12.08
Equity investments
Financial investments available-for-sale 1,829 1,681
Financial assets designated at fair value 849 1,079
Investments in associates 877 892
Total equity investments under IFRS 3,555 3,653
Realized gains and (losses), net 45 815
Unrealized gains and (losses), net 477 421
Consolidation scope adjustment (48) (80)
Other positions designated equity exposures under BIS 876 405
Total equity exposure under BIS 4,383 3,978
of which to be risk weighted 1
publicly traded 1,520 829
privately held 1,637 2,275
of which deducted from equity 1,226 874
Capital requirement according to simple risk weight method 517 612
Total capital charge 1,743 1,486
Unrealized gains included in tier 2 65 69
1 The split between the “publicly traded” and “privately held” exposures on 31 December 2008 has been adjusted to conform with the presentation applied for 30 June 2009. The total exposure on 31 December 2008 was not affected by this change.
Risk-weighted assets (RWA) attributable to equity exposures outside trading book were CHF 6,465 million as of 30 June 2009, compared with CHF 7,646 million as of 31 December 2008.

20
Market risk
Risk-weighted assets (RWA) attributable to market risk were CHF 22,327 million as of 30 June 2009, compared with CHF 27,614 million as of 31 December 2008. The market risk regulatory capital requirement is 8% of the respective RWA. Mar-ket risk regulatory capital and RWA are derived from UBS’s VaR model and subject to regulatory determined multipliers.
Value at Risk
Risk exposuresMarket risk
UBS: Value at Risk (10-day, 99% confidence, five years of historical data)
For the six months ended 30.6.09 For the year ended 31.12.08
CHF million Min. Max. Average 30.6.09 Min. Max. Average 31.12.08
Business divisions
Investment Bank 209 541 391 245 240 601 374 485
Wealth Management & Swiss Bank 1 0 1 0 0
Wealth Management Americas 1 15 24 18 21 1 17 4 16
Global Asset Management 0 7 2 2 1 7 2 6
Corporate Center 3 67 17 10 3 93 26 10
Diversification effect 2 2 (42) (41) 2 2 (34) (25)
Total regulatory VaR 206 545 386 238 246 609 373 492
Diversification effect (%) (10) (15) (8) (5)
Management VaR 3 188 473 299 193 246 521 320 459
1 Split of former Global Wealth Management & Business Banking into Wealth Management & Swiss Bank and Wealth Management Americas not available for 2008, therefore all 2008 Global Wealth Management & Business Banking figures shown under Wealth Management Americas. 2 As the minimum and maximum occur on different days for different risk types, it is not meaningful to calculate a portfolio diversification effect. 3 Includes all positions subject to internal management VaR limits.
Investment Bank: Value at Risk (10-day, 99% confidence, five years of historical data)
For the six months ended 30.6.09 For the year ended 31.12.08
CHF million Min. Max. Average 30.6.09 Min. Max. Average 31.12.08
Risk type
Equities 55 115 79 57 82 185 131 117
Interest rates (including credit spreads) 226 552 393 284 217 659 397 544
Foreign exchange 18 55 29 22 12 58 28 30
Energy, metals and commodities 14 25 18 16 14 60 30 22
Diversification effect 1 1 (128) (134) 1 1 (212) (229)
Total regulatory VaR 209 541 391 245 240 601 374 485
Diversification effect (%) (25) (35) (36) (32)
Management VaR 2 183 454 301 183 239 499 316 424
1 As the minimum and maximum occur on different days for different risk types, it is not meaningful to calculate a portfolio diversification effect. 2 Includes all positions subject to internal management VaR limits.
UBS: Value at Risk (1-day, 99% confidence, five years of historical data) 1
For the six months ended 30.6.09 For the year ended 31.12.08
CHF million Min. Max. Average 30.6.09 Min. Max. Average 31.12.08
Investment Bank Regulatory VaR 2 80 167 124 86 96 210 132 162
Management VaR 3 70 159 100 72 101 171 125 160
UBS Regulatory VaR 2 79 170 125 87 97 207 133 163
Management VaR 3 71 166 102 71 101 169 125 159
1 10-day and 1-day VaR results are separately calculated from underlying positions and historical market moves. They cannot be inferred from each other. 2 Backtesting is based on regulatory VaR. 3 Includes all positions subject to internal management VaR limits.

21
Backtesting
UBS experienced four backtesting exceptions in the first half of 2009. Backtesting is based on regulatory VaR.
0.00
18.75
37.50
56.25
75.00
Investment Bank: backtesting revenues1 distributionFrequency in number of days 1 July 2008 – 30 June 2009
<(3
00)
(300
)–(2
50)
(250
)–(2
00)
(200
)–(1
50)
(150
)–(1
00)
(100
)–(5
0)
(50)
–0
0–50
50–1
00
100–
150
150–
200
200–
250
250–
300
>30
0
Revenues in CHF million
75
60
45
30
15
0
1 Backtesting revenues exclude non-trading revenues, such as commissions and fees, and revenues from intraday trading.
Investment Bank: analysis of negative backtesting revenues1
CHF million 1 July 2008 – 30 June 2009
Frequency in number of days
> 180
150–180
120–150
90–120
60–90
30–60
0–30
(30)–0
(60)–(30)
(90)–(60)
(120)–(90)
(150)–(120)
(180)–(150)
(210)–(180)
(240)–(210)
(270)–(240)
(300)–(270)
< (300)
Negative backtesting revenue less than VaRNegative backtesting revenue greater than VaR
1 Backtesting revenues exclude non-trading revenues, such as commissions and fees, and revenues from intraday trading. Analysis for loss days only.
-20.000000-9.9999820.00003510.00005320.00007130.00008940.000106
1020 0 10 20 30 40

22
Risk exposuresOperational risk
Operational risk
Risk-weighted assets (RWA) attributable to operational risk were CHF 45,989 million as of 30 June 2009, compared with CHF 44,685 million as of 31 December 2008. RWA for operational risk purposes considers both historical losses and for-ward-looking scenarios. The increase in RWA was primarily attributable to the recognition within the historical loss compo-nent of the settlement agreements with the US Department of Justice and the US Securities and Exchange Commission re-lated to UBS’s US cross-border business and announced in February 2009. The operational risk regulatory capital requirement is 8% of the respective RWA.
23
Risk exposuresSecuritization
Securitization
Securitization activity
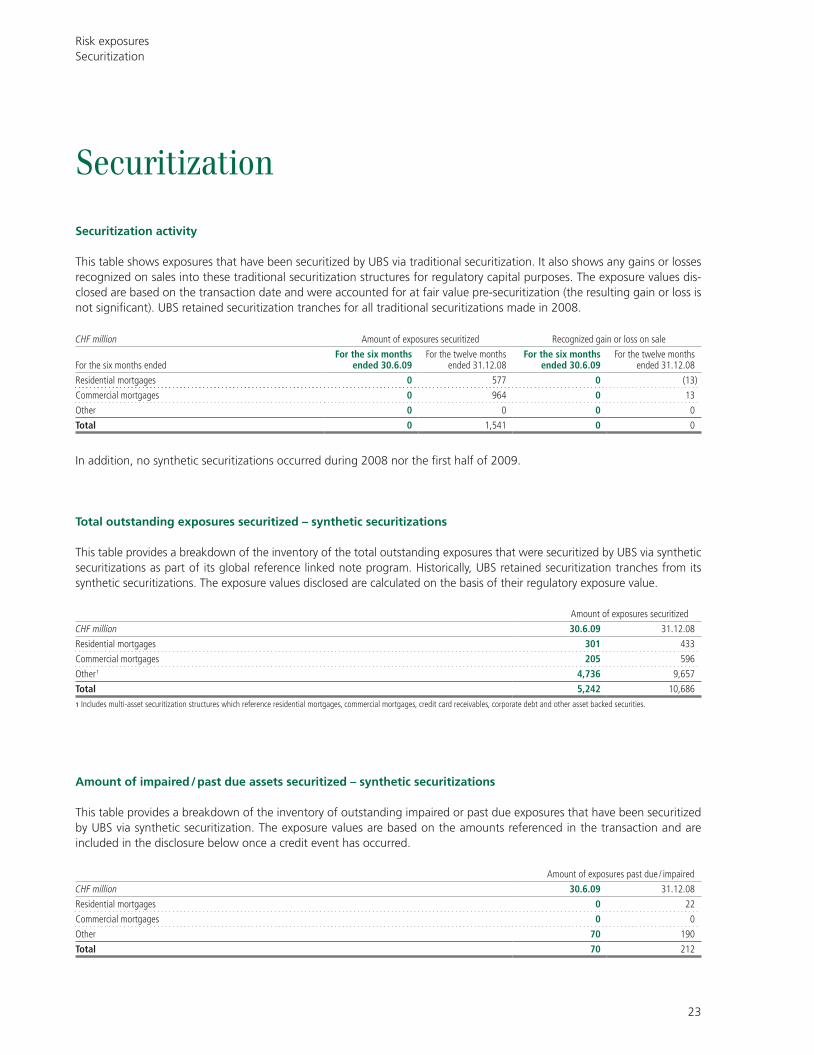
This table shows exposures that have been securitized by UBS via traditional securitization. It also shows any gains or losses recognized on sales into these traditional securitization structures for regulatory capital purposes. The exposure values dis-closed are based on the transaction date and were accounted for at fair value pre-securitization (the resulting gain or loss is not significant). UBS retained securitization tranches for all traditional securitizations made in 2008.
Amount of impaired / past due assets securitized – synthetic securitizations
This table provides a breakdown of the inventory of outstanding impaired or past due exposures that have been securitized by UBS via synthetic securitization. The exposure values are based on the amounts referenced in the transaction and are included in the disclosure below once a credit event has occurred.
Amount of exposures securitized
CHF million 30.6.09 31.12.08
Residential mortgages 301 433
Commercial mortgages 205 596
Other 1 4,736 9,657
Total 5,242 10,686
1 Includes multi-asset securitization structures which reference residential mortgages, commercial mortgages, credit card receivables, corporate debt and other asset backed securities.
Amount of exposures past due / impaired
CHF million 30.6.09 31.12.08
Residential mortgages 0 22
Commercial mortgages 0 0
Other 70 190
Total 70 212
In addition, no synthetic securitizations occurred during 2008 nor the first half of 2009.
Total outstanding exposures securitized – synthetic securitizations
This table provides a breakdown of the inventory of the total outstanding exposures that were securitized by UBS via synthetic securitizations as part of its global reference linked note program. Historically, UBS retained securitization tranches from its synthetic securitizations. The exposure values disclosed are calculated on the basis of their regulatory exposure value.
CHF million Amount of exposures securitized Recognized gain or loss on sale
For the six months endedFor the six months
ended 30.6.09For the twelve months
ended 31.12.08For the six months
ended 30.6.09For the twelve months
ended 31.12.08
Residential mortgages 0 577 0 (13)
Commercial mortgages 0 964 0 13
Other 0 0 0 0
Total 0 1,541 0 0

24
Losses recognized on originated transactions
This table provides a breakdown of losses recognized by UBS on securitization tranches purchased or retained that result from a securitization originated by UBS, after taking into account the offsetting effects of any credit protection that is an eligible risk mitigation instrument for the retained or repurchased tranche. UBS partially reports such exposures on a fair value and partially on a cost less impairment basis.
Securitization exposures retained or purchased
This table provides a breakdown of securitization exposures purchased or retained by UBS, irrespective of its role in the securitization transaction. The exposure values disclosed are calculated on the basis of their regulatory exposure value.
Capital charge for securitization exposures retained or purchased
This table provides a breakdown of securitization exposures purchased or retained by UBS, irrespective of its role in the securitization transaction, as well as a breakdown of the related capital requirement.
CHF million Amounts of losses recognized
For the six months ended 30.6.09
For the twelve months ended 31.12.08
Residential mortgages 1 789
Commercial mortgages 4 153
Other 40 291
Total 45 1,233
Exposure type Exposure amount
CHF million 30.6.09 31.12.08
Residential mortgages 304 592
Commercial mortgages 380 583
Other 1 36,186 33,960
Total 36,870 35,135
1 Includes auction rate securities positions and purchase commitments to clients. Also includes multi-asset securitization structures which reference residential mortgages, commercial mortgages, credit card receivables, corporate debt and other asset backed securities.
Risk exposuresSecuritization
Risk-weighted assets (RWA) for securitization exposures were CHF 14,736 million as of 30 June 2009, compared with CHF 6,202 million as of 31 December 2008. This change is mainly due to ratings downgrades of positions. The market risk regu-latory capital requirement is 8% of the respective RWA.
Exposure amount Capital charge
CHF million 30.6.09 31.12.08 30.6.09 31.12.08
over 0–20% 31,345 32,576 409 332
over 20–35% 1,848 464 52 13
over 35–50% 1,084 253 34 11
over 50–75% 62 321 4 19
over 75–100% 861 1,181 73 100
over 100–150% – – – –
over 150–250% 126 24 27 5
over 250–300% – – – –
over 300–350% – – – –
over 350–375% – – – –
over 375–400% – – – –
over 400–625% 178 10 64 4
over 625–1250% 938 – 516 13
deducted from capital 428 306 428 306
Total 36,870 35,135 1,607 803

Rounding | Numbers presented throughout this report may not add up precisely to the totals provided in the tables. Percentages and percent changes are calculated based on rounded figures displayed in the tables and text and may not precisely reflect the percentages and percent changes that would be derived based on figures that are not rounded.
Imprint | Publisher: UBS AG, P.O. Box, CH-8098 Zurich, Switzerland; CH-4002 Basel, P.O. Box, Switzerland; www.ubs.com | Language: English
© UBS 2009. The key symbol and UBS are among the registered and unregistered trademarks of UBS. All rights reserved.