Embed Size (px)
Citation preview

BASED ON INSIGHTS FROMSHOPPERS AROUND THE WORLD
BASED ON INSIGHTS FROMSHOPPERS AROUND THE WORLD
TABLE OF CONTENTS
3. CHRISTMAS SHOPPING FOREC AST: JOLLY4. 2016 CHRISTMAS SHOPPING INSIGHTS
CHAPTER 1:INTRODUCTION
CHAPTER 2:THE WHERE & WHEN OF CHRISTMAS SHOPPING6. FAVORITE RETAILERS7. THE WHEN OF CHRISTMAS SHOPPING8. PATH TO GIFT PURCHASES
CHAPTER 3:ONLINE & IN-STORE CHRISTMAS SHOPPING 10. ONLINE CHRISTMAS SHOPPING11. OLD FASHIONED, OMNICHANNEL CHRISTMAS12. IN-STORE INFLUENCES WHILE SHOPPING13. IN-STORE SHOPPING FRUSTRATIONS
14-20. BRAND MANAGER’S GUIDE
CHAPTER 4:GIFTS GALORE22. CHRISTMAS SHOPPING FOR KIDS23. CHRISTMAS SHOPPING FOR THE “BETTER HALF”24. MEN & WOMEN’S GIFT WISHES25. OH CHRISTMAS TECH, OH CHRISTMAS TECH...26. FILLIN’ THE STOCKINGS27. THE SKINNY ON GIFT CARDS
CHAPTER 5:FOOD & BEVERAGES OF THE FESTIVE SEASON 29. EATING IN AT CHRISTMAS TIME30. EATING TAKEAWAY AT CHRISTMAS TIME31. THE CHRISTMAS PARTY SCENE32. AROUND THE HOUSE
33-34. DEMOS & METHODS
35. WHAT’S IN-STORE THIS CHRISTMAS SEA SON ?
www.fieldagent.net.au | blog.fieldagent.net.au | [email protected]
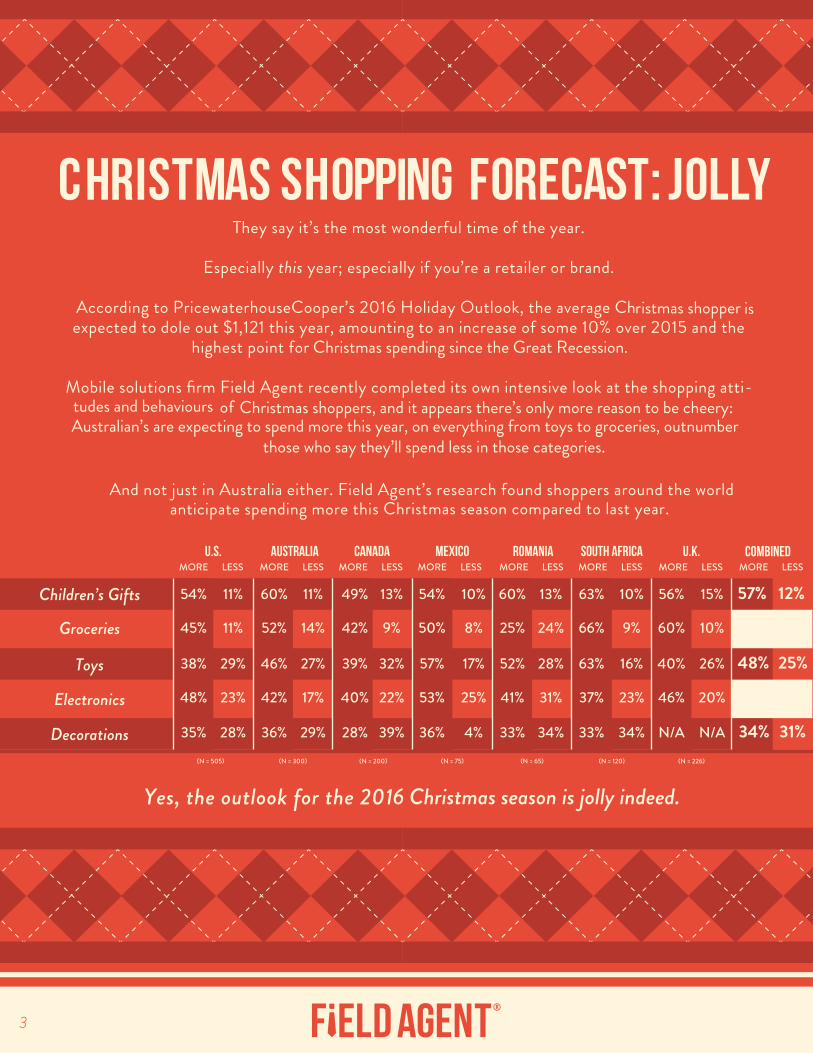
CHRISTM AS SHOPPING FORECAST: JOLLYThey say it’s the most wonderful time of the year.
Especially this year; especially if you’re a retailer or brand.
According to PricewaterhouseCooper’s 2016 Holiday Outlook, the average Christmas shopper is expected to dole out $1,121 this year, amounting to an increase of some 10% over 2015 and the
highest point for Christmas spending since the Great Recession.
Mobile solutions firm Field Agent recently completed its own intensive look at the shopping atti- of Christmas shoppers, and it appears there’s only more reason to be cheery:
Australian’s are expecting to spend more this year, on everything from toys to groceries, outnumber those who say they’ll spend less in those categories.
And not just in Australia either. Field Agent’s research found shoppers around the world anticipate spending more this Christmas season compared to last year.
Yes, the outlook for the 2016 Christmas season is jolly indeed.
AUSTRALIA CANADA ROMANIA SOUTH AFRICA U.K.MEXICOU.S.
Children’s Gifts
Toys
Decorations
Groceries
Electronics
54%
45%
38%
48%
35% 28% 39% 33%
23% 22% 41%
29% 32% 52%
11% 9% 25%
11%
36%
42%
46%
52%
60%
29%
17%
27%
14%
11%
28%
40%
39%
42%
49%
36%
53%
57%
50%
54%
4%
25%
17%
8%
10%
34%
31%
28%
24%
13%
33%
37%
63%
66%
63%
34%
23%
16%
9%
10%
N/A
46%
40%
60%
56%
N/A
20%
26%
10%
15%13% 60%
COMBINEDMORE LESS MORE LESS MORE LESS MORE LESS MORE LESS MORE LESS MORE LESS MORE LESS
34%
48%
49%
57%
44%
31%
25%
12%
12%
22%
3
tudes and behaviours
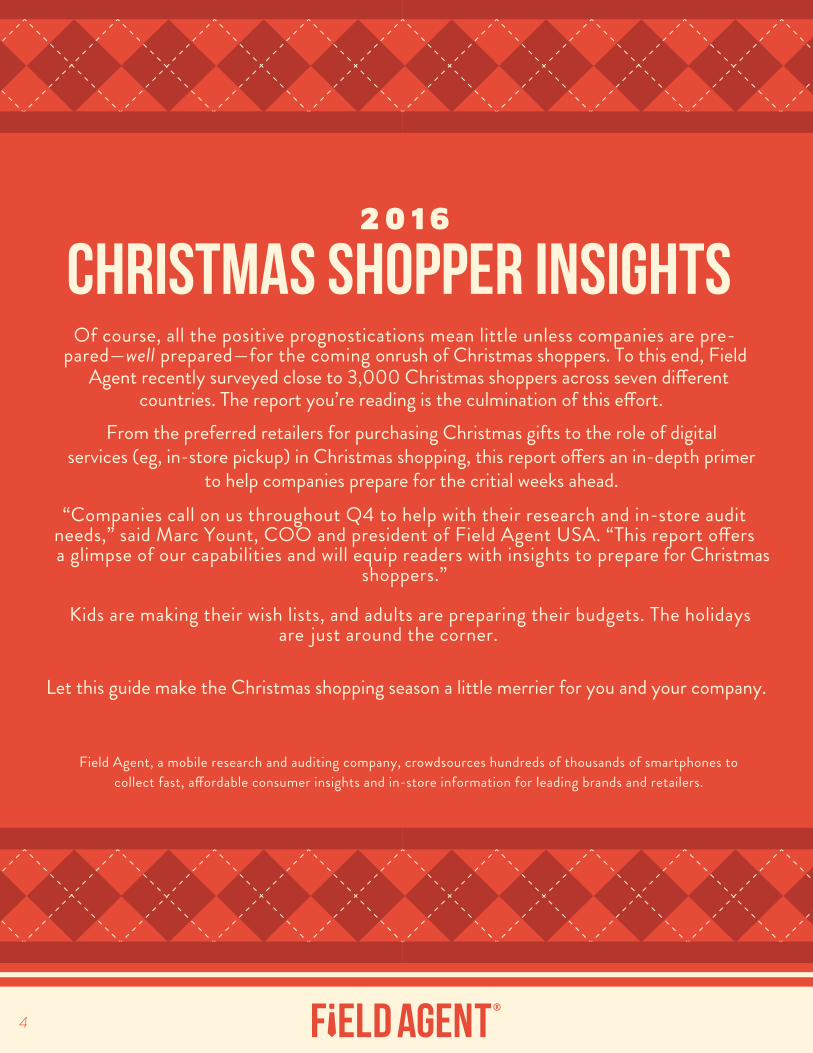
Of course, all the positive prognostications mean little unless companies are pre-pared—well prepared—for the coming onrush of Christmas shoppers. To this end, Field
“Companies call on us throughout Q4 to help with their research and in-store audit
a glimpse of our capabilities and will equip readers with insights to prepshoppers.”
Kids are making their wish lists, and adults are preparing their budgets. The holidays jusare t around the corner.
Field Agent, a mobile research and auditing company, crowdsources hundreds of thousands of smartphones to
christmas shopper insights2 0 1 6
4
Agent recently surveyed close to 3,000 Christmas shoppers across seven di�erentcountries. The report you’re reading is the culmination of this e�ort.
are for Christmas
Let this guide make the Christmas shopping season a little merrier for you and your company.
From the preferred retailers for purchasing Christmas gifts to the role of digitalservices (eg, in-store pickup) in Christmas shopping, this report o�ers an in-depth primer
to help companies prepare for the critial weeks ahead.
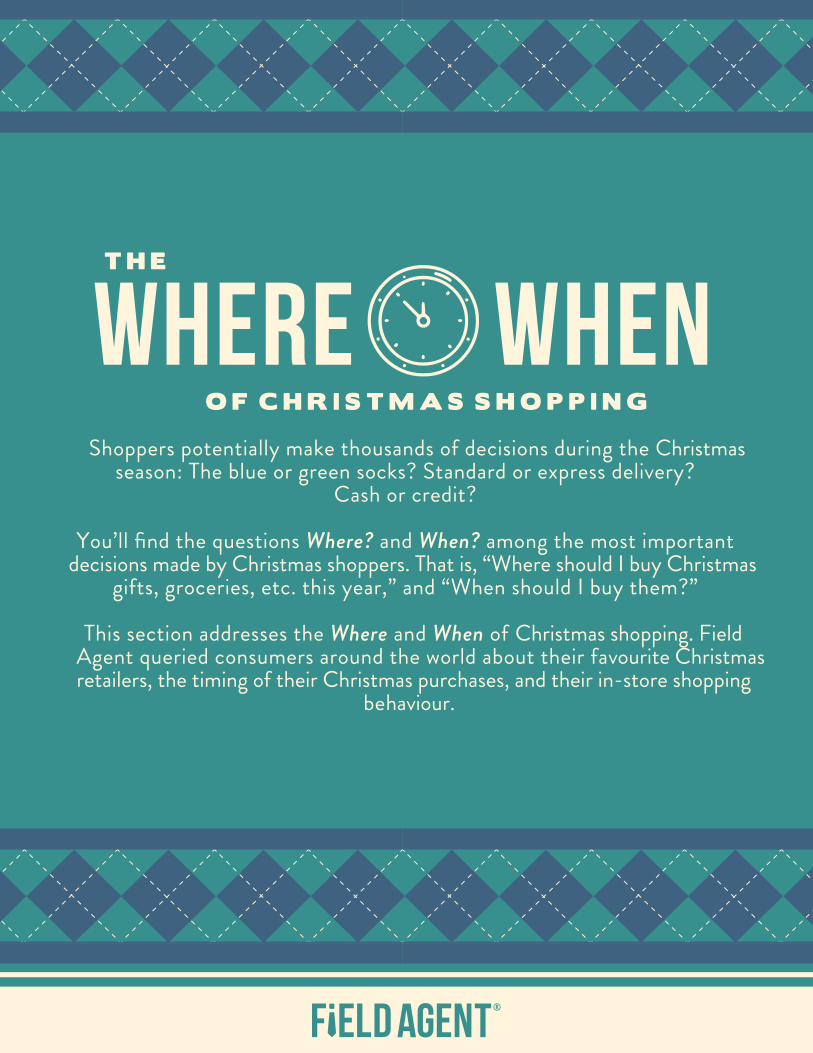
O F C H R I S T M A S S H O P P I N G
T H E
WHERE WHENShoppers potentially make thousands of decisions during the Christmas
season: The blue or green socks? Standard or express delivery?Cash or credit?
You’ll find the questions Where? and When? among the most important
gifts, groceries, etc. this year,” and “When should I buy them?”
This section addresses the Where and When of Agent queried consumers around the world about their favourite Christmas
behaviour.
decisions made by Christmas shoppers. That is, “Where should I buy Christmas
Christmas shopping. Field
retailers, the timing of their Christmas purchases, and their in-store shopping
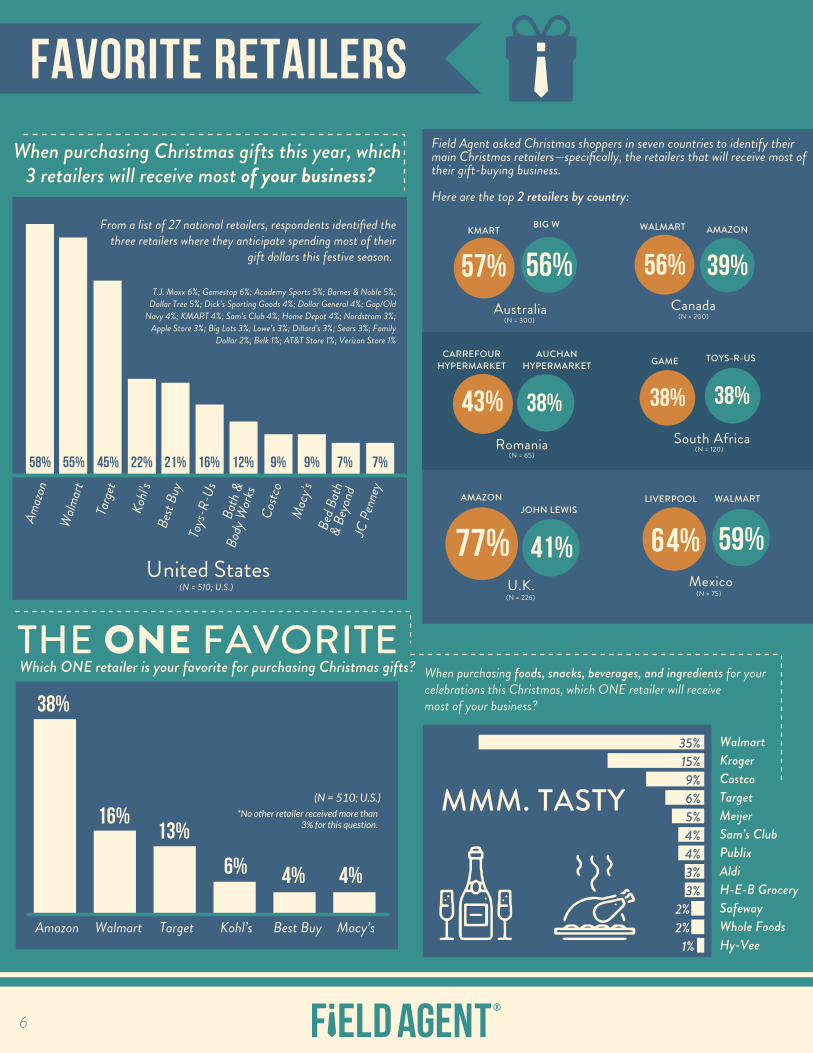
FAVORITE RETAILERS
When purchasing Christmas gifts this year, which3 retailers will receive most of your business?
From a list of 27 national retailers, respondents identified the three retailers where they anticipate spending most of their
gift dollars this festive season.
Amaz
onW
almar
tTa
rget
Kohl’
sBe
st Bu
yTo
ys-R
-Us
Costc
oM
acy’s
JC P
enne
y
Bed B
ath
& Be
yond
Bath
&Bo
dy W
orks
58% 55% 45% 22% 21% 16% 12% 9% 9% 7% 7%
T.J. Maxx 6%; Gamestop 6%; Academy Sports 5%; Barnes & Noble 5%; Dollar Tree 5%; Dick’s Sporting Goods 4%; Dollar General 4%; Gap/Old
Navy 4%; KMART 4%; Sam’s Club 4%; Home Depot 4%; Nordstrom 3%; Apple Store 3%; Big Lots 3%; Lowe’s 3%; Dillard’s 3%; Sears 3%; Family
Dollar 2%; Belk 1%; AT&T Store 1%; Verizon Store 1%
Field Agent asked Christmas shoppers in seven countries to identify their main Christmas retailers—specifically, the retailers that will receive most of their gift-buying business.
Here are the top 2 retailers by country:
THE ONE FAVORITEWhich ONE retailer is your favorite for purchasing Christmas gifts?
Amazon Walmart Target Kohl’s Best Buy Macy’s
*No other retailer received more than3% for this question.
38%
16%13%
6% 4% 4%
WalmartKrogerCostcoTargetMeijerSam’s ClubPublixAldiH-E-B GrocerySafewayWhole FoodsHy-Vee
When purchasing foods, snacks, beverages, and ingredients for your celebrations this Christmas, which ONE retailer will receive most of your business?
35%15%9%6%5%4%4%3%3%
2%2%
1%
(N = 510; U.S.)
(N = 510; U.S.)
U.K.(N = 226) (N = 75)
Mexico
Australia
KMART BIG W
57% 56%
(N = 300)
WALMART AMAZON
Canada
56% 39%
(N = 200)
CARREFOURHYPERMARKET
AUCHANHYPERMARKET
Romania
43% 38%
(N = 65)
South Africa(N = 120)
38% 38%
GAME TOYS-R-US
77% 64% 59%41%
AMAZONJOHN LEWIS
LIVERPOOL WALMART
MMM. TASTY
6
United States
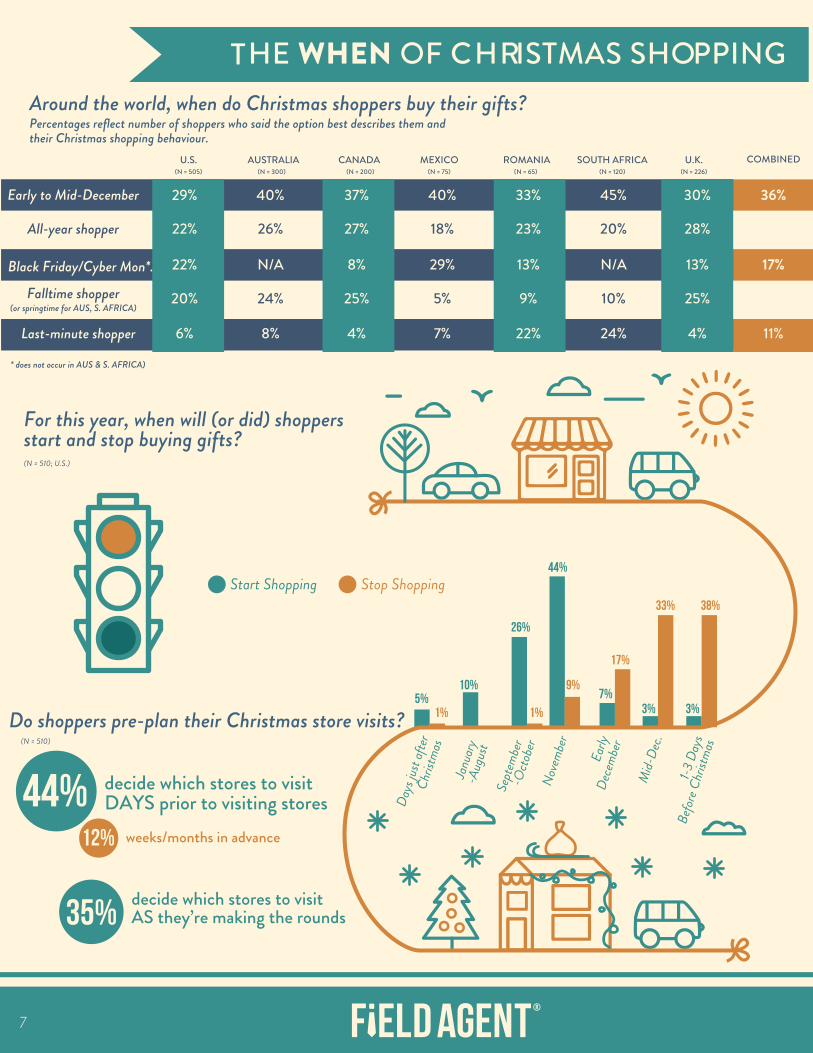
THE WHEN OF CHRISTMAS SHO P P I N G
5%10%
26%
44%
7%3% 3%1% 1%
9%
17%
33%
Do shoppers pre-plan their Christmas store visits?
Days
just
after
Chris
tmas
Janu
ary
-Aug
ust
Sept
embe
r-O
ctobe
rNo
vemb
er
Early
Dece
mber
Mid-
Dec.
1-3 D
ays
Befo
re Ch
ristm
as
Stop ShoppingStart Shopping
(N = 510; U.S.)
44%
(N = 510)
decide which stores to visitDAYS prior to visiting stores
35%decide which stores to visitAS they’re making the rounds
12% weeks/months in advance
For this year, when will (or did) shoppers start and stop buying gifts?
Around the world, when do Christmas shoppers buy their gifts?Percentages reflect number of shoppers who said the option best describes them and their Christmas shopping behaviour.
7
38%
AUSTRALIA CANADA ROMANIA SOUTH AFRICA U.K.MEXICOU.S.
Early to Mid-December
Black Friday/Cyber Mon*.
Last-minute shopper
All-year shopper
Falltime shopper(or springtime for AUS, S. AFRICA)
29%
22%
22%
20%
6% 8% 4% 7% 22% 24% 4% 11%
24% 25% 5% 9% 10% 25% 17%
N/A 8% 29% 13% N/A 13% 17%
26% 27% 18% 23% 20% 28%
40% 37% 40% 33% 45% 30%
COMBINED
23%
36%
* does not occur in AUS & S. AFRICA)
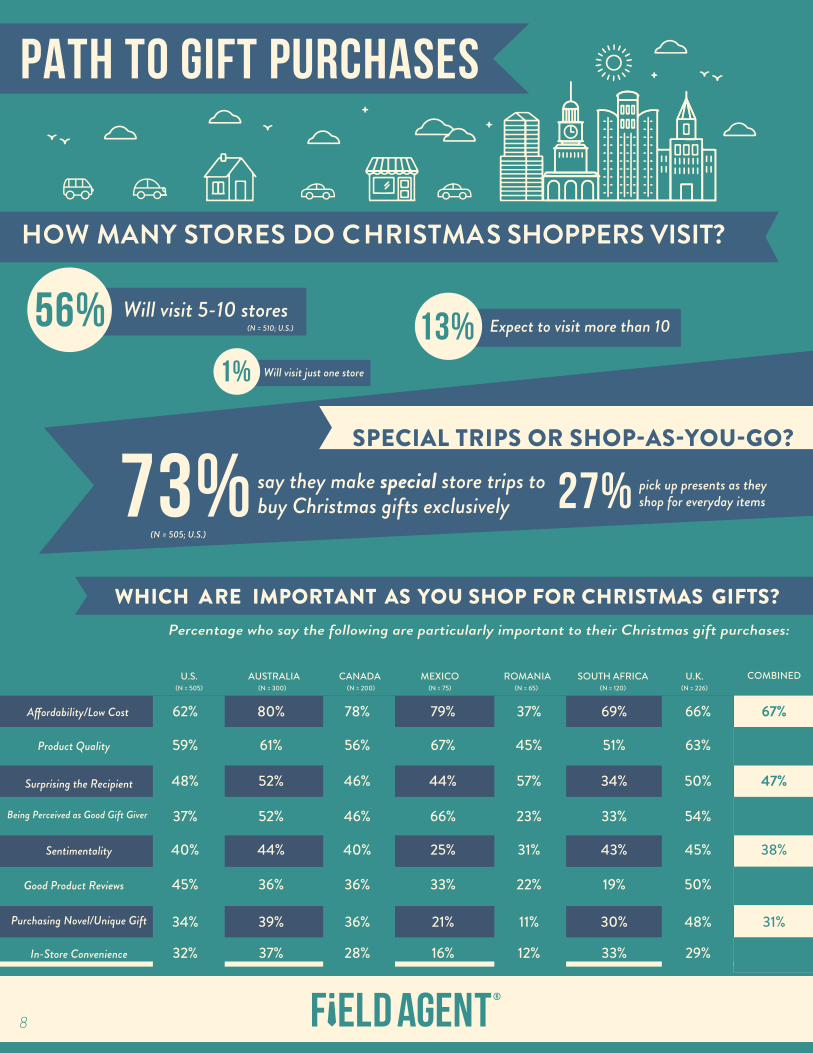
HOW MANY STORES DO CHRISTMA S SHOPPERS VISIT?
WHICH ARE IMPORTANT AS YOU SHOP FOR CHRISTMAS GIFTS?
say they make special store trips to buy Christmas gifts exclusively
Percentage who say the following are particularly important to their Christmas gift purchases:
PATH TO GIFT PURCHASES
Expect to visit more than 1013%Will visit 5-10 stores56%
Will visit just one store1%
(N = 510; U.S.)
(N = 505; U.S.)
73% 27% pick up presents as theyshop for everyday items
AUSTRALIA CANADA ROMANIA SOUTH AFRICA U.K.MEXICOU.S.
Surprising the Recipient
Sentimentality
Being Perceived as Good Gift Giver
Purchasing Novel/Unique Gift
In-Store Convenience
Product Quality
Good Product Reviews
62%
59%
48%
45%
40% 44% 40% 25% 31% 43% 45%
37% 52% 46% 66% 23% 33% 54%
34% 39% 36% 21% 11% 30% 48%
32% 37% 28% 16% 12% 33% 29%
38%
36% 36% 33% 22% 19% 50%
52% 46% 44% 57% 34% 50% 47%
61% 56% 67% 45% 51% 63%
80% 78% 79% 37% 69% 66% 67%
COMBINED
57%
34%
44%
31%
27%
8
ONLINE IN-STOREPwC’s 2016 Holiday Outlook projects a 25% increase in digital shopping this
Christmas season. 25%! It seems more and more are opting to “click” their way through the holiday shopping season. But even in-store Christmas shopping is
curbside pickup, smartphone apps, and the like.
In this section, Field Agentincluding the preferred websites for Christmas purchases as well as the
prevalence of online shopping and various omnichannel services.
least a portion of their purchases in stores this year. Thus, this section also features information on the attitudes and
in-store influences, before ending with an interesting discussion of Christmas shoppers’ top in-store frustrations.
CHRISTMAS SHOPPING
Of course, the overwhelming majority of Christmas shoppers will complete at
o�ers insight into the rise of digital shopping,
behaviours of shoppers toward
.
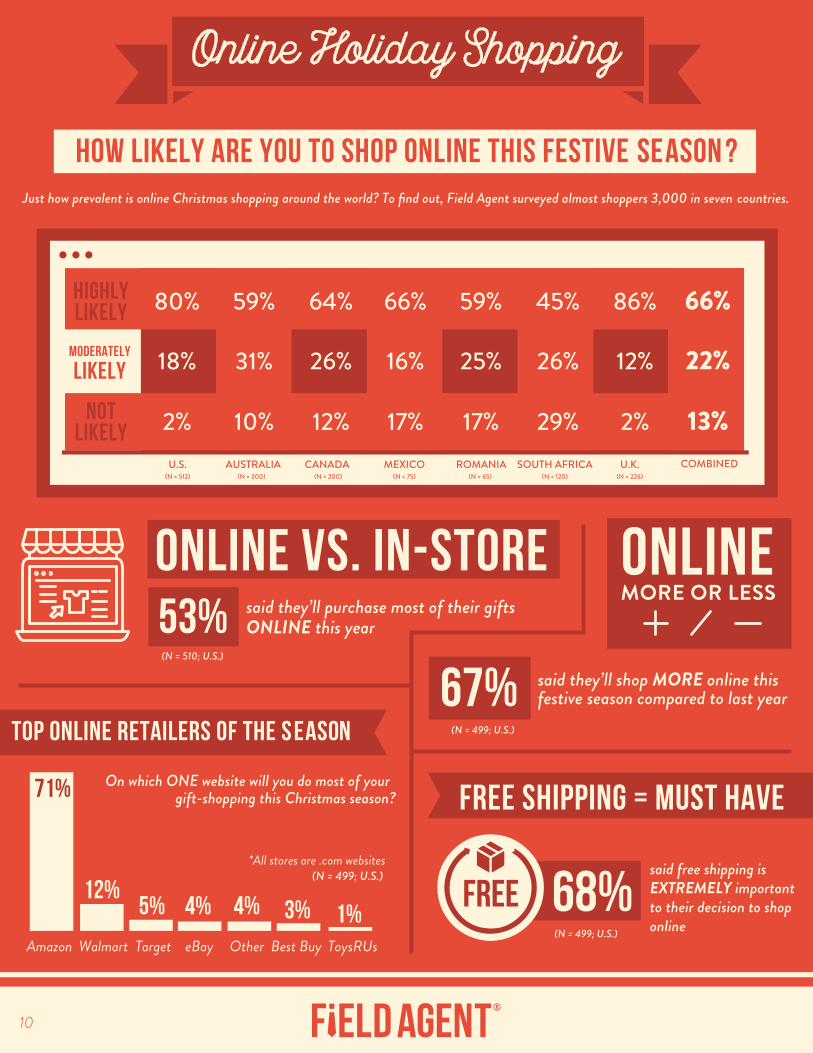
TOP ONLINE RETAILERS OF THE s eason
On which ONE website will you do most of your gift-shopping this Christmas season?
Amazon
71%
12%5% 4% 4% 3% 1%
Walmart Target eBay Other Best Buy ToysRUs
*All stores are .com websites
Online Holiday Shopping
Just how prevalent is online Christmas shopping around the world? To find out, Field Agent surveyed almost shoppers 3,000 in seven countries.
HOW LIKELY ARE YOU TO SHOP ONLINE THIS FESTIVE SEASON ?
ONLINE VS. IN-STOREsaid they’ll purchase most of their giftsONLINE this year53%
(N = 510; U.S.)
(N = 499; U.S.)
MORE OR LESSONLINE
said they’ll shop MORE online thisfestive season compared to last year
(N = 499; U.S.)
67%
FREE SHIPPING = MUST HAVE
(N = 499; U.S.)
said free shipping isEXTREMELY importantto their decision to shoponline
68%FREE
AUSTRALIA CANADA ROMANIA SOUTH AFRICA U.K.MEXICOU.S. COMBINED
HIGHLYLIKELY
LIKELYMODERATELY
NOTLIKELY
80%
18%
2%
59%
31%
10%
64%
26%
12%
66%
16%
17%
59%
25%
17%
45%
26%
29%
86%
12%
2%
66%
22%
13%
10
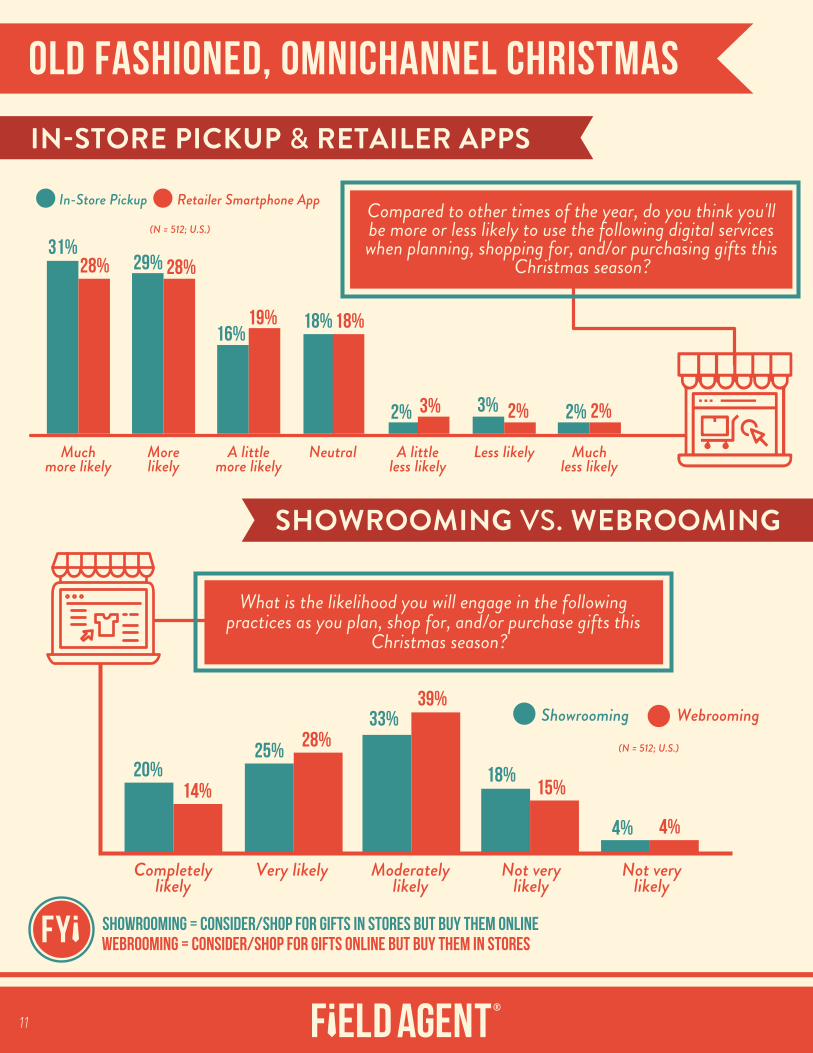
& RETAILER APPS
SHOWROOMING VS. WEBROOMING
OLD FASHIONED, OMNICHANNEL CHRISTMAS
In-Store Pickup Retailer Smartphone App
Muchmore likely
Morelikely
A littlemore likely
Neutral A littleless likely
Less likely Muchless likely
Completelylikely
Very likely Moderatelylikely
Not verylikely
Not verylikely
20%25%
33%
18%
4%
14%
28%
39%
15%
4%
Showrooming Webrooming
What is the likelihood you will engage in the following practices as you plan, shop for, and/or purchase gifts this
Christmas season?
31%28% 29% 28%
16%19% 18% 18%
2% 3% 3% 2% 2% 2%
Compared to other times of the year, do you think you'll be more or less likely to use the following digital services when planning, shopping for, and/or purchasing gifts this
Christmas season?
Showrooming = consider/shop for gifts IN STORES but buy them ONLINEWebrooming = Consider/shop for gifts ONLINE but buy them IN STORESFY
(N = 512; U.S.)
(N = 512; U.S.)
11
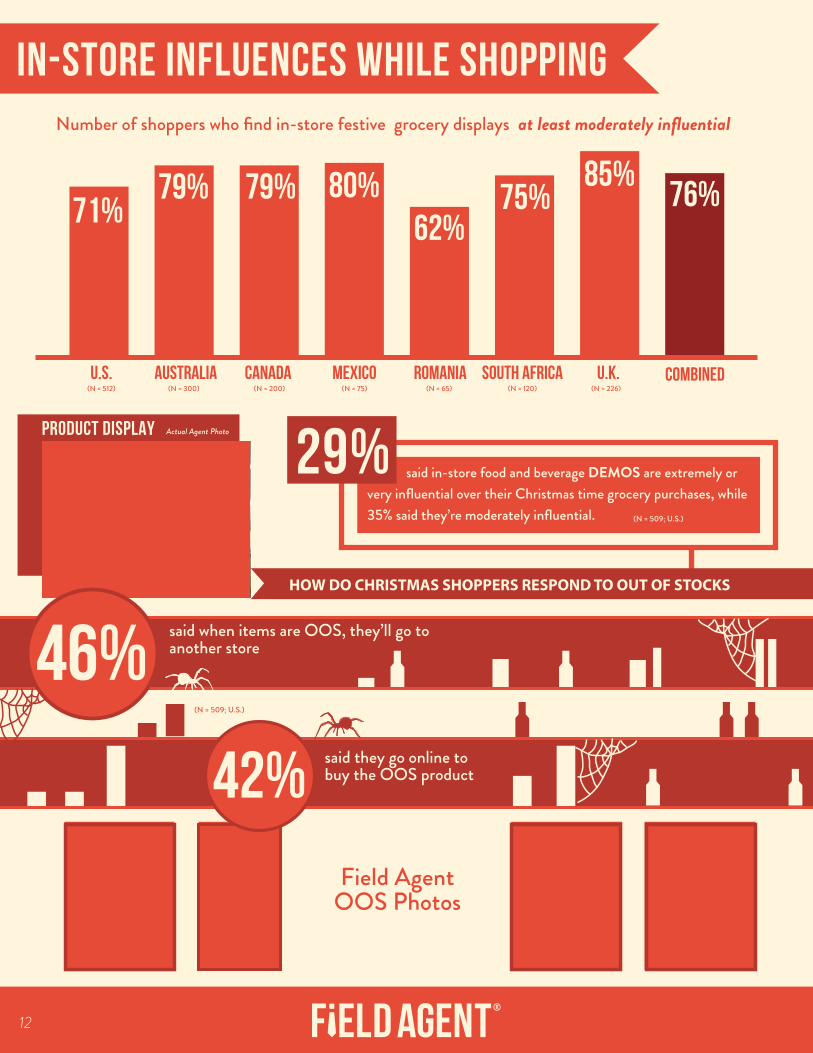
IN-STORE INFLUENCES WHILE SHOPPING
PRODUCT DISPLAY Actual Agent Photo
46%said when items are OOS, they’ll go toanother store
42% said they go online tobuy the OOS product
Field AgentOOS Photos
(N = 509; U.S.)
said in-store food and beverage DEMOS are extremely or very influential over their Christmas time grocery purchases, while 35% said they’re moderately influential. (N = 509; U.S.)
29%
AUSTRALIA CANADA ROMANIA SOUTH AFRICA U.K.MEXICOU.S. COMBINED
71%79% 79% 80%
62%75%
85%76%
Number of shoppers who find in-store festive grocery displays at least moderately influential
12
HOW DO CHRISTMAS SHOPPERS RESPOND TO OUT OF STOCKS
MOST FRUSTRATING PART OF CHRISTMAS SHOPPING
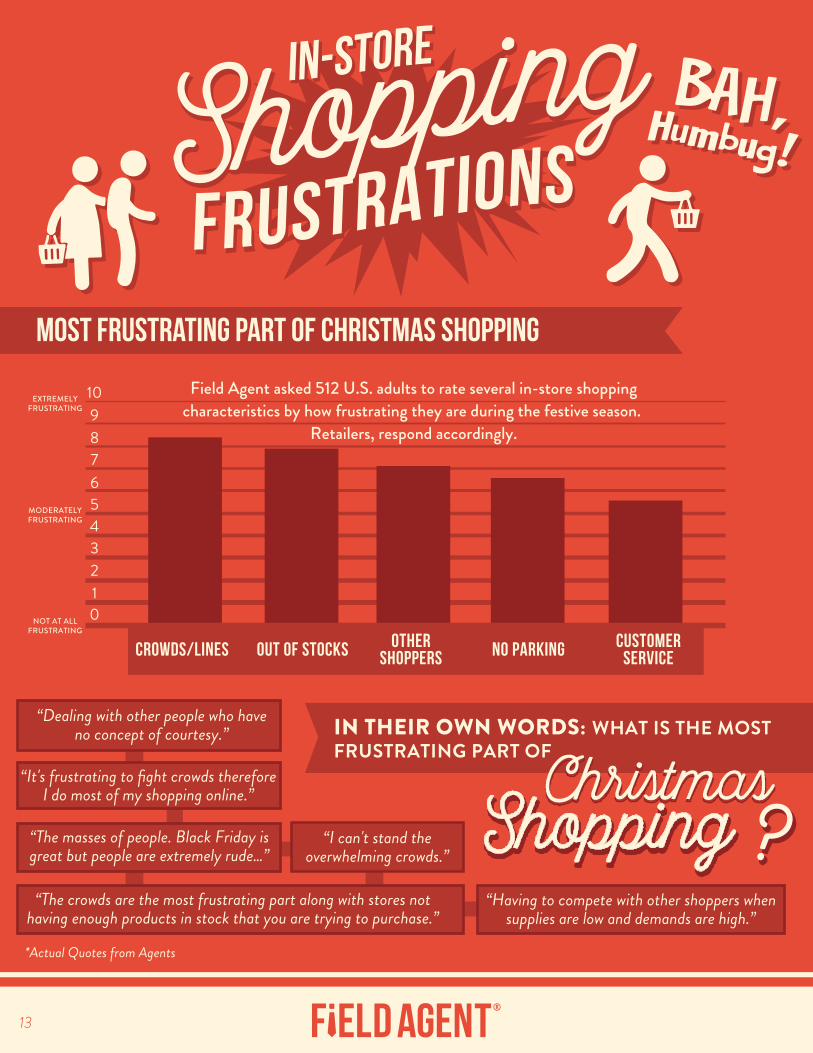
CROWDS/LINES
012345678910
OUT OF STOCKS NO PARKINGOTHERSHOPPERS
CUSTOMERSERVICE
Field Agent asked 512 U.S. adults to rate several in-store shopping characteristics by how frustrating they are during the festive season.
Retailers, respond accordingly.
EXTREMELYFRUSTRATING
NOT AT ALLFRUSTRATING
MODERATELYFRUSTRATING
IN THEIR OWN WORDS: WHAT IS THE MOSTFRUSTRATING PART OF
ShoppingShopping*Actual Quotes from Agents
“Dealing with other people who haveno concept of courtesy.”
“It's frustrating to fight crowds thereforeI do most of my shopping online.”
“I can't stand theoverwhelming crowds.”
“The masses of people. Black Friday isgreat but people are extremely rude…”
“Having to compete with other shoppers whensupplies are low and demands are high.”
“The crowds are the most frustrating part along with stores nothaving enough products in stock that you are trying to purchase.”
13
ChristmasChristmas
MOST FRUSTRATING PART OF CHRISTMAS SHOPPING
BRAND MANAGER’S GUIDEQ4
Christmas Shopping Guide Continued On Page 21
THE BRAND MANAGER’S GUIDE TO Q4 RETAIL EXECUTION
OriginallyFeatured in:
[A free consumer insights report from MRMW's Mobile Research Agency of the Year]
ALL THINGS
THE BRAND MANAGER’S GUIDE
2
That goes for companies across a wide expanse of industries—from toys to fan gear, lollies to consumerelectronics.
As a company founded by FMCG veterans for FMCG professionals, Field Agent specialises in helping brands identify problems in their retail execution, ultimately to improve sales with shoppers.
With Q4 upon us, this guide will share some of the more common causes of suboptimal—you might say,underachieving—retail execution among FMCG companies.
Make the most of the all-important weeks ahead, by being mindfulof the following in-store pitfalls.
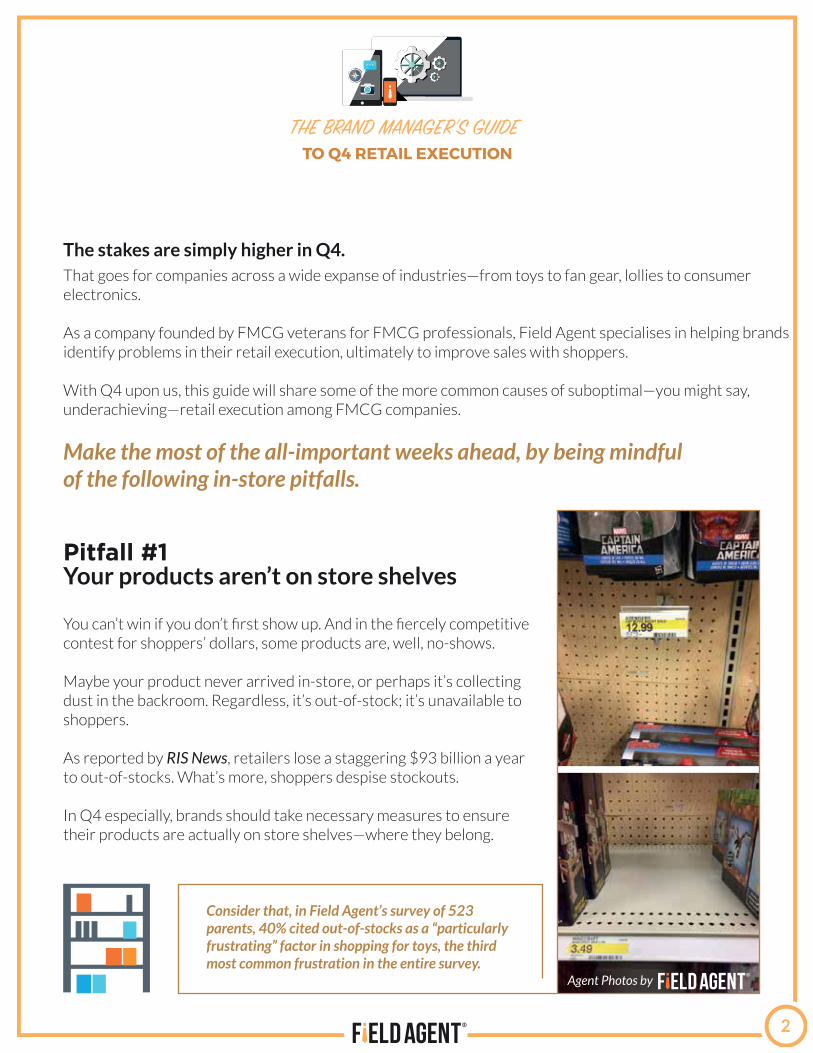
You can’t win if you don’t first show up. And in the fiercely competitive contest for shoppers’ dollars, some products are, well, no-shows.
Maybe your product never arrived in-store, or perhaps it’s collecting dust in the backroom. Regardless, it’s out-of-stock; it’s unavailable to shoppers.
As reported by RIS News, retailers lose a staggering $93 billion a year to out-of-stocks. What’s more, shoppers despise stockouts.
In Q4 especially, brands should take necessary measures to ensure their products are actually on store shelves—where they belong.
Consider that, in Field Agent’s survey of 523 parents, 40% cited out-of-stocks as a “particularly frustrating” factor in shopping for toys, the third most common frustration in the entire survey.
Agent Photos by
Pitfall #1Your products aren’t on store shelves
The stakes are simply higher in Q4.
TO Q4 RETAIL EXECUTION
TO Q4 RETAIL EXECUTION THE BRAND MANAGER’S GUIDE
3
LEARN MORE ABOUTPLANOGRAM COMPLIANCE
[FREE CASE STUDY]
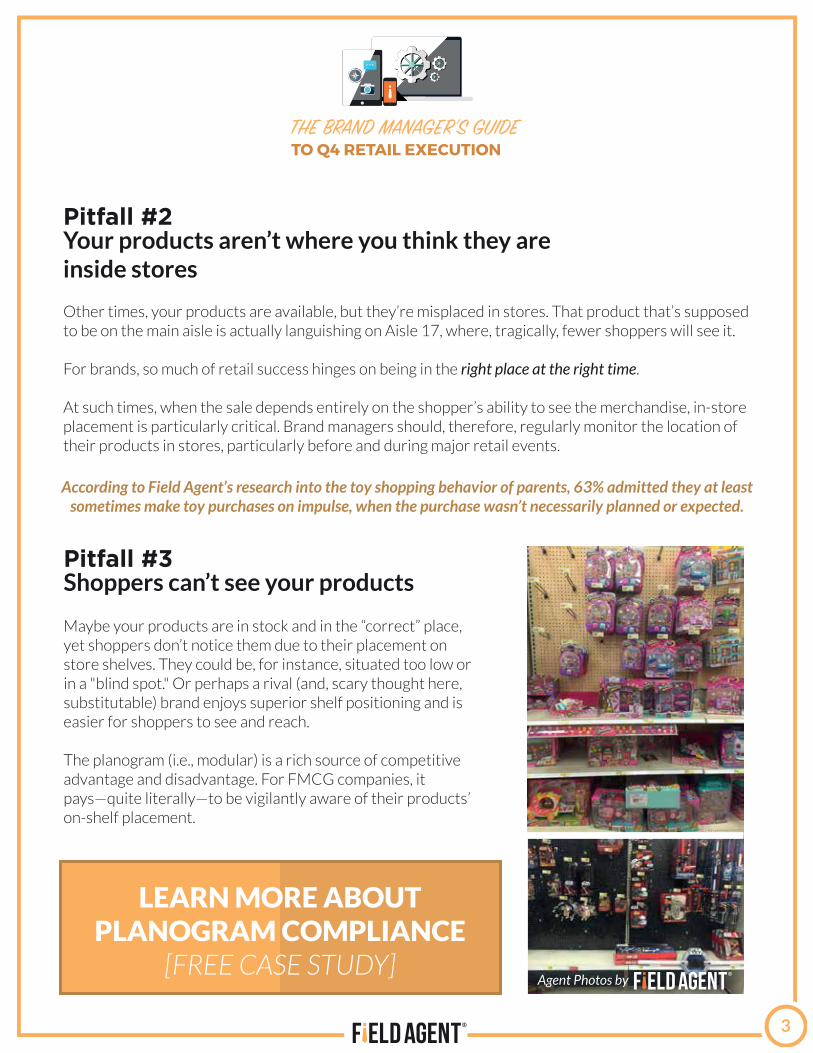
Maybe your products are in stock and in the “correct” place, yet shoppers don’t notice them due to their placement on store shelves. They could be, for instance, situated too low or in a "blind spot." Or perhaps a rival (and, scary thought here, substitutable) brand enjoys superior shelf positioning and is easier for shoppers to see and reach.
The planogram (i.e., modular) is a rich source of competitive advantage and disadvantage. For FMCG companies, itpays—quite literally—to be vigilantly aware of their products’ on-shelf placement.
Other times, your products are available, but they’re misplaced in stores. That product that’s supposed to be on the main aisle is actually languishing on Aisle 17, where, tragically, fewer shoppers will see it.
For brands, so much of retail success hinges on being in the right place at the right time.
At such times, when the sale depends entirely on the shopper’s ability to see the merchandise, in-store placement is particularly critical. Brand managers should, therefore, regularly monitor the location of their products in stores, particularly before and during major retail events.
According to Field Agent’s research into the toy shopping behavior of parents, 63% admitted they at least sometimes make toy purchases on impulse, when the purchase wasn’t necessarily planned or expected.
Agent Photos by
Pitfall #3Shoppers can’t see your products
Pitfall #2Your products aren’t where you think they areinside stores
4
CLICK HERE TO READ OTHER CAUSES OF
UNDERPERFORMING PRODUCT DISPLAYS
Agent Photos by
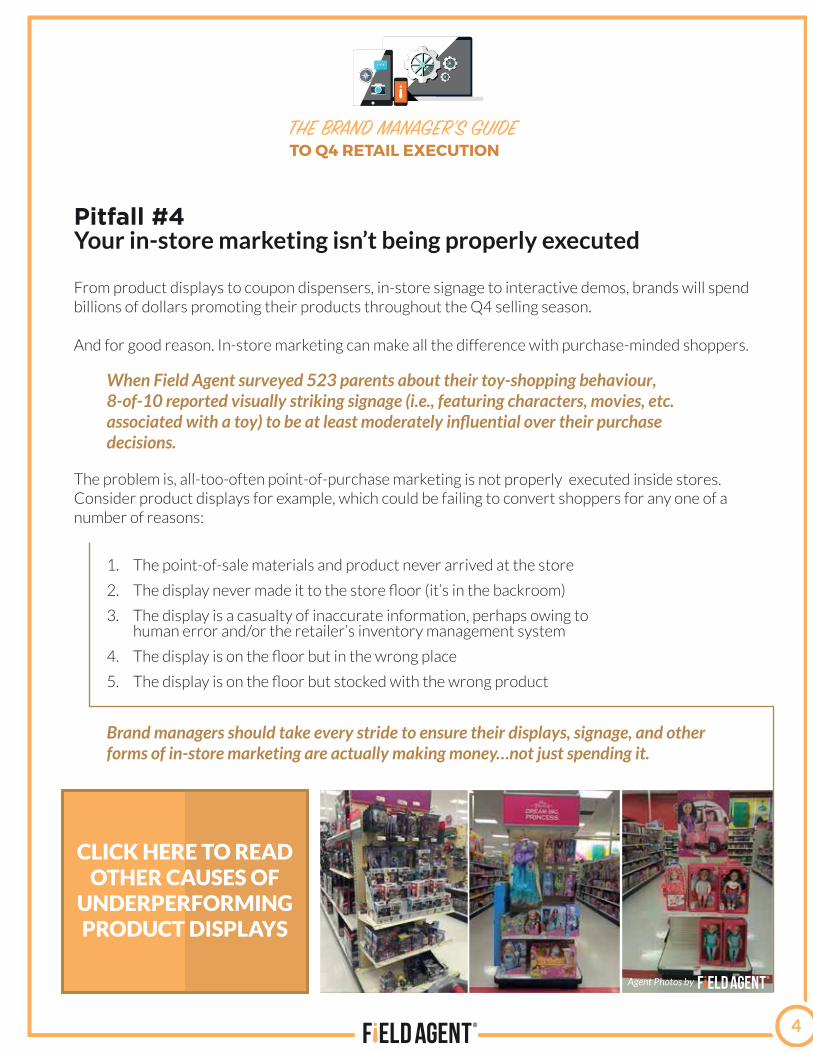
Brand managers should take every stride to ensure their displays, signage, and other forms of in-store marketing are actually making money…not just spending it.
1.
2.
3.
4.
5.
The point-of-sale materials and product never arrived at the store
The display never made it to the store floor (it’s in the backroom)
The display is a casualty of inaccurate information, perhaps owing to human error and/or the retailer’s inventory management system
The display is on the floor but in the wrong place
The display is on the floor but stocked with the wrong product
From product displays to coupon dispensers, in-store signage to interactive demos, brands will spend billions of dollars promoting their products throughout the Q4 selling season.
And for good reason. In-store marketing can make all the difference with purchase-minded shoppers.
The problem is, all-too-often point-of-purchase marketing is not properly executed inside stores.Consider product displays for example, which could be failing to convert shoppers for any one of a number of reasons:
When Field Agent surveyed 523 parents about their toy-shopping behaviour, 8-of-10 reported visually striking signage (i.e., featuring characters, movies, etc. associated with a toy) to be at least moderately influential over their purchase decisions.
Pitfall #4Your in-store marketing isn’t being properly executed
TO Q4 RETAIL EXECUTION THE BRAND MANAGER’S GUIDE
TO Q4 RETAIL EXECUTION THE BRAND MANAGER’S GUIDE
5
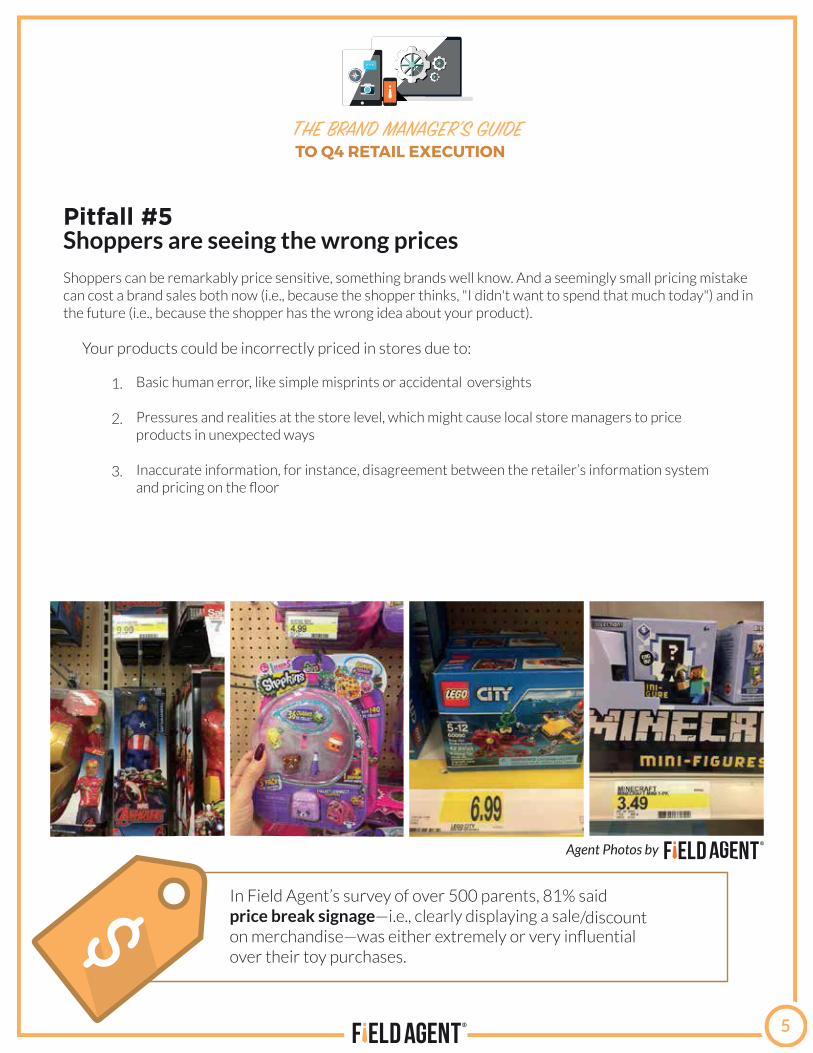
Pitfall #5Shoppers are seeing the wrong prices
In Field Agent’s survey of over 500 parents, 81% said price break signage—i.e., clearly displaying a sale/discount on merchandise—was either extremely or very influential over their toy purchases.
Shoppers can be remarkably price sensitive, something brands well know. And a seemingly small pricing mistake can cost a brand sales both now (i.e., because the shopper thinks, "I didn't want to spend that much today") and in the future (i.e., because the shopper has the wrong idea about your product).
Your products could be incorrectly priced in stores due to:
Agent Photos by
1.
2.
3.
Basic human error, like simple misprints or accidental oversights
Pressures and realities at the store level, which might cause local store managers to price products in unexpected ways
Inaccurate information, for instance, disagreement between the retailer’s information system and pricing on the floor
TO Q4 RETAIL EXECUTION THE BRAND MANAGER’S GUIDE
6
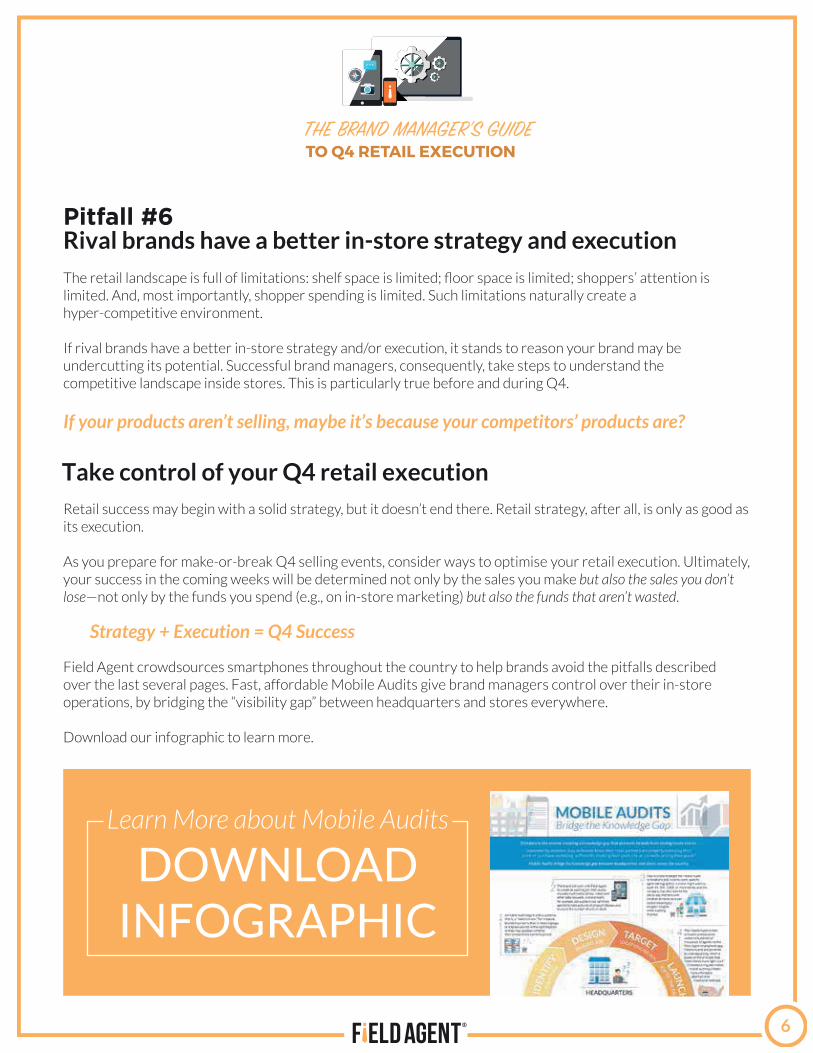
Retail success may begin with a solid strategy, but it doesn’t end there. Retail strategy, after all, is only as good as its execution.
As you prepare for make-or-break Q4 selling events, consider ways to optimise your retail execution. Ultimately, your success in the coming weeks will be determined not only by the sales you make but also the sales you don’t lose—not only by the funds you spend (e.g., on in-store marketing) but also the funds that aren’t wasted.
Field Agent crowdsources smartphones throughout the country to help brands avoid the pitfalls describedover the last several pages. Fast, affordable Mobile Audits give brand managers control over their in-store operations, by bridging the “visibility gap” between headquarters and stores everywhere.
Download our infographic to learn more.
Pitfall #6Rival brands have a better in-store strategy and execution
The retail landscape is full of limitations: shelf space is limited; floor space is limited; shoppers’ attention is limited. And, most importantly, shopper spending is limited. Such limitations naturally create a hyper-competitive environment.
If rival brands have a better in-store strategy and/or execution, it stands to reason your brand may beundercutting its potential. Successful brand managers, consequently, take steps to understand thecompetitive landscape inside stores. This is particularly true before and during Q4.
If your products aren’t selling, maybe it’s because your competitors’ products are?
DOWNLOADINFOGRAPHIC
Learn More about Mobile Audits
Strategy + Execution = Q4 Success
Take control of your Q4 retail execution
shoppers spend billions of dollars on gifts. Because the fate of so many com-panies rest on shoppers and their gift-buying decisions, this section is
devoted to questions like:
This section also examines shoppers’ attitudes and behaviours toward
So turn the page to begin discovering timely gift-buying insights.Think of it as Field Agent’s gift to you.
GIFTS GALORE
What gifts are men and women, boys and girls hoping for this year?How much do Christmas shoppers expect to spend on their spouses and kids?
What, ultimately, do Christmas shoppers expect to buy?
Christmas
DOWNLOAD FIELD AGENT’S REPORT:
“ALL THINGS TOYS”
DOWNLOAD NOWTO EXPLORE KIDS’ 2016 GIFT WISHES
GIFTSU.S.
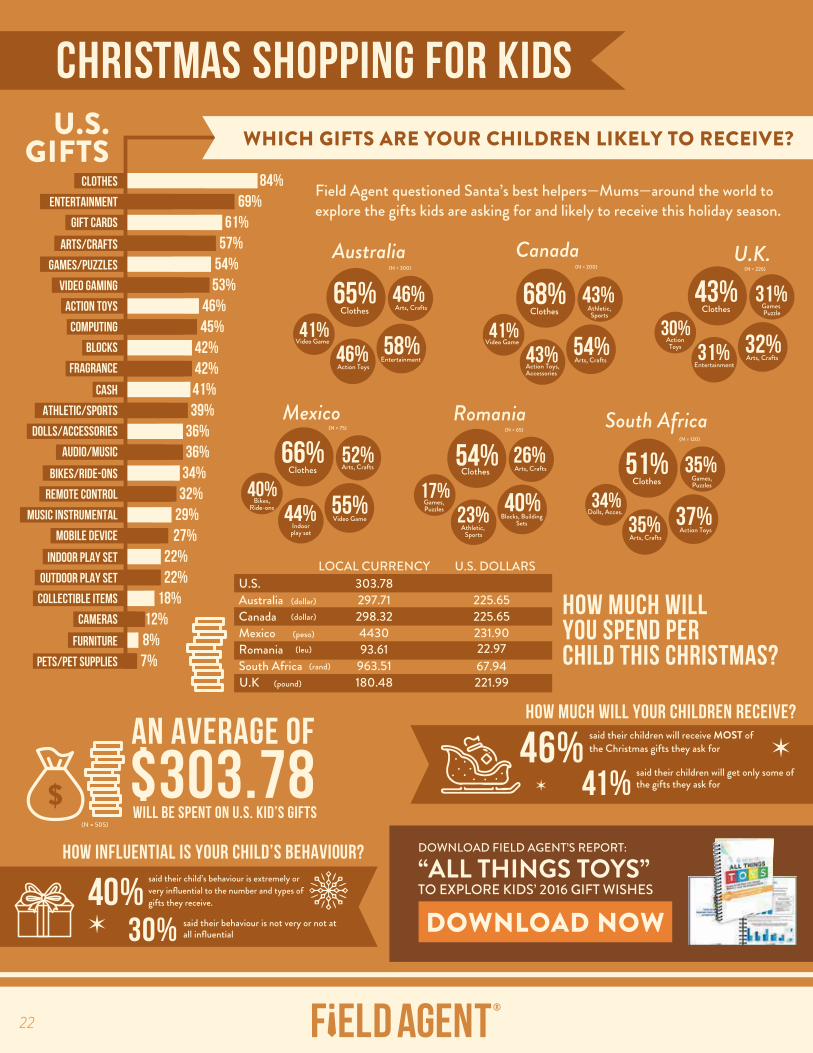
Field Agent questioned Santa’s best helpers—Mums—around the world to explore the gifts kids are asking for and likely to receive this holiday season.
chrIstmas SHOPPING FOR KIDS
CLOTHES
ENTERTAINMENT
GIFT CARDS
ARTS/CRAFTS
GAMES/PUZZLES
VIDEO GAMING
ACTION TOYS
COMPUTING
BLOCKS
FRAGRANCE
CASH
ATHLETIC/SPORTS
DOLLS/ACCESSORIES
AUDIO/MUSIC
BIKES/RIDE-ONS
REMOTE CONTROL
MUSIC INSTRUMENTAL
MOBILE DEVICE
INDOOR PLAY SET
OUTDOOR PLAY SET
COLLECTIBLE ITEMS
CAMERAS
FURNITURE
PETS/PET SUPPLIES
84%69%
61%57%
54%53%
46%45%
42%42%41%39%
36%36%
34%32%
29%27%
22%22%
18%12%8%7%
WHICH GIFTS ARE YOUR CHILDREN LIKELY TO RECEIVE?
said their children will get only some of the gifts they ask for41%
46%$ $303.78
AN AVERAGE OF
WILL BE SPENT ON U.S. KID’S GIFTS(N = 505)
HOW MUCH WILL YOUR CHILDREN RECEIVE?
HOW INFLUENTIAL IS YOUR CHILD’S BEHAVIOUR?said their child’s behaviour is extremely or very influential to the number and types of gifts they receive.40%
30% said their behaviour is not very or not at all influential
(N = 300)
Australia
65%
58%
46%
46%41%
Clothes Arts, Crafts
Video Game
Action ToysEntertainment
(N = 200)
Canada
68%
54%
43%
43%41%
Clothes Athletic,Sports
Video Game
Action Toys,Accessories
Arts, Crafts
(N = 120)
South Africa
51%
37%
35%
35%34%
Clothes Games,Puzzles
Dolls, Acces.
Arts, CraftsAction Toys
(N = 65)
Romania
54%
40%
26%
23%17%
Clothes Arts, Crafts
Games,Puzzles
Athletic, Sports
Blocks, BuildingSets
(N = 75)
Mexico
66%
55%
52%
44%40%
Clothes Arts, Crafts
Bikes,Ride-ons
Indoorplay set
Video Game
(N = 226)
U.K.
43%
32%
31%
31%30%
Clothes Games Puzzle
ActionToys
EntertainmentArts, Crafts
U.S.U.S. DOLLARSLOCAL CURRENCY
303.78297.71 225.65298.32 225.654430 231.9093.61
963.51180.48 221.99
67.9422.97
Australia (dollar)
(dollar)
(peso)(leu)
(rand)
(pound)
CanadaMexicoRomaniaSouth AfricaU.K
HOW MUCH WILLYOU SPEND PERCHILD THIS CHRISTMAS?
22
said their children will receive MOST of the Christmas gifts they ask for
U.S.U.S. DOLLARSLOCAL CURRENCY
286.35254.37 192.39331.12 250.463637 194.80
191.561615.28178.38 219.41
113.8947
Australia (dollar)
(dollar)
(peso)(leu)
(rand)
(pound)
CanadaMexicoRomaniaSouth AfricaU.K
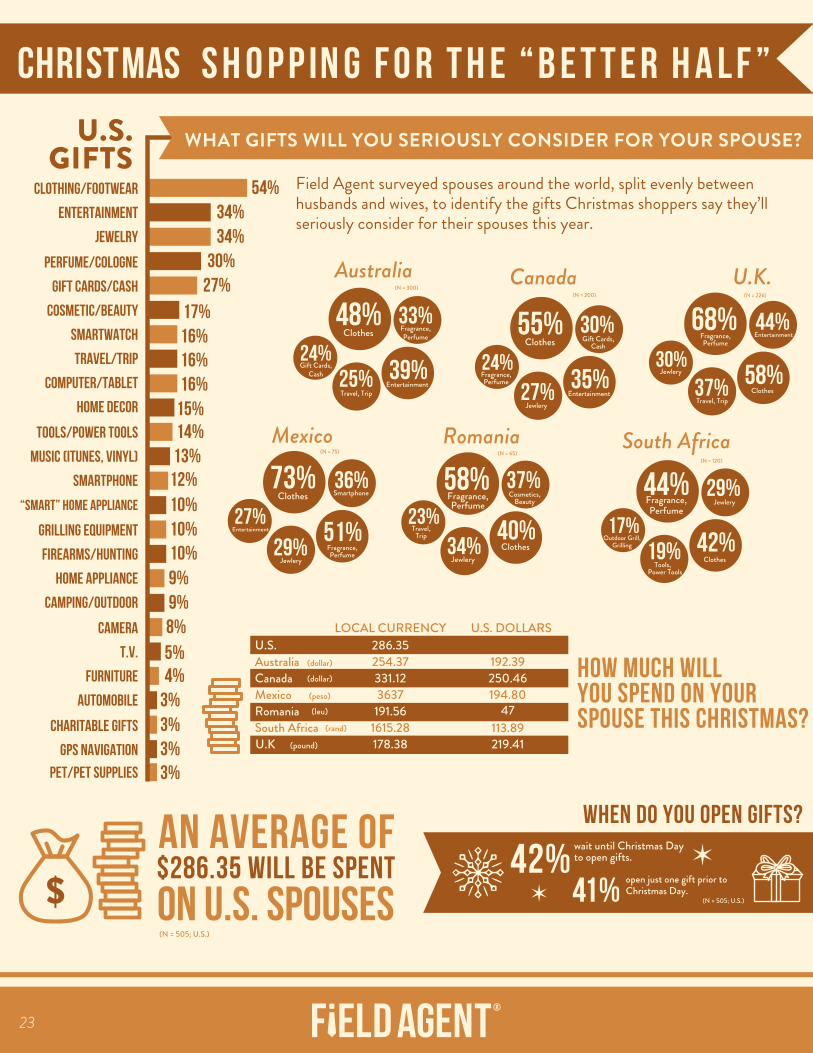
HOW MUCH WILLYOU SPEND ON YOURSPOUSE THIS CHRISTMAS?
CLOTHING/FOOTWEAR
ENTERTAINMENT
JEWELRY
PERFUME/COLOGNE
GIFT CARDS/CASH
COSMETIC/BEAUTY
SMARTWATCH
TRAVEL/TRIP
COMPUTER/TABLET
HOME DECOR
TOOLS/POWER TOOLS
MUSIC (ITUNES, VINYL)
SMARTPHONE
“SMART” HOME APPLIANCE
GRILLING EQUIPMENT
FIREARMS/HUNTING
HOME APPLIANCE
CAMPING/OUTDOOR
CAMERA
T.V.
FURNITURE
AUTOMOBILE
CHARITABLE GIFTS
GPS NAVIGATION
PET/PET SUPPLIES
54%34%34%
30%27%
17%16%16%16%
15%14%13%
12%10%10%10%9%9%8%5%4%
3%3%3%3%
Field Agent surveyed spouses around the world, split evenly between husbands and wives, to identify the gifts Christmas shoppers say they’ll seriously consider for their spouses this year.
WHAT GIFTS WILL YOU SERIOUSLY CONSIDER FOR YOUR SPOUSE?
CHRISTM AS S H O P P IN G F O R T H E “ B E T T E R H A L F ”
GIFTSU.S.
wait until Christmas Dayto open gifts.
open just one gift prior toChristmas Day.
42%41% (N = 505; U.S.)
WHEN DO YOU OPEN GIFTS?
$ $286.35 WILL BE SPENTAN AVERAGE OF
ON U.S. SPOUSES (N = 505; U.S.)
(N = 75)
(N = 300)
Australia
48%
39%
33%
25%24%
Clothes Fragrance,Perfume
Gift Cards,Cash
Travel, TripEntertainment
(N = 200)
Canada
55%
35%
30%
27%24%
Clothes Gift Cards,Cash
Fragrance,Perfume
JewleryEntertainment
(N = 120)
South Africa
44%
42%
29%
19%17%
Fragrance,Perfume
Jewlery
Outdoor Grill,Grilling
Tools,Power Tools
Clothes
(N = 65)
Romania
58%
40%
37%
34%23%
Fragrance,Perfume
Cosmetics,Beauty
Travel,Trip
JewleryClothes
Mexico
73%
51%
36%
29%27%
Clothes Smartphone
Entertainment
Jewlery
Fragrance,Perfume
(N = 226)
U.K.
68%
58%
44%
37%30%
Fragrance,Perfume
Entertainment
Jewlery
Travel, TripClothes
23
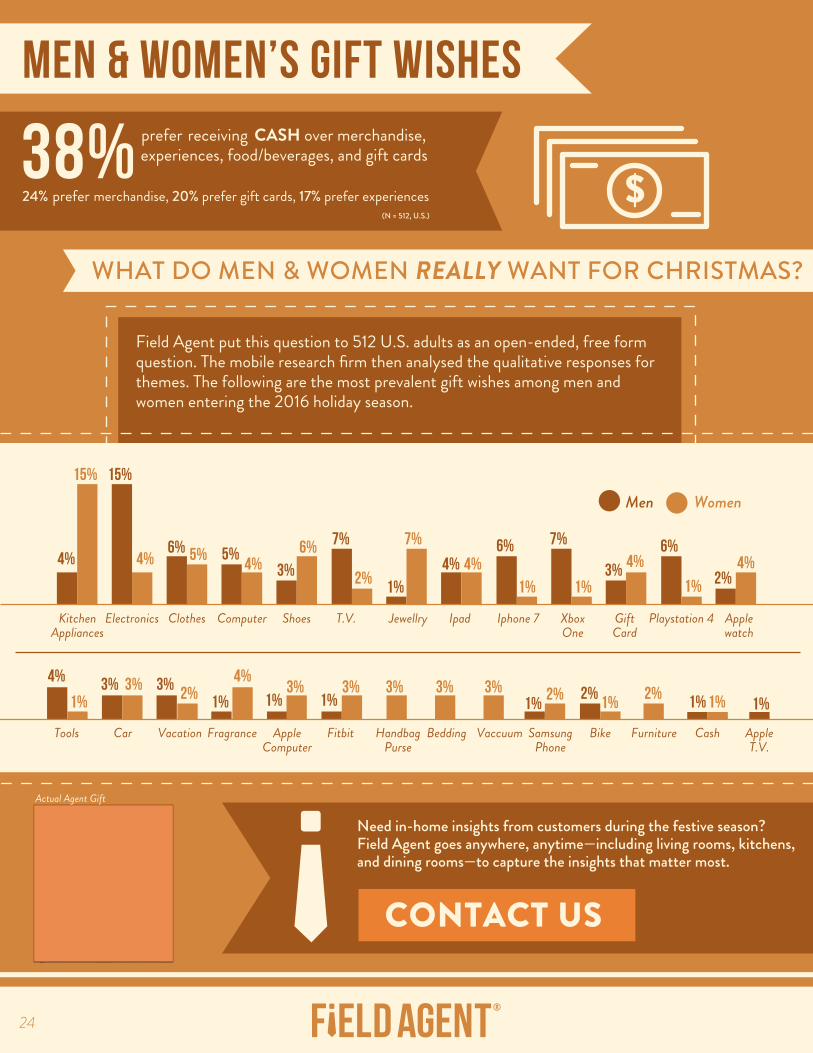
WHAT DO MEN & WOMEN REALLY WANT FOR CHRISTMAS?
24% 20% prefer gift cards, 17% prefer experiences
CASH over merchandise, prefer
prefer
experiences, food/beverages, and gift cards
Field Agent put this question to 512 U.S. adults as an open-ended, free form question. The mobile research firm then analysed the qualitative responses for themes. The following are the most prevalent gift wishes among men and women entering the 2016 holiday season.
Need in-home insights from customers during the festive season? Field Agent goes anywhere, anytime—including living rooms, kitchens, and dining rooms—to capture the insights that matter most.
CONTACT US
MEN & WOMEN’S GIFT WISHES
Men Women
KitchenAppliances
Electronics Clothes Computer Shoes T.V. Jewellry Ipad Iphone 7 XboxOne
GiftCard
Playstation 4 Applewatch
Tools Car Vacation Fragrance AppleComputer
Fitbit HandbagPurse
Bedding Vaccuum SamsungPhone
Bike Furniture Cash AppleT.V.
4%
1% 1% 1%3% 3% 3% 2% 1%
4%
1% 1% 1%2% 2% 1% 1%
3% 3% 3% 3% 3% 2%
4%
15% 15%
4%6% 5% 5%
4% 3%6% 7%
2% 1%
7% 7%
4% 4%6%
1% 1%3% 4%
6%
1% 2%4%
(N = 512, U.S.)
38% $
Actual Agent Gift
24
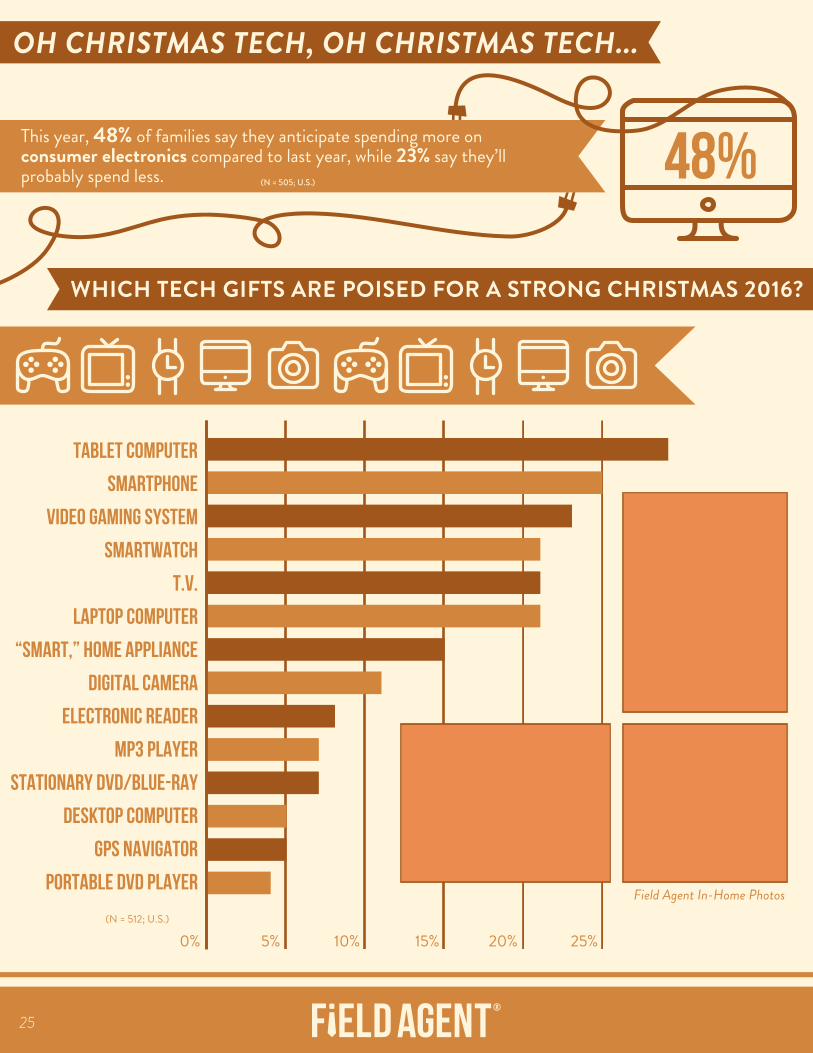
OH CHRISTMAS TECH, OH CHRISTMAS TECH...
WHICH TECH GIFTS ARE POISED FOR A STRONG CHRISTMAS 2016?
This year, 48% of families say they anticipate spending more onconsumer electronics compared to last year, while 23% say they’ll probably spend less. 48%
TABLET COMPUTER
SMARTPHONE
VIDEO GAMING SYSTEM
SMARTWATCH
T.V.
LAPTOP COMPUTER
“SMART,” HOME APPLIANCE
DIGITAL CAMERA
ELECTRONIC READER
MP3 PLAYER
STATIONARY DVD/BLUE-RAY
DESKTOP COMPUTER
GPS NAVIGATOR
PORTABLE DVD PLAYER
5% 10% 15% 20% 25%0%
Field Agent In-Home Photos(N = 512; U.S.)
(N = 505; U.S.)
25
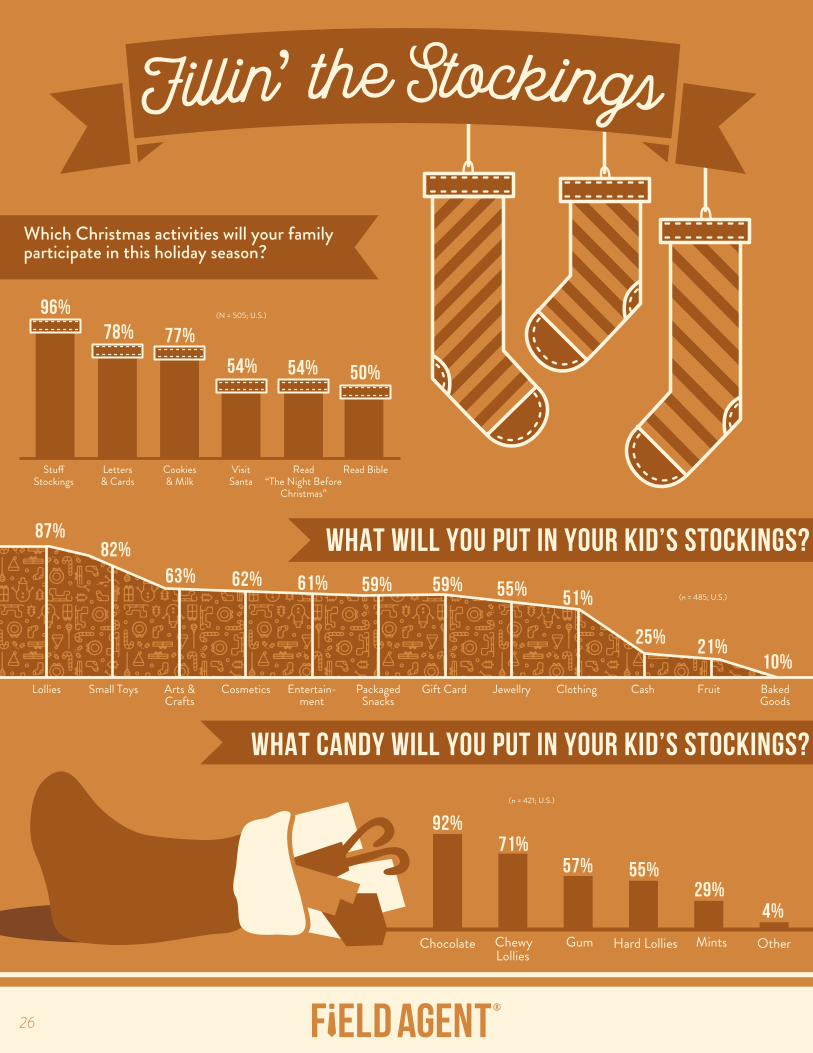
WHAT CANDY WILL YOU PUT IN YOUR KID’S STOCKINGS?
Lollies Small Toys Arts &Crafts
Cosmetics Entertain-ment
PackagedSnacks
Gift Card Jewellry Clothing Cash Fruit BakedGoods
87%82%
63% 62% 61% 59% 59% 55% 51%
25% 21%10%
WHAT WILL YOU PUT IN YOUR KID’S STOCKINGS?
Which Christmas activities will your family participate in this holiday season?
StockingsLetters& Cards
Cookies& Milk
VisitSanta
Read“The Night Before
Christmas”
Read Bible
96%78% 77%
54% 54% 50%
(N = 505; U.S.)
(n = 485; U.S.)
Chocolate ChewyLollies
Gum Hard Lollies Mints Other
92%71%
57% 55%29%
4%
(n = 421; U.S.)
26
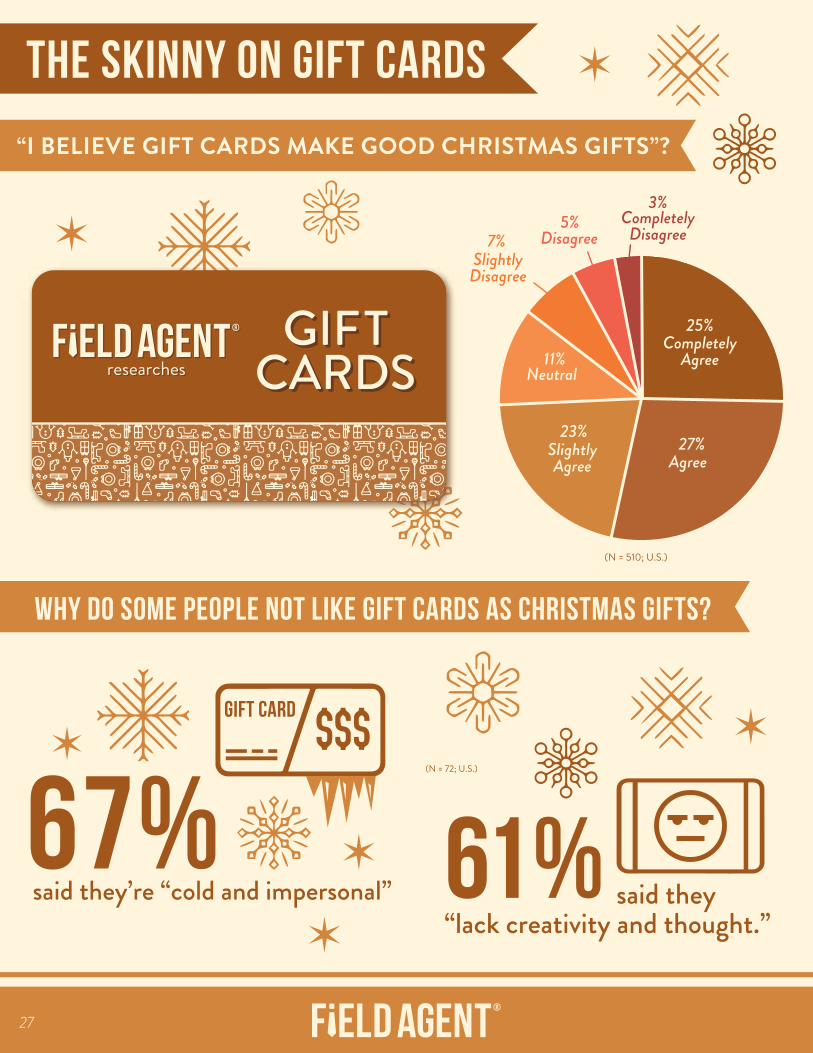
“I BELIEVE GIFT CARDS MAKE GOOD CHRISTMAS GIFTS”?
THE SKINNY ON GIFT CARDS
researchesresearchesGIFT
CARDSGIFT
CARDSCompletely
Agree
25%
27%23%
11%
7%5%
3%
AgreeSlightlyAgree
Neutral
SlightlyDisagree
DisagreeCompletely
Disagree
GIFT CARD
67%said they’re “cold and impersonal” 61% said they
“lack creativity and thought.”
(N = 510; U.S.)
(N = 72; U.S.)
WHY DO SOME PEOPLE NOT LIKE GIFT CARDS AS CHRISTMAS GIFTS?
27
roast turkey, candy canes, sugar cookies, gingerbread, egg nog, and—meh—fruitcake.
anticipate, year after year, the millions of shoppers who converge on stores to fill up their baskets with a wide range of festive fare.
The final section of this report delves into the subject of holiday foods and beverages: What do families serve on Christmas? When do they partake?
What roles do alcohol and takeout play in f es t ive feas t i n g ?
Last but not least, the section concludes with a collection of miscellaneous insights into
O F C H R I S T M A SFOOD BEVERAGES
Christmas shoppers, including battery purchases, gifts for pets,and even movie-watching behaviour.
The festive season excites the taste buds. It’s a season of honey ham, BBQ prawns,
This season also excites grocers and food-and-beverage brands as they
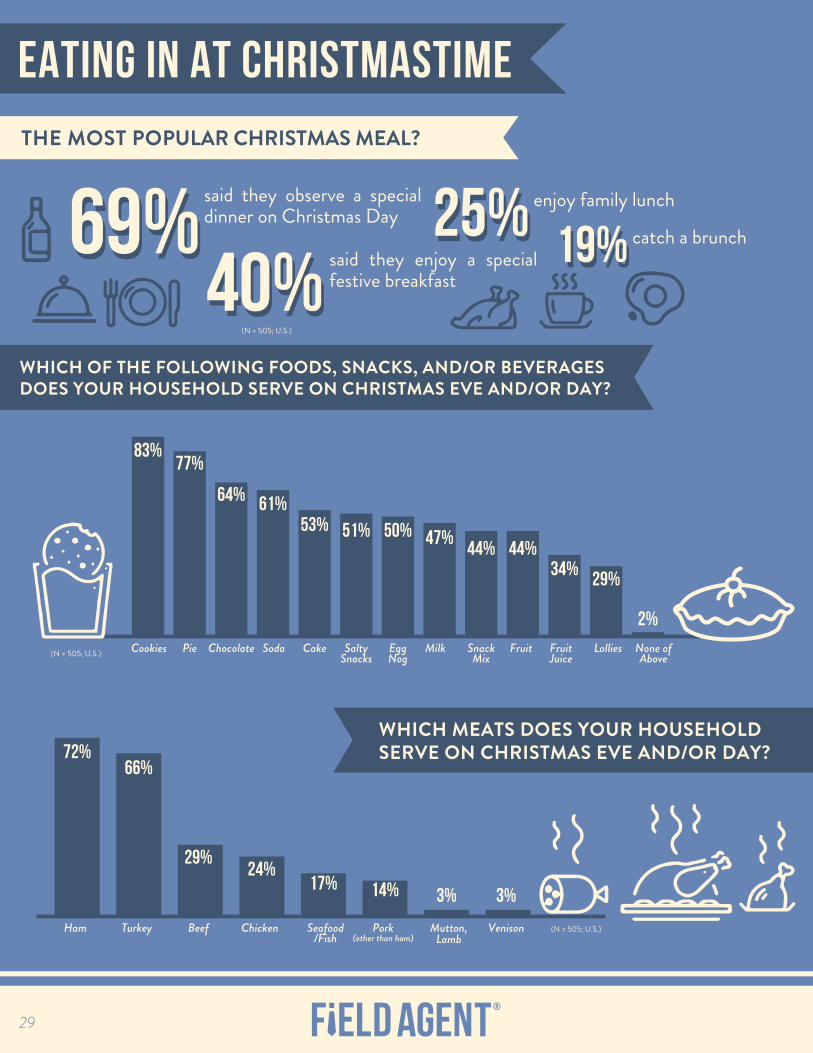
THE MOST POPULAR CHRISTMAS MEAL?
WHICH OF THE FOLLOWING FOODS, SNACKS, AND/OR BEVERAGESDOES YOUR HOUSEHOLD SERVE ON CHRISTMAS EVE AND/OR DAY?
WHICH MEATS DOES YOUR HOUSEHOLDSERVE ON CHRISTMAS EVE AND/OR DAY?
EATING IN AT CHRISTMASTIME
(N = 505; U.S.)
(N = 505; U.S.)
(N = 505; U.S.)
Cookies Pie Chocolate Soda Cake SaltySnacks
EggNog
Milk SnackMix
Fruit FruitJuice
Lollies None ofAbove
83%77%
64% 61%53% 51% 50% 47%
44% 44%34% 29%
2%
Ham Turkey Beef Chicken Seafood/Fish
Pork(other than ham)
Mutton,Lamb
Venison
72%66%
29%24%
17% 14% 3% 3%
69%40%
25% 19%69%40%
25% 19%said they observe a special dinner on Christmas Day
said they enjoy a special festive breakfast
enjoy family lunch
catch a brunch
29
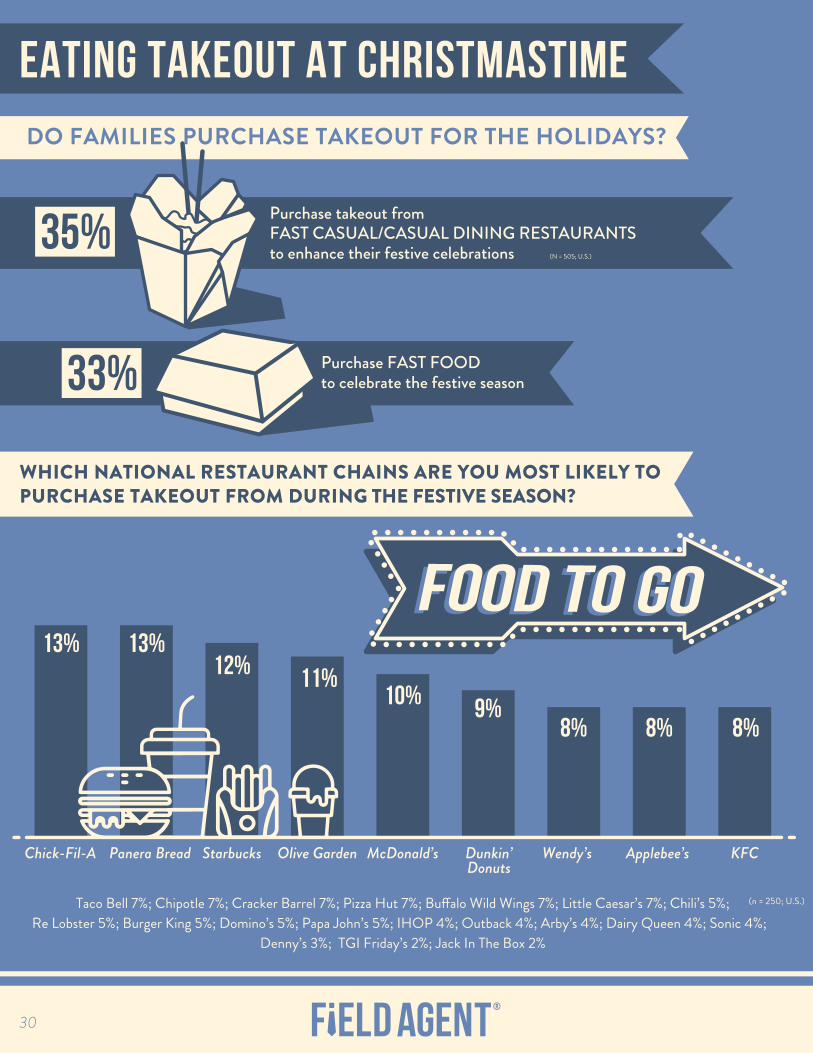
DO FAMILIES PURCHASE TAKEOUT FOR THE HOLIDAYS?
WHICH NATIONAL RESTAURANT CHAINS ARE YOU MOST LIKELY TOPURCHASE TAKEOUT FROM DURING THE FESTIVE SEASON?
(N = 505; U.S.)
Re Lobster 5%; Burger King 5%; Domino’s 5%; Papa John’s 5%; IHOP 4%; Outback 4%; Arby’s 4%; Dairy Queen 4%; Sonic 4%; Denny’s 3%; TGI Friday’s 2%; Jack In The Box 2%
EATING TAKEOUT AT CHRISTMASTIME
(n = 250; U.S.)
Chick-Fil-A Panera Bread Starbucks Olive Garden McDonald’s Dunkin’Donuts
Wendy’s Applebee’s KFC
10% 9%8% 8% 8%
13% 13%12% 11%
33% Purchase FAST FOODto celebrate the festive season
35%Purchase takeout fromFAST CASUAL/CASUAL DINING RESTAURANTSto enhance their festive celebrations
30
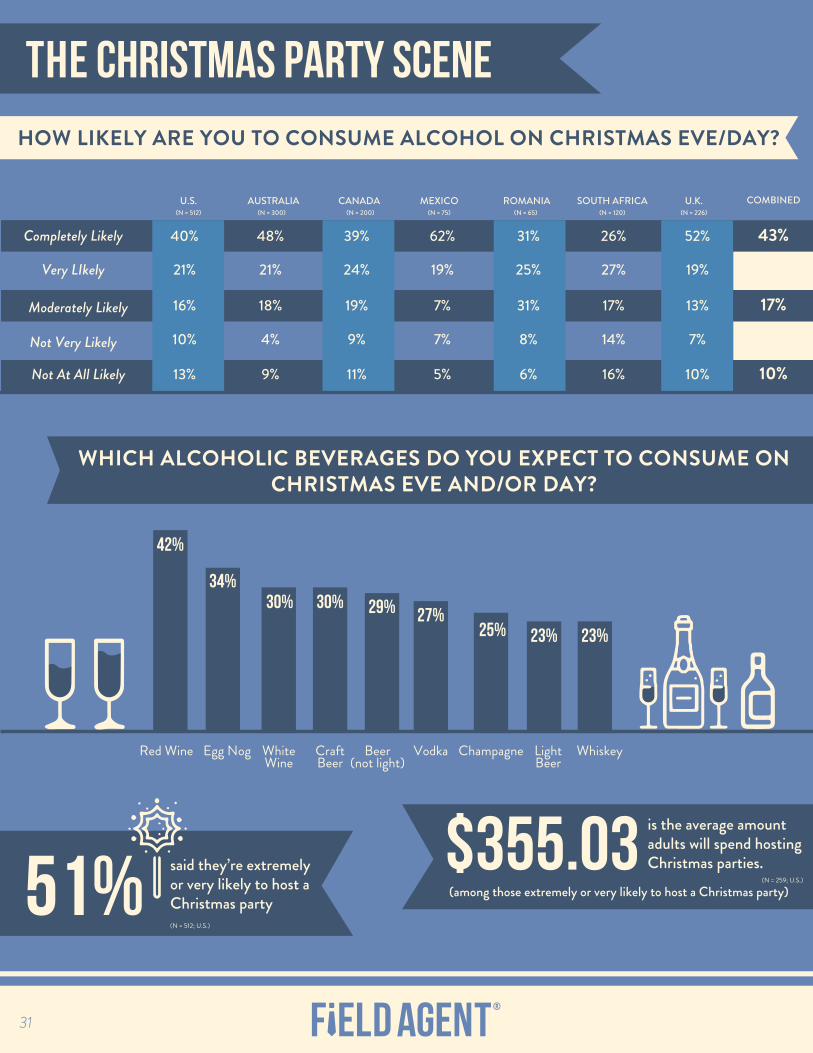
HOW LIKELY ARE YOU TO CONSUME ALCOHOL ON CHRISTMAS EVE/DAY?
WHICH ALCOHOLIC BEVERAGES DO YOU EXPECT TO CONSUME ONCHRISTMAS EVE AND/OR DAY?
THE CHRISTMAS PARTY SCENE
42%
34%30% 30% 29% 27%
25% 23% 23%
Red Wine Egg Nog WhiteWine
CraftBeer
Beer(not light)
Vodka Champagne LightBeer
Whiskey
$355.03 is the average amountadults will spend hostingChristmas parties.
(among those extremely or very likely to host a Christmas party)(N = 259; U.S.)51% said they’re extremely
or very likely to host aChristmas party(N = 512; U.S.)
AUSTRALIA CANADA ROMANIA SOUTH AFRICA U.K.MEXICOU.S.
Completely Likely
Moderately Likely
Not At All Likely
Very LIkely
Not Very Likely
40%
21%
16%
10%
13% 9% 11% 5% 6% 16% 10%
4% 9% 7% 8% 14% 7%
18% 19% 7% 31% 17% 13%
21% 24% 19% 25% 27% 19%
48% 39% 62% 31% 26% 52% 43%
COMBINED
10%
17%
22%
8%
31
(N = 505; U.S.)
(N = 505; U.S.)
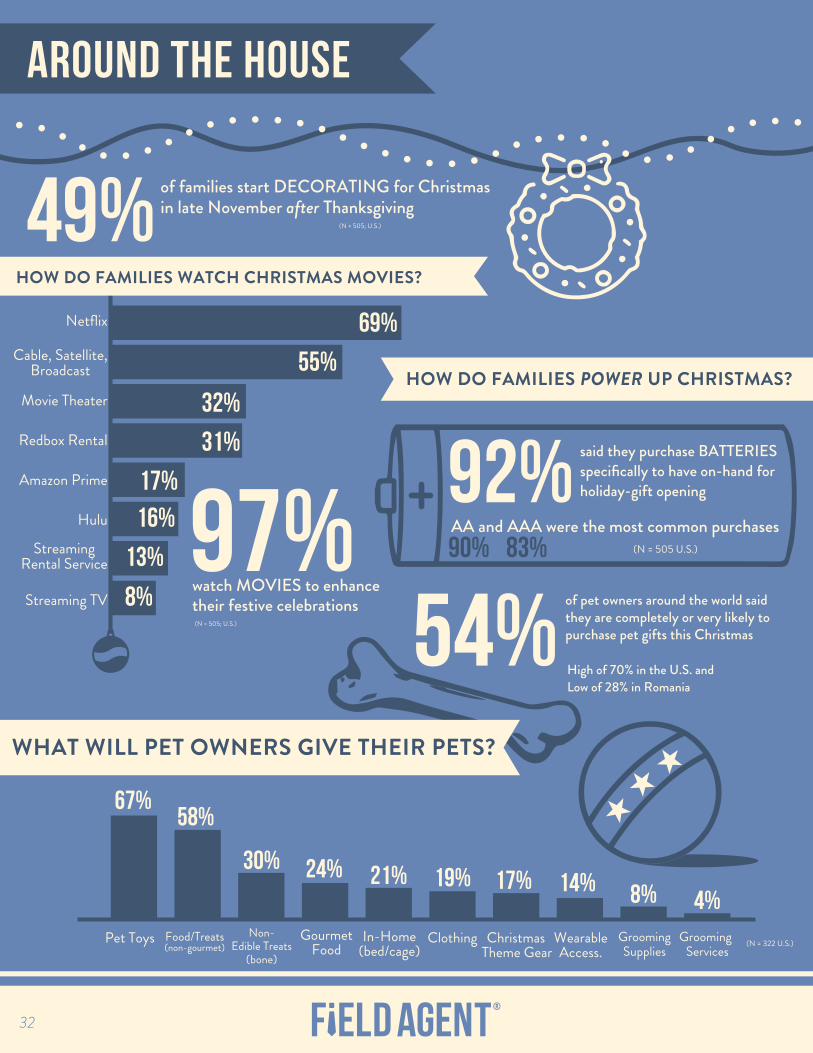
AROUND THE HOUSE
49% of families start DECORATING for Christmasin late November after Thanksgiving
97%watch MOVIES to enhancetheir festive celebrations
Netflix
Cable, Satellite,Broadcast
Movie Theater
Redbox Rental
Amazon Prime
Hulu
StreamingRental Service
Streaming TV
69%
55%
32%
31%
17%
16%
13%
8%
HOW DO FAMILIES POWER UP CHRISTMAS?
(N = 505 U.S.)
92%83%90%
AA and AAA were the most common purchases
said they purchase BATTERIESspecifically to have on-hand forholiday-gift opening
of pet owners around the world saidthey are completely or very likely topurchase pet gifts this Christmas
High of 70% in the U.S. andLow of 28% in Romania
54%
(N = 322 U.S.)
67%58%
30% 24% 21% 19% 17% 14% 8% 4%Pet Toys Food/Treats
(non-gourmet)Non-
Edible Treats(bone)
GourmetFood
In-Home(bed/cage)
Clothing ChristmasTheme Gear
WearableAccess.
GroomingSupplies
GroomingServices
WHAT WILL PET OWNERS GIVE THEIR PETS?
HOW DO FAMILIES WATCH CHRISTMAS MOVIES?
32
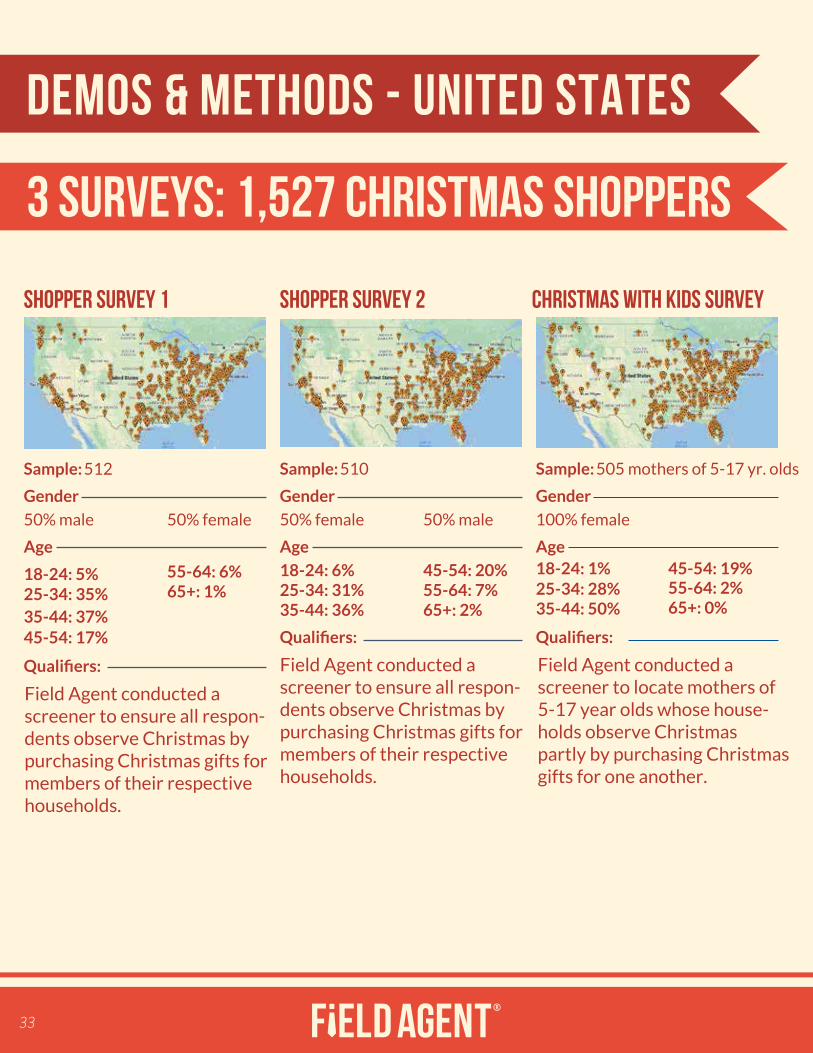
DEMOS & METHODS - UNITED STATES
Age
SHOPPER SURVEY 1 SHOPPER SURVEY 2 CHRISTMAS WITH KIDS SURVEY
Sample: 512
Gender
50% male 50% female
25-34: 35%18-24: 5%
55-64: 6%
35-44: 37%
65+: 1%
45-54: 17%
Qualifiers:
Sample: 510
Gender
50% female 50% male
Age
18-24: 6% 45-54: 20%25-34: 31% 55-64: 7%35-44: 36% 65+: 2%
Qualifiers:
Sample: 505 mothers of 5-17 yr. olds
Gender
100% female
Age
25-34: 28%18-24: 1%
55-64: 2%35-44: 50%
65+: 0%
45-54: 19%
Qualifiers:
Field Agent conducted a screener to ensure all respon-dents observe Christmas by purchasing Christmas gifts for members of their respective households.
Field Agent conducted a screener to ensure all respon-dents observe Christmas by purchasing Christmas gifts for members of their respective households.
Field Agent conducted a screener to locate mothers of 5-17 year olds whose house-holds observe Christmas partly by purchasing Christmasgifts for one another.
33
3 surveys: 1,527 christmas shoppers
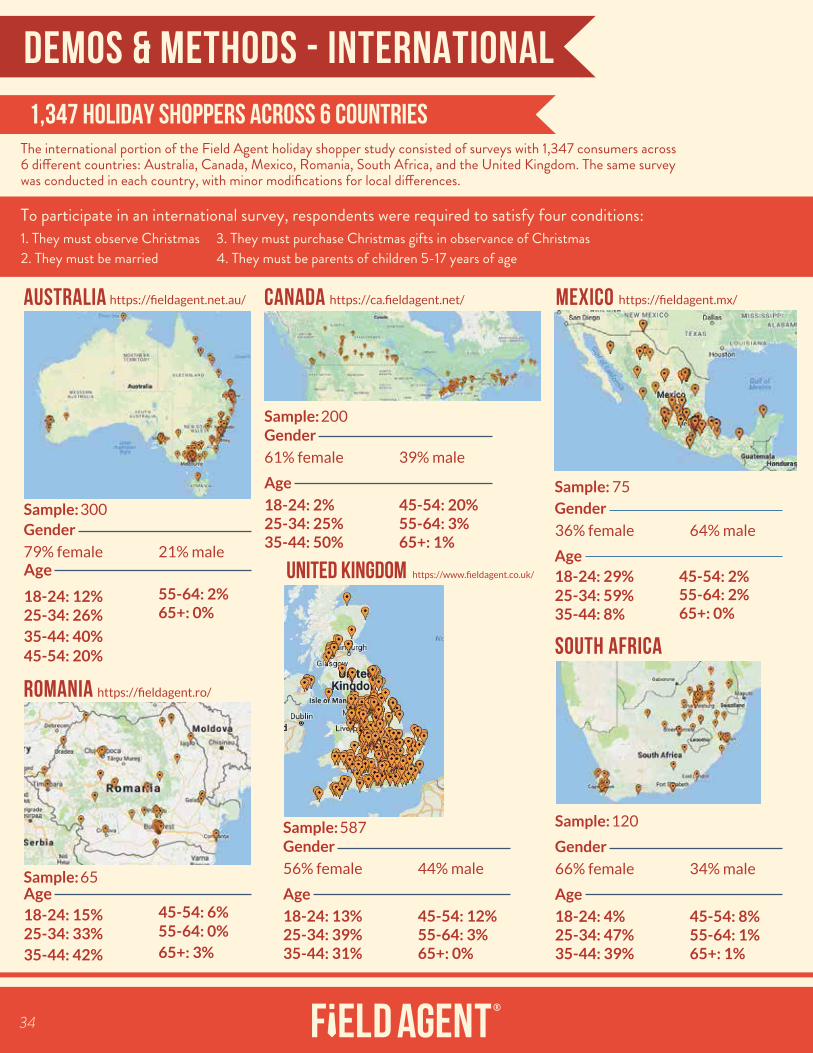
DEMOS & METHODS - INTERNATIONAL1,347 HOLIDAY SHOPPERS across 6 countries
Age
AUSTRALIA
Sample: 300Gender
79% female
https://fieldagent.net.au/
https://fieldagent.ro/
https://www.fieldagent.co.uk/
https://ca.fieldagent.net/ https://fieldagent.mx/
21% male
25-34: 26%18-24: 12%
55-64: 2%
35-44: 40%
65+: 0%
45-54: 20%
Age
ROMANIA
Sample: 65
25-34: 33%18-24: 15%
55-64: 0%
35-44: 42% 65+: 3%
45-54: 6%
Canada
Sample: 200Gender
61% female 39% male
Age
18-24: 2% 45-54: 20%25-34: 25% 55-64: 3%35-44: 50% 65+: 1%
SOUTH AFRICA
Sample: 120
Gender
66% female 34% male
Age
18-24: 4% 45-54: 8%25-34: 47% 55-64: 1%35-44: 39% 65+: 1%
MEXICO
Sample: 75
Gender
Age
25-34: 59%18-24: 29%
55-64: 2%35-44: 8%
65+: 0%
45-54: 2%
36% female 64% male
The international portion of the Field Agent holiday shopper study consisted of surveys with 1,347 consumers across
To participate in an international survey, respondents were required to satisfy four conditions:1. They must observe Christmas 3. They must purchase Christmas gifts in observance of Christmas2. They must be married 4. They must be parents of children 5-17 years of age
United kingdom
Sample: 587Gender
56% female 44% male
Age
18-24: 13% 45-54: 12%25-34: 39% 55-64: 3%35-44: 31% 65+: 0%
34

For companies, the holidays are truly a make-or-break moment. It’s not the time to take chances on in-store execution or to make best guesses
about shopper behaviour. It’s a time for first-hand, eye-on certainty.
Mobile Audits and Research from Field Agent crowdsource hundreds of thousands of smartphones around the world to capture in-store informa-
tion about displays, out of stocks, prices, shelf placement, and competitors, and to capture in-the-moment insights directly from
far-reaching Mobile Audits and Research
W H A T ’ S I N - S T O R E
THIS FESTIVE SEASON?
LEARN MORE SUBSCRIBE
www.fieldagent.net.au | blog.fieldagent.net.au | [email protected]
Christmas shoppers.
BASED ON INSIGHTS FROMSHOPPERS AROUND THE WORLD
BASED ON INSIGHTS FROMSHOPPERS AROUND THE WORLD