Embed Size (px)
Citation preview
BASE
ELINE HU
GUNN
PrU.S. Env
UMAN HSTANDA
NISON CO
ADD
Novem
repared for, avironmental
1595 WDenver,
PrS
999 18th Denver,
FINAL
EALTH RARD MINEOUNTY, C
DENDUM
mber 24, 20
and with oveProtection A
Wynkoop StrColorado 80
repared by: SRC, Inc. Street, SuiteColorado 80
RISK ASSE SITE COLORAD
M
009
ersight by: Agency Regireet 0202
e 1975 0202
SESSMEN
DO
ion 8
NT
FINAL
ES-ii
TABLE OF CONTENTS EXECUTIVE SUMMARY…………………………………………………………...………ES-1 1.0 INTRODUCTION .............................................................................................................. 1
1.1 Purpose ............................................................................................................................ 1 1.2 Organization .................................................................................................................... 1
2.0 SITE CHARACTERIZATION ........................................................................................... 2 2.1 Site Location and Description ......................................................................................... 2 2.2 Response Actions ............................................................................................................ 2
3.0 SUMMARY OF PREVIOUS RISK FINDINGS ............................................................... 3 4.0 DATA SUMMARY ............................................................................................................ 4 5.0 EVALUATING HUMAN EXPOSURE AND RISK FOR CHILD ATV RIDERS .......... 5
5.1 Quantification of Exposure ............................................................................................. 5 5.1.1 Basic Equations ........................................................................................................... 5 5.1.1.1 Ingestion Exposures ................................................................................................ 5 5.1.1.2 Inhalation Exposures ............................................................................................... 6 5.1.2 Human Exposure Parameters ...................................................................................... 7 5.1.3 Exposure Point Concentration .................................................................................... 8 5.1.4 Relative Bioavailability .............................................................................................. 9
5.2 Toxicity Assessment ....................................................................................................... 9 5.2.1 Overview ..................................................................................................................... 9 5.2.2 Human Toxicity Values ............................................................................................ 11
5.3 Risk Characterization .................................................................................................... 11 5.3.1 Basic Approach ......................................................................................................... 11 5.3.2 Risks to Child ATV Riders at On-Site Locations ..................................................... 13
6.0 UNCERTAINTY ASSESSMENT.................................................................................... 14 6.1.1 Uncertainties in Exposure Assessment ..................................................................... 14 6.1.2 Uncertainties in Toxicity Values .............................................................................. 15 6.1.3 Uncertainties in Risk Estimates ................................................................................ 16
7.0 REFERENCES ................................................................................................................. 17
FINAL
ES-iii
APPENDICES Appendix A Analytical Data Appendix B Community Interview Summary Appendix C Detailed ProUCL Output Appendix D Derivation of Particulate Emission Factor for ATV Riding
LIST OF TABLES
Table 4-1 Summary Statistics for Surface Soil Samples (mg/kg dry weight) Table 5-1 Exposure Parameters Child ATV Riders at the Mine Site Table 5-2 Summary of ProUCL Results Table 5-3 Non-Cancer and Cancer Toxicity Values for Human Health Table 5-4 Detailed Risk Calculation Tables for Child ATV Riders at the Mine Site Table 5-5 Summary of Risks to Child ATV Riders
LIST OF FIGURES Figure 2-1 Site Location Map Figure 4-1 Surface Soil Sample Locations (2006 and 2009) Figure 4-2 Soil Concentrations for Samples Collected in 2006 and 2009
FINAL
ES-iv
LIST OF ACRONYMS AND ABBREVIATIONS AFs Absorption fraction AT Averaging Time ATV All Terrain Vehicle ATSDR Agency for Toxic Substances and Disease Registry BHHRA Baseline Human Heath Risk Assessment BW Body Weight COPC Chemical of Potential Concern CTE Central Tendency Exposure DI Daily Intake DIL Daily Intake averaged over a lifetime EC Exposure Concentration ED Exposure Duration EF Exposure Frequency EPC Exposure Point Concentration HI Hazard Index HIF Human Intake Factor HQ Hazard Quotient IR Intake Rate IRIS Integrated Risk Information System LOAEL Lowest-observed-adverse-effect-level NCEA National Center for Environmental Assessment NOAEL No-observed-adverse-effect-level PEF Particulate Emission Factor PPRTVs Provisional Peer Reviewed Toxicity Values RAGS Risk Assessment Guidance for Superfund RBA Relative Bioavailability RBC Risk-Based Concentration RfC Reference Concentration RfD Reference Dose RME Reasonable Maximum Exposure SF Slope Factor TAL Target Analyte List TWF Time-Weighting Factor UCL Upper Confidence Limit UR Unit Risk USEPA United States Environmental Protection Agency WOE Weight of Evidence
FINAL
ES-1
EXECUTIVE SUMMARY
Purpose of This Document This document is an addendum to the Baseline Human Health Risk Assessment (BHHRA) for the Standard Mine site in Gunnison County, Colorado (USEPA 2008). The purpose of this document is to assess the potential risks to humans from site-related contaminants present in environmental media at the site following a number of response actions that have been performed by EPA, assuming that no additional steps are taken to remediate the environment or to reduce human contact with contaminated environmental media. Site Location and Description The Standard Mine is located in the Coal Creek Watershed of the Gunnison National Forest in Gunnison County, Colorado, approximately 30 miles north of Gunnison and five miles west of Crested Butte. The Coal Creek Watershed has a long history of mining. Silver mining began in 1874, but ceased by 1890 except for the Forest Queen Mine. Gold, silver, zinc, and copper mining occurred sporadically between 1901 and 1974. At present, active mining in the Coal Creek watershed has ceased. Most of the area near the mine is heavily forested, and is managed by the U.S. Forest Service. The terrain is mountainous with incised stream valleys with steep slopes. Elevations range from a low of 8,900 feet at the town of Crested Butte, to a high of 13,000 feet along the western edge of the mining district. Standard Mine is drained by Elk Creek, which is the primary surface water drainage from the southeastern half of the mining district. Elk Creek flows primarily south, where it joins Coal Creek. Coal Creek flows eastward toward Crested Butte, where it flows into the Slate River. Coal Creek serves as the drinking water source for the town of Crested Butte. The Standard Mine Site and nearby lands are currently used mainly for recreation. It is anticipated that land use will remain recreational in the future. The site is of potential human health concern to EPA because mining activities often result in the release of a variety of different metals to soil, surface water, and sediment, and excessive human exposure to mining-related contaminants can lead to adverse health effects. The following response actions have been completed at the site since the time of the BHHRA. These actions include:
• dewatering the on-site tailings pond • channelization of influent surface water to pass around on-site wastes • removal of 50,000 cubic yards of mining debris • removal of trestle • removal of ore bins
FINAL
ES-2
• passive treatment pilot scale bioreactor • installed sediment controls along Elk Creek • restoration and realignment of Elk Creek • revegetation of areas impacted by cleanup activities
Summary of BHHRA Results Prior to implementation of the response actions described above, EPA performed a BHHRA to evaluate non-cancer and cancer risks for a variety of recreational receptors along the drainages and on-site near the mine for the following chemicals of potential concern (COPCs): aluminum, arsenic, cadmium, chromium, iron, lead, and manganese. No receptors had cancer risk levels that were above EPA’s usual level of concern. For non-cancer risks, child ATV riders were the only receptors with hazard index (HI) values above level of concern (HI > 1). This was due mainly to inhalation exposure to manganese in dust particles in air, with a small additional contribution from ingested soil. Levels of lead in on-site soils were also evaluated and not found to be of concern (USEPA 2008). Updated Risk Evaluation Because the only risk to humans identified in the BHHRA was for exposure of child ATV riders at the mine site, this scenario was re-evaluated using new soil data that were collected after EPA had completed its response actions. The basic approach for estimating oral and inhalation exposure and risk was the same as used in the BHHRA, except inhalation exposures were evaluated in accordance with new guidance from EPA that employs a reference concentration (RfC) approach rather than a reference dose (RfD) approach. Non-cancer risks are evaluated by computing the HI. If the value of the HI is less than or equal to 1, then risks of non-cancer effects are not of concern. If the value of HI exceeds 1, then there may be a risk of non-cancer effects, with the probability and/or severity tending to increase as the value of the HI becomes larger. Cancer risks are expressed in terms of the probability that site-related exposures will result in the occurrence of cancer. The EPA generally considers a risk level of 1x10⁻⁴ (1 in 10,000) or less to be sufficiently low and not need a response action, although this is a judgment that may vary from site to site. Based on this approach, the updated cancer and non-cancer risk estimates for child ATV riders at this site for central tendency exposure (CTE) and reasonable maximum exposure (RME) are as follows:
Estimated Risks to On-Site Recreational Visitors
Receptor Exposure Pathways
Non-Cancer Hazard Index Excess Cancer Risk
CTE RME CTE RME
Child ATV rider Ingestion + Inhalation 0.08 0.5 9x10-08 2x10-06
As shown, for child ATV riders exposed by ingestion and inhalation of on-site soils, non-cancer risks are below a level of concern (HI < 1), and excess cancer risks are at the low end or below
FINAL
ES-3
EPA’s usual risk range (1E-04 to 1E-06) of concern. Because the child ATV rider is the maximally exposed receptor at the site, this indicates that risks to humans who visit the site for recreational purposes are not a significant health concern. Uncertainties Quantitative evaluation of the risks to humans from environmental contamination is frequently limited by uncertainty regarding a number of key data items, including concentration levels in the environment, the true level of human contact with contaminated media, and the true dose-response curves for non-cancer and cancer effects in humans. This uncertainty is usually addressed by making assumptions or estimates for uncertain parameters based on whatever limited data are available. Because of these assumptions and estimates, the results of risk calculations are themselves uncertain, and it is important for risk managers and the public to keep this in mind when interpreting the results of a risk assessment.
FINAL
1
1.0 INTRODUCTION 1.1 Purpose This document is an addendum to the Baseline Human Health Risk Assessment (BHHRA) for the Standard Mine site in Gunnison County, Colorado. The purpose of this document is to utilize new data collected at the site to provide an updated evaluation of the potential risks to humans from site-related contaminants present in environmental media that remain at the site after EPA has completed a number of response actions. The results of this assessment are intended to help inform risk managers and the public about potential human risks attributable to site-related contaminants and to help determine if there is a need for additional action at the site. The overall management goal is to ensure protection of humans from harmful acute and chronic exposures to site-related chemicals for current and reasonable future land uses. The methods used to evaluate risks in this assessment are consistent with current USEPA guidelines for human health (USEPA 1989; 1991a; 1991b; 1992; 1993; 2002a; 2002b; 2004e, 2009a) provided by the USEPA for use at Superfund sites. 1.2 Organization In addition to the introduction, this report is organized into the following sections: Section 2 Site description and history including a description of response actions that have
taken place at the site. Section 3 Summary of the findings and conclusions from the previous BHHRA. Section 4 Summary of the new data that were collected at the site to support an updated
evaluation of risks. Section 5 Risk characterization for child ATV riders at the site from ingestion and
inhalation of onsite soils. Section 6 Summary of the main uncertainties in the risk characterization. Section 7 Citations for all data, methods, studies, and reports utilized in the risk assessment
addendum.
FINAL
2
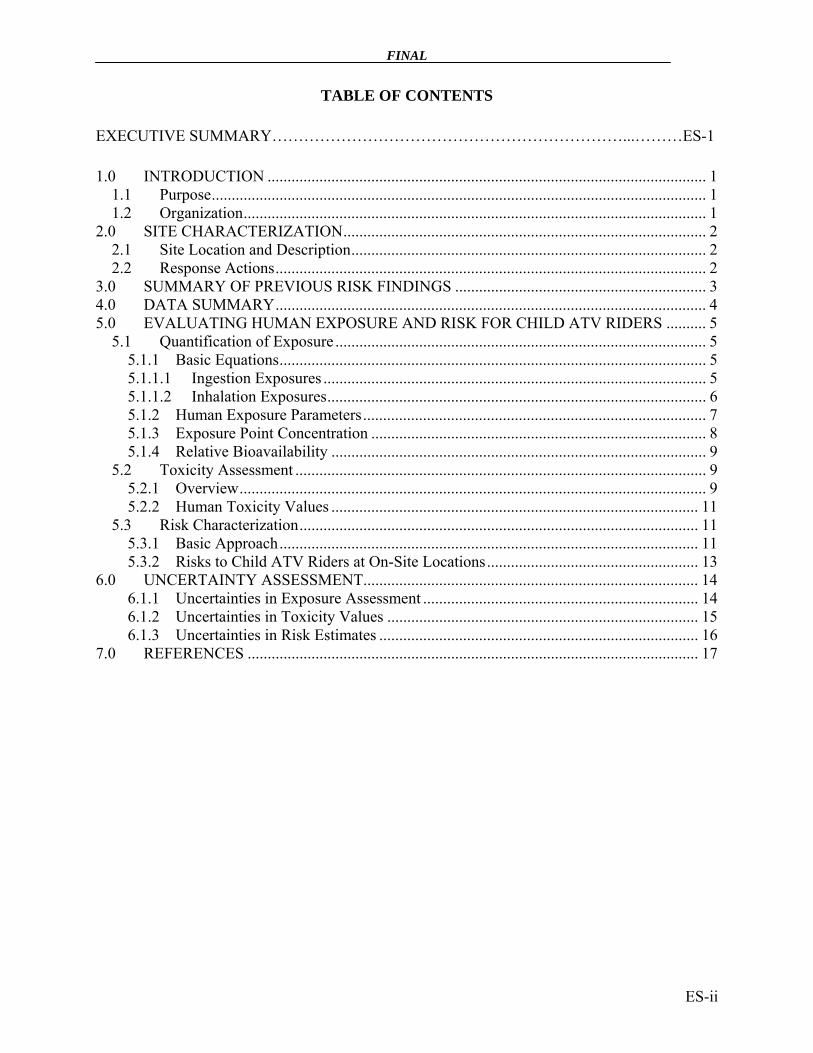
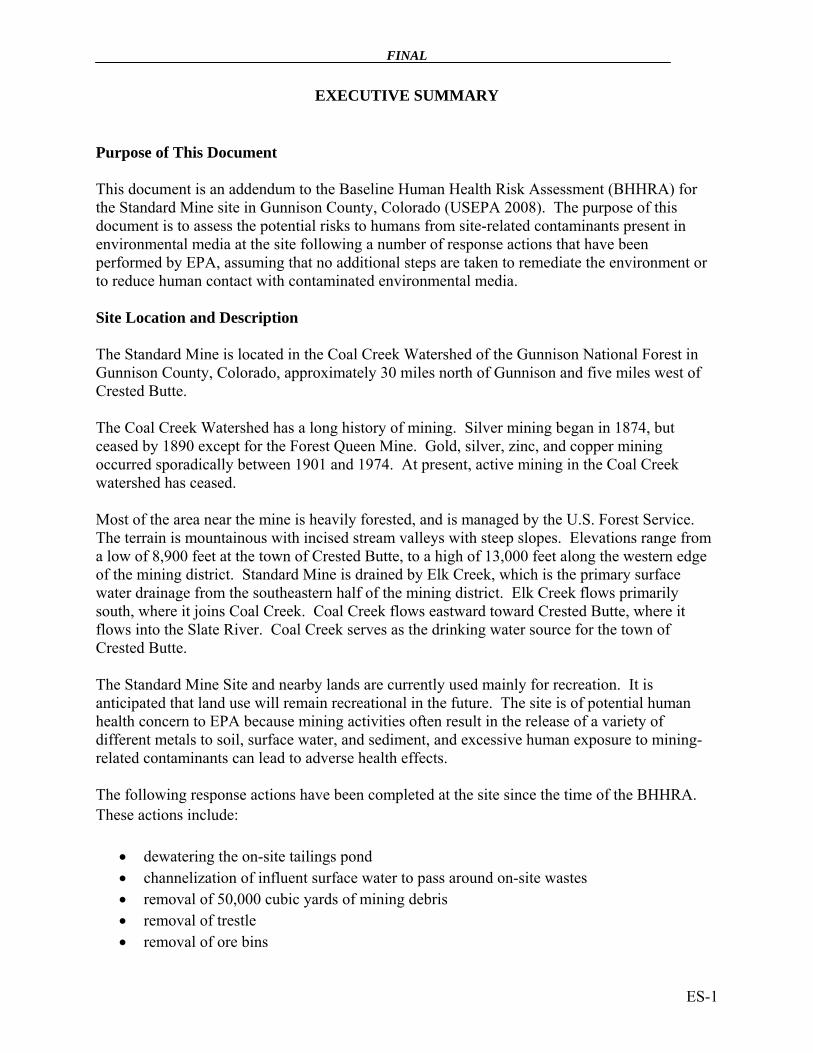
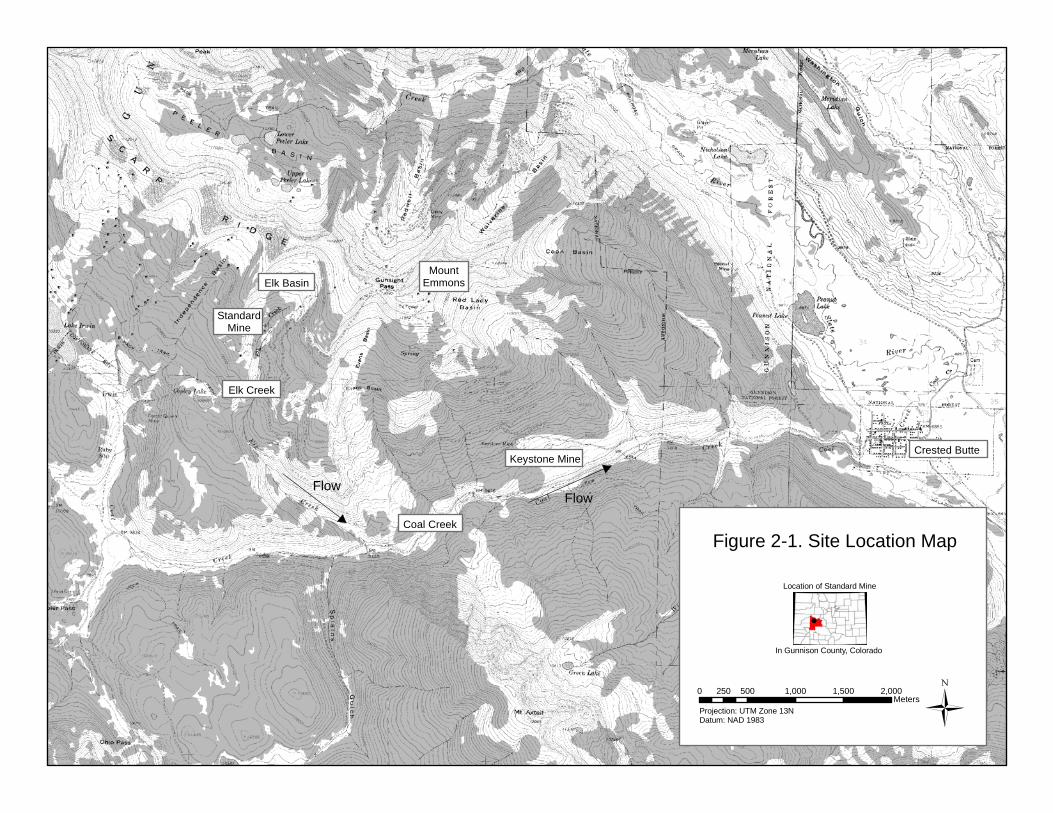
2.0 SITE CHARACTERIZATION 2.1 Site Location and Description The Standard Mine is located in the Coal Creek Watershed of the Gunnison National Forest in Gunnison County, Colorado, approximately 30 miles north of Gunnison and five miles west of Crested Butte. A map of the site is provided in Figure 2-1. The Coal Creek Watershed has a long history of mining. Silver mining began in 1874, but ceased by 1890 except for the Forest Queen Mine. Gold, silver, zinc, and copper mining occurred sporadically between 1901 and 1974. At present, active mining in the Coal Creek watershed has ceased and extensive remedial actions have taken place. Most of the area near the mine is heavily forested, and is managed by the U.S. Forest Service. The terrain is mountainous with incised stream valleys with steep slopes. The mine consists of many open, unmarked adits and shafts, giving access to 8,400 feet of mine working on 6 levels. Elevations range from a low of 8,900 feet at the town of Crested Butte, to a high of 13,000 feet along the western edge of the mining district. Standard Mine is drained by Elk Creek, which is the primary surface water drainage from the southeastern half of the mining district. Elk Creek flows primarily south, where it joins Coal Creek. Coal Creek flows eastward toward Crested Butte, where it flows into Slate River. Coal Creek serves as the drinking water source for the town of Crested Butte. The Standard Mine Site and nearby lands are currently used mainly for recreation. It is anticipated that land use will remain recreational in the future. The site is of potential human health concern to EPA because mining activities often result in the release of a variety of different metals to soil, surface water, and sediment, and excessive human exposure to mining-related contaminants can lead to adverse health effects. 2.2 Response Actions EPA has been working at the site for several years to reduce the impact of mine waste on the environment. The following response actions have been completed at the site since the time of the original BHHRA. These actions include:
• dewatering the on-site tailings pond • channelization of influent surface water to pass around on-site wastes • removal of 50,000 cubic yards of mining debris • removal of trestle • removal of ore bins • passive treatment pilot scale bioreactor • installed sediment controls along Elk Creek • restoration and realignment of Elk Creek • revegetation of areas impacted by cleanup activities
FINAL
3
3.0 SUMMARY OF PREVIOUS RISK FINDINGS Prior to implementation of the response actions described above, EPA performed a BHHRA in order to evaluate non-cancer and cancer risks for a variety of recreational receptors along the drainages and on-site near the mine for the following COPCs: aluminum, arsenic, cadmium, chromium, iron, and manganese. Levels of lead in on-site soils were also evaluated and not found to be of concern (USEPA 2008). No receptors had excess cancer risk levels that were above EPA’s usual level of concern (1E-04). For non-cancer risk, only the RME child ATV rider was found to have an HI in a range of potential concern (HI > 1). This non-cancer risk was primarily the result of inhalation exposure to manganese in airborne dusts, with non-cancer risks from all other chemicals combined contributing an HI of 0.2.
FINAL
4
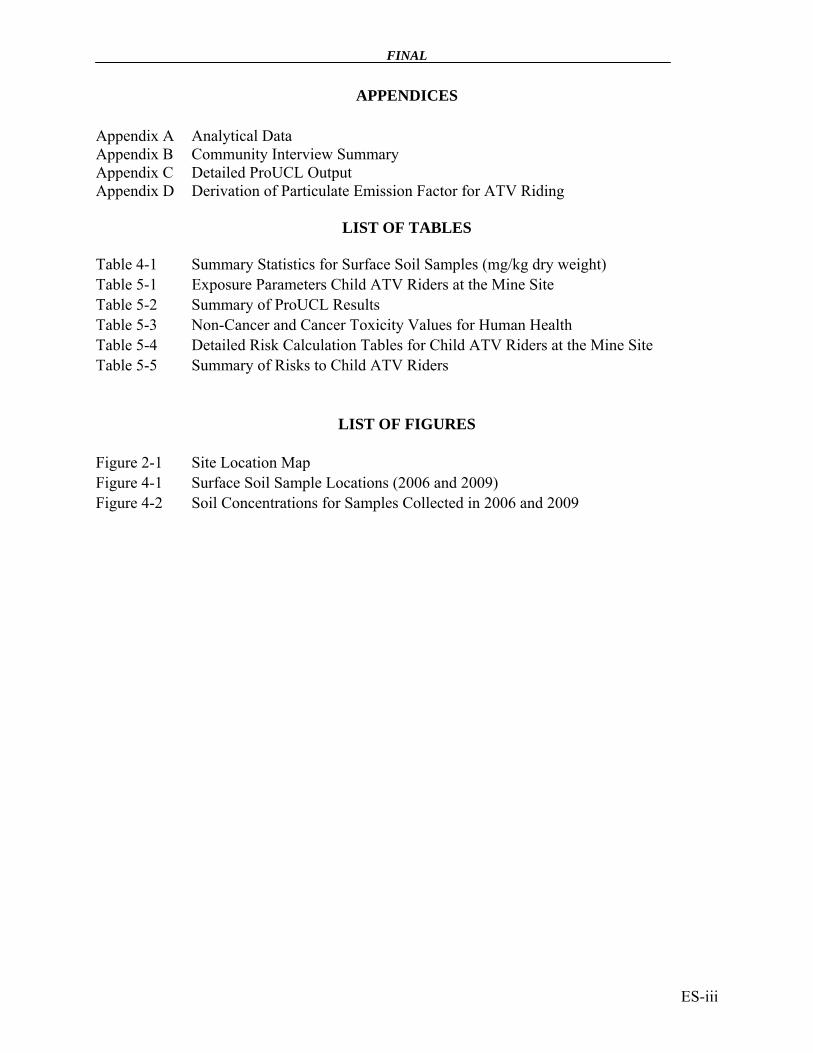
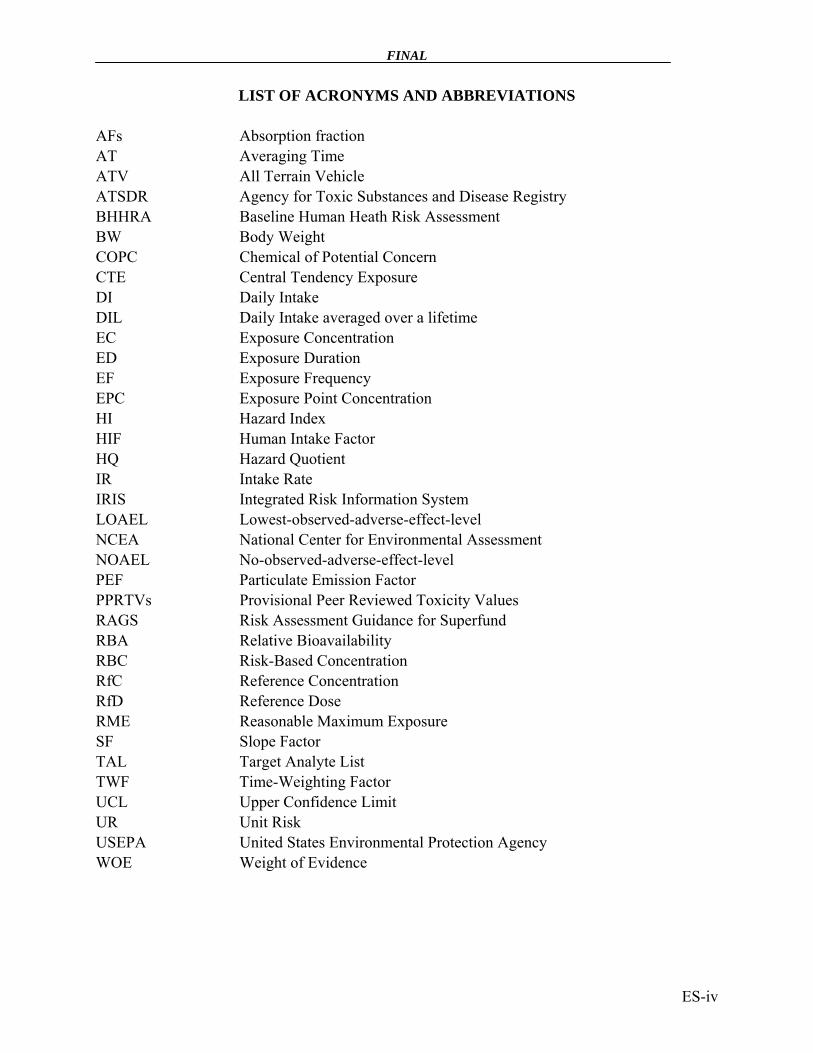
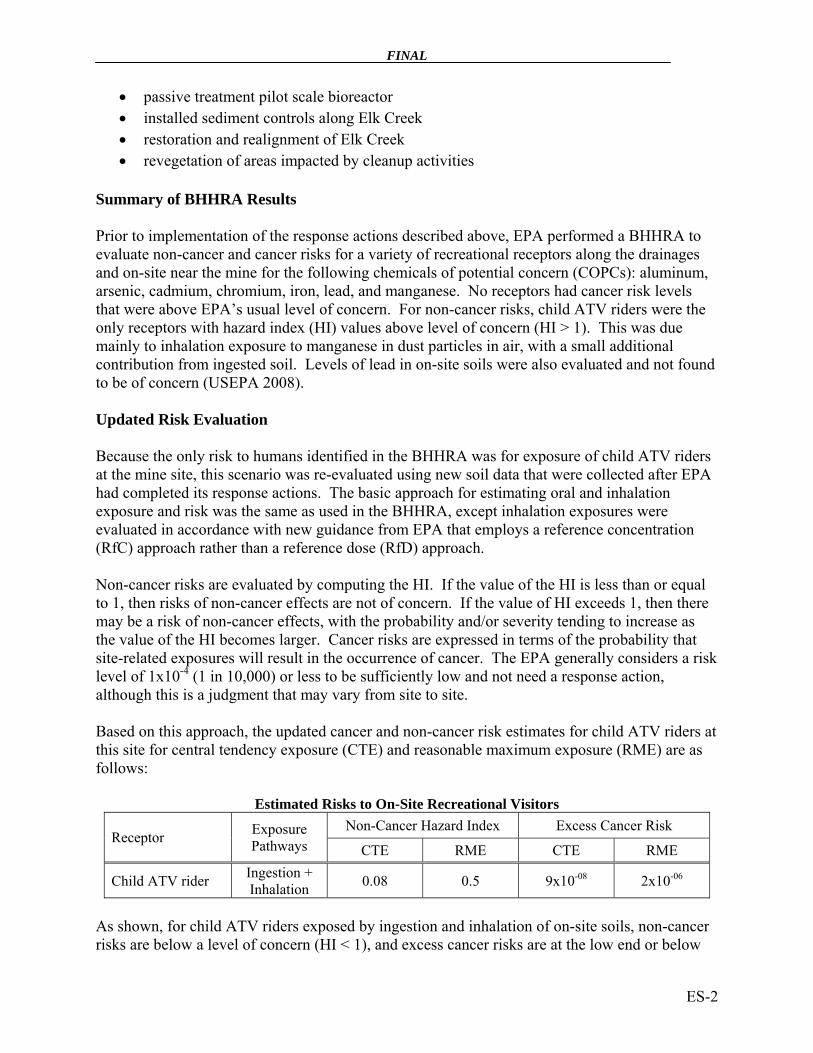
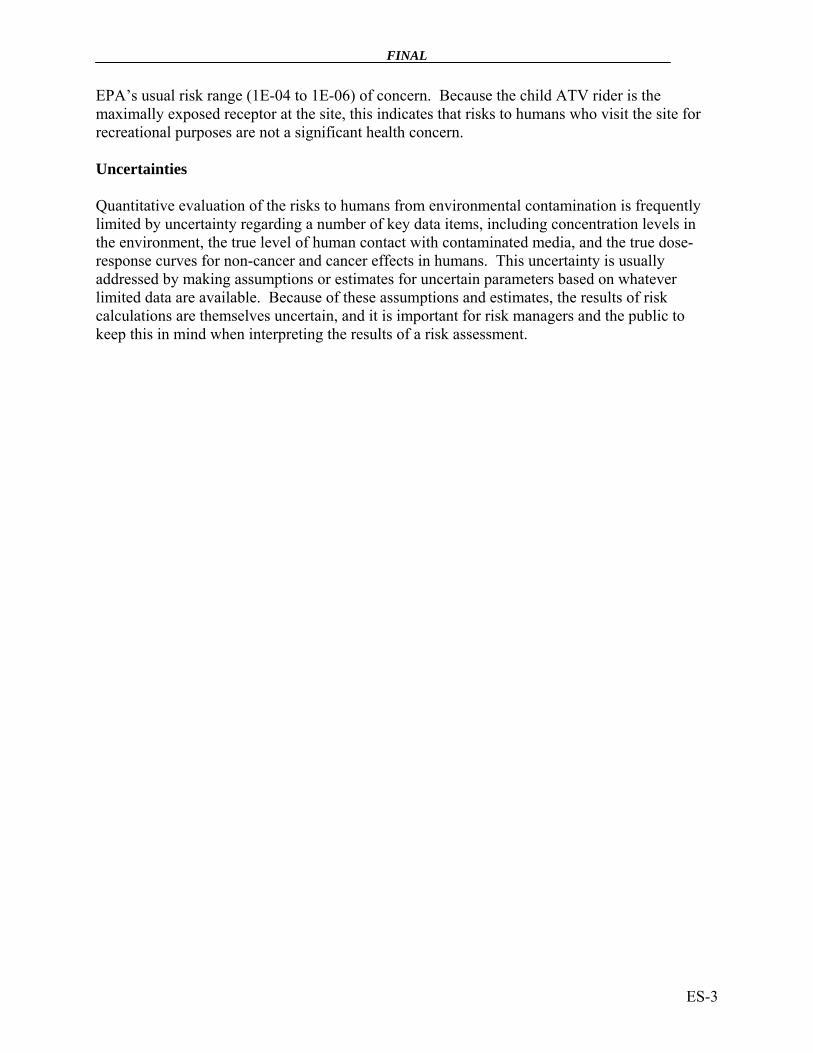
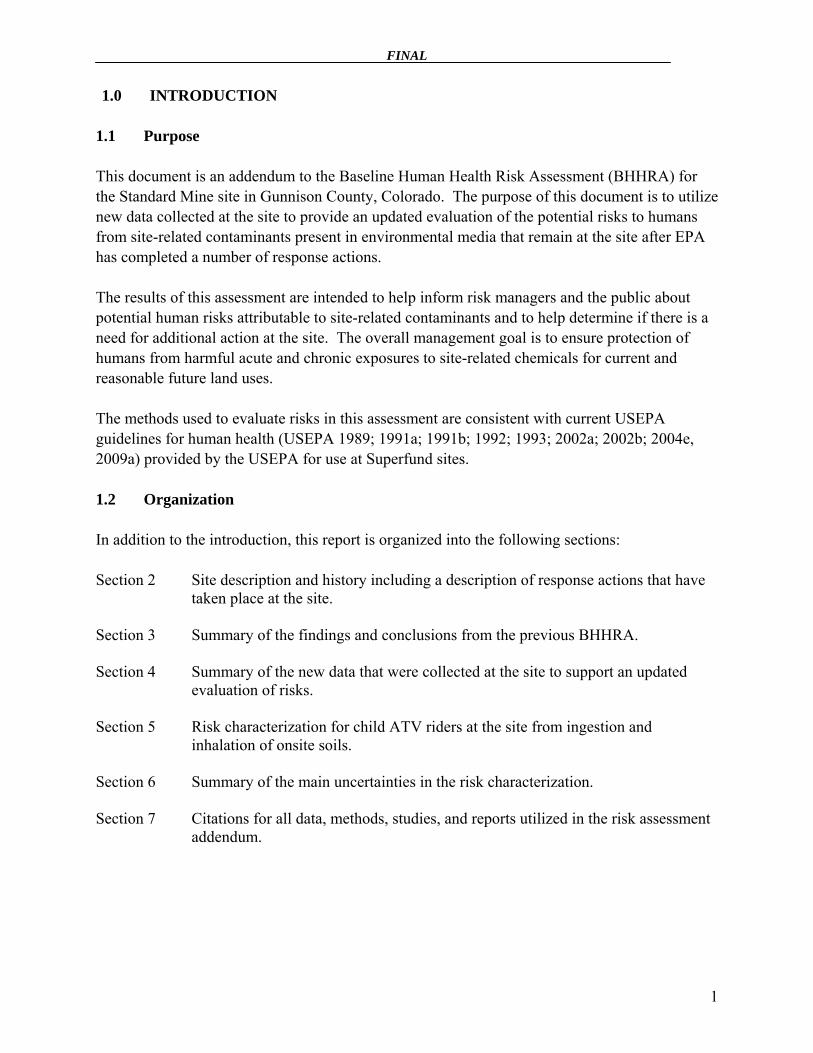
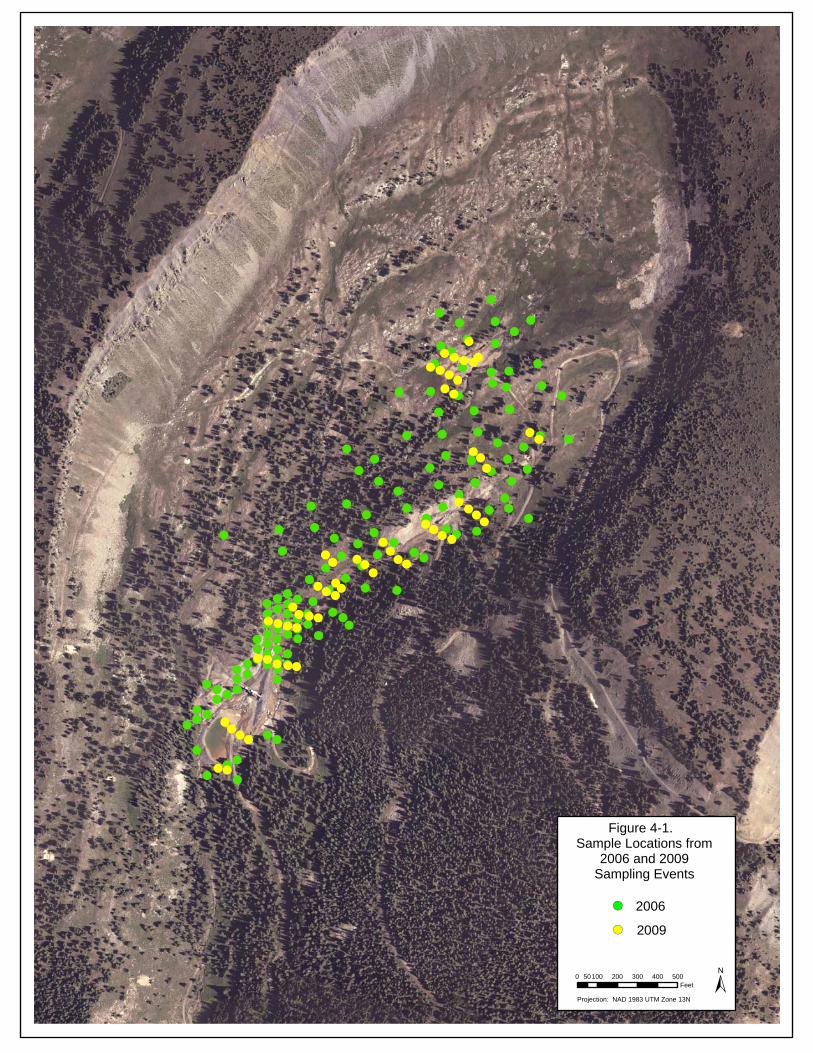
4.0 DATA SUMMARY In July, 2009, EPA collected 58 new soil samples from Levels 1, 2, and 3 of the Standard Mine site. In addition, 20 soil samples were collected from a location [Horseshoe Basin] determined to represent background conditions. These samples were analyzed for TAL (Target Analyte List) metals including the following: aluminum, antimony, arsenic, barium, beryllium, cadmium, calcium, chromium, cobalt, copper, iron, lead, magnesium, manganese, mercury, nickel potassium, selenium, silver, sodium, thallium, vanadium, and zinc. These new data collected in 2009 have been combined with relevant data from the 2006 collection effort for use in this addendum. Soil samples from 2006 were deemed relevant if it was determined that the location from which the sample was collected had not been disturbed during the implementation of any of EPA’s response actions. All 2006 and 2009 sampling locations utilized in this addendum are presented in Figure 4-1. Detailed analytical data for these samples are provided electronically in Appendix A. Summary statistics are provided in Table 4-1. For comparison purposes, data collected in 2006 and 2009 have been displayed in Figure 4-2 for the list of COPCs being evaluated in this addendum. The 2006 dataset includes all of the data that were used in the BHHRA, except samples from areas that have been influenced by EPA response actions. This allows a comparison of the site conditions in 2006 (pre-response) to 2009 (post response). As illustrated in Figure 4-2, most concentrations tend to be lower post-response (2009) than pre-response (2006). One exception is aluminum, which does not appear to change significantly. However, the concentrations of aluminum appear to be at background levels, so this result is not surprising.
FINAL
5
5.0 EVALUATING HUMAN EXPOSURE AND RISK FOR CHILD ATV RIDERS 5.1 Quantification of Exposure 5.1.1 Basic Equations
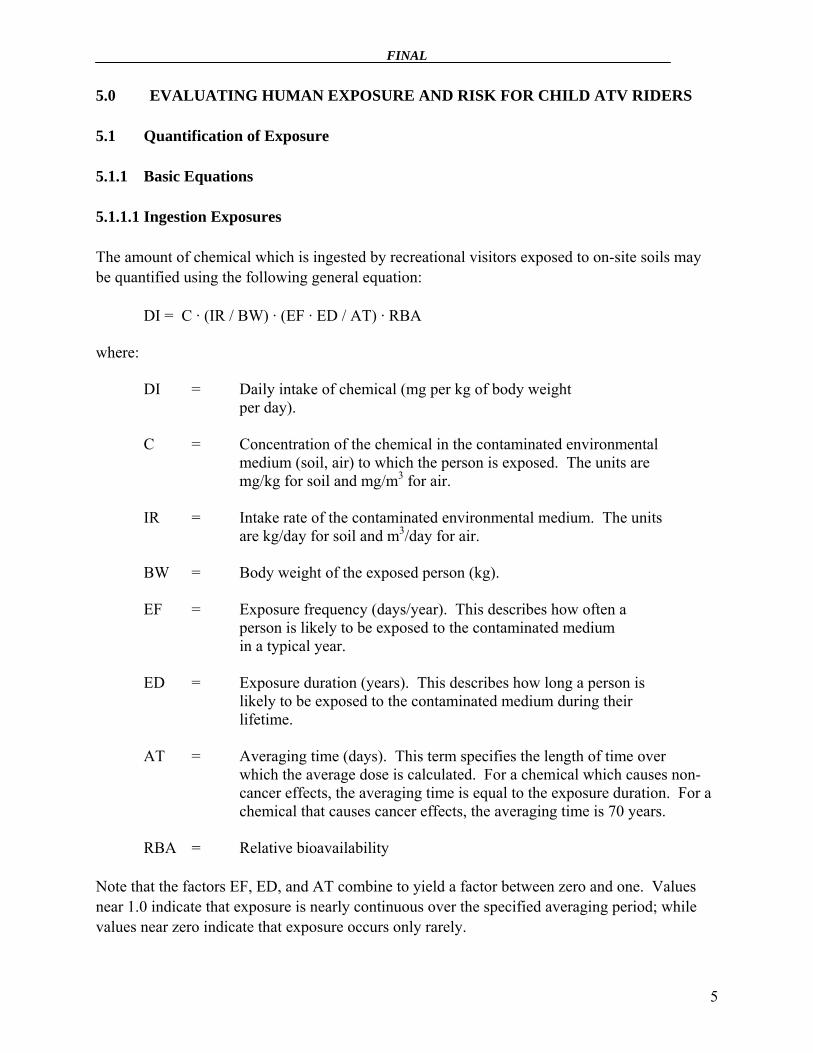
5.1.1.1 Ingestion Exposures The amount of chemical which is ingested by recreational visitors exposed to on-site soils may be quantified using the following general equation: DI = C · (IR / BW) · (EF · ED / AT) · RBA where: DI = Daily intake of chemical (mg per kg of body weight
per day). C = Concentration of the chemical in the contaminated environmental
medium (soil, air) to which the person is exposed. The units are mg/kg for soil and mg/m3 for air.
IR = Intake rate of the contaminated environmental medium. The units
are kg/day for soil and m3/day for air. BW = Body weight of the exposed person (kg). EF = Exposure frequency (days/year). This describes how often a
person is likely to be exposed to the contaminated medium in a typical year.
ED = Exposure duration (years). This describes how long a person is
likely to be exposed to the contaminated medium during their lifetime.
AT = Averaging time (days). This term specifies the length of time over which the average dose is calculated. For a chemical which causes non-cancer effects, the averaging time is equal to the exposure duration. For a chemical that causes cancer effects, the averaging time is 70 years.
RBA = Relative bioavailability Note that the factors EF, ED, and AT combine to yield a factor between zero and one. Values near 1.0 indicate that exposure is nearly continuous over the specified averaging period; while values near zero indicate that exposure occurs only rarely.

FINAL
6
For mathematical convenience, the general equation for calculating dose can be written as: DI = C · HIF · RBA where: HIF = Human Intake Factor. This term describes the average amount of
an environmental medium contacted by the exposed person each day. The value of HIF is typically given by:
HIF = (IR / BW) · (EF · ED / AT)
The units of HIF are kg/kg-day for soil and m3/kg-day for air. Because exposure parameters (e.g., intake rates, body weight, and exposure frequency) may change as a function of age, exposure calculations are performed separately for children and adults. 5.1.1.2 Inhalation Exposures In accordance with recent EPA guidance (EPA 2009a), inhalation exposures are evaluated using a concentration-based rather than a dose-based approach. In this approach, the inhalation Exposure concentration (EC) for chronic exposures is calculated as:
EC = C · (ET · EF · ED / AT) where:
EC = Exposure Concentration (μg/m3). This is the time-weighted concentration based on the characteristics of the exposure scenario being evaluated. C = Concentration of the chemical in air (μg/m3) to which the person is exposed.
ET = Exposure time (hours/day). This describes how long a person is likely to be exposed to the contaminated medium in a typical day.
EF = Exposure frequency (days/year). This describes how often a person is likely to be exposed to the contaminated medium in a typical year.
ED = Exposure duration (years). This describes how long a person is likely to be exposed to the contaminated medium during their lifetime.
AT = Averaging time (hours). This term specifies the length of time over which the time-weighted average concentration is calculated.
FINAL
7
For mathematical convenience, the general equation for exposure concentration can be written as: EC = C · TWF where:
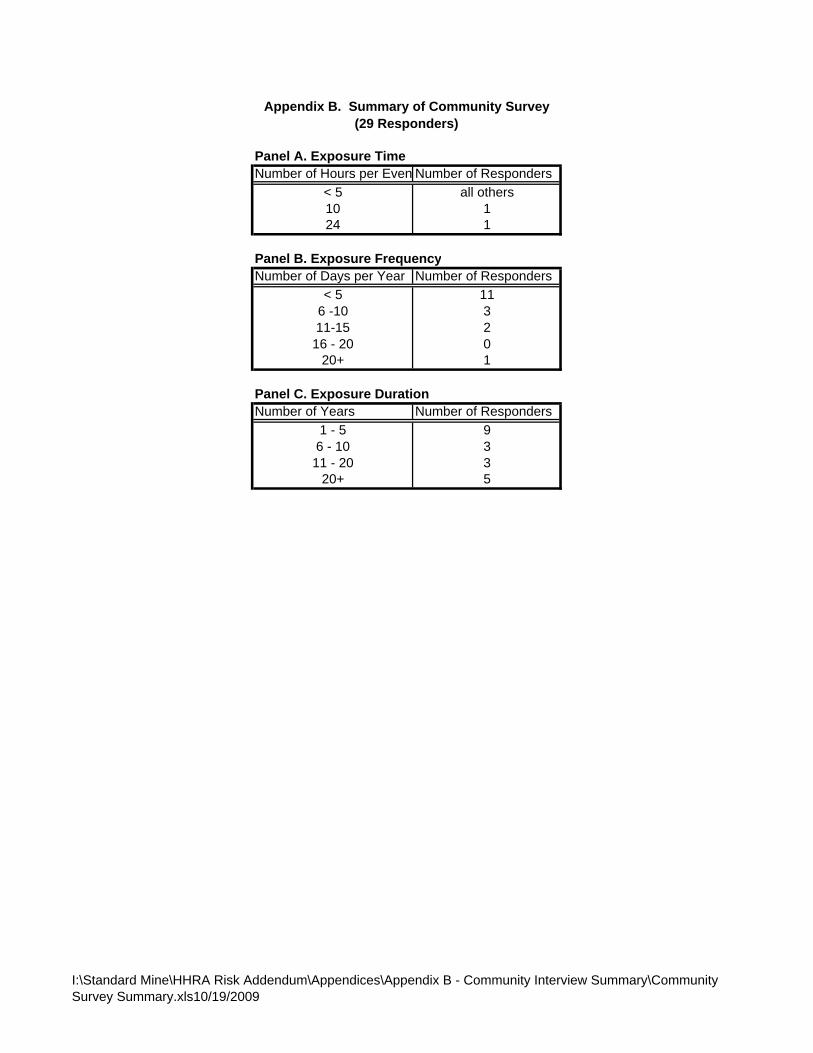
TWF = Time-Weighting Factor (unitless). The value of TWF is given by: TWF = (ET · EF · ED / AT) 5.1.2 Human Exposure Parameters For every exposure pathway of potential concern, it is expected that there will be differences between individuals in the level of exposure at a specific location due to differences in intake rates, body weights, exposure frequencies, and exposure durations. Thus, there is normally a wide range of average daily intakes between different members of an exposed population. Because of this, all daily intake calculations must specify what part of the range of doses is being estimated. Typically, attention is focused on intakes that are “average” or are otherwise near the central portion of the range, and on intakes that are near the upper end of the range (e.g., the 95th percentile). These two exposure estimates are referred to as Central Tendency Exposure (CTE) and Reasonable Maximum Exposure (RME), respectively. Table 5-1 lists the CTE and RME exposure parameters and resultant HIF and TWF values used in this assessment for on-site child ATV riders. Some of the values are based on USEPA default guidelines, and others are based on professional judgment or are estimated by extrapolation from other sites. Data on the frequency and duration of site visits are derived from a site-specific community interview conducted by EPA on July 27, 2006. Appendix B provides the detailed responses from these interviews, and the results for frequency and duration of visits to the site are summarized below:
Parameter Value Survey Result Number of site visits per year
< 5 11 5-20 5 > 20 1
Hours spent at site per visit
< 5 All others 5-10 1 > 10 1
Most respondents indicated that a majority of people would visit the site less than 20 times per year. On this basis, an RME exposure frequency of 20 days per year was selected. This would correspond to four 2-day weekend trips and two 1-week visits per year. For CTE receptors, the population-weighted average duration (6 days/year) was selected.
FINAL
8
5.1.3 Exposure Point Concentration An exposure point (also referred to as an exposure unit or exposure area) is an area where a receptor may be exposed to one or more environmental media. In general, receptors are assumed to move about at random within an exposure area. Because recreational visitors are likely to move about the entire site at random, the entire mine site was identified as the exposure area of concern. Because of the assumption of random exposure over an exposure area, risk from a chemical is related to the arithmetic mean concentration of that chemical averaged over the entire exposure area. Since the true arithmetic mean concentration cannot be calculated with certainty from a limited number of measurements, the USEPA recommends that the upper 95th percentile confidence limit (UCL) of the arithmetic mean at each exposure point be used when calculating exposure and risk at that location (USEPA 1992). If the 95% UCL exceeds the highest detected concentration, the highest detected value is used instead (USEPA 1989). The mathematical approach that is most appropriate for computing the 95% UCL of a data set depends on a number of factors, including the number of data points available, the shape of the distribution of the values, and the degree of censoring (USEPA 2002a). The USEPA has developed a software system known as ProUCL that computes the UCL for a data set by several different strategies, and then identifies which UCL is recommended. Detailed results from ProUCL can be found in Appendix C, and a summary of the results is shown in Table 5-2. Approach for Airborne Dust from ATV Riding No data were collected at the Standard Mine for soil particulate levels in air resulting from mechanical disturbances such as ATV riding. In the absence of measured values, the concentration of contaminants in air that would occur during ATV riding was estimated using the following equation:
C(air) = C(soil) · PEF where: C(air) = concentration of contaminant in air (mg/m3) C(soil) = concentration of contaminant in soil (mg/kg)
PEF = particulate emission factor (kg of soil per m3 of air)
Appendix D presents the derivation of the PEF for ATV riding used in the risk assessment. The resulting value is 1.18E-06 kg/m3.
FINAL
9
5.1.4 Relative Bioavailability Relative bioavailability (RBA) is the ratio of the gastrointestinal absorption of a chemical from a site medium (e.g., soil or sediment) compared to the absorption of that chemical which occurred in the toxicity study used to derive the toxicity factors (RfD, SF) for the chemical. In general, metals in soil or sediment at mining sites exist in the form of mineral particles that are not rapidly solubilized in gastrointestinal fluids when ingested, while toxicity studies often utilize readily soluble forms of the test chemical. Thus, oral RBA values for metals in soil or sediment are often less than 1.0. For arsenic, sufficient data are available to establish that oral RBA values in soil are generally in the 10-20% range (USEPA 2005, Roberts et al. 2007). In order to be conservative, the RBA for arsenic in soil and sediment is set to 50%. Note that this value applies only to ingested soil, and a value of 1.0 is assumed for inhaled arsenic. RBA data are much more limited or absent for other metals, so the RBA values for all other metals are set to 1.0. This is considered to be a conservative assumption. 5.2 Toxicity Assessment 5.2.1 Overview The basic objective of a toxicity assessment is to identify the potential adverse health effects of a chemical, and how the appearance of these adverse effects depends on exposure concentrations. In addition, the toxic effects of a chemical frequently depend on the route of exposure (oral, inhalation, dermal) and the duration of exposure (subchronic, chronic, or lifetime). Thus, a full description of the toxic effects of a chemical includes a listing of what adverse health effects the chemical may cause, and how the occurrence of these effects depends upon dose, route, and duration of exposure. The toxicity assessment is usually divided into two parts: the first characterizes and quantifies the non-cancer effects of the chemical, while the second addresses the cancer effects of the chemical. This two-part approach is employed because there are typically major differences in the time-course of action and the shape of the dose-response curve for cancer and non-cancer effects. Non-Cancer Effects Most chemicals can cause adverse health effects if given at a high enough dose. However, when the dose is sufficiently low, typically no adverse effect is observed. Thus, in characterizing the non-cancer effects of a chemical, the key parameter is the threshold dose at which an adverse effect first becomes evident. Doses below the threshold are considered to be safe, while doses above the threshold are likely to cause an adverse effect.
FINAL
10
The threshold dose is typically estimated from toxicological data (derived from studies of humans and/or animals) by finding the highest dose that does not produce an observable adverse effect and/or the lowest dose which does produce an effect. These are referred to as the "No-observed-adverse-effect-level" (NOAEL) and the "Lowest-observed-adverse-effect-level" (LOAEL), respectively. The threshold is presumed to lie in the interval between the NOAEL and the LOAEL. However, in order to be conservative (health protective), non-cancer risk evaluations are not based directly on the threshold exposure level, but on a value referred to as the Reference Dose (RfD). The RfD is an estimate (with uncertainty spanning perhaps an order of magnitude) of a daily exposure to the human population (including sensitive subgroups) that is likely to be without an appreciable risk of deleterious effects during a lifetime. The RfD is derived from the NOAEL (or the LOAEL if a reliable NOAEL is not available) by dividing by an "uncertainty factor". If the data are from studies in humans, and if the observations are considered to be very reliable, the uncertainty factor may be as small as 1.0. However, the uncertainty factor is normally at least 10, and can be much higher if the data are limited. The effect of dividing the NOAEL or the LOAEL by an uncertainty factor is to ensure that the RfD is not higher than the threshold level for adverse effects. Thus, there is always a "margin of safety" built into an RfD, and doses equal to or less than the RfD are nearly certain to be without any risk of adverse effect. Doses higher than the RfD may carry some risk, but because of the margin of safety, a dose above the RfD does not mean that an effect will occur. Cancer Effects For cancer effects, the toxicity assessment has two components. The first is a qualitative evaluation of the weight of evidence (WOE) that the chemical does or does not cause cancer in humans. Typically, this evaluation is performed by the USEPA, using the system summarized below:
WOE Meaning Description A Known human carcinogen Sufficient evidence of cancer in humans. B1 Probable human carcinogen Suggestive evidence of cancer incidence in humans. B2 Probable human carcinogen Sufficient evidence of cancer in animals, but lack of data
or insufficient data in humans. C Possible human carcinogen Suggestive evidence of carcinogenicity in animals
For chemicals which are classified in Group A, B1, B2, or C, the second part of the toxicity assessment is to describe the carcinogenic potency of the chemical. This is done by quantifying how the number of cancers observed in exposed animals or humans increases as the dose increases. Typically, it is assumed that the dose response curve for cancer has no threshold, arising from the origin and increasing linearly until high doses are reached. Thus, the most convenient descriptor of cancer potency is the slope of the dose-response curve at low doses (where the slope is still linear). This is referred to as the Slope Factor (SF), which has dimensions of cancer risk per unit dose.
FINAL
11
Estimating the cancer SF is often complicated by the fact that observable increases in cancer incidence usually occur only at relatively high doses, frequently in the part of the dose-response curve that is no longer linear. Thus, it is necessary to use mathematical models to extrapolate from the observed high dose data to the desired (but immeasurable) slope at low doses. To account for the uncertainty in this extrapolation, USEPA typically chooses to employ the upper 95th confidence limit of the slope as the SF. That is, there is a 95 percent probability that the true cancer potency is lower than the value chosen for the Slope Factor. This approach ensures that there is a margin of safety in cancer as well as non-cancer risk estimates. 5.2.2 Human Toxicity Values Toxicity values (RfD, RfC, SF, and UR values) that have been established by USEPA are listed in an on-line database referred to as "IRIS" (Integrated Risk Information System). Other toxicity values are available as interim recommendations from USEPA's Superfund Technical Assistance Center operated by the National Center for Environmental Assessment (NCEA). Table 5-3 summarizes the toxicity values used for evaluation of human health risks from COPCs at this site. Points to note regarding the data in this table are listed below:
• The oral RfD for manganese in soil is based on the oral RfD of 1.4E-01 mg/kg-day in the diet. In accordance with recommendations in IRIS, the dietary RfD is modified by dividing by a Modifying Factor of 3 for application to soil ingestion exposures.
• The valence state of chromium in soil at this site is not known. Most chromium in soils
tends to be in the less toxic trivalent form (ATSDR 2000). Therefore, for the oral RfD used in risk calculations, it was assumed that 85% of the chromium in soil exists in the trivalent form, and 15% exists in the more toxic hexavalent form.
5.3 Risk Characterization 5.3.1 Basic Approach Non-Cancer Effects The potential for non-cancer effects is evaluated by comparing the estimated exposure concentration for a receptor over a specified time period to a reference threshold that represents the exposure below which it is unlikely for even sensitive populations to experience adverse health effects (EPA 1989). This ratio of exposure to toxicity is called a Hazard Quotient (HQ). If the HQ for a chemical is equal to or less than one, it is believed that there is no appreciable risk that non-cancer health effects will occur. If an HQ exceeds one, there is some possibility that non-cancer effects may occur, although an HQ above one does not indicate an effect will definitely occur. This is because of the margin of safety inherent in the derivation of all toxicity values (see Section 5.2.1). However, the larger the HQ value, the more likely it is that an adverse effect may occur. Non-cancer HQs for each chemical are calculated as described below.
FINAL
12
Ingestion Exposures. For most chemicals, the potential for non-cancer effects is evaluated by comparing the estimated daily intake of the chemical over a specific time period with the RfD for that chemical derived for a similar exposure period, as follows (USEPA 1989):
HQ = DI / RfD
where: DI = Daily Intake (mg/kg-day) RfD = Reference Dose (mg/kg-day)
Inhalation Exposures. For inhalation exposures, the potential for non-cancer effects is evaluated by comparing the time-weighted exposure concentration (EC) over a specific time period to the appropriate inhalation reference concentration (iRfC) for that chemical, as follows (USEPA 2009a):
HQ = EC / iRfC
where: EC = Exposure Concentration (μg/m3) iRfC = Inhalation Reference Concentration (μg/m3)
Cancer Effects The excess risk of cancer from exposure to a chemical is described in terms of the probability that an exposed individual will develop cancer because of that exposure. Excess cancer risks are summed across all carcinogenic chemicals and all exposure pathways that contribute to exposure of an individual in a given population. The level of total cancer risk that is of concern is a matter of personal, community, and regulatory judgment. In general, the EPA considers excess cancer risks that are below 1E-06 to be so small as to be negligible, and risks above 1E-04 to be sufficiently large that some sort of remediation is desirable1. Excess cancer risks that range between 1E-04 and 1E-06 are generally considered to be acceptable (EPA 1991b), although this is evaluated on a case by case basis, and EPA may determine that risks lower than 1E-04 are not sufficiently protective and warrant remedial action. Cancer risks for each chemical are calculated as described below. Ingestion Exposures. The excess risk of cancer from ingestion exposure to a chemical is calculated as follows (EPA 1989):
Excess Cancer Risk = 1 - exp(-DIL · SF)
1 Note that excess cancer risk can be expressed in several formats. A cancer risk expressed in a scientific notation format as 1E-06 is equivalent to 1 in 1,000,000 or 10-6. Similarly, a cancer risk of 1E-04 is equivalent to 1 in 10,000 or 10-4. For the purposes of this document, all cancer risks are presented in a scientific notation format (i.e., 1E-06).
FINAL
13
where: DIL = Daily Intake, averaged over a lifetime (mg/kg-day) SF = Slope Factor (mg/kg-day)-1
In most cases (except when the product of DIL ⋅ SF is larger than about 0.01), this equation may be approximated by the following:
Excess Cancer Risk = DIL · SF Inhalation Exposures. The excess risk of cancer from inhalation exposure is calculated based on inhalation unit risk (iUR) values, as follows (EPA 2009a): Excess Cancer Risk = EC · iUR
where:
EC = Exposure Concentration (μg/m3) iUR = Inhalation Unit Risk (μg/m3)-1
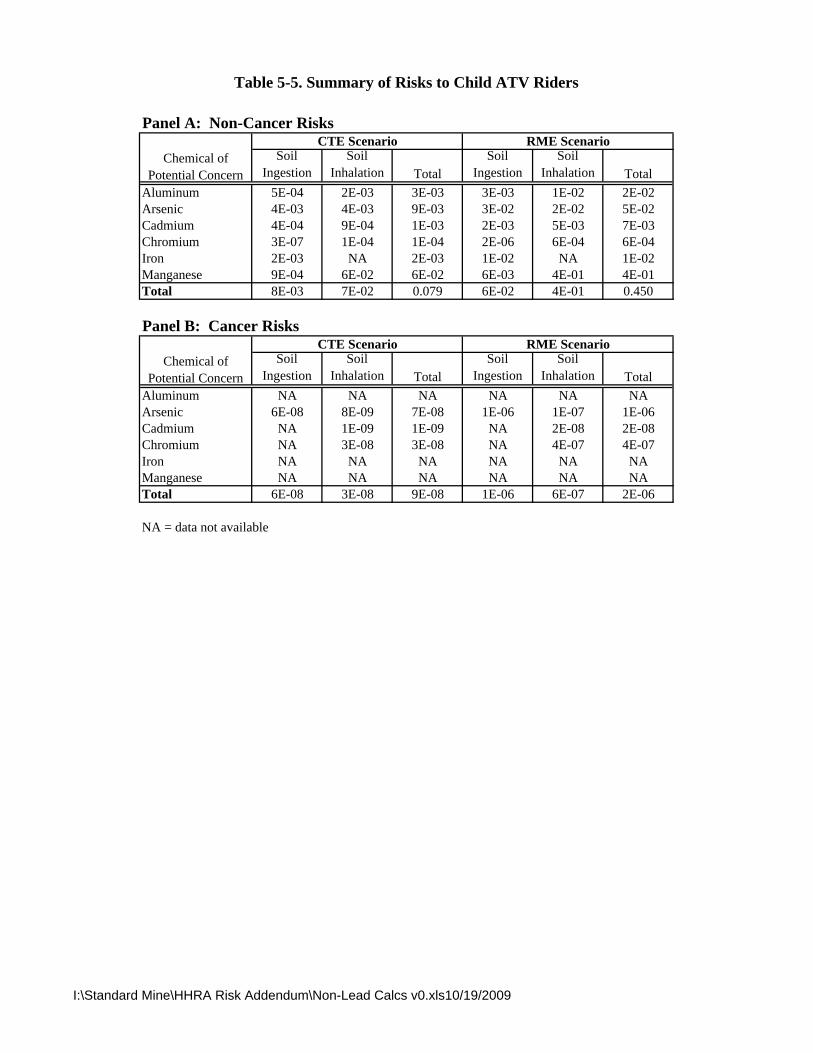
5.3.2 Risks to Child ATV Riders at On-Site Locations Detailed calculations of exposure and risk are presented in Table 5-4. A summary of results for the child ATV rider exposed at on-site locations is shown in Table 5-5. Inspection of this table reveals the following conclusions:
• Non-cancer risks (Panel A) are below a level of concern (HI < 1) for all chemicals, alone or in combination.
• Excess cancer risks (Panel B) are within or below EPA’s risk range (1E-04 to 1E-06) for
all chemicals, alone or in combination.
FINAL
14
6.0 UNCERTAINTY ASSESSMENT Quantitative evaluation of the risks to humans from environmental contamination is frequently limited by uncertainty regarding a number of key data items, including concentration levels in the environment, the true level of human contact with contaminated media, and the true dose-response curves for non-cancer and cancer effects in humans. This uncertainty is usually addressed by making assumptions or estimates for uncertain parameters based on whatever limited data are available. Because of these assumptions and estimates, the results of risk calculations have some uncertainty, and it is important for risk managers and the public to keep this in mind when interpreting the results of a risk assessment. The following sections review the main sources of uncertainty in the risk calculations performed for the Standard Mine site. 6.1.1 Uncertainties in Exposure Assessment Uncertainties from Exposure Pathways Not Evaluated As discussed above, humans may be exposed to site-related chemicals by a number of pathways, but not all of these pathways are evaluated quantitatively in this risk assessment. In most cases, this is because the contribution of the pathway omitted is believed to be minor compared to one or more other pathways that were evaluated. In these cases, omission of the minor pathways will result in a small underestimation of exposure and risk, but the magnitude of this underestimation is not expected to be significant. One potential exception is dermal exposure. This pathway was not evaluated because current methods for estimating dermal uptake are too limited to support meaningful risk estimates. In general, dermal absorption of metals is expected to be minor, especially from dermal contact with soil, since the metals would likely be adsorbed to the soil particles, and transport of ionic chemicals across the skin is generally quite slow. However, because data are so limited, omission of this pathway could result in an underestimate of exposure, and this is a source of uncertainty. Uncertainties From Chemicals Not Evaluated As discussed above, exposure and risk were quantified only for a selected subset (the COPCs) of chemicals detected in environmental media as determined by the BHHRA. While omission of other chemicals might tend to underestimate total risks, this is not a significant source of uncertainty because the chemicals that were excluded are known to be present at concentrations that are well below a level of concern. Uncertainties in Exposure Point Concentrations In all exposure calculations, the desired input parameter is the true mean concentration of a contaminant within a medium, averaged over the area where random exposure occurs. However, because the true mean cannot be calculated based on a limited set of measurements, the USEPA (1989, 1992) recommends that the exposure estimate be based on the 95% upper confidence
FINAL
15
limit of the mean. At this site, the data for on-site soils are of sufficient quantity and quality that the 95% UCL of the mean is only moderately larger than the sample mean, so this source of uncertainty is relatively minor. In the case of risks from dust released into air by ATV riding, no measured data were available so airborne concentrations were estimated using a screening-level soil-to-air transfer model. In general, such predicted concentration values have high uncertainty compared to measured values, so the actual concentrations of manganese and other chemicals in airborne dusts are uncertain, and true values might be either higher or lower than calculated. Uncertainties in Human Exposure Parameters Accurate calculation of risk values requires accurate estimates of the level of human exposure that is occurring. However, many of the required exposure parameters are not known with certainty and must be estimated from limited data or knowledge. For example, even though site-specific data were collected on the frequency and duration of exposures of recreation visitors at the site, the number of respondents was sufficiently low that actual values can only be estimated. Likewise, data are absent on the amount of actual amount of soil, sediment and surface water ingested by recreational visitors, and the values used in the calculations are based mainly on professional judgment. In general, when exposure data were limited or absent, the exposure parameters were chosen in a way that was intended to be conservative. For example, recall that a relative bioavailability of 1.0 was assumed for all chemicals except arsenic, even though values less than 1.0 are likely. Because of this generally conservative approach, the values selected are thought to be more likely to overestimate than underestimate actual exposure and risk. 6.1.2 Uncertainties in Toxicity Values Toxicity information for many chemicals is often limited. Consequently, there are varying degrees of uncertainty associated with toxicity values (i.e., cancer slope factors, reference doses). For example, uncertainties can arise from the following sources:
• Extrapolation from animal studies to humans • Extrapolation from high dose to low dose • Extrapolation from continuous exposure to intermittent exposure • Limited or inconsistent toxicity studies
In general, uncertainty in toxicity factors is one of the largest sources of uncertainty in risk estimates at a site. Because of the conservative methods USEPA uses in dealing with the uncertainties, it is much more likely that the uncertainty will result in an overestimation rather than an underestimation of risk.
FINAL
16
6.1.3 Uncertainties in Risk Estimates Because risk estimates for a chemical are derived by combining uncertain estimates of exposure and toxicity (see above), the risk estimates for each chemical are more uncertain than either the exposure estimate or the toxicity estimate alone. Additional uncertainty arises from the issue of how to combine risk estimates across different chemicals. In some cases, the effects caused by one chemical do not influence the effects caused by other chemicals. In other cases, the effects of one chemical may interact with effects of other chemicals, causing responses that are approximately additive, greater than additive (synergistic), or less than additive (antagonistic). In most cases, available toxicity data are not sufficient to define what type of interaction is expected, so USEPA generally assumes effects are additive for non-carcinogens that act on the same target tissue and for carcinogens (all target tissues). At this site, non-cancer risks are contributed nearly exclusive by manganese, so additivity of HQ values across different COPCs is a minor source of uncertainty. Likewise, cancer risks are contributed mainly by arsenic with negligible contributions from other chemicals (cadmium and chromium), so interactions between these chemicals is unlikely to be a source of significant uncertainty.
FINAL
17
7.0 REFERENCES ATSDR. 2000. Toxicological Profile for Chromium. September 2000. ATSDR Toxicological Profiles Web Site. http://www.atsdr.cdc.gov/toxprofiles/tp2.html IRIS. 2009. Integrated Risk Information System. On-line database of toxicity data maintained by USEPA, available at http://www.epa.gov/iriswebp/iris/index.html. Roberts SM, Munson JW, Lowney YW, and Ruby MV. 2007. Relative Oral Bioavailability of Arsenic from Contaminated Soils Measured in the Cynomolgus Monkey. Tox. Sci. 95:281-288. USEPA. 1989. Risk Assessment Guidance for Superfund (RAGS). Volume I. Human Health Evaluation Manual (Part A). USEPA. 1991a. Human Health Evaluation Manual, Supplemental Guidance: “Standard Default Exposure Factors.” Washington, DC. OSWER Directive 9285.6-03. USEPA. 1991b. Role of the Baseline Risk Assessment in Superfund Remedy Selection Decisions. Washington, DC. OSWER Directive 9355.0-30. USEPA. 1992. U.S. Environmental Protection Agency, Office of Solid Waste and Emergency Response. Supplemental Guidance to RAGS: Calculating the Concentration Term. Publication 9285.7-081. USEPA. 1993. Superfund’s Standard Default Exposure Factors for the Central Tendency and Reasonable Maximum Exposure. Draft. USEPA. 1994. Methods for Derivation of Inhalation Reference Concentrations and Application of Inhalation Dosimetry. U.S. Environmental Protection Agency, Office of Research and Development, Research Triangle Park, NC. EPA/600/8-90/066F. http://cfpub.epa.gov/ncea/cfm/recordisplay.cfm?deid=71993 USEPA. 1997a. Exposure Factors Handbook, Volumes I, II, and III. U.S. Environmental Protection Agency, Office of Research and Development. EPA/600/P-95/002Fa. USEPA 1997b. Health Effects Assessment Summary Tables. FY 1997 Update. EPA-540-R-97-036. U.S. Environmental Protection Agency, Office of Solid Waste and Emergency Response. Washington, D.C. July. USEPA. 2000. Risk Assessment Guidance for Superfund Volume I: Human Health Evaluation Manual (Part E, Supplemental Guidance for Dermal Risk Assessment) Interim. U.S. Environmental Protection Agency, Office of Emergency and Remedial Response. EPA/540/R/99/005.
FINAL
18
USEPA. 2002a. Supplemental Guidance for Developing Soil Screening Levels for Superfund Sites. OSWER 9355.4-24. December. USEPA. 2002b. Calculating Upper Confidence Limits for Exposure Point Concentrations at Hazardous Waste Sites. U.S. Environmental Protection Agency, Office of Emergency and Remedial Response. OSWER 9285.6-10. December. USEPA. 2004. Risk Assessment Guidance for Superfund Volume I; Human Health Evaluation Manual (Part 3, Supplemental Guidance for Dermal Risk Assessment). Final. July. USEPA 2005. Estimation of Relative Bioavailability of Arsenic in Soil and Soil-Like Materials by In Vivo and In Vitro Methods. USEPA Review Draft. March. USEPA. 2008. Baseline Human Health Risk Assessment for the Standard Mine Site, Gunnison County, CO. Report prepared by USEPA Region 8 with technical support from SRC, Inc. March 19, 2008. USEPA. 2009a. Risk Assessment Guidance for Superfund, Volume I: Human Health Evaluation Manual (Part F, Supplemental Guidance for Inhalation Risk Assessment). U.S. Environmental Protection Agency, Office of Superfund Remediation and Technology Innovation. EPA-540-R-070-002. OSWER 9285.7-82. January. http://www.epa.gov/oswer/riskassessment/ragsf/index.htm USEPA. 2009b. USEPA Regional Screening Levels for Chemical Contaminates at Superfund Sites (last updated April 2009). Electronic data downloaded from http://www.epa.gov/reg3hwmd/risk/human/index.htm.
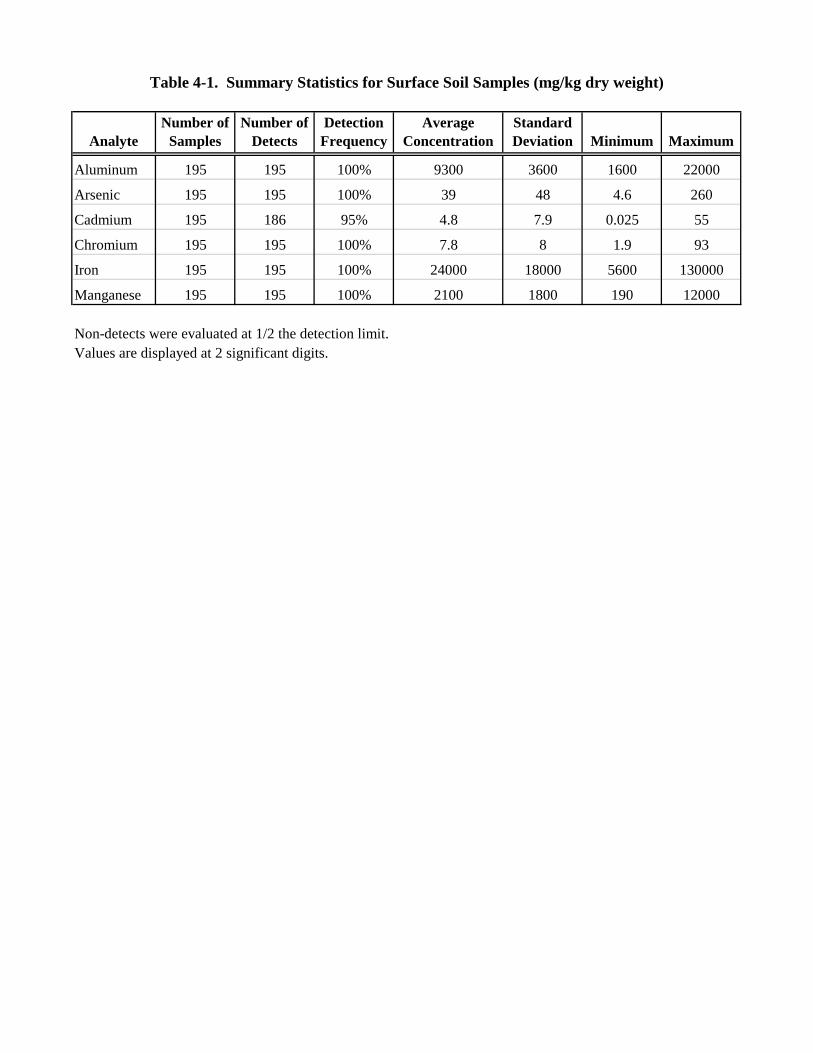
AnalyteNumber of
SamplesNumber of
DetectsDetection
FrequencyAverage
ConcentrationStandard Deviation Minimum Maximum
Aluminum 195 195 100% 9300 3600 1600 22000
Arsenic 195 195 100% 39 48 4.6 260
Cadmium 195 186 95% 4.8 7.9 0.025 55
Chromium 195 195 100% 7.8 8 1.9 93
Iron 195 195 100% 24000 18000 5600 130000
Manganese 195 195 100% 2100 1800 190 12000
Non-detects were evaluated at 1/2 the detection limit.Values are displayed at 2 significant digits.
Table 4-1. Summary Statistics for Surface Soil Samples (mg/kg dry weight)
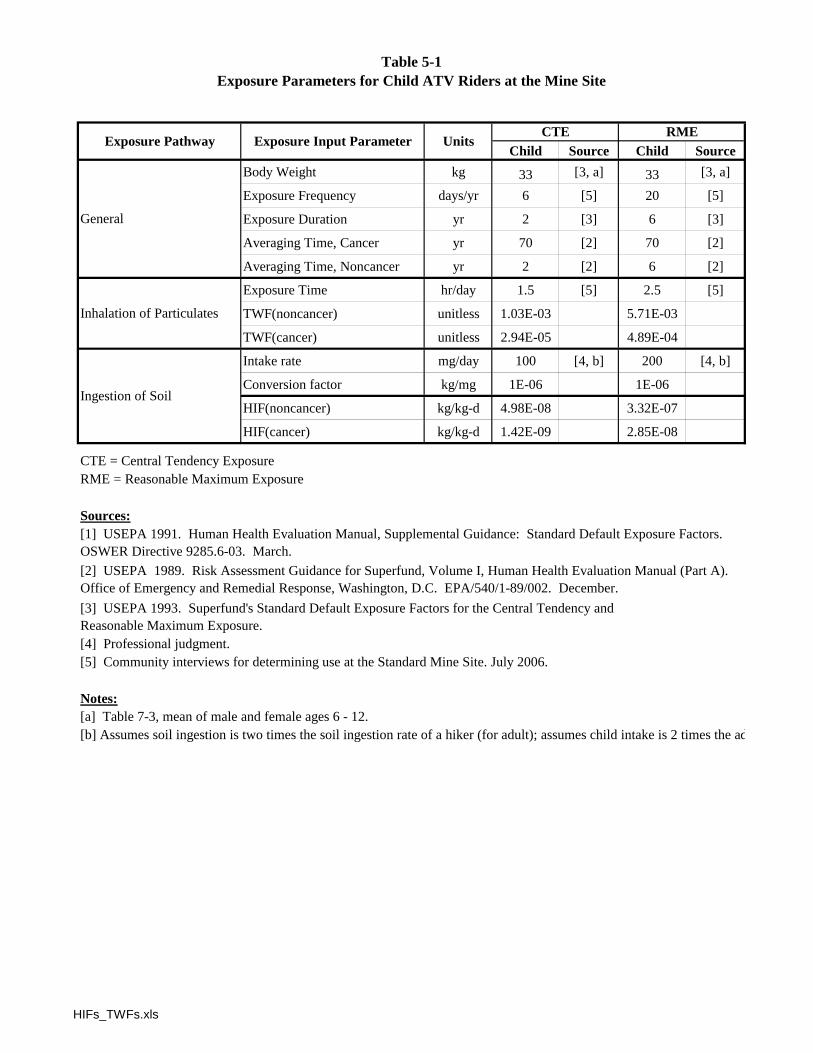
Child Source Child SourceBody Weight kg 33 [3, a] 33 [3, a]
Exposure Frequency days/yr 6 [5] 20 [5]
Exposure Duration yr 2 [3] 6 [3]
Averaging Time, Cancer yr 70 [2] 70 [2]
Averaging Time, Noncancer yr 2 [2] 6 [2]
Exposure Time hr/day 1.5 [5] 2.5 [5]
TWF(noncancer) unitless 1.03E-03 5.71E-03
TWF(cancer) unitless 2.94E-05 4.89E-04
Intake rate mg/day 100 [4, b] 200 [4, b]
Conversion factor kg/mg 1E-06 1E-06
HIF(noncancer) kg/kg-d 4.98E-08 3.32E-07
HIF(cancer) kg/kg-d 1.42E-09 2.85E-08
CTE = Central Tendency ExposureRME = Reasonable Maximum Exposure
Sources:
Table 5-1Exposure Parameters for Child ATV Riders at the Mine Site
[1] USEPA 1991. Human Health Evaluation Manual, Supplemental Guidance: Standard Default Exposure Factors.
General
Ingestion of Soil
Inhalation of Particulates
RMEExposure Pathway Exposure Input Parameter Units
CTE
[4] Professional judgment.
Notes:
[b] Assumes soil ingestion is two times the soil ingestion rate of a hiker (for adult); assumes child intake is 2 times the ad[a] Table 7-3, mean of male and female ages 6 - 12.
[3] USEPA 1993. Superfund's Standard Default Exposure Factors for the Central Tendency and Reasonable Maximum Exposure.
OSWER Directive 9285.6-03. March.[2] USEPA 1989. Risk Assessment Guidance for Superfund, Volume I, Human Health Evaluation Manual (Part A). Office of Emergency and Remedial Response, Washington, D.C. EPA/540/1-89/002. December.
[5] Community interviews for determining use at the Standard Mine Site. July 2006.
HIFs_TWFs.xls

Analyte Recommended UCL UCL Type
Aluminum 9,723 95% Approximate Gamma UCL
Arsenic 54 95% Chebyshev (Mean, Sd) UCL
Cadmium 7.3 95% KM (Chebyshev) UCL
Chromium 8.8 95% Modified-t UCL*
Iron 29,581 95% Chebyshev (Mean, Sd) UCL
Manganese 2,611 95% Chebyshev (Mean, Sd) UCL
Table 5-2. Summary of ProUCL Results
*95% Student's-t UCL was also recommended but this was the lower of the two recommended values.
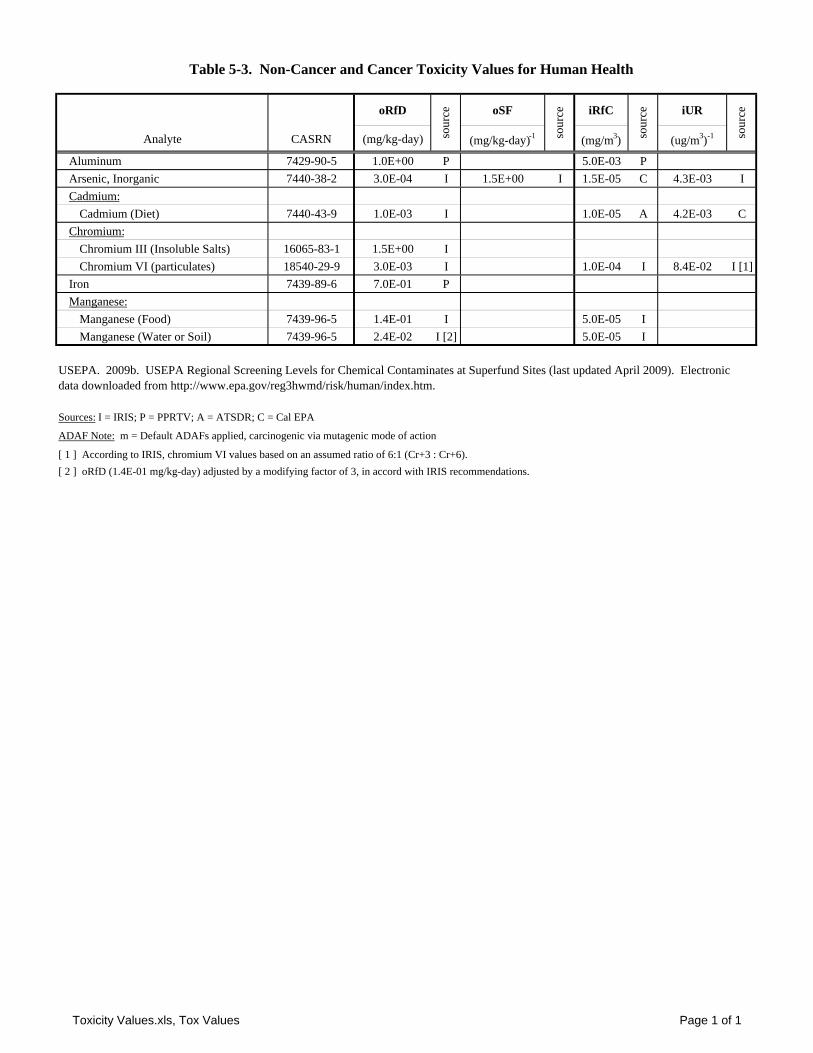
oRfD oSF iRfC iUR
Analyte CASRN (mg/kg-day) (mg/kg-day)-1 (mg/m3) (ug/m3)-1
Aluminum 7429-90-5 1.0E+00 P 5.0E-03 PArsenic, Inorganic 7440-38-2 3.0E-04 I 1.5E+00 I 1.5E-05 C 4.3E-03 ICadmium:
Cadmium (Diet) 7440-43-9 1.0E-03 I 1.0E-05 A 4.2E-03 CChromium:
Chromium III (Insoluble Salts) 16065-83-1 1.5E+00 IChromium VI (particulates) 18540-29-9 3.0E-03 I 1.0E-04 I 8.4E-02 I [1]
Iron 7439-89-6 7.0E-01 PManganese:
Manganese (Food) 7439-96-5 1.4E-01 I 5.0E-05 IManganese (Water or Soil) 7439-96-5 2.4E-02 I [2] 5.0E-05 I
Sources: I = IRIS; P = PPRTV; A = ATSDR; C = Cal EPA
ADAF Note: m = Default ADAFs applied, carcinogenic via mutagenic mode of action
[ 1 ] According to IRIS, chromium VI values based on an assumed ratio of 6:1 (Cr+3 : Cr+6).[ 2 ] oRfD (1.4E-01 mg/kg-day) adjusted by a modifying factor of 3, in accord with IRIS recommendations.
Table 5-3. Non-Cancer and Cancer Toxicity Values for Human Health
sour
ce
sour
ce
sour
ce
sour
ce
USEPA. 2009b. USEPA Regional Screening Levels for Chemical Contaminates at Superfund Sites (last updated April 2009). Electronic data downloaded from http://www.epa.gov/reg3hwmd/risk/human/index.htm.
Toxicity Values.xls, Tox Values Page 1 of 1
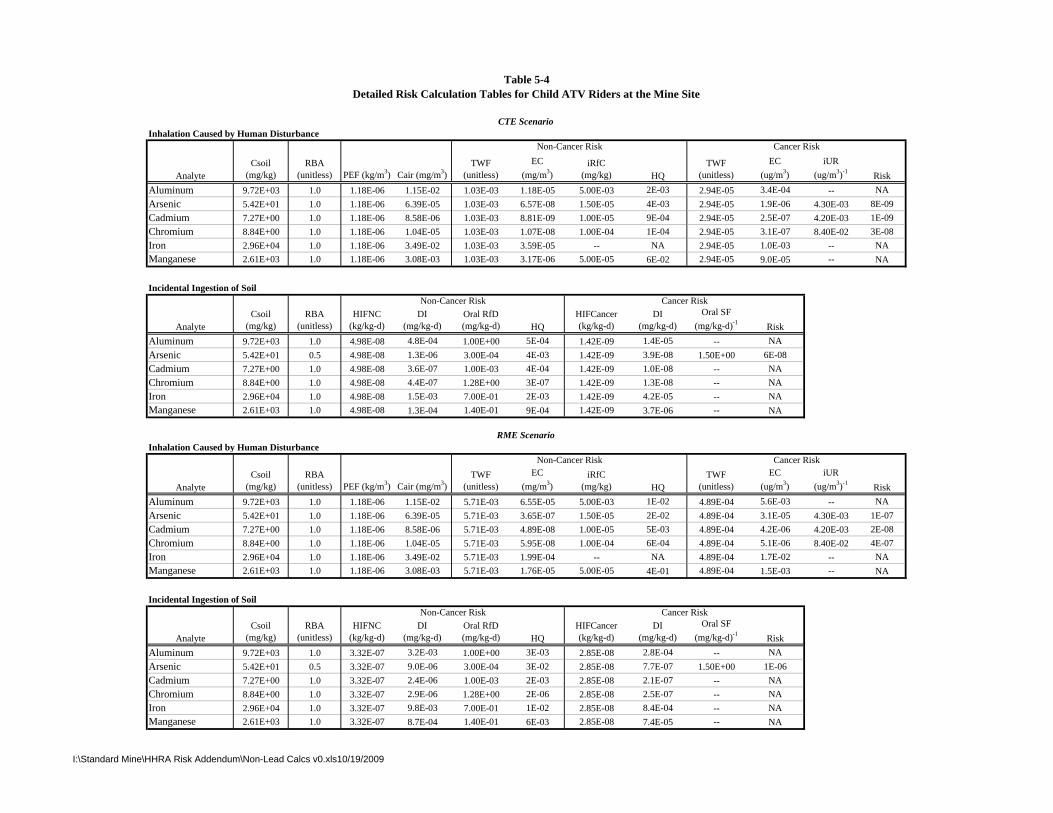
Inhalation Caused by Human Disturbance
AnalyteCsoil
(mg/kg)RBA
(unitless) PEF (kg/m3) Cair (mg/m3)TWF
(unitless)EC
(mg/m3)iRfC
(mg/kg) HQTWF
(unitless)EC
(ug/m3)iUR
(ug/m3)-1 RiskAluminum 9.72E+03 1.0 1.18E-06 1.15E-02 1.03E-03 1.18E-05 5.00E-03 2E-03 2.94E-05 3.4E-04 -- NAArsenic 5.42E+01 1.0 1.18E-06 6.39E-05 1.03E-03 6.57E-08 1.50E-05 4E-03 2.94E-05 1.9E-06 4.30E-03 8E-09Cadmium 7.27E+00 1.0 1.18E-06 8.58E-06 1.03E-03 8.81E-09 1.00E-05 9E-04 2.94E-05 2.5E-07 4.20E-03 1E-09Chromium 8.84E+00 1.0 1.18E-06 1.04E-05 1.03E-03 1.07E-08 1.00E-04 1E-04 2.94E-05 3.1E-07 8.40E-02 3E-08Iron 2.96E+04 1.0 1.18E-06 3.49E-02 1.03E-03 3.59E-05 -- NA 2.94E-05 1.0E-03 -- NAManganese 2.61E+03 1.0 1.18E-06 3.08E-03 1.03E-03 3.17E-06 5.00E-05 6E-02 2.94E-05 9.0E-05 -- NA
Incidental Ingestion of Soil
AnalyteCsoil
(mg/kg)RBA
(unitless)HIFNC
(kg/kg-d)DI
(mg/kg-d)Oral RfD (mg/kg-d) HQ
HIFCancer(kg/kg-d)
DI(mg/kg-d)
Oral SF (mg/kg-d)-1 Risk
Aluminum 9.72E+03 1.0 4.98E-08 4.8E-04 1.00E+00 5E-04 1.42E-09 1.4E-05 -- NAArsenic 5.42E+01 0.5 4.98E-08 1.3E-06 3.00E-04 4E-03 1.42E-09 3.9E-08 1.50E+00 6E-08Cadmium 7.27E+00 1.0 4.98E-08 3.6E-07 1.00E-03 4E-04 1.42E-09 1.0E-08 -- NAChromium 8.84E+00 1.0 4.98E-08 4.4E-07 1.28E+00 3E-07 1.42E-09 1.3E-08 -- NAIron 2.96E+04 1.0 4.98E-08 1.5E-03 7.00E-01 2E-03 1.42E-09 4.2E-05 -- NAManganese 2.61E+03 1.0 4.98E-08 1.3E-04 1.40E-01 9E-04 1.42E-09 3.7E-06 -- NA
Inhalation Caused by Human Disturbance
AnalyteCsoil
(mg/kg)RBA
(unitless) PEF (kg/m3) Cair (mg/m3)TWF
(unitless)EC
(mg/m3)iRfC
(mg/kg) HQTWF
(unitless)EC
(ug/m3)iUR
(ug/m3)-1 RiskAluminum 9.72E+03 1.0 1.18E-06 1.15E-02 5.71E-03 6.55E-05 5.00E-03 1E-02 4.89E-04 5.6E-03 -- NAArsenic 5.42E+01 1.0 1.18E-06 6.39E-05 5.71E-03 3.65E-07 1.50E-05 2E-02 4.89E-04 3.1E-05 4.30E-03 1E-07Cadmium 7.27E+00 1.0 1.18E-06 8.58E-06 5.71E-03 4.89E-08 1.00E-05 5E-03 4.89E-04 4.2E-06 4.20E-03 2E-08Chromium 8.84E+00 1.0 1.18E-06 1.04E-05 5.71E-03 5.95E-08 1.00E-04 6E-04 4.89E-04 5.1E-06 8.40E-02 4E-07Iron 2.96E+04 1.0 1.18E-06 3.49E-02 5.71E-03 1.99E-04 -- NA 4.89E-04 1.7E-02 -- NAManganese 2.61E+03 1.0 1.18E-06 3.08E-03 5.71E-03 1.76E-05 5.00E-05 4E-01 4.89E-04 1.5E-03 -- NA
Incidental Ingestion of Soil
AnalyteCsoil
(mg/kg)RBA
(unitless)HIFNC
(kg/kg-d)DI
(mg/kg-d)Oral RfD (mg/kg-d) HQ
HIFCancer(kg/kg-d)
DI(mg/kg-d)
Oral SF (mg/kg-d)-1 Risk
Aluminum 9.72E+03 1.0 3.32E-07 3.2E-03 1.00E+00 3E-03 2.85E-08 2.8E-04 -- NAArsenic 5.42E+01 0.5 3.32E-07 9.0E-06 3.00E-04 3E-02 2.85E-08 7.7E-07 1.50E+00 1E-06Cadmium 7.27E+00 1.0 3.32E-07 2.4E-06 1.00E-03 2E-03 2.85E-08 2.1E-07 -- NAChromium 8.84E+00 1.0 3.32E-07 2.9E-06 1.28E+00 2E-06 2.85E-08 2.5E-07 -- NAIron 2.96E+04 1.0 3.32E-07 9.8E-03 7.00E-01 1E-02 2.85E-08 8.4E-04 -- NAManganese 2.61E+03 1.0 3.32E-07 8.7E-04 1.40E-01 6E-03 2.85E-08 7.4E-05 -- NA
Table 5-4Detailed Risk Calculation Tables for Child ATV Riders at the Mine Site
CTE Scenario
RME Scenario
Cancer RiskNon-Cancer Risk
Cancer Risk
Cancer RiskNon-Cancer Risk
Non-Cancer Risk
Cancer RiskNon-Cancer Risk
I:\Standard Mine\HHRA Risk Addendum\Non-Lead Calcs v0.xls10/19/2009
SoilIngestion
SoilInhalation Total
SoilIngestion
SoilInhalation Total
Aluminum 5E-04 2E-03 3E-03 3E-03 1E-02 2E-02Arsenic 4E-03 4E-03 9E-03 3E-02 2E-02 5E-02Cadmium 4E-04 9E-04 1E-03 2E-03 5E-03 7E-03Chromium 3E-07 1E-04 1E-04 2E-06 6E-04 6E-04Iron 2E-03 NA 2E-03 1E-02 NA 1E-02Manganese 9E-04 6E-02 6E-02 6E-03 4E-01 4E-01Total 8E-03 7E-02 0.079 6E-02 4E-01 0.450
SoilIngestion
SoilInhalation Total
SoilIngestion
SoilInhalation Total
Aluminum NA NA NA NA NA NAArsenic 6E-08 8E-09 7E-08 1E-06 1E-07 1E-06Cadmium NA 1E-09 1E-09 NA 2E-08 2E-08Chromium NA 3E-08 3E-08 NA 4E-07 4E-07Iron NA NA NA NA NA NAManganese NA NA NA NA NA NATotal 6E-08 3E-08 9E-08 1E-06 6E-07 2E-06
NA = data not available
Chemical of Potential Concern
CTE Scenario RME Scenario
Table 5-5. Summary of Risks to Child ATV Riders
Panel A: Non-Cancer Risks
Panel B: Cancer Risks
CTE Scenario RME ScenarioChemical of
Potential Concern
I:\Standard Mine\HHRA Risk Addendum\Non-Lead Calcs v0.xls10/19/2009
Elk Basin
Keystone Mine
Coal Creek
Crested Butte
StandardMine
Elk Creek
MountEmmons
FlowFlow
Figure 2-1. Site Location Map
Location of Standard Mine
In Gunnison County, Colorado
0 500 1,000 1,500 2,000250
MetersProjection: UTM Zone 13NDatum: NAD 1983
!!!
!
!
!!!!!!
!!
!!!
!
!
!!!
!
!
!!
!!
!!
!!!!
!
!!!!!!!
!!
!
!
!
!
!
!
!
!
!
!
!
!!
!
!!
!
!
!
!
!!
!!
!
!!
!!
!!
!!
!!
!!
!
!
!
!
!
!
!
!
!!
!
!
!
!
!
!
!
!!
!
!
!
!
!
!!
!
!
!
!!
!
!!
!
!
!
!
!
!
!
!
!
!!!
!
!
!
!
!
!!
!!
!!
!!!!
!!!!!
!!!!
!!!!
!!!
!!
!!
!!!
!!!!
!!!!
!!!!
!!!
!!
!!
!!!!
!!!!
!
!
Figure 4-1. Sample Locations from
2006 and 2009Sampling Events
0 100 200 300 400 50050Feet ±
Projection: NAD 1983 UTM Zone 13N
!( 2006
!( 2009
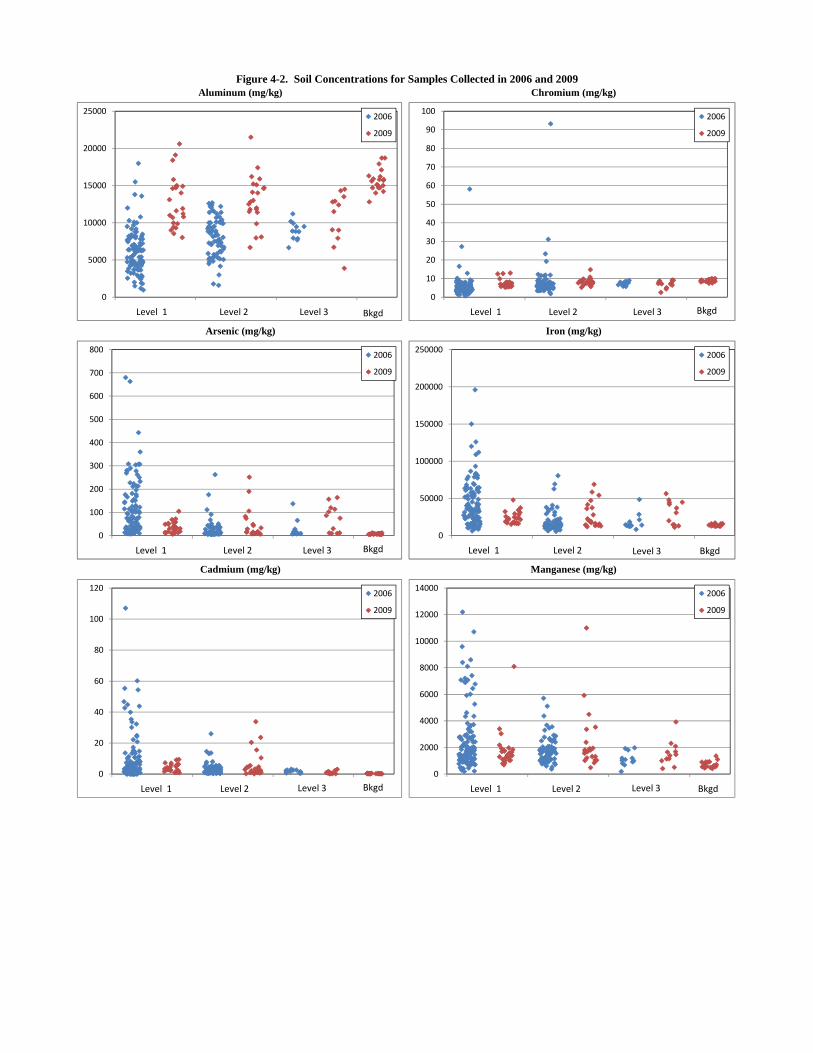
Figure 4-2. Soil Concentrations for Samples Collected in 2006 and 2009Aluminum (mg/kg)
Arsenic (mg/kg)
Chromium (mg/kg)
Iron (mg/kg)
0
5000
10000
15000
20000
250002006
2009
Level 1 Level 3Level 2 Bkgd
0
100
200
300
400
500
600
700
8002006
2009
Level 1 Level 3Level 2 Bkgd
0
10
20
30
40
50
60
70
80
90
1002006
2009
Level 1 Level 3Level 2 Bkgd
0
50000
100000
150000
200000
2500002006
2009
Level 1 Level 3Level 2 Bkgd
Manganese (mg/kg)Cadmium (mg/kg)
0
5000
10000
15000
20000
250002006
2009
Level 1 Level 3Level 2 Bkgd
0
100
200
300
400
500
600
700
8002006
2009
Level 1 Level 3Level 2 Bkgd
0
20
40
60
80
100
1202006
2009
Level 1 Level 3Level 2 Bkgd
0
10
20
30
40
50
60
70
80
90
1002006
2009
Level 1 Level 3Level 2 Bkgd
0
50000
100000
150000
200000
2500002006
2009
Level 1 Level 3Level 2 Bkgd
0
2000
4000
6000
8000
10000
12000
140002006
2009
Level 1 Level 3Level 2 Bkgd
Raw data are provided electronically within the file "Standard Mine HH Raw Data.xls"
APPENDIX A
ANALYTICAL DATA
A_Cover Page.xls
Panel A. Exposure TimeNumber of Hours per Even Number of Responders
< 5 all others10 124 1
Panel B. Exposure FrequencyNumber of Days per Year Number of Responders
< 5 116 -10 311-15 216 - 20 0
20+ 1
Panel C. Exposure DurationNumber of Years Number of Responders
1 - 5 96 - 10 311 - 20 3
20+ 5
Appendix B. Summary of Community Survey (29 Responders)
I:\Standard Mine\HHRA Risk Addendum\Appendices\Appendix B - Community Interview Summary\Community Survey Summary.xls10/19/2009
APPENDIX B
COMMUNITY INTERVIEWS FOR DETERMINING LAND USE AT THE STANDARD MINE SITE
July 27, 2006
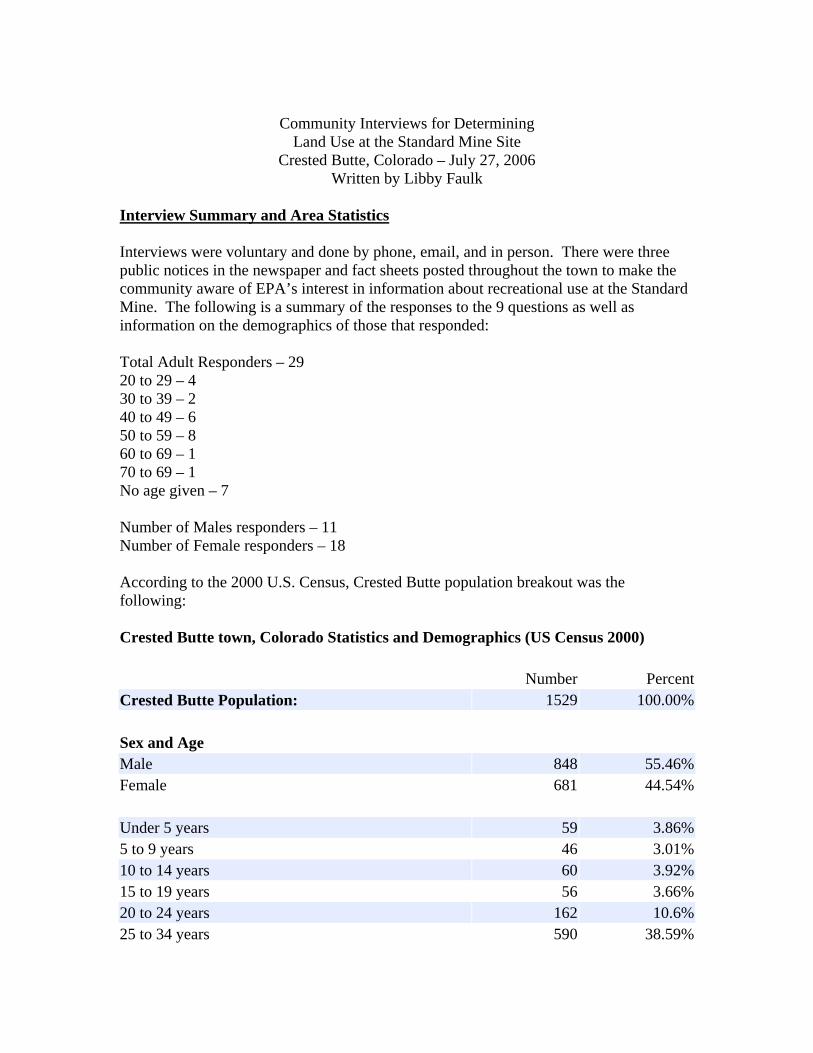
Community Interviews for Determining
Land Use at the Standard Mine Site Crested Butte, Colorado – July 27, 2006
Written by Libby Faulk Interview Summary and Area Statistics Interviews were voluntary and done by phone, email, and in person. There were three public notices in the newspaper and fact sheets posted throughout the town to make the community aware of EPA’s interest in information about recreational use at the Standard Mine. The following is a summary of the responses to the 9 questions as well as information on the demographics of those that responded: Total Adult Responders – 29 20 to 29 – 4 30 to 39 – 2 40 to 49 – 6 50 to 59 – 8 60 to 69 – 1 70 to 69 – 1 No age given – 7 Number of Males responders – 11 Number of Female responders – 18 According to the 2000 U.S. Census, Crested Butte population breakout was the following: Crested Butte town, Colorado Statistics and Demographics (US Census 2000) Number PercentCrested Butte Population: 1529 100.00% Sex and Age Male 848 55.46%Female 681 44.54% Under 5 years 59 3.86%5 to 9 years 46 3.01%10 to 14 years 60 3.92%15 to 19 years 56 3.66%20 to 24 years 162 10.6%25 to 34 years 590 38.59%
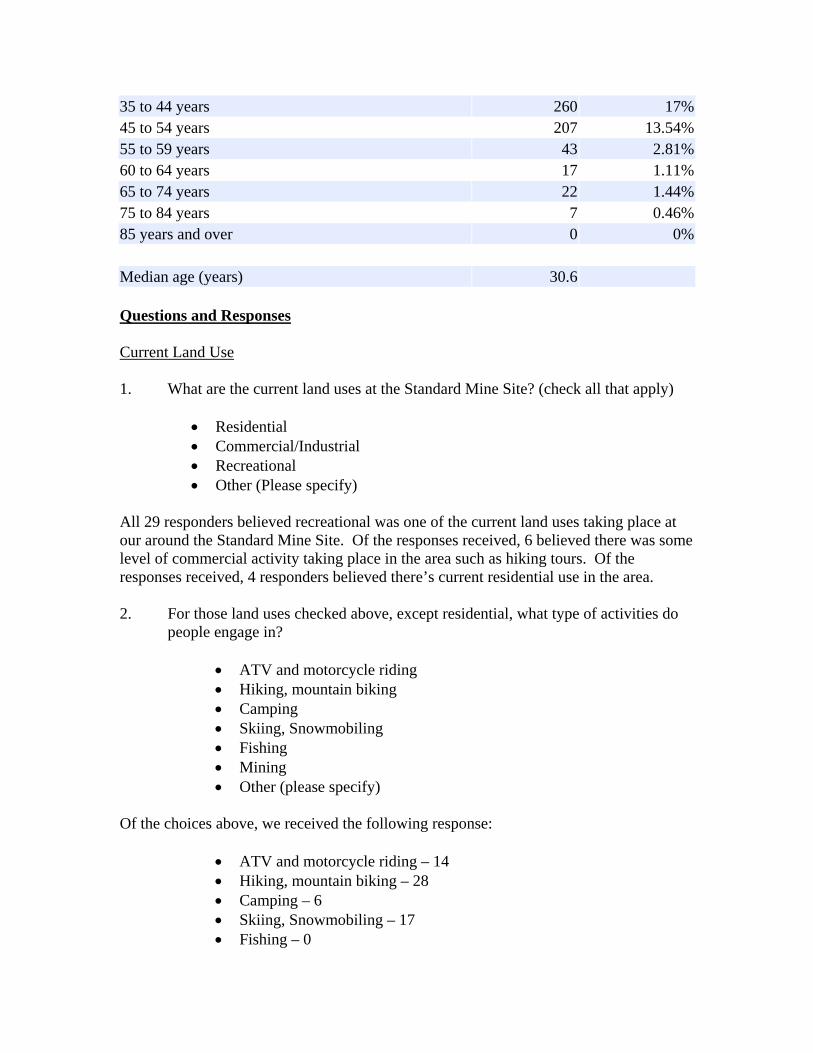
35 to 44 years 260 17%45 to 54 years 207 13.54%55 to 59 years 43 2.81%60 to 64 years 17 1.11%65 to 74 years 22 1.44%75 to 84 years 7 0.46%85 years and over 0 0% Median age (years) 30.6 Questions and Responses Current Land Use 1. What are the current land uses at the Standard Mine Site? (check all that apply)
• Residential • Commercial/Industrial • Recreational • Other (Please specify)
All 29 responders believed recreational was one of the current land uses taking place at our around the Standard Mine Site. Of the responses received, 6 believed there was some level of commercial activity taking place in the area such as hiking tours. Of the responses received, 4 responders believed there’s current residential use in the area. 2. For those land uses checked above, except residential, what type of activities do
people engage in?
• ATV and motorcycle riding • Hiking, mountain biking • Camping • Skiing, Snowmobiling • Fishing • Mining • Other (please specify)
Of the choices above, we received the following response:
• ATV and motorcycle riding – 14 • Hiking, mountain biking – 28 • Camping – 6 • Skiing, Snowmobiling – 17 • Fishing – 0
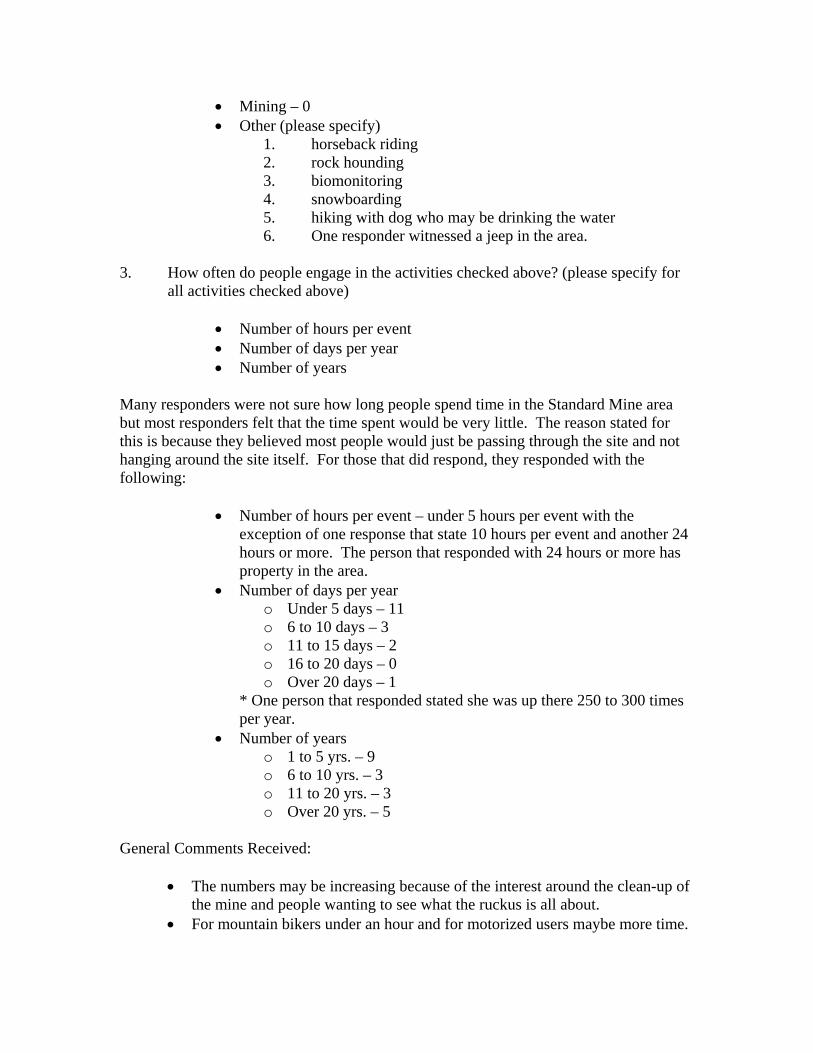
• Mining – 0 • Other (please specify)
1. horseback riding 2. rock hounding 3. biomonitoring 4. snowboarding 5. hiking with dog who may be drinking the water 6. One responder witnessed a jeep in the area.
3. How often do people engage in the activities checked above? (please specify for
all activities checked above)
• Number of hours per event • Number of days per year • Number of years
Many responders were not sure how long people spend time in the Standard Mine area but most responders felt that the time spent would be very little. The reason stated for this is because they believed most people would just be passing through the site and not hanging around the site itself. For those that did respond, they responded with the following:
• Number of hours per event – under 5 hours per event with the exception of one response that state 10 hours per event and another 24 hours or more. The person that responded with 24 hours or more has property in the area.
• Number of days per year o Under 5 days – 11 o 6 to 10 days – 3 o 11 to 15 days – 2 o 16 to 20 days – 0 o Over 20 days – 1
* One person that responded stated she was up there 250 to 300 times per year.
• Number of years o 1 to 5 yrs. – 9 o 6 to 10 yrs. – 3 o 11 to 20 yrs. – 3 o Over 20 yrs. – 5
General Comments Received:
• The numbers may be increasing because of the interest around the clean-up of the mine and people wanting to see what the ruckus is all about.
• For mountain bikers under an hour and for motorized users maybe more time.

• Some probably just pass right on through or turnaround because they missed the trail head to Copley Lake.
4. Do you bring your children with you? If so, what are their ages? Of those that responded to this question, 12 do not have children. For those that have children, 11 of them said they do not take their children with them to that area and one said their child has only been to Copley Lake which is below the Standard Mine, another responder said she took her daughter there once at age 11 but she’s not 28, and one responder said that her kids have been up in the area a long time ago but not recently. Her children are now ages 14 and 18. I did not get the ages of the children where the parents stated that they have never taken their children up to the Standard Mine site. General Comments:
• The area of hiking is too steep for children to hike. • Don’t have any and have never seen any up there when I’ve been up there. It
seems that the hike would be too steep for children. • Too far up and steep. • Only up to Copley Lake • We shouldn’t assume that children are not hiking in the area because there are
quite a few families that do lots of hiking in the area. • You’ll see kids on ATVs and motorbikes riding around.
5. If you fish, where do you fish? (Please describe location of where on site fishing
is occurring, for example, at the site itself, along Elk Creek below the site, Coal Creek).
No one responded as having fished in the area. 6. How many fish do you catch each year from this site? Do you eat all of the fish
you catch? When you prepare the fish, do you prepare just the fillets or do you include other parts of the fish?
See response to #5 above. Future Land Use 1. What do you think are the most likely land uses for the Standard Mine site in the
future? (Check all that apply)
• Residential • Commercial/Industrial • Recreational • Other (please specify)

All 29 responders believed that in the future, recreational use would continue to be the main use in and around the Standard Mine area. Of all the responders, 9 of the responders felt that residential development could occur in the area, 7 felt there could be commercial interest such as tours in the area. 2. For each of the land uses checked above, please explain the basis for your answer.
For example, if residential land use is checked, is this based on zoning ordinances, county planning, recent property purchases, development plans, etc.
Many of the responses received to this question were the same from each responder. The comments received were the following:
• Continue to be the same recreational activities as is occurring in the area now. • There could be an increase in commercial activity for touring in the area. • The Township of Irwin is close by and growing and so residential
development is bound to spill over into the Elk Basin area. • There’s private property in the area so there will probably be an increase in
residential development at some point. • You may see more tours for historical and educational purposes. • Recreational only - Climate, location and elevation. • Will depend on road improvements to the area that would make it more
accessible. • Doubts much due to steepness of the area and difficulty in getting to the mine
site. • Recreational only - Location, terrain, and precipitation. • Recreational only – location, accessibility, and demand.
3. For those land uses checked above, except residential, what are the most likely
activities you think people may engage in?
• ATV and motorcycle riding • Hiking, mountain biking • Camping • Skiing, Snowmobiling • Fishing • Mining • Other (please specify)
Of the choices above, we received the following response:
• ATV and motorcycle riding – 17 • Hiking, mountain biking – 29 • Camping – 10 • Skiing, Snowmobiling – 19 • Fishing – 0
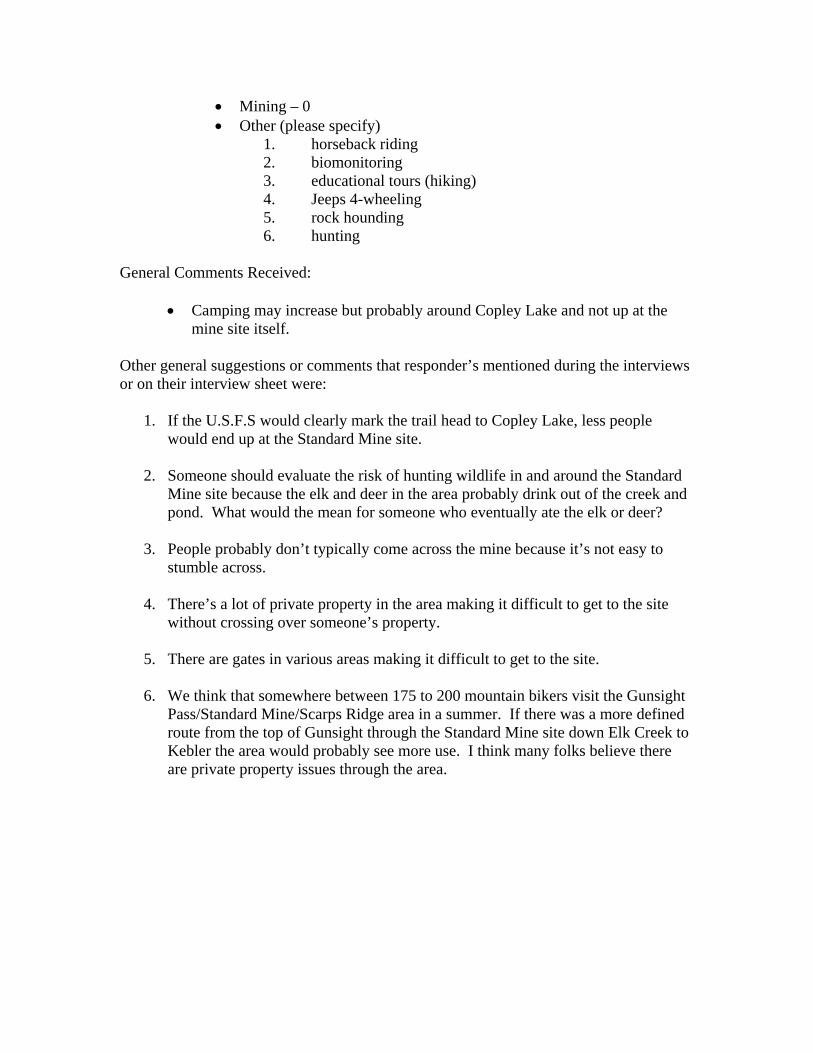
• Mining – 0 • Other (please specify)
1. horseback riding 2. biomonitoring 3. educational tours (hiking) 4. Jeeps 4-wheeling 5. rock hounding 6. hunting
General Comments Received:
• Camping may increase but probably around Copley Lake and not up at the mine site itself.
Other general suggestions or comments that responder’s mentioned during the interviews or on their interview sheet were:
1. If the U.S.F.S would clearly mark the trail head to Copley Lake, less people would end up at the Standard Mine site.
2. Someone should evaluate the risk of hunting wildlife in and around the Standard
Mine site because the elk and deer in the area probably drink out of the creek and pond. What would the mean for someone who eventually ate the elk or deer?
3. People probably don’t typically come across the mine because it’s not easy to
stumble across.
4. There’s a lot of private property in the area making it difficult to get to the site without crossing over someone’s property.
5. There are gates in various areas making it difficult to get to the site.
6. We think that somewhere between 175 to 200 mountain bikers visit the Gunsight
Pass/Standard Mine/Scarps Ridge area in a summer. If there was a more defined route from the top of Gunsight through the Standard Mine site down Elk Creek to Kebler the area would probably see more use. I think many folks believe there are private property issues through the area.

APPENDIX C
Detailed ProUCL Output
C_Cover Page.xls
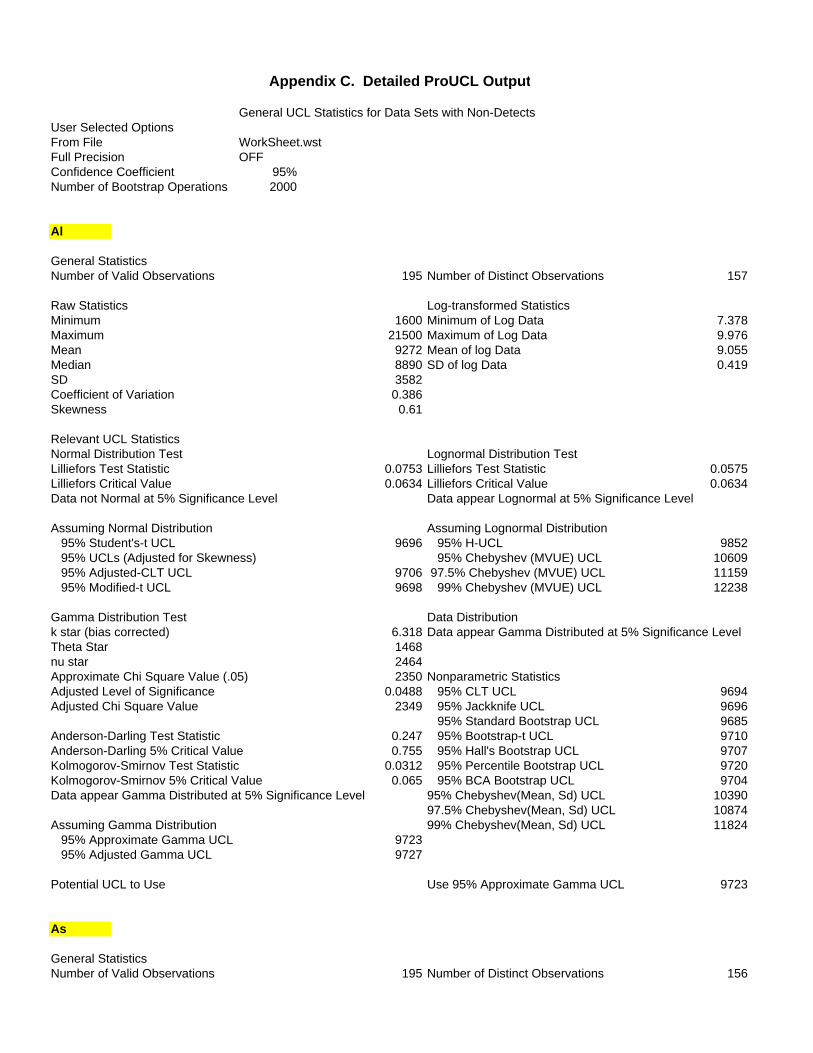
General UCL Statistics for Data Sets with Non-DetectsUser Selected OptionsFrom File WorkSheet.wstFull Precision OFFConfidence Coefficient 95%Number of Bootstrap Operations 2000
Al
General StatisticsNumber of Valid Observations 195 Number of Distinct Observations 157
Raw Statistics Log-transformed StatisticsMinimum 1600 Minimum of Log Data 7.378Maximum 21500 Maximum of Log Data 9.976Mean 9272 Mean of log Data 9.055Median 8890 SD of log Data 0.419SD 3582Coefficient of Variation 0.386Skewness 0.61
Relevant UCL StatisticsNormal Distribution Test Lognormal Distribution TestLilliefors Test Statistic 0.0753 Lilliefors Test Statistic 0.0575Lilliefors Critical Value 0.0634 Lilliefors Critical Value 0.0634Data not Normal at 5% Significance Level Data appear Lognormal at 5% Significance Level
Assuming Normal Distribution Assuming Lognormal Distribution 95% Student's-t UCL 9696 95% H-UCL 9852 95% UCLs (Adjusted for Skewness) 95% Chebyshev (MVUE) UCL 10609 95% Adjusted-CLT UCL 9706 97.5% Chebyshev (MVUE) UCL 11159 95% Modified-t UCL 9698 99% Chebyshev (MVUE) UCL 12238
Gamma Distribution Test Data Distributionk star (bias corrected) 6.318 Data appear Gamma Distributed at 5% Significance LevelTheta Star 1468nu star 2464Approximate Chi Square Value (.05) 2350 Nonparametric StatisticsAdjusted Level of Significance 0.0488 95% CLT UCL 9694Adjusted Chi Square Value 2349 95% Jackknife UCL 9696
95% Standard Bootstrap UCL 9685Anderson-Darling Test Statistic 0.247 95% Bootstrap-t UCL 9710Anderson-Darling 5% Critical Value 0.755 95% Hall's Bootstrap UCL 9707Kolmogorov-Smirnov Test Statistic 0.0312 95% Percentile Bootstrap UCL 9720Kolmogorov-Smirnov 5% Critical Value 0.065 95% BCA Bootstrap UCL 9704Data appear Gamma Distributed at 5% Significance Level 95% Chebyshev(Mean, Sd) UCL 10390
97.5% Chebyshev(Mean, Sd) UCL 10874Assuming Gamma Distribution 99% Chebyshev(Mean, Sd) UCL 11824 95% Approximate Gamma UCL 9723 95% Adjusted Gamma UCL 9727
Potential UCL to Use Use 95% Approximate Gamma UCL 9723
As
General StatisticsNumber of Valid Observations 195 Number of Distinct Observations 156
Appendix C. Detailed ProUCL Output
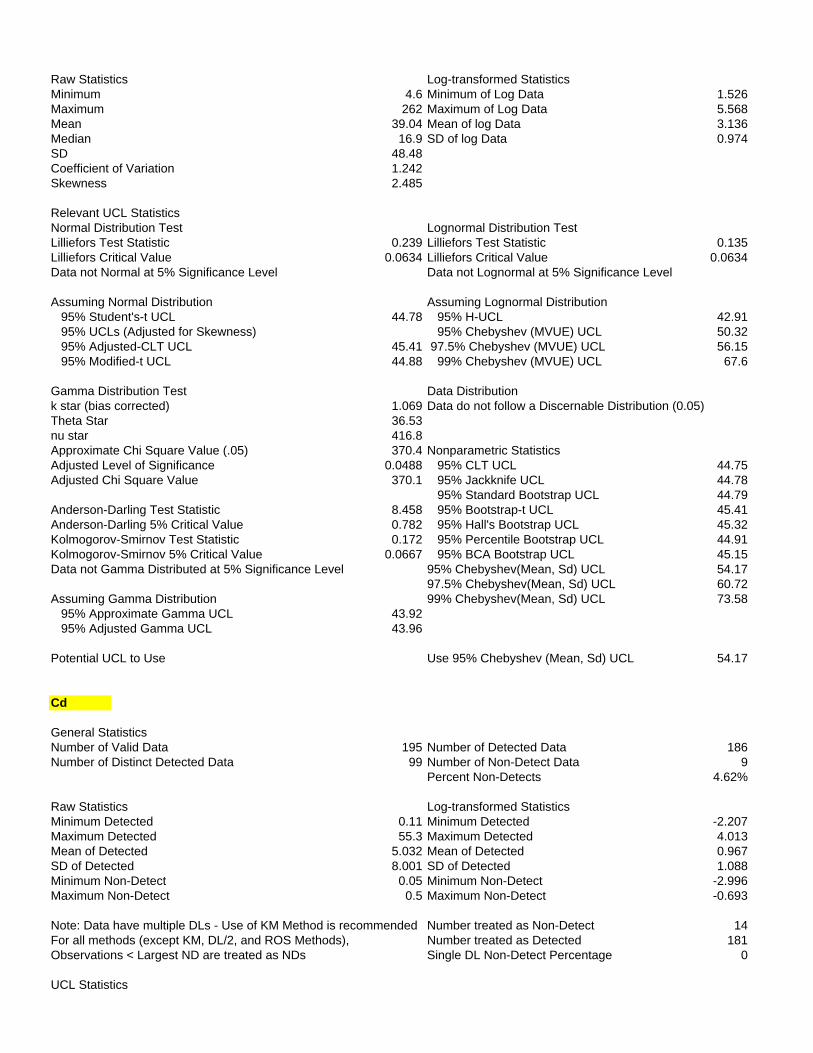
Raw Statistics Log-transformed StatisticsMinimum 4.6 Minimum of Log Data 1.526Maximum 262 Maximum of Log Data 5.568Mean 39.04 Mean of log Data 3.136Median 16.9 SD of log Data 0.974SD 48.48Coefficient of Variation 1.242Skewness 2.485
Relevant UCL StatisticsNormal Distribution Test Lognormal Distribution TestLilliefors Test Statistic 0.239 Lilliefors Test Statistic 0.135Lilliefors Critical Value 0.0634 Lilliefors Critical Value 0.0634Data not Normal at 5% Significance Level Data not Lognormal at 5% Significance Level
Assuming Normal Distribution Assuming Lognormal Distribution 95% Student's-t UCL 44.78 95% H-UCL 42.91 95% UCLs (Adjusted for Skewness) 95% Chebyshev (MVUE) UCL 50.32 95% Adjusted-CLT UCL 45.41 97.5% Chebyshev (MVUE) UCL 56.15 95% Modified-t UCL 44.88 99% Chebyshev (MVUE) UCL 67.6
Gamma Distribution Test Data Distributionk star (bias corrected) 1.069 Data do not follow a Discernable Distribution (0.05)Theta Star 36.53nu star 416.8Approximate Chi Square Value (.05) 370.4 Nonparametric StatisticsAdjusted Level of Significance 0.0488 95% CLT UCL 44.75Adjusted Chi Square Value 370.1 95% Jackknife UCL 44.78
95% Standard Bootstrap UCL 44.79Anderson-Darling Test Statistic 8.458 95% Bootstrap-t UCL 45.41Anderson-Darling 5% Critical Value 0.782 95% Hall's Bootstrap UCL 45.32Kolmogorov-Smirnov Test Statistic 0.172 95% Percentile Bootstrap UCL 44.91Kolmogorov-Smirnov 5% Critical Value 0.0667 95% BCA Bootstrap UCL 45.15Data not Gamma Distributed at 5% Significance Level 95% Chebyshev(Mean, Sd) UCL 54.17
97.5% Chebyshev(Mean, Sd) UCL 60.72Assuming Gamma Distribution 99% Chebyshev(Mean, Sd) UCL 73.58 95% Approximate Gamma UCL 43.92 95% Adjusted Gamma UCL 43.96
Potential UCL to Use Use 95% Chebyshev (Mean, Sd) UCL 54.17
Cd
General StatisticsNumber of Valid Data 195 Number of Detected Data 186Number of Distinct Detected Data 99 Number of Non-Detect Data 9
Percent Non-Detects 4.62%
Raw Statistics Log-transformed StatisticsMinimum Detected 0.11 Minimum Detected -2.207Maximum Detected 55.3 Maximum Detected 4.013Mean of Detected 5.032 Mean of Detected 0.967SD of Detected 8.001 SD of Detected 1.088Minimum Non-Detect 0.05 Minimum Non-Detect -2.996Maximum Non-Detect 0.5 Maximum Non-Detect -0.693
Note: Data have multiple DLs - Use of KM Method is recommended Number treated as Non-Detect 14For all methods (except KM, DL/2, and ROS Methods), Number treated as Detected 181Observations < Largest ND are treated as NDs Single DL Non-Detect Percentage 0
UCL Statistics
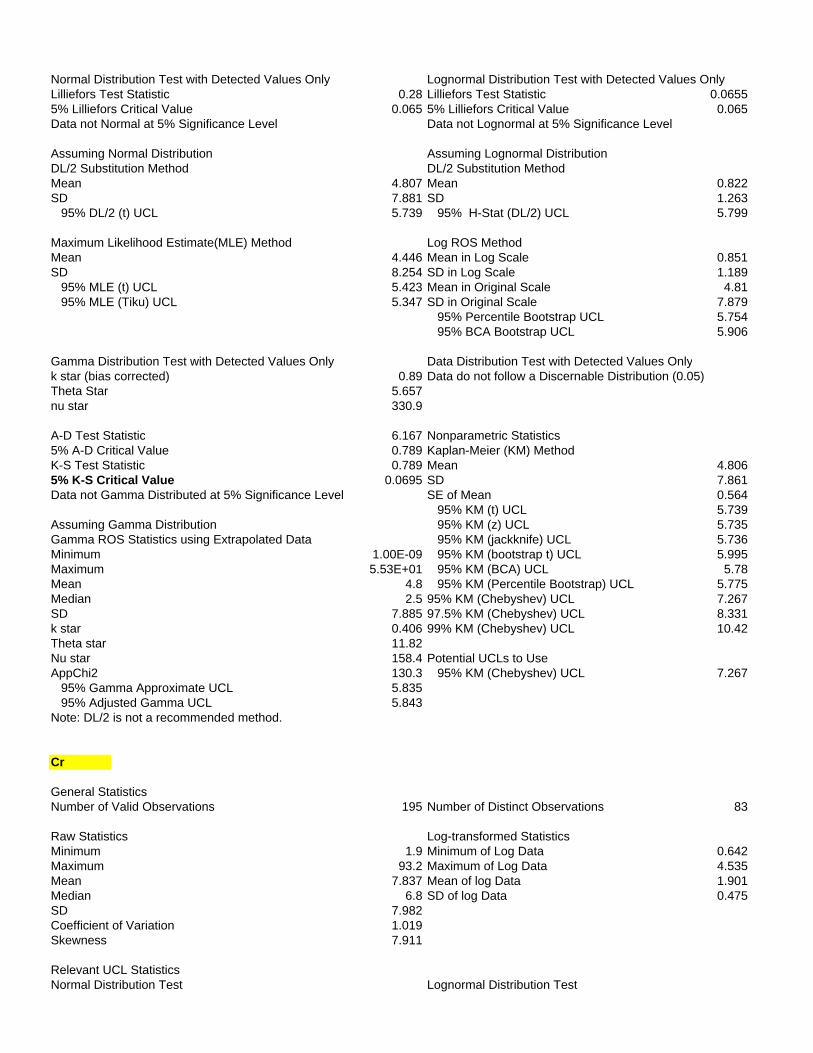
Normal Distribution Test with Detected Values Only Lognormal Distribution Test with Detected Values OnlyLilliefors Test Statistic 0.28 Lilliefors Test Statistic 0.06555% Lilliefors Critical Value 0.065 5% Lilliefors Critical Value 0.065Data not Normal at 5% Significance Level Data not Lognormal at 5% Significance Level
Assuming Normal Distribution Assuming Lognormal DistributionDL/2 Substitution Method DL/2 Substitution MethodMean 4.807 Mean 0.822SD 7.881 SD 1.263 95% DL/2 (t) UCL 5.739 95% H-Stat (DL/2) UCL 5.799
Maximum Likelihood Estimate(MLE) Method Log ROS MethodMean 4.446 Mean in Log Scale 0.851SD 8.254 SD in Log Scale 1.189 95% MLE (t) UCL 5.423 Mean in Original Scale 4.81 95% MLE (Tiku) UCL 5.347 SD in Original Scale 7.879
95% Percentile Bootstrap UCL 5.754 95% BCA Bootstrap UCL 5.906
Gamma Distribution Test with Detected Values Only Data Distribution Test with Detected Values Onlyk star (bias corrected) 0.89 Data do not follow a Discernable Distribution (0.05)Theta Star 5.657nu star 330.9
A-D Test Statistic 6.167 Nonparametric Statistics5% A-D Critical Value 0.789 Kaplan-Meier (KM) MethodK-S Test Statistic 0.789 Mean 4.8065% K-S Critical Value 0.0695 SD 7.861Data not Gamma Distributed at 5% Significance Level SE of Mean 0.564
95% KM (t) UCL 5.739Assuming Gamma Distribution 95% KM (z) UCL 5.735Gamma ROS Statistics using Extrapolated Data 95% KM (jackknife) UCL 5.736Minimum 1.00E-09 95% KM (bootstrap t) UCL 5.995Maximum 5.53E+01 95% KM (BCA) UCL 5.78Mean 4.8 95% KM (Percentile Bootstrap) UCL 5.775Median 2.5 95% KM (Chebyshev) UCL 7.267SD 7.885 97.5% KM (Chebyshev) UCL 8.331k star 0.406 99% KM (Chebyshev) UCL 10.42Theta star 11.82Nu star 158.4 Potential UCLs to UseAppChi2 130.3 95% KM (Chebyshev) UCL 7.267 95% Gamma Approximate UCL 5.835 95% Adjusted Gamma UCL 5.843Note: DL/2 is not a recommended method.
Cr
General StatisticsNumber of Valid Observations 195 Number of Distinct Observations 83
Raw Statistics Log-transformed StatisticsMinimum 1.9 Minimum of Log Data 0.642Maximum 93.2 Maximum of Log Data 4.535Mean 7.837 Mean of log Data 1.901Median 6.8 SD of log Data 0.475SD 7.982Coefficient of Variation 1.019Skewness 7.911
Relevant UCL StatisticsNormal Distribution Test Lognormal Distribution Test
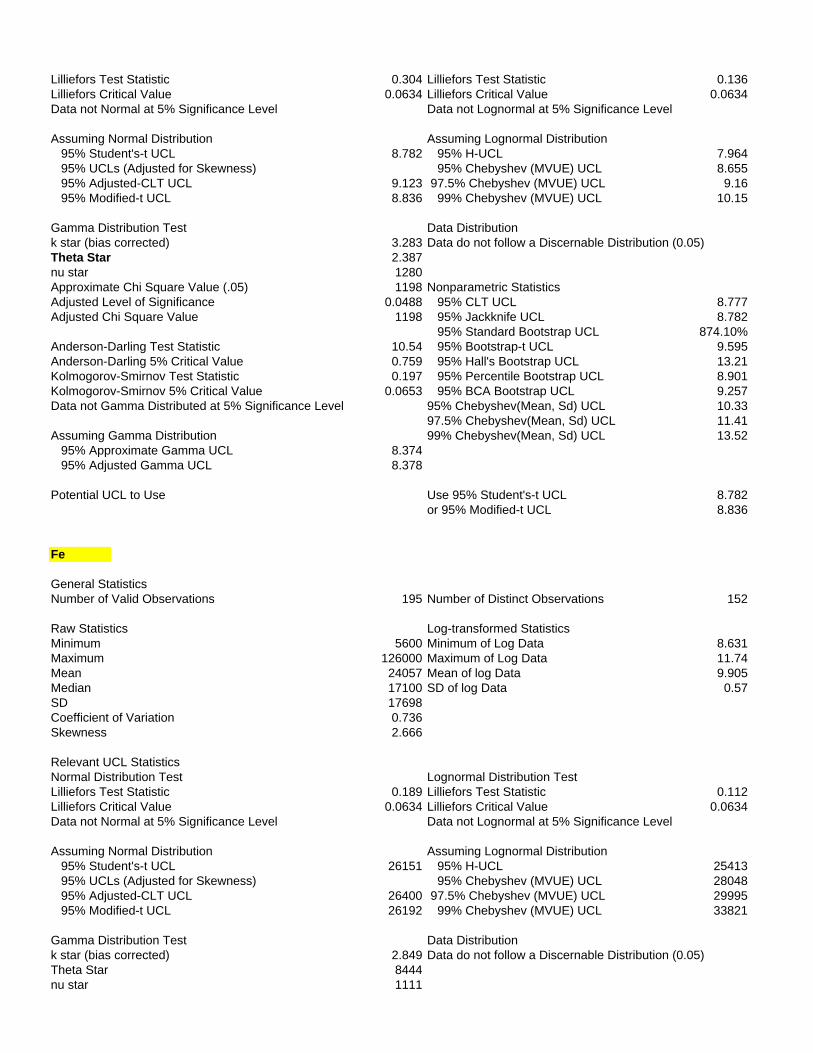
Lilliefors Test Statistic 0.304 Lilliefors Test Statistic 0.136Lilliefors Critical Value 0.0634 Lilliefors Critical Value 0.0634Data not Normal at 5% Significance Level Data not Lognormal at 5% Significance Level
Assuming Normal Distribution Assuming Lognormal Distribution 95% Student's-t UCL 8.782 95% H-UCL 7.964 95% UCLs (Adjusted for Skewness) 95% Chebyshev (MVUE) UCL 8.655 95% Adjusted-CLT UCL 9.123 97.5% Chebyshev (MVUE) UCL 9.16 95% Modified-t UCL 8.836 99% Chebyshev (MVUE) UCL 10.15
Gamma Distribution Test Data Distributionk star (bias corrected) 3.283 Data do not follow a Discernable Distribution (0.05)Theta Star 2.387nu star 1280Approximate Chi Square Value (.05) 1198 Nonparametric StatisticsAdjusted Level of Significance 0.0488 95% CLT UCL 8.777Adjusted Chi Square Value 1198 95% Jackknife UCL 8.782
95% Standard Bootstrap UCL 874.10%Anderson-Darling Test Statistic 10.54 95% Bootstrap-t UCL 9.595Anderson-Darling 5% Critical Value 0.759 95% Hall's Bootstrap UCL 13.21Kolmogorov-Smirnov Test Statistic 0.197 95% Percentile Bootstrap UCL 8.901Kolmogorov-Smirnov 5% Critical Value 0.0653 95% BCA Bootstrap UCL 9.257Data not Gamma Distributed at 5% Significance Level 95% Chebyshev(Mean, Sd) UCL 10.33
97.5% Chebyshev(Mean, Sd) UCL 11.41Assuming Gamma Distribution 99% Chebyshev(Mean, Sd) UCL 13.52 95% Approximate Gamma UCL 8.374 95% Adjusted Gamma UCL 8.378
Potential UCL to Use Use 95% Student's-t UCL 8.782or 95% Modified-t UCL 8.836
Fe
General StatisticsNumber of Valid Observations 195 Number of Distinct Observations 152
Raw Statistics Log-transformed StatisticsMinimum 5600 Minimum of Log Data 8.631Maximum 126000 Maximum of Log Data 11.74Mean 24057 Mean of log Data 9.905Median 17100 SD of log Data 0.57SD 17698Coefficient of Variation 0.736Skewness 2.666
Relevant UCL StatisticsNormal Distribution Test Lognormal Distribution TestLilliefors Test Statistic 0.189 Lilliefors Test Statistic 0.112Lilliefors Critical Value 0.0634 Lilliefors Critical Value 0.0634Data not Normal at 5% Significance Level Data not Lognormal at 5% Significance Level
Assuming Normal Distribution Assuming Lognormal Distribution 95% Student's-t UCL 26151 95% H-UCL 25413 95% UCLs (Adjusted for Skewness) 95% Chebyshev (MVUE) UCL 28048 95% Adjusted-CLT UCL 26400 97.5% Chebyshev (MVUE) UCL 29995 95% Modified-t UCL 26192 99% Chebyshev (MVUE) UCL 33821
Gamma Distribution Test Data Distributionk star (bias corrected) 2.849 Data do not follow a Discernable Distribution (0.05)Theta Star 8444nu star 1111
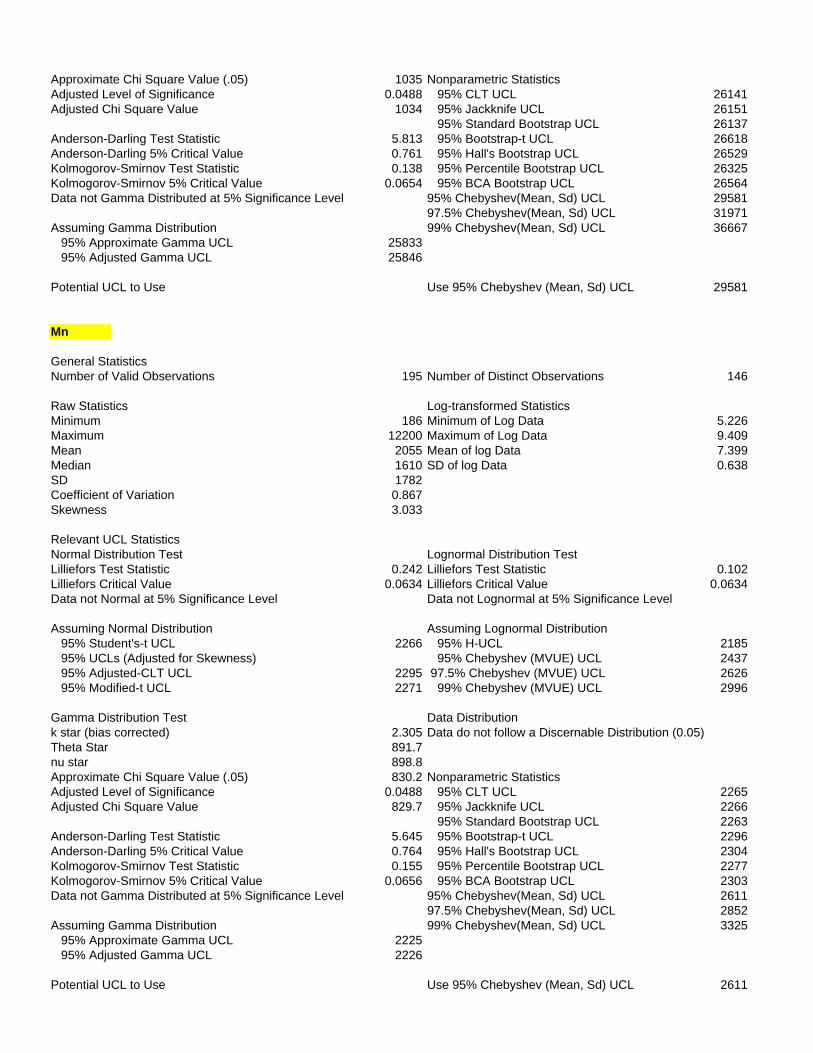
Approximate Chi Square Value (.05) 1035 Nonparametric StatisticsAdjusted Level of Significance 0.0488 95% CLT UCL 26141Adjusted Chi Square Value 1034 95% Jackknife UCL 26151
95% Standard Bootstrap UCL 26137Anderson-Darling Test Statistic 5.813 95% Bootstrap-t UCL 26618Anderson-Darling 5% Critical Value 0.761 95% Hall's Bootstrap UCL 26529Kolmogorov-Smirnov Test Statistic 0.138 95% Percentile Bootstrap UCL 26325Kolmogorov-Smirnov 5% Critical Value 0.0654 95% BCA Bootstrap UCL 26564Data not Gamma Distributed at 5% Significance Level 95% Chebyshev(Mean, Sd) UCL 29581
97.5% Chebyshev(Mean, Sd) UCL 31971Assuming Gamma Distribution 99% Chebyshev(Mean, Sd) UCL 36667 95% Approximate Gamma UCL 25833 95% Adjusted Gamma UCL 25846
Potential UCL to Use Use 95% Chebyshev (Mean, Sd) UCL 29581
Mn
General StatisticsNumber of Valid Observations 195 Number of Distinct Observations 146
Raw Statistics Log-transformed StatisticsMinimum 186 Minimum of Log Data 5.226Maximum 12200 Maximum of Log Data 9.409Mean 2055 Mean of log Data 7.399Median 1610 SD of log Data 0.638SD 1782Coefficient of Variation 0.867Skewness 3.033
Relevant UCL StatisticsNormal Distribution Test Lognormal Distribution TestLilliefors Test Statistic 0.242 Lilliefors Test Statistic 0.102Lilliefors Critical Value 0.0634 Lilliefors Critical Value 0.0634Data not Normal at 5% Significance Level Data not Lognormal at 5% Significance Level
Assuming Normal Distribution Assuming Lognormal Distribution 95% Student's-t UCL 2266 95% H-UCL 2185 95% UCLs (Adjusted for Skewness) 95% Chebyshev (MVUE) UCL 2437 95% Adjusted-CLT UCL 2295 97.5% Chebyshev (MVUE) UCL 2626 95% Modified-t UCL 2271 99% Chebyshev (MVUE) UCL 2996
Gamma Distribution Test Data Distributionk star (bias corrected) 2.305 Data do not follow a Discernable Distribution (0.05)Theta Star 891.7nu star 898.8Approximate Chi Square Value (.05) 830.2 Nonparametric StatisticsAdjusted Level of Significance 0.0488 95% CLT UCL 2265Adjusted Chi Square Value 829.7 95% Jackknife UCL 2266
95% Standard Bootstrap UCL 2263Anderson-Darling Test Statistic 5.645 95% Bootstrap-t UCL 2296Anderson-Darling 5% Critical Value 0.764 95% Hall's Bootstrap UCL 2304Kolmogorov-Smirnov Test Statistic 0.155 95% Percentile Bootstrap UCL 2277Kolmogorov-Smirnov 5% Critical Value 0.0656 95% BCA Bootstrap UCL 2303Data not Gamma Distributed at 5% Significance Level 95% Chebyshev(Mean, Sd) UCL 2611
97.5% Chebyshev(Mean, Sd) UCL 2852Assuming Gamma Distribution 99% Chebyshev(Mean, Sd) UCL 3325 95% Approximate Gamma UCL 2225 95% Adjusted Gamma UCL 2226
Potential UCL to Use Use 95% Chebyshev (Mean, Sd) UCL 2611

APPENDIX D
DERIVATION OF PARTICULATE EMISSION FACTOR FOR ATV RIDING
F-1
APPENDIX D
DERIVATION OF PARTICULATE EMISSION FACTOR FOR ATV RIDING
1.0 INTRODUCTION One pathway that humans may be exposed to contaminants in soil is by inhalation of particles of soil that become re-suspended in air. When reliable site-specific measurements of contaminant levels in air due to re-suspended soil particles are not available, the concentration of contaminants may be estimated as follows (USEPA 1996, 2002): Cair = Csoil • PEF where: Cair = Concentration of contaminant in air (mg/m3) Csoil = Concentration of contaminant in soil (mg/kg) PEF = Soil to air emission factor (kg/m3) Note the PEF term in this equation is the inverse of the value presented in USEPA (1996, 2002), which has units of m3/kg. The value of PEF depends on a number of site-specific factors, as well as the nature of the force (wind, mechanical disturbance) that leads to soil particle re-suspension in air. The following sections present the derivation of the PEF values used to estimate contaminant concentrations in air from the re-suspension of soil attributable to ATV riding (PEFatv). 2.0 ESTIMATION OF THE PEF FOR ALL TERRAIN VEHICLE RIDING (PEFatv) A PEF value for riding All Terrain Vehicles (ATVs) was derived from empirical data. USEPA (Brass, 2006) collected measurements of total dust in air during use of 2 ATVs at the Quincy Smelter site California during August 2004. A Thermo Electron DataRam was attached to the front rack of the tailing ATV and measurements of total dust, temperature and humidity were collected over a 6 hour period. The total dust measurements are presented electronically in Attachment 1. Concentrations of dust in air varied considerably during the 6 hour period, from a minimum concentration of 18.7 ug/m3 to a maximum concentration of 23,359 ug/m3. Several factors are likely to influence the wide range of observed concentrations, including: variation in speed, position of the ATVs relative to one another (directly behind, perpendicular, etc.) and distance between the vehicles.
F-2
From these data, a PEF for ATV riding was estimated by taking the mean concentration of dust in air generated during ATV use and multiplying by the fraction of total dust that is respirable to estimate the PM10 generated during dirt bike riding. This calculation is as follows:
PEFatv = CTotal Dust · fPM10 · CF
where: PEFatv = Particulate emission factor for ATV riding (kg/m3) fPM10 = Fraction of total dust that is PM10 (unitless) CTotal Dust = Concentration of total dust (ug/m3) CF = Conversion Factor (kg/ug) The assumptions for evaluating emissions from ATV riding are summarized in Table D-1. Based on these parameters, the PEF for release of soil particles into air due to ATV riding is 1.18E-06 kg/m3. 3.0 REFERENCES Brass B. 2006. Personal Communication. USEPA/ERT-West. Las Vegas, Nevada. January. United States Environmental Protection Agency (USEPA). 1996. U.S. Environmental Protection Agency. Soil Screening Guidance: Technical Background Document. Office of Solid Waste and Emergency Response, Washington, D.C. EPA/540/R-95/128. May. United States Environmental Protection Agency (USEPA). 2002. Supplemental Guidance for Developing Soil Screening Levels for Superfund Sites. OSWER 9355.4-24. December.
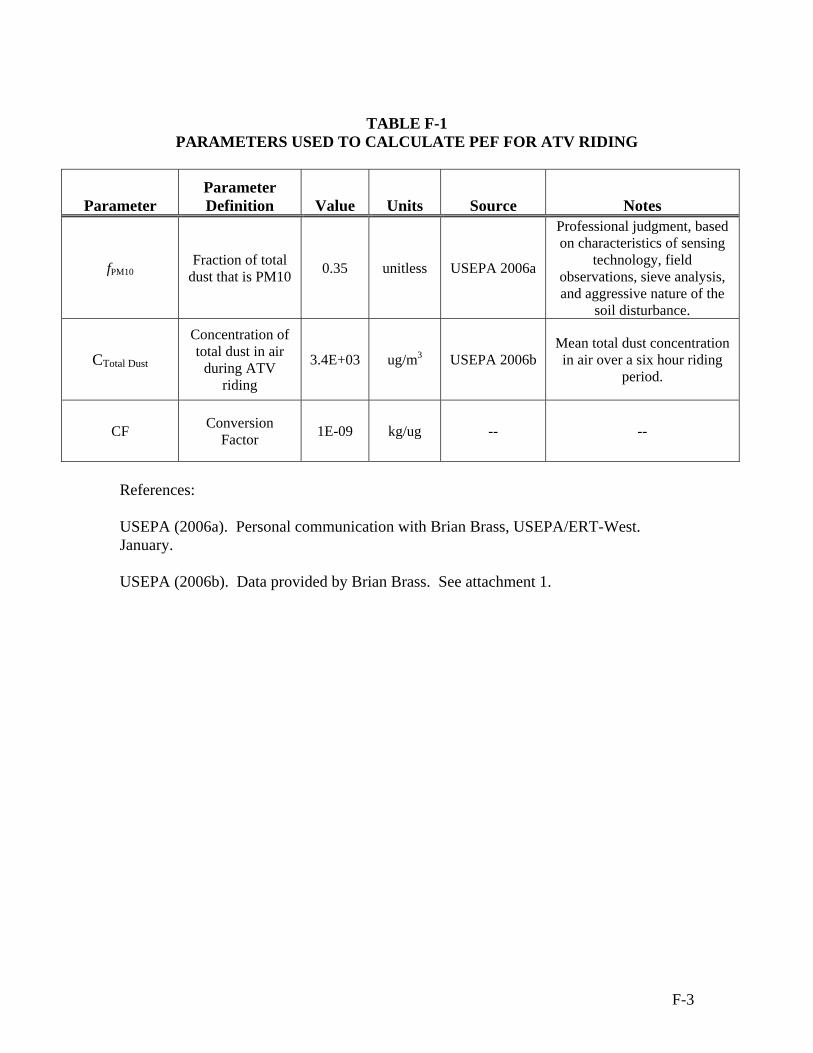
F-3
TABLE F-1
PARAMETERS USED TO CALCULATE PEF FOR ATV RIDING
Parameter Parameter Definition Value Units Source Notes
fPM10 Fraction of total
dust that is PM10 0.35 unitless USEPA 2006a
Professional judgment, based on characteristics of sensing
technology, field observations, sieve analysis, and aggressive nature of the
soil disturbance.
CTotal Dust Concentration of total dust in air
during ATV riding
3.4E+03 ug/m3 USEPA 2006b Mean total dust concentration in air over a six hour riding
period.
CF Conversion Factor 1E-09 kg/ug -- --
References: USEPA (2006a). Personal communication with Brian Brass, USEPA/ERT-West. January. USEPA (2006b). Data provided by Brian Brass. See attachment 1.

F-4
ATTACHMENT 1. RAW DATA COLLECTED DURING ATV RIDING
AT THE QUINCY SMELTER SITE
(see DATARAM.xls file on attached CD)

ParameterParameter Definition Value Units Source Notes
f PM10Fraction of total dust
that is PM10 0.35 unitless USEPA 2006a
Professional judgment, based on characteristics of sensing technology, field observations, sieve analysis, and aggressive
nature of the soil disturbance.
CTotal Dust
Concentration of total dust in air
during ATV riding3.4E+03 ug/m3 USEPA 2006b Mean total dust concentration in air over a
six hour riding period.
CF Conversion Factor 1E-09 kg/ug -- --
REFERENCESUSEPA (2006a) Personal communication with Brian Brass, USEPA/ERT-West. January.USEPA (2006b) Data provided by Brian Brass. See attachment 1.
Table D-1. Assumptions for Evaluating Emissions from Dirt Bike Riding
I:\Standard Mine\HHRA Risk Addendum\Appendices\Appendix D - PEF Derivation\PEF Calc_ATV Riding.xls10/19/2009I:\Standard Mine\HHRA Risk Addendum\Appendices\Appendix D - PEF Derivation\PEF Calc_ATV Riding.xls10/19/2009