Embed Size (px)
Citation preview
Barclays PLC H1/Q2 2017 Financial Results
28 July 2017

Jes Staley Barclays Group Chief Executive Officer

3 | Barclays H1/Q2 2017 Financial Results | 28 July 2017
A
Completed Barclays’ restructuring
A Slide 3
B Slide 3
Non-Core closed Closure on 1 July 2017
with residual RWAs of £23bn, ahead of guidance
Africa selldown complete Sold down to target shareholding of c.15% and achieved
proportional regulatory consolidation
CET1 ratio within end-state range CET1 ratio of 13.1%, reflecting strong capital generation
from profits and 47bps from Africa selldown
C Slide 3
4 | Barclays H1/Q2 2017 Financial Results | 28 July 2017
A
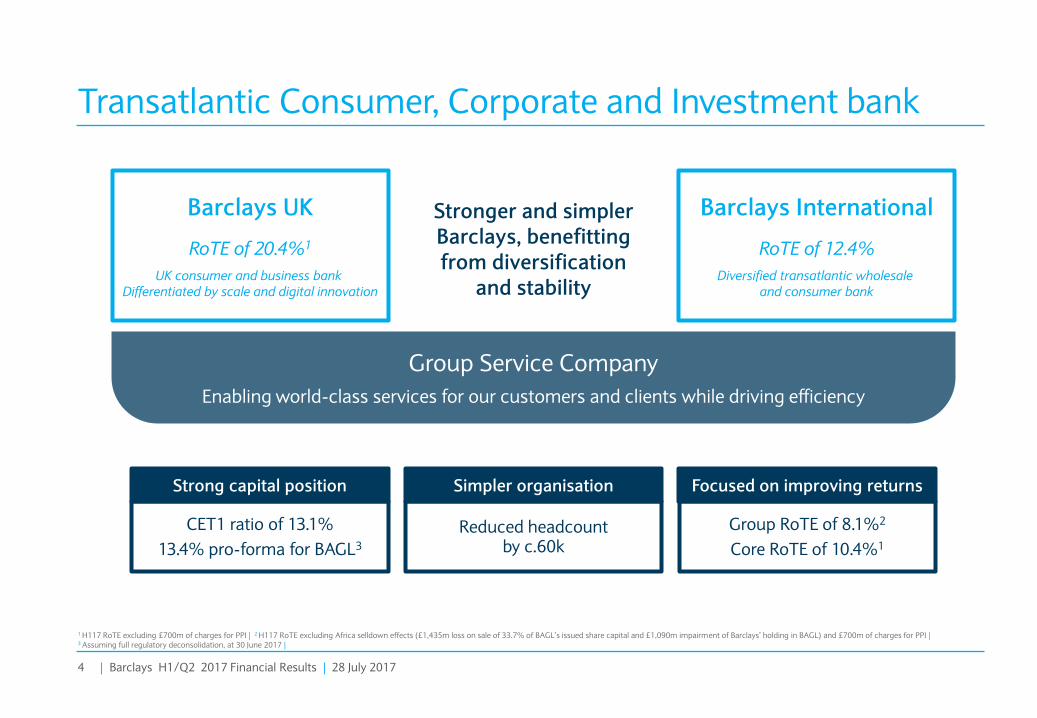
Transatlantic Consumer, Corporate and Investment bank
A Slide 4
B Slide 4
1 H117 RoTE excluding £700m of charges for PPI | 2 H117 RoTE excluding Africa selldown effects (£1,435m loss on sale of 33.7% of BAGL’s issued share capital and £1,090m impairment of Barclays’ holding in BAGL) and £700m of charges for PPI | 3 Assuming full regulatory deconsolidation, at 30 June 2017 |
Simpler organisation
Reduced headcount by c.60k
Strong capital position
CET1 ratio of 13.1%
13.4% pro-forma for BAGL3
Focused on improving returns
Group RoTE of 8.1%2
Core RoTE of 10.4%1
Group Service Company
Enabling world-class services for our customers and clients while driving efficiency
Stronger and simpler Barclays, benefitting from diversification
and stability
Barclays UK
RoTE of 20.4%1
UK consumer and business bank Differentiated by scale and digital innovation
Barclays International
RoTE of 12.4%
Diversified transatlantic wholesale and consumer bank
5 | Barclays H1/Q2 2017 Financial Results | 28 July 2017
A
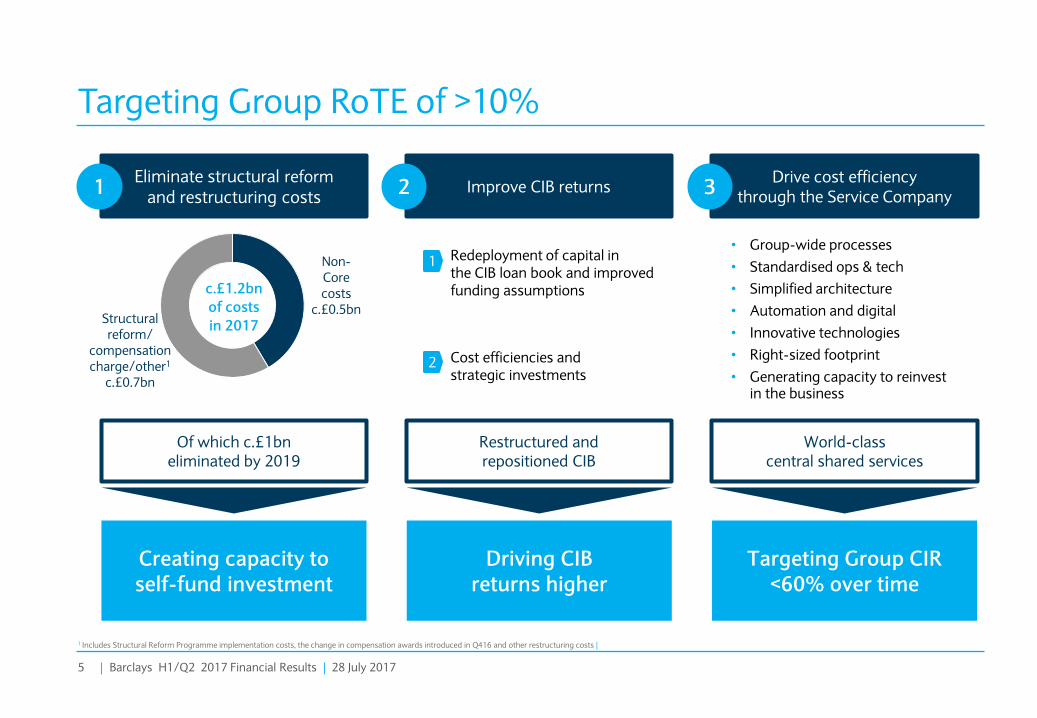
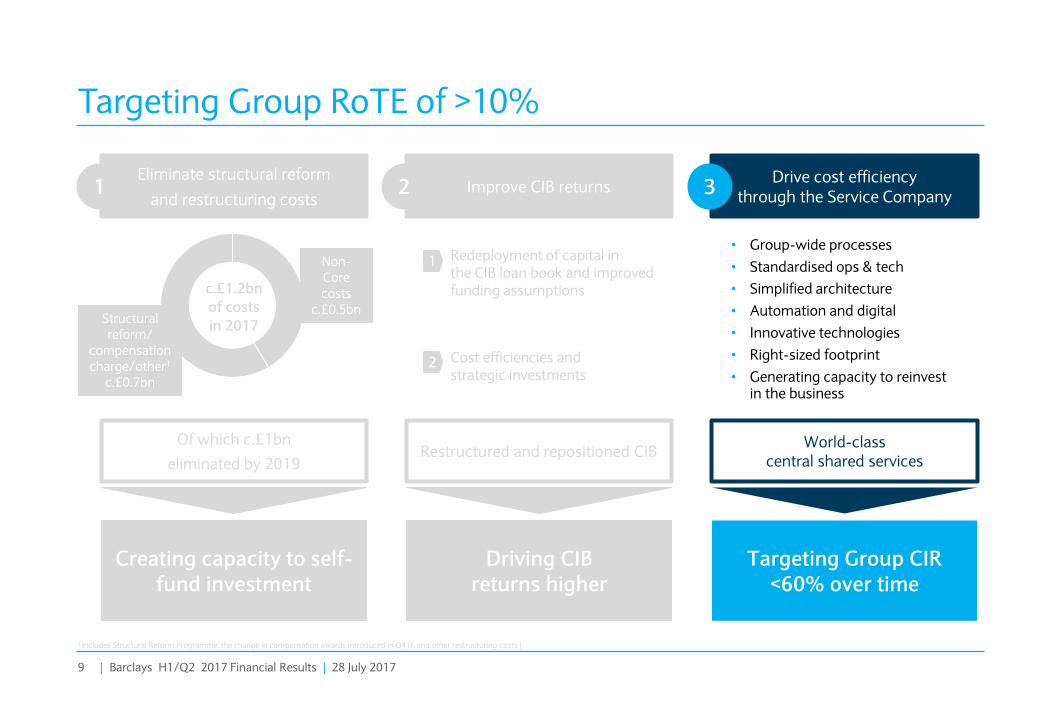
Targeting Group RoTE of >10%
Eliminate structural reform and restructuring costs
1 Improve CIB returns 2 Drive cost efficiency
through the Service Company 3
Of which c.£1bn eliminated by 2019
Restructured and repositioned CIB
World-class central shared services
• Group-wide processes
• Standardised ops & tech
• Simplified architecture
• Automation and digital
• Innovative technologies
• Right-sized footprint
• Generating capacity to reinvest in the business
Redeployment of capital in the CIB loan book and improved funding assumptions
1
2 Cost efficiencies and strategic investments
Creating capacity to self-fund investment
Driving CIB returns higher
Targeting Group CIR <60% over time
c.£1.2bn
of costs
in 2017
Non-Core costs
c.£0.5bn Structural reform/
compensation charge/other1
c.£0.7bn
1 Includes Structural Reform Programme implementation costs, the change in compensation awards introduced in Q416 and other restructuring costs |
A Slide 5
B Slide 5

6 | Barclays H1/Q2 2017 Financial Results | 28 July 2017
A
2.6 2.7
2.2 2.2
2.7 2.8
2.4 2.1
2.6 2.6 2.8
2.5 2.7
2.6
CIB has a well balanced, low volatility business model
1 Source: Dealogic, H117 ranking | 2 Ranked 6th overall globally and in the US | 3 Q114 to Q314 are calculated using the average of these three quarters as there is no pre-2014 comparison |
H117 Income by Product Fee share gains across Banking Stable Income
Banking Highlights1
Other
Corporate Lending
Trans. Banking
Credit
Equities
Macro
Banking Fees
£5,346m
1%
10%
15%
13%
17%
18%
26%
H116 H117
Advisory
Debt Underwriting
Equity Underwriting
Highest ranked European bank globally and in the US2
In Leveraged Finance globally with 7.4% share
In Debt Underwriting globally with 5.9% share
In the UK with10.3% share across all products
#1
#1
#4
#2
Markets Banking Fees Corporate Lending & Transactional Banking
2014 2015 2016 2017
Average of previous four quarters3
3.5% 4.0%
5.2% 5.9%
2.4% 3.0%
A Slide 6
B Slide 54

7 | Barclays H1/Q2 2017 Financial Results | 28 July 2017
A
Restructured and repositioned CIB to deliver higher returns
Corporate and Investment Bank RoTE
• Combined the Corporate Bank and Investment Bank in March 2016
• Successfully repositioned and restructured the business over last 3 years, with improving RoTE year over year
Focused on two primary levers to deliver higher RoTE
Prospective impact of Non-Core reabsorption and Q4 UK bank levy RoTE
Cost efficiencies and strategic investments
CIB capital allocation and funding
Sustainable cost efficiency measures which are creating capacity for investment
Redeployment of capital in the CIB loan book and improvement in funding assumptions
1
2
1.9%
5.4% 6.1%
FY14 FY15 FY16 H117
9.7%
A Slide 7
B Slide 55
8 | Barclays H1/Q2 2017 Financial Results | 28 July 2017
A
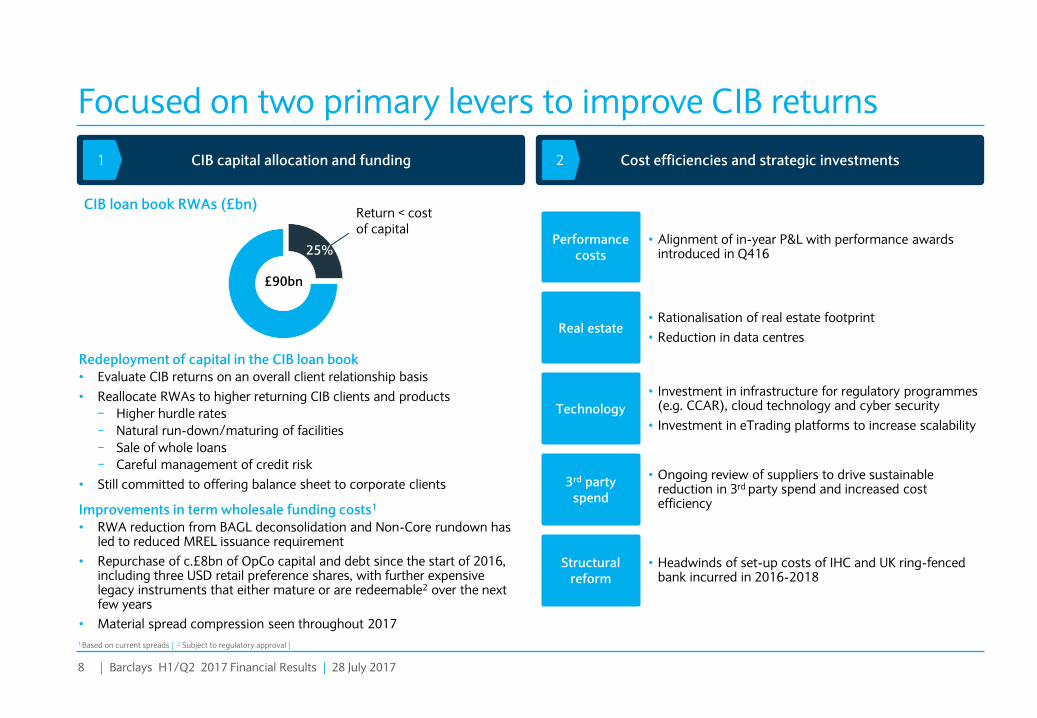
Focused on two primary levers to improve CIB returns
£90bn
25%
Return < cost of capital
CIB loan book RWAs (£bn)
CIB capital allocation and funding 1 Cost efficiencies and strategic investments 2
Structural reform
• Headwinds of set-up costs of IHC and UK ring-fenced bank incurred in 2016-2018
Performance costs
• Alignment of in-year P&L with performance awards introduced in Q416
Real estate • Rationalisation of real estate footprint
• Reduction in data centres
Technology
• Investment in infrastructure for regulatory programmes (e.g. CCAR), cloud technology and cyber security
• Investment in eTrading platforms to increase scalability
3rd party spend
• Ongoing review of suppliers to drive sustainable reduction in 3rd party spend and increased cost efficiency
Redeployment of capital in the CIB loan book • Evaluate CIB returns on an overall client relationship basis
• Reallocate RWAs to higher returning CIB clients and products
− Higher hurdle rates
− Natural run-down/maturing of facilities
− Sale of whole loans
− Careful management of credit risk
• Still committed to offering balance sheet to corporate clients
Improvements in term wholesale funding costs1
• RWA reduction from BAGL deconsolidation and Non-Core rundown has led to reduced MREL issuance requirement
• Repurchase of c.£8bn of OpCo capital and debt since the start of 2016, including three USD retail preference shares, with further expensive legacy instruments that either mature or are redeemable2 over the next few years
• Material spread compression seen throughout 2017
1 Based on current spreads | 2 Subject to regulatory approval |
A Slide 8
B Slide 7
9 | Barclays H1/Q2 2017 Financial Results | 28 July 2017
A
Targeting Group RoTE of >10%
Eliminate structural reform
and restructuring costs 1 Improve CIB returns 2
Drive cost efficiency through the Service Company
3
Of which c.£1bn
eliminated by 2019 Restructured and repositioned CIB
World-class central shared services
• Group-wide processes
• Standardised ops & tech
• Simplified architecture
• Automation and digital
• Innovative technologies
• Right-sized footprint
• Generating capacity to reinvest in the business
Redeployment of capital in the CIB loan book and improved funding assumptions
1
2 Cost efficiencies and strategic investments
Creating capacity to self-fund investment
Driving CIB returns higher
Targeting Group CIR <60% over time
c.£1.2bn
of costs
in 2017
Non-Core costs
c.£0.5bn Structural reform/
compensation charge/other1
c.£0.7bn
1 Includes Structural Reform Programme, the change in compensation awards introduced in Q416 and other restructuring costs |
10 | Barclays H1/Q2 2017 Financial Results | 28 July 2017
A
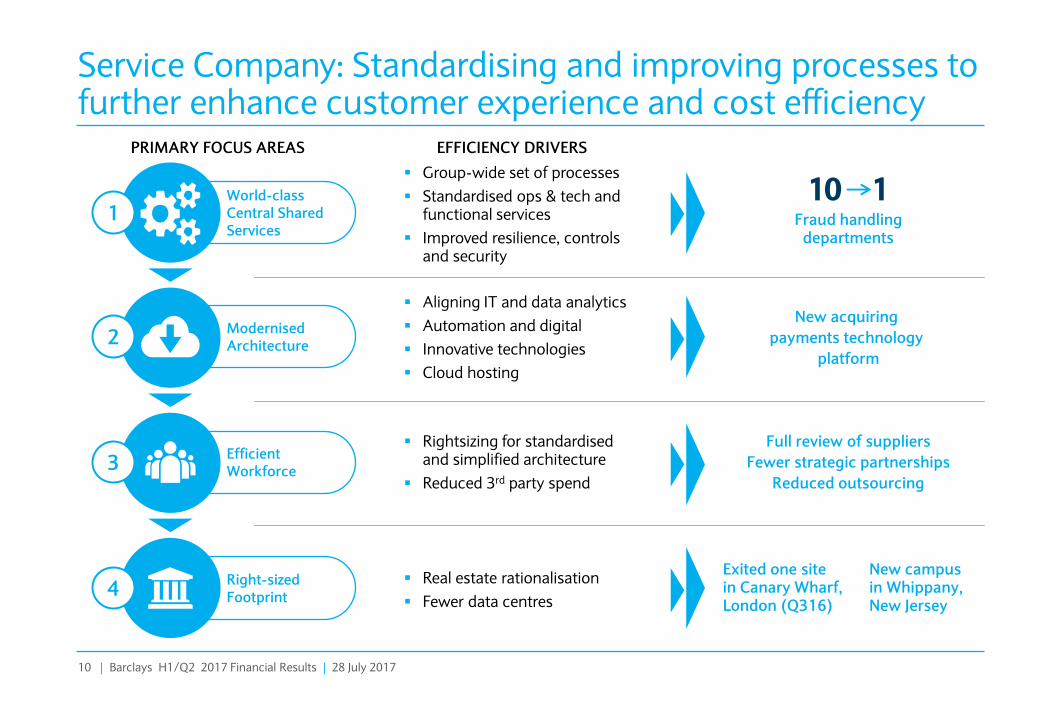
Service Company: Standardising and improving processes to further enhance customer experience and cost efficiency
World-class Central Shared Services
Modernised Architecture
Efficient Workforce
Right-sized Footprint
1
2
3
4
Group-wide set of processes
Standardised ops & tech and functional services
Improved resilience, controls and security
Aligning IT and data analytics
Automation and digital
Innovative technologies
Cloud hosting
Real estate rationalisation
Fewer data centres
Rightsizing for standardised and simplified architecture
Reduced 3rd party spend
10 1 Fraud handling
departments
Full review of suppliers
Fewer strategic partnerships
Reduced outsourcing
EFFICIENCY DRIVERS
New acquiring
payments technology
platform
Exited one site in Canary Wharf, London (Q316)
New campus in Whippany, New Jersey
PRIMARY FOCUS AREAS
A Slide 10
B Slide 8
11 | Barclays H1/Q2 2017 Financial Results | 28 July 2017
A
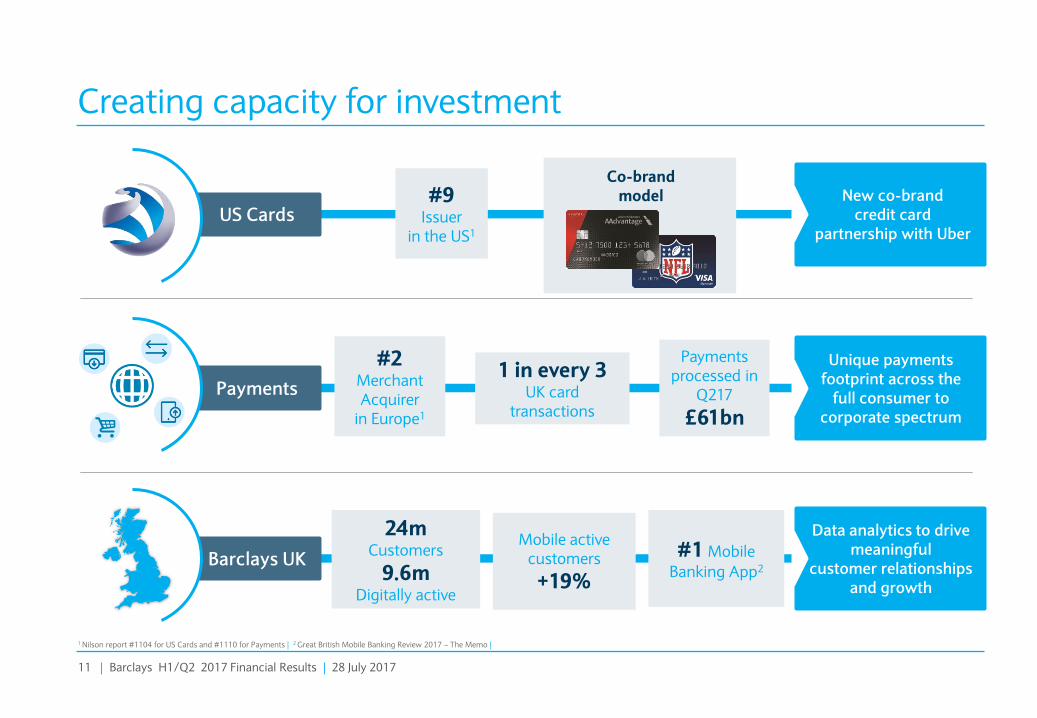
Creating capacity for investment
US Cards #9
Issuer in the US1
Payments
Unique payments footprint across the
full consumer to corporate spectrum
#2 Merchant Acquirer
in Europe1
1 in every 3 UK card
transactions
Payments processed in
Q217
£61bn
Barclays UK
Data analytics to drive meaningful
customer relationships and growth
24m Customers
9.6m Digitally active
Mobile active customers
+19%
#1 Mobile
Banking App2
New co-brand credit card
partnership with Uber
1 Nilson report #1104 for US Cards and #1110 for Payments | 2 Great British Mobile Banking Review 2017 – The Memo |
Co-brand model
A Slide 11
B Slide 56

12 | Barclays H1/Q2 2017 Financial Results | 28 July 2017
A
Group financial targets
<60%
150-200 bps above regulatory minimum level
⇒ c.13%
Group
CET1 ratio
Capital
Group Cost: income ratio
Costs
Group Return on Tangible Equity (RoTE)
Returns
Intend to achieve these targets within a reasonable timeframe
>10%
A Slide 12
C Slide 4

Tushar Morzaria Barclays Group Finance Director
14 | Barclays H1/Q2 2017 Financial Results | 28 July 2017
A
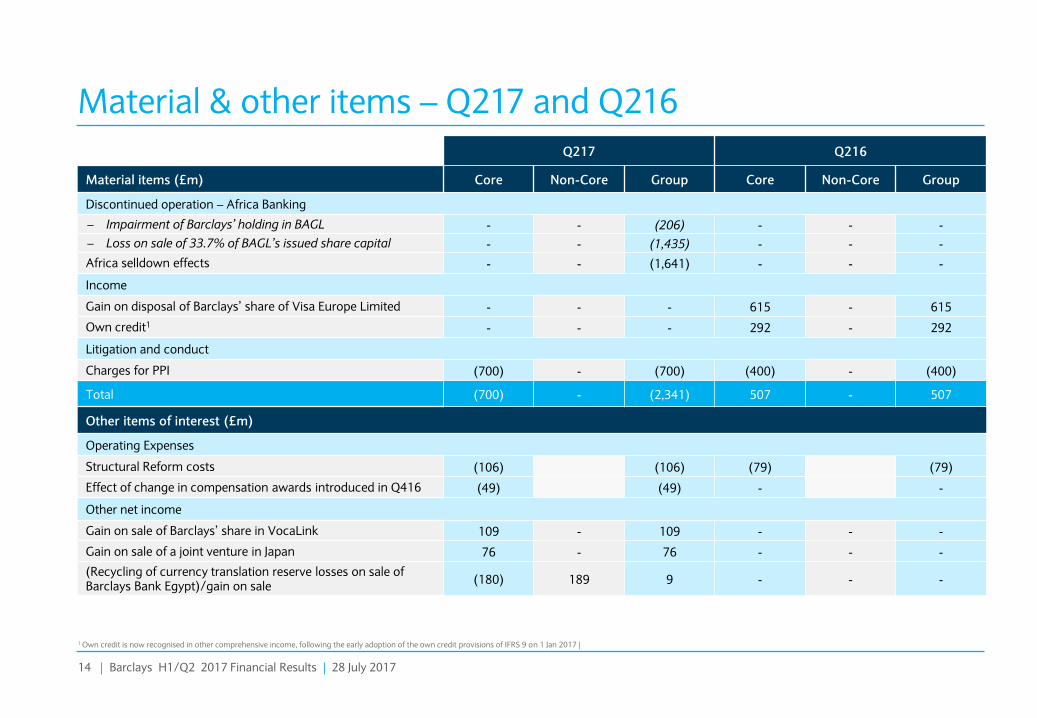
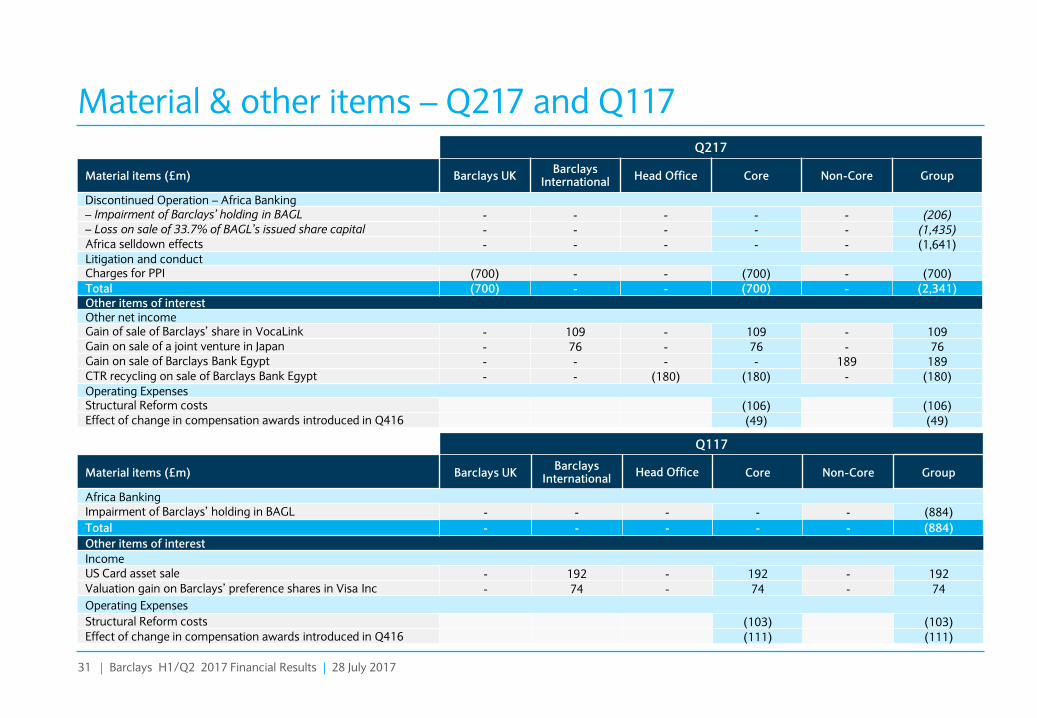
Material & other items – Q217 and Q216
Q217 Q216
Material items (£m) Core Non-Core Group Core Non-Core Group
Discontinued operation – Africa Banking
– Impairment of Barclays’ holding in BAGL - - (206) - - -
– Loss on sale of 33.7% of BAGL’s issued share capital - - (1,435) - - -
Africa selldown effects - - (1,641) - - -
Income
Gain on disposal of Barclays’ share of Visa Europe Limited - - - 615 - 615
Own credit1 - - - 292 - 292
Litigation and conduct
Charges for PPI (700) - (700) (400) - (400)
Total (700) - (2,341) 507 - 507
Other items of interest (£m)
Operating Expenses
Structural Reform costs (106) (106) (79) (79)
Effect of change in compensation awards introduced in Q416 (49) (49) - -
Other net income
Gain on sale of Barclays’ share in VocaLink 109 - 109 - - -
Gain on sale of a joint venture in Japan 76 - 76 - - -
(Recycling of currency translation reserve losses on sale of Barclays Bank Egypt)/gain on sale
(180) 189 9 - - -
1 Own credit is now recognised in other comprehensive income, following the early adoption of the own credit provisions of IFRS 9 on 1 Jan 2017 |
A Slide 14
B Slide 48

15 | Barclays H1/Q2 2017 Financial Results | 28 July 2017
A
Three months ended (£m) Jun-17 Jun-16 % change Income 5,058 5,972 (15%)
Impairment (527) (488) (8%)
– Operating expenses (excluding L&C) (3,398) (3,425) 1%
– Litigation & conduct (715) (447) (60%)
Operating expenses (4,113) (3,872) (6%)
Other net income/(expenses) 241 (342)
Profit before tax (PBT) 659 1,270 (48%)
Tax charge (305) (467) 35%
Profit after tax – continuing operations 354 803 (56%)
NCI – continuing operations (59) (92) 36%
Other equity holders (162) (104) (56%)
Attributable profit – continuing operations 133 607 (78%)
Profit after tax – discontinued operation (1,537) 145
NCI – discontinued operation 3 (75)
Attributable (loss)/profit (1,401) 677
Performance measures
Basic (loss)/earnings per share (EPS) (8.0p) 4.2p
Return on average tangible equity (RoTE) (11.0%) 5.8%
Cost: income ratio 81% 65%
Loan loss rate (LLR) 49bps 41bps
Loan: deposit ratio (LDR)2 81% 85%
Balance sheet Tangible net asset value per share (TNAV) 284p 289p
Risk weighted assets (RWA) £327.4bn £366.3bn
CET1 ratio 13.1% 11.6%
Material items (£m)
Africa selldown effects (1,641) -
Charges for PPI (700) (400)
Visa sale gain - 615
Own credit3 - 292
A Slide 15
B Slide 11
1 Adjusted for material items | 2 For Barclays UK, Barclays Intl and Non-Core, excluding investment banking business | 3 Own credit is now recognised in other comprehensive income, following the early adoption of the own credit provisions of IFRS 9 on 1 Jan 2017 |
Q217 performance metrics1
• Group RoTE was 7.2% and EPS 5.3p, excluding losses relating to the Africa selldown effects and charges for PPI
• Results were impacted by the appreciation of average USD and EUR against GBP of 10% and 9% respectively, positively impacting income and adversely affecting impairment and operating expenses
• Income was flat at £5.1bn, adjusted for the £615m Visa sale gain and £292m of own credit gains in Q216, as increased income in Barclays UK & Barclays International was offset by larger negative income in Non-Core
• Impairment increased 8% to £527m mainly due to a £77m increase in CC&P
• Costs, excluding the charges for PPI, decreased 2% to £3.4bn, with reductions in Non-Core partially offset by a 7% increase in Core
− Cost: income ratio was 67% on this basis
• Other net income increased to £241m, largely driven by
− £109m gain relating to the sale of Barclays’ share in VocaLink
− £76m gain relating to the sale of a joint venture in Japan
• Loss from discontinued operations of £1.5bn reflected impairment of Barclays’ holding in BAGL of £0.2bn and loss on sale of BAGL of £1.4bn mainly related to currency translation reserve recycling, partially offset by profits from the business to 31 May 2017
• CET1 ratio increased 150bps to 13.1%, at the end-state target of c.13%
Q217 Performance measures reconciliation Q217 Q216
Statutory RoTE (11.0%) 5.8%
– Africa selldown effects 12.6% -
– Charges for PPI 5.6% 3.4%
– Visa sale gain - (4.9%)
– Own credit - (1.7%)
RoTE excluding material items 7.2% 2.5%
Group Return on Tangible Equity of 7.2%1

16 | Barclays H1/Q2 2017 Financial Results | 28 July 2017
A
Core delivered an RoTE of 9.7%1, and cost: income ratio of 60%1
• Core delivered an RoTE of 9.7%, excluding the charges for PPI, reflecting the benefits of diversification
• Results were impacted by the appreciation of average USD and EUR against GBP of 10% and 9% respectively, positively impacting income and adversely affecting impairment and operating expenses
• Income increased by 2% to £5.5bn, excluding the Visa sale gain and own credit gains in Q216, driven by a 2% increase in Barclays UK and a 1% increase in Barclays International
• Impairment increased by £38m to £500m driven by CC&P
• Costs increased 7% to £3.3bn, excluding the charges for PPI, delivering a cost: income ratio of 60%
– Increase reflected the change in compensation awards introduced in Q416, structural reform implementation costs and investment in business growth
• Combined Barclays UK and Barclays International3 NIM was 3.84%, up 14bps on Q216 driven by a 4% increase in NII
Barclays UK – RoTE of 19.1%1 • Income increased by 2%, excluding Visa sale gain of £151m in Q216,
reflecting benefits from repricing and deposit growth, partially offset by the impact of the UK base rate reduction in 2016
• PBT, excluding charges for PPI and prior year Visa sale gains, was flat at £0.6bn
Barclays International – RoTE of 12.4% • Income increased by 1%, excluding the Visa sale gain of £464m in Q216,
reflecting USD and EUR appreciation vs. GBP and continued growth in US Cards
• PBT was flat at £1.3bn, excluding prior year Visa sale gains
Q217 performance metrics1
1 |
A Slide 16
B Slide 12
Business performance
Three months ended (£m) Jun-17 Jun-16 % change
Income 5,514 6,316 (13%)
Impairment (500) (462) (8%)
– Operating expenses (excluding L&C) (3,290) (3,057) (8%)
– Litigation & conduct (696) (420) (66%)
Operating expenses (3,986) (3,477) (15%)
– Other net income/(expenses) 37 (18)
Profit before tax (PBT) 1,065 2,359 (55%)
Attributable profit 359 1,494 (76%)
Performance measures
Basic earnings per share 2.3p 9.0p
Return on average tangible equity (RoTE) 3.6% 15.0%
Average allocated tangible equity £44.9bn £40.4bn
Cost: income ratio 72% 55%
Loan loss rate (LLR) 52bps 45bps
Balance sheet (£bn)
Risk weighted assets (RWA)2 304.6 319.6
Material items (£m)
Charges for PPI (700) (400)
Visa sale gain - 615
Own credit - 292
1 Adjusted for material items | 2 Risk weighted assets and average allocated tangible equity for Africa Banking are included within Core | 3 Includes interest earning lending balances within the Investment Banking business |

17 | Barclays H1/Q2 2017 Financial Results | 28 July 2017
A
Generating a consistently strong Core RoTE on an increasing tangible equity base
14.0% 11.3%
6.3%
10.7% 11.0% 10.4%
5.8%
11.0%
3.6%
9.8% 8.7% 9.7%
11.0%
Q215 Q315 Q415 Q116 Q216 Q316 Q416 Q117 Q217
36.4 37.7
38.3 39.6
40.7 42.1
42.7
44.2 44.9
Q215 Q315 Q415 Q116 Q216 Q316 Q416 Q117 Q217
Core return on average allocated tangible equity1
Core average allocated tangible equity (£bn)2
A Slide 17
B Slide 13
Return on average allocated tangible equity3
Q216 Q217
19.1%
12.4%
18.4%
11.9%
Barclays UK
Barclays
International
11.1%
19.4%
9.5%
26.3%
Corporate &
Investment
Bank
Consumer,
Cards
& Payments
1 Q215 to Q416 RoTE excludes notable items as listed in the FY16 results announcement. Core includes Head Office | 2 Q215 to Q416 average allocated equity excludes the cumulative post-tax impact of Own Credit | 3 Adjusted for material items listed on slides 31 and 32 |
RoTE excluding UK bank levy RoTE
RoTE excluding UK bank levy and additional charge in Q416 relating to 2016 compensation awards
RoTE excluding charges for PPI
18 | Barclays H1/Q2 2017 Financial Results | 28 July 2017
A
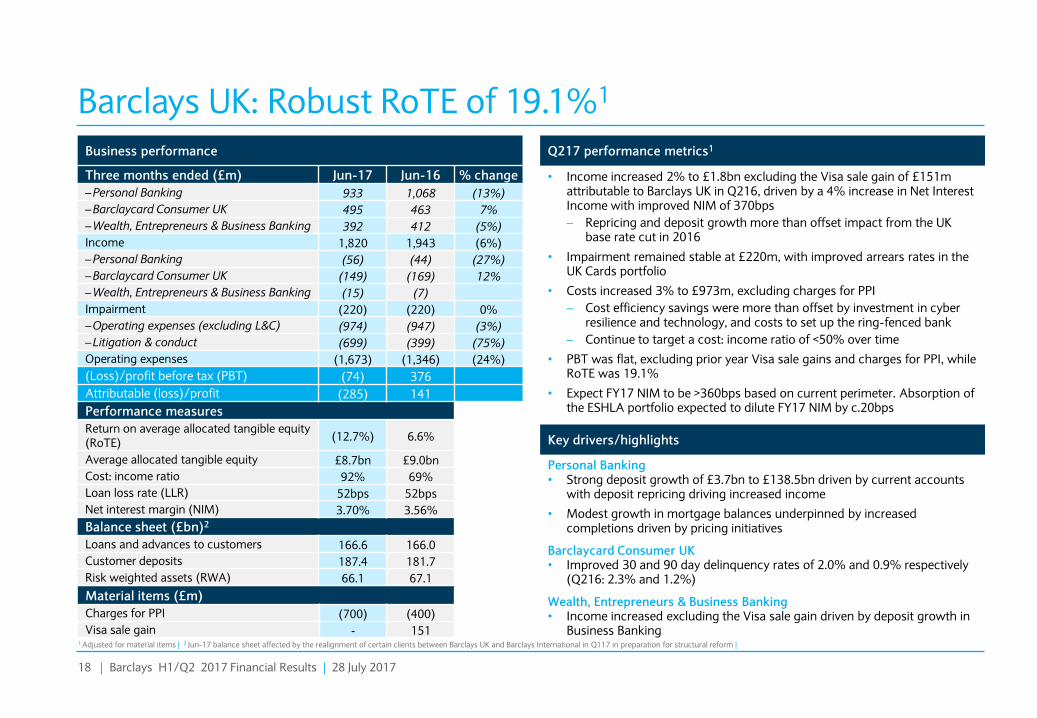
Barclays UK: Robust RoTE of 19.1%1
Personal Banking • Strong deposit growth of £3.7bn to £138.5bn driven by current accounts
with deposit repricing driving increased income
• Modest growth in mortgage balances underpinned by increased completions driven by pricing initiatives
Barclaycard Consumer UK • Improved 30 and 90 day delinquency rates of 2.0% and 0.9% respectively
(Q216: 2.3% and 1.2%)
Wealth, Entrepreneurs & Business Banking • Income increased excluding the Visa sale gain driven by deposit growth in
Business Banking
Q217 performance metrics1
Key drivers/highlights
• Income increased 2% to £1.8bn excluding the Visa sale gain of £151m attributable to Barclays UK in Q216, driven by a 4% increase in Net Interest Income with improved NIM of 370bps
– Repricing and deposit growth more than offset impact from the UK base rate cut in 2016
• Impairment remained stable at £220m, with improved arrears rates in the UK Cards portfolio
• Costs increased 3% to £973m, excluding charges for PPI
– Cost efficiency savings were more than offset by investment in cyber resilience and technology, and costs to set up the ring-fenced bank
– Continue to target a cost: income ratio of <50% over time
• PBT was flat, excluding prior year Visa sale gains and charges for PPI, while RoTE was 19.1%
• Expect FY17 NIM to be >360bps based on current perimeter. Absorption of the ESHLA portfolio expected to dilute FY17 NIM by c.20bps
A Slide 18
B Slide 14
1 Adjusted for material items | 2 Jun-17 balance sheet affected by the realignment of certain clients between Barclays UK and Barclays International in Q117 in preparation for structural reform |
Business performance
Three months ended (£m) Jun-17 Jun-16 % change
– Personal Banking 933 1,068 (13%)
– Barclaycard Consumer UK 495 463 7%
– Wealth, Entrepreneurs & Business Banking 392 412 (5%)
Income 1,820 1,943 (6%)
– Personal Banking (56) (44) (27%)
– Barclaycard Consumer UK (149) (169) 12%
– Wealth, Entrepreneurs & Business Banking (15) (7)
Impairment (220) (220) 0%
– Operating expenses (excluding L&C) (974) (947) (3%)
– Litigation & conduct (699) (399) (75%)
Operating expenses (1,673) (1,346) (24%)
(Loss)/profit before tax (PBT) (74) 376
Attributable (loss)/profit (285) 141
Performance measures
Return on average allocated tangible equity (RoTE) (12.7%) 6.6%
Average allocated tangible equity £8.7bn £9.0bn
Cost: income ratio 92% 69%
Loan loss rate (LLR) 52bps 52bps
Net interest margin (NIM) 3.70% 3.56%
Balance sheet (£bn)2
Loans and advances to customers 166.6 166.0
Customer deposits 187.4 181.7
Risk weighted assets (RWA) 66.1 67.1
Material items (£m)
Charges for PPI (700) (400)
Visa sale gain - 151
19 | Barclays H1/Q2 2017 Financial Results | 28 July 2017
A
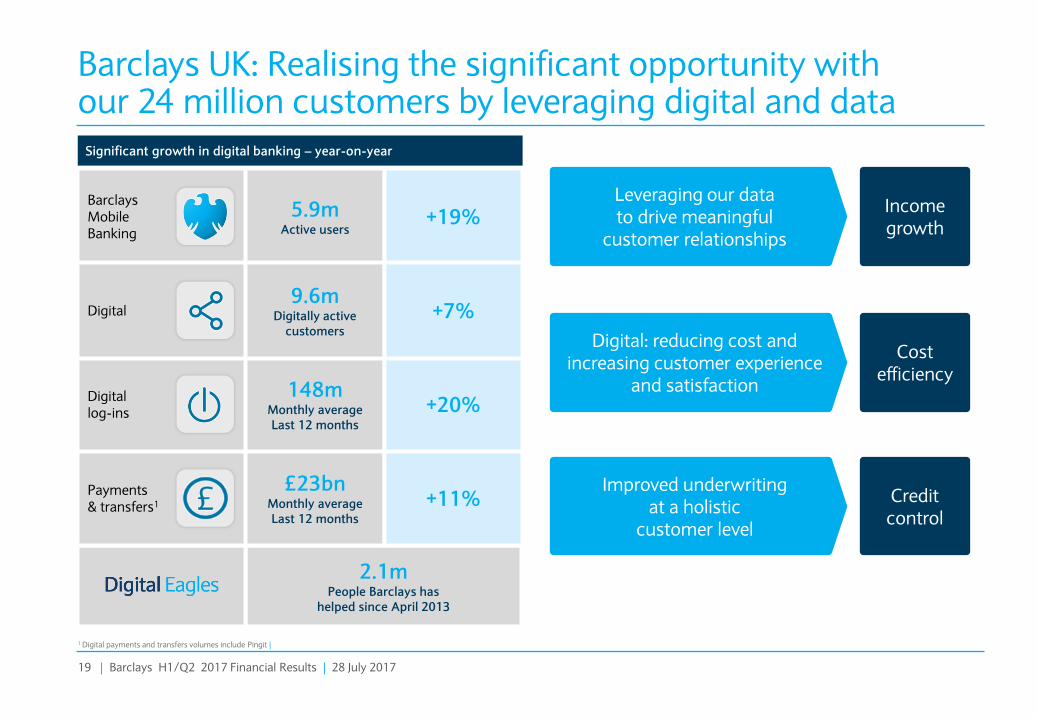
Barclays UK: Realising the significant opportunity with our 24 million customers by leveraging digital and data
Significant growth in digital banking – year-on-year
2.1m People Barclays has
helped since April 2013
Barclays Mobile Banking
Payments & transfers1
Digital log-ins
5.9m Active users
+19%
£23bn Monthly average Last 12 months
+11%
148m Monthly average Last 12 months
+20%
9.6m Digitally active
customers
+7% Digital
Leveraging our data to drive meaningful
customer relationships
Income growth
Digital: reducing cost and increasing customer experience
and satisfaction
Cost efficiency
Improved underwriting at a holistic
customer level
Credit control
B Slide 53
1 Digital payments and transfers volumes include Pingit |
A Slide 19
20 | Barclays H1/Q2 2017 Financial Results | 28 July 2017
A
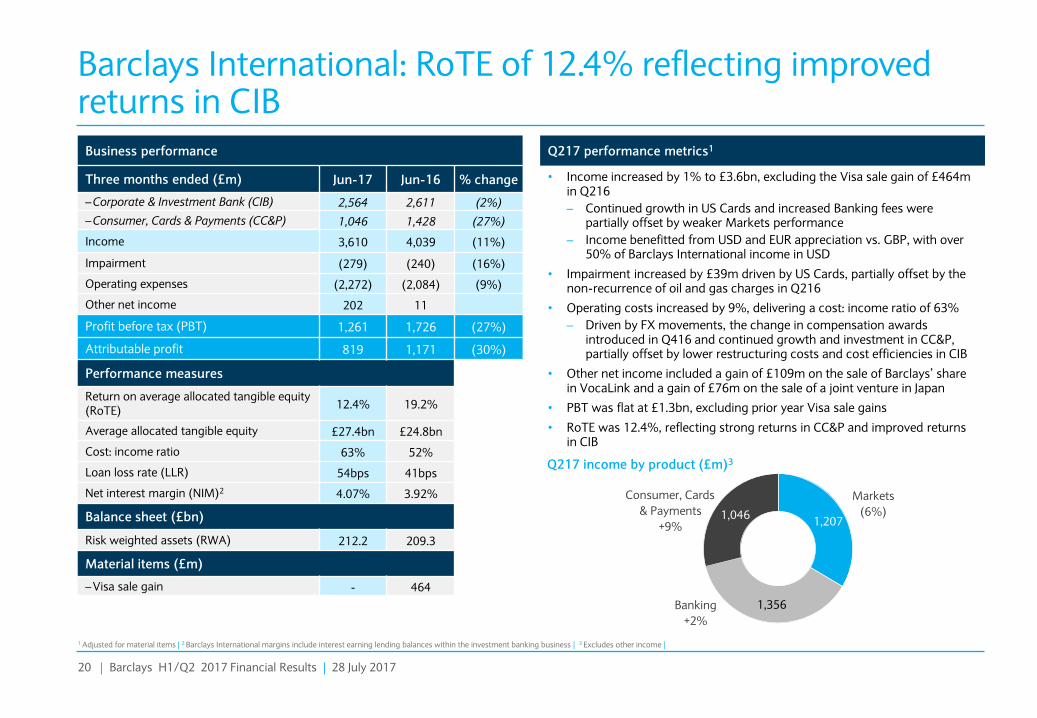
Barclays International: RoTE of 12.4% reflecting improved returns in CIB
Business performance
Three months ended (£m) Jun-17 Jun-16 % change
– Corporate & Investment Bank (CIB) 2,564 2,611 (2%)
– Consumer, Cards & Payments (CC&P) 1,046 1,428 (27%)
Income 3,610 4,039 (11%)
Impairment (279) (240) (16%)
Operating expenses (2,272) (2,084) (9%)
Other net income 202 11
Profit before tax (PBT) 1,261 1,726 (27%)
Attributable profit 819 1,171 (30%)
Performance measures
Return on average allocated tangible equity (RoTE) 12.4% 19.2%
Average allocated tangible equity £27.4bn £24.8bn
Cost: income ratio 63% 52%
Loan loss rate (LLR) 54bps 41bps
Net interest margin (NIM)2 4.07% 3.92%
Balance sheet (£bn)
Risk weighted assets (RWA) 212.2 209.3
Material items (£m)
– Visa sale gain - 464
• Income increased by 1% to £3.6bn, excluding the Visa sale gain of £464m in Q216
– Continued growth in US Cards and increased Banking fees were partially offset by weaker Markets performance
– Income benefitted from USD and EUR appreciation vs. GBP, with over 50% of Barclays International income in USD
• Impairment increased by £39m driven by US Cards, partially offset by the non-recurrence of oil and gas charges in Q216
• Operating costs increased by 9%, delivering a cost: income ratio of 63%
– Driven by FX movements, the change in compensation awards introduced in Q416 and continued growth and investment in CC&P, partially offset by lower restructuring costs and cost efficiencies in CIB
• Other net income included a gain of £109m on the sale of Barclays’ share in VocaLink and a gain of £76m on the sale of a joint venture in Japan
• PBT was flat at £1.3bn, excluding prior year Visa sale gains
• RoTE was 12.4%, reflecting strong returns in CC&P and improved returns in CIB
Q217 performance metrics1
Q217 income by product (£m)3
Consumer, Cards
& Payments
+9%
Markets
(6%)
Banking
+2%
1,207
1,356
1,046
A Slide 20
B Slide 15
1 Adjusted for material items | 2 Barclays International margins include interest earning lending balances within the investment banking business | 3 Excludes other income |
21 | Barclays H1/Q2 2017 Financial Results | 28 July 2017
A
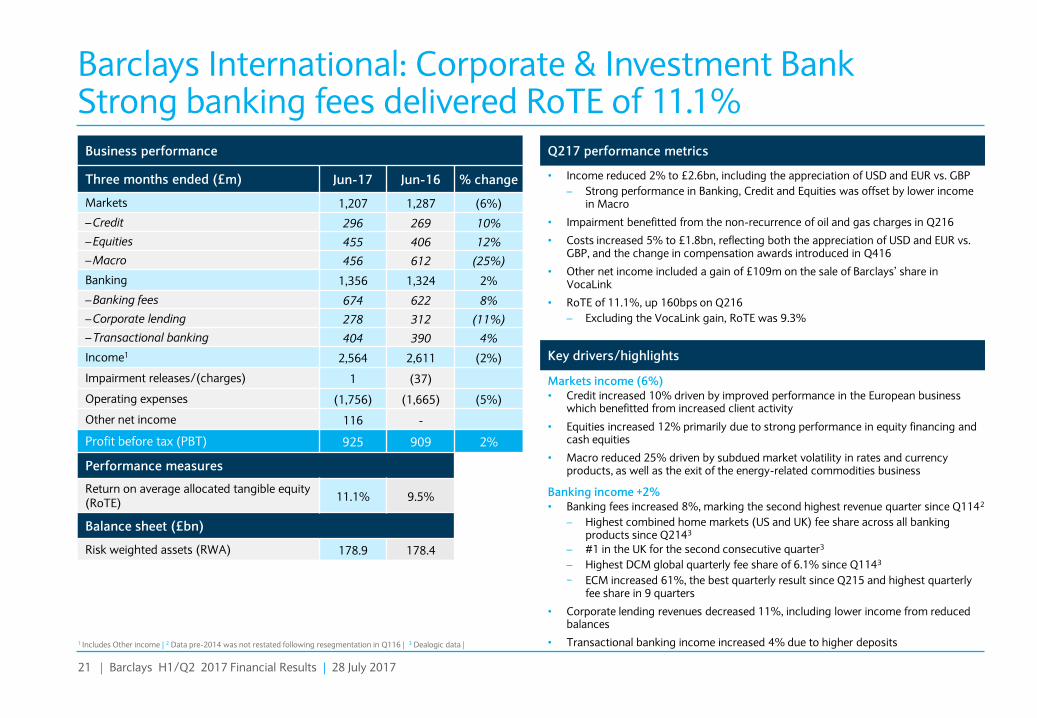
Business performance
Three months ended (£m) Jun-17 Jun-16 % change
Markets 1,207 1,287 (6%)
– Credit 296 269 10%
– Equities 455 406 12%
– Macro 456 612 (25%)
Banking 1,356 1,324 2%
– Banking fees 674 622 8%
– Corporate lending 278 312 (11%)
– Transactional banking 404 390 4%
Income1 2,564 2,611 (2%)
Impairment releases/(charges) 1 (37)
Operating expenses (1,756) (1,665) (5%)
Other net income 116 -
Profit before tax (PBT) 925 909 2%
Performance measures
Return on average allocated tangible equity (RoTE) 11.1% 9.5%
Balance sheet (£bn)
Risk weighted assets (RWA) 178.9 178.4
Barclays International: Corporate & Investment Bank Strong banking fees delivered RoTE of 11.1%
• Income reduced 2% to £2.6bn, including the appreciation of USD and EUR vs. GBP
– Strong performance in Banking, Credit and Equities was offset by lower income in Macro
• Impairment benefitted from the non-recurrence of oil and gas charges in Q216
• Costs increased 5% to £1.8bn, reflecting both the appreciation of USD and EUR vs. GBP, and the change in compensation awards introduced in Q416
• Other net income included a gain of £109m on the sale of Barclays’ share in VocaLink
• RoTE of 11.1%, up 160bps on Q216
– Excluding the VocaLink gain, RoTE was 9.3%
Markets income (6%) • Credit increased 10% driven by improved performance in the European business
which benefitted from increased client activity
• Equities increased 12% primarily due to strong performance in equity financing and cash equities
• Macro reduced 25% driven by subdued market volatility in rates and currency products, as well as the exit of the energy-related commodities business
Banking income +2% • Banking fees increased 8%, marking the second highest revenue quarter since Q1142
– Highest combined home markets (US and UK) fee share across all banking products since Q2143
– #1 in the UK for the second consecutive quarter3
– Highest DCM global quarterly fee share of 6.1% since Q1143
− ECM increased 61%, the best quarterly result since Q215 and highest quarterly fee share in 9 quarters
• Corporate lending revenues decreased 11%, including lower income from reduced balances
• Transactional banking income increased 4% due to higher deposits
Q217 performance metrics
Key drivers/highlights
A Slide 21
B Slide 16
1 Includes Other income | 2 Data pre-2014 was not restated following resegmentation in Q116 | 3 Dealogic data |

22 | Barclays H1/Q2 2017 Financial Results | 28 July 2017
A
Barclays International: Consumer, Cards & Payments 9% income growth1 and 19.4% RoTE
A Slide 22
B Slide 17
35.4 38.5
Jun-16 Jun-17
Loans and advances to banks and customers (£bn)2
9%
Total card spend and payments processed3 (£bn)
Customer deposits (£bn)2
12.4 14.2 34.5 43.1
Jun-16 Jun-17
Q217 performance metrics1
Key drivers/highlights
Barclaycard US • Net loans and advances to customers increased 7% to £19.7bn, including the
impact of FX and the Q117 asset sale
• Card spend value of £15.7bn increased by 15%3
Barclaycard Germany • 8% growth in customers to 1.2m
• 17% growth in net loans and advances to £3.2bn, including the impact of FX
Barclaycard Business Solutions • Merchant acquiring business processed payments to the value of £61.1bn, an
average of £671m per day, up 9% on Q216
Private Banking • Customer deposits of £43.1bn, a 25% increase including client reallocation
from Barclays UK
• Income increased by 9%, excluding the Visa sale gain of £464m in Q216
– Driven by continued growth in US Cards and USD and EUR appreciation vs. GBP
• Impairment increased by £77m driven by a change in portfolio mix, an increase in underlying delinquency trends in US Cards, business growth, as well as the impact of FX movements
– US Cards 30 and 90 day arrears rates were broadly stable at 2.2% (Jun-16: 2.2%) and 1.1% (Jun-16: 1.0%) respectively, including a benefit from the Q117 asset sale
• Costs increased 23% driven by investment in business growth, as well as the impact of FX
• Other net income included a £76m gain on sale of a JV in Japan
• PBT fell 5%, excluding the Visa sale gain in Q216
• RoTE was 19.4% and 15.0% excluding JV sale
1 Excluding Visa sale gain | 2 Jun-17 balance sheet affected by the realignment of certain clients between Barclays UK and Barclays International in Q117 in preparation for structural reform | 3 Includes balance transfers |
73.2 80.4
Q216 Q217
10%
Business performance
Three months ended (£m) Jun-17 Jun-16 % change Income 1,046 1,428 (27%)
Impairment (280) (203) (38%)
Operating expenses (516) (419) (23%)
Other net income 86 11
Profit before tax (PBT) 336 817 (59%)
Performance measures
Return on average allocated tangible equity (RoTE) 19.4% 77.9%
Balance sheet (£bn)
Risk weighted assets (RWA)
33.3 30.9
Material items (£m)
– Visa sale gain - 464
Private Banking International Cards
23 | Barclays H1/Q2 2017 Financial Results | 28 July 2017
A
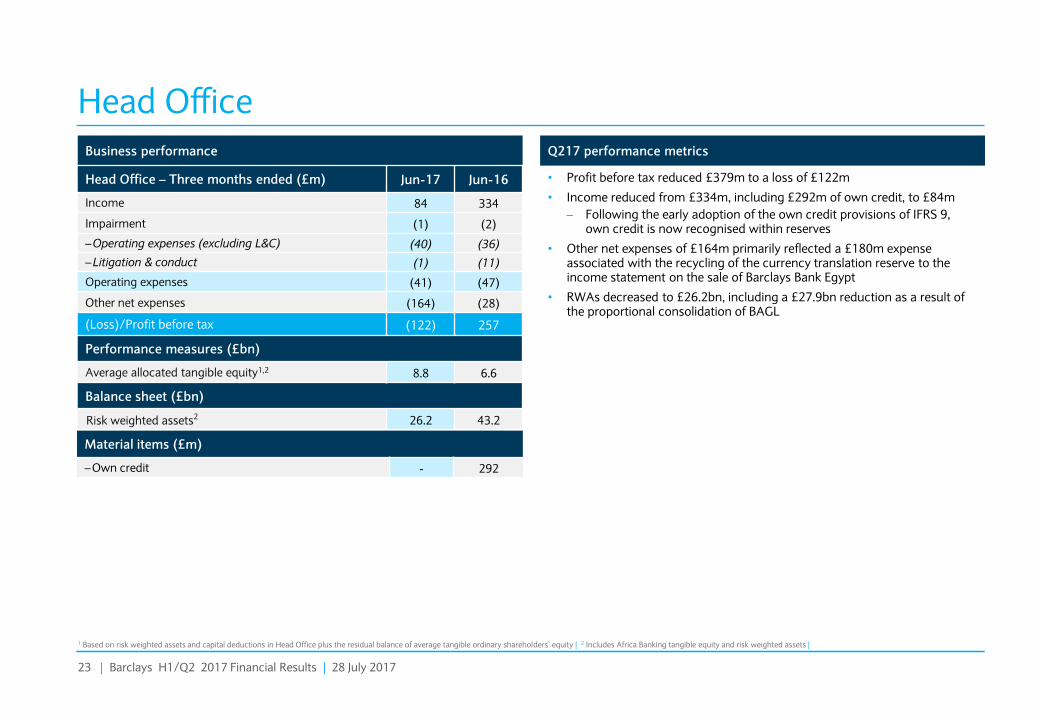
Head Office Business performance
Head Office – Three months ended (£m) Jun-17 Jun-16
Income 84 334
Impairment (1) (2)
– Operating expenses (excluding L&C) (40) (36)
– Litigation & conduct (1) (11)
Operating expenses (41) (47)
Other net expenses (164) (28)
(Loss)/Profit before tax (122) 257
Performance measures (£bn)
Average allocated tangible equity1,2 8.8 6.6
Balance sheet (£bn)
Risk weighted assets2 26.2 43.2
A Slide 23
B Slide 57
• Profit before tax reduced £379m to a loss of £122m
• Income reduced from £334m, including £292m of own credit, to £84m
– Following the early adoption of the own credit provisions of IFRS 9, own credit is now recognised within reserves
• Other net expenses of £164m primarily reflected a £180m expense associated with the recycling of the currency translation reserve to the income statement on the sale of Barclays Bank Egypt
• RWAs decreased to £26.2bn, including a £27.9bn reduction as a result of the proportional consolidation of BAGL
1 Based on risk weighted assets and capital deductions in Head Office plus the residual balance of average tangible ordinary shareholders’ equity | 2 Includes Africa Banking tangible equity and risk weighted assets |
Q217 performance metrics
Material items (£m)
– Own credit - 292
24 | Barclays H1/Q2 2017 Financial Results | 28 July 2017
A
9 5 4 4
8 8 7 7
17 12 10 7
10
7 6
5
Dec-13 Sep-16 Dec-16 Mar-17 Jun-17
Operational risk plus DTAs Securities and loans Derivatives Businesses
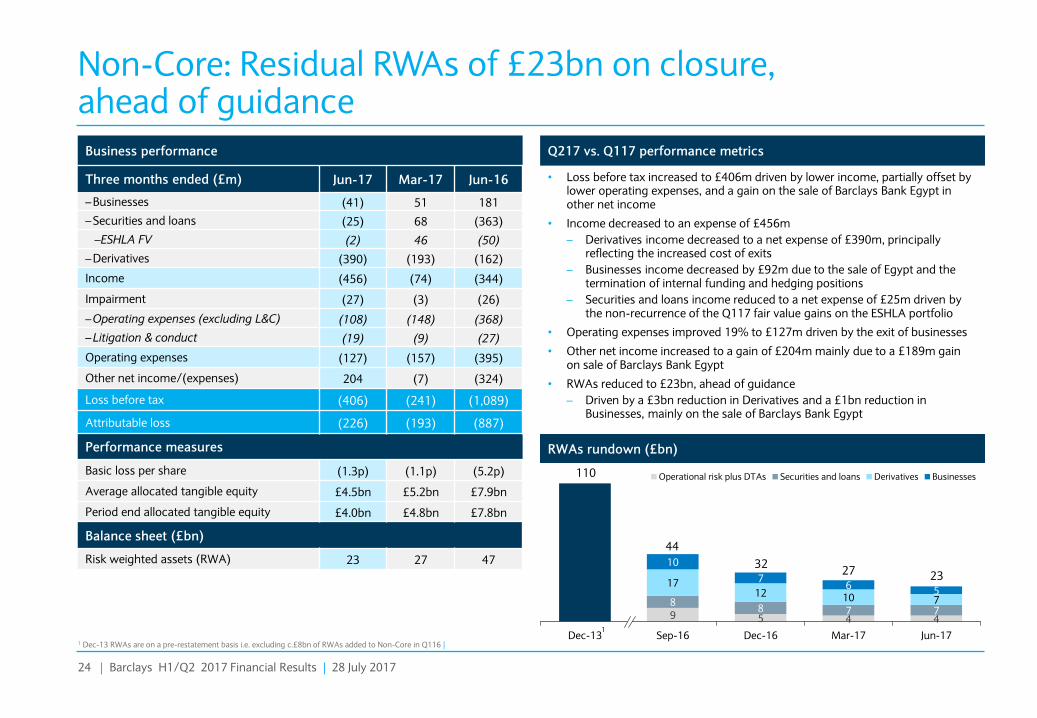
Non-Core: Residual RWAs of £23bn on closure, ahead of guidance
Business performance
Three months ended (£m) Jun-17 Mar-17 Jun-16
– Businesses (41) 51 181
– Securities and loans (25) 68 (363)
–ESHLA FV (2) 46 (50)
– Derivatives (390) (193) (162)
Income (456) (74) (344)
Impairment (27) (3) (26)
– Operating expenses (excluding L&C) (108) (148) (368)
– Litigation & conduct (19) (9) (27)
Operating expenses (127) (157) (395)
Other net income/(expenses) 204 (7) (324)
Loss before tax (406) (241) (1,089)
Attributable loss (226) (193) (887)
Performance measures
Basic loss per share (1.3p) (1.1p) (5.2p)
Average allocated tangible equity £4.5bn £5.2bn £7.9bn
Period end allocated tangible equity £4.0bn £4.8bn £7.8bn
Balance sheet (£bn)
Risk weighted assets (RWA) 23 27 47
Q217 vs. Q117 performance metrics
• Loss before tax increased to £406m driven by lower income, partially offset by lower operating expenses, and a gain on the sale of Barclays Bank Egypt in other net income
• Income decreased to an expense of £456m
– Derivatives income decreased to a net expense of £390m, principally reflecting the increased cost of exits
– Businesses income decreased by £92m due to the sale of Egypt and the termination of internal funding and hedging positions
– Securities and loans income reduced to a net expense of £25m driven by the non-recurrence of the Q117 fair value gains on the ESHLA portfolio
• Operating expenses improved 19% to £127m driven by the exit of businesses
• Other net income increased to a gain of £204m mainly due to a £189m gain on sale of Barclays Bank Egypt
• RWAs reduced to £23bn, ahead of guidance
– Driven by a £3bn reduction in Derivatives and a £1bn reduction in Businesses, mainly on the sale of Barclays Bank Egypt
A Slide 24
B Slide 18
1
RWAs rundown (£bn)
1 Dec-13 RWAs are on a pre-restatement basis i.e. excluding c.£8bn of RWAs added to Non-Core in Q116 |
23
110
32
44
27

25 | Barclays H1/Q2 2017 Financial Results | 28 July 2017
A
Non-Core: Closure at 1 July and reabsorption in Core in H217
A Slide 25
B Slide 18
1 Total includes other net income | 2 Estimated allocation based on Jun-17 balance sheet |
• Closure of Non-Core on 1 July 2017, with residual assets and liabilities to be reabsorbed into the Core
• Guidance for loss before tax from Non-Core businesses/assets remains approximately £1bn in FY17
– Given H117 loss before tax of £647m, H217 losses of £300-400m expected to be reabsorbed into Core
– Expect negative income and costs to fall further in 2018, reducing the impact on Group returns
• Non-Core RWAs expected to be absorbed as shown below, with estimated H217 loss before tax splits (further detail in appendix, slide 34)
• Barclays International RWAs and loss will only affect CIB
Non-Core reabsorption
Loss before tax (£bn)1
FY17
Guidance
FY18
Guidance
H217
0.65 H117
0.3-0.4
c.1.0
Overview
RWAs (£bn)2 Barclays UK Barclays International Head Office
H217 loss before tax guidance c.10% c.40% c.50% £300-£400m
Legacy derivatives 7 7
Op Risk/DTAs 4 4
Italian Mortgages 3 3
ESHLA 4 3 1
Residual businesses/offices 5 1 4

26 | Barclays H1/Q2 2017 Financial Results | 28 July 2017
A
Material reductions in our cost base, creating capacity to self-fund investment in the business
1 As previously presented in Barclays’ annual reports | 2 Africa Banking reclassified as a discontinued operation in 2016 | 3 2013 includes costs to achieve as previously disclosed in Barclays’ annual reports, 2016 and 2017 include Structural Reform Programme implementation costs, the change in compensation awards introduced in Q416 and other restructuring costs |
< 60%
Target CIR over time
Of which c.£1bn expected to be
eliminated by 2019 16.3
12.3
1.2
1.1 c.0.7
2.0
1.6
c.0.5
2013 2016 2017 2019
Underlying costs SRP/compensation charge/other Non-Core costs Investment spend
£19.5bn
£15.0bn2
£4.5bn achieved
Capacity for re-investment
3
Group operating costs excluding notable items1, conduct and litigation
A Slide 26
B Slide 6

27 | Barclays H1/Q2 2017 Financial Results | 28 July 2017
A
Within our end-state CET1 ratio target range CET1 ratio progression in Q217
• CET1 ratio of 13.1% at Jun-17, at the end-state target of around 13%4
• CET1 ratio increase from Mar-17 to Jun-17 included
– 47bps increase from the sale of 33.7% of BAGL’s issued share capital, reflecting selldown and proportional regulatory consolidation at a level of 23.4%
– 10bps increase from the sale of Barclays Bank Egypt
– 30bps from profits excluding the impact of the Africa selldown effects and PPI charge and 7bps from other movements, including RWA reduction
• Partially offset by
– 20bps impact arising from the £700m charges for PPI
– 7bps net pensions impact due to deficit reduction contributions of £310m, as the UKRF, the Group’s main pension scheme, was in a surplus
1 Before capital neutral goodwill impairment related to Barclays’ holding in BAGL. 33bps from profits and 9bps from RWA reduction and other | 2 Capital actions include 13bps from the series 3 USD preference share redemption, 12bps from share purchases for vesting scheme awards and 9bps from pension contributions | 3 Before capital neutral goodwill impairment related to Barclays’ holding in BAGL and recycling of currency translation reserve losses | 4 Includes countercyclical buffer, see appendix slide 41 | 5 Estimated CET1 ratio benefit compared to previously agreed schedule of pension deficit reduction contributions. See slide 33 for further detail |
12.4% 12.5%
13.1% 0.42% 0.34% 0.37%
0.47% 0.10% 0.27%
13.4%
Q416 Profits
& other
Capital
actions
Q117 Profits
& other
Africa
selldown
Egypt
sale
PPI &
pensions
Q2171 3 2
Pro-forma CET1 ratio assuming full regulatory deconsolidation of BAGL
c.13%
End-state target
Capacity for capital returns
• Organic profit generation
• Additional 26bps expected from BAGL, in two roughly equal stages
− Partial consolidation at 14.9% in H217
− Full regulatory deconsolidation expected within 18 months
• IFRS 9 (expected to be transitioned over 5 years)
• Conduct & litigation
• Pension contributions
− But reduction in contributions agreed 2017-2020 (c.25bps5)
• ‘Basel IV’
Tailwinds Headwinds
A Slide 27
B Slide 23

28 | Barclays H1/Q2 2017 Financial Results | 28 July 2017
A
Transatlantic Consumer, Corporate and Investment bank
CET1 ratio
150-200bps above regulatory minimum level
⇒ c.13%
Capital
Return on Tangible Equity (RoTE)
>10%
Returns Costs
Cost: income ratio
<60%
Group financial targets
Benefits of diversification by customer, product and geography showing through
Group RoTE of 7.2% in Q217 excluding material items
Closure of Non-Core on 1 July 2017 with £23bn of RWAs, marking the end of restructuring
Prioritisation of growing Group returns on a sustainable basis
13.1% CET1 ratio at end-state target. Pro-forma 13.4% for full regulatory deconsolidation
A Slide 28
B Slide 9
C Slide 4

Barclays PLC H1/Q2 2017 Financial Results
28 July 2017

Appendix
31 | Barclays H1/Q2 2017 Financial Results | 28 July 2017
A
Material & other items – Q217 and Q117
Q117
Material items (£m) Barclays UK Barclays
International Head Office Core Non-Core Group
Africa Banking Impairment of Barclays’ holding in BAGL - - - - - (884)
Total - - - - - (884)
Other items of interest
Income US Card asset sale - 192 - 192 - 192 Valuation gain on Barclays’ preference shares in Visa Inc - 74 - 74 - 74
Operating Expenses
Structural Reform costs (103) (103) Effect of change in compensation awards introduced in Q416 (111) (111)
Q217
Material items (£m) Barclays UK Barclays
International Head Office Core Non-Core Group
Discontinued Operation – Africa Banking – Impairment of Barclays’ holding in BAGL - - - - - (206) – Loss on sale of 33.7% of BAGL’s issued share capital - - - - - (1,435) Africa selldown effects - - - - - (1,641) Litigation and conduct Charges for PPI (700) - - (700) - (700)
Total (700) - - (700) - (2,341) Other items of interest Other net income Gain of sale of Barclays’ share in VocaLink - 109 - 109 - 109 Gain on sale of a joint venture in Japan - 76 - 76 - 76 Gain on sale of Barclays Bank Egypt - - - - 189 189 CTR recycling on sale of Barclays Bank Egypt - - (180) (180) - (180) Operating Expenses Structural Reform costs (106) (106) Effect of change in compensation awards introduced in Q416 (49) (49)
A Slide 31
B Slide 49

32 | Barclays H1/Q2 2017 Financial Results | 28 July 2017
A
Material items – Q216
Q216
Notable items (£m) Barclays UK Barclays
International Head Office Core Non-Core Group
Income
Gain on disposal of Barclays’ share of Visa Europe Limited 151 464 - 615 - 615
Own credit - - 292 292 - 292
Litigation and conduct
Charges for PPI (400) - - (400) - (400)
Total (249) 464 292 507 - 215
Other items of interest
Operating Expenses
Structural Reform costs (79) (79)
Totals may not cast due to rounding |
A Slide 32
B Slide 50

33 | Barclays H1/Q2 2017 Financial Results | 28 July 2017
A
Africa selldown and pension triennial valuation
A Slide 33
B Slide 24
Completion of the latest triennial valuation of the UK Retirement Fund (UKRF), with an effective date of 30 September 2016
• 10 year recovery plan agreed with the UKRF with lower deficit reduction contributions than under previous schedule for 2017-2020
Deficit reduction contributions (£bn)1 2017 2018 2019 2020
Sum 2017-2020
2013 Triennial valuation
1.24 0.74 0.74 0.74 3.46
2016 Triennial valuation
0.742 0.5 0.5 0.5 2.24
Impact of reduced contributions (pre-tax)
(0.5) (0.24) (0.24) (0.24) (1.22)
Pro-forma 30 June 2017 CET1 ratio benefit
c.25bps
1 The 2016 triennial valuation also agreed deficit reduction contributions of £1,000m per annum in 2021-2026 | 2 £620m of the £740m for 2017 had been paid to the UKRF by 30 June 2017 | 3 Barclays has an obligation to contribute 1.5% of BAGL’s ordinary shares to the Black Economic Empowerment Scheme, and 7.0% is allocated to the Public Investment Corporation (PIC) who is expected to take receipt of the shares following the necessary regulatory approvals |
• Actuarial valuation showed a funding deficit of £7.9bn, compared to an IAS19 pension surplus of £0.7bn, with the difference representing a different approach to setting the discount rate and a more conservative longevity assumption for funding
Sale of BAGL’s issued share capital on 1 June 2017, resulting in the accounting deconsolidation of BAGL
• As of 1 June 2017 BAGL is accounted for as an Available for Sale (AFS) asset, and no longer reported as a discontinued operation
• Q217 results included a loss on sale of £1.4bn and an impairment of Barclays’ holding in BAGL of £0.2bn
33.7%
• Reflecting proportional consolidation of BAGL based on a holding of 23.4%3
Increase to the Group’s CET1 ratio in Q217 47bps
Residual holding in BAGL
• Following the sale and an obligation to contribute 1.5% of BAGL’s ordinary shares to a Black Economic Empowerment scheme
14.9%
• Higher deficit reduction contributions of £1bn per annum agreed for 2021-2026
• Next triennial valuation in 2019 Estimated CET1 ratio accretion through to regulatory deconsolidation
c.26bps
• The UKRF will remain in BBPLC post ring-fencing
Pension triennial valuation complete Africa selldown

34 | Barclays H1/Q2 2017 Financial Results | 28 July 2017
A
Non-Core: RWA reallocation and guidance
1 Estimated allocation based on Jun-17 balance sheet | 2 Balance sheet and P&L allocation is entirely to the CIB |
Balance sheet – 30 June 17
A Slide 34
B Slide 20
C Slide 16
23
£300-400m
1.3
4.0
7
4
3
4
5
Non-Core RWAs1
Reallocated RWAs
Pre reallocation RWAs (£bn)
Loss before tax
Estimated H217 RoTE impact
Capital deductions
Allocated tangible equity
H217 Guidance
Legacy derivatives
Op Risk/DTA
Italian Mortgages
ESHLA
Residual businesses/offices
3 9 11
c.40% c.10% c.50%
1.0-1.5% 2.0-2.5% n.m.
0.5 0.3 0.5
1.6 0.7 1.7
7
4
3
3
1 4
1
Barclays UK Barclays International2 Head Office
Allocated to

35 | Barclays H1/Q2 2017 Financial Results | 28 July 2017
A
Income and margins – Q217 Income (£m) – Three months ended Jun-17 Jun-16 % change
– Barclays UK 1,534 1,476 4%
– Barclays International1 1,064 1,021 4%
– Other2 (19) 33
Net interest income (NII) 2,579 2,530 2%
Non-interest income 2,479 3,442 (28%)
Total Group income 5,058 5,972 (15%)
Net Interest Margin (%) Net Interest Income (£m)
1,476 1,569 1,502 1,511 1,534
1,021 1,149 1,110 1,121 1,064
2,497
2,718 2,612 2,632 2,598
Q216 Q316 Q416 Q117 Q217
Barclays UK Barclays International Combined
3.56 3.72
3.56 3.69 3.70 3.92
4.21 3.91 4.06 4.07
3.70 3.91
3.70 3.84 3.84
Q216 Q316 Q416 Q117 Q217
Barclays UK Barclays International Combined1 1
A Slide 35
B Slide 51
• Barclays UK NII increased 4% to £1.5bn as growth in deposits and liability repricing initiatives offset impact from the lower UK base rate
– NIM of 3.70% was 14bps higher on Q216
• Barclays International1 NII increased 4% to £1.1bn, delivering an improved NIM of 4.07%
• Combined Barclays UK and Barclays international1 NIM increased 14bps to 3.84%
1 Barclays International margins include interest earning lending balances within the investment banking business | 2 Other includes Head Office, Barclays Non-Core and non-lending related investment banking balances |
Q217 performance metrics

36 | Barclays H1/Q2 2017 Financial Results | 28 July 2017
A
Barclays UK: Improved NIM and growth in deposits Income (£m) – Three months ended Jun-17 Jun-16 % change
Net interest income (NII) 1,534 1,476 4%
– Net interest margin (NIM) 3.70% 3.56%
Non-interest income 286 467 (39%)
Total income 1,820 1,943 (6%)
3.54% 3.58% 3.62% 3.56% 3.72% 3.56% 3.69% 3.70%
Q315 Q415 Q116 Q216 Q316 Q416 Q117 Q217
Net Interest Margin (NIM)
Loans & advances to customers (£bn) Customer deposits (£bn)
166.1 166.0 166.6
Jun-15 Jun-16 Jun-17
Impact of client reallocation
171.6
181.7 187.4
Jun-15 Jun-16 Jun-17
BoE base rate FY17
0.25% >360bps on current perimeter2
NIM expectation
A Slide 36
B Slide 52
Q217 performance metrics1
• NIM increased 14bps to 370bps as NII grew 4% to £1.5bn
– Liability repricing initiatives and growth in deposit balances offset impact from the lower UK base rate
– Stable L&A, reflecting a conservative risk appetite, with focus retained on remortgage and lower LTV segments, and unsecured lending to existing customers
– Absorption of the c.£20bn ESHLA portfolio is expected to dilute FY17 NIM
• Non-interest income decreased 9% to £286m, excluding prior year Visa sale gains of £151m
• Client reallocations in Q117 between Barclays UK and Barclays International in preparation for ring-fencing reduced customer balances in Barclays UK, with modest PBT impact
• LDR of 89%, reflecting strong funding position and prudent risk appetite
Annualised impact of ESHLA reabsorption
(40bps)
1 Adjusted for material items | 2 Pre-absorption of Non-Core assets |

37 | Barclays H1/Q2 2017 Financial Results | 28 July 2017
A
Africa Banking Business performance
Three months ended (£m) Jun-17 Mar-17
Income 704 1,082
Impairment (71) (106)
Operating expenses excluding impairment of Barclays’ holding in BAGL
(477) (653)
Other net income excluding loss on sale of BAGL 3 2
Profit before tax excluding impairment of Barclays' holding in BAGL and loss on sale of BAGL
159 325
Impairment of Barclays’ holding in BAGL (206) (884)
Loss on sale of BAGL (1,435) -
Loss before tax (1,482) (559)
Loss after tax1 (1,537) (658)
Attributable loss (1,534) (801)
Balance sheet (£bn)
Risk weighted assets 9.8 41.3
A Slide 37
B Slide 58
• On 1 June 2017, Barclays sold 286 million ordinary shares of Barclays Africa Group Limited (BAGL), representing 33.7% of BAGL’s issued share capital
• The sale resulted in the accounting deconsolidation of BAGL from the Barclays Group
– Following the sale, as of 1 June 2017 BAGL is accounted for as an Available for Sale (AFS) asset in Barclays’ financial statements and is no longer reported in discontinued operations
• Africa Banking Q217 results reflected
– Profit before tax, excluding impairment of Barclays’ holding in BAGL and loss on sale of 33.7% of BAGL’s issued share capital of £159m
– Q217 profits represented two months of Africa Banking results as a discontinued operation, to 31 May 2017
– £1,435m loss on sale of 33.7% of BAGL’s issued share capital, comprising
– £1,375m recycling of the currency translation reserve to the income statement, owing to the weakening of the ZAR since initial consolidation of BAGL in 2005
– £60m loss on sale
– £206m impairment of Barclays’ holding in BAGL
• Tangible equity and risk weighted assets of Africa Banking are included within Head Office
• For regulatory reporting purposes, BAGL is treated on a proportional consolidated basis, based on a holding of 23.4%2
1 Included in Group income statement as profit after tax in respect of discontinued operation | 2 Barclays has an obligation to contribute 1.5% of BAGL’s ordinary shares to the Black Economic Empowerment Scheme, and 7.0% is allocated to the Public Investment Corporation (PIC) who is expected to take receipt of the shares following the necessary regulatory approvals |
Q217 highlights

38 | Barclays H1/Q2 2017 Financial Results | 28 July 2017
A
1.3%
3.7%
1.7%
8.1%
2.1% 1.3%
4.0%
1.7%
7.3%
2.0%
Barclays UK Barclays
International
Core Non-Core Group
Dec-16 Jun-17
Underlying stable trends reflect prudent approach to credit risk management
Retail CRL % of Gross L&A Prudent risk management
3.9%
0.8% 1.0% 0.7%
1.0%
4.4%
0.7% 0.9% 0.7% 0.9%
Barclays UK Barclays
International
Core Non-Core Group
• Remain well-positioned, having maintained a consistently prudent risk appetite since the financial crisis
• In US Cards, as part of our ongoing focus to rebalance the composition of our overall risk profile with a greater emphasis on high-quality credit card accounts, $1.6bn of higher risk accounts were sold in Q117
• Strong CRL coverage ratios continue to provide significant protection
− Core Retail CRL coverage ratio of 96% (Dec-16: 91%)
− Core Wholesale CRL coverage ratio of 56% (Dec-16: 50%)
91% 96%
50% 56%
82% 86%
52% 56%
CRL coverage
Wholesale CRL % Gross L&A
A Slide 38
B Slide 41

39 | Barclays H1/Q2 2017 Financial Results | 28 July 2017
A
Flat underlying impairment trends in UK Cards and active management of US Cards growth
A Slide 39
B Slide 42
Q217 UK Cards balance mix UK Cards Interest earning lending (IEL), as % of balances1
£16.2bn
0% Balance Transfers are <30%
• c.90% has a duration of <24 months
• Majority taken by existing customers
• Prudent EIR of <5%
• EIR income recognised on the balance sheet <£40m
< 30%
Stable card portfolio arrears rates
0% Balance Transfers
Barclaycard UK
Industry
63%
56%
1 Source: BBA, June 2017 |
UK Cards US Cards
2.2% 2.2% 2.4%
2.6%
2.3% 2.2%
1.1% 1.0% 1.1% 1.3% 1.2% 1.1%
Q116 Q216 Q316 Q416 Q117 Q217
30 day arrears 90 day arrears
50%
60%
70%
80%
May-12 May-13 May-14 May-15 May-16 May-17
2.3% 2.3% 2.0%
1.9% 2.0% 2.0%
1.2% 1.2% 1.0% 0.9% 0.9% 0.9%
0%
1%
2%
3%
Q116 Q216 Q316 Q416 Q117 Q217
40 | Barclays H1/Q2 2017 Financial Results | 28 July 2017
A
292
284
5 4
2
2
2
2 1
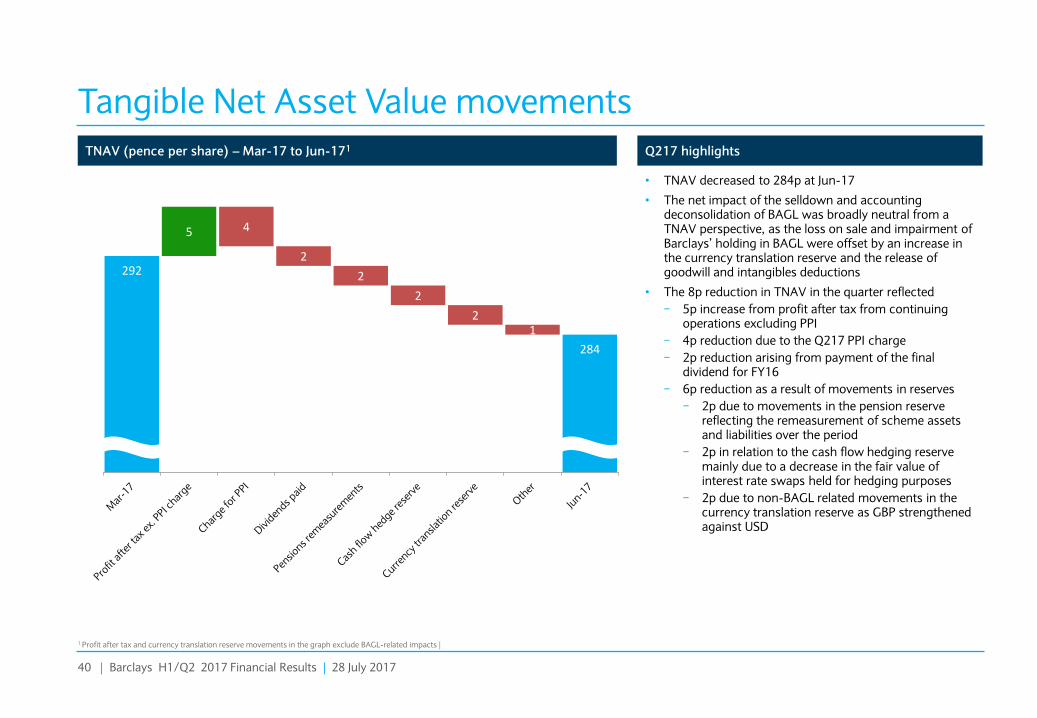
Tangible Net Asset Value movements TNAV (pence per share) – Mar-17 to Jun-171
• TNAV decreased to 284p at Jun-17
• The net impact of the selldown and accounting deconsolidation of BAGL was broadly neutral from a TNAV perspective, as the loss on sale and impairment of Barclays’ holding in BAGL were offset by an increase in the currency translation reserve and the release of goodwill and intangibles deductions
• The 8p reduction in TNAV in the quarter reflected
− 5p increase from profit after tax from continuing operations excluding PPI
− 4p reduction due to the Q217 PPI charge
− 2p reduction arising from payment of the final dividend for FY16
− 6p reduction as a result of movements in reserves
− 2p due to movements in the pension reserve reflecting the remeasurement of scheme assets and liabilities over the period
− 2p in relation to the cash flow hedging reserve mainly due to a decrease in the fair value of interest rate swaps held for hedging purposes
− 2p due to non-BAGL related movements in the currency translation reserve as GBP strengthened against USD
Q217 highlights
A Slide 29
1 Profit after tax and currency translation reserve movements in the graph exclude BAGL-related impacts |

41 | Barclays H1/Q2 2017 Financial Results | 28 July 2017
A
Managing evolving future minimum CET1 levels
• End-state CET1 ratio expectation of around13%:
– Assuming the introduction of a UK countercyclical buffer of 1% from November 2018, this would translate to around 45bps for the Group based on our UK exposures
– This would result in a CRD IV MDR hurdle rate of 11.3%
– With a management buffer of 150-200bps, this would create stress capacity of 450-500bps
• As capital buffers and RWAs will evolve over time, we manage our CET1 position to maintain a prudent internal management buffer over future minimum levels. This is to guard against mandatory distribution restrictions pursuant to CRD IV and to take into account stress testing
• The management buffer is prudently calibrated, intended to absorb fluctuations in the CET1 ratio, cover event risk and stress, and to enable management actions to be taken in sufficient time to avoid mandatory distribution restrictions
Capital Conservation Buffer (CCB)
Minimum CRD IV CET1 requirement
G-SIB buffer
CRDIV Mandatory distribution restrictions (MDR) hurdle 2017 Pillar 2A CET1 requirement
BoE stress test systemic reference point for 2017 tests1
Illustrative evolution of minimum CET1 requirements and buffers
4.5% 4.5%
2.3% 2.3%
1.0% 1.5%
1.3%
2.5%
0.5%
Jan-17 End-state
Q217 CET1
13.1%
9.0%
11.3%
1.5-2% Management buffer
Future CET1 ratio = Regulatory minimum level + 1.5-2% management buffer
7.8%
Current buffer: 4.1%
8.3%
Stress capacity: 4.5-5% Average “stress loss”2 of last three BoE stress tests: 300bps
c.13%
Countercyclical buffer
A Slide 41
B Slide 25
C Slide 7
1 Based on Barclays’ understanding of “The Bank of England’s approach to stress testing the UK banking system” published in October 2015 and “Stress testing the UK banking system: key elements of the 2016 stress test”, published March 2016 | 2 Average stress-loss of past three years based on applicable year-end CET1 ratios against low-point stress outcomes |

42 | Barclays H1/Q2 2017 Financial Results | 28 July 2017
A
Evolving CRD IV capital structure transitioning to HoldCo over time
• Transitional total capital ratio increased to 20.7% (Dec-16: 19.6%), while the fully loaded total capital ratio increased to 19.8% (Dec-16: 18.5%)
• Currently most OpCo capital is expected to be eligible CRD IV capital during and, to the extent outstanding, after the grandfathering period. It is also mostly expected to qualify as MREL until 1 January 2022 based on our understanding of the current Bank of England position
• We aim to manage our capital structure in an efficient manner:
– Expect to hold a surplus to 2.3% of AT1 through regular issuance over time
– The appropriate balance of Tier 2 will be informed by relative pricing of Senior and Tier 2 and investor appetite
• Barclays’ 2017 Pillar 2A requirement as per the PRA’s Individual Capital Guidance (ICG) is c.4.0%. The ICG is subject to at least annual review. This is split:
– CET1 of 2.3% (assuming 56% of total P2A requirement)
– AT1 of 0.8% (assuming 19% of total P2A requirement)
– T2 of 1.0% (assuming 25% of total P2A requirement)
• Basel Committee consultations and reviews of approaches to Pillar 1 and Pillar 2 risk might further impact the Pillar 2A requirement in the future
Illustrative evolution of CRD IV capital structure
Pillar 2A requirement
Well managed and balanced total capital structure
C Slide 8
B Slide 27
13.1% (£45.7bn)
CET1
2.4% (£7.7bn) AT1
1.1% (£3.7bn) Legacy T1
4.1% (£13.4bn)
T2
20.7% Total capital ratio
End-state
capital structure
2.3% P2A
4.5% CET1
2.5% Capital
Conservation buffer
1.5-2% Management buffer
1.5% G-SIB
≥ 2.3% AT1 (incl. P2A)
≥3% T2
(incl. P2A)
≥18.0% Total capital ratio
0.5% CCyB
Jun-17
capital structure
(PRA transitional)
13.1% (£42.8bn)
CET1
2.3% (£7.7bn) AT1
1.1% (£3.7bn) Legacy T1
4.1% (£13.4bn)
T2
A Slide 42
43 | Barclays H1/Q2 2017 Financial Results | 28 July 2017
A
4.5% 4.5% 4.5%
2.3% 2.3% 2.3%
1.0% 1.1% 1.5%
1.3% 1.9%
2.5%
0.5%
Jan-17 Jan-18 Jan-19
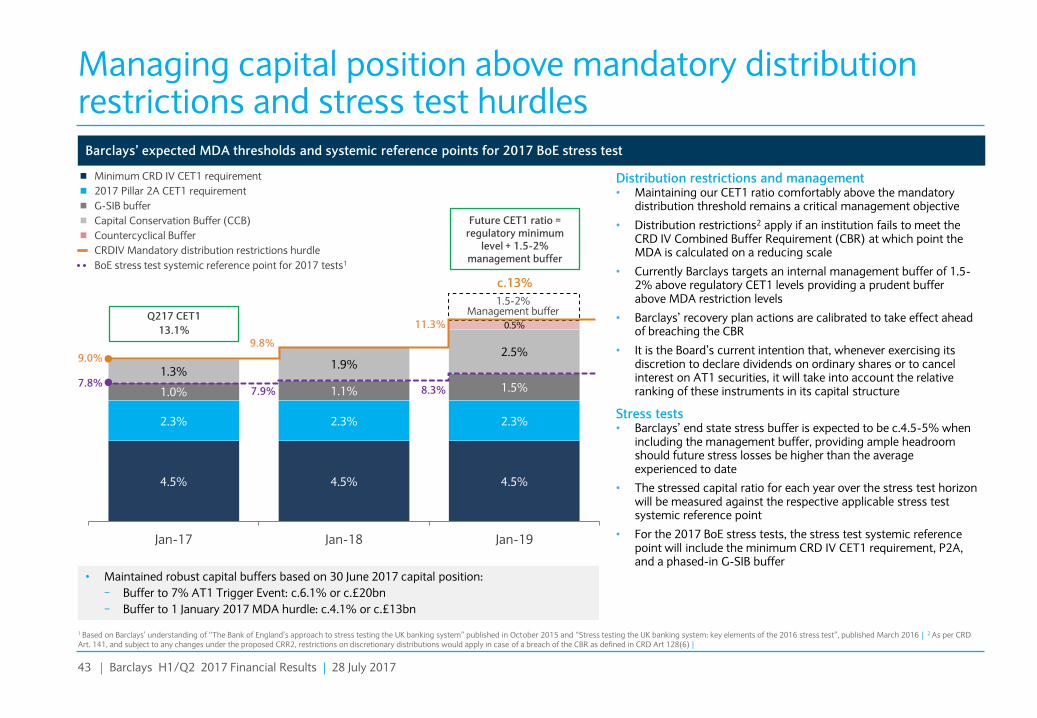
Managing capital position above mandatory distribution restrictions and stress test hurdles
Barclays’ expected MDA thresholds and systemic reference points for 2017 BoE stress test
Future CET1 ratio = regulatory minimum
level + 1.5-2% management buffer
Capital Conservation Buffer (CCB)
Minimum CRD IV CET1 requirement
G-SIB buffer
CRDIV Mandatory distribution restrictions hurdle
2017 Pillar 2A CET1 requirement
BoE stress test systemic reference point for 2017 tests1
Distribution restrictions and management • Maintaining our CET1 ratio comfortably above the mandatory
distribution threshold remains a critical management objective
• Distribution restrictions2 apply if an institution fails to meet the CRD IV Combined Buffer Requirement (CBR) at which point the MDA is calculated on a reducing scale
• Currently Barclays targets an internal management buffer of 1.5-2% above regulatory CET1 levels providing a prudent buffer above MDA restriction levels
• Barclays’ recovery plan actions are calibrated to take effect ahead of breaching the CBR
• It is the Board’s current intention that, whenever exercising its discretion to declare dividends on ordinary shares or to cancel interest on AT1 securities, it will take into account the relative ranking of these instruments in its capital structure
Stress tests • Barclays’ end state stress buffer is expected to be c.4.5-5% when
including the management buffer, providing ample headroom should future stress losses be higher than the average experienced to date
• The stressed capital ratio for each year over the stress test horizon will be measured against the respective applicable stress test systemic reference point
• For the 2017 BoE stress tests, the stress test systemic reference point will include the minimum CRD IV CET1 requirement, P2A, and a phased-in G-SIB buffer
• Maintained robust capital buffers based on 30 June 2017 capital position:
− Buffer to 7% AT1 Trigger Event: c.6.1% or c.£20bn
− Buffer to 1 January 2017 MDA hurdle: c.4.1% or c.£13bn
Q217 CET1
13.1%
1.5-2% Management buffer
7.8% 8.3%
9.0%
11.3%
c.13%
7.9%
9.8%
C Slide 17
B Slide 26
A Slide 43
Countercyclical Buffer
1 Based on Barclays’ understanding of “The Bank of England’s approach to stress testing the UK banking system” published in October 2015 and “Stress testing the UK banking system: key elements of the 2016 stress test”, published March 2016 | 2 As per CRD Art. 141, and subject to any changes under the proposed CRR2, restrictions on discretionary distributions would apply in case of a breach of the CBR as defined in CRD Art 128(6) |

44 | Barclays H1/Q2 2017 Financial Results | 28 July 2017
A
Progressing well on MREL issuance
Issuance plan – currently expect average issuance of c.£8bn p.a. from 20182
• Our MREL issuance guidance for 2017 is c.£10bn of which we have issued £7.6bn equivalent year-to-date. Remaining issuance this year is expected to comprise a combination of Senior, Tier 2 and AT1
• Beyond 2017, we currently envisage average issuance of around £8bn equivalent per annum to enable us to accommodate some RWA growth over time and to allow for a prudent MREL management buffer
• With c.£26bn of outstanding OpCo term debt and capital instruments maturing or callable by 1 January 20223 , remaining issuance is largely a matter of refinancing
• MREL position of 26.8% as at Jun-17 on a transitional basis, including eligible OpCo instruments, compared to 23.2% on a HoldCo-only basis
Requirements
• Barclays’ non-binding indicative MREL is currently expected to be 28.5% of RWAs from 1 January 2022 comprising
− Loss absorption and recapitalisation amounts
− Regulatory buffers including a 1.5% G-SIB buffer, 2.5% Capital Conservation Buffer and 0.5% from the planned introduction of a 1% Countercyclical Buffer for the UK
Well advanced on HoldCo issuance plan
A Slide 44
B Slide 30
HoldCo MREL position and requirement including requisite buffers
C Slide 9
Rec
apit
alis
atio
n
Loss
-ab
sorp
tio
n
12.9% (£45.7bn)
CET1
2.2% (£7.7bn) AT1
1.5% (£5.2bn) T2
6.0% (£21.2bn)
Senior
HoldCo MREL position Expected requirement
28.5%
P2A: 4%
P1: 8%
P1: 8%
P2A: 4%
CCB: 2.5%
G-SIB: 1.5%
CCyB: 0.5%
Jun-17 01-Jan-221
1 2022 requirements subject to BoE review by end-2020 | 2 Issuance plan subject to, amongst other things, market conditions and regulatory requirements which are subject to change and may differ from current expectations | 3 Aggregated Tier 1 and Tier 2 capital instruments, and public and private senior unsecured debt, excluding structured notes |
23.2%
13.1% (£42.8bn)
CET1
2.3% (£7.7bn) AT1
1.6% (£5.2bn) T2
6.2% (£20.4bn)
Senior

45 | Barclays H1/Q2 2017 Financial Results | 28 July 2017
A
High level of liquidity and conservative funding profile LCR continues to remain in prudential surplus Conservative and stable funding profile (£bn – excludes BAGL)
• Retail loan to deposit ratio of 81% at end of Jun-172
• Wholesale funding diversified across currencies, notably in USD, EUR and GBP
• The Group has £8.6bn of term funding maturing in the remainder of 2017 across public and private senior unsecured and secured, and capital instruments
• NSFR continues to exceed future minimum requirement of 100%
62% 62% 64% 65% 64%
4% 4% 4% 4% 4% 7% 8% 7% 4% 3%
14% 13% 13% 15% 16%
14% 13% 11% 12% 12%
Dec-13 Dec-14 Dec-15 Dec-16 Jun-17
Customer deposits Sub. Debt1 Secured term funding
Short-term debt and other deposits Unsecured term funding
£528bn £508bn £499bn £537bn £522bn
C Slide 10
96%
124%
133% 131%
140%
149%
Dec-13 Dec-14 Dec-15 Dec-16 Mar-17 Jun-17
• Liquidity pool increased £36bn in the half to £201bn and the LCR increased to 149% equivalent to a surplus of £65bn to 100%
• The overall increase in the liquidity pool reflects net increase in MREL issuance, drawdown of the Term Funding Scheme, higher money market balances and deposit growth
• Quality of the pool remains high with the majority held in cash and deposits with central banks and highly rated government bonds
1 Excludes AT1 capital and preference shares | 2 Loan: deposit ratio for Barclays UK, Barclays International and Non-Core, excluding investment banking businesses |
A Slide 45
B Slide 33

46 | Barclays H1/Q2 2017 Financial Results | 28 July 2017
A
Progress on Group legal structure
Progress Highlights
• Non-public US IHC CCAR completed in 2017
• Conditional ring-fenced bank licence approved by the Bank of England
• Infrastructure readiness progressing to plan
Barclays PLC
UK consumer and business bank differentiated by scale and digital innovation
Barclays UK
Formation of the UK Ring-fenced Bank
prior to 1 January 2019
Barclays International
Diversified transatlantic wholesale and consumer bank
Fu
ture
le
ga
l e
nti
ty
co
nst
ruc
ts
Multiple entities US IHC
Barclays Bank PLC (and subsidiaries)
Div
isio
na
l c
on
stru
cts
Provides critical services to Barclays UK and
Barclays International to deliver operational continuity
Group Service Company1
A Slide 46
B Slide 37
C Slide 22
1 Rated “A-” (negative outlook) by S&P, in line with the Group Credit Profile |

47 | Barclays H1/Q2 2017 Financial Results | 28 July 2017
A
Structural reform plan remains on track achieving critical milestones as planned
Milestones completed
Legal entity repositioned and rated
Target operating model agreed
Relevant services identified and catalogued
Milestones to complete
• Migrate assets, contracts and employees
• Introduce arms-length service management
• Continue to prepare internal infrastructure
Milestones completed
Barclays UK and Barclays International established as operating divisions in March 2016 to reflect the businesses within the future-state legal entities
Conditional banking licence approved for the Ring-Fenced Bank in April 2017
Ongoing communication with customers and clients with positive feedback to date
Successfully commenced our sort code migration process
Milestones to complete
• Ring-Fencing Transfer Scheme (RFTS) court process to be initiated in November 2017
• Continue to prepare internal infrastructure
H2 2017 Group Service Company setup H1 2018 Legal entity separation
Supports delivery of fundamentally strong banking propositions for all of our stakeholders, consistent with the Group’s strategy of being a transatlantic, consumer, corporate and investment bank
A Slide 47
B Slide 39
C Slide 11

48 | Barclays H1/Q2 2017 Financial Results | 28 July 2017
A
Current Senior Long and Short Term ratings
Fitch Standard & Poor’s Moody's
Barclays PLC (B PLC – HoldCo)
Barclays Bank PLC (BB PLC – OpCo)
Outlook – Post EU referendum
STABLE NEGATIVE NEGATIVE
Ratings are a key strategic priority Future ratings expectations of Barclays UK and Barclays Bank PLC • Rating agencies have made various
statements on their expectation of ratings post ring-fencing
− Fitch has said that they expect ratings differentiation to be small, if any
− S&P already incorporates the expected implications of structural reform in its rating of BB PLC. It also expects the ring-fenced bank to be rated one-notch higher than BB PLC, subject to finalisation
− Moody’s expects standalone profiles of ring-fenced/non-ring fenced banks to be in line, or stronger/weaker than, those of existing banks
Rating priorities • Barclays’ objective is to maintain solid
investment grade ratings
• We intend to create as much stability in the ratings of Barclays PLC and Barclays Bank PLC as we can – both before and after structural reform
• Focus on execution of strategy to support credit fundamentals
A
F1
A DCR1: A
F1
Baa2
P-3
A1
P-1
BBB
A-2
A-
A-2 CRA2: A1
A Slide 48
B Slide 44
C Slide 12
1 Derivative counterparty rating | 2 Counterparty rating assessment |

49 | Barclays H1/Q2 2017 Financial Results | 28 July 2017
A
Disclaimer Important Notice The information, statements and opinions contained in this presentation do not constitute a public offer under any applicable legislation, an offer to sell or solicitation of any offer to buy any securities or financial instruments, or any advice or recommendation with respect to such securities or other financial instruments.
Forward-looking Statements This document contains certain forward-looking statements within the meaning of Section 21E of the US Securities Exchange Act of 1934, as amended, and Section 27A of the US Securities Act of 1933, as amended, with respect to the Group. Barclays cautions readers that no forward-looking statement is a guarantee of future performance and that actual results or other financial condition or performance measures could differ materially from those contained in the forward-looking statements. These forward-looking statements can be identified by the fact that they do not relate only to historical or current facts. Forward-looking statements sometimes use words such as ‘may’, ‘will’, ’seek’, ‘continue’, ‘aim’, ‘anticipate’, ‘target’, ‘projected’, ‘expect’, ‘estimate’, ‘intend’, ‘plan’, ‘goal’, ‘believe’, ‘achieve’ or other words of similar meaning. Examples of forward-looking statements include, among others, statements or guidance regarding or relating to the Group’s future financial position, income growth, assets, impairment charges, provisions, notable items, business strategy, structural reform, capital, leverage and other regulatory ratios, payment of dividends (including dividend pay-out ratios and expected payment strategies), projected levels of growth in the banking and financial markets, projected costs or savings, original and revised commitments and targets in connection with the Group Strategy Update, rundown of assets and businesses within Barclays Non-Core, sell down of the Group’s interest in Barclays Africa Group Limited or the impact of any regulatory deconsolidation, estimates of capital expenditures and plans and objectives for future operations, projected employee numbers and other statements that are not historical fact. By their nature, forward-looking statements involve risk and uncertainty because they relate to future events and circumstances. These may be affected by changes in legislation, the development of standards and interpretations under International Financial Reporting Standards, evolving practices with regard to the interpretation and application of accounting and regulatory standards, the outcome of current and future legal proceedings and regulatory investigations, future levels of conduct provisions, future levels of notable items, the policies and actions of governmental and regulatory authorities, geopolitical risks and the impact of competition. In addition, factors including (but not limited to) the following may have an effect: capital, leverage and other regulatory rules (including with regard to the future structure of the Group) applicable to past, current and future periods; UK, US, Africa, Eurozone and global macroeconomic and business conditions; the effects of continued volatility in credit markets; market related risks such as changes in interest rates and foreign exchange rates; effects of changes in valuation of credit market exposures; changes in valuation of issued securities; volatility in capital markets; changes in credit ratings of any entities within the Group or any securities issued by such entities; the potential for one or more countries exiting the Eurozone; the implications of the exercise by the United Kingdom of Article 50 of the Treaty of Lisbon and the disruption that may result in the UK and globally from the withdrawal of the United Kingdom from the European Union; and the success of future acquisitions, disposals and other strategic transactions. A number of these influences and factors are beyond the Group’s control. As a result, the Group’s actual future results, dividend payments, and capital and leverage ratios may differ materially from the plans, goals, expectations and guidance set forth in the Group’s forward-looking statements. Additional risks and factors which may impact the Group’s future financial condition and performance are identified in our filings with the SEC (including, without limitation, our annual report on form 20-F for the fiscal year ended 31 December 2016), which are available on the SEC‟s website at www.sec.gov. Subject to our obligations under the applicable laws and regulations of the United Kingdom and the United States in relation to disclosure and ongoing information, we undertake no obligation to update publicly or revise any forward looking statements, whether as a result of new information, future events or otherwise.