Embed Size (px)
Citation preview
Barclays PLC Interim Pillar 3 Report30 June 2021
Barclays PLC Pillar 3 Page
Introduction
KM1 – Key Metrics 7
Capital
CC1 - Composition of Regulatory Capital 10
CC2 - Reconciliation of regulatory capital to balance sheet 13
IFRS 9
IFRS 9-FL - Comparison of with and without the IFRS9 transitional arrangements 15
Risk weighted assets (RWA)
RWAs by risk type and business 18
OV1 - Overview of RWAs by risk type and capital requirements 19
Movements in RWAs 20
CR8 - RWA flow statement of credit risk exposures under the advanced IRB approach 20
CCR7 - RWA flow statement of counterparty credit risk exposures under the IMM 21
MR2-B - RWA flow statement of market risk exposures under the IMA 21
Basis of preparation for movements in RWAs 22
Leverage
Summary of reconciliation of accounting assets and leverage ratio exposures 23
Leverage ratio common disclosure 24
Split-up of on balance sheet exposures (excluding derivatives, SFTs and exempted exposures) 26
Minimum Requirements for own funds and Eligible Liabilities (MREL)
KM2 – Key Metrics – TLAC Requirements 27
TLAC 1 – TLAC composition for G-SIBs 28
TLAC 3 – Resolution entity – creditor ranking at legal entity level 29
TLAC 2 – Material subgroup entity – creditor ranking at legal entity level 30
Liquidity
LIQ1 - Liquidity Coverage ratio 32
Analysis of credit risk
Detailed view of credit risk Exposure at default (EAD), RWA and capital requirements 33
CR3 - CRM techniques 35
CR4 - Standardised – Credit Risk exposure and CRM effect 36
CR7 - Effect on RWA of credit derivatives used as CRM techniques (advanced IRB) 37
CR5-A - Analysis of exposures by asset classes and risk weight pre-CCF and CRM under the standardised approach 38
CR5-B - Analysis of exposures by asset classes and risk weight post-CCF and CRM under the standardised approach 40
Internal default grade probabilities and mapping to external ratings 42
CR6 - Credit risk exposures by exposure class and PD range for central governments and central banks 43
CR6 - Credit risk exposures by exposure class and PD range for institutions 44
CR6 - Credit risk exposures by exposure class and PD range for corporates 45
CR6 - Credit risk exposures by exposure class and PD range for corporates, of which: SMEs 46
CR10 - Corporate exposures subject to slotting approach 47
CR6 - Credit risk exposures by exposure class and PD range for retail SME 49
CR6 - Credit risk exposures by exposure class and PD range for secured retail 50
CR6 - Credit risk exposures by exposure class and PD range for revolving retail 51
CR6 - Credit risk exposures by exposure class and PD range for other retail exposures 52
CR1-A – Credit quality of exposures by exposure class and instrument 53
CR1-B – Credit quality of exposures by industry or counterparty types 57
CR1-C – Credit quality of exposures by geography 59
Table of contents
Barclays PLC 2
Credit quality of forborne exposures 61
Credit quality of performing and non-performing exposures by past due days 63
Performing and non-performing exposures and related provisions 67
Collateral obtained by taking possession and execution processes 71
CR2-B – Changes in the stock of defaulted and impaired loans and debt securities 72
CR2-A – Changes in the stock of general and specific credit risk adjustments 72
Loans and advances subject to legislative and non-legislative moratoria 73
Breakdown of loans and advances subject to legislative and non-legislative moratoria by residual maturity of moratoria 74Newly originated loans and advances provided under newly applicable public guarantee schemes introduced in response to COVID-19 crisis
74
Analysis of counterparty credit risk
Detailed view of counterparty credit risk EAD, RWA and capital 75
CCR1 – Analysis of CCR exposure by approach 77
CCR3 - Counterparty credit risk exposures by exposure classes and risk weight under standardised approach 78
CCR4 - Counterparty credit risk exposures by portfolio and PD range for central governments and central banks 80
CCR4 - Counterparty credit risk exposures by portfolio and PD range for institutions 81
CCR4 - Counterparty credit risk exposures by portfolio and PD range for corporates 82
CR10 - Counterparty Credit risk – Corporate exposures subject to slotting approach 83
CCR5-A - Impact of netting and collateral held on exposure value 85
CCR5-B - Composition of collateral for exposures to CCR 85
CCR6 - Credit derivatives exposures 86
CCR8 - Exposures to CCPs 87
CCR2 - Credit valuation adjustment (CVA) capital charge 88
Analysis of market risk
Analysis of regulatory VaR, SVaR, IRC and CRM 89
Breakdown of the major regulatory risk measures by portfolio 90
Market risk own funds requirements 91
MR1 - Market risk under standardised approach 92
MR2-A - Market risk under internal models approach 93
MR4-Comparison of VaR estimates with gains/losses 95
Table of contents
Barclays PLC 3
The terms Barclays or Group refer to Barclays PLC together with its subsidiaries. The abbreviations ‘£m’ and ‘£bn’ represent millions and thousands of millions of Pounds Sterling respectively.
There are a number of key judgement areas, for example impairment calculations, which are based on models and which are subject to ongoing adjustment and modifications. Reported numbers reflect best estimates and judgements at the given point in time.
Relevant terms that are used in this document but are not defined under applicable regulatory guidance or International Financial Reporting Standards (IFRS) are explained in the results glossary that can be accessed at home.barclays/investor-relations/reports-and-events/latest-financial-results.
Forward-looking statements
This document contains certain forward-looking statements within the meaning of Section 21E of the US Securities Exchange Act of 1934, as amended, and Section 27A of the US Securities Act of 1933, as amended, with respect to the Group. Barclays cautions readers that no forward-looking statement is a guarantee of future performance and that actual results or other financial condition or performance measures could differ materially from those contained in the forward-looking statements. These forward-looking statements can be identified by the fact that they do not relate only to historical or current facts. Forward-looking statements sometimes use words such as ‘may’, ‘will’, ‘seek’, ‘continue’, ‘aim’, ‘anticipate’, ‘target’, ‘projected’, ‘expect’, ‘estimate’, ‘intend’, ‘plan’, ‘goal’, ‘believe’, ‘achieve’ or other words of similar meaning. Forward-looking statements can be made in writing but also may be made verbally by members of the management of the Group (including, without limitation, during management presentations to financial analysts) in connection with this document. Examples of forward-looking statements include, among others, statements or guidance regarding or relating to the Group’s future financial position, income growth, assets, impairment charges, provisions, business strategy, capital, leverage and other regulatory ratios, capital distributions (including dividend pay-out ratios and expected payment strategies), projected levels of growth in the banking and financial markets, projected costs or savings, any commitments and targets, estimates of capital expenditures, plans and objectives for future operations, projected employee numbers, IFRS impacts and other statements that are not historical fact. By their nature, forward-looking statements involve risk and uncertainty because they relate to future events and circumstances. The forward-looking statements speak only as at the date on which they are made. Forward-looking statements may be affected by changes in legislation, the development of standards and interpretations under IFRS, including evolving practices with regard to the interpretation and application of accounting and regulatory standards, the outcome of current and future legal proceedings and regulatory investigations, future levels of conduct provisions, the policies and actions of governmental and regulatory authorities, the Group’s ability along with governments and other stakeholders to measure, manage and mitigate the impacts of climate change effectively, geopolitical risks and the impact of competition. In addition, factors including (but not limited to) the following may have an effect: capital, leverage and other regulatory rules applicable to past, current and future periods; UK, US, Eurozone and global macroeconomic and business conditions; the effects of any volatility in credit markets; market related risks such as changes in interest rates and foreign exchange rates; effects of changes in valuation of credit market exposures; changes in valuation of issued securities; volatility in capital markets; changes in credit ratings of any entity within the Group or any securities issued by such entities; direct and indirect impacts of the coronavirus (COVID-19) pandemic; instability as a result of the UK’s exit from the European Union (“EU”), the effects of the EU-UK Trade and Cooperation Agreement and the disruption that may subsequently result in the UK and globally; the risk of cyber-attacks, information or security breaches or technology failures on the Group’s reputation, business or operations; and the success of future acquisitions, disposals and other strategic transactions. A number of these influences and factors are beyond the Group’s control. As a result, the Group’s actual financial position, future results, capital distributions, capital, leverage or other regulatory ratios or other financial and non-financial metrics or performance measures may differ materially from the statements or guidance set forth in the Group’s forward-looking statements. Additional risks and factors which may impact the Group’s future financial condition and performance are identified in Barclays PLC’s filings with the SEC (including, without limitation, Barclays PLC’s Annual Report on Form 20-F for the fiscal year ended 31 December 2020 and Interim Results Announcement for the six months ended 30 June 2021 filed on Form 6-K), which are available on the SEC’s website at www.sec.gov.
Subject to Barclays’ obligations under the applicable laws and regulations of any relevant jurisdiction, (including, without limitation, the UK and the US), in relation to disclosure and ongoing information, we undertake no obligation to update publicly or revise any forward-looking statements, whether as a result of new information, future events or otherwise.
Notes
Barclays PLC 4
Disclosure Background
Barclays’ Pillar 3 disclosures complement those disclosed in the Barclays 2021 Interim Results Announcement and provide additional information about Barclays’ risk profile, including its regulatory capital, minimum requirements for own funds and eligible liabilities (MREL), RWAs, liquidity and leverage exposures for Barclays Group, and its significant subsidiaries.
The Pillar 3 report is prepared in accordance with the Capital Requirements Regulation and Capital Requirements Directive (‘CRR’ and ‘CRD IV’ respectively, also known as the ‘CRD IV legislative package’). In particular, articles 431 to 455 of the CRR specify the Pillar 3 framework requirements.
Following the withdrawal of the UK from the EU, any references to CRR as amended by CRR II mean, unless otherwise specified, CRR as amended by CRR II, as it forms part of UK law pursuant to the European Union (Withdrawal) Act 2018 and subject to the temporary transitional powers (TTP) available to UK regulators to delay or phase-in on-shoring changes to UK regulatory requirements arising at the end of the transition period until 31 March 2022, as at the applicable reporting date. With effect from 26 June 2021, the Financial Services Act 2021 amended CRR as amended by CRR II in part. The amendments included an extension to the application of CRR II settlement netting to the CRR leverage exposure which was due to expire on 27 June 2021 under CRR II quick fix measures. Throughout the TTP period, the Bank of England (BoE) and PRA will continue to review the UK regulatory framework and the Group disclosures will reflect the amended framework as applicable at the effective reporting date.
On 26 April 2019, a prudential backstop was implemented for qualifying exposures originating after 26 April 2019 that have been non-performing for more than 2 years. Where minimum coverage requirements for qualifying non-performing exposures are not met, the difference must be deducted from CET1 capital. Different conversion factors are applied for secured and unsecured exposures depending on the length of time the exposures have been non-performing. For 2021, the conversion factor applied to secured non-performing exposures is 0% and for unsecured non-performing exposures is 35% prior to any coverage being applied. For H121 the impact to CET1 capital is immaterial.
On 29 June 2021, the FPC and PRA issued a consultation paper on proposed changes to the UK leverage ratio framework. The consultation states the intention to move to a single UK leverage ratio requirement meaning that the CRR leverage ratio will no longer apply for UK banks from 1 January 2022. Whilst largely upholding the existing framework, some technical changes to the exposure measure have been proposed that will align to the Basel III standards. Minimum requirements for the Group remain the same with minimum requirements also expected to be applied at the individual level; individual requirements may be replaced with a sub consolidated measure, subject to permission from the PRA, from 1 January 2023.
On 9 July 2021, the PRA published their near final policy statement on the implementation of Basel III standards. The policy statement confirmed the PRA’s intention to revert to the previous treatment of 100% CET1 capital deduction for qualifying software assets, meaning the c.40bps benefit in the CET1 ratio will be reversed from 1 January 2022.
The Pillar 3 disclosures have also been prepared in accordance with the EBA “Guidelines on materiality, proprietary and confidentiality and on disclosure frequency under Articles 432(1), 432(2) and 433 of CRR” and the EBA “Guidelines on disclosure requirements under Part Eight of Regulation (EU) No 575/2013”, as amended by Regulation (EU) 2019/876, in force as at the date the UK withdrew from the EU.
The disclosures included in this report reflect Barclays’ interpretation of the current rules and guidance.
In response to the PRA statement published on 27 April 2021, the Group continues to disclose exposures subject to measures applied in response COVID-19 pandemic per the EBA guidelines (EBA/GL/2020/07) published in June 2020. These disclosures also reflect the amendments as per the PRA guidelines on this topic and are included within tables 45-47 of this document.
Barclays’ approach to managing risk, including its internal ratings-based approach, is described within the Barclays Group’s Pillar 3 year-end disclosures. Throughout the half year ended 30 June 2021, and to date, Barclays has operated a framework of disclosure controls and procedures to support the appropriateness of the Group’s Pillar 3 disclosures. Specific governance committees are responsible for examining the Group’s reports and disclosures to ensure that they have been subject to adequate verification and comply with applicable standards and legislation. These committees report their conclusions to the Board Audit Committee.
Significant subsidiaryThe Group's significant subsidiaries as at 30 June 2021 are Barclays Bank PLC, Barclays Bank UK Group and Barclays Bank Ireland PLC. Barclays Bank PLC’s significant subsidiary disclosures are included in this document, whilst the Barclays Bank UK Group and Barclays Bank Ireland PLC Pillar 3 disclosures are published in standalone documents “Barclays Bank UK PLC Pillar 3 Report” and “Barclays Bank Ireland PLC Pillar 3 report” respectively.
Introduction
Barclays PLC 5

Barclays Bank PLCBarclays Bank PLC is the non-ring-fenced bank within the Barclays Group. The Barclays Bank Group contains the majority of the Barclays Group’s Barclays International division, which is comprised of the Corporate and Investment Bank (CIB) and Consumer, Cards and Payments (CC&P) businesses and Head Office.
Barclays Bank PLC is currently regulated by the PRA on a solo-consolidated basis and comprises Barclays Bank PLC plus certain additional subsidiaries, subject to PRA approval. The disclosures provided in this document for Barclays Bank PLC are based on this regulatory scope of consolidation. This differs from the accounting disclosures, where Barclays Bank PLC Group relates to Barclays Bank PLC and all its subsidiaries.
Introduction
Barclays PLC 6
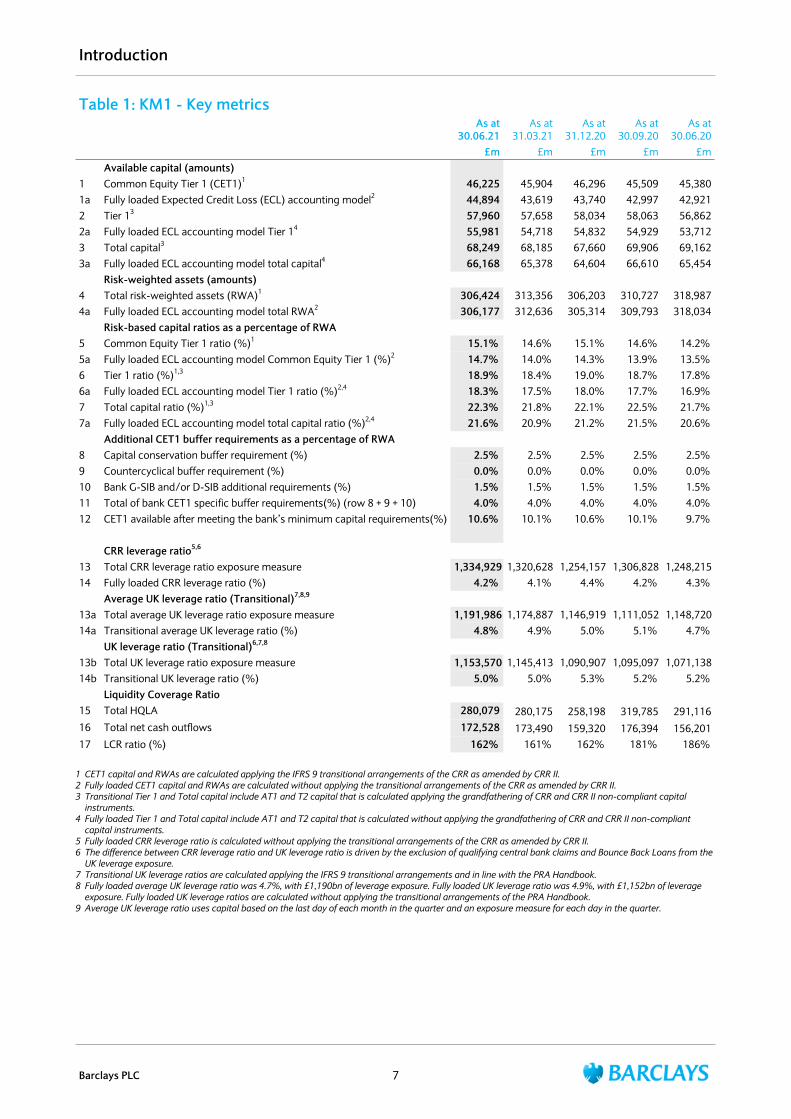
Table 1: KM1 - Key metricsAs at
30.06.21As at
31.03.21As at
31.12.20As at
30.09.20As at
30.06.20£m £m £m £m £m
Available capital (amounts)1 Common Equity Tier 1 (CET1)1 46,225 45,904 46,296 45,509 45,3801a Fully loaded Expected Credit Loss (ECL) accounting model2 44,894 43,619 43,740 42,997 42,9212 Tier 13 57,960 57,658 58,034 58,063 56,8622a Fully loaded ECL accounting model Tier 14 55,981 54,718 54,832 54,929 53,7123 Total capital3 68,249 68,185 67,660 69,906 69,1623a Fully loaded ECL accounting model total capital4 66,168 65,378 64,604 66,610 65,454
Risk-weighted assets (amounts)4 Total risk-weighted assets (RWA)1 306,424 313,356 306,203 310,727 318,9874a Fully loaded ECL accounting model total RWA2 306,177 312,636 305,314 309,793 318,034
Risk-based capital ratios as a percentage of RWA5 Common Equity Tier 1 ratio (%)1 15.1% 14.6% 15.1% 14.6% 14.2% 5a Fully loaded ECL accounting model Common Equity Tier 1 (%)2 14.7% 14.0% 14.3% 13.9% 13.5% 6 Tier 1 ratio (%)1,3 18.9% 18.4% 19.0% 18.7% 17.8% 6a Fully loaded ECL accounting model Tier 1 ratio (%)2,4 18.3% 17.5% 18.0% 17.7% 16.9% 7 Total capital ratio (%)1,3 22.3% 21.8% 22.1% 22.5% 21.7% 7a Fully loaded ECL accounting model total capital ratio (%)2,4 21.6% 20.9% 21.2% 21.5% 20.6%
Additional CET1 buffer requirements as a percentage of RWA8 Capital conservation buffer requirement (%) 2.5% 2.5% 2.5% 2.5% 2.5% 9 Countercyclical buffer requirement (%) 0.0% 0.0% 0.0% 0.0% 0.0% 10 Bank G-SIB and/or D-SIB additional requirements (%) 1.5% 1.5% 1.5% 1.5% 1.5% 11 Total of bank CET1 specific buffer requirements(%) (row 8 + 9 + 10) 4.0% 4.0% 4.0% 4.0% 4.0% 12 CET1 available after meeting the bank’s minimum capital requirements(%) 10.6% 10.1% 10.6% 10.1% 9.7%
CRR leverage ratio5,6
13 Total CRR leverage ratio exposure measure 1,334,929 1,320,628 1,254,157 1,306,828 1,248,215 14 Fully loaded CRR leverage ratio (%) 4.2% 4.1% 4.4% 4.2% 4.3%
Average UK leverage ratio (Transitional)7,8,9
13a Total average UK leverage ratio exposure measure 1,191,986 1,174,887 1,146,919 1,111,052 1,148,720 14a Transitional average UK leverage ratio (%) 4.8% 4.9% 5.0% 5.1% 4.7%
UK leverage ratio (Transitional)6,7,8
13b Total UK leverage ratio exposure measure 1,153,570 1,145,413 1,090,907 1,095,097 1,071,138 14b Transitional UK leverage ratio (%) 5.0% 5.0% 5.3% 5.2% 5.2%
Liquidity Coverage Ratio15 Total HQLA 280,079 280,175 258,198 319,785 291,11616 Total net cash outflows 172,528 173,490 159,320 176,394 156,20117 LCR ratio (%) 162% 161% 162% 181% 186%
1 CET1 capital and RWAs are calculated applying the IFRS 9 transitional arrangements of the CRR as amended by CRR II.2 Fully loaded CET1 capital and RWAs are calculated without applying the transitional arrangements of the CRR as amended by CRR II.3 Transitional Tier 1 and Total capital include AT1 and T2 capital that is calculated applying the grandfathering of CRR and CRR II non-compliant capital
instruments.4 Fully loaded Tier 1 and Total capital include AT1 and T2 capital that is calculated without applying the grandfathering of CRR and CRR II non-compliant
capital instruments. 5 Fully loaded CRR leverage ratio is calculated without applying the transitional arrangements of the CRR as amended by CRR II.6 The difference between CRR leverage ratio and UK leverage ratio is driven by the exclusion of qualifying central bank claims and Bounce Back Loans from the
UK leverage exposure. 7 Transitional UK leverage ratios are calculated applying the IFRS 9 transitional arrangements and in line with the PRA Handbook.8 Fully loaded average UK leverage ratio was 4.7%, with £1,190bn of leverage exposure. Fully loaded UK leverage ratio was 4.9%, with £1,152bn of leverage
exposure. Fully loaded UK leverage ratios are calculated without applying the transitional arrangements of the PRA Handbook.9 Average UK leverage ratio uses capital based on the last day of each month in the quarter and an exposure measure for each day in the quarter.
Introduction
Barclays PLC 7
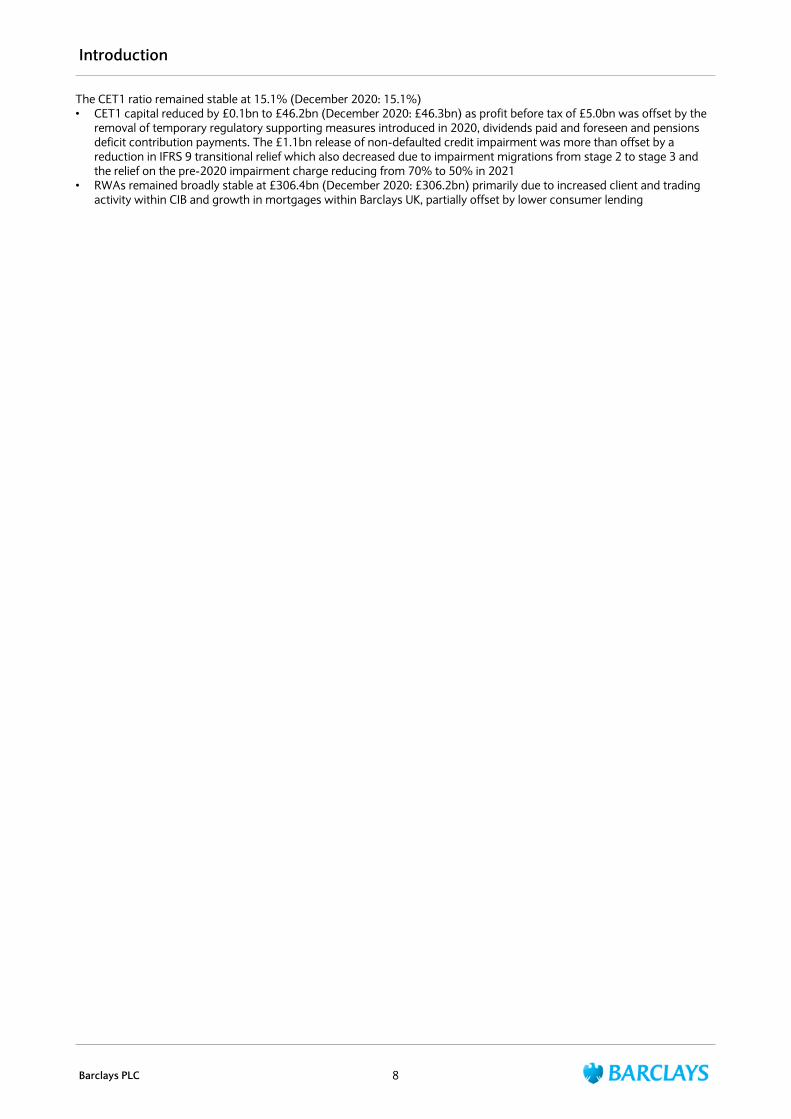
The CET1 ratio remained stable at 15.1% (December 2020: 15.1%)• CET1 capital reduced by £0.1bn to £46.2bn (December 2020: £46.3bn) as profit before tax of £5.0bn was offset by the
removal of temporary regulatory supporting measures introduced in 2020, dividends paid and foreseen and pensions deficit contribution payments. The £1.1bn release of non-defaulted credit impairment was more than offset by a reduction in IFRS 9 transitional relief which also decreased due to impairment migrations from stage 2 to stage 3 and the relief on the pre-2020 impairment charge reducing from 70% to 50% in 2021
• RWAs remained broadly stable at £306.4bn (December 2020: £306.2bn) primarily due to increased client and trading activity within CIB and growth in mortgages within Barclays UK, partially offset by lower consumer lending
Introduction
Barclays PLC 8
Capital
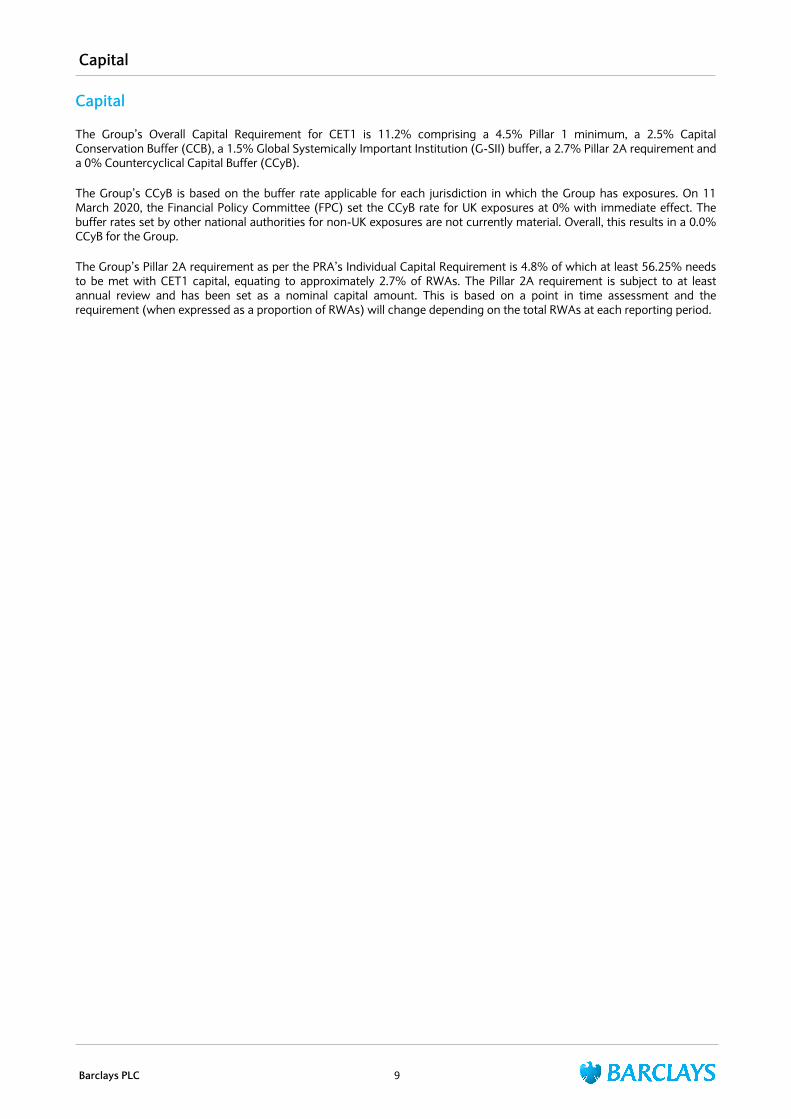
The Group’s Overall Capital Requirement for CET1 is 11.2% comprising a 4.5% Pillar 1 minimum, a 2.5% Capital Conservation Buffer (CCB), a 1.5% Global Systemically Important Institution (G-SII) buffer, a 2.7% Pillar 2A requirement and a 0% Countercyclical Capital Buffer (CCyB).
The Group’s CCyB is based on the buffer rate applicable for each jurisdiction in which the Group has exposures. On 11 March 2020, the Financial Policy Committee (FPC) set the CCyB rate for UK exposures at 0% with immediate effect. The buffer rates set by other national authorities for non-UK exposures are not currently material. Overall, this results in a 0.0% CCyB for the Group.
The Group’s Pillar 2A requirement as per the PRA’s Individual Capital Requirement is 4.8% of which at least 56.25% needs to be met with CET1 capital, equating to approximately 2.7% of RWAs. The Pillar 2A requirement is subject to at least annual review and has been set as a nominal capital amount. This is based on a point in time assessment and the requirement (when expressed as a proportion of RWAs) will change depending on the total RWAs at each reporting period.
Capital
Barclays PLC 9

Table 2: CC1 – Composition of regulatory capitalThis table shows the components of regulatory capital presented on both a transitional and fully loaded basis as at 30 June 2021.
Barclays Group Barclays Bank PLCAs at
30.06.21 Transitional
position
As at 30.06.21
Fully loaded position
As at 30.06.21
Transitional position
As at 30.06.21
Fully loaded position
Ref† £m £m Ref† £m £mCommon Equity Tier 1 capital: instruments and reserves1 Directly issued qualifying common share (and equivalent
for non-joint stock companies) capital plus related stock surplus
a 4,568 4,568 a 2,343 2,343
2 Retained earnings b 48,461 48,461 b 35,429 35,4293 Accumulated other comprehensive income (and other
reserves) c 2,856 2,856 c (541) (541)
Adjustment to retained earnings for foreseeable dividends (545) (545) (21) (21)
Scope of consolidation and other adjustments 88 88 199 199
6 Common Equity Tier 1 capital before regulatory adjustments
55,428 55,428 37,409 37,409
Common Equity Tier 1 capital: regulatory adjustments 7 Prudent valuation adjustments (1,447) (1,447) (1,012) (1,012)8 Goodwill (net of related tax liability) d,e (3,917) (3,917) d (95) (95)9 Other intangibles other than mortgage servicing rights (net
of related tax liability)f,ga (2,897) (2,897) e (14) (14)
10 Deferred tax assets that rely on future profitability excluding those arising from temporary differences (net of related tax liability)
h (664) (664) g (337) (337)
11 Cash flow hedge reserve i (665) (665) h (379) (379)14 Gains and losses due to changes in own credit risk on fair
valued liabilitiesj 934 934 i 817 817
15 Defined-benefit pension fund assets k,ga (1,828) (1,828) j,fa (1,779) (1,779)16 Investments in own shares (if not already subtracted from
paid-in capital on reportedbalance sheet)
(50) (50) — —
19 Significant investments in the common stock of banking, financial and insurance entities that are outside the scope of regulatory consolidation (amount above 10%threshold)
— — k,l (9,509) (9,555)
22 Amount exceeding the 17.65% threshold — — g,k,l (1,027) (1,195)23 of which: significant investment in the common stock of
financials — — k,l (765) (866)
25 of which: deferred tax assets arising from temporary difference
— — g (262) (329)
Adjustment under IFRS 9 transitional arrangementsb 1,331 — 464 — 28 Total regulatory adjustments to Common Equity Tier 1 (9,203) (10,534) (12,871) (13,549)29 Common Equity Tier 1 capital (CET1) 46,225 44,894 24,538 23,860
† The references (a) – (p) identify balance sheet components in Table 3 & 3a: CC2 – Reconciliation of regulatory capital to balance sheet on pages 13 & 14 which are used in the calculation of regulatory capital.
a Deferred tax liabilities on intangible assets and pension fund assets are included as either a negative component of the deferred tax asset or a deferred tax liability on the balance sheet depending on the net deferred tax position of the bank at the time of reporting.
b Barclays Group of which static £638m, of which modified £693m; Barclays Bank PLC of which static £240m, of which modified £224m.
Capital
Barclays PLC 10
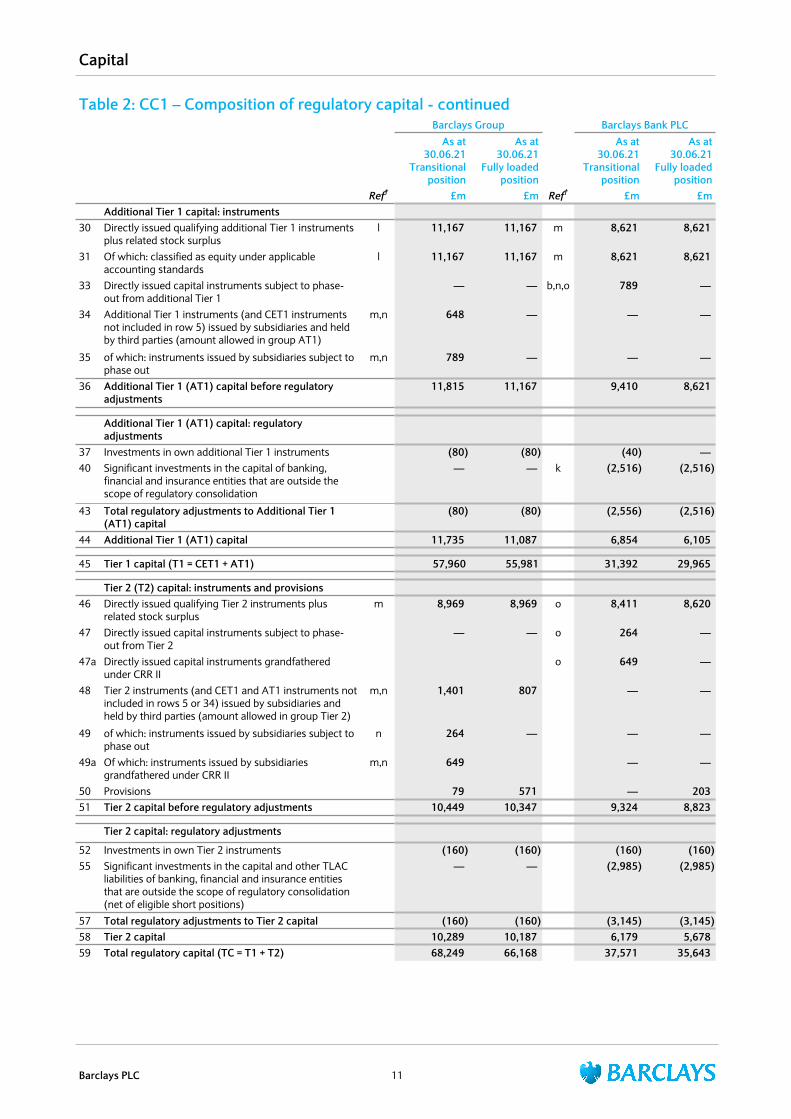
Table 2: CC1 – Composition of regulatory capital - continuedBarclays Group Barclays Bank PLC
As at 30.06.21
Transitional position
As at 30.06.21
Fully loaded position
As at 30.06.21
Transitional position
As at 30.06.21
Fully loaded position
Ref† £m £m Ref† £m £mAdditional Tier 1 capital: instruments
30 Directly issued qualifying additional Tier 1 instruments plus related stock surplus
l 11,167 11,167 m 8,621 8,621
31 Of which: classified as equity under applicable accounting standards
l 11,167 11,167 m 8,621 8,621
33 Directly issued capital instruments subject to phase-out from additional Tier 1
— — b,n,o 789 —
34 Additional Tier 1 instruments (and CET1 instruments not included in row 5) issued by subsidiaries and held by third parties (amount allowed in group AT1)
m,n 648 — — —
35 of which: instruments issued by subsidiaries subject to phase out
m,n 789 — — —
36 Additional Tier 1 (AT1) capital before regulatory adjustments
11,815 11,167 9,410 8,621
Additional Tier 1 (AT1) capital: regulatory adjustments
37 Investments in own additional Tier 1 instruments (80) (80) (40) — 40 Significant investments in the capital of banking,
financial and insurance entities that are outside the scope of regulatory consolidation
— — k (2,516) (2,516)
43 Total regulatory adjustments to Additional Tier 1 (AT1) capital
(80) (80) (2,556) (2,516)
44 Additional Tier 1 (AT1) capital 11,735 11,087 6,854 6,105
45 Tier 1 capital (T1 = CET1 + AT1) 57,960 55,981 31,392 29,965
Tier 2 (T2) capital: instruments and provisions 46 Directly issued qualifying Tier 2 instruments plus
related stock surplusm 8,969 8,969 o 8,411 8,620
47 Directly issued capital instruments subject to phase-out from Tier 2
— — o 264 —
47a Directly issued capital instruments grandfathered under CRR II
o 649 —
48 Tier 2 instruments (and CET1 and AT1 instruments not included in rows 5 or 34) issued by subsidiaries and held by third parties (amount allowed in group Tier 2)
m,n 1,401 807 — —
49 of which: instruments issued by subsidiaries subject to phase out
n 264 — — —
49a Of which: instruments issued by subsidiaries grandfathered under CRR II
m,n 649 — —
50 Provisions 79 571 — 203 51 Tier 2 capital before regulatory adjustments 10,449 10,347 9,324 8,823
Tier 2 capital: regulatory adjustments
52 Investments in own Tier 2 instruments (160) (160) (160) (160) 55 Significant investments in the capital and other TLAC
liabilities of banking, financial and insurance entities that are outside the scope of regulatory consolidation (net of eligible short positions)
— — (2,985) (2,985)
57 Total regulatory adjustments to Tier 2 capital (160) (160) (3,145) (3,145) 58 Tier 2 capital 10,289 10,187 6,179 5,678 59 Total regulatory capital (TC = T1 + T2) 68,249 66,168 37,571 35,643
Capital
Barclays PLC 11
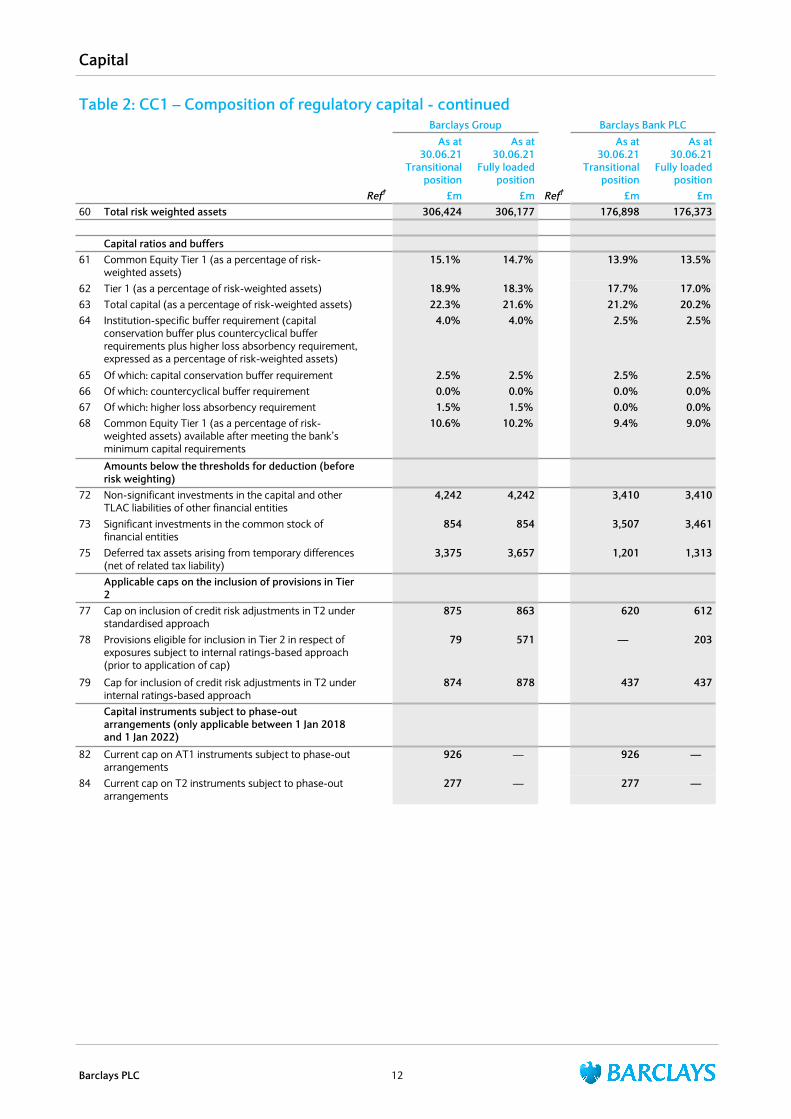
Table 2: CC1 – Composition of regulatory capital - continuedBarclays Group Barclays Bank PLC
As at 30.06.21
Transitional position
As at 30.06.21
Fully loaded position
As at 30.06.21
Transitional position
As at 30.06.21
Fully loaded position
Ref† £m £m Ref† £m £m60 Total risk weighted assets 306,424 306,177 176,898 176,373
Capital ratios and buffers61 Common Equity Tier 1 (as a percentage of risk-
weighted assets) 15.1% 14.7% 13.9% 13.5%
62 Tier 1 (as a percentage of risk-weighted assets) 18.9% 18.3% 17.7% 17.0% 63 Total capital (as a percentage of risk-weighted assets) 22.3% 21.6% 21.2% 20.2% 64 Institution-specific buffer requirement (capital
conservation buffer plus countercyclical buffer requirements plus higher loss absorbency requirement, expressed as a percentage of risk-weighted assets)
4.0% 4.0% 2.5% 2.5%
65 Of which: capital conservation buffer requirement 2.5% 2.5% 2.5% 2.5% 66 Of which: countercyclical buffer requirement 0.0% 0.0% 0.0% 0.0% 67 Of which: higher loss absorbency requirement 1.5% 1.5% 0.0% 0.0% 68 Common Equity Tier 1 (as a percentage of risk-
weighted assets) available after meeting the bank’s minimum capital requirements
10.6% 10.2% 9.4% 9.0%
Amounts below the thresholds for deduction (before risk weighting)
72 Non-significant investments in the capital and other TLAC liabilities of other financial entities
4,242 4,242 3,410 3,410
73 Significant investments in the common stock of financial entities
854 854 3,507 3,461
75 Deferred tax assets arising from temporary differences (net of related tax liability)
3,375 3,657 1,201 1,313
Applicable caps on the inclusion of provisions in Tier 2
77 Cap on inclusion of credit risk adjustments in T2 under standardised approach
875 863 620 612
78 Provisions eligible for inclusion in Tier 2 in respect of exposures subject to internal ratings-based approach (prior to application of cap)
79 571 — 203
79 Cap for inclusion of credit risk adjustments in T2 under internal ratings-based approach
874 878 437 437
Capital instruments subject to phase-out arrangements (only applicable between 1 Jan 2018 and 1 Jan 2022)
82 Current cap on AT1 instruments subject to phase-out arrangements
926 — 926 —
84 Current cap on T2 instruments subject to phase-out arrangements
277 — 277 —
Capital
Barclays PLC 12
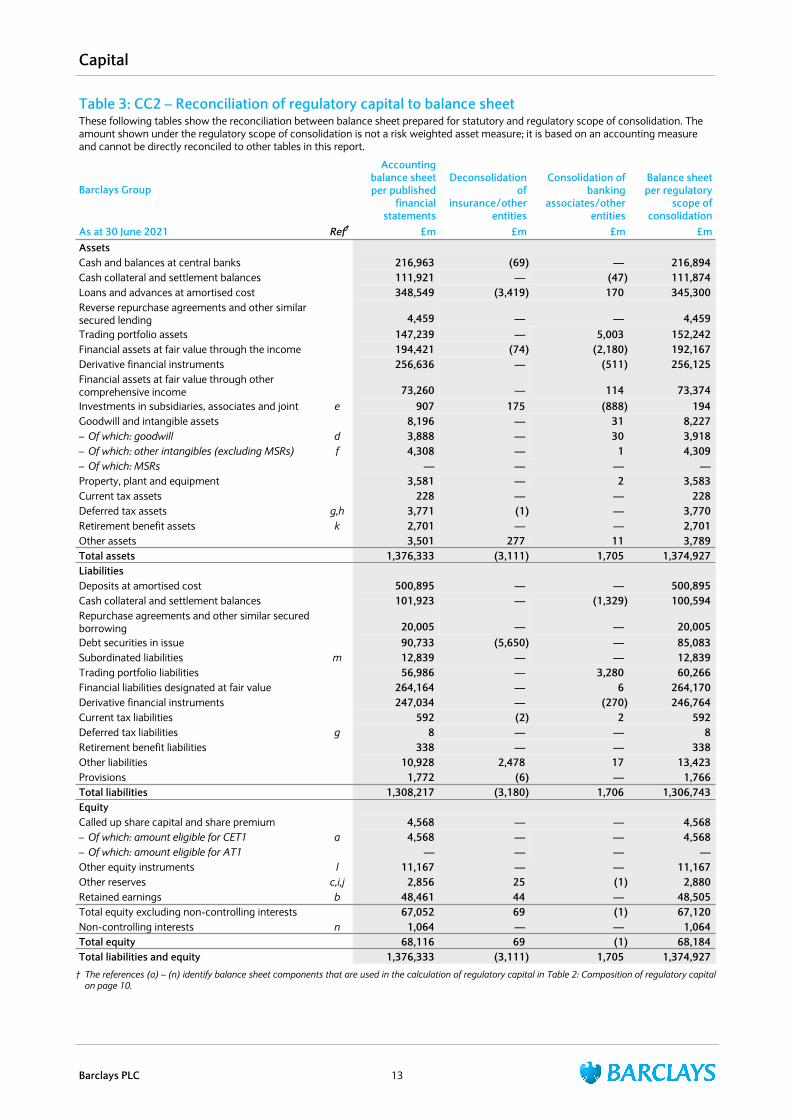
Table 3: CC2 – Reconciliation of regulatory capital to balance sheetThese following tables show the reconciliation between balance sheet prepared for statutory and regulatory scope of consolidation. The amount shown under the regulatory scope of consolidation is not a risk weighted asset measure; it is based on an accounting measure and cannot be directly reconciled to other tables in this report.
Barclays Group
Accounting balance sheet per published
financial statements
Deconsolidation of
insurance/other entities
Consolidation of banking
associates/other entities
Balance sheet per regulatory
scope of consolidation
As at 30 June 2021 Ref† £m £m £m £mAssetsCash and balances at central banks 216,963 (69) — 216,894 Cash collateral and settlement balances 111,921 — (47) 111,874 Loans and advances at amortised cost 348,549 (3,419) 170 345,300 Reverse repurchase agreements and other similar secured lending 4,459 — — 4,459 Trading portfolio assets 147,239 — 5,003 152,242 Financial assets at fair value through the income 194,421 (74) (2,180) 192,167 Derivative financial instruments 256,636 — (511) 256,125 Financial assets at fair value through other comprehensive income 73,260 — 114 73,374 Investments in subsidiaries, associates and joint e 907 175 (888) 194 Goodwill and intangible assets 8,196 — 31 8,227 – Of which: goodwill d 3,888 — 30 3,918 – Of which: other intangibles (excluding MSRs) f 4,308 — 1 4,309 – Of which: MSRs — — — — Property, plant and equipment 3,581 — 2 3,583 Current tax assets 228 — — 228 Deferred tax assets g,h 3,771 (1) — 3,770 Retirement benefit assets k 2,701 — — 2,701 Other assets 3,501 277 11 3,789 Total assets 1,376,333 (3,111) 1,705 1,374,927 LiabilitiesDeposits at amortised cost 500,895 — — 500,895 Cash collateral and settlement balances 101,923 — (1,329) 100,594 Repurchase agreements and other similar secured borrowing 20,005 — — 20,005 Debt securities in issue 90,733 (5,650) — 85,083 Subordinated liabilities m 12,839 — — 12,839 Trading portfolio liabilities 56,986 — 3,280 60,266 Financial liabilities designated at fair value 264,164 — 6 264,170 Derivative financial instruments 247,034 — (270) 246,764 Current tax liabilities 592 (2) 2 592 Deferred tax liabilities g 8 — — 8 Retirement benefit liabilities 338 — — 338 Other liabilities 10,928 2,478 17 13,423 Provisions 1,772 (6) — 1,766 Total liabilities 1,308,217 (3,180) 1,706 1,306,743 EquityCalled up share capital and share premium 4,568 — — 4,568 – Of which: amount eligible for CET1 a 4,568 — — 4,568 – Of which: amount eligible for AT1 — — — — Other equity instruments l 11,167 — — 11,167 Other reserves c,i,j 2,856 25 (1) 2,880 Retained earnings b 48,461 44 — 48,505 Total equity excluding non-controlling interests 67,052 69 (1) 67,120 Non-controlling interests n 1,064 — — 1,064 Total equity 68,116 69 (1) 68,184 Total liabilities and equity 1,376,333 (3,111) 1,705 1,374,927
† The references (a) – (n) identify balance sheet components that are used in the calculation of regulatory capital in Table 2: Composition of regulatory capital on page 10.
Capital
Barclays PLC 13
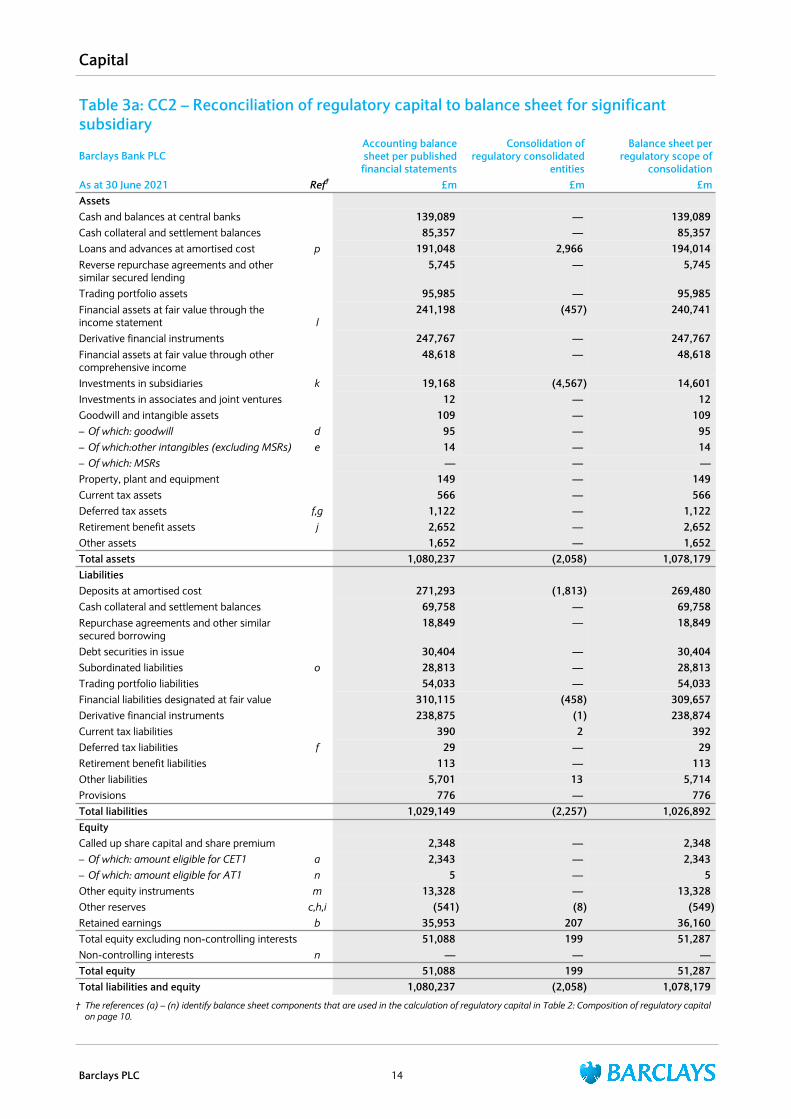
Table 3a: CC2 – Reconciliation of regulatory capital to balance sheet for significant subsidiary
Barclays Bank PLCAccounting balance sheet per published
financial statements
Consolidation of regulatory consolidated
entities
Balance sheet per regulatory scope of
consolidationAs at 30 June 2021 Ref† £m £m £mAssetsCash and balances at central banks 139,089 — 139,089 Cash collateral and settlement balances 85,357 — 85,357 Loans and advances at amortised cost p 191,048 2,966 194,014 Reverse repurchase agreements and other similar secured lending
5,745 — 5,745
Trading portfolio assets 95,985 — 95,985 Financial assets at fair value through the income statement l
241,198 (457) 240,741
Derivative financial instruments 247,767 — 247,767 Financial assets at fair value through other comprehensive income
48,618 — 48,618
Investments in subsidiaries k 19,168 (4,567) 14,601 Investments in associates and joint ventures 12 — 12 Goodwill and intangible assets 109 — 109 – Of which: goodwill d 95 — 95 – Of which:other intangibles (excluding MSRs) e 14 — 14 – Of which: MSRs — — — Property, plant and equipment 149 — 149 Current tax assets 566 — 566 Deferred tax assets f,g 1,122 — 1,122 Retirement benefit assets j 2,652 — 2,652 Other assets 1,652 — 1,652 Total assets 1,080,237 (2,058) 1,078,179 LiabilitiesDeposits at amortised cost 271,293 (1,813) 269,480 Cash collateral and settlement balances 69,758 — 69,758 Repurchase agreements and other similar secured borrowing
18,849 — 18,849
Debt securities in issue 30,404 — 30,404 Subordinated liabilities o 28,813 — 28,813 Trading portfolio liabilities 54,033 — 54,033 Financial liabilities designated at fair value 310,115 (458) 309,657 Derivative financial instruments 238,875 (1) 238,874 Current tax liabilities 390 2 392 Deferred tax liabilities f 29 — 29 Retirement benefit liabilities 113 — 113 Other liabilities 5,701 13 5,714 Provisions 776 — 776 Total liabilities 1,029,149 (2,257) 1,026,892 EquityCalled up share capital and share premium 2,348 — 2,348 – Of which: amount eligible for CET1 a 2,343 — 2,343 – Of which: amount eligible for AT1 n 5 — 5 Other equity instruments m 13,328 — 13,328 Other reserves c,h,i (541) (8) (549) Retained earnings b 35,953 207 36,160 Total equity excluding non-controlling interests 51,088 199 51,287 Non-controlling interests n — — — Total equity 51,088 199 51,287 Total liabilities and equity 1,080,237 (2,058) 1,078,179
† The references (a) – (n) identify balance sheet components that are used in the calculation of regulatory capital in Table 2: Composition of regulatory capital on page 10.
Capital
Barclays PLC 14
IFRS 9 – Transitional capital arrangements
On 1 January 2018, IFRS 9 transitional capital arrangements were implemented by Regulation (EU) 2017/2395. Barclays elected to apply the transitional arrangements at both consolidated and individual entity levels and will disclose both transitional and fully loaded CET1 ratios until the end of the transitional period. On 27 June 2020, CRR was further amended to extend the transitional period by two years and to introduce a new modified calculation.
The transitional arrangements, implemented under a modified static approach, allow for transitional relief on the “day 1” impact on adoption of IFRS 9 (static element) and for the increase in provisions between “day 1” and the reporting date (modified element), subject to eligibility.
The transitional relief applied to the static element is phased out over a 5-year period with 95% applicable for 2018; 85% for 2019; 70% for 2020; 50% for 2021; 25% for 2022 and with no transitional relief from 2023.
The transitional relief applied to the modified element for increases between “day 1” and 31 December 2019 is phased out in line with the static element. From 27 June 2020, under new legislation, the transitional relief applied to the modified element for increases between 1 January 2020 and the reporting date is phased out over a 5 year period with 100% applicable for 2020 and 2021; 75% for 2022; 50% for 2023; 25% for 2024 and with no transitional relief from 2025.
For the static element, Stage 1, Stage 2 and Stage 3 provisions are eligible for transition, whereas for the modified elements, Stage 3 provisions are excluded.
Total increases in impairment allowances as a result of IFRS 9, net of tax, decreases shareholders’ equity through retained earnings and decreases standardised RWAs due to the increase in impairment being offset against the standardised Credit Risk exposures. This is somewhat reversed by the transitional relief applied on eligible impairment.
Separate calculations are performed for standardised and advanced Internal Ratings Based (AIRB) portfolios, reflecting the different ways these frameworks take account of provisions.
Under the standardised approach, increases in provisions for both the static and modified elements are eligible for transition. When recalculating the requirements in CRR, as amended by CRR II, under the standardised approach, a risk weight of 100% is assigned to the eligible impairment.
For AIRB exposures, the calculation of capital takes account of the expected loss via a comparison with the impairment allowances. Where regulatory expected losses exceed impairment allowances, the shortfall is deducted from CET1 capital. Where the impairment allowance is higher than expected loss, the excess is added back to tier 2 capital and capped at an amount of 0.6% of AIRB RWAs. For both the static and modified elements, provisions are only eligible for transitional relief to the extent that they exceed regulatory expected loss.
The deferred tax assets (DTAs) created from the increase of impairment are also accounted for in the CET1 ratio. When DTAs arising from temporary differences are above the 10% CET1 capital threshold, any excess above the threshold is deducted and those below the threshold are risk weighted at 250% up to the point they reach threshold. DTAs that rely on future profitability excluding temporary differences are deducted from CET1 capital. To the extent that DTAs have arisen as a result of increases in eligible impairment, the impacts may also be reversed by the transitional relief applied.
Capital
Barclays PLC 15
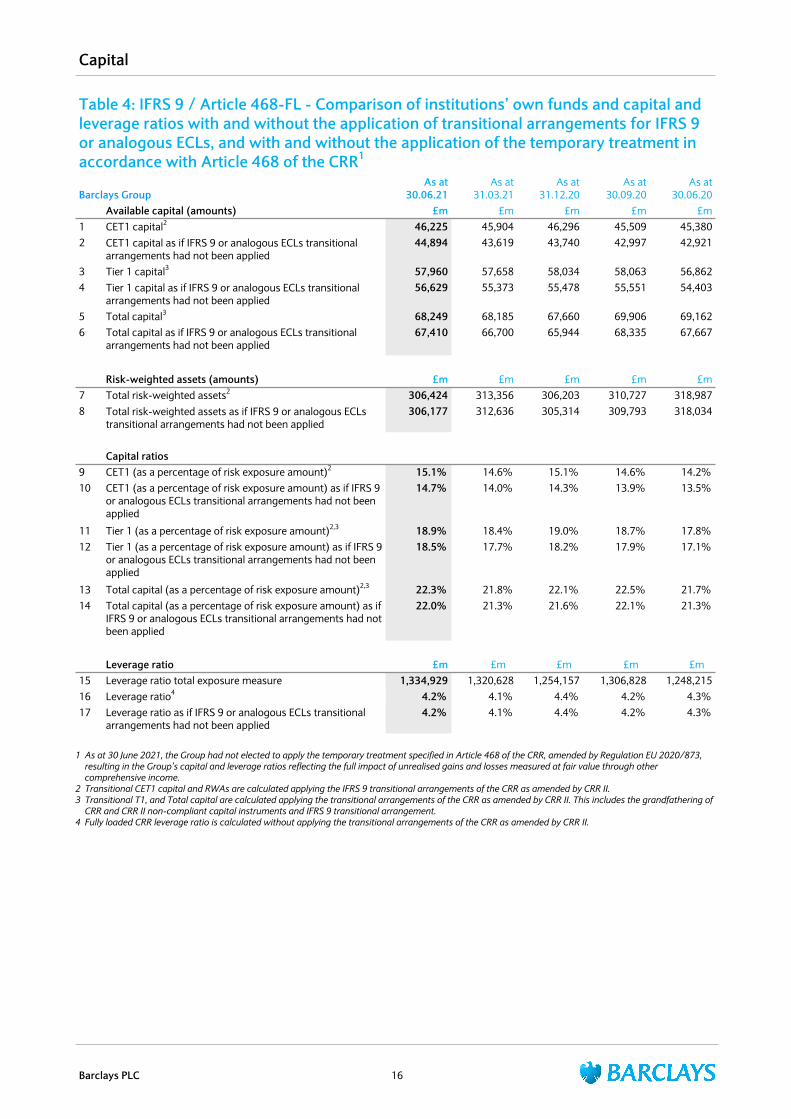
Table 4: IFRS 9 / Article 468-FL - Comparison of institutions’ own funds and capital and leverage ratios with and without the application of transitional arrangements for IFRS 9 or analogous ECLs, and with and without the application of the temporary treatment in accordance with Article 468 of the CRR1
Barclays GroupAs at
30.06.21As at
31.03.21As at
31.12.20As at
30.09.20As at
30.06.20Available capital (amounts) £m £m £m £m £m
1 CET1 capital2 46,225 45,904 46,296 45,509 45,3802 CET1 capital as if IFRS 9 or analogous ECLs transitional
arrangements had not been applied44,894 43,619 43,740 42,997 42,921
3 Tier 1 capital3 57,960 57,658 58,034 58,063 56,8624 Tier 1 capital as if IFRS 9 or analogous ECLs transitional
arrangements had not been applied56,629 55,373 55,478 55,551 54,403
5 Total capital3 68,249 68,185 67,660 69,906 69,1626 Total capital as if IFRS 9 or analogous ECLs transitional
arrangements had not been applied67,410 66,700 65,944 68,335 67,667
Risk-weighted assets (amounts) £m £m £m £m £m7 Total risk-weighted assets2 306,424 313,356 306,203 310,727 318,9878 Total risk-weighted assets as if IFRS 9 or analogous ECLs
transitional arrangements had not been applied306,177 312,636 305,314 309,793 318,034
Capital ratios9 CET1 (as a percentage of risk exposure amount)2 15.1% 14.6% 15.1% 14.6% 14.2% 10 CET1 (as a percentage of risk exposure amount) as if IFRS 9
or analogous ECLs transitional arrangements had not been applied
14.7% 14.0% 14.3% 13.9% 13.5%
11 Tier 1 (as a percentage of risk exposure amount)2,3 18.9% 18.4% 19.0% 18.7% 17.8% 12 Tier 1 (as a percentage of risk exposure amount) as if IFRS 9
or analogous ECLs transitional arrangements had not been applied
18.5% 17.7% 18.2% 17.9% 17.1%
13 Total capital (as a percentage of risk exposure amount)2,3 22.3% 21.8% 22.1% 22.5% 21.7% 14 Total capital (as a percentage of risk exposure amount) as if
IFRS 9 or analogous ECLs transitional arrangements had not been applied
22.0% 21.3% 21.6% 22.1% 21.3%
Leverage ratio £m £m £m £m £m15 Leverage ratio total exposure measure 1,334,929 1,320,628 1,254,157 1,306,828 1,248,21516 Leverage ratio4 4.2% 4.1% 4.4% 4.2% 4.3% 17 Leverage ratio as if IFRS 9 or analogous ECLs transitional
arrangements had not been applied 4.2% 4.1% 4.4% 4.2% 4.3%
1 As at 30 June 2021, the Group had not elected to apply the temporary treatment specified in Article 468 of the CRR, amended by Regulation EU 2020/873, resulting in the Group’s capital and leverage ratios reflecting the full impact of unrealised gains and losses measured at fair value through other comprehensive income.
2 Transitional CET1 capital and RWAs are calculated applying the IFRS 9 transitional arrangements of the CRR as amended by CRR II.3 Transitional T1, and Total capital are calculated applying the transitional arrangements of the CRR as amended by CRR II. This includes the grandfathering of
CRR and CRR II non-compliant capital instruments and IFRS 9 transitional arrangement.4 Fully loaded CRR leverage ratio is calculated without applying the transitional arrangements of the CRR as amended by CRR II.
Capital
Barclays PLC 16
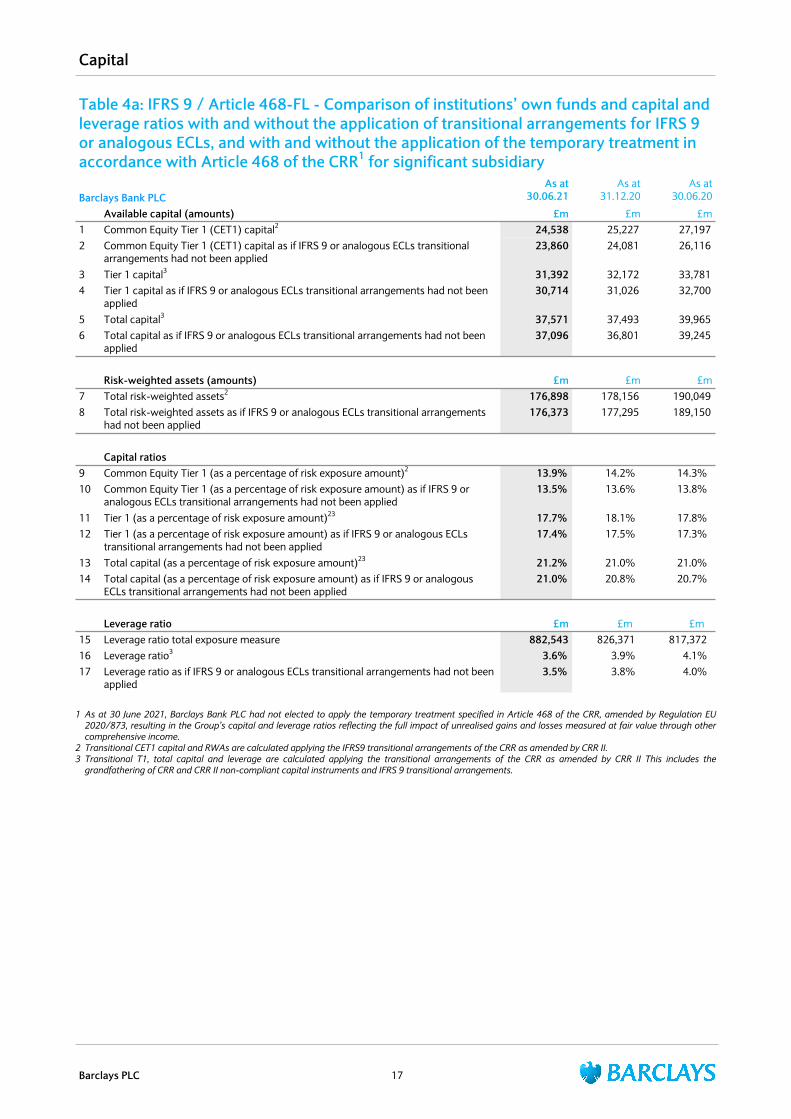
Table 4a: IFRS 9 / Article 468-FL - Comparison of institutions’ own funds and capital and leverage ratios with and without the application of transitional arrangements for IFRS 9 or analogous ECLs, and with and without the application of the temporary treatment in accordance with Article 468 of the CRR1 for significant subsidiary
Barclays Bank PLCAs at
30.06.21As at
31.12.20As at
30.06.20
Available capital (amounts) £m £m £m1 Common Equity Tier 1 (CET1) capital2 24,538 25,227 27,197 2 Common Equity Tier 1 (CET1) capital as if IFRS 9 or analogous ECLs transitional
arrangements had not been applied23,860 24,081 26,116
3 Tier 1 capital3 31,392 32,172 33,781 4 Tier 1 capital as if IFRS 9 or analogous ECLs transitional arrangements had not been
applied30,714 31,026 32,700
5 Total capital3 37,571 37,493 39,965 6 Total capital as if IFRS 9 or analogous ECLs transitional arrangements had not been
applied37,096 36,801 39,245
Risk-weighted assets (amounts) £m £m £m7 Total risk-weighted assets2 176,898 178,156 190,049 8 Total risk-weighted assets as if IFRS 9 or analogous ECLs transitional arrangements
had not been applied176,373 177,295 189,150
Capital ratios9 Common Equity Tier 1 (as a percentage of risk exposure amount)2 13.9% 14.2% 14.3% 10 Common Equity Tier 1 (as a percentage of risk exposure amount) as if IFRS 9 or
analogous ECLs transitional arrangements had not been applied 13.5% 13.6% 13.8%
11 Tier 1 (as a percentage of risk exposure amount)23 17.7% 18.1% 17.8% 12 Tier 1 (as a percentage of risk exposure amount) as if IFRS 9 or analogous ECLs
transitional arrangements had not been applied 17.4% 17.5% 17.3%
13 Total capital (as a percentage of risk exposure amount)23 21.2% 21.0% 21.0% 14 Total capital (as a percentage of risk exposure amount) as if IFRS 9 or analogous
ECLs transitional arrangements had not been applied 21.0% 20.8% 20.7%
Leverage ratio £m £m £m15 Leverage ratio total exposure measure 882,543 826,371 817,372 16 Leverage ratio3 3.6% 3.9% 4.1% 17 Leverage ratio as if IFRS 9 or analogous ECLs transitional arrangements had not been
applied 3.5% 3.8% 4.0%
1 As at 30 June 2021, Barclays Bank PLC had not elected to apply the temporary treatment specified in Article 468 of the CRR, amended by Regulation EU 2020/873, resulting in the Group’s capital and leverage ratios reflecting the full impact of unrealised gains and losses measured at fair value through other comprehensive income.
2 Transitional CET1 capital and RWAs are calculated applying the IFRS9 transitional arrangements of the CRR as amended by CRR II.3 Transitional T1, total capital and leverage are calculated applying the transitional arrangements of the CRR as amended by CRR II This includes the
grandfathering of CRR and CRR II non-compliant capital instruments and IFRS 9 transitional arrangements.
Capital
Barclays PLC 17
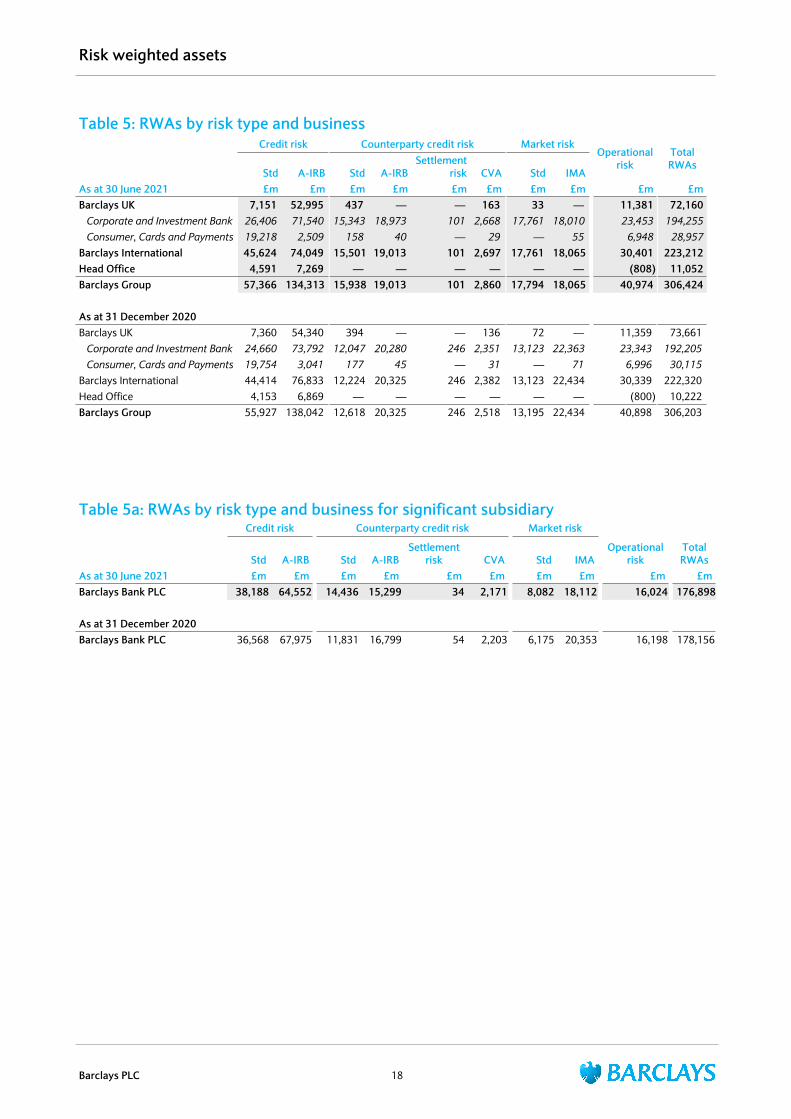
Table 5: RWAs by risk type and business Credit risk Counterparty credit risk Market risk
Operational risk
Total RWAs
Std A-IRB Std A-IRBSettlement
risk CVA Std IMAAs at 30 June 2021 £m £m £m £m £m £m £m £m £m £mBarclays UK 7,151 52,995 437 — — 163 33 — 11,381 72,160 Corporate and Investment Bank 26,406 71,540 15,343 18,973 101 2,668 17,761 18,010 23,453 194,255 Consumer, Cards and Payments 19,218 2,509 158 40 — 29 — 55 6,948 28,957Barclays International 45,624 74,049 15,501 19,013 101 2,697 17,761 18,065 30,401 223,212Head Office 4,591 7,269 — — — — — — (808) 11,052Barclays Group 57,366 134,313 15,938 19,013 101 2,860 17,794 18,065 40,974 306,424
As at 31 December 2020Barclays UK 7,360 54,340 394 — — 136 72 — 11,359 73,661 Corporate and Investment Bank 24,660 73,792 12,047 20,280 246 2,351 13,123 22,363 23,343 192,205 Consumer, Cards and Payments 19,754 3,041 177 45 — 31 — 71 6,996 30,115 Barclays International 44,414 76,833 12,224 20,325 246 2,382 13,123 22,434 30,339 222,320 Head Office 4,153 6,869 — — — — — — (800) 10,222 Barclays Group 55,927 138,042 12,618 20,325 246 2,518 13,195 22,434 40,898 306,203
Table 5a: RWAs by risk type and business for significant subsidiaryCredit risk Counterparty credit risk Market risk
Operational risk
Total RWAsStd A-IRB Std A-IRB
Settlement risk CVA Std IMA
As at 30 June 2021 £m £m £m £m £m £m £m £m £m £mBarclays Bank PLC 38,188 64,552 14,436 15,299 34 2,171 8,082 18,112 16,024 176,898
As at 31 December 2020Barclays Bank PLC 36,568 67,975 11,831 16,799 54 2,203 6,175 20,353 16,198 178,156
Risk weighted assets
Barclays PLC 18
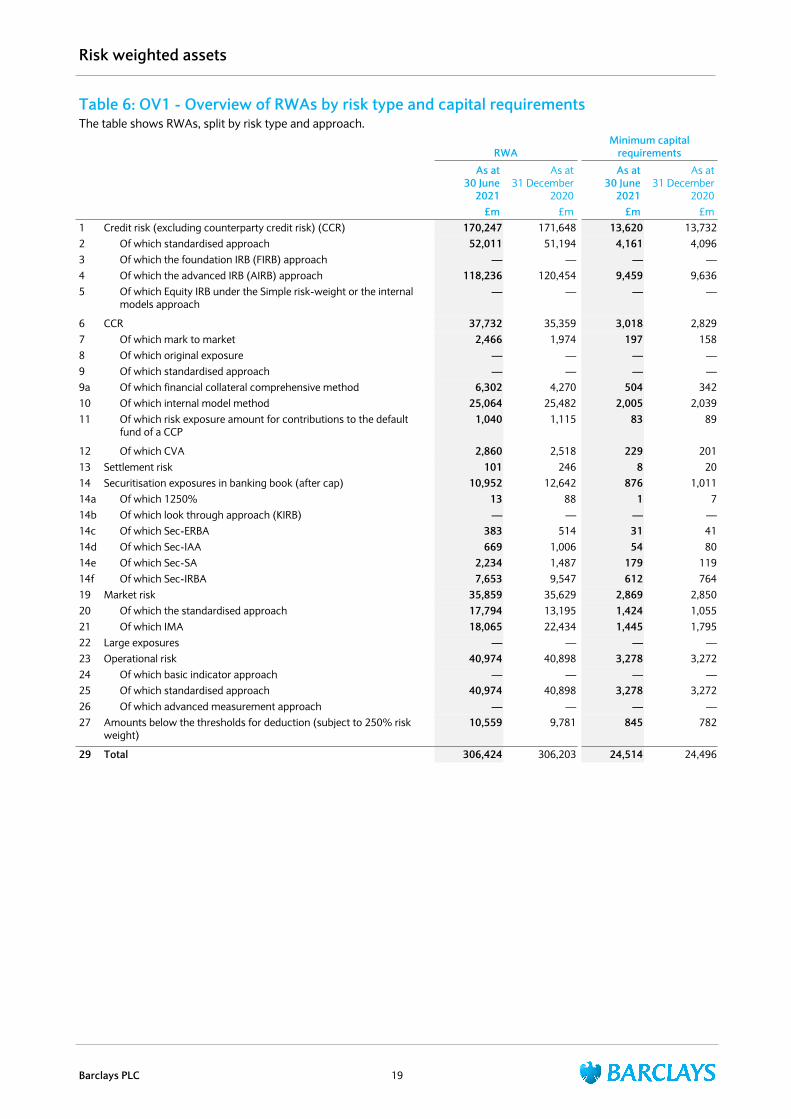
Table 6: OV1 - Overview of RWAs by risk type and capital requirements The table shows RWAs, split by risk type and approach.
RWAMinimum capital
requirements
As at 30 June
2021
As at 31 December
2020
As at 30 June
2021
As at 31 December
2020£m £m £m £m
1 Credit risk (excluding counterparty credit risk) (CCR) 170,247 171,648 13,620 13,732 2 Of which standardised approach 52,011 51,194 4,161 4,096 3 Of which the foundation IRB (FIRB) approach — — — — 4 Of which the advanced IRB (AIRB) approach 118,236 120,454 9,459 9,636 5 Of which Equity IRB under the Simple risk-weight or the internal
models approach — — — —
6 CCR 37,732 35,359 3,018 2,829 7 Of which mark to market 2,466 1,974 197 158 8 Of which original exposure — — — — 9 Of which standardised approach — — — — 9a Of which financial collateral comprehensive method 6,302 4,270 504 342 10 Of which internal model method 25,064 25,482 2,005 2,039 11 Of which risk exposure amount for contributions to the default
fund of a CCP 1,040 1,115 83 89
12 Of which CVA 2,860 2,518 229 201 13 Settlement risk 101 246 8 20 14 Securitisation exposures in banking book (after cap) 10,952 12,642 876 1,011 14a Of which 1250% 13 88 1 7 14b Of which look through approach (KIRB) — — — — 14c Of which Sec-ERBA 383 514 31 41 14d Of which Sec-IAA 669 1,006 54 80 14e Of which Sec-SA 2,234 1,487 179 119 14f Of which Sec-IRBA 7,653 9,547 612 764 19 Market risk 35,859 35,629 2,869 2,850 20 Of which the standardised approach 17,794 13,195 1,424 1,055 21 Of which IMA 18,065 22,434 1,445 1,795 22 Large exposures — — — — 23 Operational risk 40,974 40,898 3,278 3,272 24 Of which basic indicator approach — — — — 25 Of which standardised approach 40,974 40,898 3,278 3,272 26 Of which advanced measurement approach — — — — 27 Amounts below the thresholds for deduction (subject to 250% risk
weight) 10,559 9,781 845 782
29 Total 306,424 306,203 24,514 24,496
Risk weighted assets
Barclays PLC 19
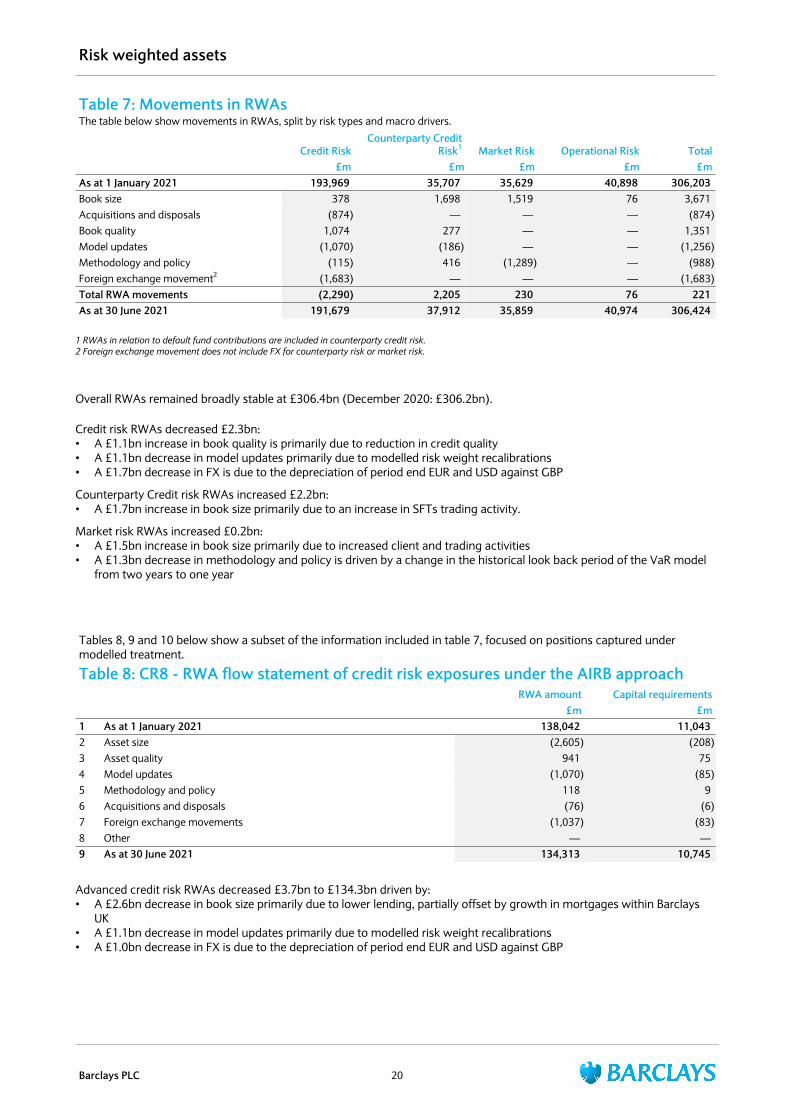
Table 7: Movements in RWAsThe table below show movements in RWAs, split by risk types and macro drivers.
Credit RiskCounterparty Credit
Risk1 Market Risk Operational Risk Total£m £m £m £m £m
As at 1 January 2021 193,969 35,707 35,629 40,898 306,203 Book size 378 1,698 1,519 76 3,671 Acquisitions and disposals (874) — — — (874) Book quality 1,074 277 — — 1,351 Model updates (1,070) (186) — — (1,256) Methodology and policy (115) 416 (1,289) — (988) Foreign exchange movement2 (1,683) — — — (1,683) Total RWA movements (2,290) 2,205 230 76 221 As at 30 June 2021 191,679 37,912 35,859 40,974 306,424
1 RWAs in relation to default fund contributions are included in counterparty credit risk.2 Foreign exchange movement does not include FX for counterparty risk or market risk.
Overall RWAs remained broadly stable at £306.4bn (December 2020: £306.2bn).
Credit risk RWAs decreased £2.3bn:• A £1.1bn increase in book quality is primarily due to reduction in credit quality• A £1.1bn decrease in model updates primarily due to modelled risk weight recalibrations• A £1.7bn decrease in FX is due to the depreciation of period end EUR and USD against GBP
Counterparty Credit risk RWAs increased £2.2bn: • A £1.7bn increase in book size primarily due to an increase in SFTs trading activity.
Market risk RWAs increased £0.2bn:• A £1.5bn increase in book size primarily due to increased client and trading activities• A £1.3bn decrease in methodology and policy is driven by a change in the historical look back period of the VaR model
from two years to one year
Tables 8, 9 and 10 below show a subset of the information included in table 7, focused on positions captured under modelled treatment.
Table 8: CR8 - RWA flow statement of credit risk exposures under the AIRB approachRWA amount Capital requirements
£m £m1 As at 1 January 2021 138,042 11,043 2 Asset size (2,605) (208) 3 Asset quality 941 75 4 Model updates (1,070) (85) 5 Methodology and policy 118 9 6 Acquisitions and disposals (76) (6) 7 Foreign exchange movements (1,037) (83) 8 Other — — 9 As at 30 June 2021 134,313 10,745
Advanced credit risk RWAs decreased £3.7bn to £134.3bn driven by:• A £2.6bn decrease in book size primarily due to lower lending, partially offset by growth in mortgages within Barclays
UK• A £1.1bn decrease in model updates primarily due to modelled risk weight recalibrations• A £1.0bn decrease in FX is due to the depreciation of period end EUR and USD against GBP
Risk weighted assets
Barclays PLC 20
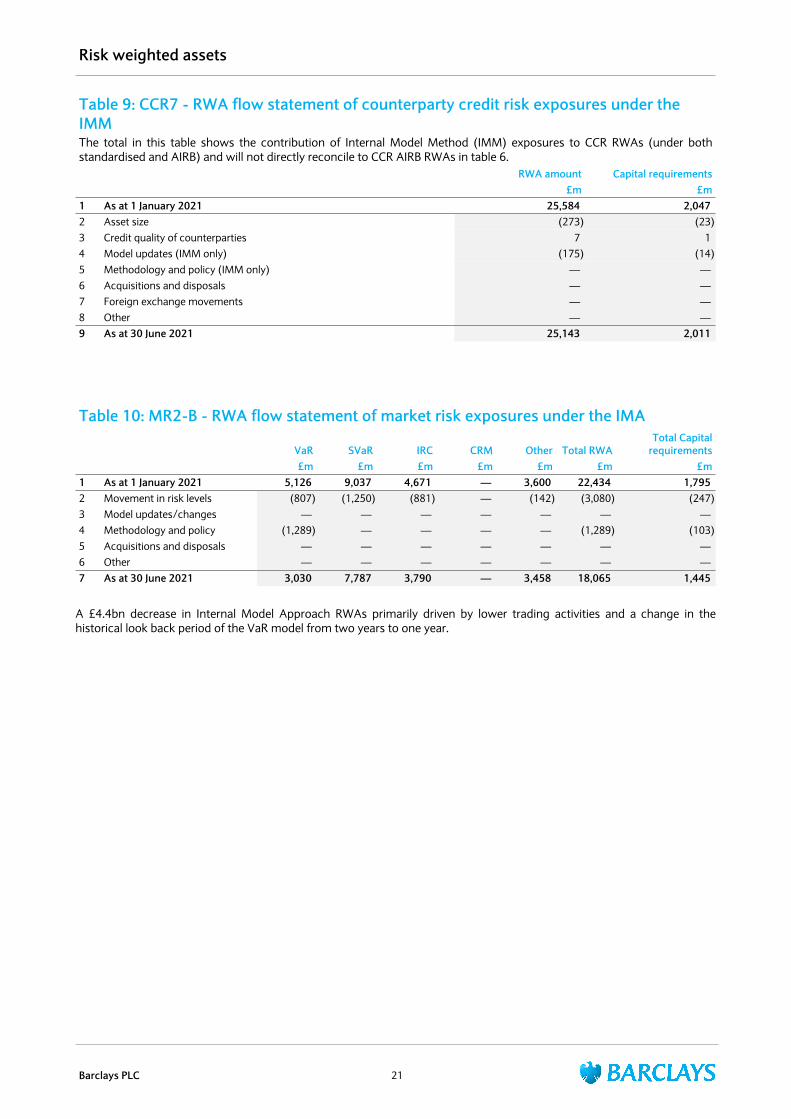
Table 9: CCR7 - RWA flow statement of counterparty credit risk exposures under the IMMThe total in this table shows the contribution of Internal Model Method (IMM) exposures to CCR RWAs (under both standardised and AIRB) and will not directly reconcile to CCR AIRB RWAs in table 6.
RWA amount Capital requirements£m £m
1 As at 1 January 2021 25,584 2,047 2 Asset size (273) (23) 3 Credit quality of counterparties 7 1 4 Model updates (IMM only) (175) (14) 5 Methodology and policy (IMM only) — — 6 Acquisitions and disposals — — 7 Foreign exchange movements — — 8 Other — — 9 As at 30 June 2021 25,143 2,011
Table 10: MR2-B - RWA flow statement of market risk exposures under the IMA
VaR SVaR IRC CRM Other Total RWATotal Capital
requirements£m £m £m £m £m £m £m
1 As at 1 January 2021 5,126 9,037 4,671 — 3,600 22,434 1,795 2 Movement in risk levels (807) (1,250) (881) — (142) (3,080) (247) 3 Model updates/changes — — — — — — — 4 Methodology and policy (1,289) — — — — (1,289) (103) 5 Acquisitions and disposals — — — — — — — 6 Other — — — — — — — 7 As at 30 June 2021 3,030 7,787 3,790 — 3,458 18,065 1,445
A £4.4bn decrease in Internal Model Approach RWAs primarily driven by lower trading activities and a change in the historical look back period of the VaR model from two years to one year.
Risk weighted assets
Barclays PLC 21
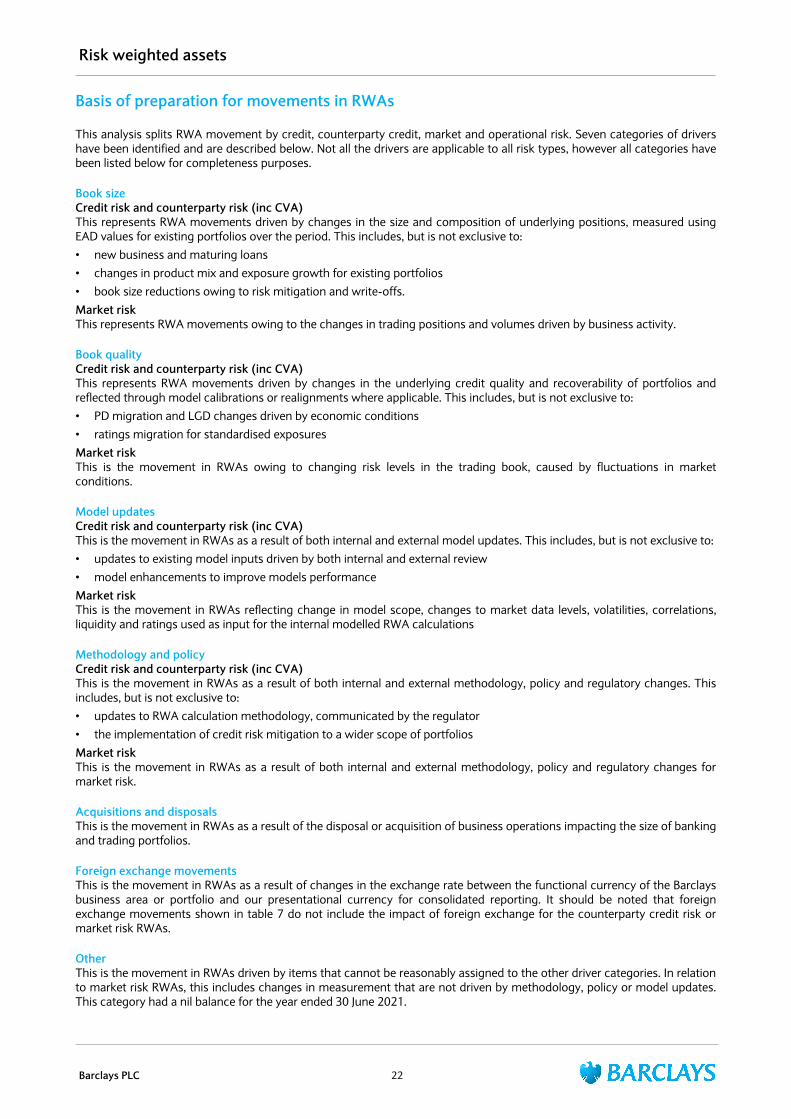
Basis of preparation for movements in RWAs
This analysis splits RWA movement by credit, counterparty credit, market and operational risk. Seven categories of drivers have been identified and are described below. Not all the drivers are applicable to all risk types, however all categories have been listed below for completeness purposes.
Book sizeCredit risk and counterparty risk (inc CVA)This represents RWA movements driven by changes in the size and composition of underlying positions, measured using EAD values for existing portfolios over the period. This includes, but is not exclusive to:• new business and maturing loans• changes in product mix and exposure growth for existing portfolios• book size reductions owing to risk mitigation and write-offs.Market riskThis represents RWA movements owing to the changes in trading positions and volumes driven by business activity.
Book qualityCredit risk and counterparty risk (inc CVA)This represents RWA movements driven by changes in the underlying credit quality and recoverability of portfolios and reflected through model calibrations or realignments where applicable. This includes, but is not exclusive to:• PD migration and LGD changes driven by economic conditions• ratings migration for standardised exposuresMarket riskThis is the movement in RWAs owing to changing risk levels in the trading book, caused by fluctuations in market conditions.
Model updatesCredit risk and counterparty risk (inc CVA)This is the movement in RWAs as a result of both internal and external model updates. This includes, but is not exclusive to:• updates to existing model inputs driven by both internal and external review• model enhancements to improve models performanceMarket riskThis is the movement in RWAs reflecting change in model scope, changes to market data levels, volatilities, correlations, liquidity and ratings used as input for the internal modelled RWA calculations
Methodology and policyCredit risk and counterparty risk (inc CVA)This is the movement in RWAs as a result of both internal and external methodology, policy and regulatory changes. This includes, but is not exclusive to:• updates to RWA calculation methodology, communicated by the regulator• the implementation of credit risk mitigation to a wider scope of portfoliosMarket riskThis is the movement in RWAs as a result of both internal and external methodology, policy and regulatory changes for market risk.
Acquisitions and disposalsThis is the movement in RWAs as a result of the disposal or acquisition of business operations impacting the size of banking and trading portfolios.
Foreign exchange movementsThis is the movement in RWAs as a result of changes in the exchange rate between the functional currency of the Barclays business area or portfolio and our presentational currency for consolidated reporting. It should be noted that foreign exchange movements shown in table 7 do not include the impact of foreign exchange for the counterparty credit risk or market risk RWAs.
OtherThis is the movement in RWAs driven by items that cannot be reasonably assigned to the other driver categories. In relation to market risk RWAs, this includes changes in measurement that are not driven by methodology, policy or model updates. This category had a nil balance for the year ended 30 June 2021.
Risk weighted assets
Barclays PLC 22
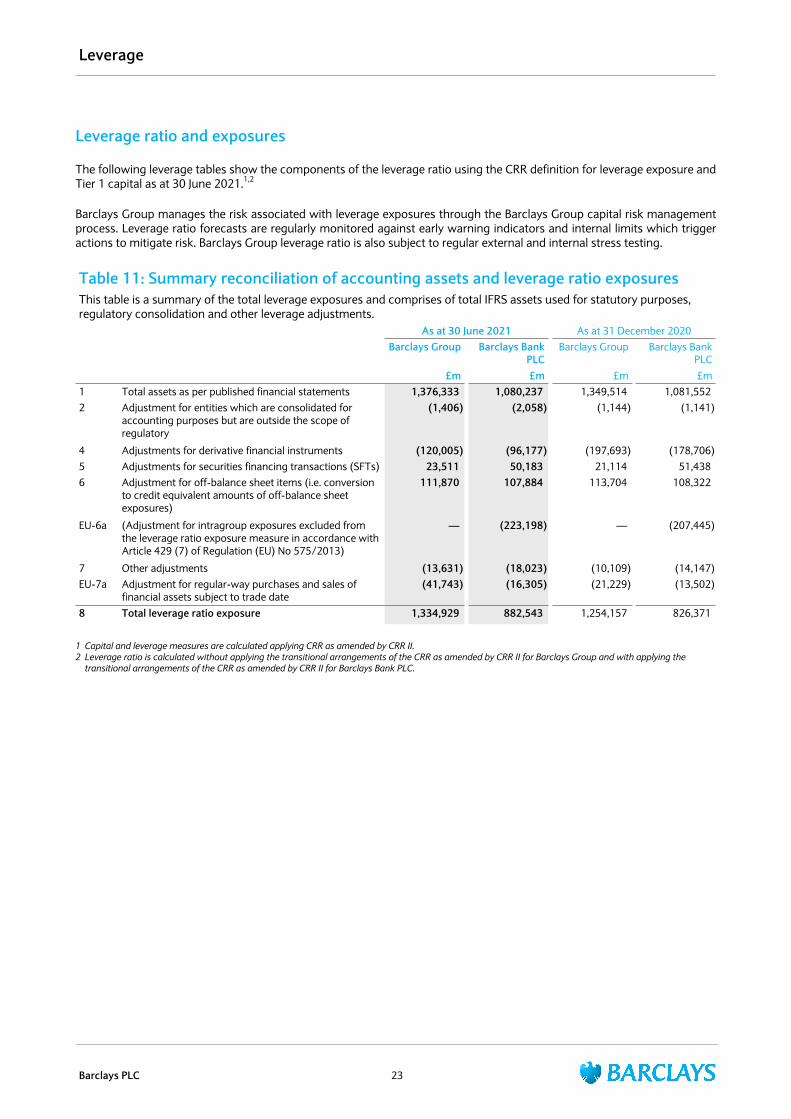
Leverage ratio and exposures
The following leverage tables show the components of the leverage ratio using the CRR definition for leverage exposure and Tier 1 capital as at 30 June 2021.1,2
Barclays Group manages the risk associated with leverage exposures through the Barclays Group capital risk management process. Leverage ratio forecasts are regularly monitored against early warning indicators and internal limits which trigger actions to mitigate risk. Barclays Group leverage ratio is also subject to regular external and internal stress testing.
Table 11: Summary reconciliation of accounting assets and leverage ratio exposuresThis table is a summary of the total leverage exposures and comprises of total IFRS assets used for statutory purposes, regulatory consolidation and other leverage adjustments.
As at 30 June 2021 As at 31 December 2020Barclays Group Barclays Bank
PLCBarclays Group Barclays Bank
PLC£m £m £m £m
1 Total assets as per published financial statements 1,376,333 1,080,237 1,349,514 1,081,552 2 Adjustment for entities which are consolidated for
accounting purposes but are outside the scope of regulatory
(1,406) (2,058) (1,144) (1,141)
4 Adjustments for derivative financial instruments (120,005) (96,177) (197,693) (178,706) 5 Adjustments for securities financing transactions (SFTs) 23,511 50,183 21,114 51,438 6 Adjustment for off-balance sheet items (i.e. conversion
to credit equivalent amounts of off-balance sheet exposures)
111,870 107,884 113,704 108,322
EU-6a (Adjustment for intragroup exposures excluded from the leverage ratio exposure measure in accordance with Article 429 (7) of Regulation (EU) No 575/2013)
— (223,198) — (207,445)
7 Other adjustments (13,631) (18,023) (10,109) (14,147) EU-7a Adjustment for regular-way purchases and sales of
financial assets subject to trade date (41,743) (16,305) (21,229) (13,502)
8 Total leverage ratio exposure 1,334,929 882,543 1,254,157 826,371
1 Capital and leverage measures are calculated applying CRR as amended by CRR II.2 Leverage ratio is calculated without applying the transitional arrangements of the CRR as amended by CRR II for Barclays Group and with applying the
transitional arrangements of the CRR as amended by CRR II for Barclays Bank PLC.
Leverage
Barclays PLC 23
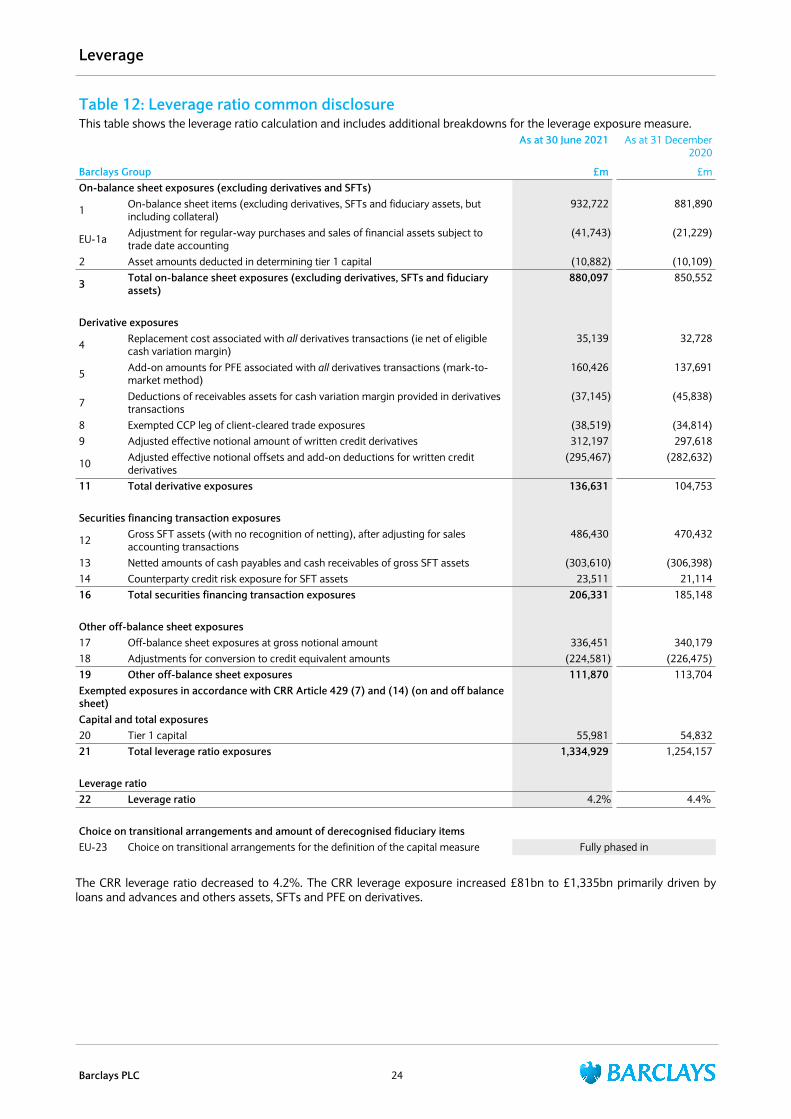
Table 12: Leverage ratio common disclosureThis table shows the leverage ratio calculation and includes additional breakdowns for the leverage exposure measure.
As at 30 June 2021 As at 31 December 2020
Barclays Group £m £mOn-balance sheet exposures (excluding derivatives and SFTs)
1 On-balance sheet items (excluding derivatives, SFTs and fiduciary assets, but including collateral)
932,722 881,890
EU-1a Adjustment for regular-way purchases and sales of financial assets subject to trade date accounting
(41,743) (21,229)
2 Asset amounts deducted in determining tier 1 capital (10,882) (10,109)
3 Total on-balance sheet exposures (excluding derivatives, SFTs and fiduciary assets)
880,097 850,552
Derivative exposures
4 Replacement cost associated with all derivatives transactions (ie net of eligible cash variation margin)
35,139 32,728
5 Add-on amounts for PFE associated with all derivatives transactions (mark-to-market method)
160,426 137,691
7 Deductions of receivables assets for cash variation margin provided in derivatives transactions
(37,145) (45,838)
8 Exempted CCP leg of client-cleared trade exposures (38,519) (34,814)9 Adjusted effective notional amount of written credit derivatives 312,197 297,618
10 Adjusted effective notional offsets and add-on deductions for written credit derivatives
(295,467) (282,632)
11 Total derivative exposures 136,631 104,753
Securities financing transaction exposures
12 Gross SFT assets (with no recognition of netting), after adjusting for sales accounting transactions
486,430 470,432
13 Netted amounts of cash payables and cash receivables of gross SFT assets (303,610) (306,398)14 Counterparty credit risk exposure for SFT assets 23,511 21,11416 Total securities financing transaction exposures 206,331 185,148
Other off-balance sheet exposures17 Off-balance sheet exposures at gross notional amount 336,451 340,17918 Adjustments for conversion to credit equivalent amounts (224,581) (226,475)19 Other off-balance sheet exposures 111,870 113,704Exempted exposures in accordance with CRR Article 429 (7) and (14) (on and off balance sheet)Capital and total exposures20 Tier 1 capital 55,981 54,83221 Total leverage ratio exposures 1,334,929 1,254,157
Leverage ratio22 Leverage ratio 4.2% 4.4%
Choice on transitional arrangements and amount of derecognised fiduciary itemsEU-23 Choice on transitional arrangements for the definition of the capital measure Fully phased in
The CRR leverage ratio decreased to 4.2%. The CRR leverage exposure increased £81bn to £1,335bn primarily driven by loans and advances and others assets, SFTs and PFE on derivatives.
Leverage
Barclays PLC 24
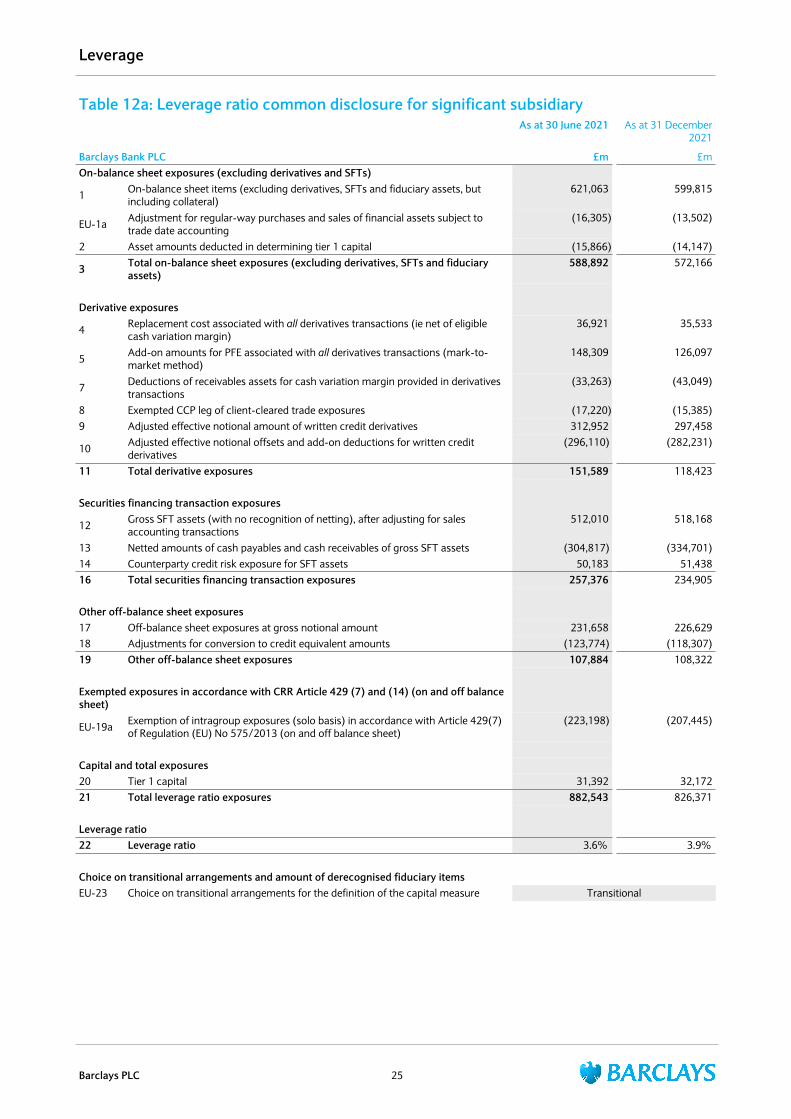
Table 12a: Leverage ratio common disclosure for significant subsidiaryAs at 30 June 2021 As at 31 December
2021
Barclays Bank PLC £m £mOn-balance sheet exposures (excluding derivatives and SFTs)
1 On-balance sheet items (excluding derivatives, SFTs and fiduciary assets, but including collateral)
621,063 599,815
EU-1a Adjustment for regular-way purchases and sales of financial assets subject to trade date accounting
(16,305) (13,502)
2 Asset amounts deducted in determining tier 1 capital (15,866) (14,147)
3 Total on-balance sheet exposures (excluding derivatives, SFTs and fiduciary assets)
588,892 572,166
Derivative exposures
4 Replacement cost associated with all derivatives transactions (ie net of eligible cash variation margin)
36,921 35,533
5 Add-on amounts for PFE associated with all derivatives transactions (mark-to-market method)
148,309 126,097
7 Deductions of receivables assets for cash variation margin provided in derivatives transactions
(33,263) (43,049)
8 Exempted CCP leg of client-cleared trade exposures (17,220) (15,385)9 Adjusted effective notional amount of written credit derivatives 312,952 297,458
10 Adjusted effective notional offsets and add-on deductions for written credit derivatives
(296,110) (282,231)
11 Total derivative exposures 151,589 118,423
Securities financing transaction exposures
12 Gross SFT assets (with no recognition of netting), after adjusting for sales accounting transactions
512,010 518,168
13 Netted amounts of cash payables and cash receivables of gross SFT assets (304,817) (334,701)14 Counterparty credit risk exposure for SFT assets 50,183 51,43816 Total securities financing transaction exposures 257,376 234,905
Other off-balance sheet exposures17 Off-balance sheet exposures at gross notional amount 231,658 226,62918 Adjustments for conversion to credit equivalent amounts (123,774) (118,307)19 Other off-balance sheet exposures 107,884 108,322
Exempted exposures in accordance with CRR Article 429 (7) and (14) (on and off balance sheet)
EU-19a Exemption of intragroup exposures (solo basis) in accordance with Article 429(7) of Regulation (EU) No 575/2013 (on and off balance sheet)
(223,198) (207,445)
Capital and total exposures20 Tier 1 capital 31,392 32,17221 Total leverage ratio exposures 882,543 826,371
Leverage ratio22 Leverage ratio 3.6% 3.9%
Choice on transitional arrangements and amount of derecognised fiduciary itemsEU-23 Choice on transitional arrangements for the definition of the capital measure Transitional
Leverage
Barclays PLC 25
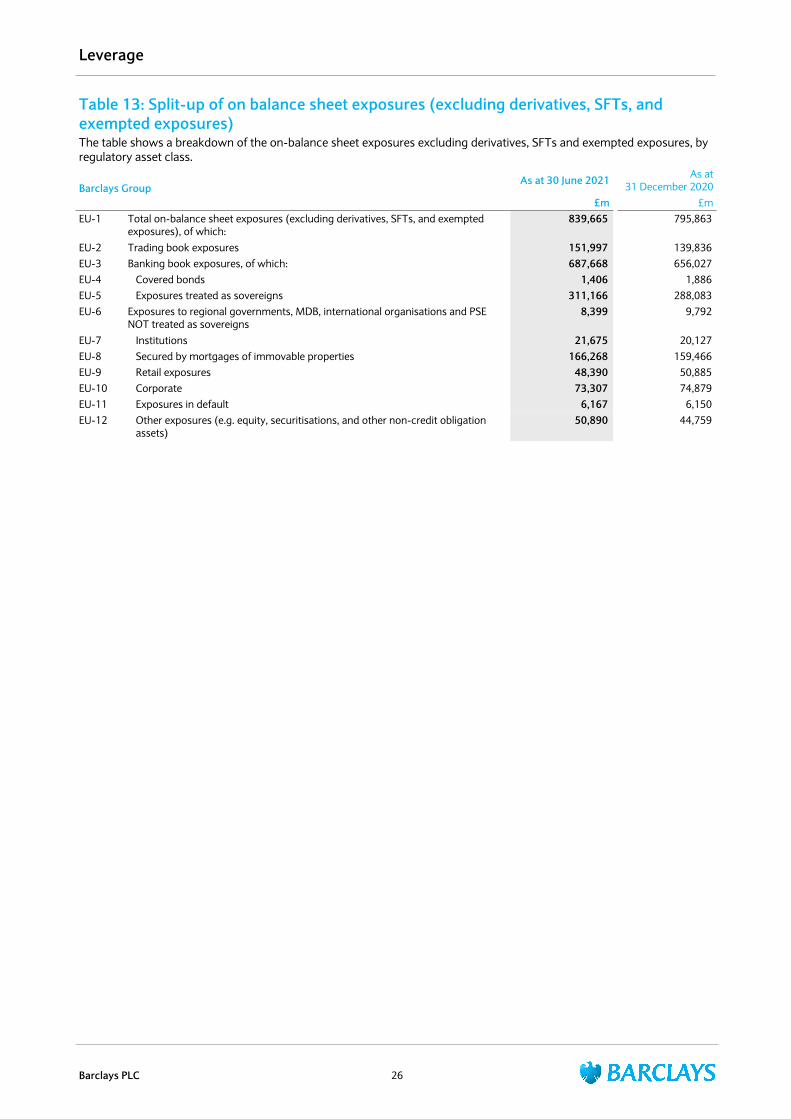
Table 13: Split-up of on balance sheet exposures (excluding derivatives, SFTs, and exempted exposures)The table shows a breakdown of the on-balance sheet exposures excluding derivatives, SFTs and exempted exposures, by regulatory asset class.
Barclays GroupAs at 30 June 2021 As at
31 December 2020£m £m
EU-1 Total on-balance sheet exposures (excluding derivatives, SFTs, and exempted exposures), of which:
839,665 795,863
EU-2 Trading book exposures 151,997 139,836 EU-3 Banking book exposures, of which: 687,668 656,027 EU-4 Covered bonds 1,406 1,886 EU-5 Exposures treated as sovereigns 311,166 288,083 EU-6 Exposures to regional governments, MDB, international organisations and PSE
NOT treated as sovereigns 8,399 9,792
EU-7 Institutions 21,675 20,127 EU-8 Secured by mortgages of immovable properties 166,268 159,466 EU-9 Retail exposures 48,390 50,885 EU-10 Corporate 73,307 74,879 EU-11 Exposures in default 6,167 6,150 EU-12 Other exposures (e.g. equity, securitisations, and other non-credit obligation
assets) 50,890 44,759
Leverage
Barclays PLC 26

Minimum requirement for own funds and eligible liabilities (MREL)
The disclosures in this section (Tables 14 to 18) have been prepared in accordance with CRR as amended by CRR II, using the uniform format set out in the BCBS Standard on Pillar 3 disclosure requirements.
Table 14: KM2 - Key metrics - TLAC requirements (at resolution group level)This table shows the key metrics for the Group’s own funds and eligible liabilities.
Barclays GroupAs at
30.06.21As at
31.03.21As at
31.12.20As at
30.09.20As at
30.06.20£m £m £m £m £m
1 Total Loss Absorbing Capacity (TLAC) available1 105,344 102,756 102,746 105,115 107,4701a Fully loaded ECL accounting model TLAC available 104,505 101,271 101,030 103,544 105,9752 Total RWA at the level of the resolution group1 306,424 313,356 306,203 310,727 318,9873 TLAC as a percentage of RWA (row 1 / row 2) (%)1 34.4% 32.8% 33.6% 33.8% 33.7% 3a Fully loaded ECL accounting model TLAC as a percentage of fully
loaded ECL accounting model RWA (%) 34.1% 32.4% 33.1% 33.4% 33.3%
4 Leverage ratio exposure measure at the level of the resolution group2
1,334,929 1,320,628 1,254,157 1,306,828 1,248,215
5 TLAC as a percentage of leverage ratio exposure measure (row 1 / row 4) (%)1,2
7.9% 7.8% 8.2% 8.0% 8.6%
5a Fully loaded ECL accounting model TLAC as a percentage of fully loaded ECL accounting model Leverage exposure measure (%)
7.8% 7.7% 8.1% 7.9% 8.5%
6a Does the subordination exemption in the antepenultimate paragraph of Section 11 of the FSB TLAC Term Sheet apply?
No No No No No
6b Does the subordination exemption in the penultimate paragraph of Section 11 of the FSB TLAC Term Sheet apply?
No No No No No
6c If the capped subordination exemption applies, the amount of funding issued that ranks pari passu with Excluded Liabilities and that is recognised as external TLAC, divided by funding issued that ranks pari passu with Excluded Liabilities and that would be recognised as external TLAC if no cap was applied (%)
N/A N/A N/A N/A N/A
1 Own funds included in TLAC, and RWAs are calculated applying the transitional arrangements of the CRR as amended by CRR II. This includes IFRS 9 transitional arrangements and the grandfathering of CRR and CRR II non-compliant capital instruments.
2 Fully loaded CRR leverage exposure is calculated without applying the transitional arrangements of the CRR as amended by CRR II.
Minimum requirement for own funds and eligible liabilities (MREL)
Barclays PLC 27

Table 15: TLAC 1 - TLAC composition for G-SIBs (at resolution group level)This table shows the composition of the Group’s own funds and eligible liabilities and ratios.
Barclays GroupAs at 30.06.21
£mRegulatory capital elements of TLAC and adjustments1
1 Common Equity Tier 1 capital (CET1) 46,2252 Additional Tier 1 capital (AT1) before TLAC adjustment 11,7355 AT1 instruments eligible under the TLAC framework 11,7356 Tier 2 capital (T2) before TLAC adjustments 10,2897 Amortised portion of T2 instruments where remaining maturity > 1 year 38610 T2 instruments eligible under the TLAC framework 10,67511 TLAC arising from regulatory capital 68,635
Non-regulatory capital elements of TLAC12 External TLAC instruments issued directly by the bank and subordinated to excluded liabilities 36,74417 TLAC arising from non-regulatory capital instruments before adjustments 36,744
Non-regulatory capital elements of TLAC: adjustments18 TLAC before deductions 105,37920 Deduction of investments in own other TLAC liabilities (35)22 TLAC after deductions 105,344
Risk-weighted assets and leverage exposure measure for TLAC purposes23 Total risk-weighted assets adjusted as permitted under the TLAC regime1 306,42424 Leverage exposure measure2 1,334,929
TLAC ratios and buffers25 TLAC (as a percentage of risk-weighted assets adjusted as permitted under the TLAC regime)1 34.4% 26 TLAC (as a percentage of leverage exposure)1,2 7.9% 27 CET1 (as a percentage of risk-weighted assets) available after meeting the resolution group’s minimum
capital and TLAC requirements 10.6%
28 Institution-specific buffer requirement (capital conservation buffer plus countercyclical buffer requirements plus higher loss absorbency requirement, expressed as a percentage of risk-weighted assets)
4.0%
29 Of which: capital conservation buffer requirement 2.5% 30 Of which: bank specific countercyclical buffer requirement 0.0% 31 Of which: higher loss absorbency requirement 1.5%
1 Own funds included in TLAC, and RWAs are calculated applying the transitional arrangements of the CRR as amended by CRR II. This includes IFRS 9 transitional arrangements and the grandfathering of CRR and CRR II non-compliant capital instruments.
2 Fully loaded CRR leverage exposure is calculated without applying the transitional arrangements of the CRR as amended by CRR II.
Minimum requirement for own funds and eligible liabilities (MREL)
Barclays PLC 28
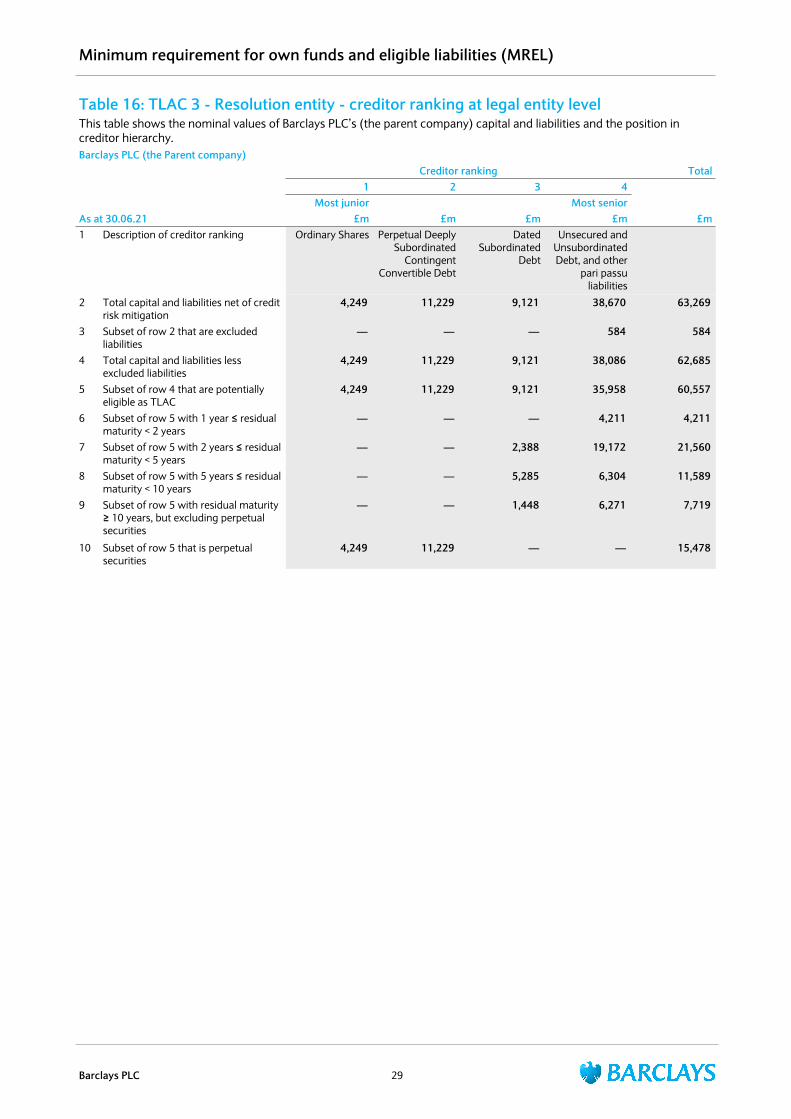
Table 16: TLAC 3 - Resolution entity - creditor ranking at legal entity levelThis table shows the nominal values of Barclays PLC’s (the parent company) capital and liabilities and the position in creditor hierarchy.Barclays PLC (the Parent company)
Creditor ranking Total1 2 3 4
Most junior Most seniorAs at 30.06.21 £m £m £m £m £m1 Description of creditor ranking Ordinary Shares Perpetual Deeply
Subordinated Contingent
Convertible Debt
Dated Subordinated
Debt
Unsecured and Unsubordinated Debt, and other
pari passu liabilities
2 Total capital and liabilities net of credit risk mitigation
4,249 11,229 9,121 38,670 63,269
3 Subset of row 2 that are excluded liabilities
— — — 584 584
4 Total capital and liabilities less excluded liabilities
4,249 11,229 9,121 38,086 62,685
5 Subset of row 4 that are potentially eligible as TLAC
4,249 11,229 9,121 35,958 60,557
6 Subset of row 5 with 1 year ≤ residual maturity < 2 years
— — — 4,211 4,211
7 Subset of row 5 with 2 years ≤ residual maturity < 5 years
— — 2,388 19,172 21,560
8 Subset of row 5 with 5 years ≤ residual maturity < 10 years
— — 5,285 6,304 11,589
9 Subset of row 5 with residual maturity ≥ 10 years, but excluding perpetual securities
— — 1,448 6,271 7,719
10 Subset of row 5 that is perpetual securities
4,249 11,229 — — 15,478
Minimum requirement for own funds and eligible liabilities (MREL)
Barclays PLC 29

Table 17: TLAC2 - Material subgroup entity - creditor ranking at legal entity levelThis table shows the nominal values of Barclays Bank PLC’s capital and liabilities and the position in creditor hierarchy.Barclays Bank PLC
Creditor ranking Total1 2 2 3 4 5 5 6
Most junior Most seniorAs at 30.06.21 £m £m £m £m £m £m £m £m £m1 Is the resolution
entity the creditor/investor?
Yes Yes No No No Yes No Yes
2 Description of creditor ranking
Ordinary Shares
Perpetual Deeply
Sub-ordinated
Contingent Convertible
Debt
Preference Shares /
Perpetual Deeply
Sub-ordinated
Debt
Perpetual Sub-
ordinated Debt
Junior Sub-
ordinated Debt
Dated Sub-
ordinated Debt
Dated Sub-ordinated
Debt / Dated Sub-
ordinated Contingent
Capital Debt
Dated secondary
non-preferential
debt
3 Total capital and liabilities net of credit risk mitigation
2,343 8,654 720 572 27 7,608 2,709 16,826 39,459
4 Subset of row 3 that are excluded liabilities
— — — — — — — — —
5 Total capital and liabilities less excluded liabilities
2,343 8,654 720 572 27 7,608 2,709 16,826 39,459
6 Subset of row 5 that are eligible as TLAC
2,343 8,654 720 572 27 7,608 2,709 16,533 39,166
7 Subset of row 6 with 1 year ≤ residual maturity < 2 years
— — — — — — 1,085 3,027 4,112
8 Subset of row 6 with 2 years ≤ residual maturity < 5 years
— — — — — 989 43 10,196 11,228
9 Subset of row 6 with 5 years ≤ residual maturity < 10 years
— — — — — 4,062 372 1,760 6,194
10 Subset of row 6 with residual maturity ≥ 10 years, but excluding perpetual securities
— — — — — 2,557 108 1,550 4,215
11 Subset of row 6 that is perpetual securities
2,343 8,654 720 572 27 — — — 12,316
Minimum requirement for own funds and eligible liabilities (MREL)
Barclays PLC 30
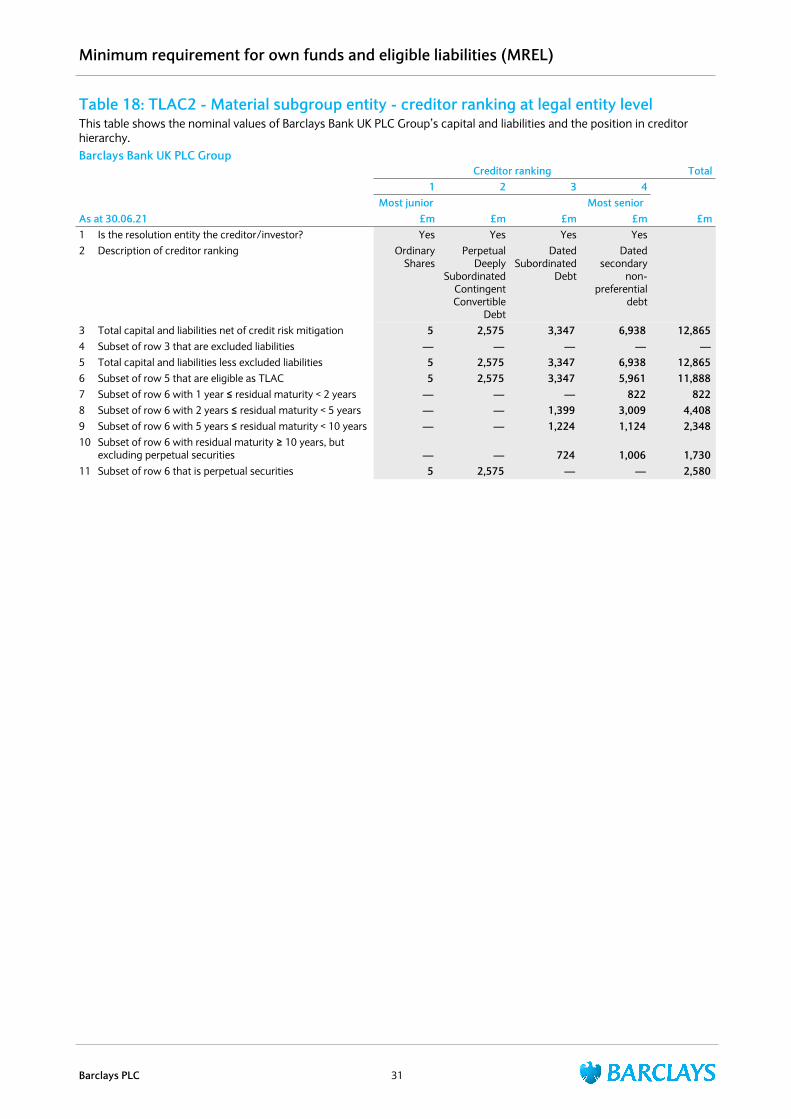
Table 18: TLAC2 - Material subgroup entity - creditor ranking at legal entity levelThis table shows the nominal values of Barclays Bank UK PLC Group’s capital and liabilities and the position in creditor hierarchy.Barclays Bank UK PLC Group
Creditor ranking Total1 2 3 4
Most junior Most seniorAs at 30.06.21 £m £m £m £m £m1 Is the resolution entity the creditor/investor? Yes Yes Yes Yes2 Description of creditor ranking Ordinary
SharesPerpetual
Deeply Subordinated
Contingent Convertible
Debt
Dated Subordinated
Debt
Dated secondary
non-preferential
debt
3 Total capital and liabilities net of credit risk mitigation 5 2,575 3,347 6,938 12,865 4 Subset of row 3 that are excluded liabilities — — — — — 5 Total capital and liabilities less excluded liabilities 5 2,575 3,347 6,938 12,865 6 Subset of row 5 that are eligible as TLAC 5 2,575 3,347 5,961 11,888 7 Subset of row 6 with 1 year ≤ residual maturity < 2 years — — — 822 822 8 Subset of row 6 with 2 years ≤ residual maturity < 5 years — — 1,399 3,009 4,408 9 Subset of row 6 with 5 years ≤ residual maturity < 10 years — — 1,224 1,124 2,348 10 Subset of row 6 with residual maturity ≥ 10 years, but
excluding perpetual securities — — 724 1,006 1,730 11 Subset of row 6 that is perpetual securities 5 2,575 — — 2,580
Minimum requirement for own funds and eligible liabilities (MREL)
Barclays PLC 31

Table 19: LIQ1 - Liquidity Coverage ratioThis table shows the level and components of the Liquidity Coverage Ratio. This disclosure has been prepared in accordance with the requirements set out in the ‘Guidelines on LCR disclosure to complement the disclosure of liquidity risk management under Article 435 of Regulation (EU) No 575/2013’ as specified in Annexure II which complements Article 435(1)(f) of Regulation (EU) No 575/2013.Liquidity coverage ratio (period end) Total period end value
30.06.21 31.03.21 31.12.20 30.09.20 30.06.20
Barclays Group £m £m £m £m £m
Liquidity buffer 280,079 280,175 258,198 319,785 291,116
Total net cash outflows 172,528 173,490 159,320 176,394 156,201
Liquidity coverage ratio (%) (period end) 162% 161% 162% 181% 186%
LIQ1 - Liquidity coverage ratio (average)
Total unweighted value (average) Total weighted value (average)
30.06.21 31.03.21 31.12.20 30.09.20 30.06.20 30.06.21 31.03.21 31.12.20 30.09.20 30.06.20
Number of data points used in calculation of averages1
12 12 12 12 12 12 12 12 12 12
High-quality liquid assets £m £m £m £m £m £m £m £m £m £m
1 Total high-quality liquid assets (HQLA) 298,380 295,957 281,470 262,744 242,005
Cash outflows
2 Retail deposits and deposits from small business customers, of which:
250,148 244,129 232,900 222,638 212,695 21,061 20,507 19,795 19,184 18,655
3 Stable deposits 135,225 131,313 125,621 120,444 115,586 6,761 6,565 6,281 6,022 5,779
4 Less stable deposits 105,639 102,964 99,687 96,799 94,378 14,295 13,937 13,509 13,156 12,870
5 Unsecured wholesale funding, of which: 222,291 217,873 208,240 194,573 183,119 114,444 113,206 107,669 99,108 92,557
6 Operational deposits (all counterparties) and deposits in networks of cooperative banks
52,945 50,547 48,850 45,956 42,922 12,938 12,353 11,946 11,251 10,525
7 Non-operational deposits (all counterparties)2
160,623 158,952 152,613 142,861 135,266 92,783 92,479 88,946 82,101 77,101
8 Unsecured debt 8,723 8,374 6,777 5,756 4,931 8,723 8,374 6,777 5,756 4,931
9 Secured wholesale funding 57,386 58,042 58,316 58,086 60,066
10 Additional requirements, of which: 184,243 181,899 178,970 176,757 178,640 55,043 54,993 54,122 52,815 53,275
11 Outflows related to derivative exposures and other collateral requirements
21,644 22,212 22,814 22,050 21,557 19,324 19,890 20,421 19,693 19,258
12 Outflows related to loss of funding on debt products
10,431 10,311 9,483 9,262 9,626 10,431 10,311 9,483 9,262 9,626
13 Credit and liquidity facilities 152,168 149,376 146,673 145,445 147,457 25,288 24,792 24,218 23,860 24,391
14 Other contractual funding obligations 3,165 3,288 3,030 2,754 2,647 2,626 2,669 2,351 2,053 1,924
15 Other contingent funding obligations 154,310 157,072 159,316 160,231 161,936 5,997 5,783 5,693 5,935 6,133
16 Total cash outflows 256,557 225,200 247,946 237,181 232,610
Cash inflows
17 Secured lending (e.g. reverse repos) 504,617 494,791 486,986 469,995 461,684 55,669 55,605 55,820 56,616 58,363
18 Inflows from fully performing exposures 14,965 16,257 16,844 15,537 14,219 10,601 11,667 12,010 10,469 9,172
19 Other cash inflows3 14,313 14,656 15,885 15,790 14,886 10,570 10,790 11,982 11,566 10,357
EU-19a
(Difference between total weighted inflows and total weighted outflows arising from transactions in third countries where there are transfer restrictions or which are denominated in non-convertible currencies)
EU-19b
(Excess inflows from a related specialised credit institution)
20 Total cash inflows 533,895 525,704 519,316 501,322 490,789 76,840 78,062 79,812 78,651 77,892
Fully exempt inflows — — — — — — — — — —
Inflows subject to 90% cap — — — — — — — — — —
Inflows subject to 75% cap £431,215 £427,927 £422,635 £407,686 £398,840 76,840 78,062 79,812 78,651 77,892
21 Liquidity buffer 298,380 295,957 281,470 262,744 242,005
22 Total net cash outflows 179,717 177,138 168,134 158,530 154,718
23 Liquidity coverage ratio (%) (average) 166% 167% 167% 166% 156%
1 Trailing average of 12 month-end observations to the reporting date.2 Non-operational deposits in row 7 include excess deposits as defined in the Delegated Act Article 27(4).3 Difference between total weighted inflows and total weighted outflows arising from transactions in third countries where there is transfer restrictions or
which are denominated in non-convertible currencies.
As at 30 June 2021, the Barclays Group LCR was 162% (December 2020: 162%), equivalent to a surplus of £108bn (December 2020:£99bn) above the 100% regulatory requirement. The trailing 12 month-end average LCR to 30 June 2021 was 166% (December 2020: 167%).
Liquidity
Barclays PLC 32
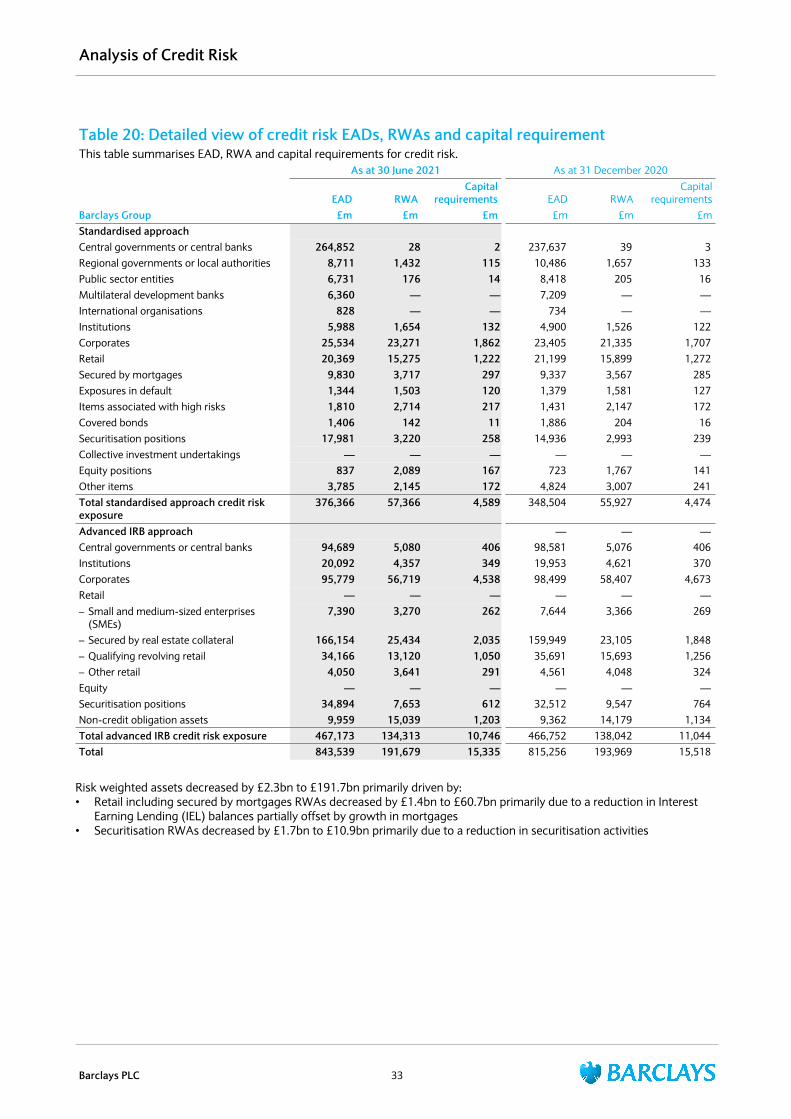
Table 20: Detailed view of credit risk EADs, RWAs and capital requirementThis table summarises EAD, RWA and capital requirements for credit risk.
As at 30 June 2021 As at 31 December 2020
EAD RWACapital
requirements EAD RWACapital
requirementsBarclays Group £m £m £m £m £m £mStandardised approachCentral governments or central banks 264,852 28 2 237,637 39 3 Regional governments or local authorities 8,711 1,432 115 10,486 1,657 133 Public sector entities 6,731 176 14 8,418 205 16 Multilateral development banks 6,360 — — 7,209 — — International organisations 828 — — 734 — — Institutions 5,988 1,654 132 4,900 1,526 122 Corporates 25,534 23,271 1,862 23,405 21,335 1,707 Retail 20,369 15,275 1,222 21,199 15,899 1,272 Secured by mortgages 9,830 3,717 297 9,337 3,567 285 Exposures in default 1,344 1,503 120 1,379 1,581 127 Items associated with high risks 1,810 2,714 217 1,431 2,147 172 Covered bonds 1,406 142 11 1,886 204 16 Securitisation positions 17,981 3,220 258 14,936 2,993 239 Collective investment undertakings — — — — — — Equity positions 837 2,089 167 723 1,767 141 Other items 3,785 2,145 172 4,824 3,007 241 Total standardised approach credit risk exposure
376,366 57,366 4,589 348,504 55,927 4,474
Advanced IRB approach — — — Central governments or central banks 94,689 5,080 406 98,581 5,076 406 Institutions 20,092 4,357 349 19,953 4,621 370 Corporates 95,779 56,719 4,538 98,499 58,407 4,673 Retail — — — — — — – Small and medium-sized enterprises
(SMEs) 7,390 3,270 262 7,644 3,366 269
– Secured by real estate collateral 166,154 25,434 2,035 159,949 23,105 1,848 – Qualifying revolving retail 34,166 13,120 1,050 35,691 15,693 1,256 – Other retail 4,050 3,641 291 4,561 4,048 324 Equity — — — — — — Securitisation positions 34,894 7,653 612 32,512 9,547 764 Non-credit obligation assets 9,959 15,039 1,203 9,362 14,179 1,134 Total advanced IRB credit risk exposure 467,173 134,313 10,746 466,752 138,042 11,044 Total 843,539 191,679 15,335 815,256 193,969 15,518
Risk weighted assets decreased by £2.3bn to £191.7bn primarily driven by:• Retail including secured by mortgages RWAs decreased by £1.4bn to £60.7bn primarily due to a reduction in Interest
Earning Lending (IEL) balances partially offset by growth in mortgages• Securitisation RWAs decreased by £1.7bn to £10.9bn primarily due to a reduction in securitisation activities
Analysis of Credit Risk
Barclays PLC 33
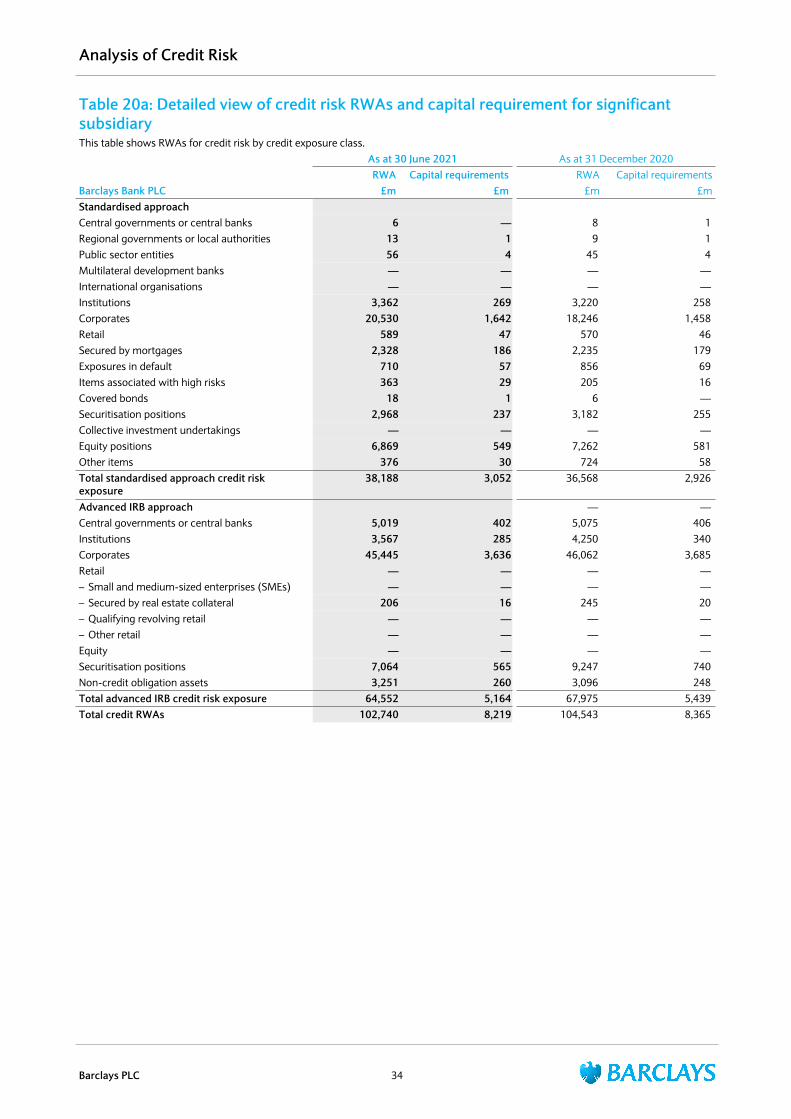
Table 20a: Detailed view of credit risk RWAs and capital requirement for significant subsidiaryThis table shows RWAs for credit risk by credit exposure class.
As at 30 June 2021 As at 31 December 2020RWA Capital requirements RWA Capital requirements
Barclays Bank PLC £m £m £m £mStandardised approachCentral governments or central banks 6 — 8 1 Regional governments or local authorities 13 1 9 1 Public sector entities 56 4 45 4 Multilateral development banks — — — — International organisations — — — — Institutions 3,362 269 3,220 258 Corporates 20,530 1,642 18,246 1,458 Retail 589 47 570 46 Secured by mortgages 2,328 186 2,235 179 Exposures in default 710 57 856 69 Items associated with high risks 363 29 205 16 Covered bonds 18 1 6 — Securitisation positions 2,968 237 3,182 255 Collective investment undertakings — — — — Equity positions 6,869 549 7,262 581 Other items 376 30 724 58 Total standardised approach credit risk exposure
38,188 3,052 36,568 2,926
Advanced IRB approach — — Central governments or central banks 5,019 402 5,075 406 Institutions 3,567 285 4,250 340 Corporates 45,445 3,636 46,062 3,685 Retail — — — — – Small and medium-sized enterprises (SMEs) — — — — – Secured by real estate collateral 206 16 245 20 – Qualifying revolving retail — — — — – Other retail — — — — Equity — — — — Securitisation positions 7,064 565 9,247 740 Non-credit obligation assets 3,251 260 3,096 248 Total advanced IRB credit risk exposure 64,552 5,164 67,975 5,439 Total credit RWAs 102,740 8,219 104,543 8,365
Analysis of Credit Risk
Barclays PLC 34
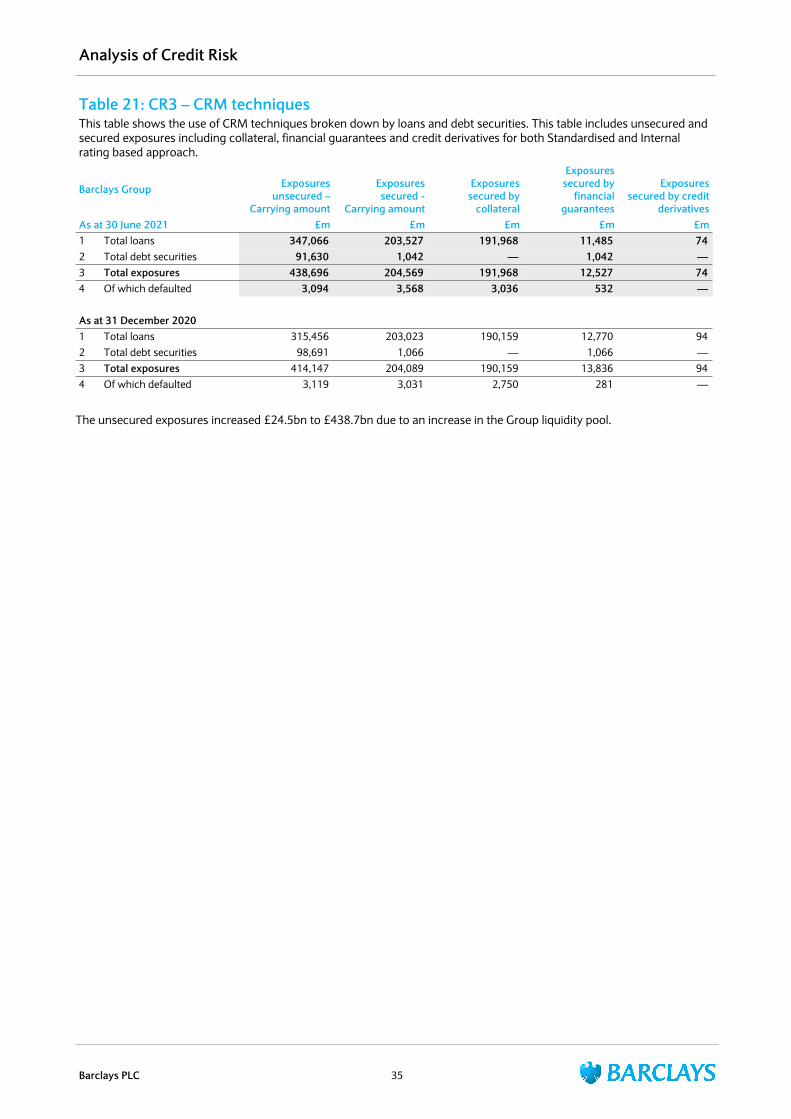
Table 21: CR3 – CRM techniquesThis table shows the use of CRM techniques broken down by loans and debt securities. This table includes unsecured and secured exposures including collateral, financial guarantees and credit derivatives for both Standardised and Internal rating based approach.
Barclays Group Exposures unsecured –
Carrying amount
Exposures secured -
Carrying amount
Exposures secured by
collateral
Exposures secured by
financial guarantees
Exposures secured by credit
derivativesAs at 30 June 2021 £m £m £m £m £m1 Total loans 347,066 203,527 191,968 11,485 74 2 Total debt securities 91,630 1,042 — 1,042 — 3 Total exposures 438,696 204,569 191,968 12,527 74 4 Of which defaulted 3,094 3,568 3,036 532 —
As at 31 December 20201 Total loans 315,456 203,023 190,159 12,770 94 2 Total debt securities 98,691 1,066 — 1,066 — 3 Total exposures 414,147 204,089 190,159 13,836 94 4 Of which defaulted 3,119 3,031 2,750 281 —
The unsecured exposures increased £24.5bn to £438.7bn due to an increase in the Group liquidity pool.
Analysis of Credit Risk
Barclays PLC 35
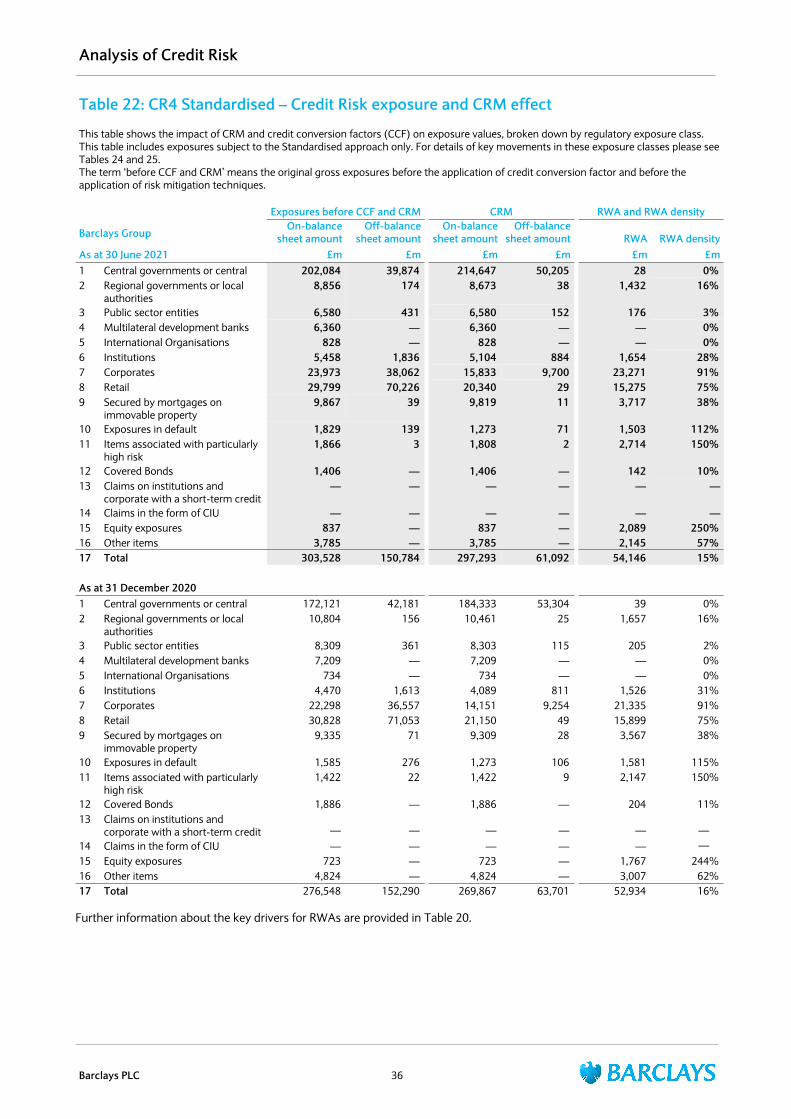
Table 22: CR4 Standardised – Credit Risk exposure and CRM effect
This table shows the impact of CRM and credit conversion factors (CCF) on exposure values, broken down by regulatory exposure class. This table includes exposures subject to the Standardised approach only. For details of key movements in these exposure classes please see Tables 24 and 25.The term ‘before CCF and CRM’ means the original gross exposures before the application of credit conversion factor and before the application of risk mitigation techniques.
Exposures before CCF and CRMExposures post-CCF and
CRM RWA and RWA density
Barclays GroupOn-balance
sheet amountOff-balance
sheet amountOn-balance
sheet amountOff-balance
sheet amount RWA RWA densityAs at 30 June 2021 £m £m £m £m £m £m1 Central governments or central 202,084 39,874 214,647 50,205 28 0% 2 Regional governments or local
authorities 8,856 174 8,673 38 1,432 16%
3 Public sector entities 6,580 431 6,580 152 176 3% 4 Multilateral development banks 6,360 — 6,360 — — 0% 5 International Organisations 828 — 828 — — 0% 6 Institutions 5,458 1,836 5,104 884 1,654 28% 7 Corporates 23,973 38,062 15,833 9,700 23,271 91% 8 Retail 29,799 70,226 20,340 29 15,275 75% 9 Secured by mortgages on
immovable property 9,867 39 9,819 11 3,717 38%
10 Exposures in default 1,829 139 1,273 71 1,503 112% 11 Items associated with particularly
high risk 1,866 3 1,808 2 2,714 150%
12 Covered Bonds 1,406 — 1,406 — 142 10% 13 Claims on institutions and
corporate with a short-term credit — — — — — —
14 Claims in the form of CIU — — — — — —15 Equity exposures 837 — 837 — 2,089 250% 16 Other items 3,785 — 3,785 — 2,145 57% 17 Total 303,528 150,784 297,293 61,092 54,146 15%
As at 31 December 20201 Central governments or central 172,121 42,181 184,333 53,304 39 0% 2 Regional governments or local
authorities 10,804 156 10,461 25 1,657 16%
3 Public sector entities 8,309 361 8,303 115 205 2% 4 Multilateral development banks 7,209 — 7,209 — — 0% 5 International Organisations 734 — 734 — — 0% 6 Institutions 4,470 1,613 4,089 811 1,526 31% 7 Corporates 22,298 36,557 14,151 9,254 21,335 91% 8 Retail 30,828 71,053 21,150 49 15,899 75% 9 Secured by mortgages on
immovable property 9,335 71 9,309 28 3,567 38%
10 Exposures in default 1,585 276 1,273 106 1,581 115% 11 Items associated with particularly
high risk 1,422 22 1,422 9 2,147 150%
12 Covered Bonds 1,886 — 1,886 — 204 11% 13 Claims on institutions and
corporate with a short-term credit — — — — — — 14 Claims in the form of CIU — — — — — — 15 Equity exposures 723 — 723 — 1,767 244% 16 Other items 4,824 — 4,824 — 3,007 62% 17 Total 276,548 152,290 269,867 63,701 52,934 16%
Further information about the key drivers for RWAs are provided in Table 20.
Analysis of Credit Risk
Barclays PLC 36
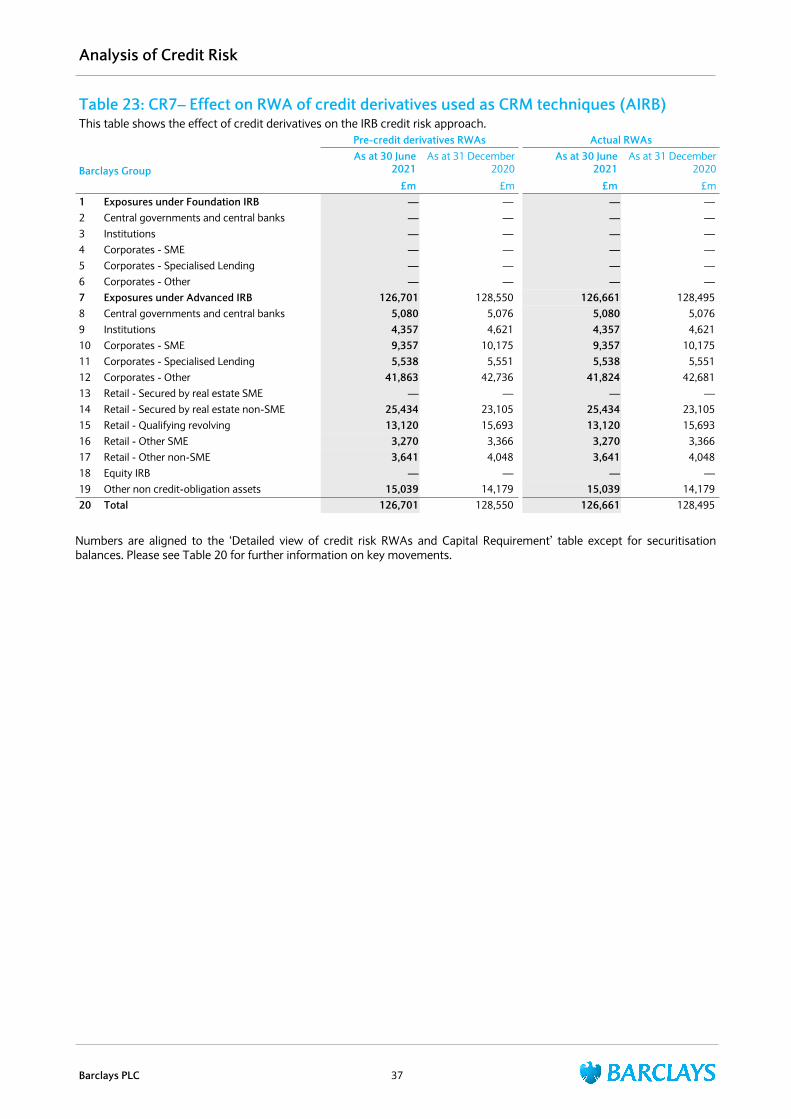
Table 23: CR7– Effect on RWA of credit derivatives used as CRM techniques (AIRB)This table shows the effect of credit derivatives on the IRB credit risk approach.
Pre-credit derivatives RWAs Actual RWAs
Barclays GroupAs at 30 June
2021As at 31 December
2020As at 30 June
2021As at 31 December
2020
£m £m £m £m1 Exposures under Foundation IRB — — — — 2 Central governments and central banks — — — — 3 Institutions — — — — 4 Corporates - SME — — — — 5 Corporates - Specialised Lending — — — — 6 Corporates - Other — — — — 7 Exposures under Advanced IRB 126,701 128,550 126,661 128,495 8 Central governments and central banks 5,080 5,076 5,080 5,076 9 Institutions 4,357 4,621 4,357 4,621 10 Corporates - SME 9,357 10,175 9,357 10,175 11 Corporates - Specialised Lending 5,538 5,551 5,538 5,551 12 Corporates - Other 41,863 42,736 41,824 42,681 13 Retail - Secured by real estate SME — — — — 14 Retail - Secured by real estate non-SME 25,434 23,105 25,434 23,105 15 Retail - Qualifying revolving 13,120 15,693 13,120 15,693 16 Retail - Other SME 3,270 3,366 3,270 3,366 17 Retail - Other non-SME 3,641 4,048 3,641 4,048 18 Equity IRB — — — — 19 Other non credit-obligation assets 15,039 14,179 15,039 14,179 20 Total 126,701 128,550 126,661 128,495
Numbers are aligned to the ‘Detailed view of credit risk RWAs and Capital Requirement’ table except for securitisation balances. Please see Table 20 for further information on key movements.
Analysis of Credit Risk
Barclays PLC 37
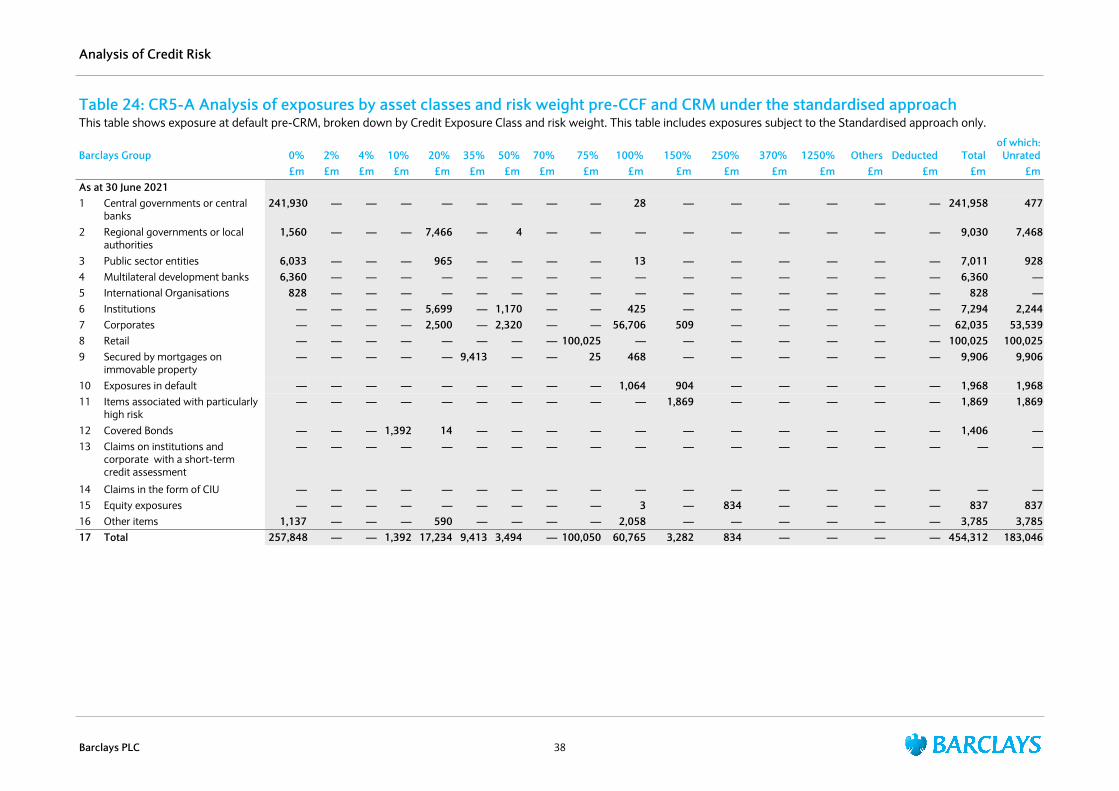
Table 24: CR5-A Analysis of exposures by asset classes and risk weight pre-CCF and CRM under the standardised approach This table shows exposure at default pre-CRM, broken down by Credit Exposure Class and risk weight. This table includes exposures subject to the Standardised approach only.
Barclays Group 0% 2% 4% 10% 20% 35% 50% 70% 75% 100% 150% 250% 370% 1250% Others Deducted Totalof which:
Unrated£m £m £m £m £m £m £m £m £m £m £m £m £m £m £m £m £m £m
As at 30 June 20211 Central governments or central
banks 241,930 — — — — — — — — 28 — — — — — — 241,958 477
2 Regional governments or local authorities
1,560 — — — 7,466 — 4 — — — — — — — — — 9,030 7,468
3 Public sector entities 6,033 — — — 965 — — — — 13 — — — — — — 7,011 928 4 Multilateral development banks 6,360 — — — — — — — — — — — — — — — 6,360 — 5 International Organisations 828 — — — — — — — — — — — — — — — 828 — 6 Institutions — — — — 5,699 — 1,170 — — 425 — — — — — — 7,294 2,244 7 Corporates — — — — 2,500 — 2,320 — — 56,706 509 — — — — — 62,035 53,539 8 Retail — — — — — — — — 100,025 — — — — — — — 100,025 100,025 9 Secured by mortgages on
immovable property — — — — — 9,413 — — 25 468 — — — — — — 9,906 9,906
10 Exposures in default — — — — — — — — — 1,064 904 — — — — — 1,968 1,968 11 Items associated with particularly
high risk — — — — — — — — — — 1,869 — — — — — 1,869 1,869
12 Covered Bonds — — — 1,392 14 — — — — — — — — — — — 1,406 — 13 Claims on institutions and
corporate with a short-term credit assessment
— — — — — — — — — — — — — — — — — —
14 Claims in the form of CIU — — — — — — — — — — — — — — — — — — 15 Equity exposures — — — — — — — — — 3 — 834 — — — — 837 837 16 Other items 1,137 — — — 590 — — — — 2,058 — — — — — — 3,785 3,785 17 Total 257,848 — — 1,392 17,234 9,413 3,494 — 100,050 60,765 3,282 834 — — — — 454,312 183,046
Analysis of Credit Risk
Barclays PLC 38
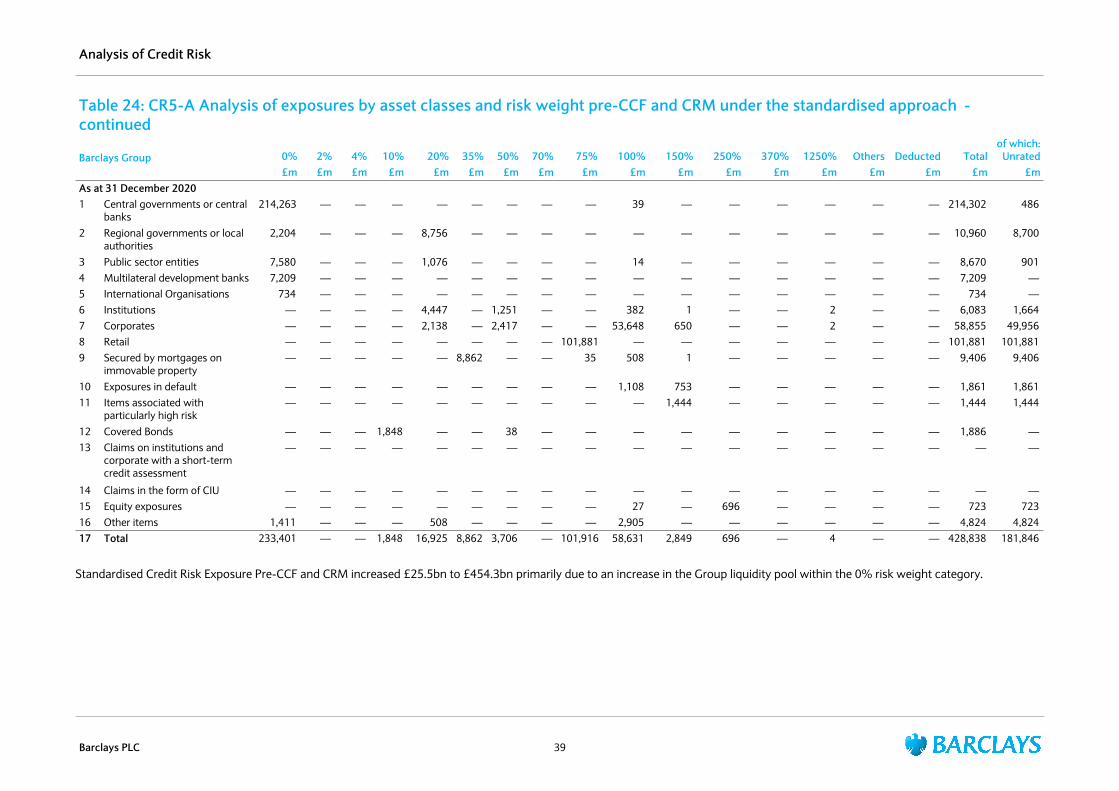
Table 24: CR5-A Analysis of exposures by asset classes and risk weight pre-CCF and CRM under the standardised approach - continued
Barclays Group 0% 2% 4% 10% 20% 35% 50% 70% 75% 100% 150% 250% 370% 1250% Others Deducted Totalof which:
Unrated£m £m £m £m £m £m £m £m £m £m £m £m £m £m £m £m £m £m
As at 31 December 20201 Central governments or central
banks 214,263 — — — — — — — — 39 — — — — — — 214,302 486
2 Regional governments or local authorities
2,204 — — — 8,756 — — — — — — — — — — — 10,960 8,700
3 Public sector entities 7,580 — — — 1,076 — — — — 14 — — — — — — 8,670 901 4 Multilateral development banks 7,209 — — — — — — — — — — — — — — — 7,209 — 5 International Organisations 734 — — — — — — — — — — — — — — — 734 — 6 Institutions — — — — 4,447 — 1,251 — — 382 1 — — 2 — — 6,083 1,664 7 Corporates — — — — 2,138 — 2,417 — — 53,648 650 — — 2 — — 58,855 49,956 8 Retail — — — — — — — — 101,881 — — — — — — — 101,881 101,881 9 Secured by mortgages on
immovable property — — — — — 8,862 — — 35 508 1 — — — — — 9,406 9,406
10 Exposures in default — — — — — — — — — 1,108 753 — — — — — 1,861 1,861 11 Items associated with
particularly high risk — — — — — — — — — — 1,444 — — — — — 1,444 1,444
12 Covered Bonds — — — 1,848 — — 38 — — — — — — — — — 1,886 — 13 Claims on institutions and
corporate with a short-term credit assessment
— — — — — — — — — — — — — — — — — —
14 Claims in the form of CIU — — — — — — — — — — — — — — — — — — 15 Equity exposures — — — — — — — — — 27 — 696 — — — — 723 723 16 Other items 1,411 — — — 508 — — — — 2,905 — — — — — — 4,824 4,824 17 Total 233,401 — — 1,848 16,925 8,862 3,706 — 101,916 58,631 2,849 696 — 4 — — 428,838 181,846
Standardised Credit Risk Exposure Pre-CCF and CRM increased £25.5bn to £454.3bn primarily due to an increase in the Group liquidity pool within the 0% risk weight category.
Analysis of Credit Risk
Barclays PLC 39

Table 25: CR5-B Analysis of exposures by asset classes and risk weight post-CCF and CRM under the standardised approach The difference between exposure at default pre-CRM set out in Table 24 Pre and exposure at default post-CRM below is the impact of financial collateral and CCF as described in Table 23.
Barclays Group 0% 2% 4% 10% 20% 35% 50% 70% 75% 100% 150% 250% 370% 1250% Others Deducted Total of which: Unrated
£m £m £m £m £m £m £m £m £m £m £m £m £m £m £m £m £m £mAs at 30 June 20211 Central governments or central
banks 264,824 — — — — — — — — 28 — — — — — — 264,852 344
2 Regional governments or local authorities
1,558 — — — 7,149 — 4 — — — — — — — — — 8,711 7,149
3 Public sector entities 5,888 — — — 834 — — — — 10 — — — — — — 6,732 793 4 Multilateral development banks 6,360 — — — — — — — — — — — — — — — 6,360 — 5 International Organisations 828 — — — — — — — — — — — — — — — 828 — 6 Institutions — — — — 5,086 — 532 — — 370 — — — — — — 5,988 2,076 7 Corporates — — — — 1,922 — 1,250 — — 22,081 280 — — — — — 25,533 20,635 8 Retail — — — — — — — — 20,369 — — — — — — — 20,369 20,369 9 Secured by mortgages on
immovable property — — — — — 9,346 — — 24 460 — — — — — — 9,830 9,830
10 Exposures in default — — — — — — — — — 1,026 318 — — — — — 1,344 1,344 11 Items associated with
particularly high risk — — — — — — — — — — 1,810 — — — — — 1,810 1,810
12 Covered Bonds — — — 1,392 14 — — — — — — — — — — — 1,406 — 13 Claims on institutions and
corporate with a short-term credit assessment
— — — — — — — — — — — — — — — — — —
14 Claims in the form of CIU — — — — — — — — — — — — — — — — — — 15 Equity exposures — — — — — — — — — 2 — 835 — — — — 837 837 16 Other items 1,138 — — — 590 — — — — 2,057 — — — — — — 3,785 3,785 17 Total 280,596 — — 1,392 15,595 9,346 1,786 — 20,393 26,034 2,408 835 — — — — 358,385 68,972
Analysis of Credit Risk
Barclays PLC 40

Table 25: CR5-B Analysis of exposures by asset classes and risk weight post-CCF and CRM under the standardised approach - continued
Barclays Group 0% 2% 4% 10% 20% 35% 50% 70% 75% 100% 150% 250% 370% 1250% Others Deducted Total of which: Unrated
£m £m £m £m £m £m £m £m £m £m £m £m £m £m £m £m £m £mAs at 31 December 20201 Central governments or central
banks 237,598 — — — — — — — — 39 — — — — — — 237,637 334
2 Regional governments or local authorities
2,202 — — — 8,284 — — — — — — — — — — — 10,486 8,227
3 Public sector entities 7,435 — — — 973 — — — — 10 — — — — — — 8,418 795 4 Multilateral development banks 7,209 — — — — — — — — — — — — — — — 7,209 — 5 International Organisations 734 — — — — — — — — — — — — — — — 734 — 6 Institutions — — — — 3,705 — 864 — — 329 1 — — 1 — — 4,900 1,279 7 Corporates — — — — 1,633 — 1,388 — — 19,989 393 — — 2 — — 23,405 18,326 8 Retail — — — — — — — — 21,199 — — — — — — — 21,199 21,199 9 Secured by mortgages on
immovable property — — — — — 8,814 — — 31 491 1 — — — — — 9,337 9,337
10 Exposures in default — — — — — — — — — 975 404 — — — — — 1,379 1,379 11 Items associated with particularly
high risk — — — — — — — — — — 1,431 — — — — — 1,431 1,431
12 Covered Bonds — — — 1,848 — — 38 — — — — — — — — — 1,886 — 13 Claims on institutions and
corporate with a short-term credit assessment
— — — — — — — — — — — — — — — — — —
14 Claims in the form of CIU — — — — — — — — — — — — — — — — — — 15 Equity exposures — — — — — — — — — 27 — 696 — — — — 723 723 16 Other items 1,410 — — — 508 — — — — 2,906 — — — — — — 4,824 4,824 17 Total 256,558 — — 1,848 15,103 8,814 2,290 — 21,230 24,766 2,230 696 — 3 — — 333,568 67,854
Standardised Credit Risk Exposure Post-CCF and CRM increased £24.8bn to £358.4bn primarily due to an increase in the Group liquidity pool within the 0% risk weight category.
Analysis of Credit Risk
Barclays PLC 41
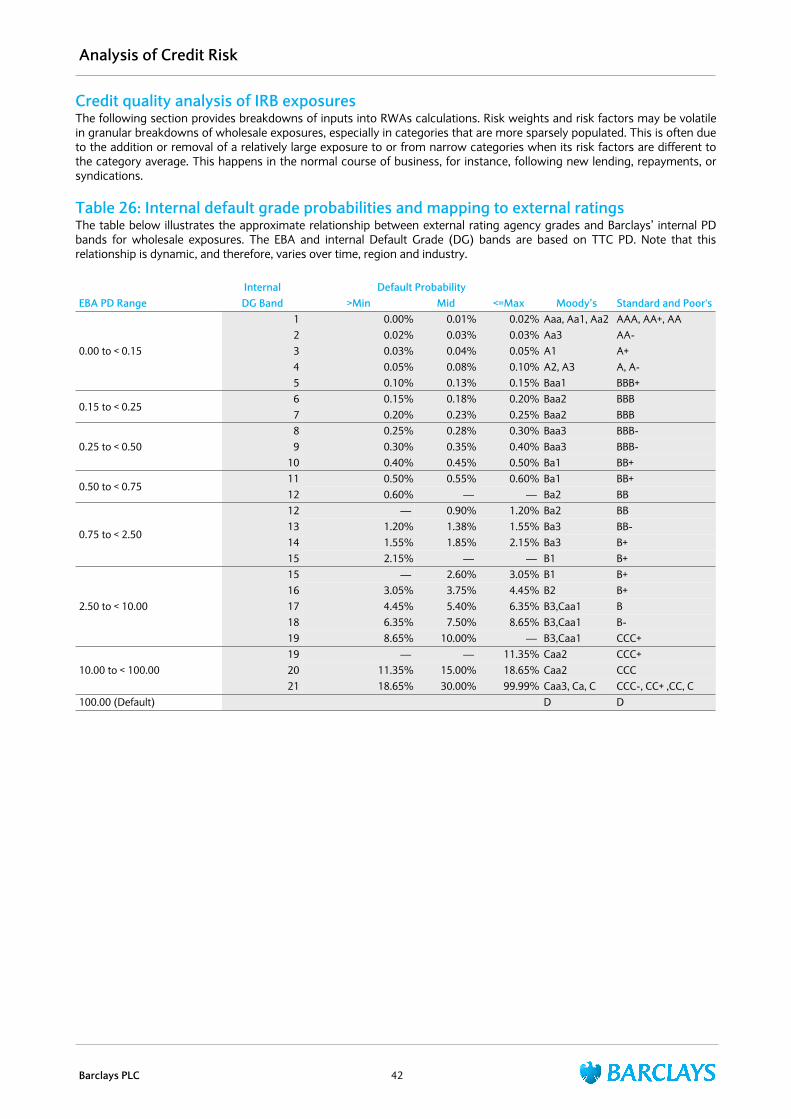
Credit quality analysis of IRB exposuresThe following section provides breakdowns of inputs into RWAs calculations. Risk weights and risk factors may be volatile in granular breakdowns of wholesale exposures, especially in categories that are more sparsely populated. This is often due to the addition or removal of a relatively large exposure to or from narrow categories when its risk factors are different to the category average. This happens in the normal course of business, for instance, following new lending, repayments, or syndications.
Table 26: Internal default grade probabilities and mapping to external ratingsThe table below illustrates the approximate relationship between external rating agency grades and Barclays’ internal PD bands for wholesale exposures. The EBA and internal Default Grade (DG) bands are based on TTC PD. Note that this relationship is dynamic, and therefore, varies over time, region and industry.
EBA PD RangeInternal Default Probability
Moody’s Standard and Poor'sDG Band >Min Mid <=Max
0.00 to < 0.15
1 0.00 % 0.01 % 0.02 % Aaa, Aa1, Aa2 AAA, AA+, AA2 0.02 % 0.03 % 0.03 % Aa3 AA-3 0.03 % 0.04 % 0.05 % A1 A+4 0.05 % 0.08 % 0.10 % A2, A3 A, A-5 0.10 % 0.13 % 0.15 % Baa1 BBB+
0.15 to < 0.256 0.15 % 0.18 % 0.20 % Baa2 BBB7 0.20 % 0.23 % 0.25 % Baa2 BBB
0.25 to < 0.508 0.25 % 0.28 % 0.30 % Baa3 BBB-9 0.30 % 0.35 % 0.40 % Baa3 BBB-
10 0.40 % 0.45 % 0.50 % Ba1 BB+
0.50 to < 0.7511 0.50 % 0.55 % 0.60 % Ba1 BB+12 0.60 % — — Ba2 BB
0.75 to < 2.50
12 — 0.90 % 1.20 % Ba2 BB13 1.20 % 1.38 % 1.55 % Ba3 BB-14 1.55 % 1.85 % 2.15 % Ba3 B+15 2.15 % — — B1 B+
2.50 to < 10.00
15 — 2.60 % 3.05 % B1 B+16 3.05 % 3.75 % 4.45 % B2 B+17 4.45 % 5.40 % 6.35 % B3,Caa1 B18 6.35 % 7.50 % 8.65 % B3,Caa1 B-19 8.65 % 10.00 % — B3,Caa1 CCC+
10.00 to < 100.0019 — — 11.35 % Caa2 CCC+20 11.35 % 15.00 % 18.65 % Caa2 CCC21 18.65 % 30.00 % 99.99 % Caa3, Ca, C CCC-, CC+ ,CC, C
100.00 (Default) D D
Analysis of Credit Risk
Barclays PLC 42
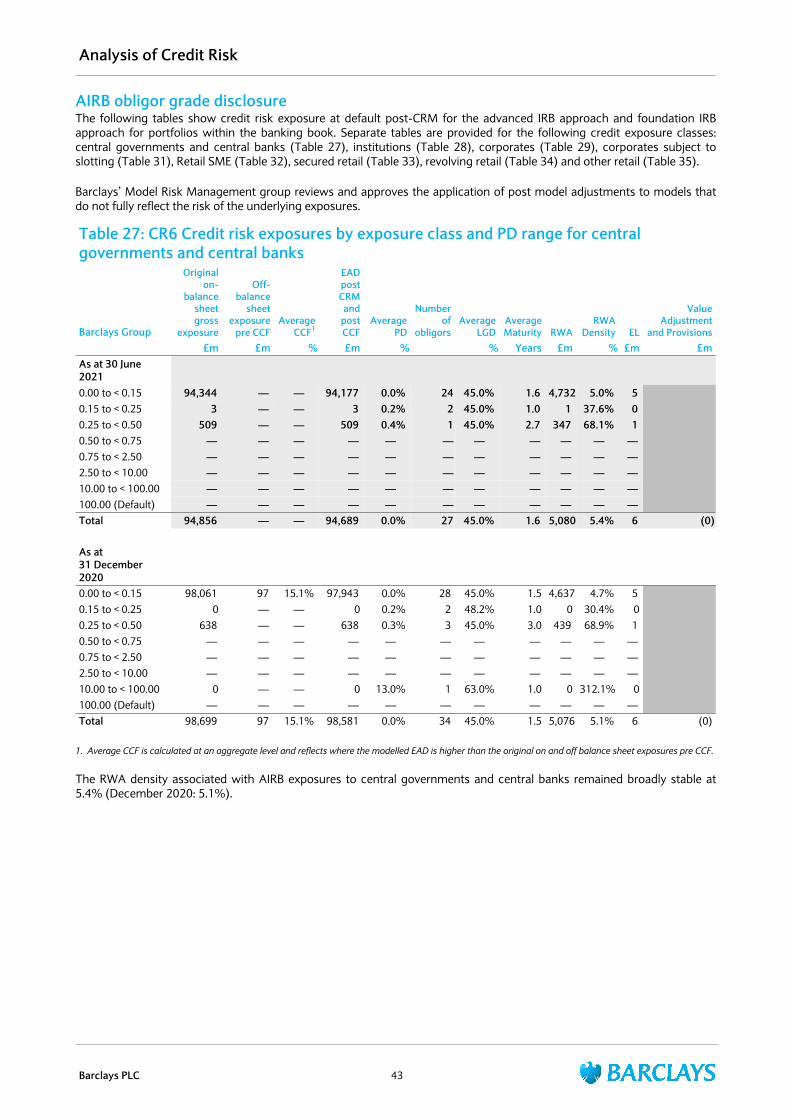
AIRB obligor grade disclosureThe following tables show credit risk exposure at default post-CRM for the advanced IRB approach and foundation IRB approach for portfolios within the banking book. Separate tables are provided for the following credit exposure classes: central governments and central banks (Table 27), institutions (Table 28), corporates (Table 29), corporates subject to slotting (Table 31), Retail SME (Table 32), secured retail (Table 33), revolving retail (Table 34) and other retail (Table 35).
Barclays’ Model Risk Management group reviews and approves the application of post model adjustments to models that do not fully reflect the risk of the underlying exposures.
Table 27: CR6 Credit risk exposures by exposure class and PD range for central governments and central banks
Barclays Group
Originalon-
balancesheet gross
exposure
Off-balance
sheetexposure
pre CCFAverage
CCF1
EAD post CRM and
post CCF
Average PD
Number of
obligorsAverage
LGDAverage Maturity RWA
RWA Density EL
Value Adjustment
and Provisions£m £m % £m % % Years £m % £m £m
As at 30 June 20210.00 to < 0.15 94,344 — — 94,177 0.0% 24 45.0% 1.6 4,732 5.0% 5 0.15 to < 0.25 3 — — 3 0.2% 2 45.0% 1.0 1 37.6% 0 0.25 to < 0.50 509 — — 509 0.4% 1 45.0% 2.7 347 68.1% 1 0.50 to < 0.75 — — — — — — — — — — — 0.75 to < 2.50 — — — — — — — — — — — 2.50 to < 10.00 — — — — — — — — — — — 10.00 to < 100.00 — — — — — — — — — — — 100.00 (Default) — — — — — — — — — — — Total 94,856 — — 94,689 0.0% 27 45.0% 1.6 5,080 5.4% 6 (0)
As at 31 December 20200.00 to < 0.15 98,061 97 15.1% 97,943 0.0% 28 45.0% 1.5 4,637 4.7% 5 0.15 to < 0.25 0 — — 0 0.2% 2 48.2% 1.0 0 30.4% 00.25 to < 0.50 638 — — 638 0.3% 3 45.0% 3.0 439 68.9% 1 0.50 to < 0.75 — — — — — — — — — — — 0.75 to < 2.50 — — — — — — — — — — — 2.50 to < 10.00 — — — — — — — — — — — 10.00 to < 100.00 0 — — 0 13.0% 1 63.0% 1.0 0 312.1% 0100.00 (Default) — — — — — — — — — — — Total 98,699 97 15.1% 98,581 0.0% 34 45.0% 1.5 5,076 5.1% 6 (0)
1. Average CCF is calculated at an aggregate level and reflects where the modelled EAD is higher than the original on and off balance sheet exposures pre CCF.
The RWA density associated with AIRB exposures to central governments and central banks remained broadly stable at 5.4% (December 2020: 5.1%).
Analysis of Credit Risk
Barclays PLC 43
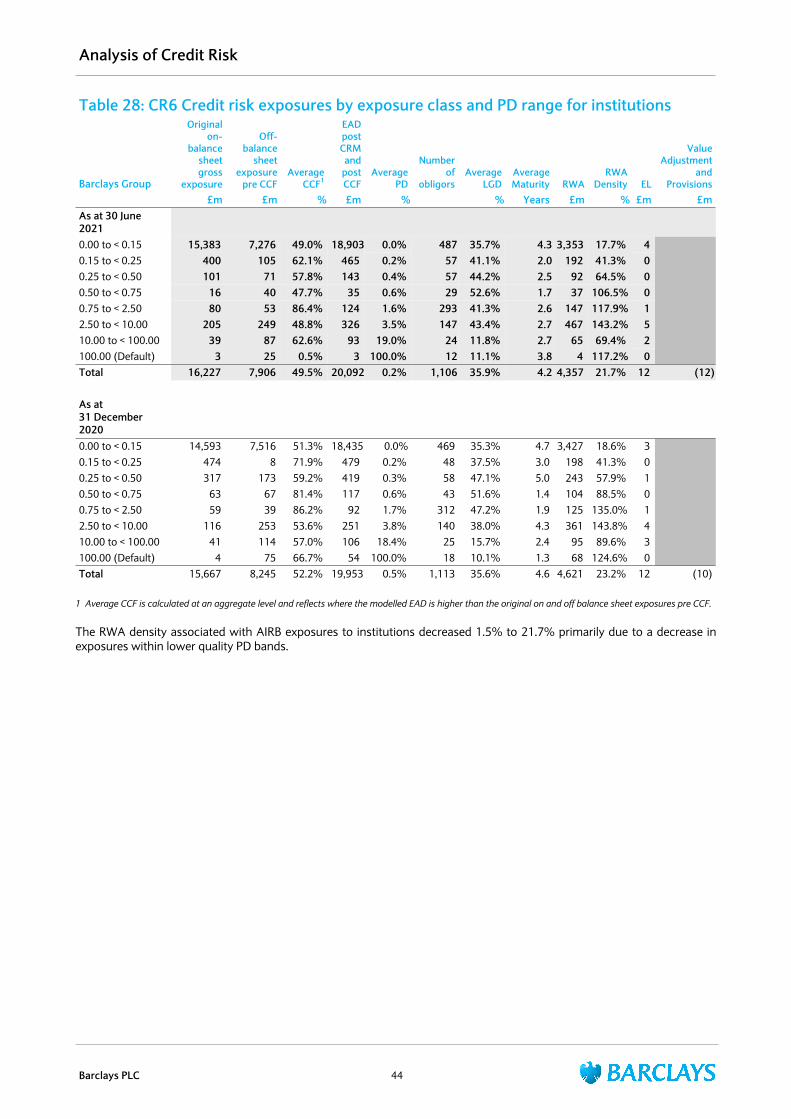
Table 28: CR6 Credit risk exposures by exposure class and PD range for institutions
Barclays Group
Originalon-
balancesheet gross
exposure
Off-balance
sheetexposure
pre CCFAverage
CCF1
EAD post CRM and
post CCF
Average PD
Number of
obligorsAverage
LGDAverage Maturity RWA
RWA Density EL
Value Adjustment
and Provisions
£m £m % £m % % Years £m % £m £mAs at 30 June 20210.00 to < 0.15 15,383 7,276 49.0% 18,903 0.0% 487 35.7% 4.3 3,353 17.7% 4 0.15 to < 0.25 400 105 62.1% 465 0.2% 57 41.1% 2.0 192 41.3% 0 0.25 to < 0.50 101 71 57.8% 143 0.4% 57 44.2% 2.5 92 64.5% 0 0.50 to < 0.75 16 40 47.7% 35 0.6% 29 52.6% 1.7 37 106.5% 0 0.75 to < 2.50 80 53 86.4% 124 1.6% 293 41.3% 2.6 147 117.9% 1 2.50 to < 10.00 205 249 48.8% 326 3.5% 147 43.4% 2.7 467 143.2% 5 10.00 to < 100.00 39 87 62.6% 93 19.0% 24 11.8% 2.7 65 69.4% 2 100.00 (Default) 3 25 0.5% 3 100.0% 12 11.1% 3.8 4 117.2% 0 Total 16,227 7,906 49.5% 20,092 0.2% 1,106 35.9% 4.2 4,357 21.7% 12 (12)
As at 31 December 20200.00 to < 0.15 14,593 7,516 51.3% 18,435 0.0% 469 35.3% 4.7 3,427 18.6% 3 0.15 to < 0.25 474 8 71.9% 479 0.2% 48 37.5% 3.0 198 41.3% 0 0.25 to < 0.50 317 173 59.2% 419 0.3% 58 47.1% 5.0 243 57.9% 1 0.50 to < 0.75 63 67 81.4% 117 0.6% 43 51.6% 1.4 104 88.5% 0 0.75 to < 2.50 59 39 86.2% 92 1.7% 312 47.2% 1.9 125 135.0% 1 2.50 to < 10.00 116 253 53.6% 251 3.8% 140 38.0% 4.3 361 143.8% 4 10.00 to < 100.00 41 114 57.0% 106 18.4% 25 15.7% 2.4 95 89.6% 3 100.00 (Default) 4 75 66.7% 54 100.0% 18 10.1% 1.3 68 124.6% 0 Total 15,667 8,245 52.2% 19,953 0.5% 1,113 35.6% 4.6 4,621 23.2% 12 (10)
1 Average CCF is calculated at an aggregate level and reflects where the modelled EAD is higher than the original on and off balance sheet exposures pre CCF.
The RWA density associated with AIRB exposures to institutions decreased 1.5% to 21.7% primarily due to a decrease in exposures within lower quality PD bands.
Analysis of Credit Risk
Barclays PLC 44
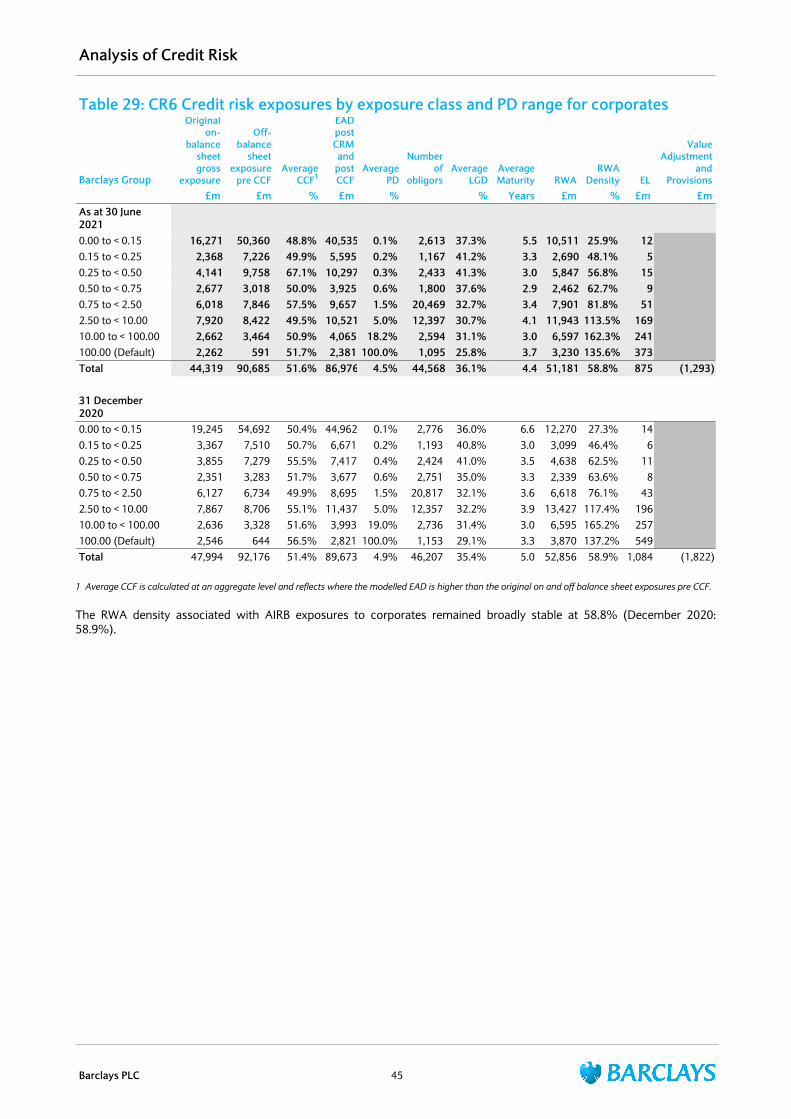
Table 29: CR6 Credit risk exposures by exposure class and PD range for corporates
Barclays Group
Originalon-
balancesheet gross
exposure
Off-balance
sheetexposure
pre CCFAverage
CCF1
EAD post CRM and
post CCF
Average PD
Number of
obligorsAverage
LGDAverage Maturity RWA
RWA Density EL
Value Adjustment
and Provisions
£m £m % £m % % Years £m % £m £mAs at 30 June 20210.00 to < 0.15 16,271 50,360 48.8% 40,535 0.1% 2,613 37.3% 5.5 10,511 25.9% 12 0.15 to < 0.25 2,368 7,226 49.9% 5,595 0.2% 1,167 41.2% 3.3 2,690 48.1% 5 0.25 to < 0.50 4,141 9,758 67.1% 10,297 0.3% 2,433 41.3% 3.0 5,847 56.8% 15 0.50 to < 0.75 2,677 3,018 50.0% 3,925 0.6% 1,800 37.6% 2.9 2,462 62.7% 9 0.75 to < 2.50 6,018 7,846 57.5% 9,657 1.5% 20,469 32.7% 3.4 7,901 81.8% 51 2.50 to < 10.00 7,920 8,422 49.5% 10,521 5.0% 12,397 30.7% 4.1 11,943 113.5% 169 10.00 to < 100.00 2,662 3,464 50.9% 4,065 18.2% 2,594 31.1% 3.0 6,597 162.3% 241 100.00 (Default) 2,262 591 51.7% 2,381 100.0% 1,095 25.8% 3.7 3,230 135.6% 373 Total 44,319 90,685 51.6% 86,976 4.5% 44,568 36.1% 4.4 51,181 58.8% 875 (1,293)
As at 31 December 20200.00 to < 0.15 19,245 54,692 50.4% 44,962 0.1% 2,776 36.0% 6.6 12,270 27.3% 14 0.15 to < 0.25 3,367 7,510 50.7% 6,671 0.2% 1,193 40.8% 3.0 3,099 46.4% 6 0.25 to < 0.50 3,855 7,279 55.5% 7,417 0.4% 2,424 41.0% 3.5 4,638 62.5% 11 0.50 to < 0.75 2,351 3,283 51.7% 3,677 0.6% 2,751 35.0% 3.3 2,339 63.6% 8 0.75 to < 2.50 6,127 6,734 49.9% 8,695 1.5% 20,817 32.1% 3.6 6,618 76.1% 43 2.50 to < 10.00 7,867 8,706 55.1% 11,437 5.0% 12,357 32.2% 3.9 13,427 117.4% 196 10.00 to < 100.00 2,636 3,328 51.6% 3,993 19.0% 2,736 31.4% 3.0 6,595 165.2% 257 100.00 (Default) 2,546 644 56.5% 2,821 100.0% 1,153 29.1% 3.3 3,870 137.2% 549 Total 47,994 92,176 51.4% 89,673 4.9% 46,207 35.4% 5.0 52,856 58.9% 1,084 (1,822)
1 Average CCF is calculated at an aggregate level and reflects where the modelled EAD is higher than the original on and off balance sheet exposures pre CCF.
The RWA density associated with AIRB exposures to corporates remained broadly stable at 58.8% (December 2020: 58.9%).
Analysis of Credit Risk
Barclays PLC 45

Table 30: CR6 Credit risk exposures by exposure class and PD range for corporate of which: SMEs
Barclays Group
Originalon-
balancesheet gross
exposure
Off-balance
sheetexposure
pre CCFAverage
CCF
EAD post CRM and
post CCF
Average PD
Number of
obligorsAverage
LGDAverage Maturity RWA
RWA Density EL
Value Adjustment
and Provisions
£m £m % £m % % Years £m % £m £mAs at 30 June 20210.00 to < 0.15 1,828 870 65.0% 2,373 0.1% 851 25.4% 9.9 596 25.1% 1 0.15 to < 0.25 237 58 74.2% 268 0.2% 607 41.3% 8.9 115 42.8% 0 0.25 to < 0.50 931 428 54.8% 1,056 0.4% 1,612 35.8% 6.0 435 41.2% 2 0.50 to < 0.75 1,001 262 50.1% 1,005 0.6% 1,336 30.5% 4.4 427 42.5% 2 0.75 to < 2.50 3,539 757 48.3% 3,497 1.5% 15,272 30.4% 4.9 2,189 62.6% 19 2.50 to < 10.00 2,936 630 52.9% 2,879 4.6% 7,827 30.4% 4.7 2,293 79.6% 48 10.00 to < 100.00 1,021 154 52.3% 930 22.4% 1,686 29.8% 4.3 1,034 111.3% 75 100.00 (Default) 1,648 199 50.4% 1,627 100.0% 763 16.4% 4.5 2,268 139.4% 118 Total 13,141 3,358 55.0% 13,635 14.9% 29,954 28.4% 5.8 9,357 68.6% 265 (340)
As at 31 December 2020
0.00 to < 0.15 2,286 872 74.9% 2,810 0.1% 965 22.9% 11.1 698 24.9% 1 0.15 to < 0.25 304 98 59.7% 354 0.2% 590 38.0% 9.9 149 42.1% 00.25 to < 0.50 1,027 318 57.2% 1,097 0.4% 1,587 36.6% 5.4 497 45.3% 2 0.50 to < 0.75 1,046 299 53.4% 1,081 0.6% 1,992 34.5% 4.7 564 52.2% 3 0.75 to < 2.50 3,638 938 46.6% 3,634 1.5% 15,608 31.7% 4.9 2,306 63.5% 20 2.50 to < 10.00 3,313 742 46.1% 3,244 4.7% 7,987 31.2% 4.7 2,620 80.7% 55 10.00 to < 100.00 902 144 48.9% 868 22.1% 1,752 33.9% 4.2 1,107 127.5% 75 100.00 (Default) 1,528 227 50.3% 1,584 100.0% 821 16.3% 4.5 2,234 141.0% 116 Total 14,044 3,638 55.7% 14,672 13.6% 31,302 29.1% 6.1 10,175 69.3% 272 (359)
1 Average CCF is calculated at an aggregate level and reflects where the modelled EAD is higher than the original on and off balance sheet exposures pre CCF.
The RWA density associated with AIRB exposures to corporates of which: SME remained broadly stable at 68.6% (December 2020: 69.3%).
Analysis of Credit Risk
Barclays PLC 46
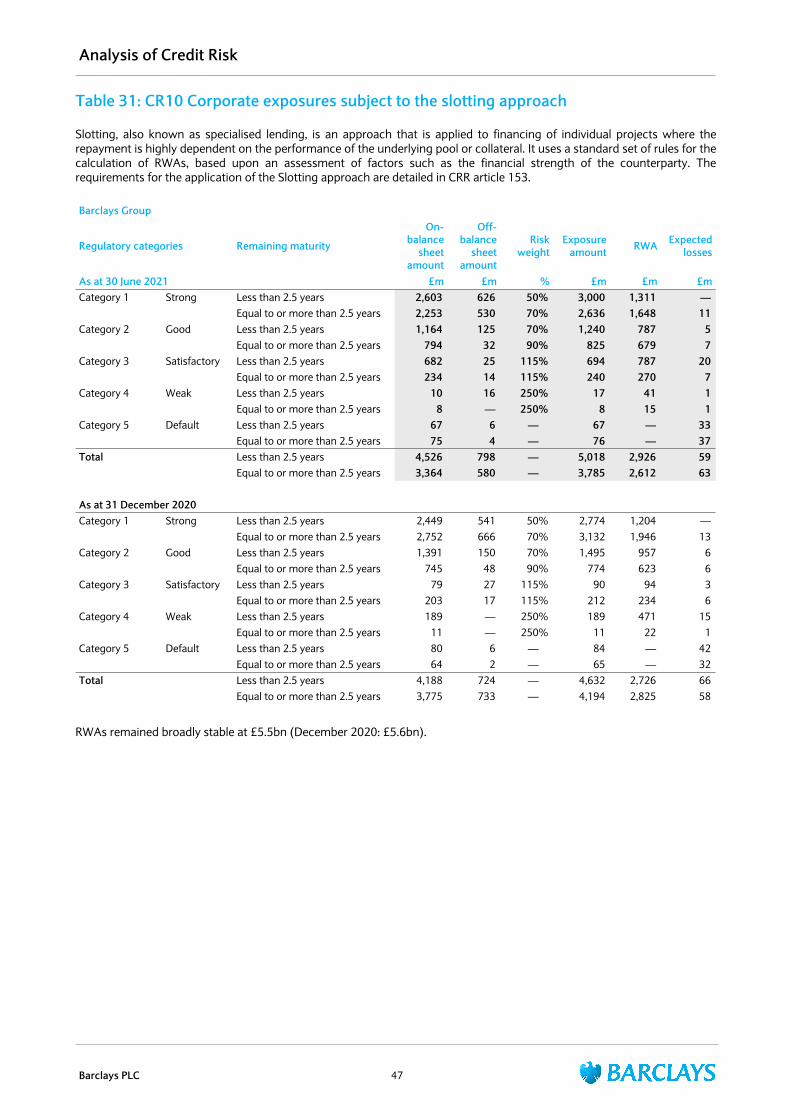
Table 31: CR10 Corporate exposures subject to the slotting approach
Slotting, also known as specialised lending, is an approach that is applied to financing of individual projects where the repayment is highly dependent on the performance of the underlying pool or collateral. It uses a standard set of rules for the calculation of RWAs, based upon an assessment of factors such as the financial strength of the counterparty. The requirements for the application of the Slotting approach are detailed in CRR article 153.
Barclays Group
Regulatory categories Remaining maturity
On-balance
sheet amount
Off-balance
sheet amount
Risk weight
Exposure amount RWA Expected
losses
As at 30 June 2021 £m £m % £m £m £mCategory 1 Strong Less than 2.5 years 2,603 626 50% 3,000 1,311 —
Equal to or more than 2.5 years 2,253 530 70% 2,636 1,648 11 Category 2 Good Less than 2.5 years 1,164 125 70% 1,240 787 5
Equal to or more than 2.5 years 794 32 90% 825 679 7 Category 3 Satisfactory Less than 2.5 years 682 25 115% 694 787 20
Equal to or more than 2.5 years 234 14 115% 240 270 7 Category 4 Weak Less than 2.5 years 10 16 250% 17 41 1
Equal to or more than 2.5 years 8 — 250% 8 15 1 Category 5 Default Less than 2.5 years 67 6 — 67 — 33
Equal to or more than 2.5 years 75 4 — 76 — 37 Total Less than 2.5 years 4,526 798 — 5,018 2,926 59
Equal to or more than 2.5 years 3,364 580 — 3,785 2,612 63
As at 31 December 2020Category 1 Strong Less than 2.5 years 2,449 541 50% 2,774 1,204 —
Equal to or more than 2.5 years 2,752 666 70% 3,132 1,946 13 Category 2 Good Less than 2.5 years 1,391 150 70% 1,495 957 6
Equal to or more than 2.5 years 745 48 90% 774 623 6 Category 3 Satisfactory Less than 2.5 years 79 27 115% 90 94 3
Equal to or more than 2.5 years 203 17 115% 212 234 6 Category 4 Weak Less than 2.5 years 189 — 250% 189 471 15
Equal to or more than 2.5 years 11 — 250% 11 22 1 Category 5 Default Less than 2.5 years 80 6 — 84 — 42
Equal to or more than 2.5 years 64 2 — 65 — 32 Total Less than 2.5 years 4,188 724 — 4,632 2,726 66
Equal to or more than 2.5 years 3,775 733 — 4,194 2,825 58
RWAs remained broadly stable at £5.5bn (December 2020: £5.6bn).
Analysis of Credit Risk
Barclays PLC 47
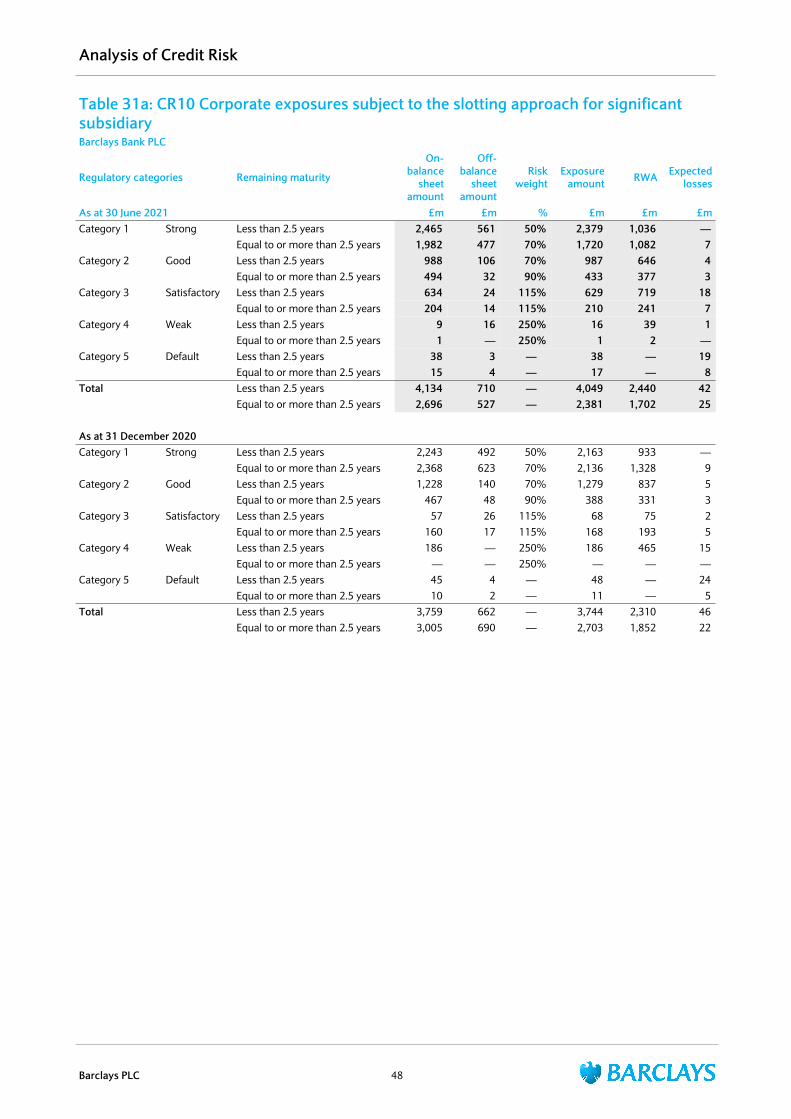
Table 31a: CR10 Corporate exposures subject to the slotting approach for significant subsidiaryBarclays Bank PLC
Regulatory categories Remaining maturity
On-balance
sheet amount
Off-balance
sheet amount
Risk weight
Exposure amount RWA Expected
losses
As at 30 June 2021 £m £m % £m £m £mCategory 1 Strong Less than 2.5 years 2,465 561 50% 2,379 1,036 —
Equal to or more than 2.5 years 1,982 477 70% 1,720 1,082 7 Category 2 Good Less than 2.5 years 988 106 70% 987 646 4
Equal to or more than 2.5 years 494 32 90% 433 377 3 Category 3 Satisfactory Less than 2.5 years 634 24 115% 629 719 18
Equal to or more than 2.5 years 204 14 115% 210 241 7 Category 4 Weak Less than 2.5 years 9 16 250% 16 39 1
Equal to or more than 2.5 years 1 — 250% 1 2 — Category 5 Default Less than 2.5 years 38 3 — 38 — 19
Equal to or more than 2.5 years 15 4 — 17 — 8 Total Less than 2.5 years 4,134 710 — 4,049 2,440 42
Equal to or more than 2.5 years 2,696 527 — 2,381 1,702 25
As at 31 December 2020Category 1 Strong Less than 2.5 years 2,243 492 50% 2,163 933 —
Equal to or more than 2.5 years 2,368 623 70% 2,136 1,328 9 Category 2 Good Less than 2.5 years 1,228 140 70% 1,279 837 5
Equal to or more than 2.5 years 467 48 90% 388 331 3 Category 3 Satisfactory Less than 2.5 years 57 26 115% 68 75 2
Equal to or more than 2.5 years 160 17 115% 168 193 5 Category 4 Weak Less than 2.5 years 186 — 250% 186 465 15
Equal to or more than 2.5 years — — 250% — — — Category 5 Default Less than 2.5 years 45 4 — 48 — 24
Equal to or more than 2.5 years 10 2 — 11 — 5 Total Less than 2.5 years 3,759 662 — 3,744 2,310 46
Equal to or more than 2.5 years 3,005 690 — 2,703 1,852 22
Analysis of Credit Risk
Barclays PLC 48
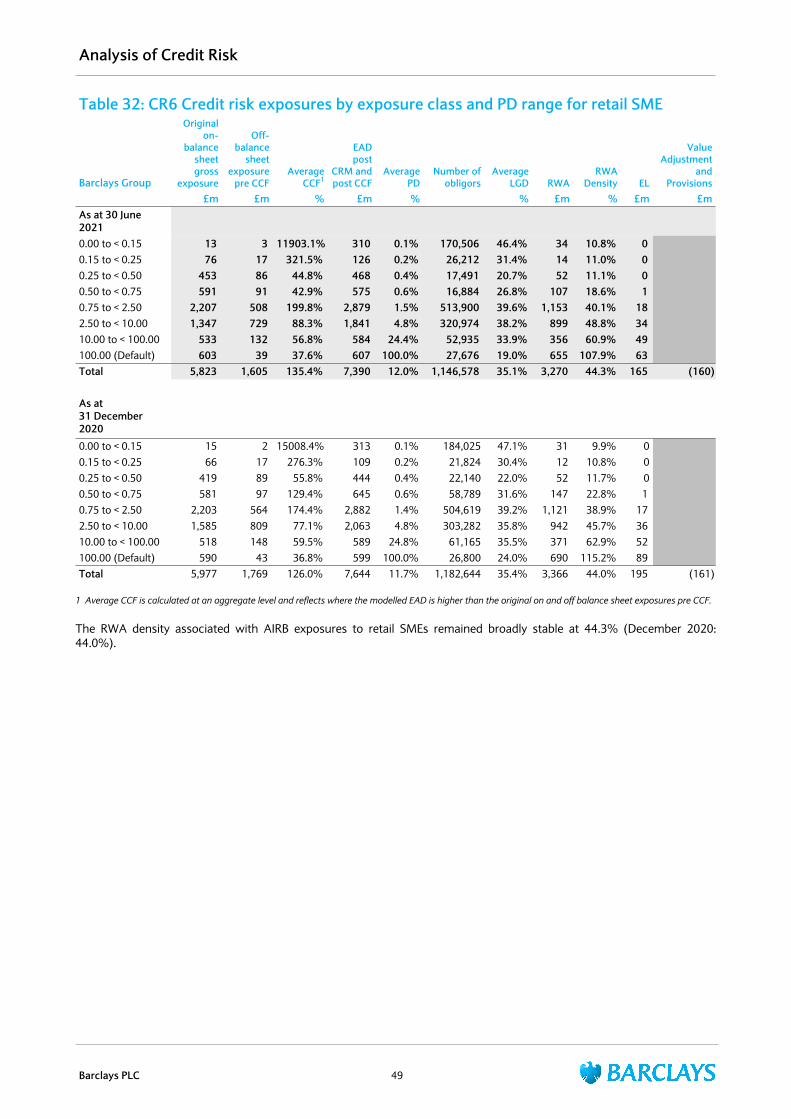
Table 32: CR6 Credit risk exposures by exposure class and PD range for retail SME
Barclays Group
Originalon-
balancesheet gross
exposure
Off-balance
sheetexposure
pre CCFAverage
CCF1
EAD post
CRM and post CCF
Average PD
Number of obligors
Average LGD RWA
RWA Density EL
Value Adjustment
and Provisions
£m £m % £m % % £m % £m £mAs at 30 June 20210.00 to < 0.15 13 3 11903.1% 310 0.1% 170,506 46.4% 34 10.8% 0 0.15 to < 0.25 76 17 321.5% 126 0.2% 26,212 31.4% 14 11.0% 0 0.25 to < 0.50 453 86 44.8% 468 0.4% 17,491 20.7% 52 11.1% 0 0.50 to < 0.75 591 91 42.9% 575 0.6% 16,884 26.8% 107 18.6% 1 0.75 to < 2.50 2,207 508 199.8% 2,879 1.5% 513,900 39.6% 1,153 40.1% 18 2.50 to < 10.00 1,347 729 88.3% 1,841 4.8% 320,974 38.2% 899 48.8% 34 10.00 to < 100.00 533 132 56.8% 584 24.4% 52,935 33.9% 356 60.9% 49 100.00 (Default) 603 39 37.6% 607 100.0% 27,676 19.0% 655 107.9% 63 Total 5,823 1,605 135.4% 7,390 12.0% 1,146,578 35.1% 3,270 44.3% 165 (160)
As at 31 December 2020
0.00 to < 0.15 15 2 15008.4% 313 0.1% 184,025 47.1% 31 9.9% 00.15 to < 0.25 66 17 276.3% 109 0.2% 21,824 30.4% 12 10.8% 00.25 to < 0.50 419 89 55.8% 444 0.4% 22,140 22.0% 52 11.7% 00.50 to < 0.75 581 97 129.4% 645 0.6% 58,789 31.6% 147 22.8% 1 0.75 to < 2.50 2,203 564 174.4% 2,882 1.4% 504,619 39.2% 1,121 38.9% 17 2.50 to < 10.00 1,585 809 77.1% 2,063 4.8% 303,282 35.8% 942 45.7% 36 10.00 to < 100.00 518 148 59.5% 589 24.8% 61,165 35.5% 371 62.9% 52 100.00 (Default) 590 43 36.8% 599 100.0% 26,800 24.0% 690 115.2% 89 Total 5,977 1,769 126.0% 7,644 11.7% 1,182,644 35.4% 3,366 44.0% 195 (161)
1 Average CCF is calculated at an aggregate level and reflects where the modelled EAD is higher than the original on and off balance sheet exposures pre CCF.
The RWA density associated with AIRB exposures to retail SMEs remained broadly stable at 44.3% (December 2020: 44.0%).
Analysis of Credit Risk
Barclays PLC 49

Table 33: CR6 Credit risk exposures by exposure class and PD range for secured retail
Barclays Group
Originalon-
balancesheet gross
exposure
Off-balance
sheetexposure
pre CCFAverage
CCF1
EAD post CRM
and post CCF
Average PD
Number of obligors
Average LGD RWA
RWA Density EL
Value Adjustment
and Provisions
£m £m % £m % % £m % £m £mAs at 30 June 20210.00 to < 0.15 21,268 1,866 98.5% 22,778 0.1% 109,692 12.9% 1,641 7.2% 10 0.15 to < 0.25 10,859 1,438 96.2% 11,825 0.2% 86,317 13.2% 937 7.9% 7 0.25 to < 0.50 29,751 2,622 97.1% 31,422 0.4% 185,470 10.3% 2,172 6.9% 13 0.50 to < 0.75 42,700 2,183 98.2% 44,058 0.6% 271,494 10.5% 4,403 10.0% 29 0.75 to < 2.50 38,785 2,369 98.9% 40,700 1.3% 246,880 13.9% 8,663 21.3% 74 2.50 to < 10.00 8,690 336 99.7% 9,003 4.5% 53,703 14.1% 3,985 44.3% 58 10.00 to < 100.00 4,428 132 99.7% 4,545 28.2% 28,894 10.0% 2,346 51.6% 148 100.00 (Default) 1,817 3 100.0% 1,823 100.0% 17,179 17.6% 1,287 70.6% 369 Total 158,298 10,949 98.2% 166,154 2.7% 999,629 12.1% 25,434 15.3% 708 (431)
As at 31 December 2020
0.00 to < 0.15 22,425 4,131 94.4% 25,072 0.1% 126,979 13.4% 1,811 7.2% 8 0.15 to < 0.25 14,844 2,111 94.2% 15,973 0.2% 121,670 10.6% 1,042 6.5% 6 0.25 to < 0.50 35,150 3,096 96.5% 36,903 0.4% 227,513 9.7% 2,511 6.8% 15 0.50 to < 0.75 34,852 1,059 96.7% 35,876 0.6% 224,280 11.3% 3,843 10.7% 25 0.75 to < 2.50 31,012 1,569 98.7% 32,151 1.2% 200,759 14.2% 6,958 21.6% 60 2.50 to < 10.00 7,274 155 100.0% 7,431 4.6% 43,878 13.5% 3,206 43.1% 48 10.00 to < 100.00 4,688 127 99.8% 4,805 30.3% 30,231 10.1% 2,483 51.7% 187 100.00 (Default) 1,732 2 100.0% 1,738 100.0% 16,035 18.6% 1,251 72.0% 373 Total 151,977 12,250 96.7% 159,949 2.7% 991,345 11.9% 23,105 14.4% 722 (481)
1 Average CCF is calculated at an aggregate level and reflects where the modelled EAD is higher than the original on and off balance sheet exposures pre CCF.
The RWA density associated with AIRB exposures to secured retail increased 0.9% to 15.3% primarily due to a reduction in credit quality.
Analysis of Credit Risk
Barclays PLC 50
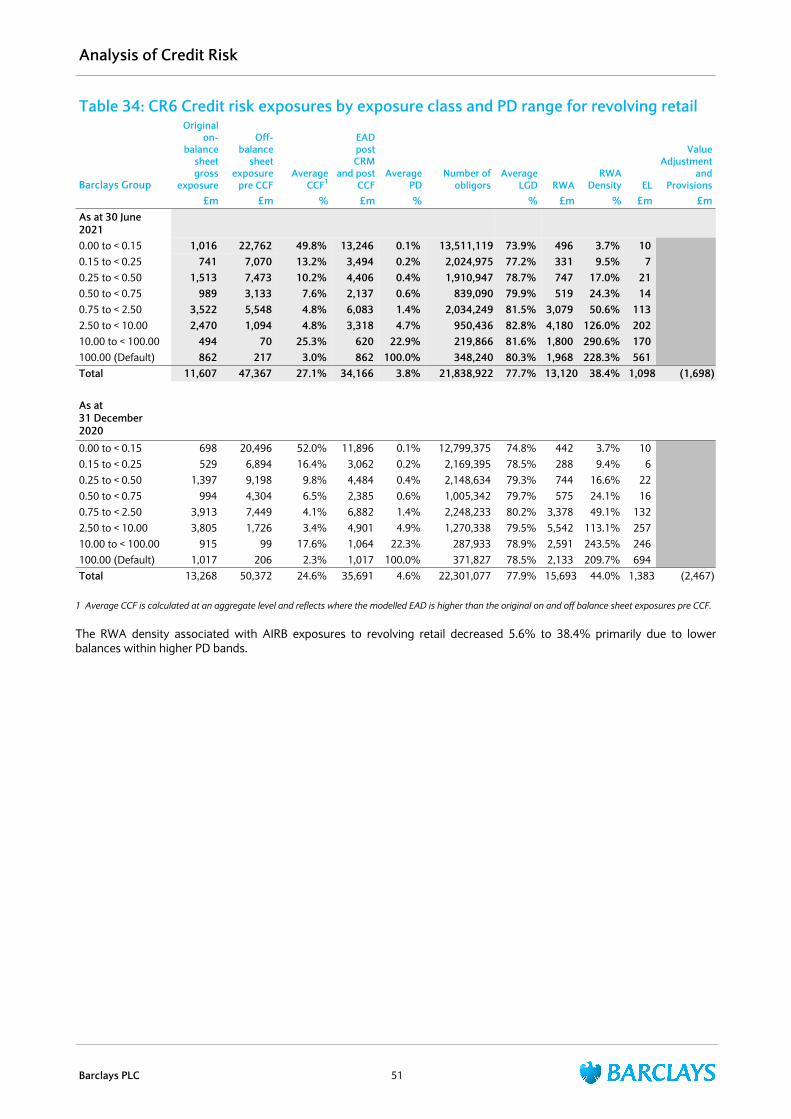
Table 34: CR6 Credit risk exposures by exposure class and PD range for revolving retail
Barclays Group
Originalon-
balancesheet gross
exposure
Off-balance
sheetexposure
pre CCFAverage
CCF1
EAD post CRM
and post CCF
Average PD
Number of obligors
Average LGD RWA
RWA Density EL
Value Adjustment
and Provisions
£m £m % £m % % £m % £m £mAs at 30 June 20210.00 to < 0.15 1,016 22,762 49.8% 13,246 0.1% 13,511,119 73.9% 496 3.7% 10 0.15 to < 0.25 741 7,070 13.2% 3,494 0.2% 2,024,975 77.2% 331 9.5% 7 0.25 to < 0.50 1,513 7,473 10.2% 4,406 0.4% 1,910,947 78.7% 747 17.0% 21 0.50 to < 0.75 989 3,133 7.6% 2,137 0.6% 839,090 79.9% 519 24.3% 14 0.75 to < 2.50 3,522 5,548 4.8% 6,083 1.4% 2,034,249 81.5% 3,079 50.6% 113 2.50 to < 10.00 2,470 1,094 4.8% 3,318 4.7% 950,436 82.8% 4,180 126.0% 202 10.00 to < 100.00 494 70 25.3% 620 22.9% 219,866 81.6% 1,800 290.6% 170 100.00 (Default) 862 217 3.0% 862 100.0% 348,240 80.3% 1,968 228.3% 561 Total 11,607 47,367 27.1% 34,166 3.8% 21,838,922 77.7% 13,120 38.4% 1,098 (1,698)
As at 31 December 2020
0.00 to < 0.15 698 20,496 52.0% 11,896 0.1% 12,799,375 74.8% 442 3.7% 10 0.15 to < 0.25 529 6,894 16.4% 3,062 0.2% 2,169,395 78.5% 288 9.4% 6 0.25 to < 0.50 1,397 9,198 9.8% 4,484 0.4% 2,148,634 79.3% 744 16.6% 22 0.50 to < 0.75 994 4,304 6.5% 2,385 0.6% 1,005,342 79.7% 575 24.1% 16 0.75 to < 2.50 3,913 7,449 4.1% 6,882 1.4% 2,248,233 80.2% 3,378 49.1% 132 2.50 to < 10.00 3,805 1,726 3.4% 4,901 4.9% 1,270,338 79.5% 5,542 113.1% 257 10.00 to < 100.00 915 99 17.6% 1,064 22.3% 287,933 78.9% 2,591 243.5% 246 100.00 (Default) 1,017 206 2.3% 1,017 100.0% 371,827 78.5% 2,133 209.7% 694 Total 13,268 50,372 24.6% 35,691 4.6% 22,301,077 77.9% 15,693 44.0% 1,383 (2,467)
1 Average CCF is calculated at an aggregate level and reflects where the modelled EAD is higher than the original on and off balance sheet exposures pre CCF.
The RWA density associated with AIRB exposures to revolving retail decreased 5.6% to 38.4% primarily due to lower balances within higher PD bands.
Analysis of Credit Risk
Barclays PLC 51
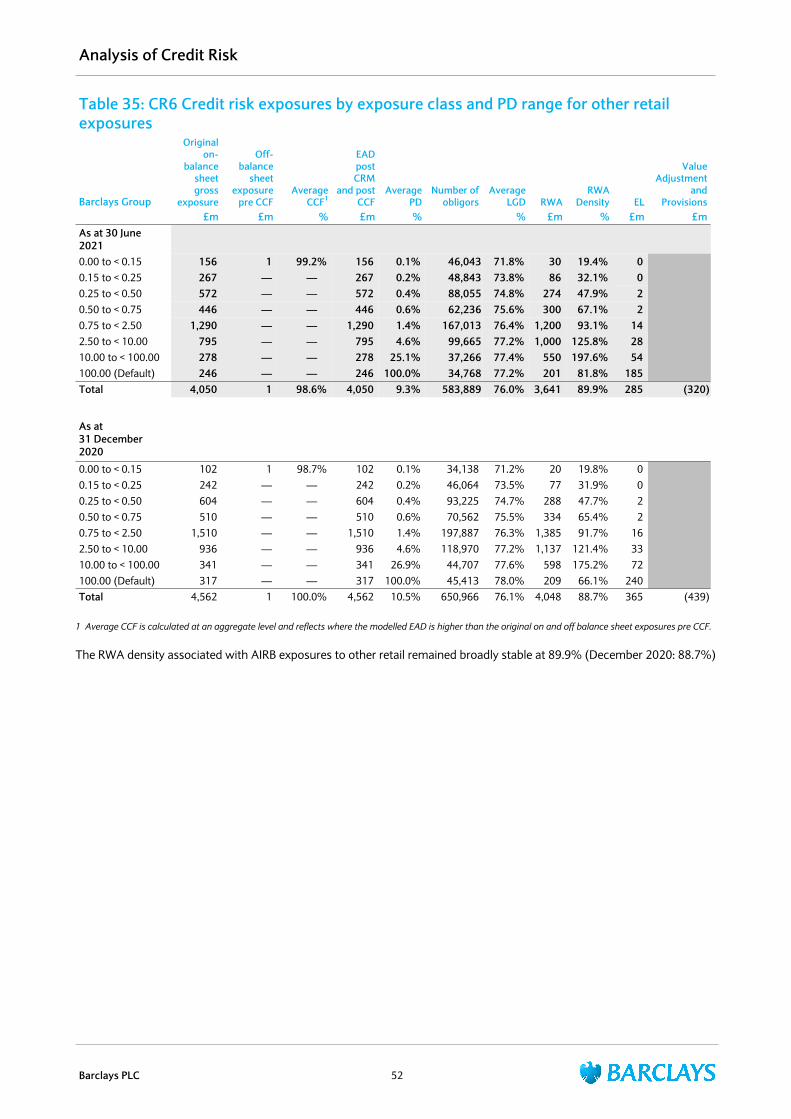
Table 35: CR6 Credit risk exposures by exposure class and PD range for other retail exposures
Barclays Group
Originalon-
balancesheet gross
exposure
Off-balance
sheetexposure
pre CCFAverage
CCF1
EAD post CRM
and post CCF
Average PD
Number of obligors
Average LGD RWA
RWA Density EL
Value Adjustment
and Provisions
£m £m % £m % % £m % £m £mAs at 30 June 20210.00 to < 0.15 156 1 99.2% 156 0.1% 46,043 71.8% 30 19.4% 0 0.15 to < 0.25 267 — — 267 0.2% 48,843 73.8% 86 32.1% 0 0.25 to < 0.50 572 — — 572 0.4% 88,055 74.8% 274 47.9% 2 0.50 to < 0.75 446 — — 446 0.6% 62,236 75.6% 300 67.1% 2 0.75 to < 2.50 1,290 — — 1,290 1.4% 167,013 76.4% 1,200 93.1% 14 2.50 to < 10.00 795 — — 795 4.6% 99,665 77.2% 1,000 125.8% 28 10.00 to < 100.00 278 — — 278 25.1% 37,266 77.4% 550 197.6% 54 100.00 (Default) 246 — — 246 100.0% 34,768 77.2% 201 81.8% 185 Total 4,050 1 98.6% 4,050 9.3% 583,889 76.0% 3,641 89.9% 285 (320)
As at 31 December 2020
0.00 to < 0.15 102 1 98.7% 102 0.1% 34,138 71.2% 20 19.8% 0 0.15 to < 0.25 242 — — 242 0.2% 46,064 73.5% 77 31.9% 0 0.25 to < 0.50 604 — — 604 0.4% 93,225 74.7% 288 47.7% 2 0.50 to < 0.75 510 — — 510 0.6% 70,562 75.5% 334 65.4% 2 0.75 to < 2.50 1,510 — — 1,510 1.4% 197,887 76.3% 1,385 91.7% 16 2.50 to < 10.00 936 — — 936 4.6% 118,970 77.2% 1,137 121.4% 33 10.00 to < 100.00 341 — — 341 26.9% 44,707 77.6% 598 175.2% 72 100.00 (Default) 317 — — 317 100.0% 45,413 78.0% 209 66.1% 240 Total 4,562 1 100.0% 4,562 10.5% 650,966 76.1% 4,048 88.7% 365 (439)
1 Average CCF is calculated at an aggregate level and reflects where the modelled EAD is higher than the original on and off balance sheet exposures pre CCF.
The RWA density associated with AIRB exposures to other retail remained broadly stable at 89.9% (December 2020: 88.7%)
Analysis of Credit Risk
Barclays PLC 52
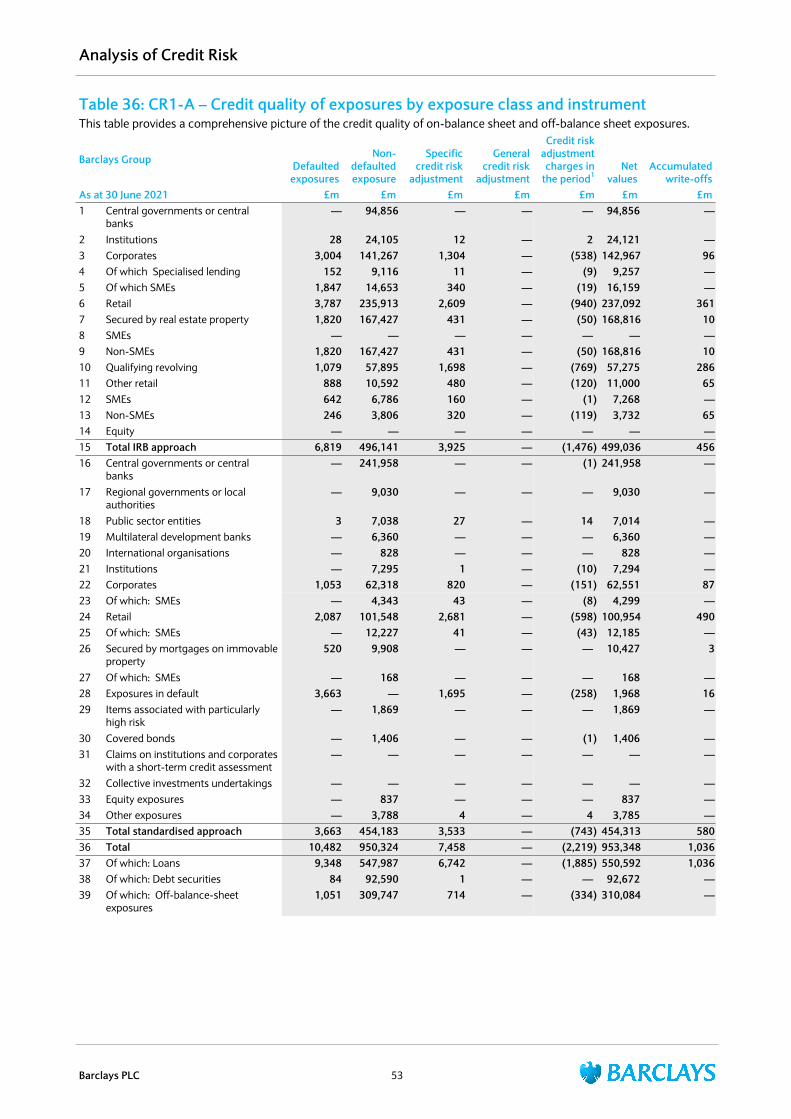
Table 36: CR1-A – Credit quality of exposures by exposure class and instrumentThis table provides a comprehensive picture of the credit quality of on-balance sheet and off-balance sheet exposures.
Barclays Group Defaulted exposures
Non-defaulted exposure
Specific credit risk
adjustment
General credit risk
adjustment
Credit risk adjustment charges in
the period1Net
valuesAccumulated
write-offsAs at 30 June 2021 £m £m £m £m £m £m £m1 Central governments or central
banks — 94,856 — — — 94,856 —
2 Institutions 28 24,105 12 — 2 24,121 — 3 Corporates 3,004 141,267 1,304 — (538) 142,967 96 4 Of which Specialised lending 152 9,116 11 — (9) 9,257 — 5 Of which SMEs 1,847 14,653 340 — (19) 16,159 — 6 Retail 3,787 235,913 2,609 — (940) 237,092 361 7 Secured by real estate property 1,820 167,427 431 — (50) 168,816 10 8 SMEs — — — — — — — 9 Non-SMEs 1,820 167,427 431 — (50) 168,816 10 10 Qualifying revolving 1,079 57,895 1,698 — (769) 57,275 286 11 Other retail 888 10,592 480 — (120) 11,000 65 12 SMEs 642 6,786 160 — (1) 7,268 — 13 Non-SMEs 246 3,806 320 — (119) 3,732 65 14 Equity — — — — — — — 15 Total IRB approach 6,819 496,141 3,925 — (1,476) 499,036 456 16 Central governments or central
banks — 241,958 — — (1) 241,958 —
17 Regional governments or local authorities
— 9,030 — — — 9,030 —
18 Public sector entities 3 7,038 27 — 14 7,014 — 19 Multilateral development banks — 6,360 — — — 6,360 — 20 International organisations — 828 — — — 828 — 21 Institutions — 7,295 1 — (10) 7,294 — 22 Corporates 1,053 62,318 820 — (151) 62,551 87 23 Of which: SMEs — 4,343 43 — (8) 4,299 — 24 Retail 2,087 101,548 2,681 — (598) 100,954 490 25 Of which: SMEs — 12,227 41 — (43) 12,185 — 26 Secured by mortgages on immovable
property 520 9,908 — — — 10,427 3
27 Of which: SMEs — 168 — — — 168 — 28 Exposures in default 3,663 — 1,695 — (258) 1,968 16 29 Items associated with particularly
high risk — 1,869 — — — 1,869 —
30 Covered bonds — 1,406 — — (1) 1,406 — 31 Claims on institutions and corporates
with a short-term credit assessment — — — — — — —
32 Collective investments undertakings — — — — — — — 33 Equity exposures — 837 — — — 837 — 34 Other exposures — 3,788 4 — 4 3,785 — 35 Total standardised approach 3,663 454,183 3,533 — (743) 454,313 580 36 Total 10,482 950,324 7,458 — (2,219) 953,348 1,036 37 Of which: Loans 9,348 547,987 6,742 — (1,885) 550,592 1,036 38 Of which: Debt securities 84 92,590 1 — — 92,672 — 39 Of which: Off-balance-sheet
exposures 1,051 309,747 714 — (334) 310,084 —
Analysis of Credit Risk
Barclays PLC 53
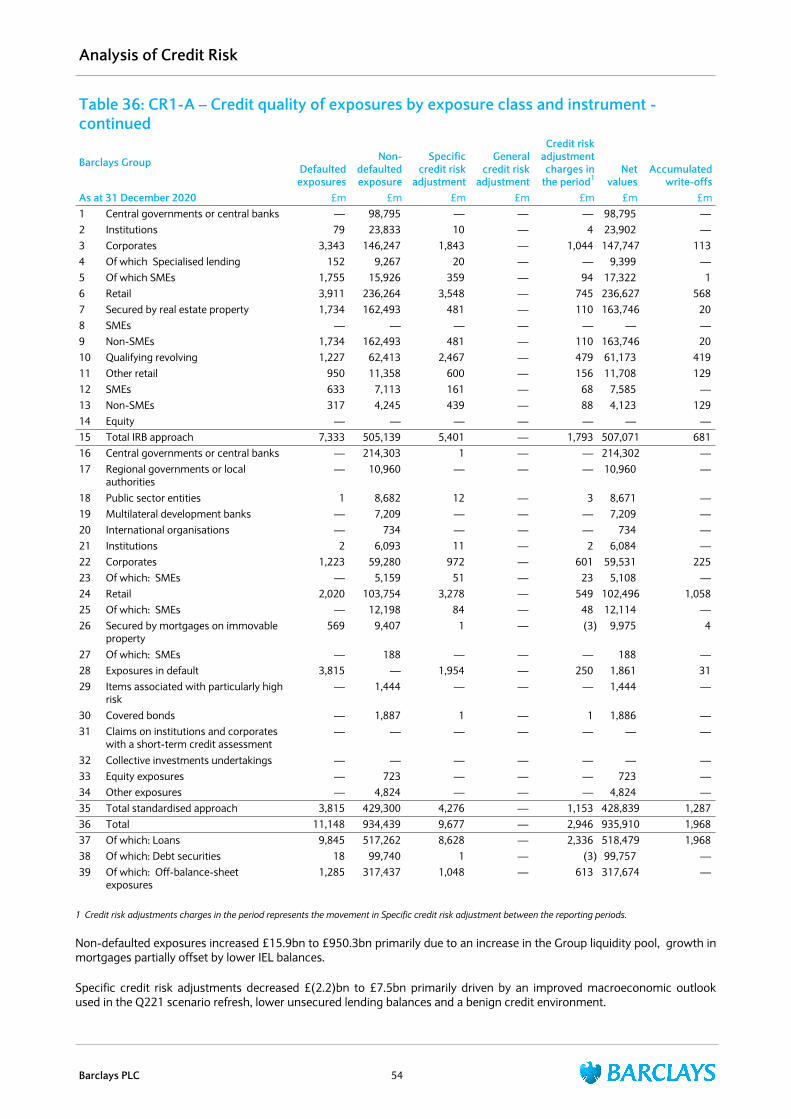
Table 36: CR1-A – Credit quality of exposures by exposure class and instrument - continued
Barclays Group Defaulted exposures
Non-defaulted exposure
Specific credit risk
adjustment
General credit risk
adjustment
Credit risk adjustment charges in
the period1Net
valuesAccumulated
write-offsAs at 31 December 2020 £m £m £m £m £m £m £m1 Central governments or central banks — 98,795 — — — 98,795 — 2 Institutions 79 23,833 10 — 4 23,902 — 3 Corporates 3,343 146,247 1,843 — 1,044 147,747 113 4 Of which Specialised lending 152 9,267 20 — — 9,399 — 5 Of which SMEs 1,755 15,926 359 — 94 17,322 1 6 Retail 3,911 236,264 3,548 — 745 236,627 568 7 Secured by real estate property 1,734 162,493 481 — 110 163,746 20 8 SMEs — — — — — — — 9 Non-SMEs 1,734 162,493 481 — 110 163,746 20 10 Qualifying revolving 1,227 62,413 2,467 — 479 61,173 419 11 Other retail 950 11,358 600 — 156 11,708 129 12 SMEs 633 7,113 161 — 68 7,585 — 13 Non-SMEs 317 4,245 439 — 88 4,123 129 14 Equity — — — — — — — 15 Total IRB approach 7,333 505,139 5,401 — 1,793 507,071 681 16 Central governments or central banks — 214,303 1 — — 214,302 — 17 Regional governments or local
authorities — 10,960 — — — 10,960 —
18 Public sector entities 1 8,682 12 — 3 8,671 — 19 Multilateral development banks — 7,209 — — — 7,209 — 20 International organisations — 734 — — — 734 — 21 Institutions 2 6,093 11 — 2 6,084 — 22 Corporates 1,223 59,280 972 — 601 59,531 225 23 Of which: SMEs — 5,159 51 — 23 5,108 — 24 Retail 2,020 103,754 3,278 — 549 102,496 1,058 25 Of which: SMEs — 12,198 84 — 48 12,114 — 26 Secured by mortgages on immovable
property 569 9,407 1 — (3) 9,975 4
27 Of which: SMEs — 188 — — — 188 — 28 Exposures in default 3,815 — 1,954 — 250 1,861 31 29 Items associated with particularly high
risk — 1,444 — — — 1,444 —
30 Covered bonds — 1,887 1 — 1 1,886 — 31 Claims on institutions and corporates
with a short-term credit assessment — — — — — — —
32 Collective investments undertakings — — — — — — — 33 Equity exposures — 723 — — — 723 — 34 Other exposures — 4,824 — — — 4,824 — 35 Total standardised approach 3,815 429,300 4,276 — 1,153 428,839 1,287 36 Total 11,148 934,439 9,677 — 2,946 935,910 1,968 37 Of which: Loans 9,845 517,262 8,628 — 2,336 518,479 1,968 38 Of which: Debt securities 18 99,740 1 — (3) 99,757 — 39 Of which: Off-balance-sheet
exposures 1,285 317,437 1,048 — 613 317,674 —
1 Credit risk adjustments charges in the period represents the movement in Specific credit risk adjustment between the reporting periods.
Non-defaulted exposures increased £15.9bn to £950.3bn primarily due to an increase in the Group liquidity pool, growth in mortgages partially offset by lower IEL balances.
Specific credit risk adjustments decreased £(2.2)bn to £7.5bn primarily driven by an improved macroeconomic outlook used in the Q221 scenario refresh, lower unsecured lending balances and a benign credit environment.
Analysis of Credit Risk
Barclays PLC 54
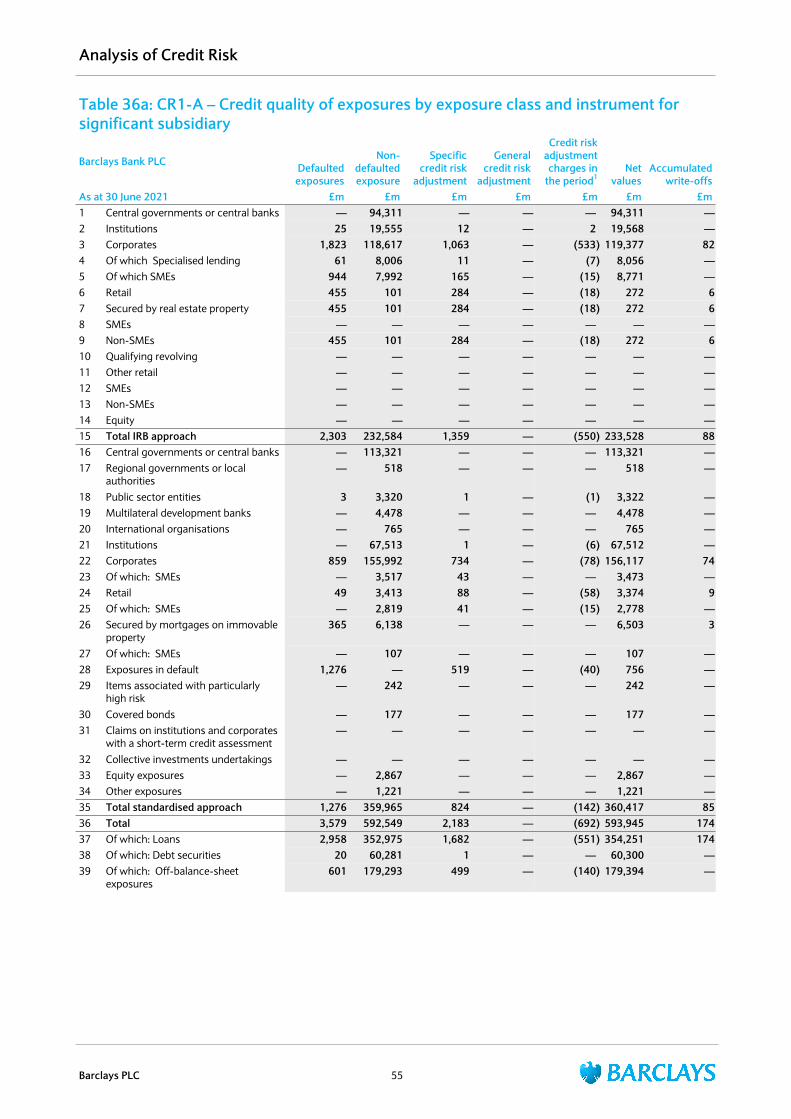
Table 36a: CR1-A – Credit quality of exposures by exposure class and instrument for significant subsidiary
Barclays Bank PLC Defaulted exposures
Non-defaulted exposure
Specific credit risk
adjustment
General credit risk
adjustment
Credit risk adjustment charges in
the period1Net
valuesAccumulated
write-offsAs at 30 June 2021 £m £m £m £m £m £m £m1 Central governments or central banks — 94,311 — — — 94,311 — 2 Institutions 25 19,555 12 — 2 19,568 — 3 Corporates 1,823 118,617 1,063 — (533) 119,377 82 4 Of which Specialised lending 61 8,006 11 — (7) 8,056 — 5 Of which SMEs 944 7,992 165 — (15) 8,771 — 6 Retail 455 101 284 — (18) 272 6 7 Secured by real estate property 455 101 284 — (18) 272 6 8 SMEs — — — — — — — 9 Non-SMEs 455 101 284 — (18) 272 6 10 Qualifying revolving — — — — — — — 11 Other retail — — — — — — — 12 SMEs — — — — — — — 13 Non-SMEs — — — — — — — 14 Equity — — — — — — — 15 Total IRB approach 2,303 232,584 1,359 — (550) 233,528 88 16 Central governments or central banks — 113,321 — — — 113,321 — 17 Regional governments or local
authorities — 518 — — — 518 —
18 Public sector entities 3 3,320 1 — (1) 3,322 — 19 Multilateral development banks — 4,478 — — — 4,478 — 20 International organisations — 765 — — — 765 — 21 Institutions — 67,513 1 — (6) 67,512 — 22 Corporates 859 155,992 734 — (78) 156,117 74 23 Of which: SMEs — 3,517 43 — — 3,473 — 24 Retail 49 3,413 88 — (58) 3,374 9 25 Of which: SMEs — 2,819 41 — (15) 2,778 — 26 Secured by mortgages on immovable
property 365 6,138 — — — 6,503 3
27 Of which: SMEs — 107 — — — 107 — 28 Exposures in default 1,276 — 519 — (40) 756 — 29 Items associated with particularly
high risk — 242 — — — 242 —
30 Covered bonds — 177 — — — 177 — 31 Claims on institutions and corporates
with a short-term credit assessment — — — — — — —
32 Collective investments undertakings — — — — — — — 33 Equity exposures — 2,867 — — — 2,867 — 34 Other exposures — 1,221 — — — 1,221 — 35 Total standardised approach 1,276 359,965 824 — (142) 360,417 85 36 Total 3,579 592,549 2,183 — (692) 593,945 174 37 Of which: Loans 2,958 352,975 1,682 — (551) 354,251 174 38 Of which: Debt securities 20 60,281 1 — — 60,300 — 39 Of which: Off-balance-sheet
exposures 601 179,293 499 — (140) 179,394 —
Analysis of Credit Risk
Barclays PLC 55
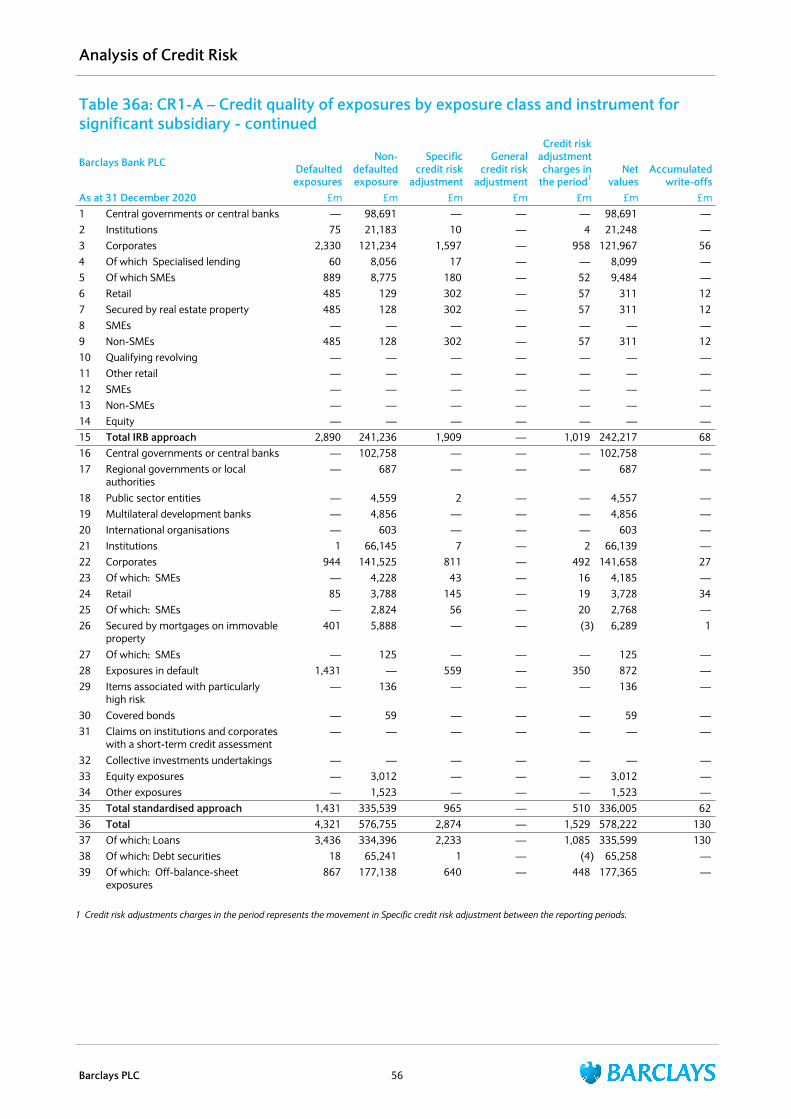
Table 36a: CR1-A – Credit quality of exposures by exposure class and instrument for significant subsidiary - continued
Barclays Bank PLC Defaulted exposures
Non-defaulted exposure
Specific credit risk
adjustment
General credit risk
adjustment
Credit risk adjustment charges in
the period1Net
valuesAccumulated
write-offsAs at 31 December 2020 £m £m £m £m £m £m £m1 Central governments or central banks — 98,691 — — — 98,691 — 2 Institutions 75 21,183 10 — 4 21,248 — 3 Corporates 2,330 121,234 1,597 — 958 121,967 56 4 Of which Specialised lending 60 8,056 17 — — 8,099 — 5 Of which SMEs 889 8,775 180 — 52 9,484 — 6 Retail 485 129 302 — 57 311 12 7 Secured by real estate property 485 128 302 — 57 311 12 8 SMEs — — — — — — — 9 Non-SMEs 485 128 302 — 57 311 12 10 Qualifying revolving — — — — — — — 11 Other retail — — — — — — — 12 SMEs — — — — — — — 13 Non-SMEs — — — — — — — 14 Equity — — — — — — — 15 Total IRB approach 2,890 241,236 1,909 — 1,019 242,217 68 16 Central governments or central banks — 102,758 — — — 102,758 — 17 Regional governments or local
authorities — 687 — — — 687 —
18 Public sector entities — 4,559 2 — — 4,557 — 19 Multilateral development banks — 4,856 — — — 4,856 — 20 International organisations — 603 — — — 603 — 21 Institutions 1 66,145 7 — 2 66,139 — 22 Corporates 944 141,525 811 — 492 141,658 27 23 Of which: SMEs — 4,228 43 — 16 4,185 — 24 Retail 85 3,788 145 — 19 3,728 34 25 Of which: SMEs — 2,824 56 — 20 2,768 — 26 Secured by mortgages on immovable
property 401 5,888 — — (3) 6,289 1
27 Of which: SMEs — 125 — — — 125 — 28 Exposures in default 1,431 — 559 — 350 872 — 29 Items associated with particularly
high risk — 136 — — — 136 —
30 Covered bonds — 59 — — — 59 — 31 Claims on institutions and corporates
with a short-term credit assessment — — — — — — —
32 Collective investments undertakings — — — — — — — 33 Equity exposures — 3,012 — — — 3,012 — 34 Other exposures — 1,523 — — — 1,523 — 35 Total standardised approach 1,431 335,539 965 — 510 336,005 62 36 Total 4,321 576,755 2,874 — 1,529 578,222 130 37 Of which: Loans 3,436 334,396 2,233 — 1,085 335,599 130 38 Of which: Debt securities 18 65,241 1 — (4) 65,258 — 39 Of which: Off-balance-sheet
exposures 867 177,138 640 — 448 177,365 —
1 Credit risk adjustments charges in the period represents the movement in Specific credit risk adjustment between the reporting periods.
Analysis of Credit Risk
Barclays PLC 56
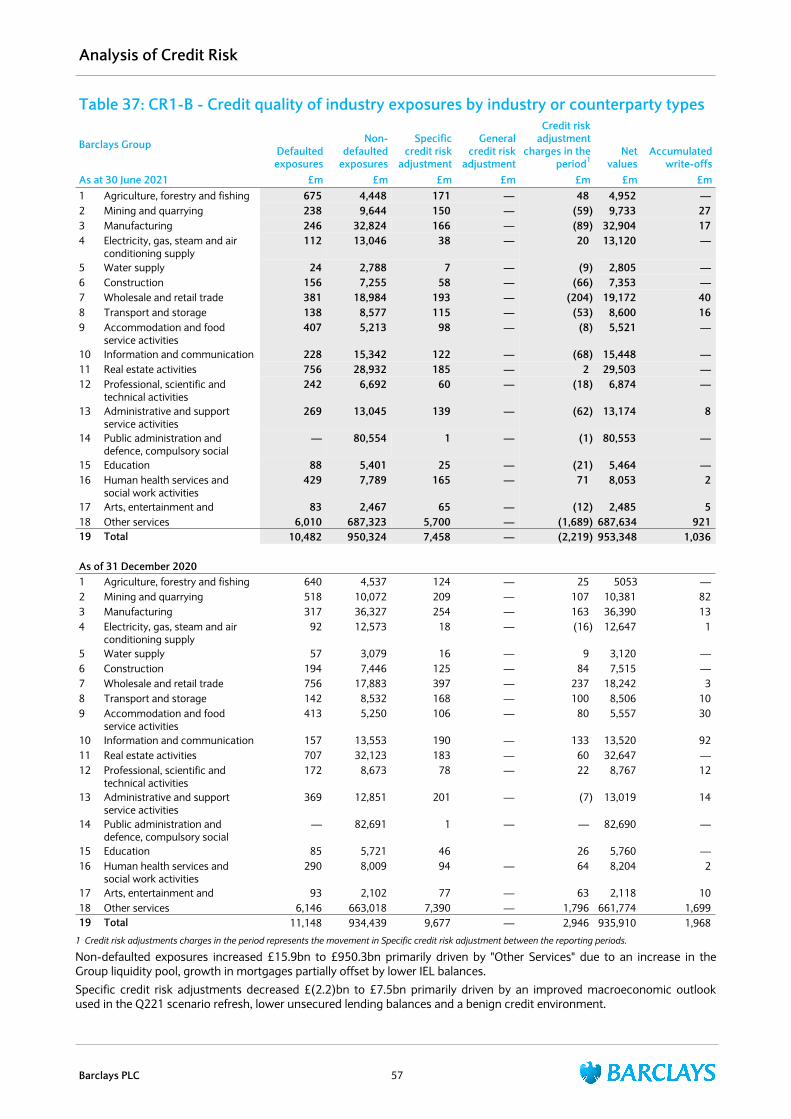
Table 37: CR1-B - Credit quality of industry exposures by industry or counterparty types
Barclays Group Defaulted exposures
Non-defaulted
exposures
Specific credit risk
adjustment
General credit risk
adjustment
Credit risk adjustment
charges in the period1
Net values
Accumulatedwrite-offs
As at 30 June 2021 £m £m £m £m £m £m £m1 Agriculture, forestry and fishing 675 4,448 171 — 48 4,952 — 2 Mining and quarrying 238 9,644 150 — (59) 9,733 27 3 Manufacturing 246 32,824 166 — (89) 32,904 17 4 Electricity, gas, steam and air
conditioning supply 112 13,046 38 — 20 13,120 —
5 Water supply 24 2,788 7 — (9) 2,805 — 6 Construction 156 7,255 58 — (66) 7,353 — 7 Wholesale and retail trade 381 18,984 193 — (204) 19,172 40 8 Transport and storage 138 8,577 115 — (53) 8,600 16 9 Accommodation and food
service activities 407 5,213 98 — (8) 5,521 —
10 Information and communication 228 15,342 122 — (68) 15,448 — 11 Real estate activities 756 28,932 185 — 2 29,503 — 12 Professional, scientific and
technical activities 242 6,692 60 — (18) 6,874 —
13 Administrative and support service activities
269 13,045 139 — (62) 13,174 8
14 Public administration and defence, compulsory social
— 80,554 1 — (1) 80,553 —
15 Education 88 5,401 25 — (21) 5,464 — 16 Human health services and
social work activities 429 7,789 165 — 71 8,053 2
17 Arts, entertainment and 83 2,467 65 — (12) 2,485 5 18 Other services 6,010 687,323 5,700 — (1,689) 687,634 921 19 Total 10,482 950,324 7,458 — (2,219) 953,348 1,036
As of 31 December 20201 Agriculture, forestry and fishing 640 4,537 124 — 25 5053 — 2 Mining and quarrying 518 10,072 209 — 107 10,381 82 3 Manufacturing 317 36,327 254 — 163 36,390 13 4 Electricity, gas, steam and air
conditioning supply 92 12,573 18 — (16) 12,647 1
5 Water supply 57 3,079 16 — 9 3,120 — 6 Construction 194 7,446 125 — 84 7,515 — 7 Wholesale and retail trade 756 17,883 397 — 237 18,242 3 8 Transport and storage 142 8,532 168 — 100 8,506 10 9 Accommodation and food
service activities 413 5,250 106 — 80 5,557 30
10 Information and communication 157 13,553 190 — 133 13,520 92 11 Real estate activities 707 32,123 183 — 60 32,647 — 12 Professional, scientific and
technical activities 172 8,673 78 — 22 8,767 12
13 Administrative and support service activities
369 12,851 201 — (7) 13,019 14
14 Public administration and defence, compulsory social
— 82,691 1 — — 82,690 —
15 Education 85 5,721 46 26 5,760 — 16 Human health services and
social work activities 290 8,009 94 — 64 8,204 2
17 Arts, entertainment and 93 2,102 77 — 63 2,118 10 18 Other services 6,146 663,018 7,390 — 1,796 661,774 1,699 19 Total 11,148 934,439 9,677 — 2,946 935,910 1,968
1 Credit risk adjustments charges in the period represents the movement in Specific credit risk adjustment between the reporting periods.
Non-defaulted exposures increased £15.9bn to £950.3bn primarily driven by "Other Services" due to an increase in the Group liquidity pool, growth in mortgages partially offset by lower IEL balances. Specific credit risk adjustments decreased £(2.2)bn to £7.5bn primarily driven by an improved macroeconomic outlook used in the Q221 scenario refresh, lower unsecured lending balances and a benign credit environment.
Analysis of Credit Risk
Barclays PLC 57
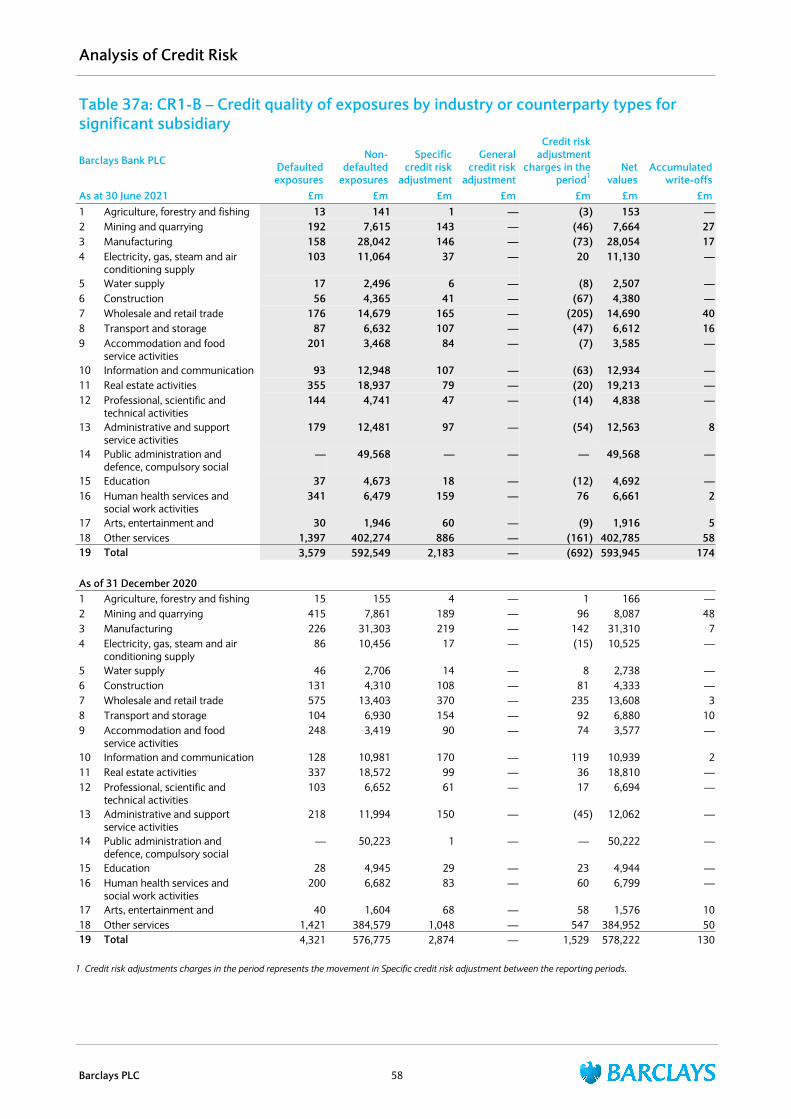
Table 37a: CR1-B – Credit quality of exposures by industry or counterparty types for significant subsidiary
Barclays Bank PLC Defaulted exposures
Non-defaulted
exposures
Specific credit risk
adjustment
General credit risk
adjustment
Credit risk adjustment
charges in the period1
Net values
Accumulatedwrite-offs
As at 30 June 2021 £m £m £m £m £m £m £m1 Agriculture, forestry and fishing 13 141 1 — (3) 153 — 2 Mining and quarrying 192 7,615 143 — (46) 7,664 27 3 Manufacturing 158 28,042 146 — (73) 28,054 17 4 Electricity, gas, steam and air
conditioning supply 103 11,064 37 — 20 11,130 —
5 Water supply 17 2,496 6 — (8) 2,507 — 6 Construction 56 4,365 41 — (67) 4,380 — 7 Wholesale and retail trade 176 14,679 165 — (205) 14,690 40 8 Transport and storage 87 6,632 107 — (47) 6,612 16 9 Accommodation and food
service activities 201 3,468 84 — (7) 3,585 —
10 Information and communication 93 12,948 107 — (63) 12,934 — 11 Real estate activities 355 18,937 79 — (20) 19,213 — 12 Professional, scientific and
technical activities 144 4,741 47 — (14) 4,838 —
13 Administrative and support service activities
179 12,481 97 — (54) 12,563 8
14 Public administration and defence, compulsory social
— 49,568 — — — 49,568 —
15 Education 37 4,673 18 — (12) 4,692 — 16 Human health services and
social work activities 341 6,479 159 — 76 6,661 2
17 Arts, entertainment and 30 1,946 60 — (9) 1,916 5 18 Other services 1,397 402,274 886 — (161) 402,785 58 19 Total 3,579 592,549 2,183 — (692) 593,945 174
As of 31 December 20201 Agriculture, forestry and fishing 15 155 4 — 1 166 — 2 Mining and quarrying 415 7,861 189 — 96 8,087 48 3 Manufacturing 226 31,303 219 — 142 31,310 7 4 Electricity, gas, steam and air
conditioning supply 86 10,456 17 — (15) 10,525 —
5 Water supply 46 2,706 14 — 8 2,738 — 6 Construction 131 4,310 108 — 81 4,333 — 7 Wholesale and retail trade 575 13,403 370 — 235 13,608 3 8 Transport and storage 104 6,930 154 — 92 6,880 10 9 Accommodation and food
service activities 248 3,419 90 — 74 3,577 —
10 Information and communication 128 10,981 170 — 119 10,939 2 11 Real estate activities 337 18,572 99 — 36 18,810 — 12 Professional, scientific and
technical activities 103 6,652 61 — 17 6,694 —
13 Administrative and support service activities
218 11,994 150 — (45) 12,062 —
14 Public administration and defence, compulsory social
— 50,223 1 — — 50,222 —
15 Education 28 4,945 29 — 23 4,944 — 16 Human health services and
social work activities 200 6,682 83 — 60 6,799 —
17 Arts, entertainment and 40 1,604 68 — 58 1,576 10 18 Other services 1,421 384,579 1,048 — 547 384,952 50 19 Total 4,321 576,775 2,874 — 1,529 578,222 130
1 Credit risk adjustments charges in the period represents the movement in Specific credit risk adjustment between the reporting periods.
Analysis of Credit Risk
Barclays PLC 58
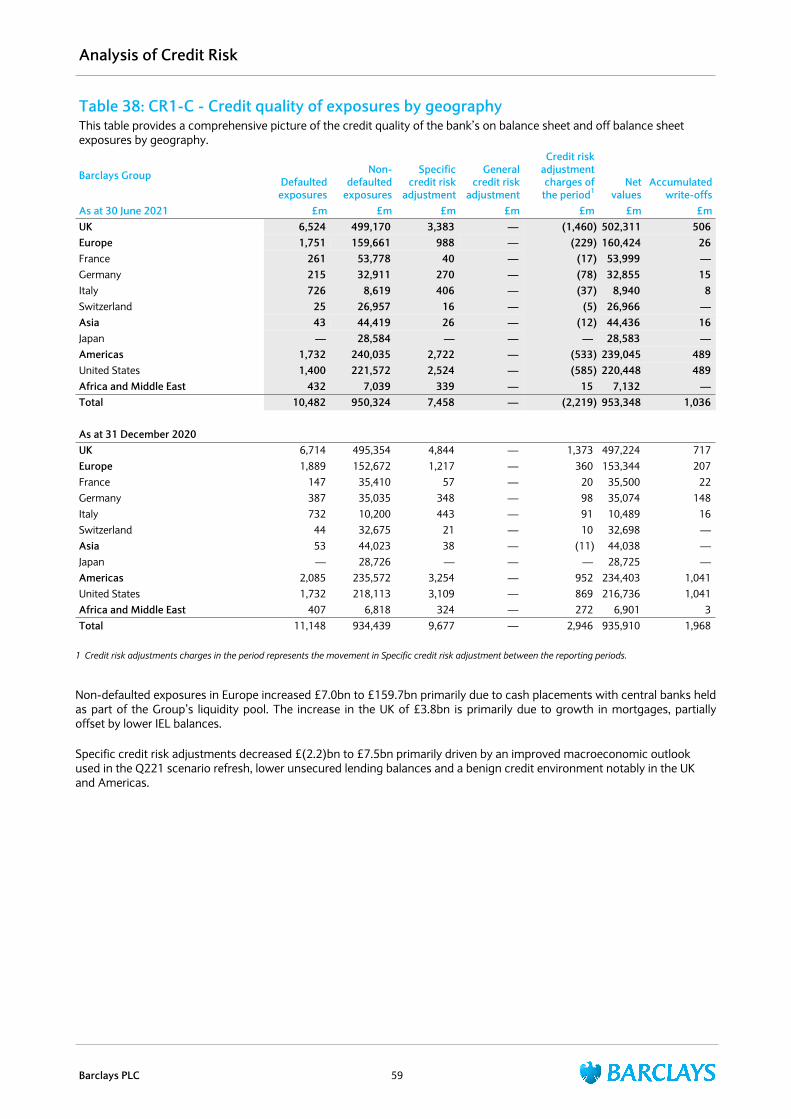
Table 38: CR1-C - Credit quality of exposures by geographyThis table provides a comprehensive picture of the credit quality of the bank’s on balance sheet and off balance sheet exposures by geography.
Barclays Group Defaulted exposures
Non-defaulted
exposures
Specific credit risk
adjustment
General credit risk
adjustment
Credit risk adjustment charges of the period1
Net values
Accumulatedwrite-offs
As at 30 June 2021 £m £m £m £m £m £m £mUK 6,524 499,170 3,383 — (1,460) 502,311 506 Europe 1,751 159,661 988 — (229) 160,424 26 France 261 53,778 40 — (17) 53,999 — Germany 215 32,911 270 — (78) 32,855 15 Italy 726 8,619 406 — (37) 8,940 8 Switzerland 25 26,957 16 — (5) 26,966 — Asia 43 44,419 26 — (12) 44,436 16 Japan — 28,584 — — — 28,583 — Americas 1,732 240,035 2,722 — (533) 239,045 489 United States 1,400 221,572 2,524 — (585) 220,448 489 Africa and Middle East 432 7,039 339 — 15 7,132 — Total 10,482 950,324 7,458 — (2,219) 953,348 1,036
As at 31 December 2020UK 6,714 495,354 4,844 — 1,373 497,224 717 Europe 1,889 152,672 1,217 — 360 153,344 207 France 147 35,410 57 — 20 35,500 22 Germany 387 35,035 348 — 98 35,074 148 Italy 732 10,200 443 — 91 10,489 16 Switzerland 44 32,675 21 — 10 32,698 — Asia 53 44,023 38 — (11) 44,038 — Japan — 28,726 — — — 28,725 — Americas 2,085 235,572 3,254 — 952 234,403 1,041 United States 1,732 218,113 3,109 — 869 216,736 1,041 Africa and Middle East 407 6,818 324 — 272 6,901 3 Total 11,148 934,439 9,677 — 2,946 935,910 1,968
1 Credit risk adjustments charges in the period represents the movement in Specific credit risk adjustment between the reporting periods.
Non-defaulted exposures in Europe increased £7.0bn to £159.7bn primarily due to cash placements with central banks held as part of the Group’s liquidity pool. The increase in the UK of £3.8bn is primarily due to growth in mortgages, partially offset by lower IEL balances.
Specific credit risk adjustments decreased £(2.2)bn to £7.5bn primarily driven by an improved macroeconomic outlook used in the Q221 scenario refresh, lower unsecured lending balances and a benign credit environment notably in the UK and Americas.
Analysis of Credit Risk
Barclays PLC 59

Table 38a: CR1-C – Credit quality of exposures by geography for significant subsidiary
Barclays Bank PLC Defaulted exposures
Non-defaulted
exposures
Specific credit risk
adjustment
General credit risk
adjustment
Credit risk adjustment
charges in the period1
Net values
Accumulatedwrite-offs
As at 30 June 2021 £m £m £m £m £m £m £mUK 1,719 246,828 755 — (465) 247,792 104 Europe 886 115,689 430 — (119) 116,144 10 France 107 48,199 18 — (10) 48,289 — Germany 22 4,108 4 — (8) 4,126 10 Italy 452 2,292 283 — (18) 2,462 6 Switzerland 17 26,812 12 — (7) 26,817 — Asia 42 33,738 25 — (13) 33,756 16 Japan — 18,292 — — — 18,292 — Americas 515 191,444 641 — (104) 191,317 44 United States 275 146,290 451 — (157) 146,115 44 Africa and Middle East 417 4,850 332 — 10 4,935 — Total 3,579 592,549 2,183 — (692) 593,945 174
As at 31 December 2020UK 1,966 240,610 1,220 — 583 241,356 43 Europe 1,121 106,864 549 — 150 107,436 12 France 73 29,102 28 — 2 29,147 — Germany 120 6,766 12 — 6 6,874 — Italy 482 2,863 301 — 54 3,044 12 Switzerland 35 32,974 19 — 9 32,990 — Asia 52 35,344 37 — (11) 35,359 — Japan — 20,314 — — — 20,314 — Americas 788 188,717 745 — 536 188,760 72 United States 495 142,679 607 — 458 142,567 72 Africa and Middle East 394 5,240 323 — 271 5,311 3 Total 4,321 576,775 2,874 — 1,529 578,222 130
1 Credit risk adjustments charges in the period represents the movement in Specific credit risk adjustment between the reporting periods.
Analysis of Credit Risk
Barclays PLC 60
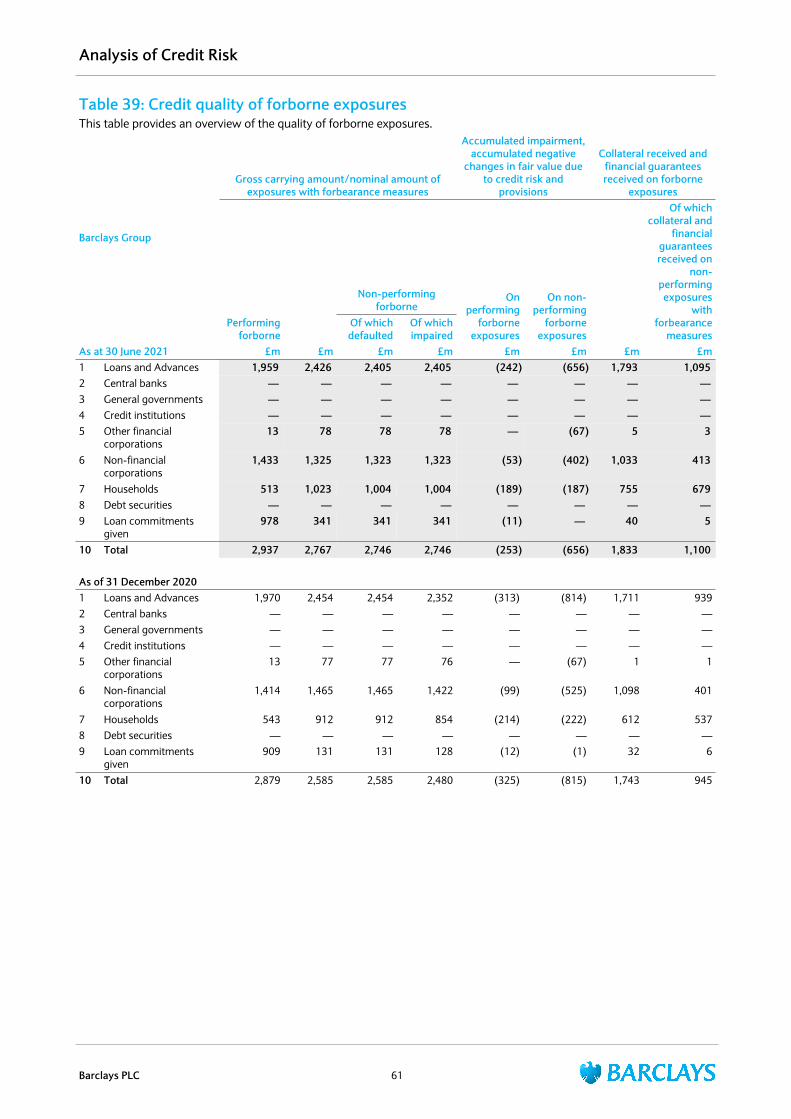
Table 39: Credit quality of forborne exposuresThis table provides an overview of the quality of forborne exposures.
Barclays Group
Gross carrying amount/nominal amount of exposures with forbearance measures
Accumulated impairment, accumulated negative
changes in fair value due to credit risk and
provisions
Collateral received and financial guarantees received on forborne
exposures
Performing forborne
Non-performing forborne
On performing
forborne exposures
On non-performing
forborne exposures
Of which collateral and
financial guarantees received on
non-performing exposures
with forbearance
measuresOf which defaulted
Of which impaired
As at 30 June 2021 £m £m £m £m £m £m £m £m1 Loans and Advances 1,959 2,426 2,405 2,405 (242) (656) 1,793 1,095 2 Central banks — — — — — — — — 3 General governments — — — — — — — — 4 Credit institutions — — — — — — — — 5 Other financial
corporations 13 78 78 78 — (67) 5 3
6 Non-financial corporations
1,433 1,325 1,323 1,323 (53) (402) 1,033 413
7 Households 513 1,023 1,004 1,004 (189) (187) 755 679 8 Debt securities — — — — — — — — 9 Loan commitments
given 978 341 341 341 (11) — 40 5
10 Total 2,937 2,767 2,746 2,746 (253) (656) 1,833 1,100
As of 31 December 20201 Loans and Advances 1,970 2,454 2,454 2,352 (313) (814) 1,711 9392 Central banks — — — — — — — —3 General governments — — — — — — — —4 Credit institutions — — — — — — — —5 Other financial
corporations13 77 77 76 — (67) 1 1
6 Non-financial corporations
1,414 1,465 1,465 1,422 (99) (525) 1,098 401
7 Households 543 912 912 854 (214) (222) 612 5378 Debt securities — — — — — — — —9 Loan commitments
given909 131 131 128 (12) (1) 32 6
10 Total 2,879 2,585 2,585 2,480 (325) (815) 1,743 945
Analysis of Credit Risk
Barclays PLC 61

Table 39a: Credit quality of forborne exposures for significant subsidiary
Barclays Bank PLC
Gross carrying amount/nominal amount of exposures with forbearance measures
Accumulated impairment, accumulated negative
changes in fair value due to credit risk and
provisions
Collateral received and financial guarantees received on forborne
exposures
Performing forborne
Non-performing forborne
On performing
forborne exposures
On non-performing
forborne exposures
Of which: collateral and
financial guarantees received on
non-performing exposures
with forbearance
measuresOf which defaulted
Of which impaired
As at 30 June 2021 £m £m £m £m £m £m £m £m1 Loans and Advances 1,460 1,116 1,115 1,115 (52) (409) 1,059 416 2 Central banks — — — — — — — — 3 General governments — — — — — — — — 4 Credit institutions — — — — — — — — 5 Other financial
corporations 10 75 75 75 — (67) — —
6 Non-financial corporations
1,385 699 698 698 (51) (323) 686 104
7 Households 65 342 342 342 (1) (19) 373 312 8 Debt securities — — — — — — — — 9 Loan commitments
given 867 309 309 309 (11) — 35 —
10 Total 2,327 1,425 1,424 1,424 (63) (409) 1,094 416
As of 31 December 20201 Loans and Advances 1,393 1,305 1,305 1,212 (91) (551) 1,109 380 2 Central banks — — — — — — — — 3 General governments — — — — — — — — 4 Credit institutions — — — — — — — — 5 Other financial
corporations 13 77 77 76 — (67) 1 1
6 Non-financial corporations
1,313 925 925 886 (90) (455) 781 117
7 Households 67 303 303 250 (1) (29) 327 262 8 Debt securities — — — — — — — — 9 Loan commitments
given 810 102 102 100 (12) (1) 26 1
10 Total 2,203 1,407 1,407 1,312 (103) (552) 1,135 381
Analysis of Credit Risk
Barclays PLC 62
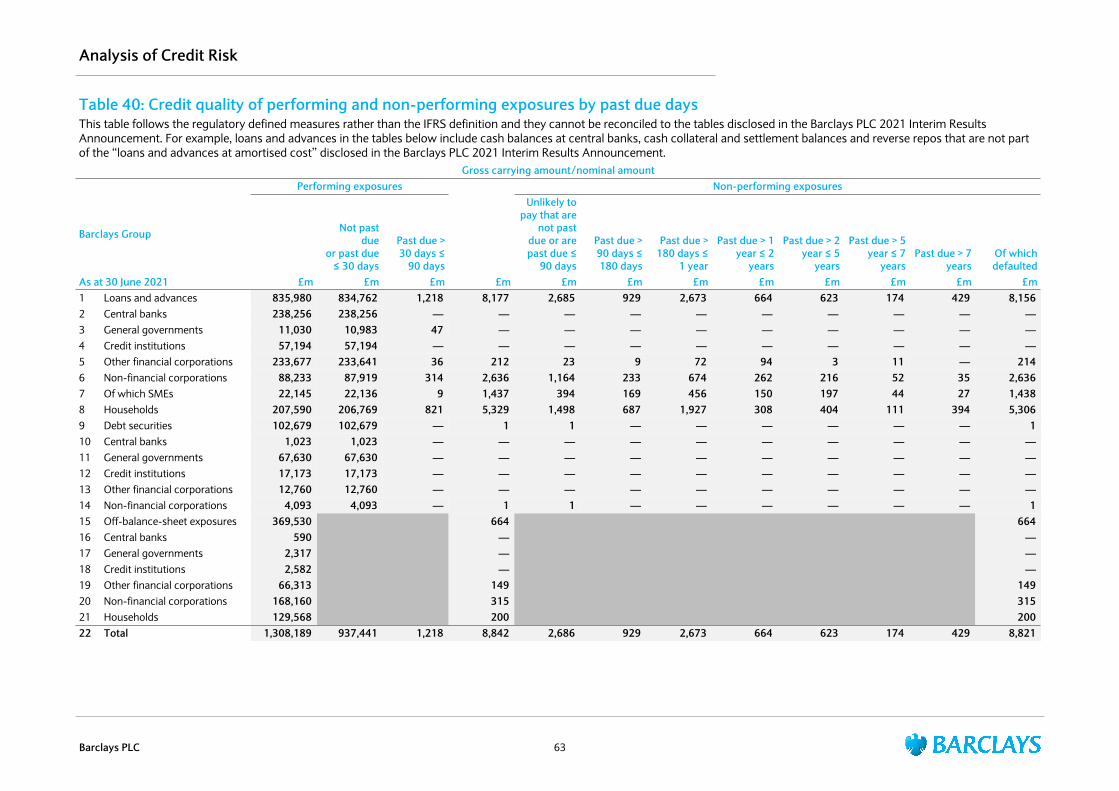
Table 40: Credit quality of performing and non-performing exposures by past due daysThis table follows the regulatory defined measures rather than the IFRS definition and they cannot be reconciled to the tables disclosed in the Barclays PLC 2021 Interim Results Announcement. For example, loans and advances in the tables below include cash balances at central banks, cash collateral and settlement balances and reverse repos that are not part of the “loans and advances at amortised cost” disclosed in the Barclays PLC 2021 Interim Results Announcement.
Gross carrying amount/nominal amountPerforming exposures Non-performing exposures
Barclays Group Not past due
or past due ≤ 30 days
Past due > 30 days ≤
90 days
Unlikely to pay that are
not past due or are past due ≤
90 days
Past due > 90 days ≤ 180 days
Past due > 180 days ≤
1 year
Past due > 1 year ≤ 2
years
Past due > 2 year ≤ 5
years
Past due > 5 year ≤ 7
yearsPast due > 7
yearsOf which defaulted
As at 30 June 2021 £m £m £m £m £m £m £m £m £m £m £m £m1 Loans and advances 835,980 834,762 1,218 8,177 2,685 929 2,673 664 623 174 429 8,156 2 Central banks 238,256 238,256 — — — — — — — — — — 3 General governments 11,030 10,983 47 — — — — — — — — — 4 Credit institutions 57,194 57,194 — — — — — — — — — — 5 Other financial corporations 233,677 233,641 36 212 23 9 72 94 3 11 — 214 6 Non-financial corporations 88,233 87,919 314 2,636 1,164 233 674 262 216 52 35 2,636 7 Of which SMEs 22,145 22,136 9 1,437 394 169 456 150 197 44 27 1,438 8 Households 207,590 206,769 821 5,329 1,498 687 1,927 308 404 111 394 5,306 9 Debt securities 102,679 102,679 — 1 1 — — — — — — 1 10 Central banks 1,023 1,023 — — — — — — — — — — 11 General governments 67,630 67,630 — — — — — — — — — — 12 Credit institutions 17,173 17,173 — — — — — — — — — — 13 Other financial corporations 12,760 12,760 — — — — — — — — — — 14 Non-financial corporations 4,093 4,093 — 1 1 — — — — — — 1 15 Off-balance-sheet exposures 369,530 664 664 16 Central banks 590 — — 17 General governments 2,317 — — 18 Credit institutions 2,582 — — 19 Other financial corporations 66,313 149 149 20 Non-financial corporations 168,160 315 315 21 Households 129,568 200 200 22 Total 1,308,189 937,441 1,218 8,842 2,686 929 2,673 664 623 174 429 8,821
Analysis of Credit Risk
Barclays PLC 63
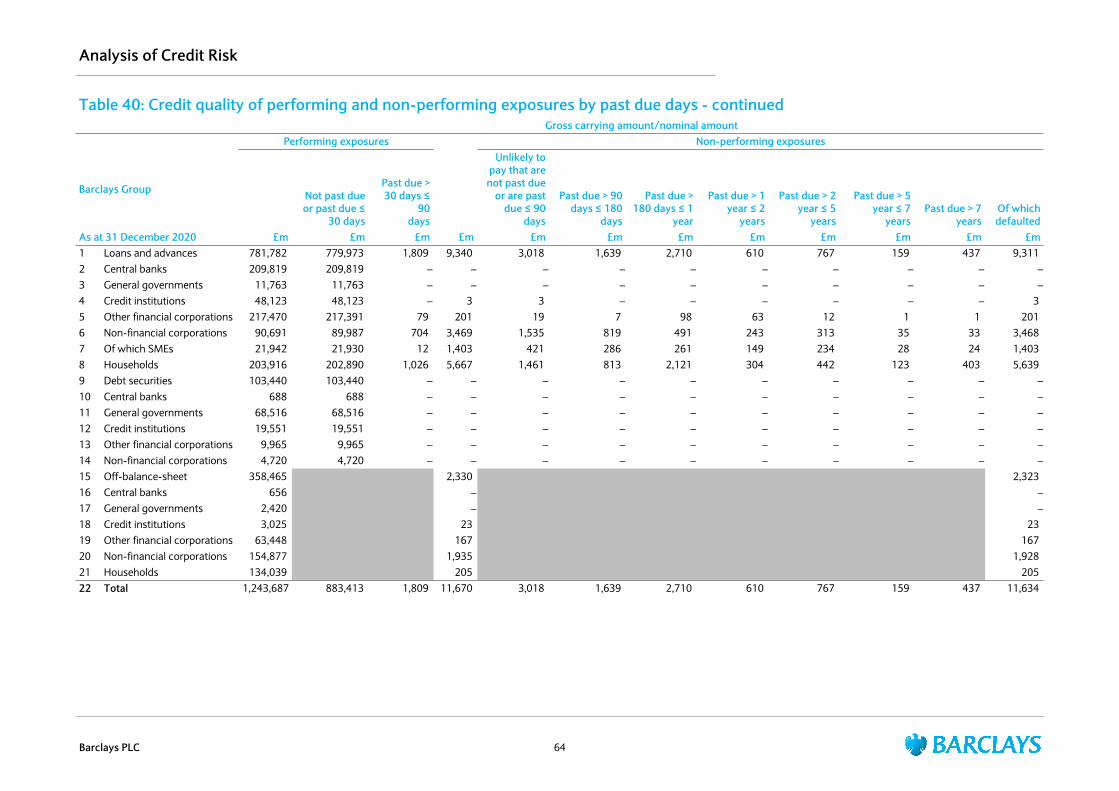
Table 40: Credit quality of performing and non-performing exposures by past due days - continuedGross carrying amount/nominal amount
Performing exposures Non-performing exposures
Barclays Group Not past due or past due ≤
30 days
Past due > 30 days ≤
90 days
Unlikely to pay that are
not past due or are past
due ≤ 90 days
Past due > 90 days ≤ 180
days
Past due > 180 days ≤ 1
year
Past due > 1 year ≤ 2
years
Past due > 2 year ≤ 5
years
Past due > 5 year ≤ 7
yearsPast due > 7
yearsOf which defaulted
As at 31 December 2020 £m £m £m £m £m £m £m £m £m £m £m £m1 Loans and advances 781,782 779,973 1,809 9,340 3,018 1,639 2,710 610 767 159 437 9,311 2 Central banks 209,819 209,819 – – – – – – – – – –3 General governments 11,763 11,763 – – – – – – – – – –4 Credit institutions 48,123 48,123 – 3 3 – – – – – – 3 5 Other financial corporations 217,470 217,391 79 201 19 7 98 63 12 1 1 201 6 Non-financial corporations 90,691 89,987 704 3,469 1,535 819 491 243 313 35 33 3,468 7 Of which SMEs 21,942 21,930 12 1,403 421 286 261 149 234 28 24 1,403 8 Households 203,916 202,890 1,026 5,667 1,461 813 2,121 304 442 123 403 5,639 9 Debt securities 103,440 103,440 – – – – – – – – – –10 Central banks 688 688 – – – – – – – – – –11 General governments 68,516 68,516 – – – – – – – – – –12 Credit institutions 19,551 19,551 – – – – – – – – – –13 Other financial corporations 9,965 9,965 – – – – – – – – – –14 Non-financial corporations 4,720 4,720 – – – – – – – – – –15 Off-balance-sheet 358,465 2,330 2,323 16 Central banks 656 – –17 General governments 2,420 – –18 Credit institutions 3,025 23 23 19 Other financial corporations 63,448 167 167 20 Non-financial corporations 154,877 1,935 1,928 21 Households 134,039 205 205 22 Total 1,243,687 883,413 1,809 11,670 3,018 1,639 2,710 610 767 159 437 11,634
Analysis of Credit Risk
Barclays PLC 64

Table 40a: Credit quality of performing and non-performing exposures by past due days for significant subsidiaryGross carrying amount/nominal amount
Performing exposures Non-performing exposures
Barclays Bank PLC Not past due or past due
≤ 30 days
Past due > 30 days ≤ 90
days
Unlikely to pay that are
not past due or are past
due ≤ 90 days
Past due > 90 days ≤ 180
days
Past due > 180 days ≤ 1
year
Past due > 1 year ≤ 2
years
Past due > 2 year ≤ 5
years
Past due > 5 year ≤ 7
yearsPast due > 7
yearsOf which defaulted
As at 30 June 2021 £m £m £m £m £m £m £m £m £m £m £m £m1 Loans and advances 645,316 644,888 428 2,290 794 188 555 254 164 72 263 2,289 2 Central banks 153,751 153,751 — — — — — — — — — — 3 General governments 2,030 1,983 47 — — — — — — — — — 4 Credit institutions 60,127 60,127 — — — — — — — — — — 5 Other financial corporations 366,574 366,538 36 179 19 1 68 91 — — — 179 6 Non-financial corporations 52,390 52,115 275 1,031 652 62 198 96 17 — 6 1,032 7 Of which SMEs 579 575 4 7 2 4 1 — — — — 7 8 Households 10,444 10,374 70 1,080 123 125 289 67 147 72 257 1,078 9 Debt securities 66,892 66,892 — 1 1 — — — — — — 1 10 Central banks 969 969 — — — — — — — — — — 11 General governments 44,145 44,145 — — — — — — — — — — 12 Credit institutions 12,203 12,203 — — — — — — — — — — 13 Other financial corporations 8,209 8,209 — — — — — — — — — — 14 Non-financial corporations 1,366 1,366 — 1 1 — — — — — — 1 15 Off-balance-sheet exposures 240,503 338 338 16 Central banks 5 — — 17 General governments 2,317 — — 18 Credit institutions 7,328 — — 19 Other financial corporations 80,648 147 147 20 Non-financial corporations 148,160 189 189 21 Households 2,045 2 2 22 Total 952,711 711,780 428 2,629 795 188 555 254 164 72 263 2,628
Analysis of Credit Risk
Barclays PLC 65
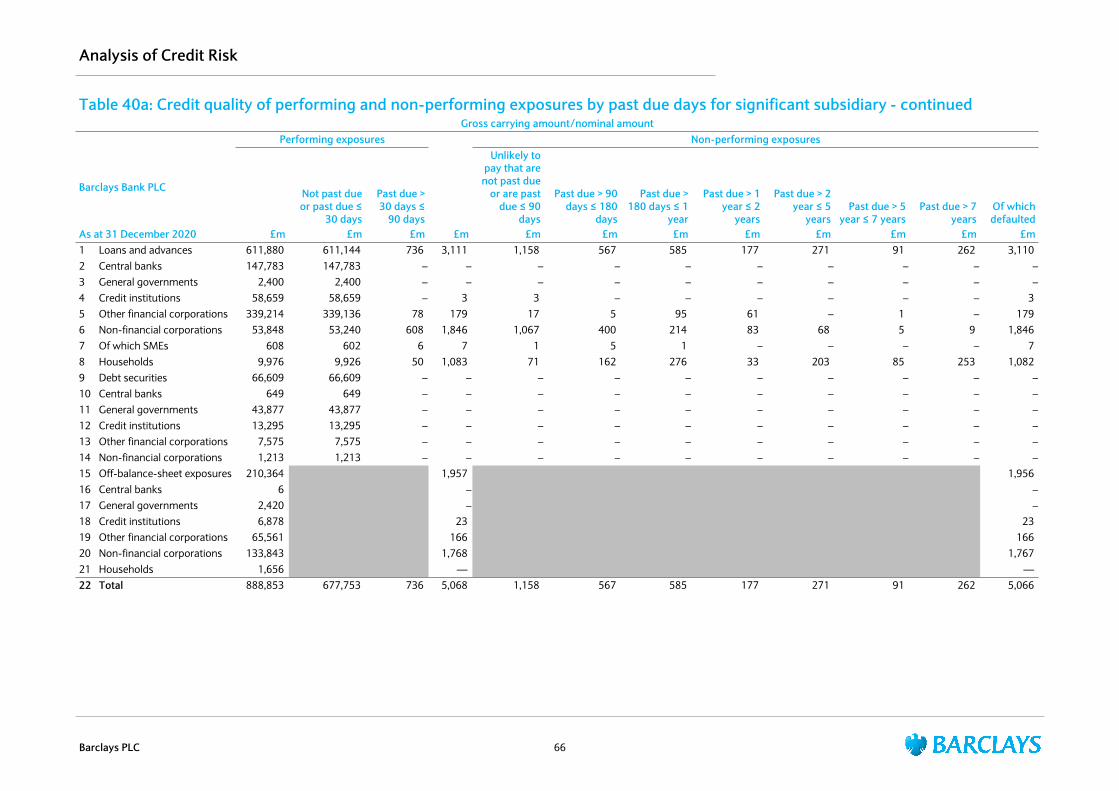
Table 40a: Credit quality of performing and non-performing exposures by past due days for significant subsidiary - continuedGross carrying amount/nominal amount
Performing exposures Non-performing exposures
Barclays Bank PLC Not past due or past due ≤
30 days
Past due > 30 days ≤
90 days
Unlikely to pay that are
not past due or are past
due ≤ 90 days
Past due > 90 days ≤ 180
days
Past due > 180 days ≤ 1
year
Past due > 1 year ≤ 2
years
Past due > 2 year ≤ 5
yearsPast due > 5
year ≤ 7 yearsPast due > 7
yearsOf which defaulted
As at 31 December 2020 £m £m £m £m £m £m £m £m £m £m £m £m1 Loans and advances 611,880 611,144 736 3,111 1,158 567 585 177 271 91 262 3,110 2 Central banks 147,783 147,783 – – – – – – – – – –3 General governments 2,400 2,400 – – – – – – – – – –4 Credit institutions 58,659 58,659 – 3 3 – – – – – – 3 5 Other financial corporations 339,214 339,136 78 179 17 5 95 61 – 1 – 179 6 Non-financial corporations 53,848 53,240 608 1,846 1,067 400 214 83 68 5 9 1,846 7 Of which SMEs 608 602 6 7 1 5 1 – – – – 7 8 Households 9,976 9,926 50 1,083 71 162 276 33 203 85 253 1,082 9 Debt securities 66,609 66,609 – – – – – – – – – –10 Central banks 649 649 – – – – – – – – – –11 General governments 43,877 43,877 – – – – – – – – – –12 Credit institutions 13,295 13,295 – – – – – – – – – –13 Other financial corporations 7,575 7,575 – – – – – – – – – –14 Non-financial corporations 1,213 1,213 – – – – – – – – – –15 Off-balance-sheet exposures 210,364 1,957 1,956 16 Central banks 6 – –17 General governments 2,420 – –18 Credit institutions 6,878 23 23 19 Other financial corporations 65,561 166 166 20 Non-financial corporations 133,843 1,768 1,767 21 Households 1,656 — — 22 Total 888,853 677,753 736 5,068 1,158 567 585 177 271 91 262 5,066
Analysis of Credit Risk
Barclays PLC 66
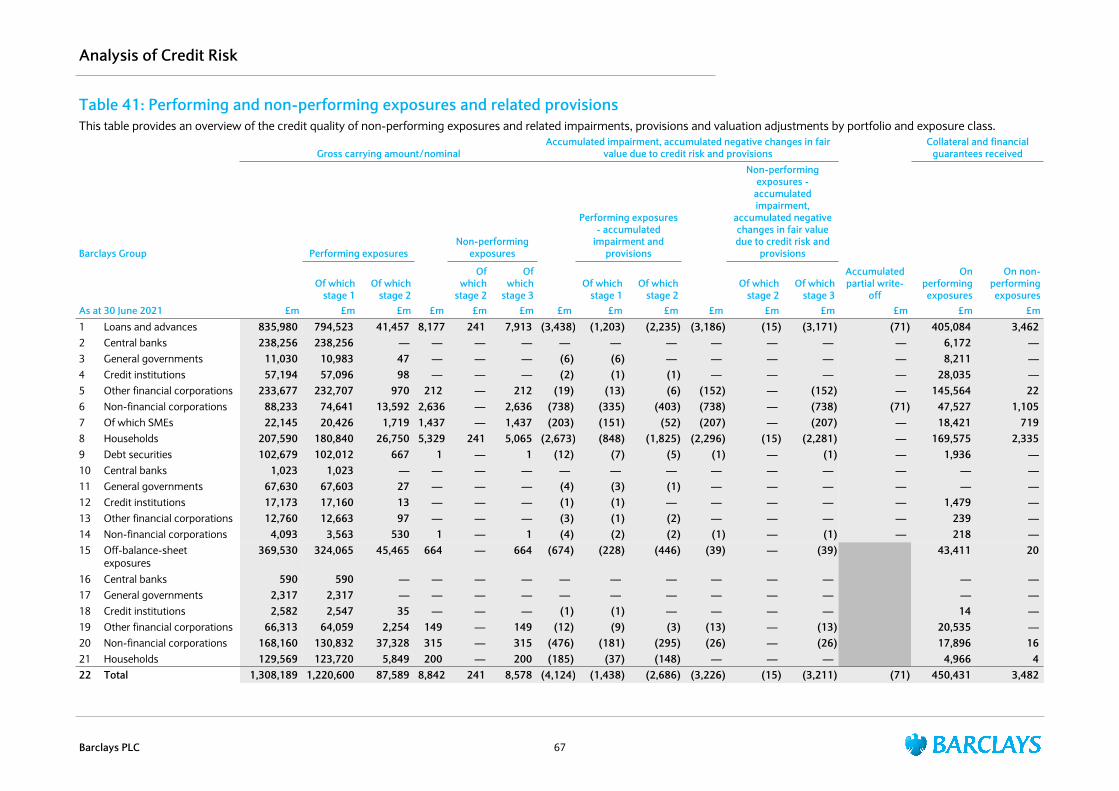
Table 41: Performing and non-performing exposures and related provisionsThis table provides an overview of the credit quality of non-performing exposures and related impairments, provisions and valuation adjustments by portfolio and exposure class.
Gross carrying amount/nominalAccumulated impairment, accumulated negative changes in fair
value due to credit risk and provisions
Accumulated partial write-
off
Collateral and financial guarantees received
Barclays Group Performing exposuresNon-performing
exposures
Performing exposures - accumulated
impairment and provisions
Non-performing exposures -
accumulated impairment,
accumulated negative changes in fair value due to credit risk and
provisions
On performing exposures
On non-performing exposures
Of which stage 1
Of which stage 2
Of which
stage 2
Of which
stage 3Of which
stage 1Of which
stage 2Of which
stage 2Of which
stage 3As at 30 June 2021 £m £m £m £m £m £m £m £m £m £m £m £m £m £m £m
1 Loans and advances 835,980 794,523 41,457 8,177 241 7,913 (3,438) (1,203) (2,235) (3,186) (15) (3,171) (71) 405,084 3,462 2 Central banks 238,256 238,256 — — — — — — — — — — — 6,172 — 3 General governments 11,030 10,983 47 — — — (6) (6) — — — — — 8,211 — 4 Credit institutions 57,194 57,096 98 — — — (2) (1) (1) — — — — 28,035 — 5 Other financial corporations 233,677 232,707 970 212 — 212 (19) (13) (6) (152) — (152) — 145,564 22 6 Non-financial corporations 88,233 74,641 13,592 2,636 — 2,636 (738) (335) (403) (738) — (738) (71) 47,527 1,105 7 Of which SMEs 22,145 20,426 1,719 1,437 — 1,437 (203) (151) (52) (207) — (207) — 18,421 719 8 Households 207,590 180,840 26,750 5,329 241 5,065 (2,673) (848) (1,825) (2,296) (15) (2,281) — 169,575 2,335 9 Debt securities 102,679 102,012 667 1 — 1 (12) (7) (5) (1) — (1) — 1,936 — 10 Central banks 1,023 1,023 — — — — — — — — — — — — — 11 General governments 67,630 67,603 27 — — — (4) (3) (1) — — — — — — 12 Credit institutions 17,173 17,160 13 — — — (1) (1) — — — — — 1,479 — 13 Other financial corporations 12,760 12,663 97 — — — (3) (1) (2) — — — — 239 — 14 Non-financial corporations 4,093 3,563 530 1 — 1 (4) (2) (2) (1) — (1) — 218 — 15 Off-balance-sheet
exposures 369,530 324,065 45,465 664 — 664 (674) (228) (446) (39) — (39) 43,411 20
16 Central banks 590 590 — — — — — — — — — — — — 17 General governments 2,317 2,317 — — — — — — — — — — — — 18 Credit institutions 2,582 2,547 35 — — — (1) (1) — — — — 14 — 19 Other financial corporations 66,313 64,059 2,254 149 — 149 (12) (9) (3) (13) — (13) 20,535 — 20 Non-financial corporations 168,160 130,832 37,328 315 — 315 (476) (181) (295) (26) — (26) 17,896 16 21 Households 129,569 123,720 5,849 200 — 200 (185) (37) (148) — — — 4,966 4 22 Total 1,308,189 1,220,600 87,589 8,842 241 8,578 (4,124) (1,438) (2,686) (3,226) (15) (3,211) (71) 450,431 3,482
Analysis of Credit Risk
Barclays PLC 67
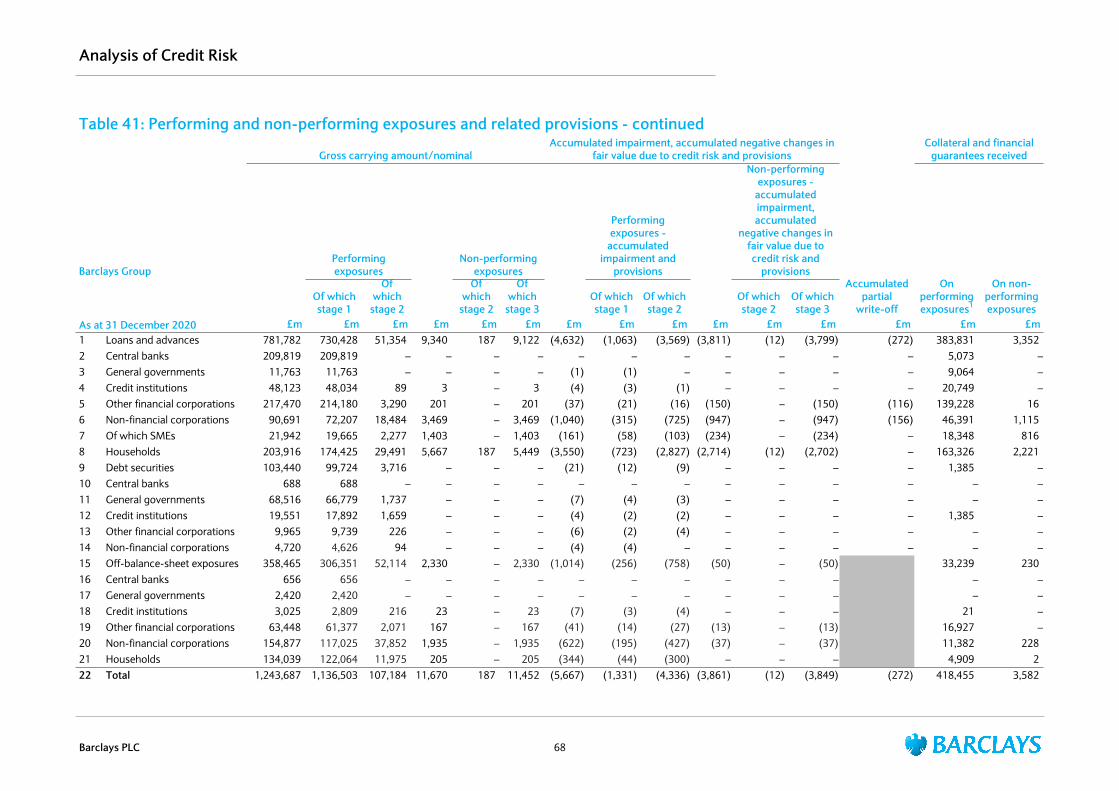
Table 41: Performing and non-performing exposures and related provisions - continued
Gross carrying amount/nominalAccumulated impairment, accumulated negative changes in
fair value due to credit risk and provisions
Accumulated partial
write-off
Collateral and financial guarantees received
Barclays GroupPerforming exposures
Non-performing exposures
Performing exposures -
accumulated impairment and
provisions
Non-performing exposures -
accumulated impairment, accumulated
negative changes in fair value due to credit risk and
provisionsOn
performing exposures1
On non-performing exposures
Of which stage 1
Of which
stage 2
Of which
stage 2
Of which
stage 3Of which stage 1
Of which stage 2
Of which stage 2
Of which stage 3
As at 31 December 2020 £m £m £m £m £m £m £m £m £m £m £m £m £m £m £m1 Loans and advances 781,782 730,428 51,354 9,340 187 9,122 (4,632) (1,063) (3,569) (3,811) (12) (3,799) (272) 383,831 3,352 2 Central banks 209,819 209,819 – – – – – – – – – – – 5,073 –3 General governments 11,763 11,763 – – – – (1) (1) – – – – – 9,064 –4 Credit institutions 48,123 48,034 89 3 – 3 (4) (3) (1) – – – – 20,749 –5 Other financial corporations 217,470 214,180 3,290 201 – 201 (37) (21) (16) (150) – (150) (116) 139,228 16 6 Non-financial corporations 90,691 72,207 18,484 3,469 – 3,469 (1,040) (315) (725) (947) – (947) (156) 46,391 1,115 7 Of which SMEs 21,942 19,665 2,277 1,403 – 1,403 (161) (58) (103) (234) – (234) – 18,348 816 8 Households 203,916 174,425 29,491 5,667 187 5,449 (3,550) (723) (2,827) (2,714) (12) (2,702) – 163,326 2,221 9 Debt securities 103,440 99,724 3,716 – – – (21) (12) (9) – – – – 1,385 –10 Central banks 688 688 – – – – – – – – – – – – –11 General governments 68,516 66,779 1,737 – – – (7) (4) (3) – – – – – –12 Credit institutions 19,551 17,892 1,659 – – – (4) (2) (2) – – – – 1,385 –13 Other financial corporations 9,965 9,739 226 – – – (6) (2) (4) – – – – – –14 Non-financial corporations 4,720 4,626 94 – – – (4) (4) – – – – – – –15 Off-balance-sheet exposures 358,465 306,351 52,114 2,330 – 2,330 (1,014) (256) (758) (50) – (50) 33,239 230 16 Central banks 656 656 – – – – – – – – – – – –17 General governments 2,420 2,420 – – – – – – – – – – – –18 Credit institutions 3,025 2,809 216 23 – 23 (7) (3) (4) – – – 21 –19 Other financial corporations 63,448 61,377 2,071 167 – 167 (41) (14) (27) (13) – (13) 16,927 –20 Non-financial corporations 154,877 117,025 37,852 1,935 – 1,935 (622) (195) (427) (37) – (37) 11,382 228 21 Households 134,039 122,064 11,975 205 – 205 (344) (44) (300) – – – 4,909 2 22 Total 1,243,687 1,136,503 107,184 11,670 187 11,452 (5,667) (1,331) (4,336) (3,861) (12) (3,849) (272) 418,455 3,582
Analysis of Credit Risk
Barclays PLC 68
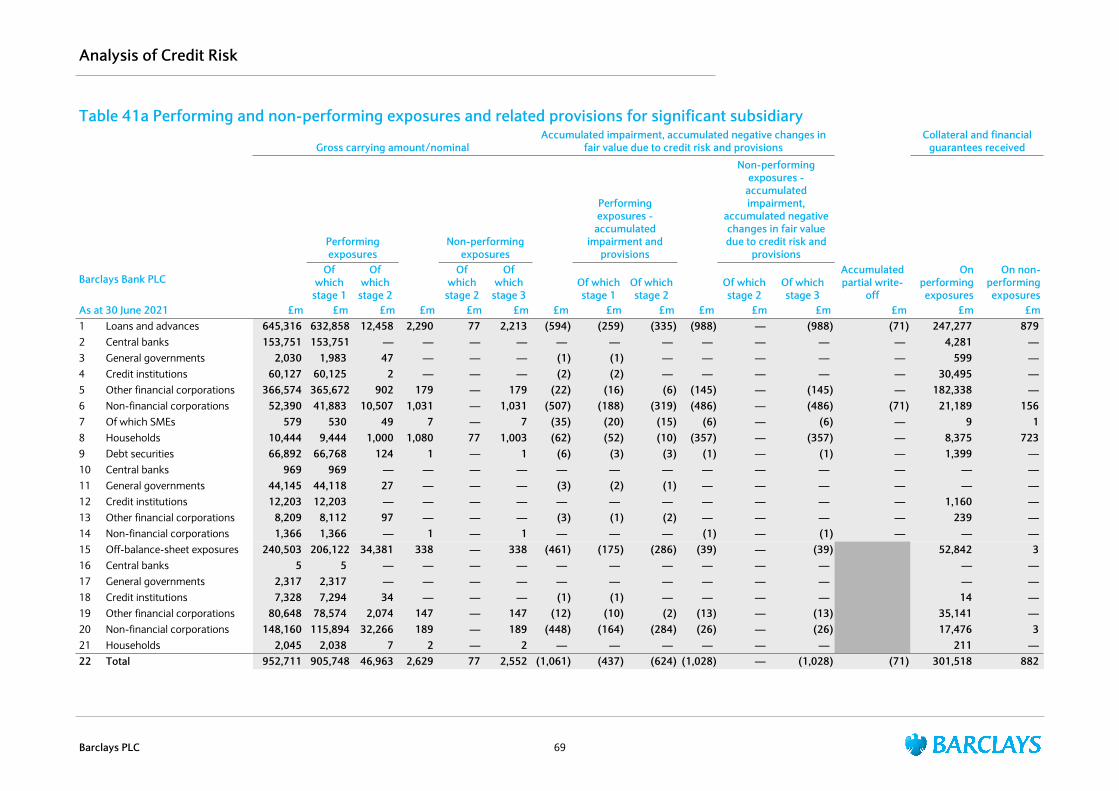
Table 41a Performing and non-performing exposures and related provisions for significant subsidiary
Gross carrying amount/nominalAccumulated impairment, accumulated negative changes in
fair value due to credit risk and provisions
Accumulated partial write-
off
Collateral and financial guarantees received
Barclays Bank PLC
Performing exposures
Non-performing exposures
Performing exposures -
accumulated impairment and
provisions
Non-performing exposures -
accumulated impairment,
accumulated negative changes in fair value due to credit risk and
provisionsOn
performing exposures
On non-performing exposures
Of which
stage 1
Of which
stage 2
Of which
stage 2
Of which
stage 3Of which stage 1
Of which stage 2
Of which stage 2
Of which stage 3
As at 30 June 2021 £m £m £m £m £m £m £m £m £m £m £m £m £m £m £m1 Loans and advances 645,316 632,858 12,458 2,290 77 2,213 (594) (259) (335) (988) — (988) (71) 247,277 879 2 Central banks 153,751 153,751 — — — — — — — — — — — 4,281 — 3 General governments 2,030 1,983 47 — — — (1) (1) — — — — — 599 — 4 Credit institutions 60,127 60,125 2 — — — (2) (2) — — — — — 30,495 — 5 Other financial corporations 366,574 365,672 902 179 — 179 (22) (16) (6) (145) — (145) — 182,338 — 6 Non-financial corporations 52,390 41,883 10,507 1,031 — 1,031 (507) (188) (319) (486) — (486) (71) 21,189 156 7 Of which SMEs 579 530 49 7 — 7 (35) (20) (15) (6) — (6) — 9 1 8 Households 10,444 9,444 1,000 1,080 77 1,003 (62) (52) (10) (357) — (357) — 8,375 723 9 Debt securities 66,892 66,768 124 1 — 1 (6) (3) (3) (1) — (1) — 1,399 — 10 Central banks 969 969 — — — — — — — — — — — — — 11 General governments 44,145 44,118 27 — — — (3) (2) (1) — — — — — — 12 Credit institutions 12,203 12,203 — — — — — — — — — — — 1,160 — 13 Other financial corporations 8,209 8,112 97 — — — (3) (1) (2) — — — — 239 — 14 Non-financial corporations 1,366 1,366 — 1 — 1 — — — (1) — (1) — — — 15 Off-balance-sheet exposures 240,503 206,122 34,381 338 — 338 (461) (175) (286) (39) — (39) 52,842 3 16 Central banks 5 5 — — — — — — — — — — — — 17 General governments 2,317 2,317 — — — — — — — — — — — — 18 Credit institutions 7,328 7,294 34 — — — (1) (1) — — — — 14 — 19 Other financial corporations 80,648 78,574 2,074 147 — 147 (12) (10) (2) (13) — (13) 35,141 — 20 Non-financial corporations 148,160 115,894 32,266 189 — 189 (448) (164) (284) (26) — (26) 17,476 3 21 Households 2,045 2,038 7 2 — 2 — — — — — — 211 — 22 Total 952,711 905,748 46,963 2,629 77 2,552 (1,061) (437) (624) (1,028) — (1,028) (71) 301,518 882
Analysis of Credit Risk
Barclays PLC 69

Table 41a Performing and non-performing exposures and related provisions for significant subsidiary - continued
Gross carrying amount/nominal
Accumulated impairment, accumulated negative changes in fair value
due to credit risk and provisions
Accumulated partial write-
off
Collateral and financial guarantees received
Performing exposures
Non-performing exposures
Performing exposures -
accumulated impairment and
provisions
Non-performing exposures -
accumulated impairment, accumulated
negative changes in fair value
due to credit risk and provisions
On performing exposures1
On non-performing exposures
Barclays Bank PLCOf which stage 1
Of which stage 2
Of which
stage 2
Of which
stage 3Of which stage 1
Of which stage 2
Of which stage 2
Of which stage 3
As at 31 December 2020 £m £m £m £m £m £m £m £m £m £m £m £m £m £m £m1 Loans and advances 611,880 595,212 16,668 3,111 22 3,089 (885) (342) (543) (1,193) – (1,193) (272) 226,663 908 2 Central banks 147,783 147,783 – – – – – – – – – – – 4,813 –3 General governments 2,400 2,400 – – – – – – – – – – – 628 –4 Credit institutions 58,659 58,577 82 3 – 3 (5) (4) (1) – – – – 26,039 –5 Other financial corporations 339,214 335,949 3,265 179 – 179 (47) (32) (15) (146) – (146) (116) 167,216 1 6 Non-financial corporations 53,848 41,178 12,670 1,846 – 1,846 (780) (269) (511) (652) – (652) (156) 19,591 239 7 Of which SMEs 608 527 81 7 – 7 (54) (24) (30) (6) – (6) – 8 1 8 Households 9,976 9,325 651 1,083 22 1,061 (53) (37) (16) (395) – (395) – 8,376 668 9 Debt securities 66,609 63,697 2,912 – – – (14) (7) (7) – – – – 1,065 –10 Central banks 649 649 – – – – – – – – – – – – –11 General governments 43,877 42,360 1,517 – – – (6) (4) (2) – – – – – –12 Credit institutions 13,295 12,113 1,182 – – – (2) (1) (1) – – – – 1,065 –13 Other financial corporations 7,575 7,370 205 – – – (6) (2) (4) – – – – – –14 Non-financial corporations 1,213 1,205 8 – – – – – – – – – – – –15 Off-balance-sheet 210,364 174,417 35,947 1,957 – 1,957 (604) (200) (404) (50) – (50) 41,600 214 16 Central banks 6 6 – – – – – – – – – – – –17 General governments 2,420 2,420 – – – – – – – – – – – –18 Credit institutions 6,878 6,714 164 23 – 23 (6) (2) (4) – – – 21 –19 Other financial corporations 65,561 63,673 1,888 166 – 166 (20) (14) (6) (13) – (13) 30,411 –20 Non-financial corporations 133,843 100,040 33,803 1,768 – 1,768 (578) (184) (394) (37) – (37) 11,057 214 21 Households 1,656 1,564 92 – – – – – – – – – 111 –22 Total 888,853 833,326 55,527 5,068 22 5,046 (1,503) (549) (954) (1,243) – (1,243) (272) 269,328 1,122
Analysis of Credit Risk
Barclays PLC 70
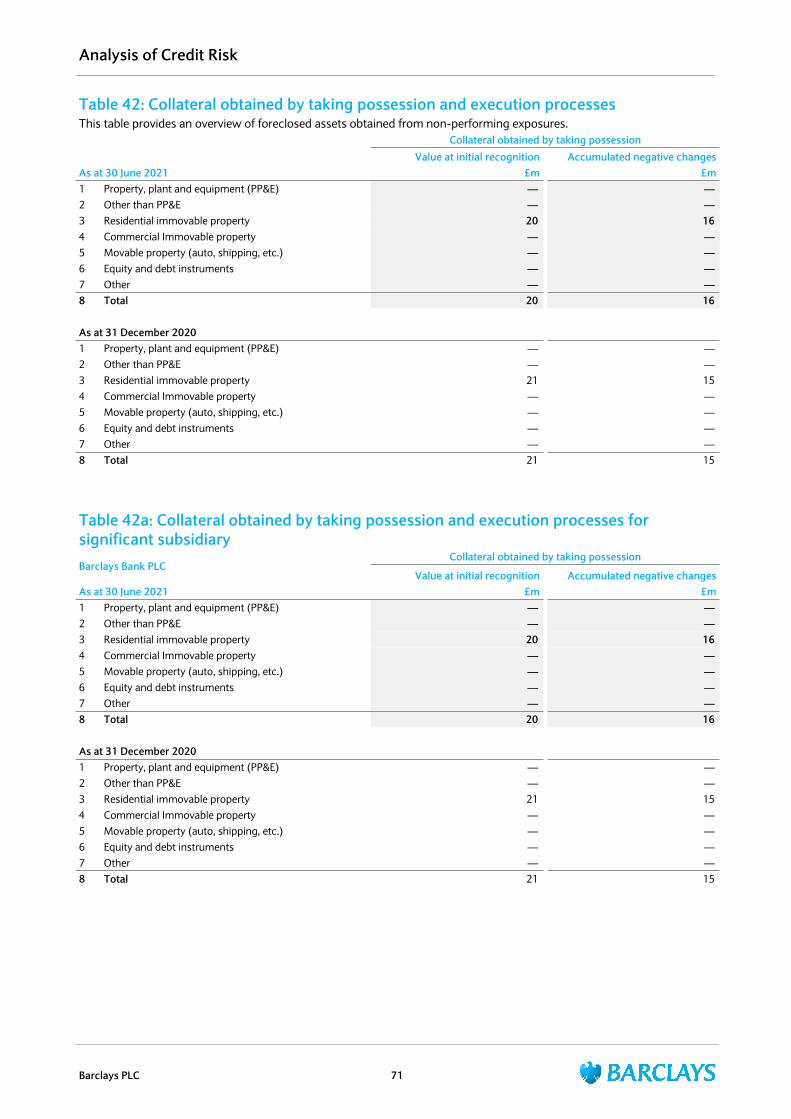
Table 42: Collateral obtained by taking possession and execution processesThis table provides an overview of foreclosed assets obtained from non-performing exposures.
Collateral obtained by taking possession
Value at initial recognition Accumulated negative changesAs at 30 June 2021 £m £m1 Property, plant and equipment (PP&E) — — 2 Other than PP&E — — 3 Residential immovable property 20 16 4 Commercial Immovable property — — 5 Movable property (auto, shipping, etc.) — — 6 Equity and debt instruments — — 7 Other — — 8 Total 20 16
As at 31 December 20201 Property, plant and equipment (PP&E) — — 2 Other than PP&E — — 3 Residential immovable property 21 15 4 Commercial Immovable property — — 5 Movable property (auto, shipping, etc.) — — 6 Equity and debt instruments — — 7 Other — — 8 Total 21 15
Table 42a: Collateral obtained by taking possession and execution processes for significant subsidiaryBarclays Bank PLC
Collateral obtained by taking possession
Value at initial recognition Accumulated negative changesAs at 30 June 2021 £m £m1 Property, plant and equipment (PP&E) — — 2 Other than PP&E — — 3 Residential immovable property 20 16 4 Commercial Immovable property — — 5 Movable property (auto, shipping, etc.) — — 6 Equity and debt instruments — — 7 Other — — 8 Total 20 16
As at 31 December 20201 Property, plant and equipment (PP&E) — — 2 Other than PP&E — — 3 Residential immovable property 21 15 4 Commercial Immovable property — — 5 Movable property (auto, shipping, etc.) — — 6 Equity and debt instruments — — 7 Other — — 8 Total 21 15
Analysis of Credit Risk
Barclays PLC 71

Table 43: CR2-B - Changes in the stock of defaulted and impaired loans and debt securitiesThis table provides an overview of the Bank’s stock of defaulted and impaired loans and debt securities.
Barclays GroupGross carrying value defaulted exposures1
£m1 As at 1 January 2021 9,3112 Loans and debt securities that have defaulted or impaired since the last
reporting period2,030
3 Returned to non-defaulted status (1,099) 4 Amounts written off (1,009) 5 Other changes2 (1,076) 10 As at 30 June 2021 8,157
1 Defaulted exposures are defined as all stage 3 impaired gross loans and debt securities under IFRS9 and any stage 1 and stage 2 gross loans and debt securities under IFRS9 more than 90 days past due.
2 Other changes include repayments and disposals net of drawdowns.
Table 44: CR2-A – Changes in the stock of general and specific credit risk adjustmentsThis table shows the movement in the impairment1 allowance the year.
Barclays Group
Accumulated specific credit risk
adjustment1
Accumulated general credit risk
adjustment
£m £m1 As at 1 January 2021 9,528 — 2 Increases due to amounts set aside for estimated loan losses during the period2 (1,076) — 3 Decreases due to amounts reversed for estimated loan losses during the period3 (1,009) — 4 Decreases due to amounts taken against accumulated credit risk adjustments — — 5 Transfers between credit risk adjustments — — 6 Impact of exchange rate differences (94) — 7 Business combinations, including acquisitions and disposals of subsidiaries — — 8 Other adjustments — — 9 As at 30 June 2021 7,349 — 10 Recoveries on credit risk adjustments recorded directly to the statement of profit or loss4 185 — 11 Specific credit risk adjustments directly recorded to the statement of profit or loss — —
1 Excludes other assets impairment of £109m.2 Increases due to amounts set aside for estimated loan losses during the period includes the net impact of changes made to parameters (such as probability
of default, exposure at default and loss given default), changes in macro-economic variables, new assets originated, repayments and drawdowns.3 Represents amounts written off.4 Recoveries include a net loss in relation to reimbursements from financial guarantee contracts held with third parties of £216m and post write off recoveries
of £31m.
Analysis of Credit Risk
Barclays PLC 72
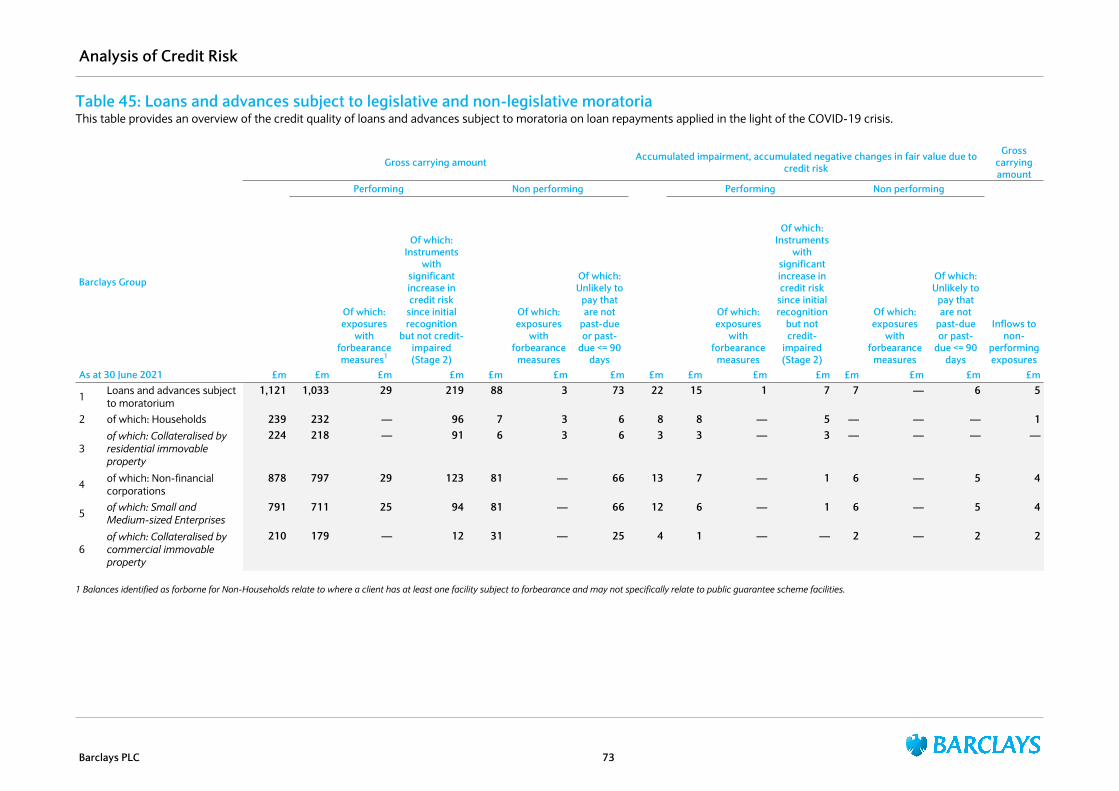
Table 45: Loans and advances subject to legislative and non-legislative moratoriaThis table provides an overview of the credit quality of loans and advances subject to moratoria on loan repayments applied in the light of the COVID-19 crisis.
Gross carrying amount Accumulated impairment, accumulated negative changes in fair value due to credit risk
Gross carrying amount
Performing Non performing Performing Non performing
Barclays Group
Of which:exposures
with forbearance measures1
Of which:Instruments
with significant increase in credit risk
since initial recognition
but not credit-impaired (Stage 2)
Of which:exposures
with forbearance
measures
Of which:Unlikely to
pay that are not
past-due or past-
due <= 90 days
Of which:exposures
with forbearance
measures
Of which:Instruments
with significant increase in credit risk
since initial recognition
but not credit-
impaired (Stage 2)
Of which:exposures
with forbearance
measures
Of which:Unlikely to
pay that are not
past-due or past-
due <= 90 days
Inflows to non-
performing exposures
As at 30 June 2021 £m £m £m £m £m £m £m £m £m £m £m £m £m £m £m
1 Loans and advances subject to moratorium
1,121 1,033 29 219 88 3 73 22 15 1 7 7 — 6 5
2 of which: Households 239 232 — 96 7 3 6 8 8 — 5 — — — 1
3of which: Collateralised by residential immovable property
224 218 — 91 6 3 6 3 3 — 3 — — — —
4 of which: Non-financial corporations
878 797 29 123 81 — 66 13 7 — 1 6 — 5 4
5 of which: Small and Medium-sized Enterprises
791 711 25 94 81 — 66 12 6 — 1 6 — 5 4
6of which: Collateralised by commercial immovable property
210 179 — 12 31 — 25 4 1 — — 2 — 2 2
1 Balances identified as forborne for Non-Households relate to where a client has at least one facility subject to forbearance and may not specifically relate to public guarantee scheme facilities.
Analysis of Credit Risk
Barclays PLC 73
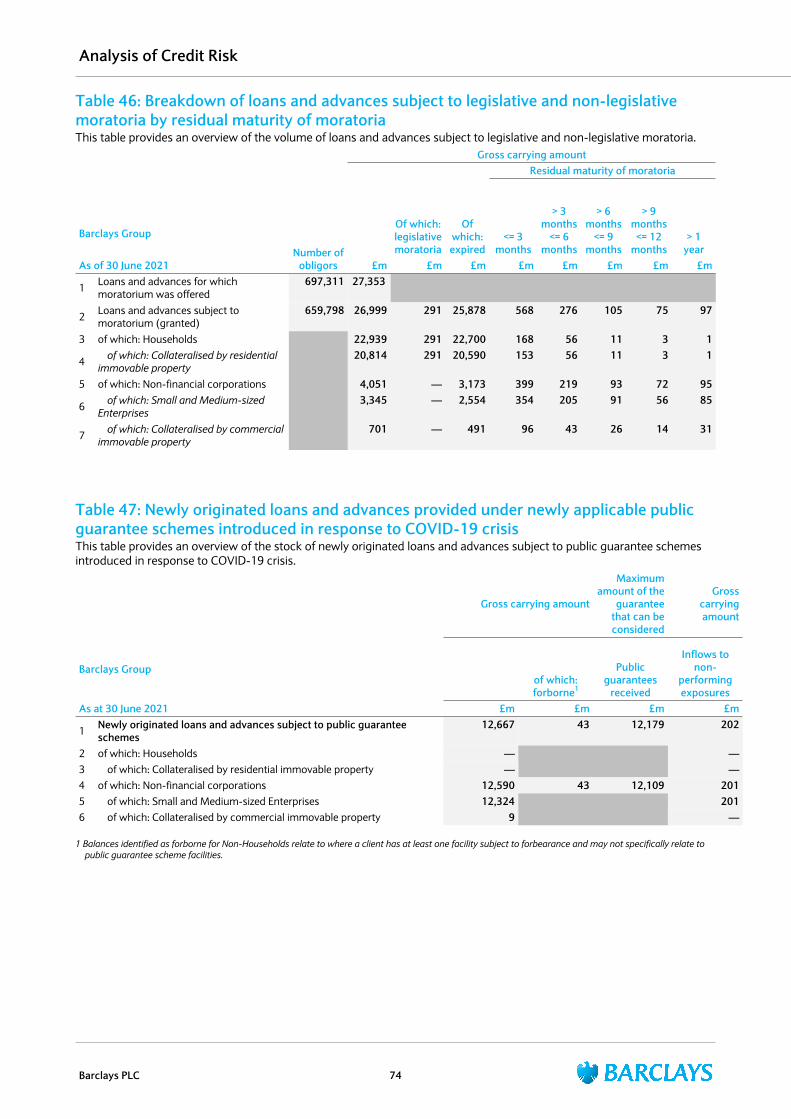
Table 46: Breakdown of loans and advances subject to legislative and non-legislative moratoria by residual maturity of moratoriaThis table provides an overview of the volume of loans and advances subject to legislative and non-legislative moratoria.
Number of obligors
Gross carrying amount
Of which: legislative moratoria
Of which: expired
Residual maturity of moratoria
<= 3 months
> 3 months
<= 6 months
> 6 months
<= 9 months
> 9 months
<= 12 months
> 1 year
Barclays Group
As of 30 June 2021 £m £m £m £m £m £m £m £m
1 Loans and advances for which moratorium was offered
697,311 27,353
2 Loans and advances subject to moratorium (granted)
659,798 26,999 291 25,878 568 276 105 75 97
3 of which: Households 22,939 291 22,700 168 56 11 3 1
4 of which: Collateralised by residential immovable property
20,814 291 20,590 153 56 11 3 1
5 of which: Non-financial corporations 4,051 — 3,173 399 219 93 72 95
6 of which: Small and Medium-sized Enterprises
3,345 — 2,554 354 205 91 56 85
7 of which: Collateralised by commercial immovable property
701 — 491 96 43 26 14 31
Table 47: Newly originated loans and advances provided under newly applicable public guarantee schemes introduced in response to COVID-19 crisisThis table provides an overview of the stock of newly originated loans and advances subject to public guarantee schemes introduced in response to COVID-19 crisis.
Gross carrying amount
Maximum amount of the
guarantee that can be considered
Gross carrying amount
Barclays Groupof which: forborne1
Public guarantees
received
Inflows to non-
performing exposures
As at 30 June 2021 £m £m £m £m
1 Newly originated loans and advances subject to public guarantee schemes
12,667 43 12,179 202
2 of which: Households — —3 of which: Collateralised by residential immovable property — —4 of which: Non-financial corporations 12,590 43 12,109 2015 of which: Small and Medium-sized Enterprises 12,324 2016 of which: Collateralised by commercial immovable property 9 —
1 Balances identified as forborne for Non-Households relate to where a client has at least one facility subject to forbearance and may not specifically relate to public guarantee scheme facilities.
Analysis of Credit Risk
Barclays PLC 74

Counterparty risk exposuresThis table summarises exposure at default, risk weighted assets and capital requirements for counterparty credit risk. This disclosure excludes CVA which is shown on table 59.
Table 48: Detailed view of counterparty credit risk RWAs and capital requirements
Barclays Group
As at 30 June 2021 As at 31 December 2020
EAD RWACapital
requirements EAD RWACapital
requirements£m £m £m £m £m £m
Standardised approachCentral governments or central banks 3,024 3 — 3,675 4 — Regional governments or local authorities 1,556 — — 2,606 2 — Public sector entities 978 103 8 1,225 145 12 Multilateral development banks 221 2 — 296 1 — International organisations 130 — — 182 — — Institutions 28,255 1,101 88 24,104 993 79 Corporates 13,807 13,709 1,097 10,425 10,500 840 Retail — — — — — — Secured by mortgages — — — — — — Exposures in default 1 2 — — — — Items associated with high risks — — — — — — Covered bonds — — — — — — Securitisation positions 84 79 6 119 102 8 Collective investment undertakings — — — — — — Equity positions — — — — — — Other items — — — — — — Total standardised approach credit risk exposure 48,056 14,999 1,199 42,632 11,747 939 Advanced IRB approach — — — — — — Central governments or central banks 5,371 734 59 7,144 763 61 Institutions 20,888 5,030 402 22,281 5,184 415 Corporates 53,620 13,249 1,062 51,875 14,377 1,150 Retail — — — — — — – Small and medium-sized enterprises (SMEs) — — — — — — – Secured by real estate collateral — — — — — — – Qualifying revolving retail — — — — — — – Other retail — — — — — — Equity — — — — — — Securitisation positions — — — — — — Non-credit obligation assets — — — — — — Total advanced IRB credit risk exposure 79,879 19,013 1,523 81,300 20,324 1,626 Default fund contributions 2,318 1,040 83 2,113 1,115 89 Total Counterparty credit risk weighted assets 130,253 35,052 2,805 126,045 33,186 2,654
Counterparty credit risk exposure post-CRM and RWAs increased £4.2bn to £130.3bn and £1.9bn to £35.1bn respectively, primarily due to increased SFT trading activity.
Analysis of Counterparty Credit Risk
Barclays PLC 75
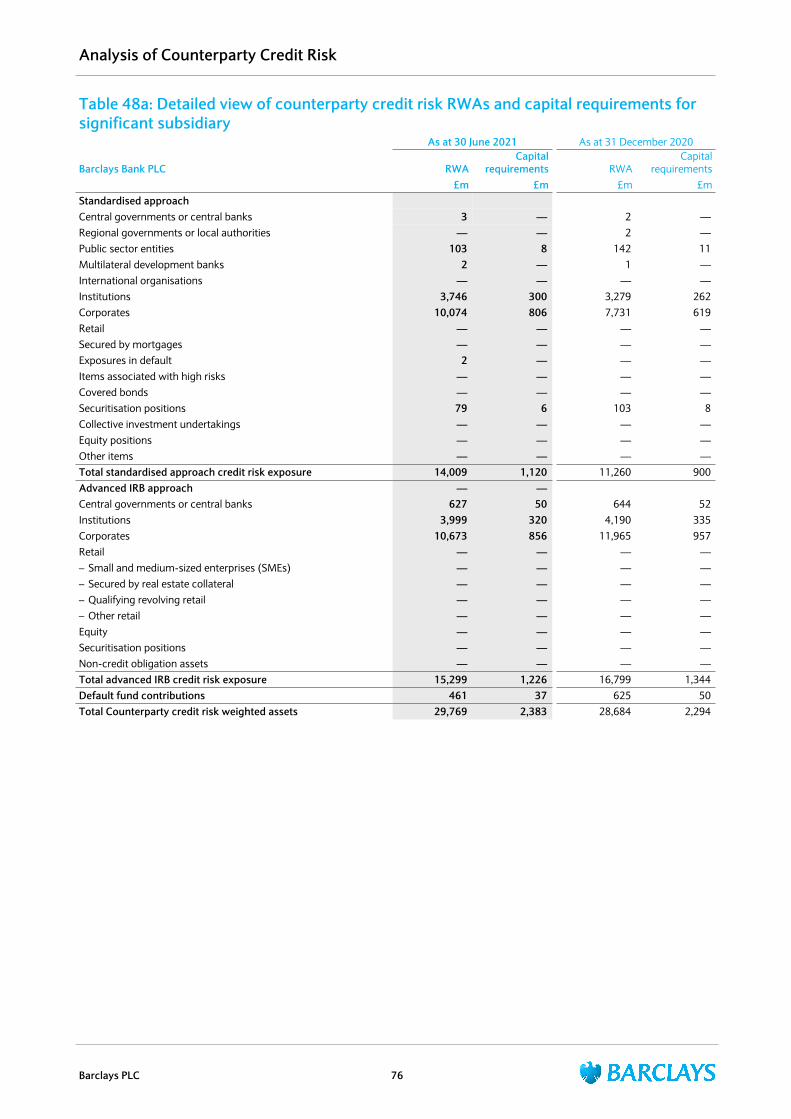
Table 48a: Detailed view of counterparty credit risk RWAs and capital requirements for significant subsidiary
As at 30 June 2021 As at 31 December 2020
Barclays Bank PLC RWACapital
requirements RWACapital
requirements£m £m £m £m
Standardised approachCentral governments or central banks 3 — 2 — Regional governments or local authorities — — 2 — Public sector entities 103 8 142 11 Multilateral development banks 2 — 1 — International organisations — — — — Institutions 3,746 300 3,279 262 Corporates 10,074 806 7,731 619 Retail — — — — Secured by mortgages — — — — Exposures in default 2 — — — Items associated with high risks — — — — Covered bonds — — — — Securitisation positions 79 6 103 8 Collective investment undertakings — — — — Equity positions — — — — Other items — — — — Total standardised approach credit risk exposure 14,009 1,120 11,260 900 Advanced IRB approach — — Central governments or central banks 627 50 644 52 Institutions 3,999 320 4,190 335 Corporates 10,673 856 11,965 957 Retail — — — — – Small and medium-sized enterprises (SMEs) — — — — – Secured by real estate collateral — — — — – Qualifying revolving retail — — — — – Other retail — — — — Equity — — — — Securitisation positions — — — — Non-credit obligation assets — — — — Total advanced IRB credit risk exposure 15,299 1,226 16,799 1,344 Default fund contributions 461 37 625 50 Total Counterparty credit risk weighted assets 29,769 2,383 28,684 2,294
Analysis of Counterparty Credit Risk
Barclays PLC 76

Table 49: CCR1 – Analysis of CCR exposure by approachThis table excludes default fund contribution and as such cannot be directly reconciled to Table 48.
Barclays Group
Notional
Replacement cost/current
market value
Potential future credit
exposure EEPE MultiplierEAD post
CRM RWAsAs at 30 June 2021 £m £m £m £m £m £m1 Mark to market 3,132 24,329 11,223 2,567 2 Original exposure — — — 3 Standardised approach — — — 4 IMM (for derivatives and SFTs) 72,598 1.4 101,637 25,143 5 Of which securities financing
transactions 26,306 1.4 36,829 4,995
6 Of which derivatives and long settlement transactions
46,292 1.4 64,808 20,148
7 Of which from contractual cross-product netting
— — —
8 Financial collateral simple method (for SFTs)
— —
9 Financial collateral comprehensive method (for SFTs)
15,075 6,302
10 VaR for SFTs — — 11 Total 34,012
As at 31 December 20201 Mark to market 2,633 19,512 9,574 2,219 2 Original exposure — — — 3 Standardised approach — — — 4 IMM (for derivatives and SFTs) 72,284 1.4 101,196 25,582 5 Of which securities financing
transactions 25,429 1.4 35,600 4,388
6 Of which derivatives and long settlement transactions
46,855 1.4 65,596 21,194
7 Of which from contractual cross-product netting
— — —
8 Financial collateral simple method (for SFTs)
— —
9 Financial collateral comprehensive method (for SFTs)
13,162 4,270
10 VaR for SFTs — — 11 Total 32,071
Counterparty Credit Risk RWAs increased by £1.9bn to £34.0bn primarily driven by SFT trading activity subject to FCCM.
Analysis of Counterparty Credit Risk
Barclays PLC 77
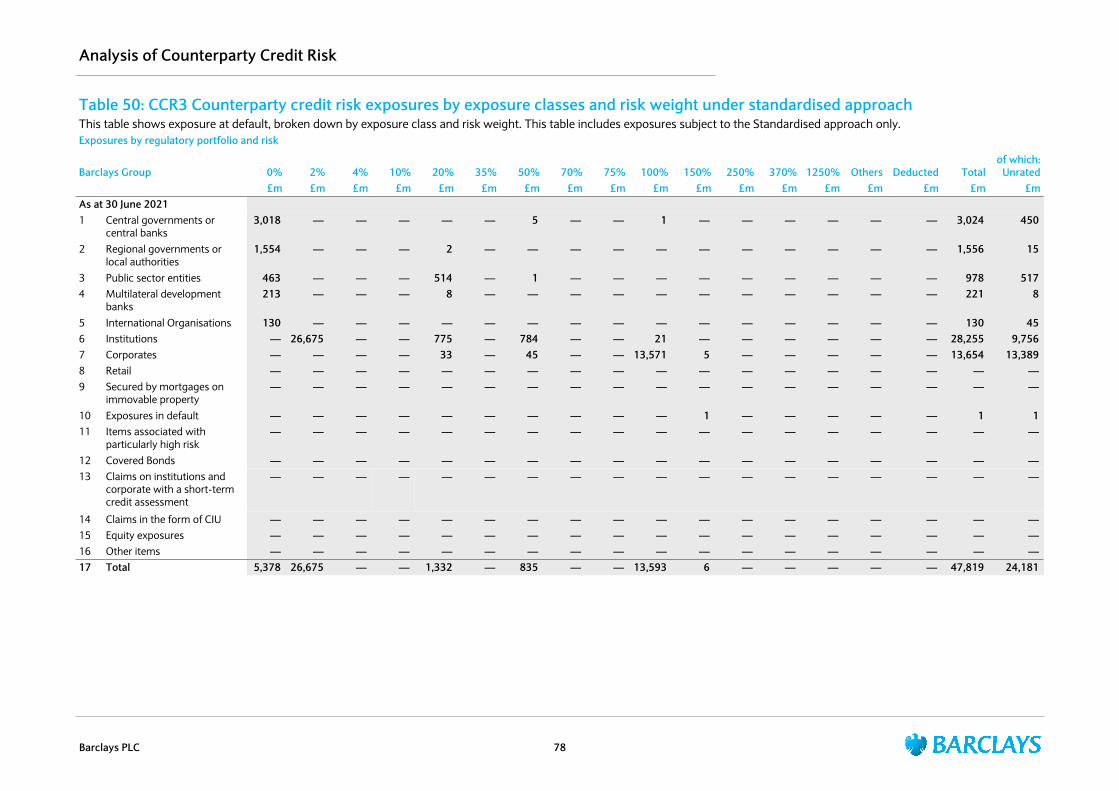
Table 50: CCR3 Counterparty credit risk exposures by exposure classes and risk weight under standardised approachThis table shows exposure at default, broken down by exposure class and risk weight. This table includes exposures subject to the Standardised approach only.Exposures by regulatory portfolio and risk
Barclays Group 0% 2% 4% 10% 20% 35% 50% 70% 75% 100% 150% 250% 370% 1250% Others Deducted Totalof which:
Unrated£m £m £m £m £m £m £m £m £m £m £m £m £m £m £m £m £m £m
As at 30 June 20211 Central governments or
central banks 3,018 — — — — — 5 — — 1 — — — — — — 3,024 450
2 Regional governments or local authorities
1,554 — — — 2 — — — — — — — — — — — 1,556 15
3 Public sector entities 463 — — — 514 — 1 — — — — — — — — — 978 517 4 Multilateral development
banks 213 — — — 8 — — — — — — — — — — — 221 8
5 International Organisations 130 — — — — — — — — — — — — — — — 130 45 6 Institutions — 26,675 — — 775 — 784 — — 21 — — — — — — 28,255 9,756 7 Corporates — — — — 33 — 45 — — 13,571 5 — — — — — 13,654 13,389 8 Retail — — — — — — — — — — — — — — — — — — 9 Secured by mortgages on
immovable property — — — — — — — — — — — — — — — — — —
10 Exposures in default — — — — — — — — — — 1 — — — — — 1 1 11 Items associated with
particularly high risk — — — — — — — — — — — — — — — — — —
12 Covered Bonds — — — — — — — — — — — — — — — — — — 13 Claims on institutions and
corporate with a short-term credit assessment
— — — — — — — — — — — — — — — — — —
14 Claims in the form of CIU — — — — — — — — — — — — — — — — — — 15 Equity exposures — — — — — — — — — — — — — — — — — — 16 Other items — — — — — — — — — — — — — — — — — — 17 Total 5,378 26,675 — — 1,332 — 835 — — 13,593 6 — — — — — 47,819 24,181
Analysis of Counterparty Credit Risk
Barclays PLC 78

Table 50: CCR3 Counterparty credit risk exposures by exposure classes and risk weight under standardised approach - continuedExposures by regulatory portfolio and risk
Barclays Group 0% 2% 4% 10% 20% 35% 50% 70% 75% 100% 150% 250% 370% 1250% Others Deducted Total
of which:
Unrated£m £m £m £m £m £m £m £m £m £m £m £m £m £m £m £m £m £m
As at 31 December 20201 Central governments or
central banks 3,669 — — — — — 3 — — 3 — — — — — — 3,675 358
2 Regional governments or local authorities
2,602 — — — 2 — — — — 2 — — — — — — 2,606 180
3 Public sector entities 502 — — — 722 — 1 — — — — — — — — — 1,225 1,220 4 Multilateral development
banks 293 — — — 3 — — — — — — — — — — — 296 3
5 International Organisations 182 — — — — — — — — — — — — — — — 182 88 6 Institutions — 22,648 — — 651 — 788 — — 17 — — — — — — 24,104 8,630 7 Corporates — — — — 27 — 19 — — 10,234 4 — — — — — 10,284 10,222 8 Retail — — — — — — — — — — — — — — — — — — 9 Secured by mortgages on
immovable property — — — — — — — — — — — — — — — — — —
10 Exposures in default — — — — — — — — — — — — — — — — — — 11 Items associated with
particularly high risk — — — — — — — — — — — — — — — — — —
12 Covered Bonds — — — — — — — — — — — — — — — — — — 13 Claims on institutions and
corporate with a short-term credit assessment
— — — — — — — — — — — — — — — — — —
14 Claims in the form of CIU — — — — — — — — — — — — — — — — — — 15 Equity exposures — — — — — — — — — — — — — — — — — — 16 Other items — — — — — — — — — — — — — — — — — — 17 Total 7,248 22,648 — — 1,405 — 811 — — 10,256 4 — — — — — 42,372 20,701
Counterparty credit risk EAD increased by £5.4bn to £47.8bn primarily driven by an increase in trading activity and increase in exposure to central clearing counterparties
Analysis of Counterparty Credit Risk
Barclays PLC 79
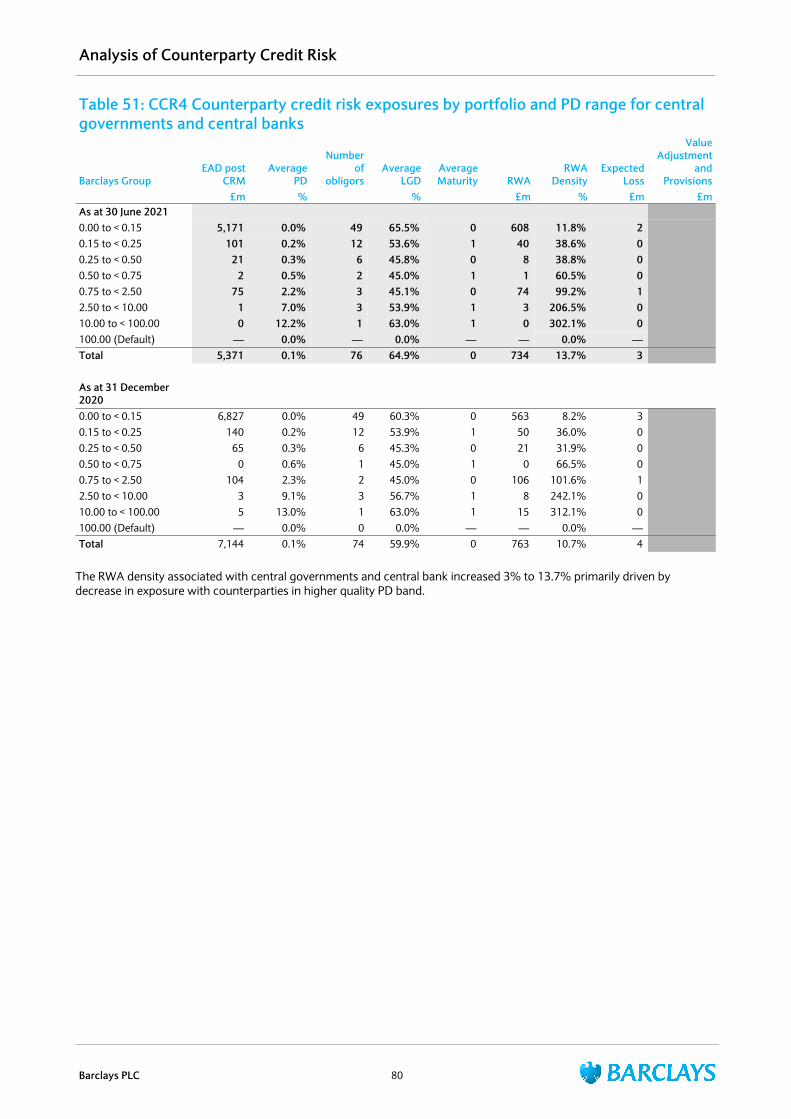
Table 51: CCR4 Counterparty credit risk exposures by portfolio and PD range for central governments and central banks
Barclays GroupEAD post
CRMAverage
PD
Number of
obligorsAverage
LGDAverage Maturity RWA
RWA Density
Expected Loss
Value Adjustment
and Provisions
£m % % £m % £m £mAs at 30 June 20210.00 to < 0.15 5,171 0.0% 49 65.5% 0 608 11.8% 2 0.15 to < 0.25 101 0.2% 12 53.6% 1 40 38.6% 0 0.25 to < 0.50 21 0.3% 6 45.8% 0 8 38.8% 0 0.50 to < 0.75 2 0.5% 2 45.0% 1 1 60.5% 0 0.75 to < 2.50 75 2.2% 3 45.1% 0 74 99.2% 1 2.50 to < 10.00 1 7.0% 3 53.9% 1 3 206.5% 0 10.00 to < 100.00 0 12.2% 1 63.0% 1 0 302.1% 0 100.00 (Default) — 0.0% — 0.0% — — 0.0% — Total 5,371 0.1% 76 64.9% 0 734 13.7% 3
As at 31 December 20200.00 to < 0.15 6,827 0.0% 49 60.3% 0 563 8.2% 3 0.15 to < 0.25 140 0.2% 12 53.9% 1 50 36.0% 0 0.25 to < 0.50 65 0.3% 6 45.3% 0 21 31.9% 0 0.50 to < 0.75 0 0.6% 1 45.0% 1 0 66.5% 0 0.75 to < 2.50 104 2.3% 2 45.0% 0 106 101.6% 1 2.50 to < 10.00 3 9.1% 3 56.7% 1 8 242.1% 0 10.00 to < 100.00 5 13.0% 1 63.0% 1 15 312.1% 0 100.00 (Default) — 0.0% 0 0.0% — — 0.0% — Total 7,144 0.1% 74 59.9% 0 763 10.7% 4
The RWA density associated with central governments and central bank increased 3% to 13.7% primarily driven by decrease in exposure with counterparties in higher quality PD band.
Analysis of Counterparty Credit Risk
Barclays PLC 80
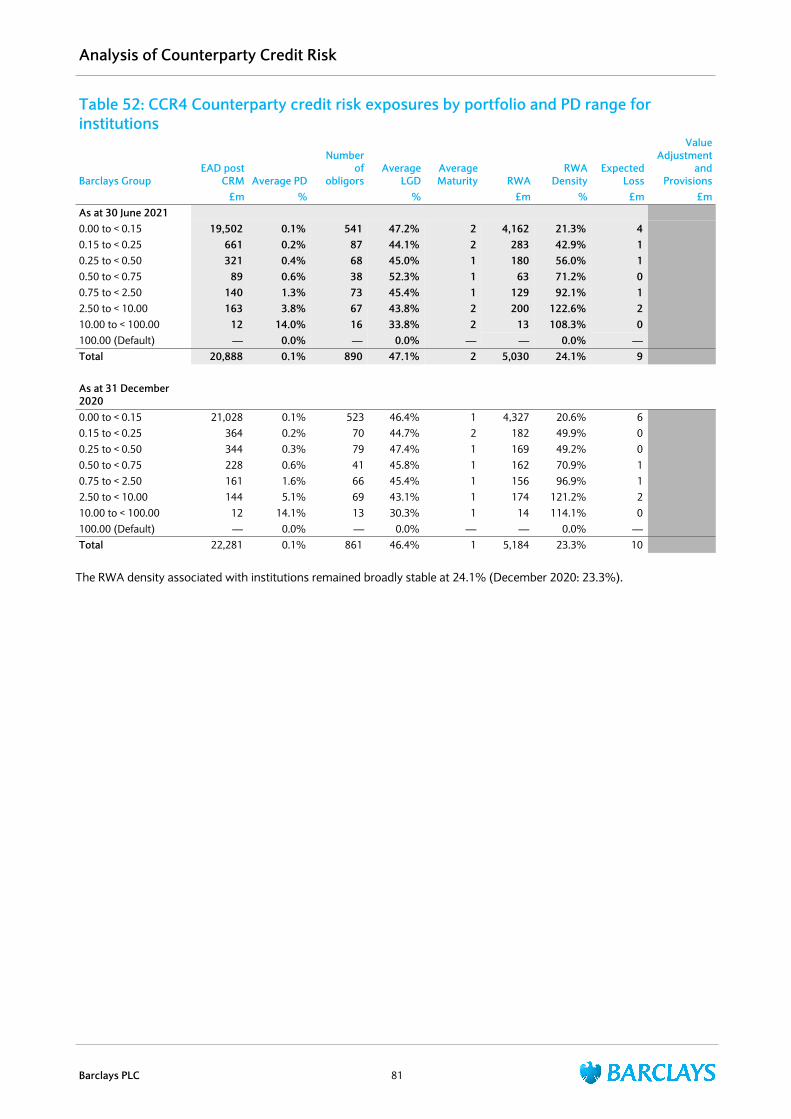
Table 52: CCR4 Counterparty credit risk exposures by portfolio and PD range for institutions
Barclays GroupEAD post
CRM Average PD
Number of
obligorsAverage
LGDAverage Maturity RWA
RWA Density
Expected Loss
Value Adjustment
and Provisions
£m % % £m % £m £mAs at 30 June 20210.00 to < 0.15 19,502 0.1% 541 47.2% 2 4,162 21.3% 4 0.15 to < 0.25 661 0.2% 87 44.1% 2 283 42.9% 1 0.25 to < 0.50 321 0.4% 68 45.0% 1 180 56.0% 1 0.50 to < 0.75 89 0.6% 38 52.3% 1 63 71.2% 0 0.75 to < 2.50 140 1.3% 73 45.4% 1 129 92.1% 1 2.50 to < 10.00 163 3.8% 67 43.8% 2 200 122.6% 2 10.00 to < 100.00 12 14.0% 16 33.8% 2 13 108.3% 0 100.00 (Default) — 0.0% — 0.0% — — 0.0% — Total 20,888 0.1% 890 47.1% 2 5,030 24.1% 9
As at 31 December 20200.00 to < 0.15 21,028 0.1% 523 46.4% 1 4,327 20.6% 6 0.15 to < 0.25 364 0.2% 70 44.7% 2 182 49.9% 0 0.25 to < 0.50 344 0.3% 79 47.4% 1 169 49.2% 0 0.50 to < 0.75 228 0.6% 41 45.8% 1 162 70.9% 1 0.75 to < 2.50 161 1.6% 66 45.4% 1 156 96.9% 1 2.50 to < 10.00 144 5.1% 69 43.1% 1 174 121.2% 2 10.00 to < 100.00 12 14.1% 13 30.3% 1 14 114.1% 0 100.00 (Default) — 0.0% — 0.0% — — 0.0% — Total 22,281 0.1% 861 46.4% 1 5,184 23.3% 10
The RWA density associated with institutions remained broadly stable at 24.1% (December 2020: 23.3%).
Analysis of Counterparty Credit Risk
Barclays PLC 81
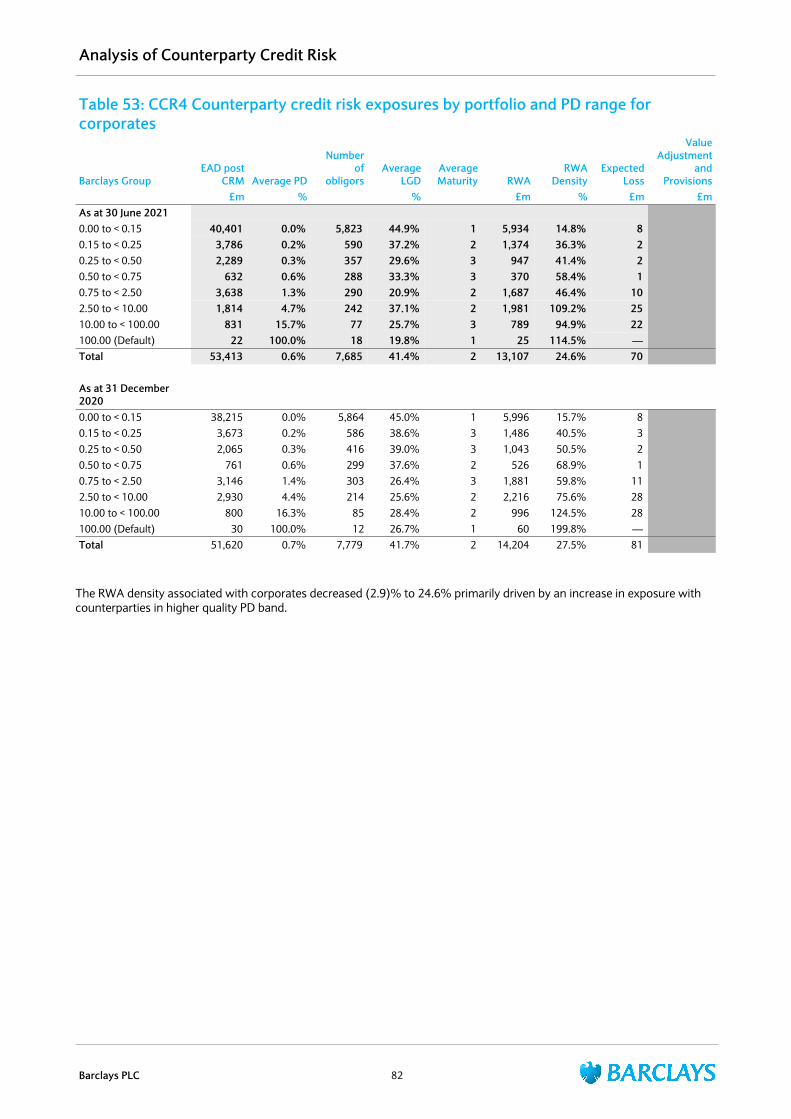
Table 53: CCR4 Counterparty credit risk exposures by portfolio and PD range for corporates
Barclays GroupEAD post
CRM Average PD
Number of
obligorsAverage
LGDAverage Maturity RWA
RWA Density
Expected Loss
Value Adjustment
and Provisions
£m % % £m % £m £mAs at 30 June 20210.00 to < 0.15 40,401 0.0% 5,823 44.9% 1 5,934 14.8% 8 0.15 to < 0.25 3,786 0.2% 590 37.2% 2 1,374 36.3% 2 0.25 to < 0.50 2,289 0.3% 357 29.6% 3 947 41.4% 2 0.50 to < 0.75 632 0.6% 288 33.3% 3 370 58.4% 1 0.75 to < 2.50 3,638 1.3% 290 20.9% 2 1,687 46.4% 10 2.50 to < 10.00 1,814 4.7% 242 37.1% 2 1,981 109.2% 25 10.00 to < 100.00 831 15.7% 77 25.7% 3 789 94.9% 22 100.00 (Default) 22 100.0% 18 19.8% 1 25 114.5% — Total 53,413 0.6% 7,685 41.4% 2 13,107 24.6% 70
As at 31 December 20200.00 to < 0.15 38,215 0.0% 5,864 45.0% 1 5,996 15.7% 8 0.15 to < 0.25 3,673 0.2% 586 38.6% 3 1,486 40.5% 3 0.25 to < 0.50 2,065 0.3% 416 39.0% 3 1,043 50.5% 2 0.50 to < 0.75 761 0.6% 299 37.6% 2 526 68.9% 1 0.75 to < 2.50 3,146 1.4% 303 26.4% 3 1,881 59.8% 11 2.50 to < 10.00 2,930 4.4% 214 25.6% 2 2,216 75.6% 28 10.00 to < 100.00 800 16.3% 85 28.4% 2 996 124.5% 28 100.00 (Default) 30 100.0% 12 26.7% 1 60 199.8% — Total 51,620 0.7% 7,779 41.7% 2 14,204 27.5% 81
The RWA density associated with corporates decreased (2.9)% to 24.6% primarily driven by an increase in exposure with counterparties in higher quality PD band.
Analysis of Counterparty Credit Risk
Barclays PLC 82
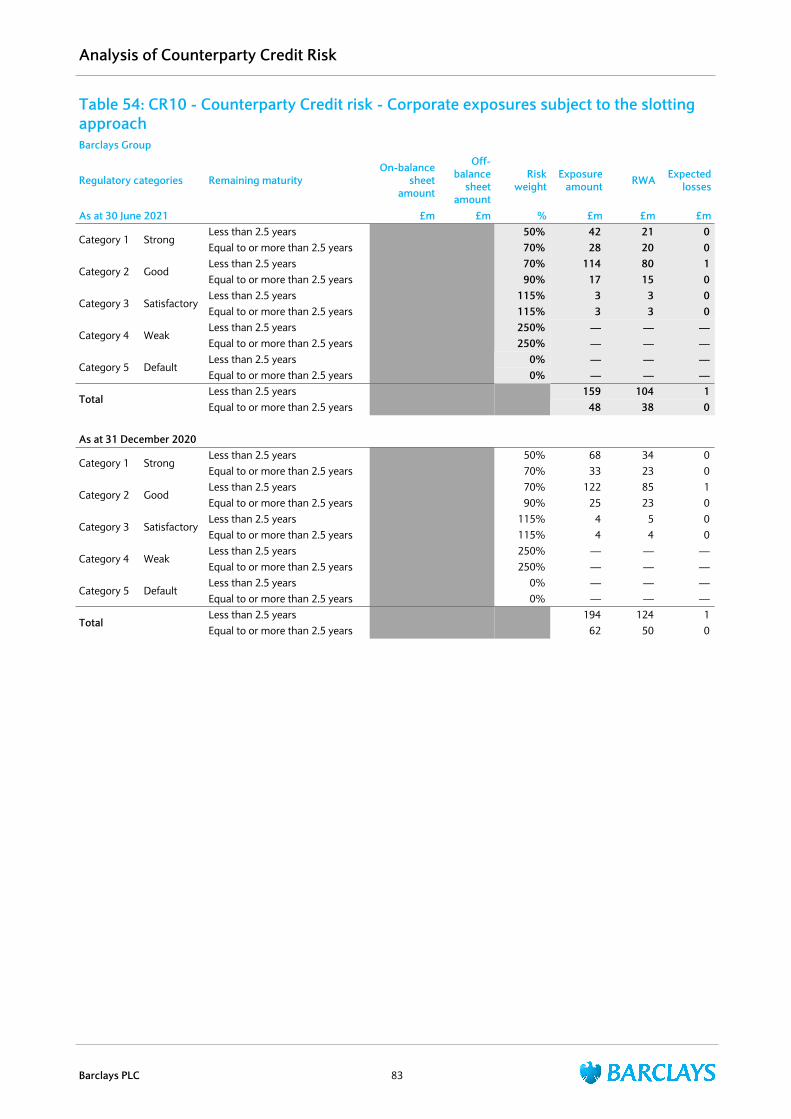
Table 54: CR10 - Counterparty Credit risk - Corporate exposures subject to the slotting approachBarclays Group
Regulatory categories Remaining maturityOn-balance
sheet amount
Off-balance
sheet amount
Risk weight
Exposure amount RWA Expected
losses
As at 30 June 2021 £m £m % £m £m £m
Category 1 StrongLess than 2.5 years 50% 42 21 0 Equal to or more than 2.5 years 70% 28 20 0
Category 2 GoodLess than 2.5 years 70% 114 80 1 Equal to or more than 2.5 years 90% 17 15 0
Category 3 SatisfactoryLess than 2.5 years 115% 3 3 0 Equal to or more than 2.5 years 115% 3 3 0
Category 4 WeakLess than 2.5 years 250% — — — Equal to or more than 2.5 years 250% — — —
Category 5 DefaultLess than 2.5 years 0% — — — Equal to or more than 2.5 years 0% — — —
TotalLess than 2.5 years 159 104 1 Equal to or more than 2.5 years 48 38 0
As at 31 December 2020
Category 1 StrongLess than 2.5 years 50% 68 34 0 Equal to or more than 2.5 years 70% 33 23 0
Category 2 GoodLess than 2.5 years 70% 122 85 1 Equal to or more than 2.5 years 90% 25 23 0
Category 3 SatisfactoryLess than 2.5 years 115% 4 5 0 Equal to or more than 2.5 years 115% 4 4 0
Category 4 WeakLess than 2.5 years 250% — — — Equal to or more than 2.5 years 250% — — —
Category 5 DefaultLess than 2.5 years 0% — — — Equal to or more than 2.5 years 0% — — —
TotalLess than 2.5 years 194 124 1 Equal to or more than 2.5 years 62 50 0
Analysis of Counterparty Credit Risk
Barclays PLC 83
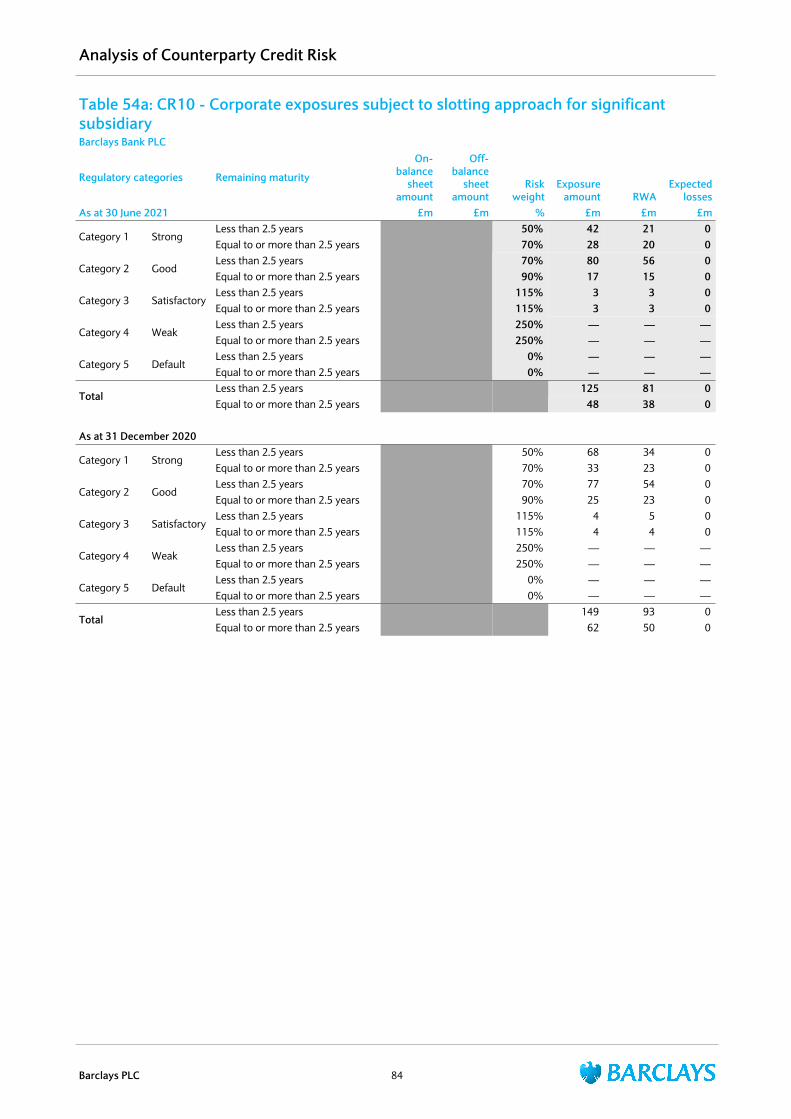
Table 54a: CR10 - Corporate exposures subject to slotting approach for significant subsidiaryBarclays Bank PLC
Regulatory categories Remaining maturity
On-balance
sheet amount
Off-balance
sheet amount
Risk weight
Exposure amount RWA
Expected losses
As at 30 June 2021 £m £m % £m £m £m
Category 1 StrongLess than 2.5 years 50% 42 21 0 Equal to or more than 2.5 years 70% 28 20 0
Category 2 GoodLess than 2.5 years 70% 80 56 0 Equal to or more than 2.5 years 90% 17 15 0
Category 3 SatisfactoryLess than 2.5 years 115% 3 3 0 Equal to or more than 2.5 years 115% 3 3 0
Category 4 WeakLess than 2.5 years 250% — — — Equal to or more than 2.5 years 250% — — —
Category 5 DefaultLess than 2.5 years 0% — — — Equal to or more than 2.5 years 0% — — —
TotalLess than 2.5 years 125 81 0 Equal to or more than 2.5 years 48 38 0
As at 31 December 2020
Category 1 StrongLess than 2.5 years 50% 68 34 0 Equal to or more than 2.5 years 70% 33 23 0
Category 2 GoodLess than 2.5 years 70% 77 54 0 Equal to or more than 2.5 years 90% 25 23 0
Category 3 SatisfactoryLess than 2.5 years 115% 4 5 0 Equal to or more than 2.5 years 115% 4 4 0
Category 4 WeakLess than 2.5 years 250% — — — Equal to or more than 2.5 years 250% — — —
Category 5 DefaultLess than 2.5 years 0% — — — Equal to or more than 2.5 years 0% — — —
TotalLess than 2.5 years 149 93 0 Equal to or more than 2.5 years 62 50 0
Analysis of Counterparty Credit Risk
Barclays PLC 84
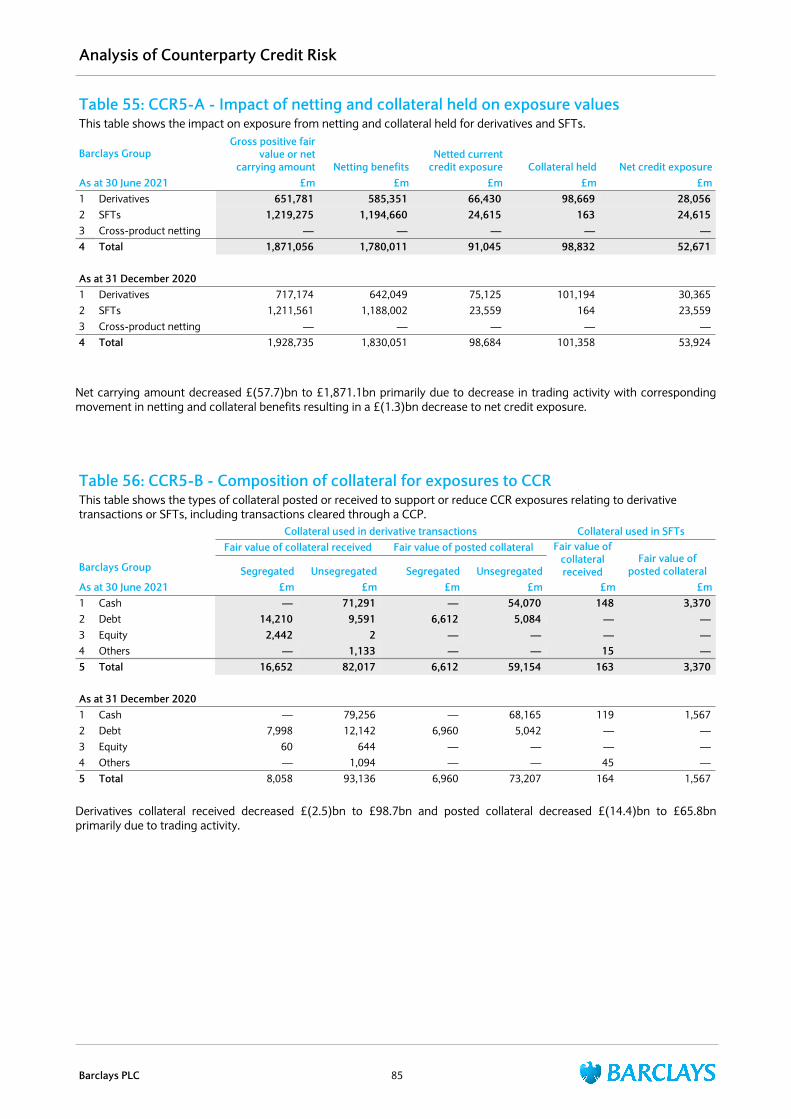
Table 55: CCR5-A - Impact of netting and collateral held on exposure valuesThis table shows the impact on exposure from netting and collateral held for derivatives and SFTs.
Barclays GroupGross positive fair
value or net carrying amount Netting benefits
Netted current credit exposure Collateral held Net credit exposure
As at 30 June 2021 £m £m £m £m £m1 Derivatives 651,781 585,351 66,430 98,669 28,056 2 SFTs 1,219,275 1,194,660 24,615 163 24,615 3 Cross-product netting — — — — — 4 Total 1,871,056 1,780,011 91,045 98,832 52,671
As at 31 December 20201 Derivatives 717,174 642,049 75,125 101,194 30,365 2 SFTs 1,211,561 1,188,002 23,559 164 23,559 3 Cross-product netting — — — — — 4 Total 1,928,735 1,830,051 98,684 101,358 53,924
Net carrying amount decreased £(57.7)bn to £1,871.1bn primarily due to decrease in trading activity with corresponding movement in netting and collateral benefits resulting in a £(1.3)bn decrease to net credit exposure.
Table 56: CCR5-B - Composition of collateral for exposures to CCRThis table shows the types of collateral posted or received to support or reduce CCR exposures relating to derivative transactions or SFTs, including transactions cleared through a CCP.
Collateral used in derivative transactions Collateral used in SFTsFair value of collateral received Fair value of posted collateral Fair value of
collateral received
Fair value of posted collateralBarclays Group Segregated Unsegregated Segregated Unsegregated
As at 30 June 2021 £m £m £m £m £m £m1 Cash — 71,291 — 54,070 148 3,370 2 Debt 14,210 9,591 6,612 5,084 — — 3 Equity 2,442 2 — — — — 4 Others — 1,133 — — 15 — 5 Total 16,652 82,017 6,612 59,154 163 3,370
As at 31 December 20201 Cash — 79,256 — 68,165 119 1,567 2 Debt 7,998 12,142 6,960 5,042 — — 3 Equity 60 644 — — — — 4 Others — 1,094 — — 45 — 5 Total 8,058 93,136 6,960 73,207 164 1,567
Derivatives collateral received decreased £(2.5)bn to £98.7bn and posted collateral decreased £(14.4)bn to £65.8bn primarily due to trading activity.
Analysis of Counterparty Credit Risk
Barclays PLC 85
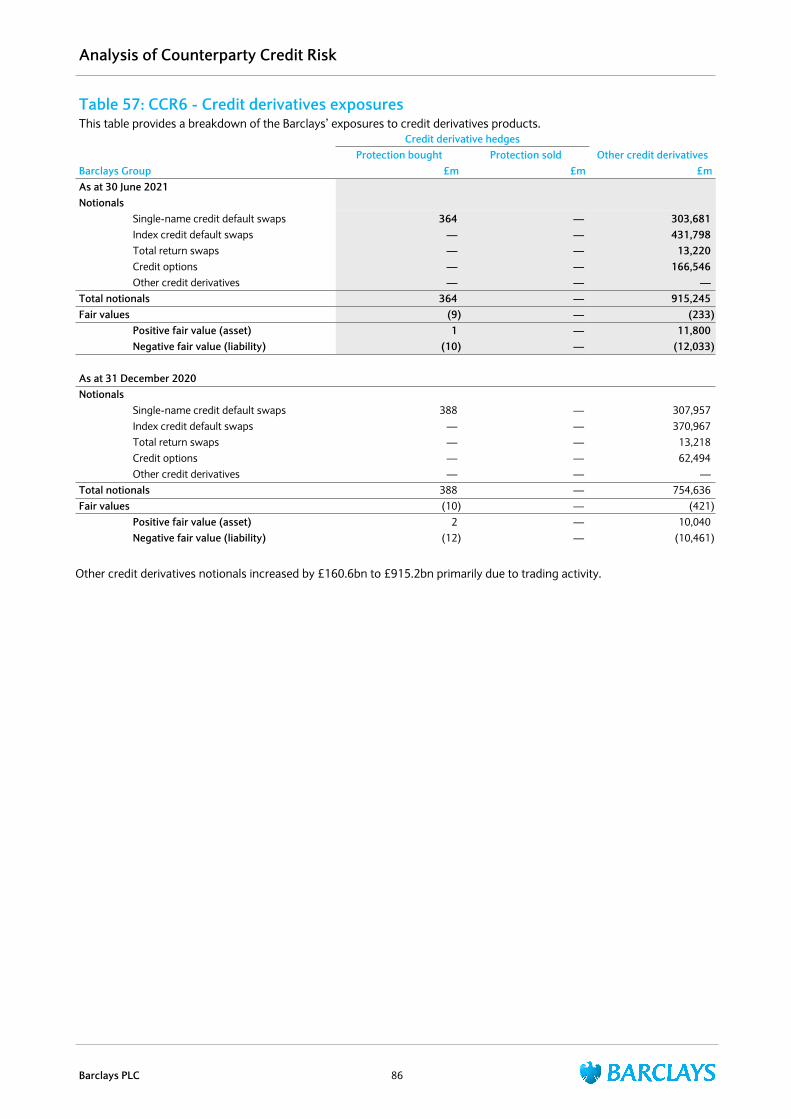
Table 57: CCR6 - Credit derivatives exposuresThis table provides a breakdown of the Barclays’ exposures to credit derivatives products.
Credit derivative hedgesOther credit derivativesProtection bought Protection sold
Barclays Group £m £m £mAs at 30 June 2021Notionals
Single-name credit default swaps 364 — 303,681 Index credit default swaps — — 431,798 Total return swaps — — 13,220 Credit options — — 166,546 Other credit derivatives — — —
Total notionals 364 — 915,245 Fair values (9) — (233)
Positive fair value (asset) 1 — 11,800 Negative fair value (liability) (10) — (12,033)
As at 31 December 2020Notionals
Single-name credit default swaps 388 — 307,957 Index credit default swaps — — 370,967 Total return swaps — — 13,218 Credit options — — 62,494 Other credit derivatives — — —
Total notionals 388 — 754,636 Fair values (10) — (421)
Positive fair value (asset) 2 — 10,040 Negative fair value (liability) (12) — (10,461)
Other credit derivatives notionals increased by £160.6bn to £915.2bn primarily due to trading activity.
Analysis of Counterparty Credit Risk
Barclays PLC 86

Table 58: CCR8 Exposures to Central Counterparties (CCPs)This table provides a breakdown of Barclays’ exposures and RWAs to qualifying CCPs.
As at 30 June 2021 As at 31 December 2020EAD post CRM RWAs EAD post CRM RWAs
Barclays Group £m £m £m £m1 Exposures to QCCPs (total) 1,573 1,568 2 Exposures for trades at QCCPs (excluding initial margin
and default fund contributions); of which 15,029 300 9,181 184
3 (i) OTC derivatives 3,375 67 2,343 47 4 (ii) Exchange-traded derivatives 8,161 163 5,361 107 5 (iii) SFTs 3,493 70 1,477 30 6 (iv) Netting sets where cross-product netting
has been approved — — — —
7 Segregated initial margin 1,494 1,633 8 Non-segregated initial margin 11,646 233 13,468 269 9 Prefunded default fund contributions 2,318 1,040 2,113 1,115 10 Alternative calculation of own funds requirements for
exposures — —
11 Exposures to non-QCCPs (total) — — 12 Exposures for trades at non-QCCPs (excluding initial
margin and default fund contributions); of which — — — —
13 (i) OTC derivatives — — — — 14 (ii) Exchange-traded derivatives — — — — 15 (iii) SFTs — — — — 16 (iv) Netting sets where cross-product netting
has been approved — — — —
17 Segregated initial margin — — 18 Non-segregated initial margin — — — — 19 Prefunded default fund contributions — — — — 20 Unfunded default fund contributions — — — —
EAD post CRM for Exposures for trades at QCCPs increased by £5.8bn to £15.0bn primarily due to trading activity in exchange traded derivatives and SFTs.
Analysis of Counterparty Credit Risk
Barclays PLC 87

Credit valuation adjustments
The CVA measures the risk from MTM losses due to deterioration in the credit quality of a counterparty to over-the-counter derivative transactions with Barclays. It is a complement to the counterparty credit risk charge, that accounts for the risk of outright default of a counterparty.
Table 59: CCR2 Credit valuation adjustment (CVA) capital charge
Barclays GroupExposure value RWA
£m £mAs at 30 June 20211 Total portfolios subject to the Advanced Method 17,023 2,540 2 (i) VaR component (including the 3x multiplier) 481 3 (ii) Stressed VaR component (including 3x multiplier) 2,059 4 All portfolios subject to the Standardised Method 917 320 EU4 Based on original exposure method — — 5 Total subject to the CVA capital charge 17,940 2,860
As at 31 December 20201 Total portfolios subject to the Advanced Method 16,455 2,171 2 (i) VaR component (including the 3x multiplier) 706 3 (ii) Stressed VaR component (including 3x multiplier) 1,465 4 All portfolios subject to the Standardised Method 832 347 EU4 Based on original exposure method — — 5 Total subject to the CVA capital charge 17,287 2,518
Analysis of Counterparty Credit Risk
Barclays PLC 88

Review of regulatory measures
The following disclosures provide details on regulatory measures of market risk. Refer to pages 180 and 188 of Barclays PLC Pillar 3 Report 2020 for more detail on regulatory measures and the differences when compared to management measures.
Barclays Group’s market risk capital requirement comprises of two elements:
• the market risk of trading book positions booked to legal entities are measured under a PRA approved internal models approach, including Regulatory VaR, Stressed Value at Risk (SVaR), Incremental Risk Charge (IRC) and Comprehensive Risk Measure (CRM) as required.
• the trading book positions that do not meet the conditions for inclusion within the approved internal models approach are calculated using standardised rules.
The table below summarises the regulatory market risk measures, under the internal models approach. Refer to Table 62 “Minimum capital requirement for market risk”, on page 92 for a breakdown of capital requirements by approach.
Table 60: Analysis of Regulatory VaR, SVaR, IRC and CRMPeriod-end Avg. Max Min
Six months ended 30 June 2021 £m £m £m £mRegulatory VaR- 1 day 26 37 64 18 Regulatory VaR- 10 day1 82 117 204 58 SVaR 49 70 116 48 SVaR (10-day)1 154 222 365 152 IRC 247 386 544 217 CRM — — — —
Six months ended 31 December 2020Regulatory VaR- 1 day 39 55 97 32 Regulatory VaR- 10 day1 123 174 308 100 SVaR 91 83 108 64 SVaR (10-day)1 288 262 342 204 IRC 378 218 391 133 CRM — — — —
1 The 10 day VaR is based on scaling of 1-day VaR model output since VaR is currently not modelled for a 10-day holding period. For more information about regulatory and stressed VaR methodology, refer to pages 183-185 of the Barclays PLC Pillar 3 Report 2020.
Overall, average VaR and SVaR decreased while IRC increased in H1 2021:▪ Regulatory VaR: Decreased due to a combination of a methodology update which changed the historical lookback
period of the VaR model from two years to one year and reduced risk taking in the period▪ Regulatory SVaR: Decreased due to reduced risk taking in Equities and Counterparty Risk Trading in the period▪ IRC: Increased principally due to higher default and rating migration exposure in FI Credit and Rates
Analysis of Market Risk
Barclays PLC 89
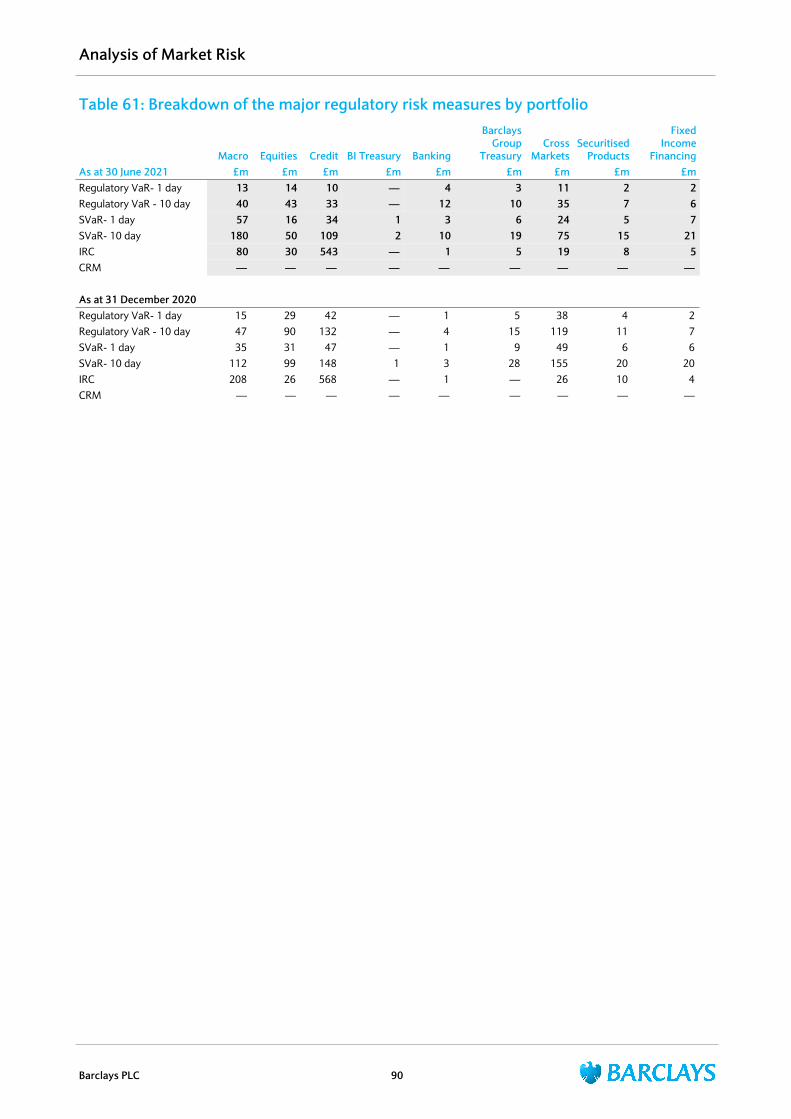
Table 61: Breakdown of the major regulatory risk measures by portfolio
Macro Equities Credit BI Treasury Banking
Barclays Group
TreasuryCross
MarketsSecuritised
Products
Fixed Income
FinancingAs at 30 June 2021 £m £m £m £m £m £m £m £m £mRegulatory VaR- 1 day 13 14 10 — 4 3 11 2 2Regulatory VaR - 10 day 40 43 33 — 12 10 35 7 6SVaR- 1 day 57 16 34 1 3 6 24 5 7SVaR- 10 day 180 50 109 2 10 19 75 15 21IRC 80 30 543 — 1 5 19 8 5CRM — — — — — — — — —
As at 31 December 2020Regulatory VaR- 1 day 15 29 42 — 1 5 38 4 2 Regulatory VaR - 10 day 47 90 132 — 4 15 119 11 7 SVaR- 1 day 35 31 47 — 1 9 49 6 6 SVaR- 10 day 112 99 148 1 3 28 155 20 20 IRC 208 26 568 — 1 — 26 10 4 CRM — — — — — — — — —
Analysis of Market Risk
Barclays PLC 90
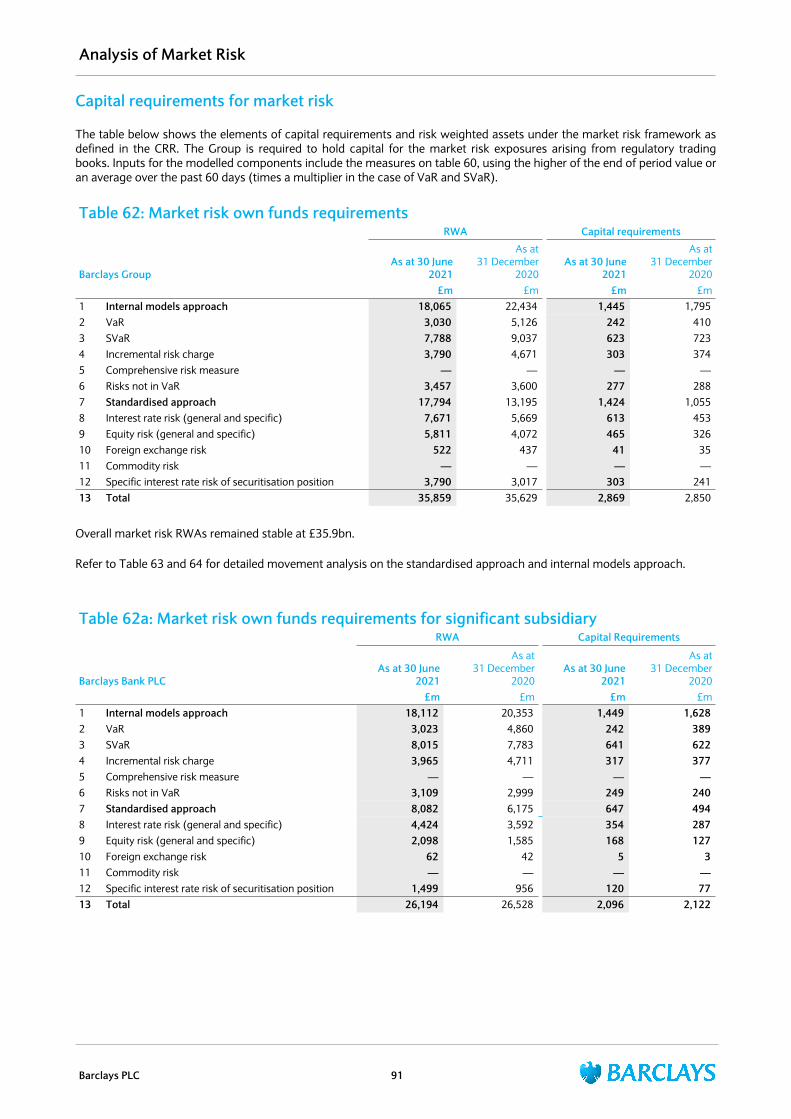
Capital requirements for market risk
The table below shows the elements of capital requirements and risk weighted assets under the market risk framework as defined in the CRR. The Group is required to hold capital for the market risk exposures arising from regulatory trading books. Inputs for the modelled components include the measures on table 60, using the higher of the end of period value or an average over the past 60 days (times a multiplier in the case of VaR and SVaR).
Table 62: Market risk own funds requirementsRWA Capital requirements
Barclays GroupAs at 30 June
2021
As at 31 December
2020As at 30 June
2021
As at 31 December
2020£m £m £m £m
1 Internal models approach 18,065 22,434 1,445 1,795 2 VaR 3,030 5,126 242 410 3 SVaR 7,788 9,037 623 723 4 Incremental risk charge 3,790 4,671 303 374 5 Comprehensive risk measure — — — — 6 Risks not in VaR 3,457 3,600 277 288 7 Standardised approach 17,794 13,195 1,424 1,055 8 Interest rate risk (general and specific) 7,671 5,669 613 453 9 Equity risk (general and specific) 5,811 4,072 465 326 10 Foreign exchange risk 522 437 41 35 11 Commodity risk — — — — 12 Specific interest rate risk of securitisation position 3,790 3,017 303 241 13 Total 35,859 35,629 2,869 2,850
Overall market risk RWAs remained stable at £35.9bn.
Refer to Table 63 and 64 for detailed movement analysis on the standardised approach and internal models approach.
Table 62a: Market risk own funds requirements for significant subsidiaryRWA Capital Requirements
Barclays Bank PLCAs at 30 June
2021
As at 31 December
2020As at 30 June
2021
As at 31 December
2020£m £m £m £m
1 Internal models approach 18,112 20,353 1,449 1,628 2 VaR 3,023 4,860 242 389 3 SVaR 8,015 7,783 641 622 4 Incremental risk charge 3,965 4,711 317 377 5 Comprehensive risk measure — — — — 6 Risks not in VaR 3,109 2,999 249 240 7 Standardised approach 8,082 6,175 647 494 8 Interest rate risk (general and specific) 4,424 3,592 354 287 9 Equity risk (general and specific) 2,098 1,585 168 127 10 Foreign exchange risk 62 42 5 3 11 Commodity risk — — — — 12 Specific interest rate risk of securitisation position 1,499 956 120 77 13 Total 26,194 26,528 2,096 2,122
Analysis of Market Risk
Barclays PLC 91
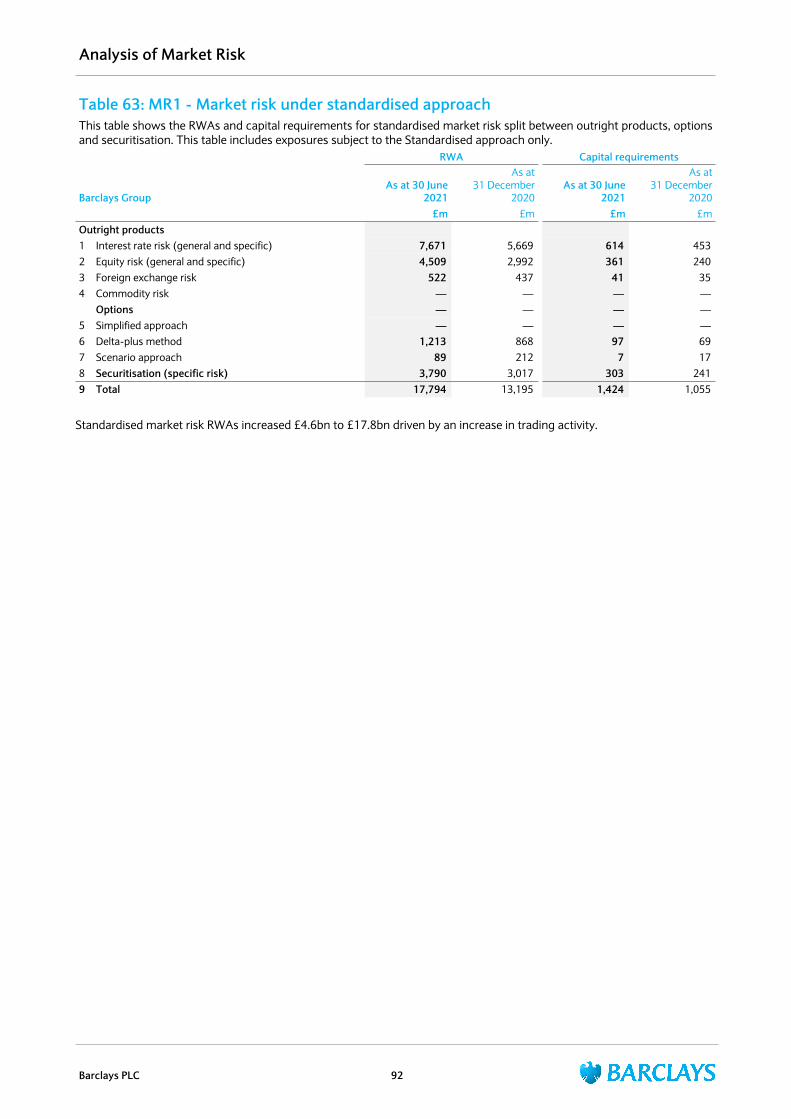
Table 63: MR1 - Market risk under standardised approachThis table shows the RWAs and capital requirements for standardised market risk split between outright products, options and securitisation. This table includes exposures subject to the Standardised approach only.
RWA Capital requirements
Barclays GroupAs at 30 June
2021
As at 31 December
2020As at 30 June
2021
As at 31 December
2020£m £m £m £m
Outright products1 Interest rate risk (general and specific) 7,671 5,669 614 453 2 Equity risk (general and specific) 4,509 2,992 361 240 3 Foreign exchange risk 522 437 41 35 4 Commodity risk — — — —
Options — — — — 5 Simplified approach — — — — 6 Delta-plus method 1,213 868 97 69 7 Scenario approach 89 212 7 17 8 Securitisation (specific risk) 3,790 3,017 303 241 9 Total 17,794 13,195 1,424 1,055
Standardised market risk RWAs increased £4.6bn to £17.8bn driven by an increase in trading activity.
Analysis of Market Risk
Barclays PLC 92
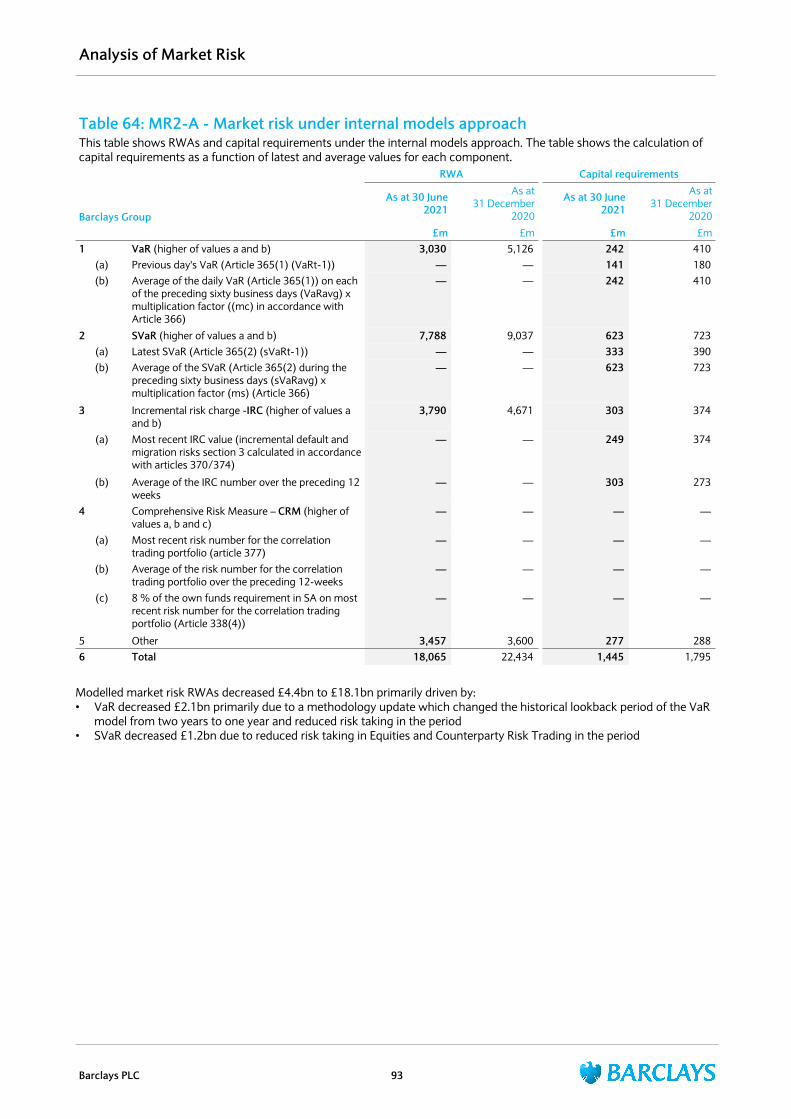
Table 64: MR2-A - Market risk under internal models approachThis table shows RWAs and capital requirements under the internal models approach. The table shows the calculation of capital requirements as a function of latest and average values for each component.
RWA Capital requirements
Barclays Group
As at 30 June 2021
As at 31 December
2020
As at 30 June 2021
As at 31 December
2020
£m £m £m £m1 VaR (higher of values a and b) 3,030 5,126 242 410
(a) Previous day's VaR (Article 365(1) (VaRt-1)) — — 141 180 (b) Average of the daily VaR (Article 365(1)) on each
of the preceding sixty business days (VaRavg) x multiplication factor ((mc) in accordance with Article 366)
— — 242 410
2 SVaR (higher of values a and b) 7,788 9,037 623 723 (a) Latest SVaR (Article 365(2) (sVaRt-1)) — — 333 390 (b) Average of the SVaR (Article 365(2) during the
preceding sixty business days (sVaRavg) x multiplication factor (ms) (Article 366)
— — 623 723
3 Incremental risk charge -IRC (higher of values a and b)
3,790 4,671 303 374
(a) Most recent IRC value (incremental default and migration risks section 3 calculated in accordance with articles 370/374)
— — 249 374
(b) Average of the IRC number over the preceding 12 weeks
— — 303 273
4 Comprehensive Risk Measure – CRM (higher of values a, b and c)
— — — —
(a) Most recent risk number for the correlation trading portfolio (article 377)
— — — —
(b) Average of the risk number for the correlation trading portfolio over the preceding 12-weeks
— — — —
(c) 8 % of the own funds requirement in SA on most recent risk number for the correlation trading portfolio (Article 338(4))
— — — —
5 Other 3,457 3,600 277 288 6 Total 18,065 22,434 1,445 1,795
Modelled market risk RWAs decreased £4.4bn to £18.1bn primarily driven by:• VaR decreased £2.1bn primarily due to a methodology update which changed the historical lookback period of the VaR
model from two years to one year and reduced risk taking in the period• SVaR decreased £1.2bn due to reduced risk taking in Equities and Counterparty Risk Trading in the period
Analysis of Market Risk
Barclays PLC 93
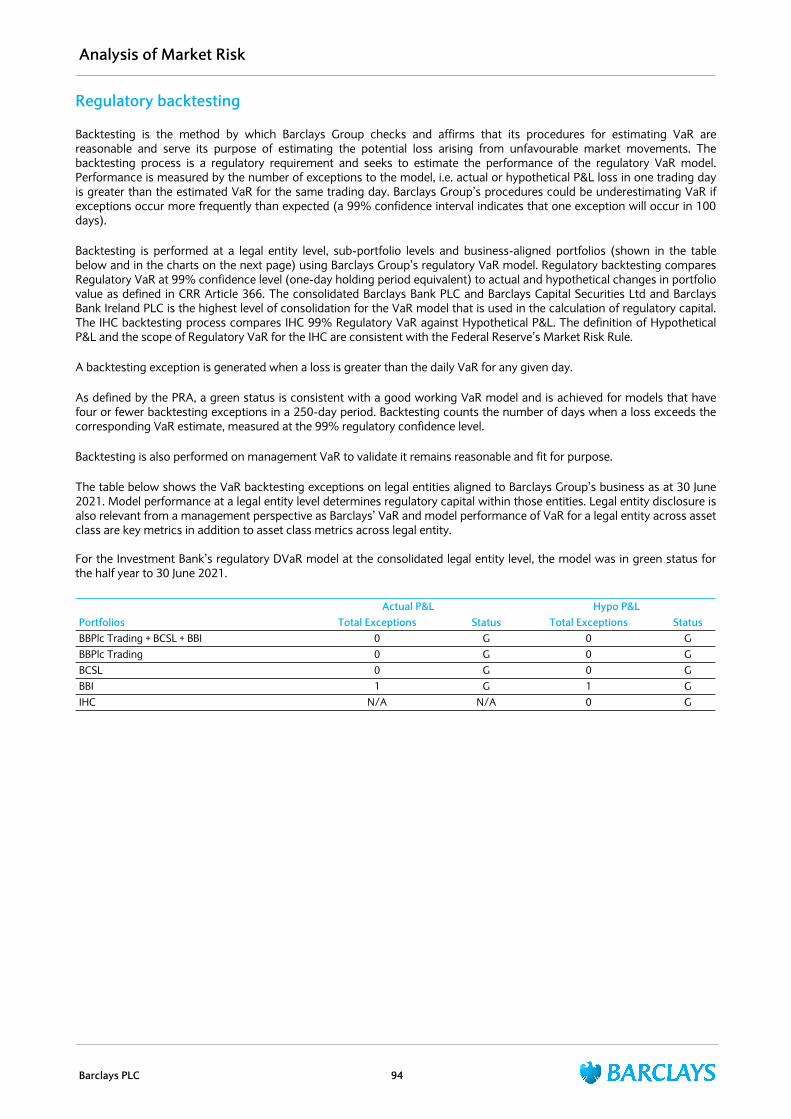
Regulatory backtesting
Backtesting is the method by which Barclays Group checks and affirms that its procedures for estimating VaR are reasonable and serve its purpose of estimating the potential loss arising from unfavourable market movements. The backtesting process is a regulatory requirement and seeks to estimate the performance of the regulatory VaR model. Performance is measured by the number of exceptions to the model, i.e. actual or hypothetical P&L loss in one trading day is greater than the estimated VaR for the same trading day. Barclays Group’s procedures could be underestimating VaR if exceptions occur more frequently than expected (a 99% confidence interval indicates that one exception will occur in 100 days).
Backtesting is performed at a legal entity level, sub-portfolio levels and business-aligned portfolios (shown in the table below and in the charts on the next page) using Barclays Group’s regulatory VaR model. Regulatory backtesting compares Regulatory VaR at 99% confidence level (one-day holding period equivalent) to actual and hypothetical changes in portfolio value as defined in CRR Article 366. The consolidated Barclays Bank PLC and Barclays Capital Securities Ltd and Barclays Bank Ireland PLC is the highest level of consolidation for the VaR model that is used in the calculation of regulatory capital. The IHC backtesting process compares IHC 99% Regulatory VaR against Hypothetical P&L. The definition of Hypothetical P&L and the scope of Regulatory VaR for the IHC are consistent with the Federal Reserve’s Market Risk Rule.
A backtesting exception is generated when a loss is greater than the daily VaR for any given day.
As defined by the PRA, a green status is consistent with a good working VaR model and is achieved for models that have four or fewer backtesting exceptions in a 250-day period. Backtesting counts the number of days when a loss exceeds the corresponding VaR estimate, measured at the 99% regulatory confidence level.
Backtesting is also performed on management VaR to validate it remains reasonable and fit for purpose.
The table below shows the VaR backtesting exceptions on legal entities aligned to Barclays Group’s business as at 30 June 2021. Model performance at a legal entity level determines regulatory capital within those entities. Legal entity disclosure is also relevant from a management perspective as Barclays’ VaR and model performance of VaR for a legal entity across asset class are key metrics in addition to asset class metrics across legal entity.
For the Investment Bank’s regulatory DVaR model at the consolidated legal entity level, the model was in green status for the half year to 30 June 2021.
Actual P&L Hypo P&LPortfolios Total Exceptions Status Total Exceptions StatusBBPlc Trading + BCSL + BBI 0 G 0 GBBPlc Trading 0 G 0 GBCSL 0 G 0 GBBI 1 G 1 GIHC N/A N/A 0 G
Analysis of Market Risk
Barclays PLC 94
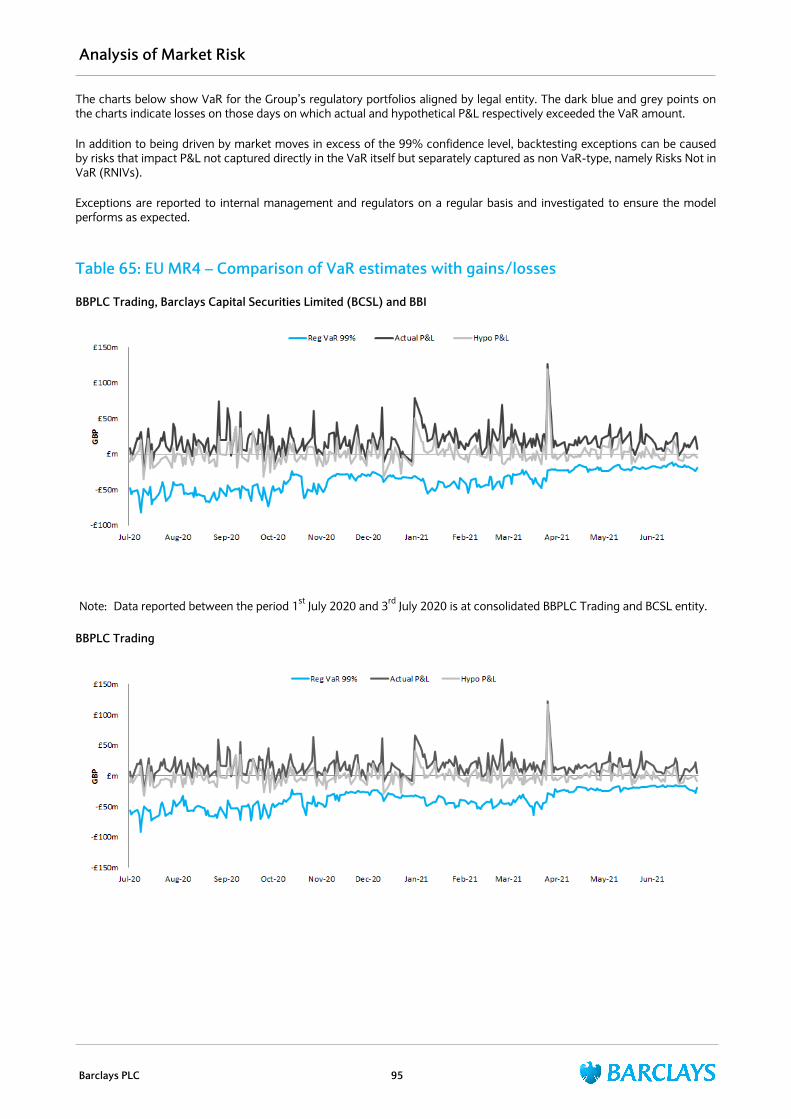
The charts below show VaR for the Group’s regulatory portfolios aligned by legal entity. The dark blue and grey points on the charts indicate losses on those days on which actual and hypothetical P&L respectively exceeded the VaR amount.
In addition to being driven by market moves in excess of the 99% confidence level, backtesting exceptions can be caused by risks that impact P&L not captured directly in the VaR itself but separately captured as non VaR-type, namely Risks Not in VaR (RNIVs).
Exceptions are reported to internal management and regulators on a regular basis and investigated to ensure the model performs as expected.
Table 65: EU MR4 – Comparison of VaR estimates with gains/losses
BBPLC Trading, Barclays Capital Securities Limited (BCSL) and BBI
Note: Data reported between the period 1st July 2020 and 3rd July 2020 is at consolidated BBPLC Trading and BCSL entity.
BBPLC Trading
Analysis of Market Risk
Barclays PLC 95
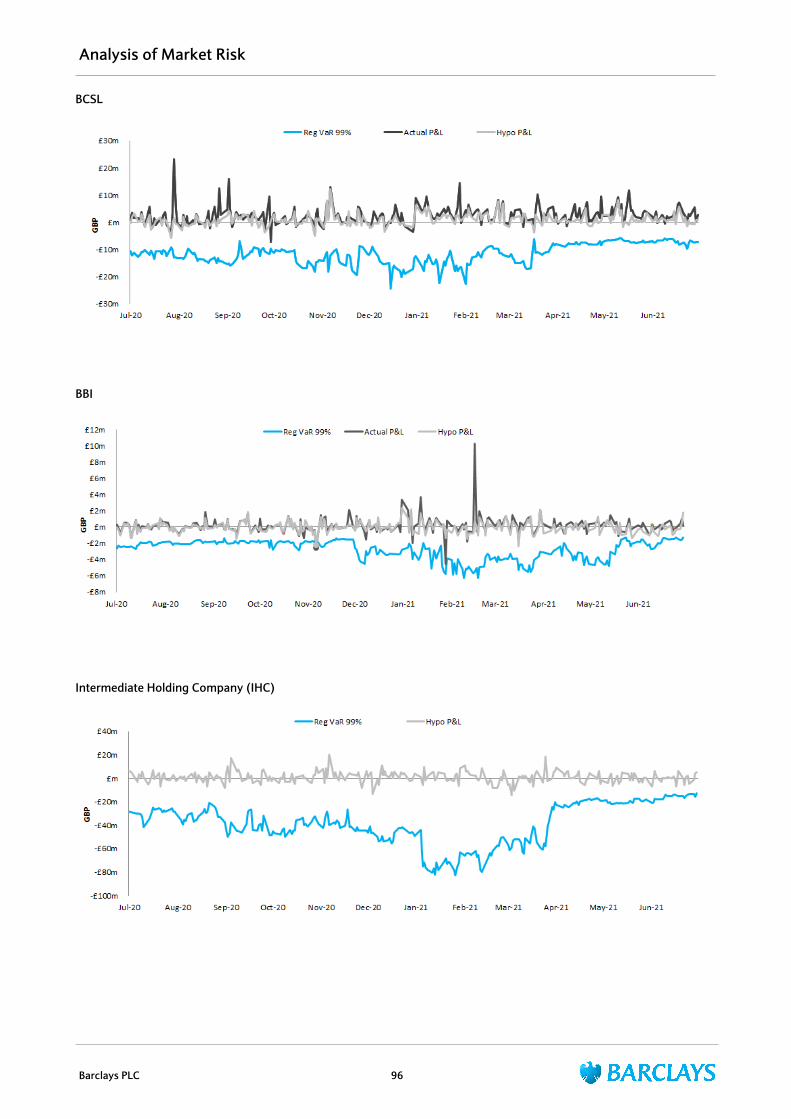
BCSL
BBI
Intermediate Holding Company (IHC)
Analysis of Market Risk
Barclays PLC 96