Embed Size (px)
Citation preview

Barclays PLC 2015 Interim Results 29 July 2015
John McFarlane Barclays Executive Chairman
3 | Barclays 2015 Interim Results | 29 July 2015
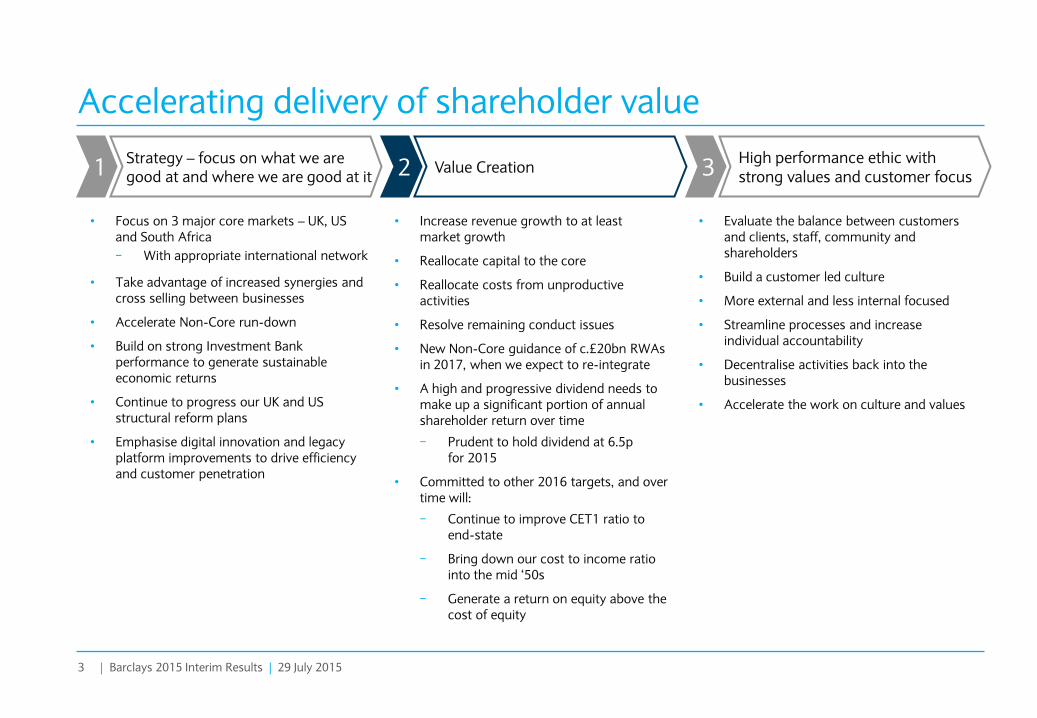
Accelerating delivery of shareholder value
Strategy – focus on what we are good at and where we are good at it 1 Value Creation 2
High performance ethic with strong values and customer focus 3
• Increase revenue growth to at least market growth
• Reallocate capital to the core
• Reallocate costs from unproductive activities
• Resolve remaining conduct issues
• New Non-Core guidance of c.£20bn RWAs in 2017, when we expect to re-integrate
• A high and progressive dividend needs to make up a significant portion of annual shareholder return over time
− Prudent to hold dividend at 6.5p for 2015
• Committed to other 2016 targets, and over time will:
− Continue to improve CET1 ratio to end-state
− Bring down our cost to income ratio into the mid ‘50s
− Generate a return on equity above the cost of equity
• Focus on 3 major core markets – UK, US and South Africa
− With appropriate international network
• Take advantage of increased synergies and cross selling between businesses
• Accelerate Non-Core run-down
• Build on strong Investment Bank performance to generate sustainable economic returns
• Continue to progress our UK and US structural reform plans
• Emphasise digital innovation and legacy platform improvements to drive efficiency and customer penetration
• Evaluate the balance between customers and clients, staff, community and shareholders
• Build a customer led culture
• More external and less internal focused
• Streamline processes and increase individual accountability
• Decentralise activities back into the businesses
• Accelerate the work on culture and values
B: Slide 3 A: Slide 3 Q2 2015 Results Slides – V32
Tushar Morzaria Barclays Group Finance Director
5 | Barclays 2015 Interim Results | 29 July 2015
Continued good progress in H1
GROUP CORE NON-CORE CONCLUSION
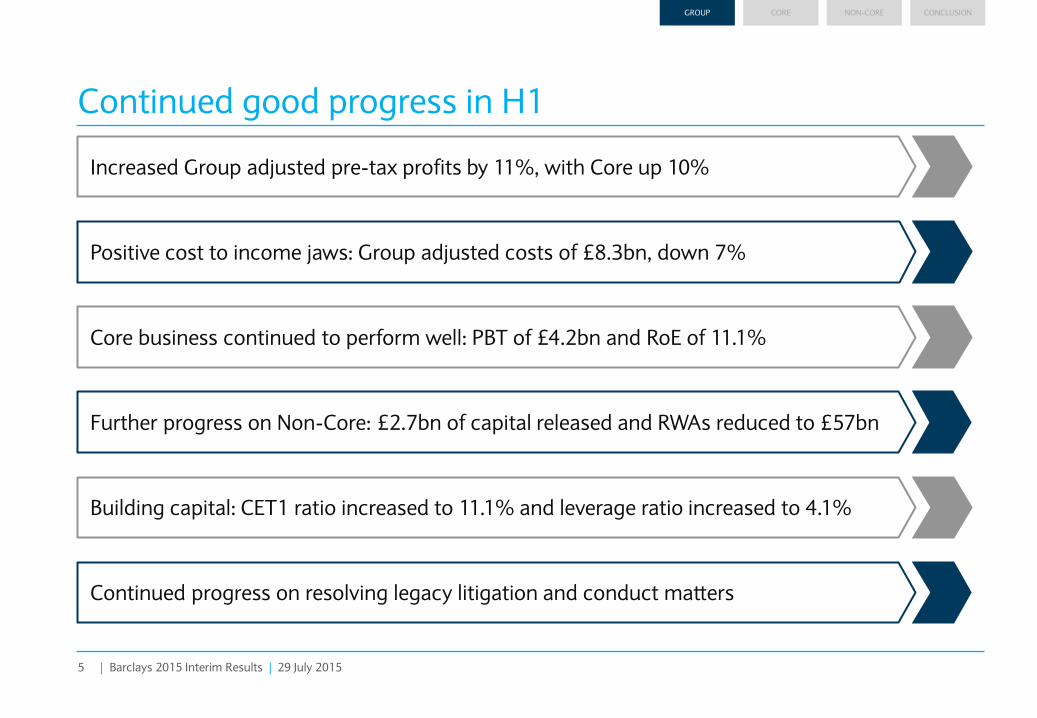
Increased Group adjusted pre-tax profits by 11%, with Core up 10%
Positive cost to income jaws: Group adjusted costs of £8.3bn, down 7%
Core business continued to perform well: PBT of £4.2bn and RoE of 11.1%
Further progress on Non-Core: £2.7bn of capital released and RWAs reduced to £57bn
Building capital: CET1 ratio increased to 11.1% and leverage ratio increased to 4.1%
Continued progress on resolving legacy litigation and conduct matters
B: Slide 2 A: Slide 5 Q2 2015 Results Slides – V32
6 | Barclays 2015 Interim Results | 29 July 2015
Six months ended – June (£m) 2014 2015 %
change
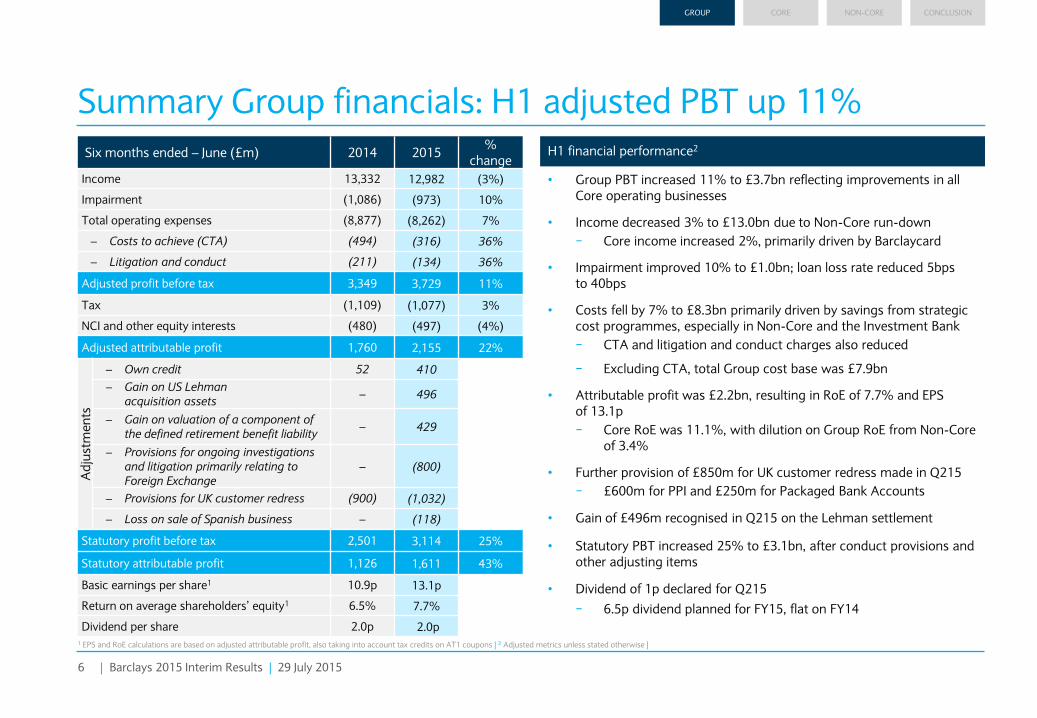
Income 13,332 12,982 (3%)
Impairment (1,086) (973) 10%
Total operating expenses (8,877) (8,262) 7%
– Costs to achieve (CTA) (494) (316) 36%
– Litigation and conduct (211) (134) 36%
Adjusted profit before tax 3,349 3,729 11%
Tax (1,109) (1,077) 3%
NCI and other equity interests (480) (497) (4%)
Adjusted attributable profit 1,760 2,155 22%
Ad
just
me
nts
– Own credit 52 410
– Gain on US Lehman acquisition assets
– 496
– Gain on valuation of a component of the defined retirement benefit liability
– 429
– Provisions for ongoing investigations and litigation primarily relating to Foreign Exchange
– (800)
– Provisions for UK customer redress (900) (1,032)
– Loss on sale of Spanish business – (118)
Statutory profit before tax 2,501 3,114 25%
Statutory attributable profit 1,126 1,611 43%
Basic earnings per share1 10.9p 13.1p
Return on average shareholders’ equity1 6.5% 7.7%
Dividend per share 2.0p 2.0p
H1 financial performance2
Summary Group financials: H1 adjusted PBT up 11%
• Group PBT increased 11% to £3.7bn reflecting improvements in all Core operating businesses
• Income decreased 3% to £13.0bn due to Non-Core run-down
− Core income increased 2%, primarily driven by Barclaycard
• Impairment improved 10% to £1.0bn; loan loss rate reduced 5bps to 40bps
• Costs fell by 7% to £8.3bn primarily driven by savings from strategic cost programmes, especially in Non-Core and the Investment Bank
− CTA and litigation and conduct charges also reduced
− Excluding CTA, total Group cost base was £7.9bn
• Attributable profit was £2.2bn, resulting in RoE of 7.7% and EPS of 13.1p
− Core RoE was 11.1%, with dilution on Group RoE from Non-Core of 3.4%
• Further provision of £850m for UK customer redress made in Q215
− £600m for PPI and £250m for Packaged Bank Accounts
• Gain of £496m recognised in Q215 on the Lehman settlement
• Statutory PBT increased 25% to £3.1bn, after conduct provisions and other adjusting items
• Dividend of 1p declared for Q215
− 6.5p dividend planned for FY15, flat on FY14
GROUP CORE NON-CORE CONCLUSION
1 EPS and RoE calculations are based on adjusted attributable profit, also taking into account tax credits on AT1 coupons | 2 Adjusted metrics unless stated otherwise |
B: Slide 5 A : Slide 6 C: Slide 3 Q2 2015 Results Slides – V32
7 | Barclays 2015 Interim Results | 29 July 2015
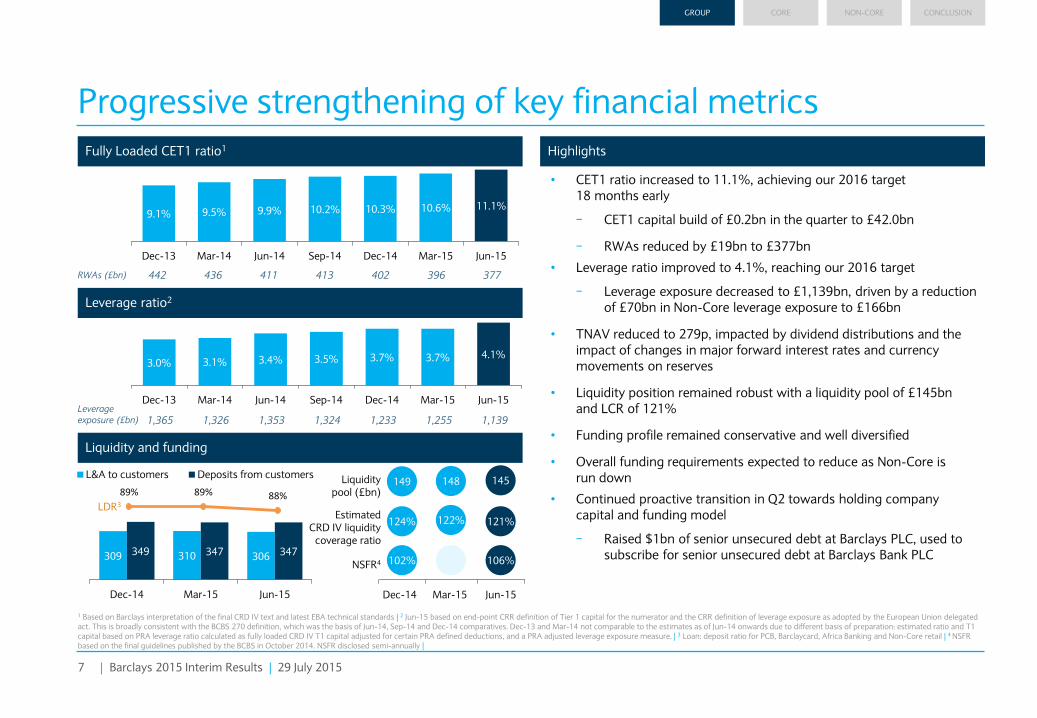
1,365 1,326 1,353 1,324 1,233 1,255 1,139
442 436 411 413 402 396 377
Fully Loaded CET1 ratio1 Highlights
• CET1 ratio increased to 11.1%, achieving our 2016 target 18 months early
− CET1 capital build of £0.2bn in the quarter to £42.0bn
− RWAs reduced by £19bn to £377bn
• Leverage ratio improved to 4.1%, reaching our 2016 target
− Leverage exposure decreased to £1,139bn, driven by a reduction of £70bn in Non-Core leverage exposure to £166bn
• TNAV reduced to 279p, impacted by dividend distributions and the impact of changes in major forward interest rates and currency movements on reserves
• Liquidity position remained robust with a liquidity pool of £145bn and LCR of 121%
• Funding profile remained conservative and well diversified
• Overall funding requirements expected to reduce as Non-Core is run down
• Continued proactive transition in Q2 towards holding company capital and funding model
− Raised $1bn of senior unsecured debt at Barclays PLC, used to subscribe for senior unsecured debt at Barclays Bank PLC
Progressive strengthening of key financial metrics
309 310 306 349 347 347
Dec-14 Mar-15 Jun-15
L&A to customers Deposits from customers
89% 89% 88% LDR3
149 145 Liquidity pool (£bn)
Estimated CRD IV liquidity
coverage ratio
124% 121%
3.0% 3.1% 3.4% 3.5% 3.7% 3.7% 4.1%
Dec-13 Mar-14 Jun-14 Sep-14 Dec-14 Mar-15 Jun-15
9.1% 9.5% 9.9% 10.2% 10.3% 10.6% 11.1%
Dec-13 Mar-14 Jun-14 Sep-14 Dec-14 Mar-15 Jun-15
Mar-15 Jun-15 Dec-14
148
122%
NSFR4 102% 106%
RWAs (£bn)
Leverage exposure (£bn)
GROUP CORE NON-CORE CONCLUSION
1 Based on Barclays interpretation of the final CRD IV text and latest EBA technical standards | 2 Jun-15 based on end-point CRR definition of Tier 1 capital for the numerator and the CRR definition of leverage exposure as adopted by the European Union delegated act. This is broadly consistent with the BCBS 270 definition, which was the basis of Jun-14, Sep-14 and Dec-14 comparatives. Dec-13 and Mar-14 not comparable to the estimates as of Jun-14 onwards due to different basis of preparation: estimated ratio and T1 capital based on PRA leverage ratio calculated as fully loaded CRD IV T1 capital adjusted for certain PRA defined deductions, and a PRA adjusted leverage exposure measure. | 3 Loan: deposit ratio for PCB, Barclaycard, Africa Banking and Non-Core retail | 4 NSFR based on the final guidelines published by the BCBS in October 2014. NSFR disclosed semi-annually |
Liquidity and funding
Leverage ratio2
8 | Barclays 2015 Interim Results | 29 July 2015
Financial performance
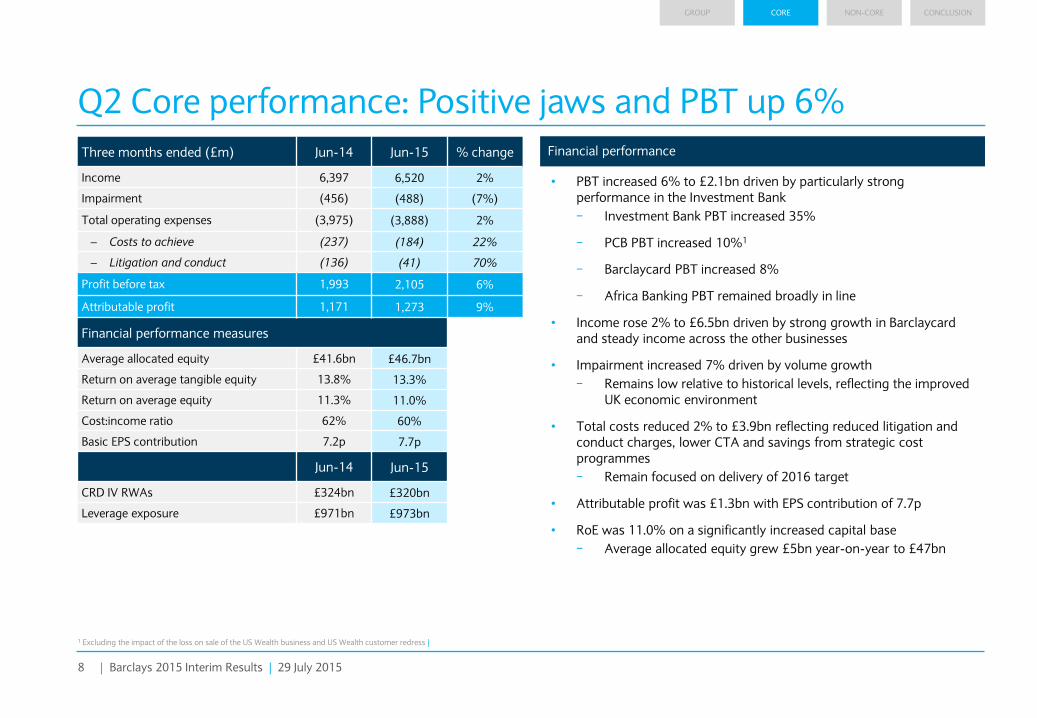
Q2 Core performance: Positive jaws and PBT up 6%
GROUP CORE NON-CORE CONCLUSION
• PBT increased 6% to £2.1bn driven by particularly strong performance in the Investment Bank
− Investment Bank PBT increased 35%
− PCB PBT increased 10%1
− Barclaycard PBT increased 8%
− Africa Banking PBT remained broadly in line
• Income rose 2% to £6.5bn driven by strong growth in Barclaycard and steady income across the other businesses
• Impairment increased 7% driven by volume growth
− Remains low relative to historical levels, reflecting the improved UK economic environment
• Total costs reduced 2% to £3.9bn reflecting reduced litigation and conduct charges, lower CTA and savings from strategic cost programmes
− Remain focused on delivery of 2016 target
• Attributable profit was £1.3bn with EPS contribution of 7.7p
• RoE was 11.0% on a significantly increased capital base
− Average allocated equity grew £5bn year-on-year to £47bn
Three months ended (£m) Jun-14 Jun-15 % change
Income 6,397 6,520 2%
Impairment (456) (488) (7%)
Total operating expenses (3,975) (3,888) 2%
– Costs to achieve (237) (184) 22%
– Litigation and conduct (136) (41) 70%
Profit before tax 1,993 2,105 6%
Attributable profit 1,171 1,273 9%
Financial performance measures
Average allocated equity £41.6bn £46.7bn
Return on average tangible equity 13.8% 13.3%
Return on average equity 11.3% 11.0%
Cost:income ratio 62% 60%
Basic EPS contribution 7.2p 7.7p
Jun-14 Jun-15
CRD IV RWAs £324bn £320bn
Leverage exposure £971bn £973bn
1 Excluding the impact of the loss on sale of the US Wealth business and US Wealth customer redress |
B: Slide 7 A : Slide 8 Q2 2015 Results Slides – V32
9 | Barclays 2015 Interim Results | 29 July 2015
GROUP CORE NON-CORE CONCLUSION
1 For Personal and Corporate Banking, Barclaycard and Africa Banking | 2 Africa Banking Q115 net interest income has been revised by £14m to accurately reflect the classification of income across financial statement line items |
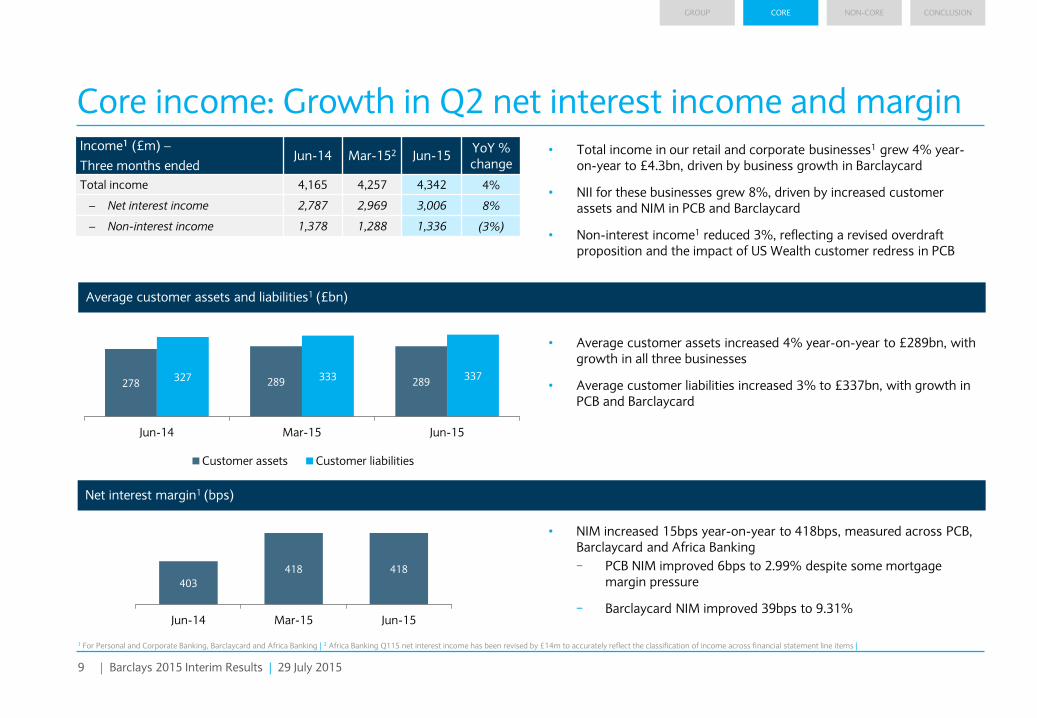
Average customer assets and liabilities1 (£bn)
Net interest margin1 (bps)
Income1 (£m) –
Three months ended Jun-14 Mar-152 Jun-15
YoY % change
Total income 4,165 4,257 4,342 4%
– Net interest income 2,787 2,969 3,006 8%
– Non-interest income 1,378 1,288 1,336 (3%)
403
418 418
Jun-14 Mar-15 Jun-15
278 289 289 327 333 337
0
50
100
150
200
250
300
350
400
Jun-14 Mar-15 Jun-15
Customer assets Customer liabilities
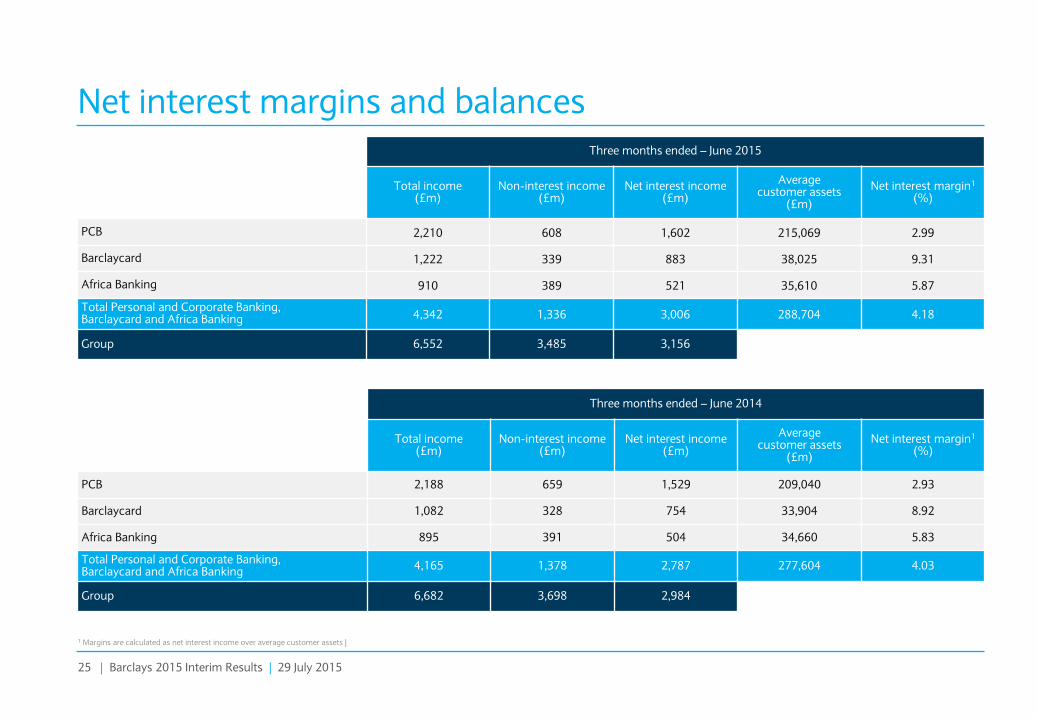
Core income: Growth in Q2 net interest income and margin
• NIM increased 15bps year-on-year to 418bps, measured across PCB, Barclaycard and Africa Banking
− PCB NIM improved 6bps to 2.99% despite some mortgage margin pressure
− Barclaycard NIM improved 39bps to 9.31%
• Average customer assets increased 4% year-on-year to £289bn, with growth in all three businesses
• Average customer liabilities increased 3% to £337bn, with growth in PCB and Barclaycard
• Total income in our retail and corporate businesses1 grew 4% year-on-year to £4.3bn, driven by business growth in Barclaycard
• NII for these businesses grew 8%, driven by increased customer assets and NIM in PCB and Barclaycard
• Non-interest income1 reduced 3%, reflecting a revised overdraft proposition and the impact of US Wealth customer redress in PCB
10 | Barclays 2015 Interim Results | 29 July 2015
GROUP CORE NON-CORE CONCLUSION
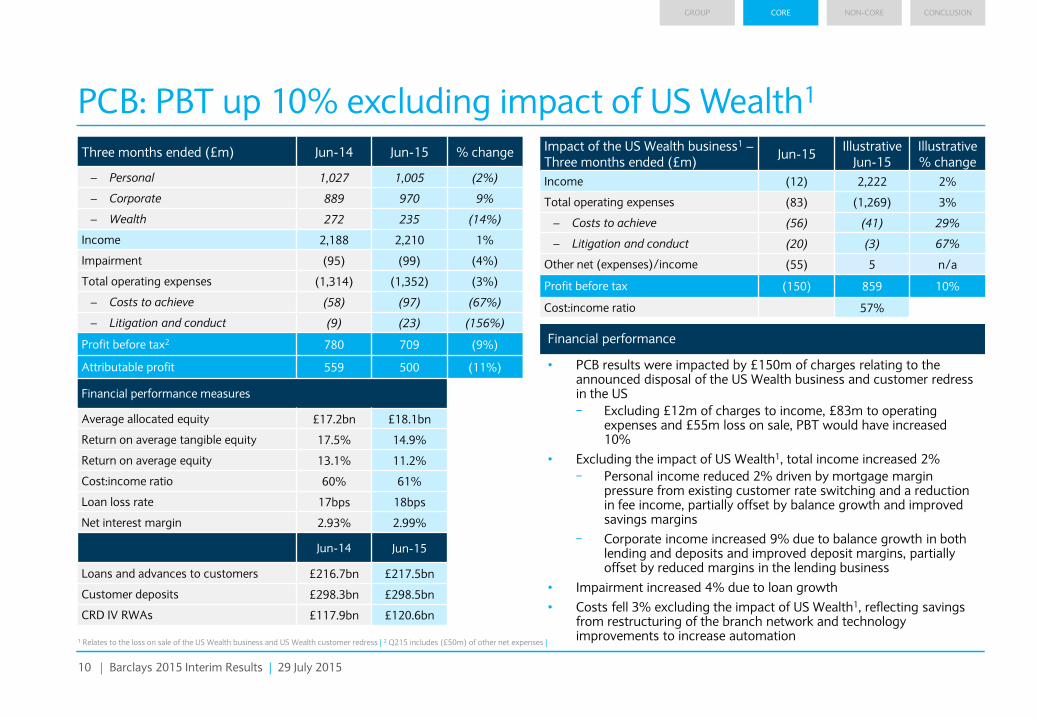
PCB: PBT up 10% excluding impact of US Wealth1
• PCB results were impacted by £150m of charges relating to the announced disposal of the US Wealth business and customer redress in the US
− Excluding £12m of charges to income, £83m to operating expenses and £55m loss on sale, PBT would have increased 10%
• Excluding the impact of US Wealth1, total income increased 2%
− Personal income reduced 2% driven by mortgage margin pressure from existing customer rate switching and a reduction in fee income, partially offset by balance growth and improved savings margins
− Corporate income increased 9% due to balance growth in both lending and deposits and improved deposit margins, partially offset by reduced margins in the lending business
• Impairment increased 4% due to loan growth
• Costs fell 3% excluding the impact of US Wealth1, reflecting savings from restructuring of the branch network and technology improvements to increase automation
Three months ended (£m) Jun-14 Jun-15 % change
– Personal 1,027 1,005 (2%)
– Corporate 889 970 9%
– Wealth 272 235 (14%)
Income 2,188 2,210 1%
Impairment (95) (99) (4%)
Total operating expenses (1,314) (1,352) (3%)
– Costs to achieve (58) (97) (67%)
– Litigation and conduct (9) (23) (156%)
Profit before tax2 780 709 (9%)
Attributable profit 559 500 (11%)
Financial performance measures
Average allocated equity £17.2bn £18.1bn
Return on average tangible equity 17.5% 14.9%
Return on average equity 13.1% 11.2%
Cost:income ratio 60% 61%
Loan loss rate 17bps 18bps
Net interest margin 2.93% 2.99%
Jun-14 Jun-15
Loans and advances to customers £216.7bn £217.5bn
Customer deposits £298.3bn £298.5bn
CRD IV RWAs £117.9bn £120.6bn
Financial performance
Impact of the US Wealth business1 – Three months ended (£m)
Jun-15 Illustrative
Jun-15 Illustrative % change
Income (12) 2,222 2%
Total operating expenses (83) (1,269) 3%
– Costs to achieve (56) (41) 29%
– Litigation and conduct (20) (3) 67%
Other net (expenses)/income (55) 5 n/a
Profit before tax (150) 859 10%
Cost:income ratio 57%
1 Relates to the loss on sale of the US Wealth business and US Wealth customer redress | 2 Q215 includes (£50m) of other net expenses |
B: Slide 38 A : Slide 10 Q2 2015 Results Slides – V32
11 | Barclays 2015 Interim Results | 29 July 2015
GROUP CORE NON-CORE CONCLUSION
Financial performance
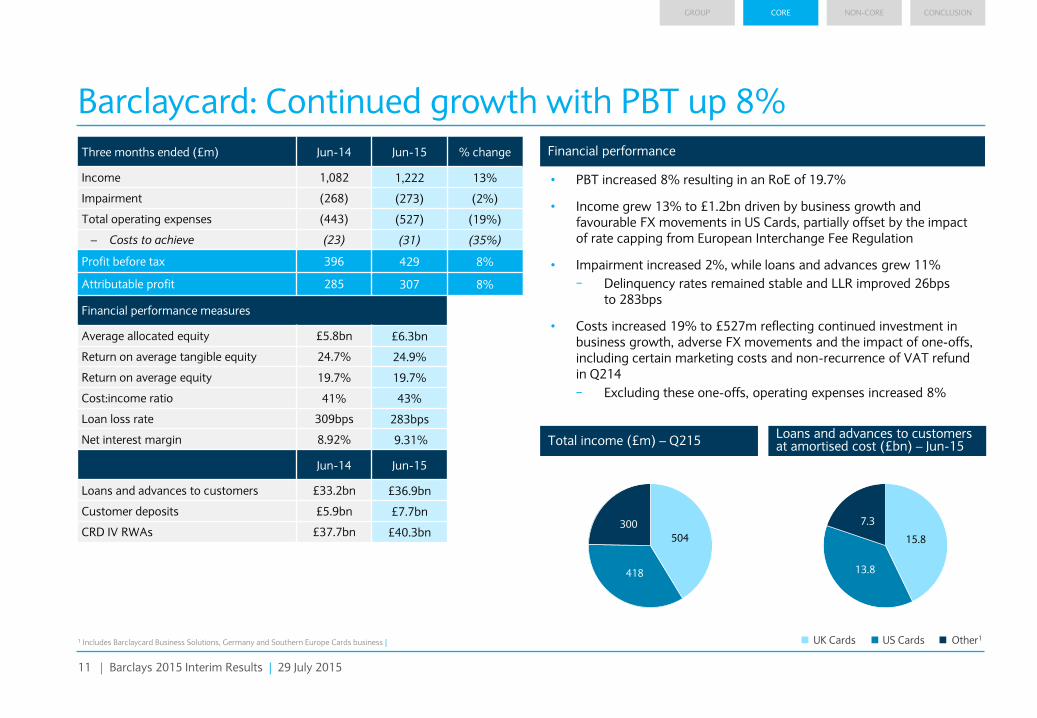
Barclaycard: Continued growth with PBT up 8%
• PBT increased 8% resulting in an RoE of 19.7%
• Income grew 13% to £1.2bn driven by business growth and favourable FX movements in US Cards, partially offset by the impact of rate capping from European Interchange Fee Regulation
• Impairment increased 2%, while loans and advances grew 11%
− Delinquency rates remained stable and LLR improved 26bps to 283bps
• Costs increased 19% to £527m reflecting continued investment in business growth, adverse FX movements and the impact of one-offs, including certain marketing costs and non-recurrence of VAT refund in Q214
− Excluding these one-offs, operating expenses increased 8%
15.8
13.8
7.3
UK Cards US Cards Other1
504
418
300
1 Includes Barclaycard Business Solutions, Germany and Southern Europe Cards business |
Three months ended (£m) Jun-14 Jun-15 % change
Income 1,082 1,222 13%
Impairment (268) (273) (2%)
Total operating expenses (443) (527) (19%)
– Costs to achieve (23) (31) (35%)
Profit before tax 396 429 8%
Attributable profit 285 307 8%
Financial performance measures
Average allocated equity £5.8bn £6.3bn
Return on average tangible equity 24.7% 24.9%
Return on average equity 19.7% 19.7%
Cost:income ratio 41% 43%
Loan loss rate 309bps 283bps
Net interest margin 8.92% 9.31%
Jun-14 Jun-15
Loans and advances to customers £33.2bn £36.9bn
Customer deposits £5.9bn £7.7bn
CRD IV RWAs £37.7bn £40.3bn
Total income (£m) – Q215 Loans and advances to customers at amortised cost (£bn) – Jun-15
B Slide 39 A Slide 11 Q2 2015 Results Slides – V32
12 | Barclays 2015 Interim Results | 29 July 2015
GROUP CORE NON-CORE CONCLUSION
1 Africa Banking business unit performance based on BAGL results in addition to Egypt and Zimbabwe | 2 Barclays share of the statutory equity of the BAGL entity (together with that of the Barclays Egypt and Zimbabwe businesses which remain outside the BAGL corporate entity), as well as the Barclays’ goodwill on acquisition of these businesses. The tangible equity for RoTE uses the same basis but excludes both the Barclays’ goodwill on acquisition and the goodwill and intangibles held within the BAGL statutory equity |
Financial performance1
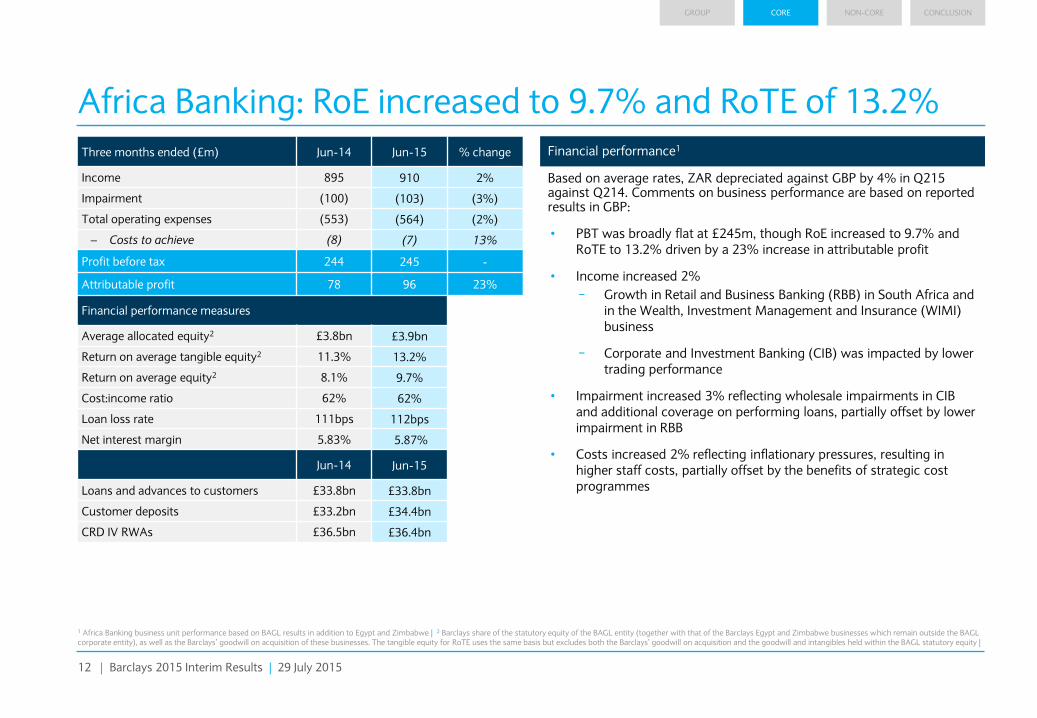
Africa Banking: RoE increased to 9.7% and RoTE of 13.2%
Based on average rates, ZAR depreciated against GBP by 4% in Q215 against Q214. Comments on business performance are based on reported results in GBP:
• PBT was broadly flat at £245m, though RoE increased to 9.7% and RoTE to 13.2% driven by a 23% increase in attributable profit
• Income increased 2%
− Growth in Retail and Business Banking (RBB) in South Africa and in the Wealth, Investment Management and Insurance (WIMI) business
− Corporate and Investment Banking (CIB) was impacted by lower trading performance
• Impairment increased 3% reflecting wholesale impairments in CIB and additional coverage on performing loans, partially offset by lower impairment in RBB
• Costs increased 2% reflecting inflationary pressures, resulting in higher staff costs, partially offset by the benefits of strategic cost programmes
Three months ended (£m) Jun-14 Jun-15 % change
Income 895 910 2%
Impairment (100) (103) (3%)
Total operating expenses (553) (564) (2%)
– Costs to achieve (8) (7) 13%
Profit before tax 244 245 -
Attributable profit 78 96 23%
Financial performance measures
Average allocated equity2 £3.8bn £3.9bn
Return on average tangible equity2 11.3% 13.2%
Return on average equity2 8.1% 9.7%
Cost:income ratio 62% 62%
Loan loss rate 111bps 112bps
Net interest margin 5.83% 5.87%
Jun-14 Jun-15
Loans and advances to customers £33.8bn £33.8bn
Customer deposits £33.2bn £34.4bn
CRD IV RWAs £36.5bn £36.4bn
B Slide 40 A Slide 12 Q2 2015 Results Slides – V32
13 | Barclays 2015 Interim Results | 29 July 2015
GROUP CORE NON-CORE CONCLUSION
1 Includes ‘Other’ income |
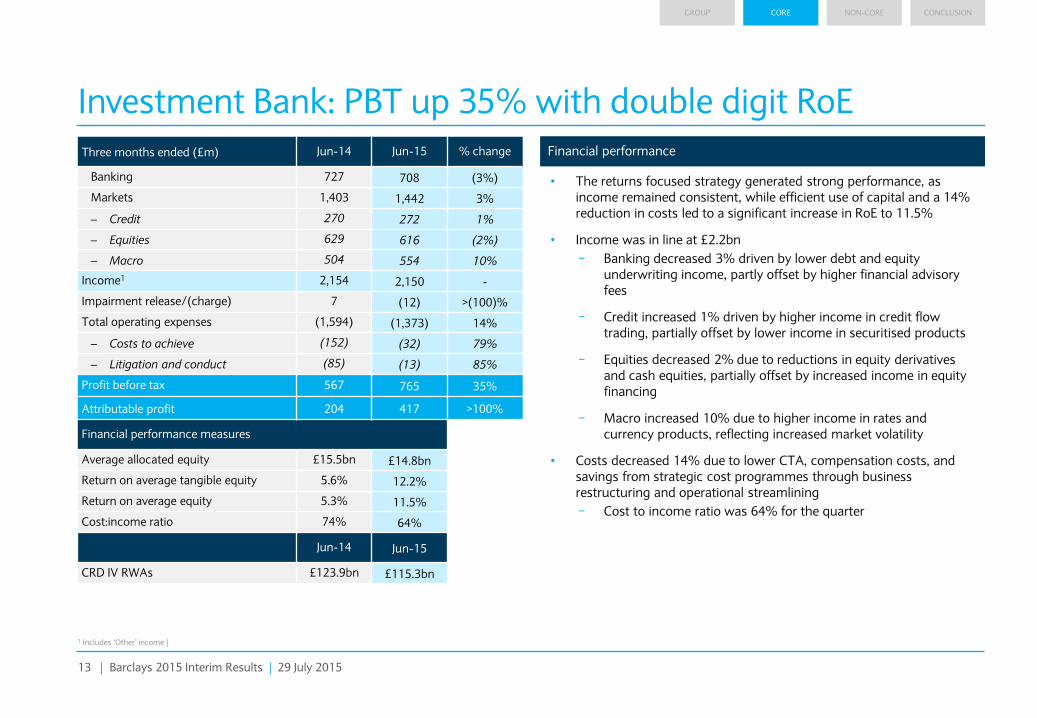
• The returns focused strategy generated strong performance, as income remained consistent, while efficient use of capital and a 14% reduction in costs led to a significant increase in RoE to 11.5%
• Income was in line at £2.2bn
− Banking decreased 3% driven by lower debt and equity underwriting income, partly offset by higher financial advisory fees
− Credit increased 1% driven by higher income in credit flow trading, partially offset by lower income in securitised products
− Equities decreased 2% due to reductions in equity derivatives and cash equities, partially offset by increased income in equity financing
− Macro increased 10% due to higher income in rates and currency products, reflecting increased market volatility
• Costs decreased 14% due to lower CTA, compensation costs, and savings from strategic cost programmes through business restructuring and operational streamlining
− Cost to income ratio was 64% for the quarter
Investment Bank: PBT up 35% with double digit RoE
Three months ended (£m) Jun-14 Jun-15 % change
Banking 727 708 (3%)
Markets 1,403 1,442 3%
– Credit 270 272 1%
– Equities 629 616 (2%)
– Macro 504 554 10%
Income1 2,154 2,150 -
Impairment release/(charge) 7 (12) >(100)%
Total operating expenses (1,594) (1,373) 14%
– Costs to achieve (152) (32) 79%
– Litigation and conduct (85) (13) 85%
Profit before tax 567 765 35%
Attributable profit 204 417 >100%
Financial performance measures
Average allocated equity £15.5bn £14.8bn
Return on average tangible equity 5.6% 12.2%
Return on average equity 5.3% 11.5%
Cost:income ratio 74% 64%
Jun-14 Jun-15
CRD IV RWAs £123.9bn £115.3bn
Financial performance
B Slide 41 A Slide 13 Q2 2015 Results Slides – V32
14 | Barclays 2015 Interim Results | 29 July 2015
GROUP CORE NON-CORE CONCLUSION
1 Return on average equity and average tangible equity for Barclays Non-Core represents its impact on the Group, being the difference between Barclays Group returns and Barclays Core returns. This does not represent the return on average equity and average tangible equity of the Non-Core business |
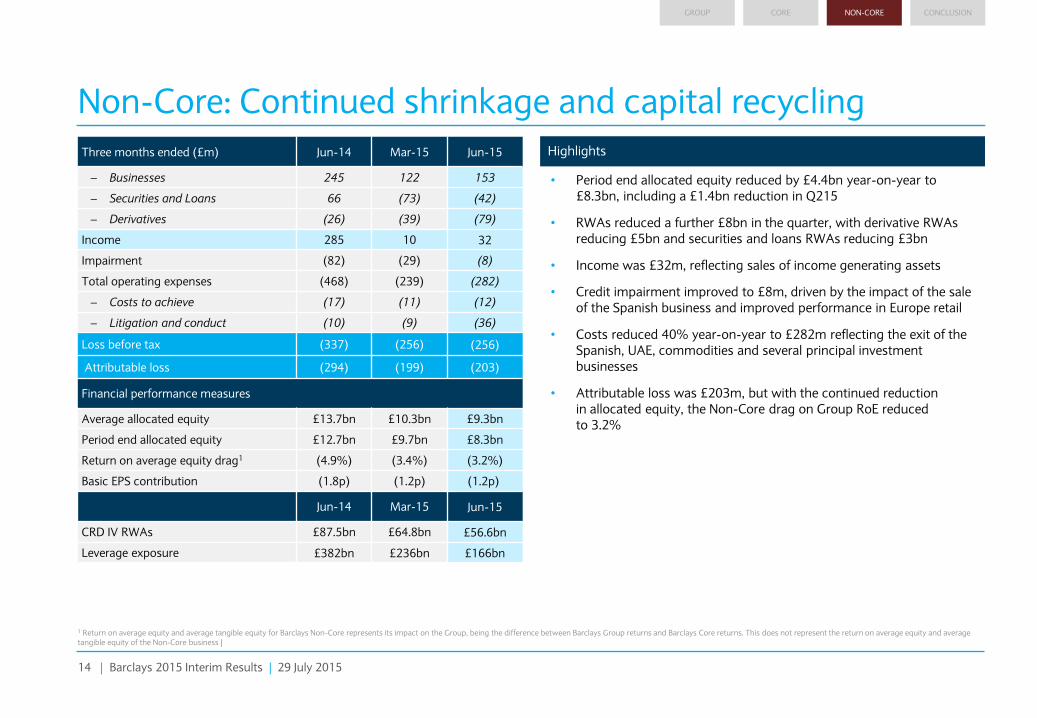
• Period end allocated equity reduced by £4.4bn year-on-year to £8.3bn, including a £1.4bn reduction in Q215
• RWAs reduced a further £8bn in the quarter, with derivative RWAs reducing £5bn and securities and loans RWAs reducing £3bn
• Income was £32m, reflecting sales of income generating assets
• Credit impairment improved to £8m, driven by the impact of the sale of the Spanish business and improved performance in Europe retail
• Costs reduced 40% year-on-year to £282m reflecting the exit of the Spanish, UAE, commodities and several principal investment businesses
• Attributable loss was £203m, but with the continued reduction in allocated equity, the Non-Core drag on Group RoE reduced to 3.2%
Non-Core: Continued shrinkage and capital recycling Highlights Three months ended (£m) Jun-14 Mar-15 Jun-15
– Businesses 245 122 153
– Securities and Loans 66 (73) (42)
– Derivatives (26) (39) (79)
Income 285 10 32
Impairment (82) (29) (8)
Total operating expenses (468) (239) (282)
– Costs to achieve (17) (11) (12)
– Litigation and conduct (10) (9) (36)
Loss before tax (337) (256) (256)
Attributable loss (294) (199) (203)
Financial performance measures
Average allocated equity £13.7bn £10.3bn £9.3bn
Period end allocated equity £12.7bn £9.7bn £8.3bn
Return on average equity drag1 (4.9%) (3.4%) (3.2%)
Basic EPS contribution (1.8p) (1.2p) (1.2p)
Jun-14 Mar-15 Jun-15
CRD IV RWAs £87.5bn £64.8bn £56.6bn
Leverage exposure £382bn £236bn £166bn
B Slide 8 A Slide 14 Q2 2015 Results Slides – V32
15 | Barclays 2015 Interim Results | 29 July 2015
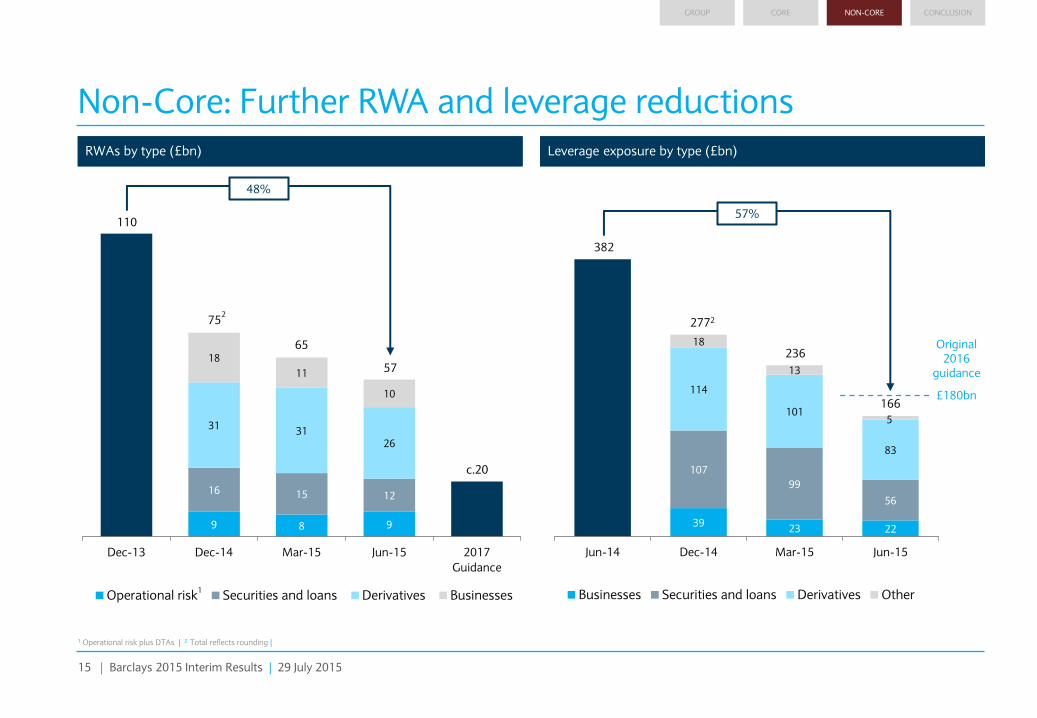
Non-Core: Further RWA and leverage reductions
GROUP CORE NON-CORE CONCLUSION
9 8 9
16 15 12
31 31
26
18
11
10
Dec-13 Dec-14 Mar-15 Jun-15 2017
Guidance
Operational risk Securities and loans Derivatives Businesses
39 23 22
107
99
56
114
101
83
18
13
5
Jun-14 Dec-14 Mar-15 Jun-15
Businesses Securities and loans Derivatives Other
2772
236
1 Operational risk plus DTAs | 2 Total reflects rounding |
1
2
382
110
75
65
57
166
RWA reduction bridge (£bn) Leverage exposure by type (£bn) RWAs by type (£bn) Leverage exposure by type (£bn)
48%
57%
Original 2016
guidance
£180bn
c.20
B Slide 12 A Slide 15 Q2 2015 Results Slides – V32
16 | Barclays 2015 Interim Results | 29 July 2015
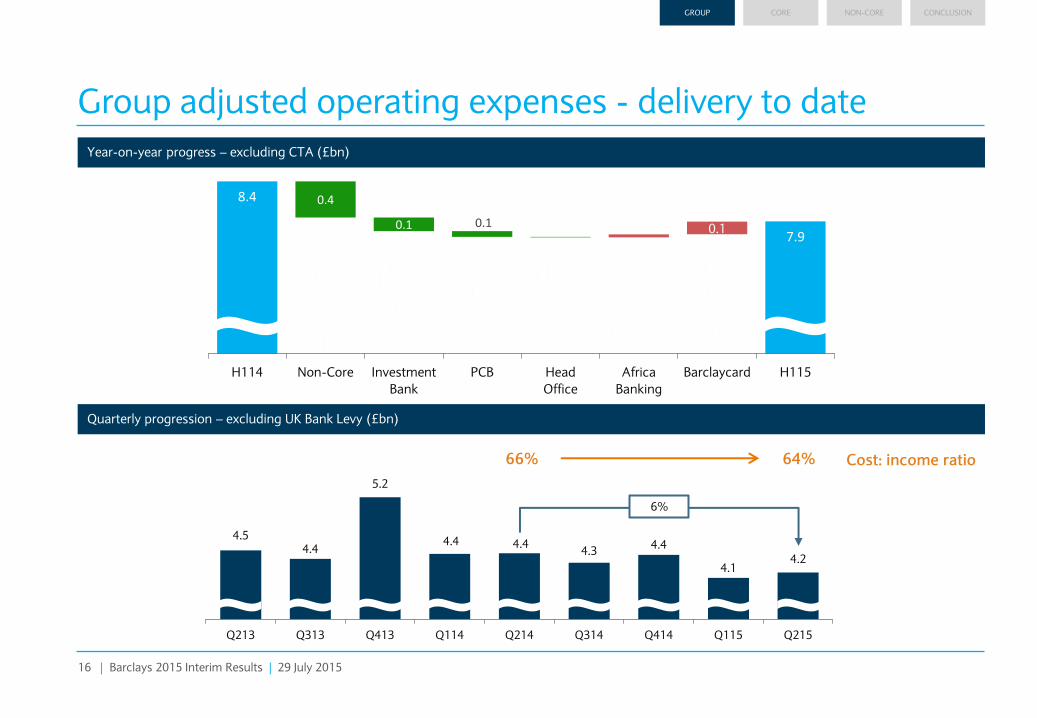
Group adjusted operating expenses - delivery to date
8.4
7.9 0.1
0.4
0.1 0.1
H114 Non-Core Investment
Bank
PCB Head
Office
Africa
Banking
Barclaycard H115
4.5 4.4
5.2
4.4 4.4 4.3
4.4
4.1 4.2
Q213 Q313 Q413 Q114 Q214 Q314 Q414 Q115 Q215
6%
66% Cost: income ratio 64%
GROUP CORE NON-CORE CONCLUSION
Quarterly progression – excluding UK Bank Levy (£bn)
Year-on-year progress – excluding CTA (£bn)
B Slide 44 A Slide 16 Q2 2015 Results Slides – V32
17 | Barclays 2015 Interim Results | 29 July 2015
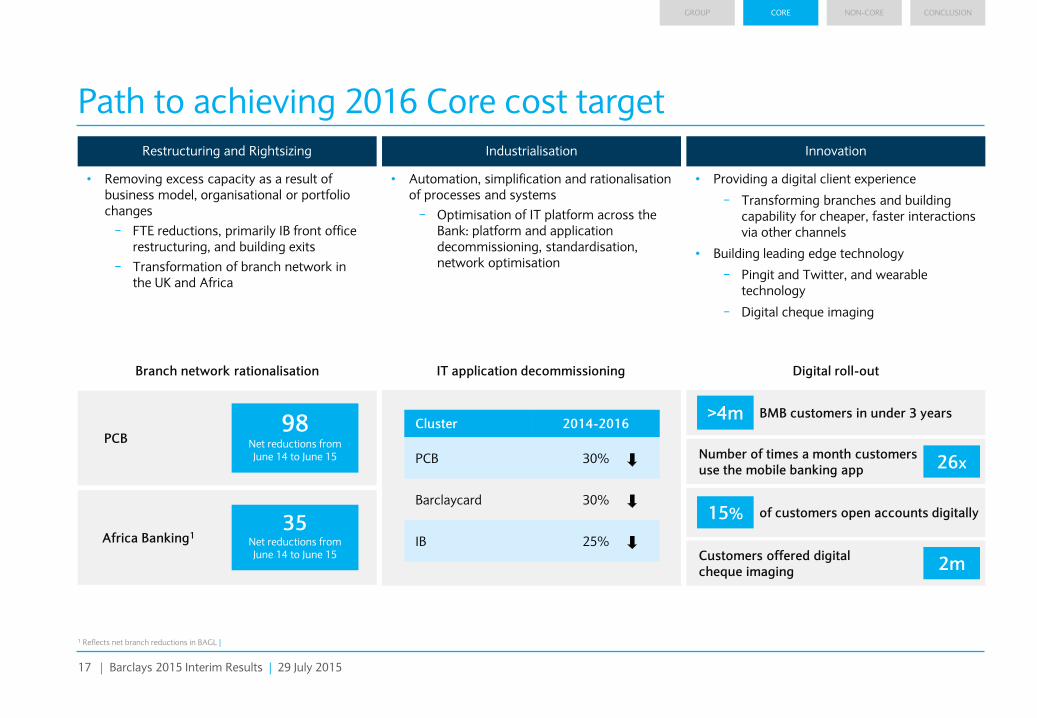
Path to achieving 2016 Core cost target
• Providing a digital client experience
− Transforming branches and building capability for cheaper, faster interactions via other channels
• Building leading edge technology
− Pingit and Twitter, and wearable technology
− Digital cheque imaging
• Removing excess capacity as a result of business model, organisational or portfolio changes
− FTE reductions, primarily IB front office restructuring, and building exits
− Transformation of branch network in the UK and Africa
• Automation, simplification and rationalisation of processes and systems
− Optimisation of IT platform across the Bank: platform and application decommissioning, standardisation, network optimisation
IT application decommissioning Branch network rationalisation
Cluster 2014-2016
PCB 30%
Barclaycard 30%
IB 25%
98 Net reductions from June 14 to June 15
PCB
Africa Banking1 35
Net reductions from June 14 to June 15
>4m BMB customers in under 3 years
Number of times a month customers use the mobile banking app 26x
15% of customers open accounts digitally
GROUP CORE NON-CORE CONCLUSION
Restructuring and Rightsizing Industrialisation Innovation
Digital roll-out
Customers offered digital cheque imaging 2m
1 Reflects net branch reductions in BAGL |
18 | Barclays 2015 Interim Results | 29 July 2015
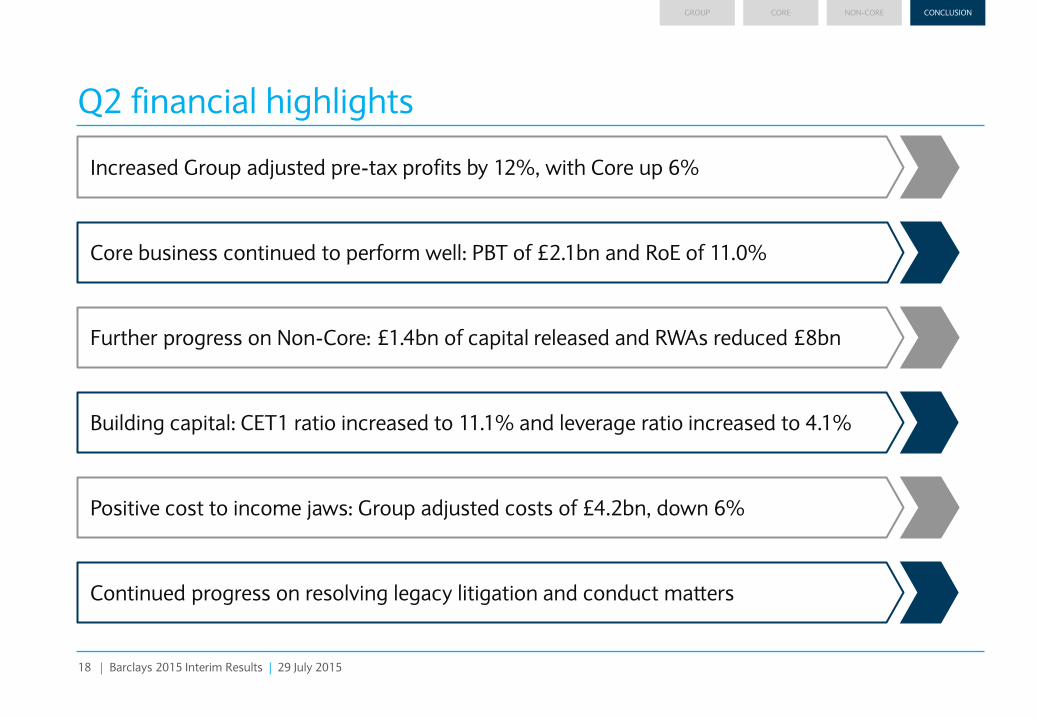
Q2 financial highlights
CORE NON-CORE CONCLUSION GROUP
Increased Group adjusted pre-tax profits by 12%, with Core up 6%
Core business continued to perform well: PBT of £2.1bn and RoE of 11.0%
Further progress on Non-Core: £1.4bn of capital released and RWAs reduced £8bn
Building capital: CET1 ratio increased to 11.1% and leverage ratio increased to 4.1%
Positive cost to income jaws: Group adjusted costs of £4.2bn, down 6%
Continued progress on resolving legacy litigation and conduct matters
Barclays PLC 2015 Interim Results 29 July 2015

Appendices
21 | Barclays 2015 Interim Results | 29 July 2015
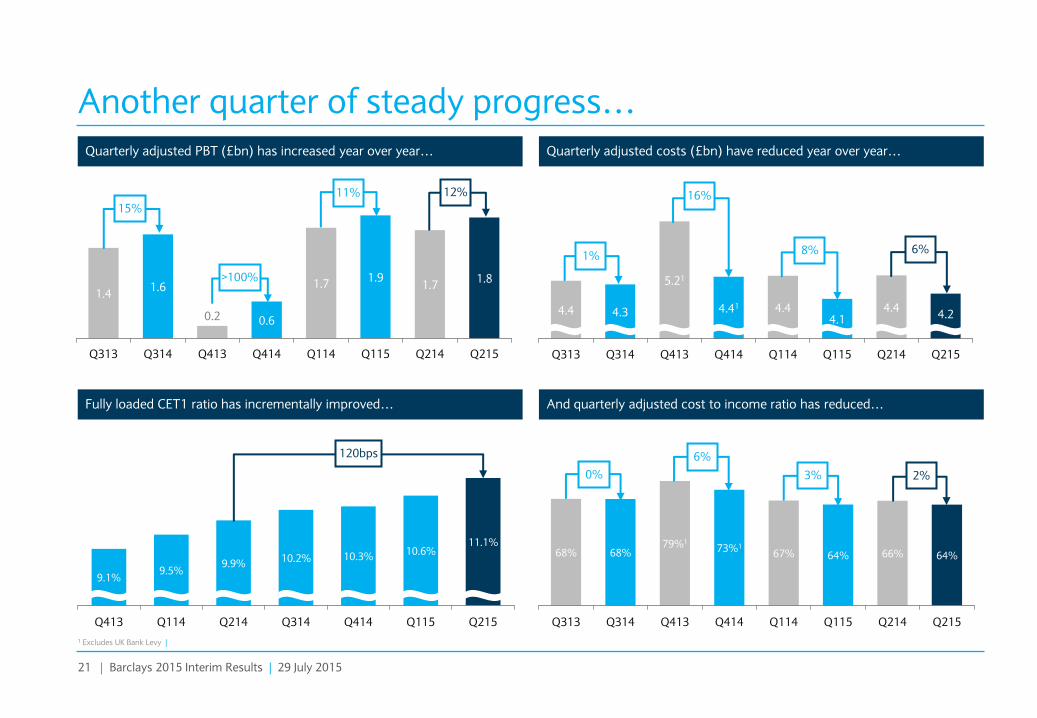
Quarterly adjusted PBT (£bn) has increased year over year…
Another quarter of steady progress…
Quarterly adjusted costs (£bn) have reduced year over year…
1.4 1.6
0.2 0.6
1.7 1.9
1.7 1.8
Q313 Q314 Q413 Q414 Q114 Q115 Q214 Q215
9.1% 9.5%
9.9% 10.2% 10.3%
10.6% 11.1%
Q413 Q114 Q214 Q314 Q414 Q115 Q215
4.4 4.3
5.21
4.41 4.4 4.1
4.4 4.2
Q313 Q314 Q413 Q414 Q114 Q115 Q214 Q215
68% 68% 79%1
73%1 67% 64% 66% 64%
Q313 Q314 Q413 Q414 Q114 Q115 Q214 Q215
6%
120bps
12% 11%
>100%
15%
8%
16%
1%
0%
6%
3% 2%
1 Excludes UK Bank Levy |
Fully loaded CET1 ratio has incrementally improved… And quarterly adjusted cost to income ratio has reduced…
22 | Barclays 2015 Interim Results | 29 July 2015
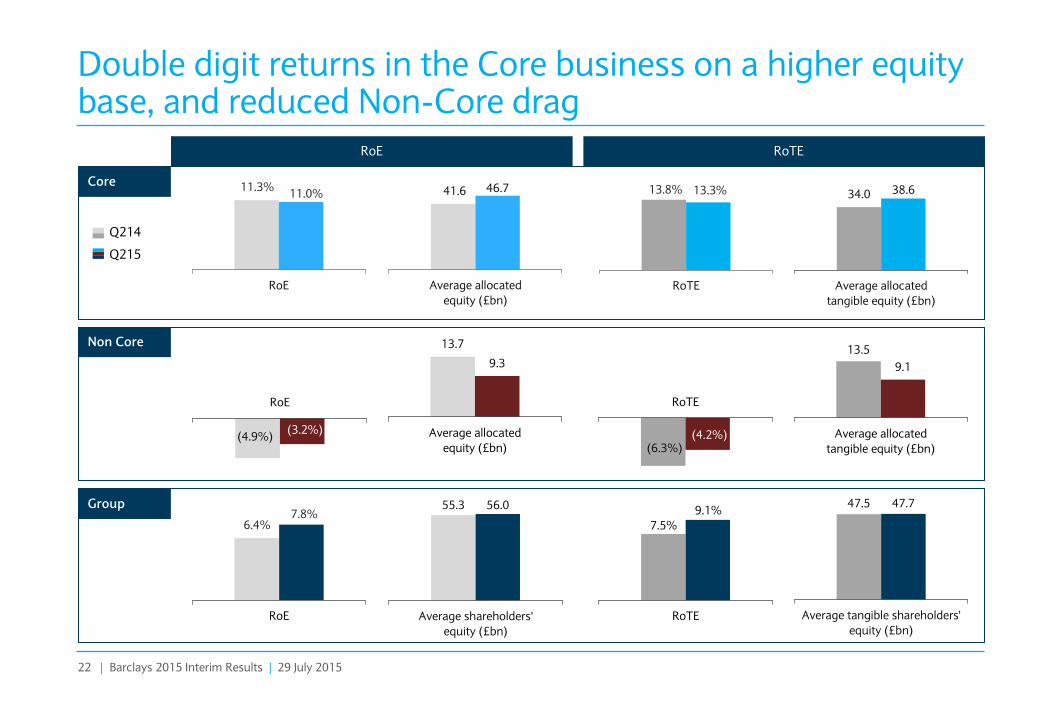
Double digit returns in the Core business on a higher equity base, and reduced Non-Core drag
RoE RoTE
RoTE
13.8% 13.3%
Q214
Q215
RoE
11.3% 11.0%
Core
RoE
6.4% 7.8%
RoTE
7.5%
9.1% Group
RoTE
(6.3%) (4.2%)
RoE
(4.9%) (3.2%)
Non Core
41.6 46.7
Average allocated
equity (£bn)
34.0 38.6
Average allocated
tangible equity (£bn)
13.7
9.3
Average allocated
equity (£bn)
13.5
9.1
Average allocated
tangible equity (£bn)
55.3 56.0
Average shareholders'
equity (£bn)
47.5 47.7
Average tangible shareholders'
equity (£bn)
B Slide 42 A Slide 22 Q2 2015 Results Slides – V32
23 | Barclays 2015 Interim Results | 29 July 2015
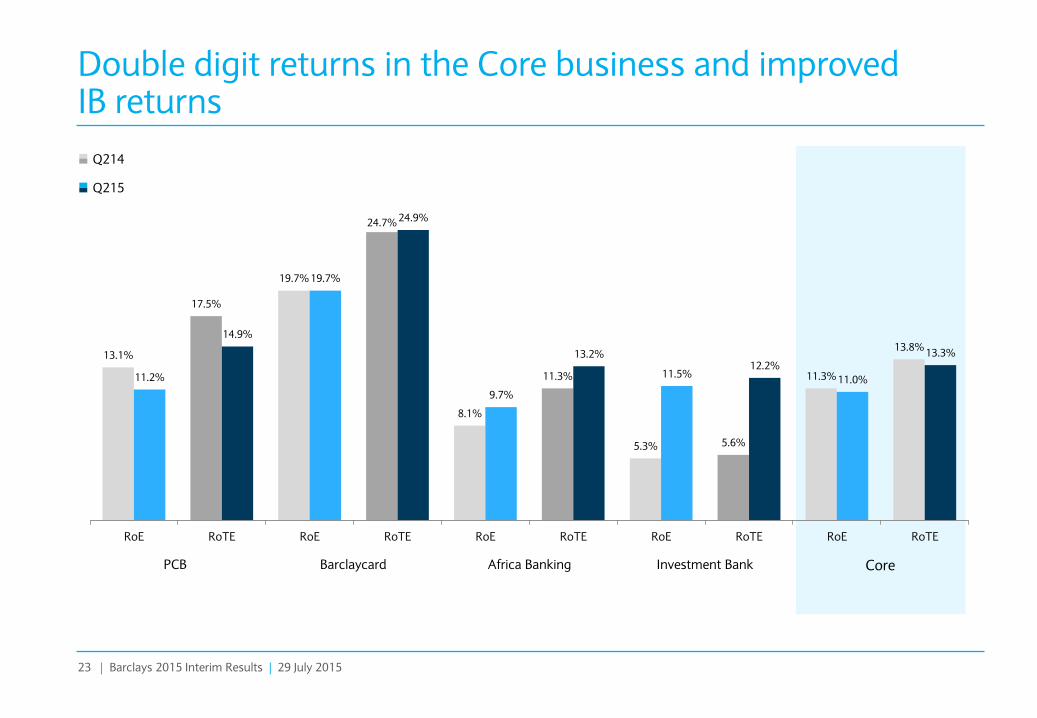
Double digit returns in the Core business and improved IB returns
13.1%
17.5%
19.7%
24.7%
8.1%
11.3%
5.3% 5.6%
11.3%
13.8%
11.2%
14.9%
19.7%
24.9%
9.7%
13.2%
11.5% 12.2%
11.0%
13.3%
RoE RoTE RoE RoTE RoE RoTE RoE RoTE RoE RoTE
Q214
Q215
PCB Barclaycard Africa Banking Investment Bank Core
B Slide 43 A Slide 23 Q2 2015 Results Slides – V32
24 | Barclays 2015 Interim Results | 29 July 2015
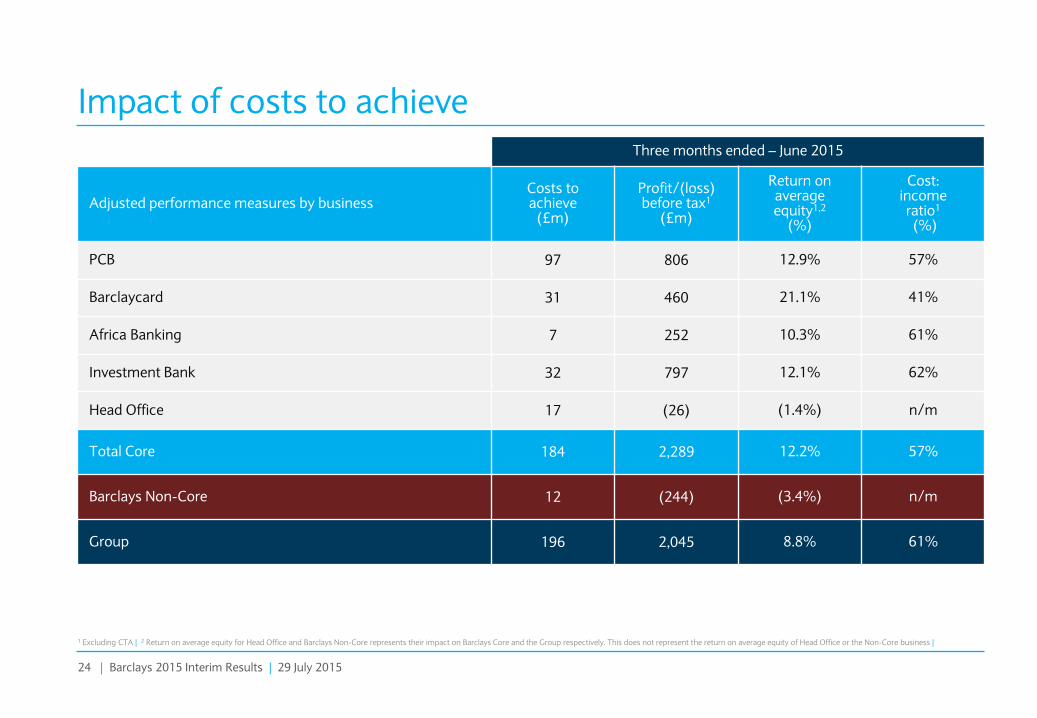
Impact of costs to achieve Three months ended – June 2015
Adjusted performance measures by business Costs to achieve
(£m)
Profit/(loss) before tax1
(£m)
Return on average equity1,2
(%)
Cost: income ratio1 (%)
PCB 97 806 12.9% 57%
Barclaycard 31 460 21.1% 41%
Africa Banking 7 252 10.3% 61%
Investment Bank 32 797 12.1% 62%
Head Office 17 (26) (1.4%) n/m
Total Core 184 2,289 12.2% 57%
Barclays Non-Core 12 (244) (3.4%) n/m
Group 196 2,045 8.8% 61%
1 Excluding CTA | 2 Return on average equity for Head Office and Barclays Non-Core represents their impact on Barclays Core and the Group respectively. This does not represent the return on average equity of Head Office or the Non-Core business |
25 | Barclays 2015 Interim Results | 29 July 2015
Net interest margins and balances
Three months ended – June 2014
Total income (£m)
Non-interest income (£m)
Net interest income (£m)
Average customer assets
(£m)
Net interest margin1
(%)
PCB 2,188 659 1,529 209,040 2.93
Barclaycard 1,082 328 754 33,904 8.92
Africa Banking 895 391 504 34,660 5.83
Total Personal and Corporate Banking, Barclaycard and Africa Banking
4,165 1,378 2,787 277,604 4.03
Group 6,682 3,698 2,984
1 Margins are calculated as net interest income over average customer assets |
Three months ended – June 2015
Total income (£m)
Non-interest income (£m)
Net interest income (£m)
Average customer assets
(£m)
Net interest margin1
(%)
PCB 2,210 608 1,602 215,069 2.99
Barclaycard 1,222 339 883 38,025 9.31
Africa Banking 910 389 521 35,610 5.87
Total Personal and Corporate Banking, Barclaycard and Africa Banking 4,342 1,336 3,006 288,704 4.18
Group 6,552 3,485 3,156
26 | Barclays 2015 Interim Results | 29 July 2015
Africa Banking
456 448 488
Q214 Q115 Q215
Impairment charge (£m)
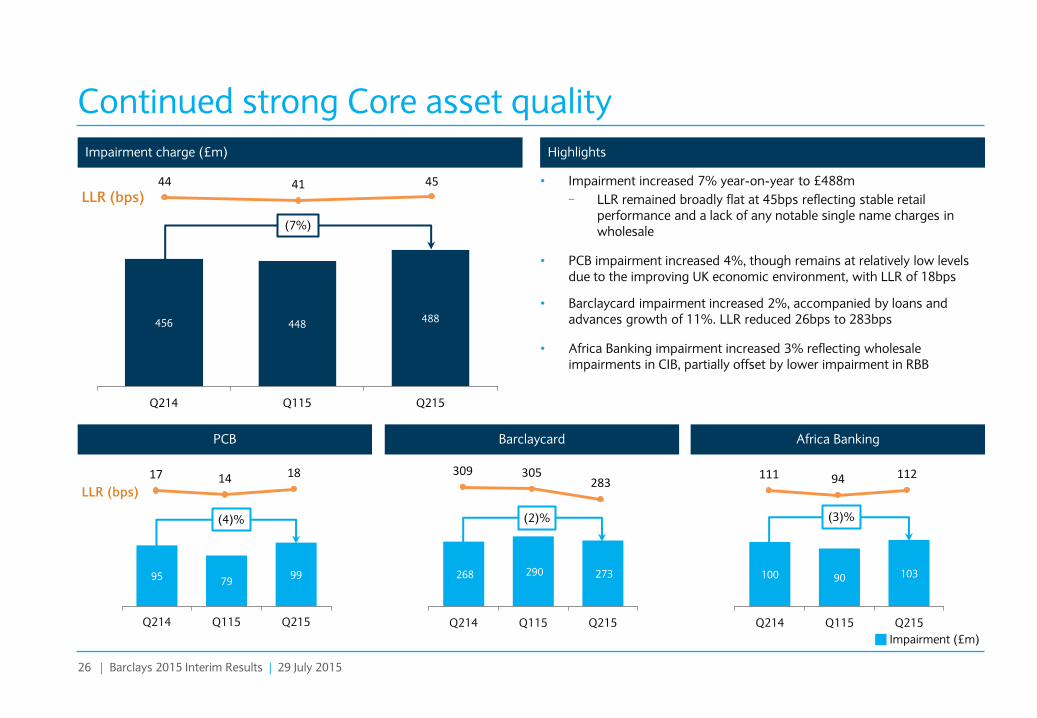
Continued strong Core asset quality
Highlights
95 79 99
Q214 Q115 Q215
268 290 273
Q214 Q115 Q215
100 90 103
Q214 Q115 Q215
Impairment (£m)
LLR (bps)
LLR (bps)
(7%)
(4)% (2)%
17 14 18
44 41 45
309 305 283
111 94 112
• Impairment increased 7% year-on-year to £488m
− LLR remained broadly flat at 45bps reflecting stable retail performance and a lack of any notable single name charges in wholesale
• PCB impairment increased 4%, though remains at relatively low levels due to the improving UK economic environment, with LLR of 18bps
• Barclaycard impairment increased 2%, accompanied by loans and advances growth of 11%. LLR reduced 26bps to 283bps
• Africa Banking impairment increased 3% reflecting wholesale impairments in CIB, partially offset by lower impairment in RBB
(3)%
Barclaycard PCB
B Slide 27 A Slide 26 Q2 2015 Results Slides – V32
27 | Barclays 2015 Interim Results | 29 July 2015
0.55 0.57 0.56
Q214 Q115 Q215
Core operating expenses1 (£bn) Highlights
1.31 1.28 1.35
Q214 Q115 Q215
0.44 0.49 0.53
Q214 Q115 Q215
1.59 1.49 1.37
Q214 Q115 Q215
Operating expenses (£bn)
(3%)
2.4 2.4 2.4
1.3 1.3 1.3
0.2 0.1 0.2
Q214 Q115 Q215
Staff costs Other operating expenses CTA
4.0 3.9 3.9
(19%) (2%)
14%
1 Totals in graph reflect rounding | 2 Relates to the loss on sale of the US Wealth business and US Wealth customer redress |
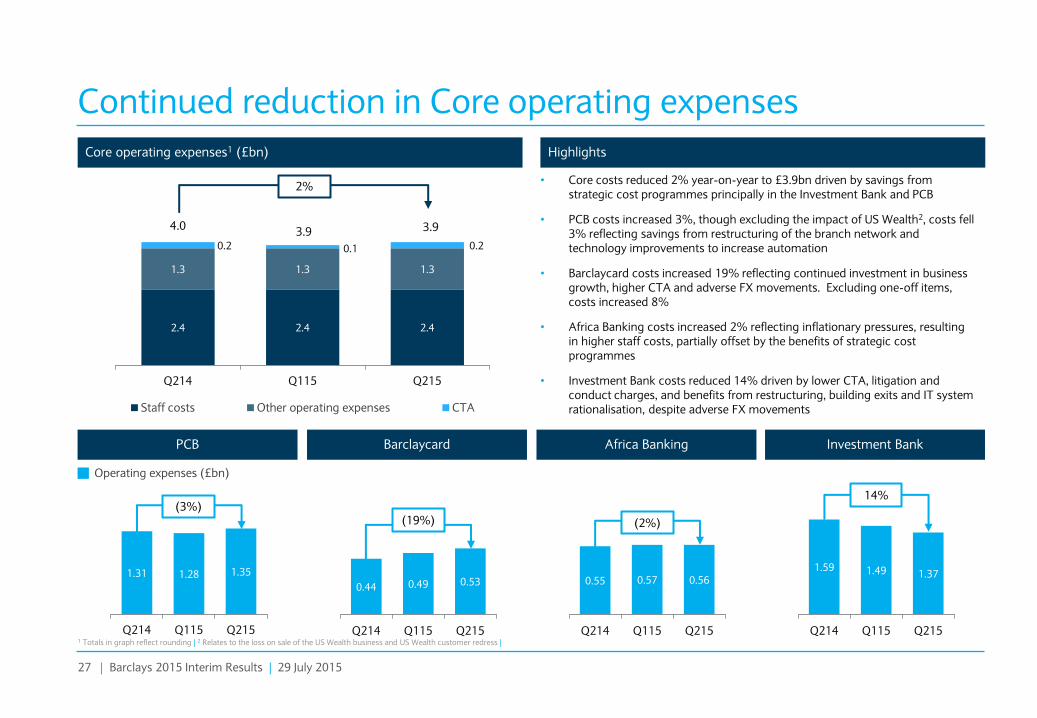
Continued reduction in Core operating expenses
• Core costs reduced 2% year-on-year to £3.9bn driven by savings from strategic cost programmes principally in the Investment Bank and PCB
• PCB costs increased 3%, though excluding the impact of US Wealth2, costs fell 3% reflecting savings from restructuring of the branch network and technology improvements to increase automation
• Barclaycard costs increased 19% reflecting continued investment in business growth, higher CTA and adverse FX movements. Excluding one-off items, costs increased 8%
• Africa Banking costs increased 2% reflecting inflationary pressures, resulting in higher staff costs, partially offset by the benefits of strategic cost programmes
• Investment Bank costs reduced 14% driven by lower CTA, litigation and conduct charges, and benefits from restructuring, building exits and IT system rationalisation, despite adverse FX movements
Investment Bank Africa Banking Barclaycard PCB
2%
B Slide 46 A Slide 27 Q2 2015 Results Slides – V32
28 | Barclays 2015 Interim Results | 29 July 2015
18.7
16.9 c.16.3
FY13 FY14 FY15 Target
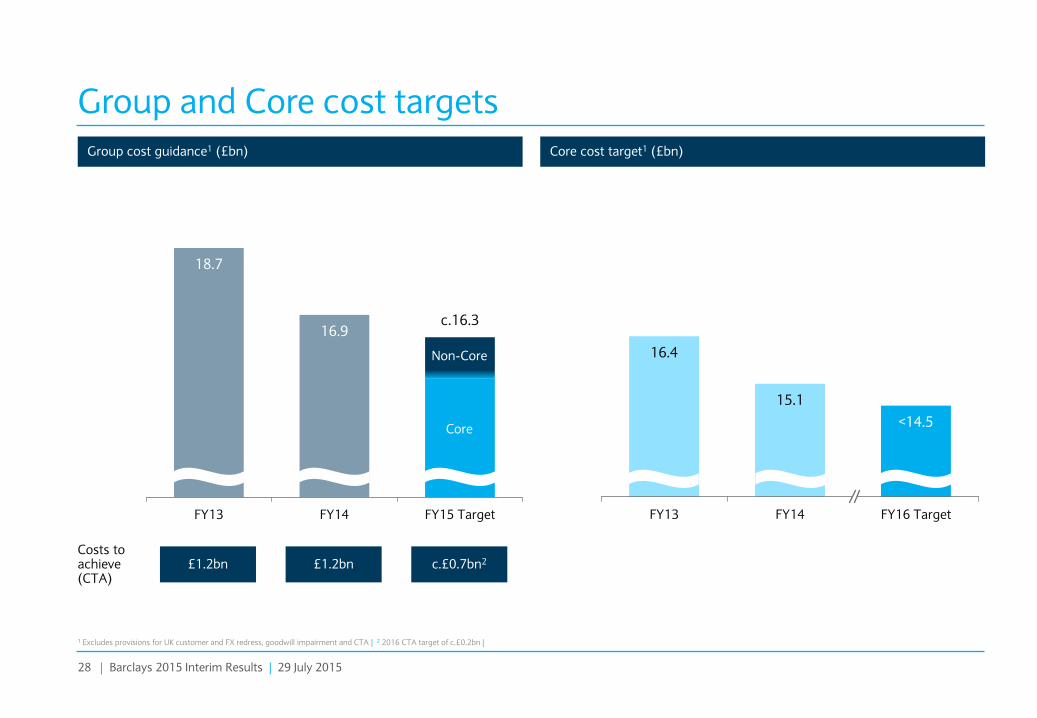
Group and Core cost targets
1 Excludes provisions for UK customer and FX redress, goodwill impairment and CTA | 2 2016 CTA target of c.£0.2bn |
Costs to achieve (CTA)
£1.2bn c.£0.7bn2 £1.2bn
Non-Core
Core
Group cost guidance1 (£bn) Core cost target1 (£bn)
16.4
15.1
<14.5
FY13 FY14 FY16 Target
B Slide 45 A Slide 28 Q2 2015 Results Slides – V32
29 | Barclays 2015 Interim Results | 29 July 2015
464 456 419 441
321 329 219
234
Q313 Q413 Q114 Q214 Q314 Q414 Q115 Q215
Non-Core: Income and cost development
207
368 450
373 285
370
22 10 32
Q313 Q413 Q114 Q214 Q314 Q414 Q115 Q215
Europe retail businesses
(253)
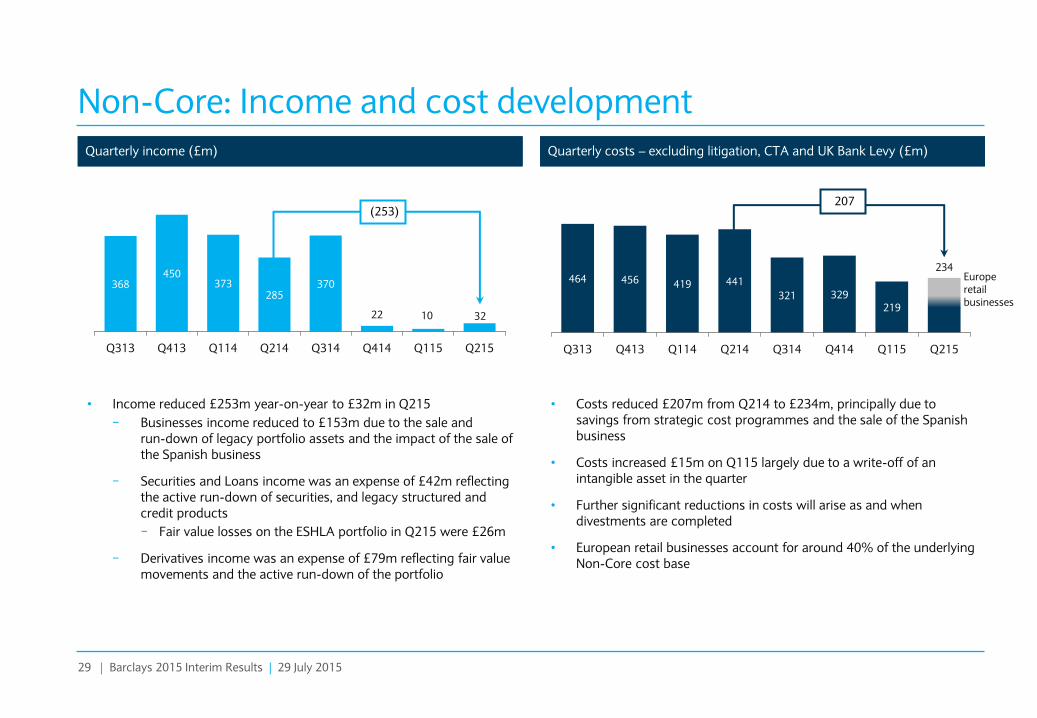
• Income reduced £253m year-on-year to £32m in Q215
− Businesses income reduced to £153m due to the sale and run-down of legacy portfolio assets and the impact of the sale of the Spanish business
− Securities and Loans income was an expense of £42m reflecting the active run-down of securities, and legacy structured and credit products
− Fair value losses on the ESHLA portfolio in Q215 were £26m
− Derivatives income was an expense of £79m reflecting fair value movements and the active run-down of the portfolio
• Costs reduced £207m from Q214 to £234m, principally due to savings from strategic cost programmes and the sale of the Spanish business
• Costs increased £15m on Q115 largely due to a write-off of an intangible asset in the quarter
• Further significant reductions in costs will arise as and when divestments are completed
• European retail businesses account for around 40% of the underlying Non-Core cost base
Non-Core quarterly income (£m) Non-Core quarterly costs – excluding litigation, CTA and BL (£m) Quarterly income (£m) Quarterly costs – excluding litigation, CTA and UK Bank Levy (£m)
30 | Barclays 2015 Interim Results | 29 July 2015
Tangible net asset value (pence per share)
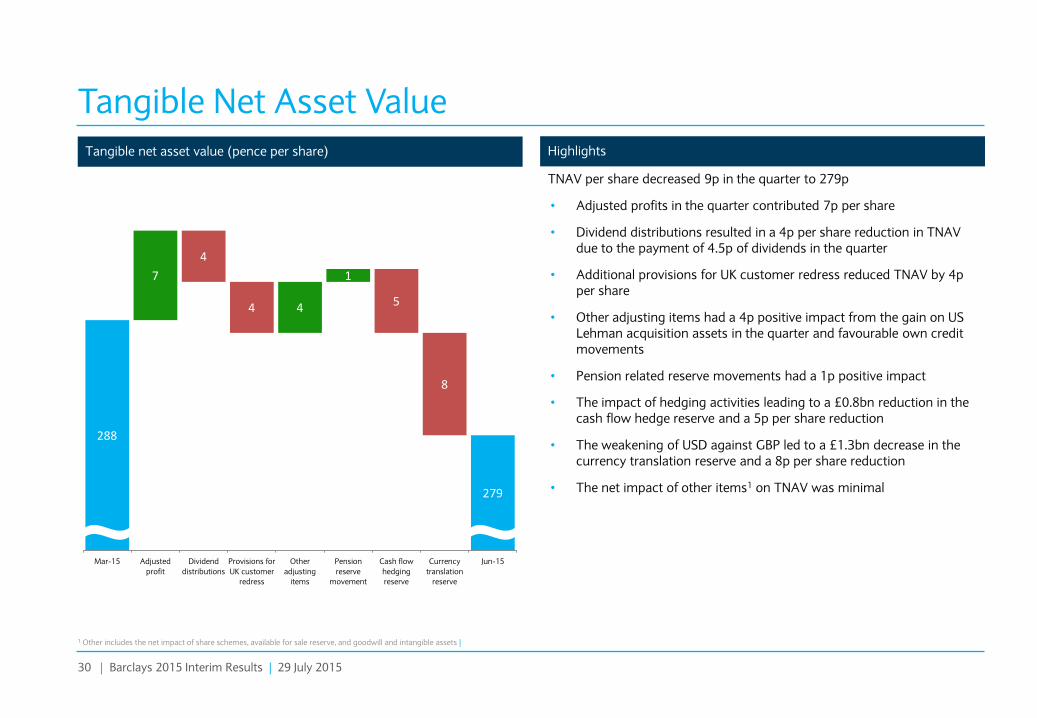
TNAV per share decreased 9p in the quarter to 279p
• Adjusted profits in the quarter contributed 7p per share
• Dividend distributions resulted in a 4p per share reduction in TNAV due to the payment of 4.5p of dividends in the quarter
• Additional provisions for UK customer redress reduced TNAV by 4p per share
• Other adjusting items had a 4p positive impact from the gain on US Lehman acquisition assets in the quarter and favourable own credit movements
• Pension related reserve movements had a 1p positive impact
• The impact of hedging activities leading to a £0.8bn reduction in the cash flow hedge reserve and a 5p per share reduction
• The weakening of USD against GBP led to a £1.3bn decrease in the currency translation reserve and a 8p per share reduction
• The net impact of other items1 on TNAV was minimal
Tangible Net Asset Value
288
279
7
4
1
4
4 5
8
Mar-15 Adjusted
profit
Dividend
distributions
Provisions for
UK customer
redress
Other
adjusting
items
Pension
reserve
movement
Cash flow
hedging
reserve
Currency
translation
reserve
Jun-15
Highlights
1 Other includes the net impact of share schemes, available for sale reserve, and goodwill and intangible assets |
31 | Barclays 2015 Interim Results | 29 July 2015
41.8 42.0
1.2 0.3
0.2
0.5
0.5
0.4
0.6 0.2
1.3
Mar-15 Profit for the
period
Own credit Dividends Net impact of
share schemes
Available for
sale reserve
Currency
translation
reserve
Retirement
benefits
Additional
value
adjustments
(PVA)
Other Jun-15
CET1 capital movement (£bn)
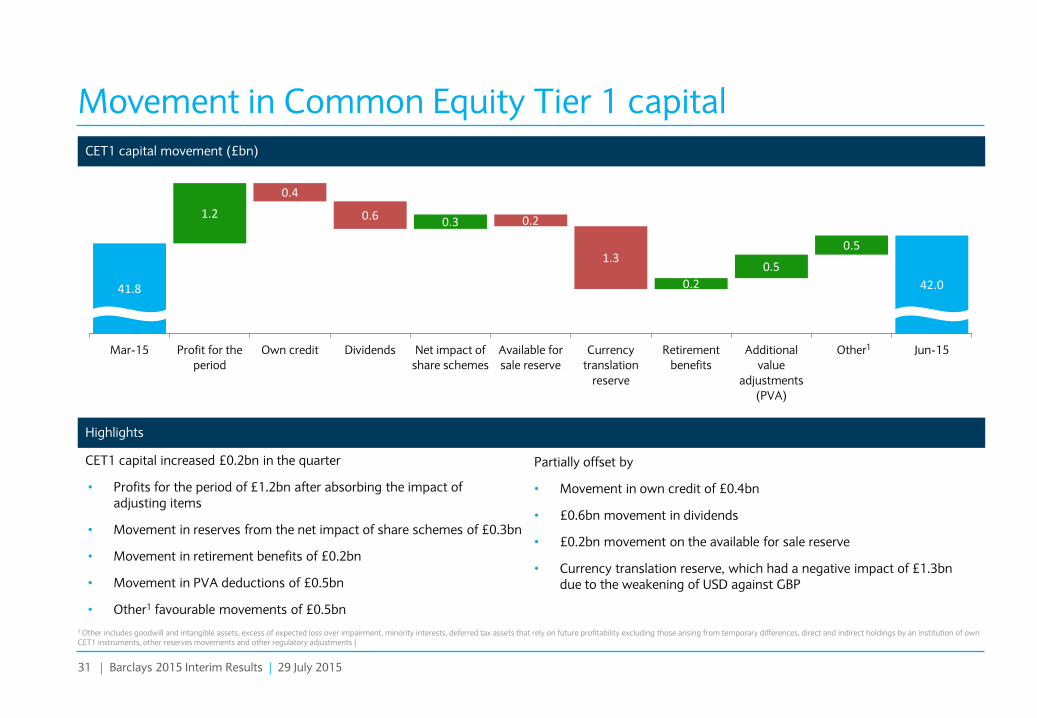
CET1 capital increased £0.2bn in the quarter
• Profits for the period of £1.2bn after absorbing the impact of adjusting items
• Movement in reserves from the net impact of share schemes of £0.3bn
• Movement in retirement benefits of £0.2bn
• Movement in PVA deductions of £0.5bn
• Other1 favourable movements of £0.5bn
Partially offset by
• Movement in own credit of £0.4bn
• £0.6bn movement in dividends
• £0.2bn movement on the available for sale reserve
• Currency translation reserve, which had a negative impact of £1.3bn due to the weakening of USD against GBP
Highlights
Movement in Common Equity Tier 1 capital
1 Other includes goodwill and intangible assets, excess of expected loss over impairment, minority interests, deferred tax assets that rely on future profitability excluding those arising from temporary differences, direct and indirect holdings by an institution of own CET1 instruments, other reserves movements and other regulatory adjustments |
1
32 | Barclays 2015 Interim Results | 29 July 2015
RWAs (£bn)1 Highlights
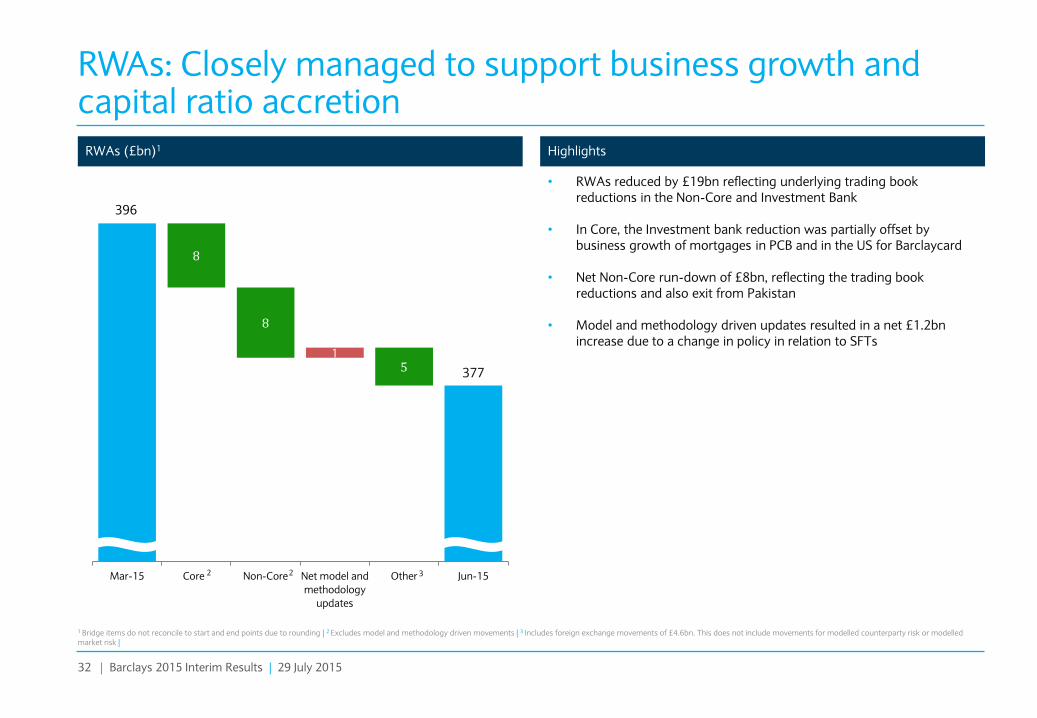
• RWAs reduced by £19bn reflecting underlying trading book reductions in the Non-Core and Investment Bank
• In Core, the Investment bank reduction was partially offset by business growth of mortgages in PCB and in the US for Barclaycard
• Net Non-Core run-down of £8bn, reflecting the trading book reductions and also exit from Pakistan
• Model and methodology driven updates resulted in a net £1.2bn increase due to a change in policy in relation to SFTs
RWAs: Closely managed to support business growth and capital ratio accretion
1 Bridge items do not reconcile to start and end points due to rounding | 2 Excludes model and methodology driven movements | 3 Includes foreign exchange movements of £4.6bn. This does not include movements for modelled counterparty risk or modelled market risk |
1
8
8
5
Mar-15 Core Non-Core Net model and
methodology
updates
Other Jun-152
1
2
3
377
396
A Slide 32 B Slide 11 HI 2015 FI Investor Presentation v6
33 | Barclays 2015 Interim Results | 29 July 2015
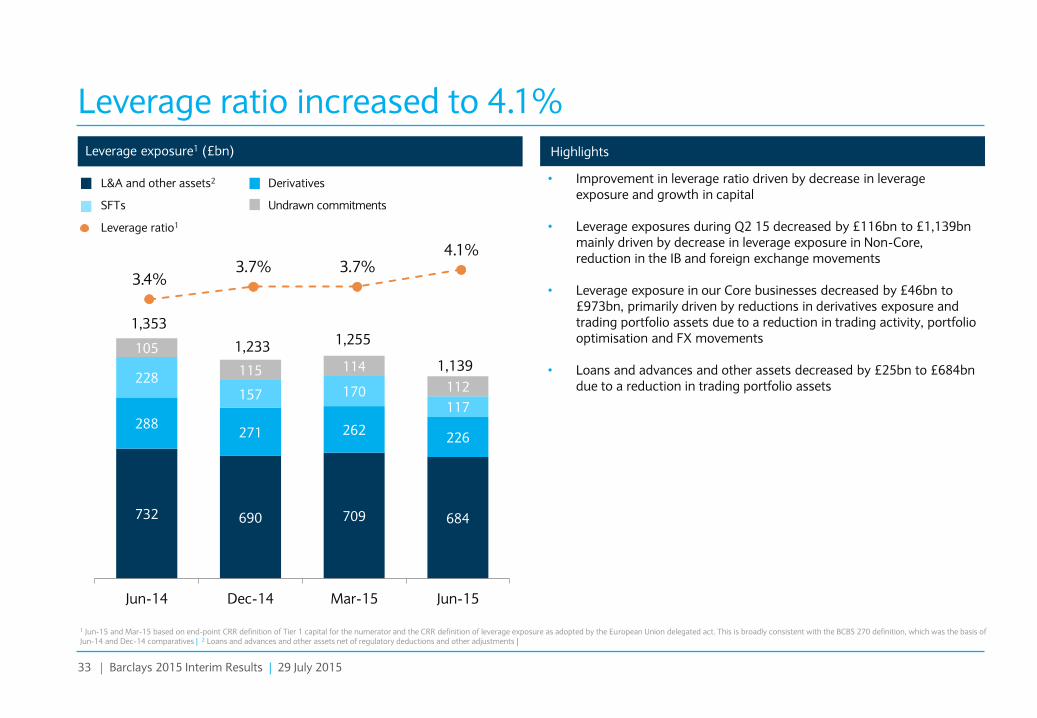
732 690 709 684
288 271 262
226
228 157 170
117
105
115 114
112
Jun-14 Dec-14 Mar-15 Jun-15
3.4% 3.7% 3.7%
4.1%
Leverage exposure1 (£bn) Highlights
Leverage ratio increased to 4.1%
1,353
1,233
L&A and other assets2
SFTs Undrawn commitments
Derivatives
Leverage ratio1
1,139
• Improvement in leverage ratio driven by decrease in leverage exposure and growth in capital
• Leverage exposures during Q2 15 decreased by £116bn to £1,139bn mainly driven by decrease in leverage exposure in Non-Core, reduction in the IB and foreign exchange movements
• Leverage exposure in our Core businesses decreased by £46bn to £973bn, primarily driven by reductions in derivatives exposure and trading portfolio assets due to a reduction in trading activity, portfolio optimisation and FX movements
• Loans and advances and other assets decreased by £25bn to £684bn due to a reduction in trading portfolio assets
1 Jun-15 and Mar-15 based on end-point CRR definition of Tier 1 capital for the numerator and the CRR definition of leverage exposure as adopted by the European Union delegated act. This is broadly consistent with the BCBS 270 definition, which was the basis of Jun-14 and Dec-14 comparatives | 2 Loans and advances and other assets net of regulatory deductions and other adjustments |
1,255
A Slide 33 B Slide 51 HI 2015 FI Investor Presentation v6

Fixed Income Slides
35 | Barclays 2015 Interim Results | 29 July 2015
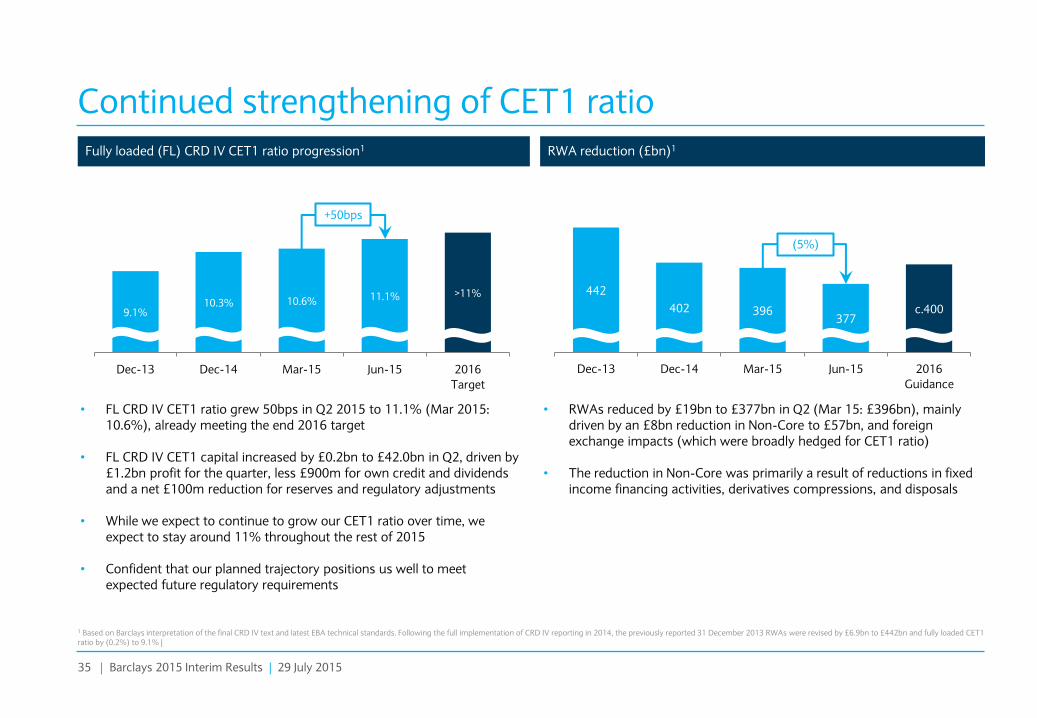
9.1% 10.3% 10.6% 11.1% >11%
Dec-13 Dec-14 Mar-15 Jun-15 2016
Target
442
402 396 377
c.400
Dec-13 Dec-14 Mar-15 Jun-15 2016
Guidance
+50bps
Fully loaded (FL) CRD IV CET1 ratio progression1 RWA reduction (£bn)1
Continued strengthening of CET1 ratio
• FL CRD IV CET1 ratio grew 50bps in Q2 2015 to 11.1% (Mar 2015: 10.6%), already meeting the end 2016 target
• FL CRD IV CET1 capital increased by £0.2bn to £42.0bn in Q2, driven by £1.2bn profit for the quarter, less £900m for own credit and dividends and a net £100m reduction for reserves and regulatory adjustments
• While we expect to continue to grow our CET1 ratio over time, we expect to stay around 11% throughout the rest of 2015
• Confident that our planned trajectory positions us well to meet expected future regulatory requirements
• RWAs reduced by £19bn to £377bn in Q2 (Mar 15: £396bn), mainly driven by an £8bn reduction in Non-Core to £57bn, and foreign exchange impacts (which were broadly hedged for CET1 ratio)
• The reduction in Non-Core was primarily a result of reductions in fixed income financing activities, derivatives compressions, and disposals
1 Based on Barclays interpretation of the final CRD IV text and latest EBA technical standards. Following the full implementation of CRD IV reporting in 2014, the previously reported 31 December 2013 RWAs were revised by £6.9bn to £442bn and fully loaded CET1 ratio by (0.2%) to 9.1% |
(5%)
B: Slide 10 A : Slide 35 C: Slide 9 H1 2015 Fixed income call - slides v20
36 | Barclays 2015 Interim Results | 29 July 2015
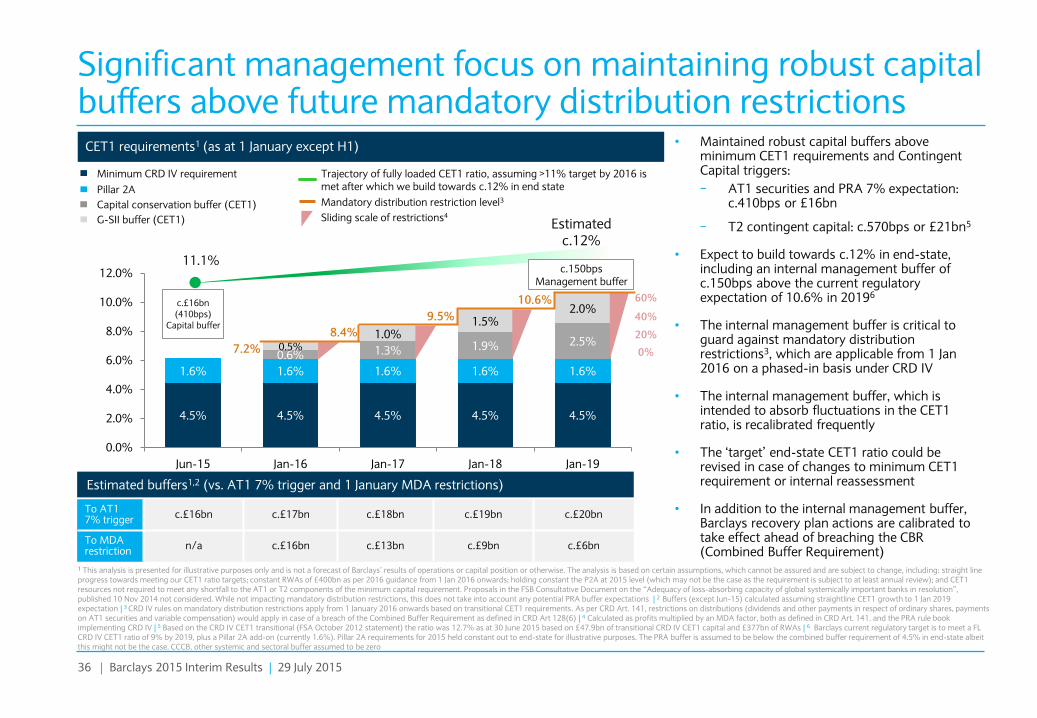
4.5% 4.5% 4.5% 4.5% 4.5%
1.6% 1.6% 1.6% 1.6% 1.6%
0.6% 1.3% 1.9% 2.5% 0.5% 1.0%
1.5% 2.0%
0.0%
2.0%
4.0%
6.0%
8.0%
10.0%
12.0%
Jun-15 Jan-16 Jan-17 Jan-18 Jan-19
Significant management focus on maintaining robust capital buffers above future mandatory distribution restrictions
To AT1 7% trigger
c.£16bn c.£17bn c.£18bn c.£19bn c.£20bn
To MDA restriction
n/a c.£16bn c.£13bn c.£9bn c.£6bn
Estimated buffers1,2 (vs. AT1 7% trigger and 1 January MDA restrictions)
Capital conservation buffer (CET1)
G-SII buffer (CET1)
Trajectory of fully loaded CET1 ratio, assuming >11% target by 2016 is met after which we build towards c.12% in end state
Mandatory distribution restriction level3
Minimum CRD IV requirement
Sliding scale of restrictions4
Pillar 2A
10.6%
8.4%
7.2%
9.5%
CET1 requirements1 (as at 1 January except H1)
60%
40%
20%
0%
c.£16bn (410bps)
Capital buffer
c.150bps Management buffer
11.1%
Estimated c.12%
• Maintained robust capital buffers above minimum CET1 requirements and Contingent Capital triggers:
− AT1 securities and PRA 7% expectation: c.410bps or £16bn
− T2 contingent capital: c.570bps or £21bn5
• Expect to build towards c.12% in end-state, including an internal management buffer of c.150bps above the current regulatory expectation of 10.6% in 20196
• The internal management buffer is critical to guard against mandatory distribution restrictions3, which are applicable from 1 Jan 2016 on a phased-in basis under CRD IV
• The internal management buffer, which is intended to absorb fluctuations in the CET1 ratio, is recalibrated frequently
• The ‘target’ end-state CET1 ratio could be revised in case of changes to minimum CET1 requirement or internal reassessment
• In addition to the internal management buffer, Barclays recovery plan actions are calibrated to take effect ahead of breaching the CBR (Combined Buffer Requirement)
1 This analysis is presented for illustrative purposes only and is not a forecast of Barclays’ results of operations or capital position or otherwise. The analysis is based on certain assumptions, which cannot be assured and are subject to change, including: straight line progress towards meeting our CET1 ratio targets; constant RWAs of £400bn as per 2016 guidance from 1 Jan 2016 onwards; holding constant the P2A at 2015 level (which may not be the case as the requirement is subject to at least annual review); and CET1 resources not required to meet any shortfall to the AT1 or T2 components of the minimum capital requirement. Proposals in the FSB Consultative Document on the “Adequacy of loss-absorbing capacity of global systemically important banks in resolution”, published 10 Nov 2014 not considered. While not impacting mandatory distribution restrictions, this does not take into account any potential PRA buffer expectations | 2 Buffers (except Jun-15) calculated assuming straightline CET1 growth to 1 Jan 2019 expectation | 3 CRD IV rules on mandatory distribution restrictions apply from 1 January 2016 onwards based on transitional CET1 requirements. As per CRD Art. 141, restrictions on distributions (dividends and other payments in respect of ordinary shares, payments on AT1 securities and variable compensation) would apply in case of a breach of the Combined Buffer Requirement as defined in CRD Art 128(6) | 4 Calculated as profits multiplied by an MDA factor, both as defined in CRD Art. 141. and the PRA rule book implementing CRD IV | 5 Based on the CRD IV CET1 transitional (FSA October 2012 statement) the ratio was 12.7% as at 30 June 2015 based on £47.9bn of transitional CRD IV CET1 capital and £377bn of RWAs | 6 Barclays current regulatory target is to meet a FL CRD IV CET1 ratio of 9% by 2019, plus a Pillar 2A add-on (currently 1.6%). Pillar 2A requirements for 2015 held constant out to end-state for illustrative purposes. The PRA buffer is assumed to be below the combined buffer requirement of 4.5% in end-state albeit this might not be the case. CCCB, other systemic and sectoral buffer assumed to be zero
B: Slide 14 A : Slide 36 C: Slide 8 H1 2015 Fixed income call - slides v20
37 | Barclays 2015 Interim Results | 29 July 2015
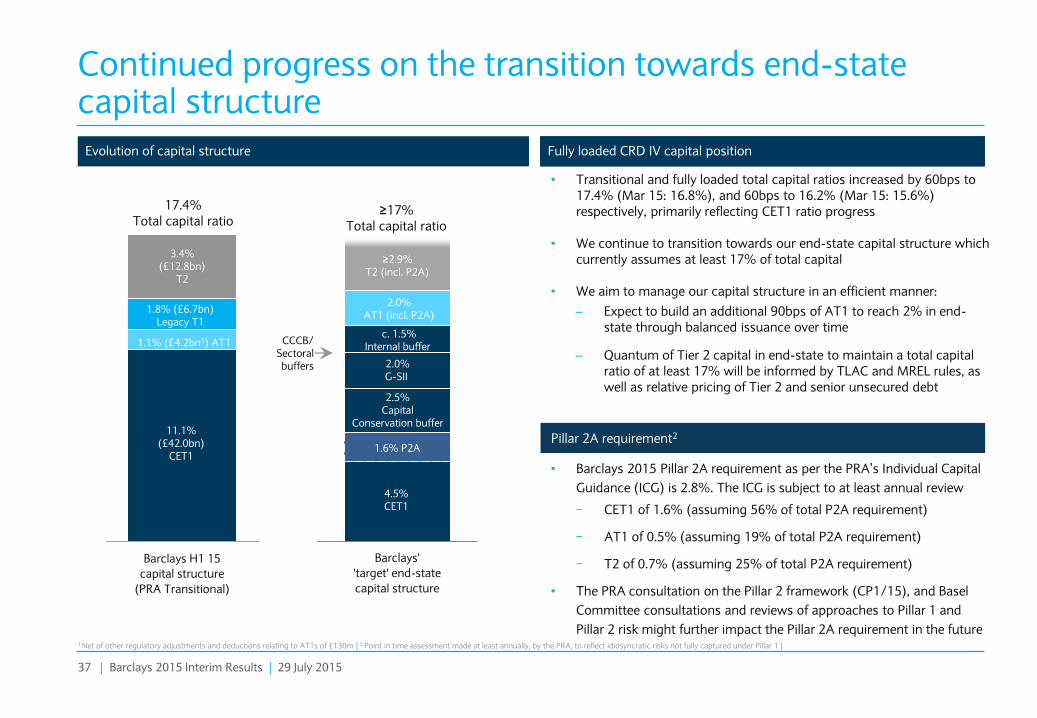
Barclays'
'target' end-state
capital structure
Barclays H1 15
capital structure
(PRA Transitional)
11.1% (£42.0bn)
CET1
1.1% (£4.2bn1) AT1
Continued progress on the transition towards end-state capital structure
• Transitional and fully loaded total capital ratios increased by 60bps to 17.4% (Mar 15: 16.8%), and 60bps to 16.2% (Mar 15: 15.6%) respectively, primarily reflecting CET1 ratio progress
• We continue to transition towards our end-state capital structure which currently assumes at least 17% of total capital
• We aim to manage our capital structure in an efficient manner:
– Expect to build an additional 90bps of AT1 to reach 2% in end-state through balanced issuance over time
– Quantum of Tier 2 capital in end-state to maintain a total capital ratio of at least 17% will be informed by TLAC and MREL rules, as well as relative pricing of Tier 2 and senior unsecured debt
• Barclays 2015 Pillar 2A requirement as per the PRA’s Individual Capital
Guidance (ICG) is 2.8%. The ICG is subject to at least annual review
− CET1 of 1.6% (assuming 56% of total P2A requirement)
− AT1 of 0.5% (assuming 19% of total P2A requirement)
− T2 of 0.7% (assuming 25% of total P2A requirement)
• The PRA consultation on the Pillar 2 framework (CP1/15), and Basel
Committee consultations and reviews of approaches to Pillar 1 and
Pillar 2 risk might further impact the Pillar 2A requirement in the future
3.4% (£12.8bn)
T2
≥17% Total capital ratio
CCCB/ Sectoral buffers
17.4% Total capital ratio
1.6% P2A Pillar 2A requirement2
4.5% CET1
1.8% (£6.7bn) Legacy T1
1 Net of other regulatory adjustments and deductions relating to AT1s of £130m | 2 Point in time assessment made at least annually, by the PRA, to reflect idiosyncratic risks not fully captured under Pillar 1 |
2.5% Capital
Conservation buffer
c. 1.5% Internal buffer
2.0% AT1 (incl. P2A)
≥2.9% T2 (incl. P2A)
2.0% G-SII
Evolution of capital structure blah Fully loaded CRD IV capital position
B: Slide 13 A : Slide 37 C: Slide 9 H1 2015 Fixed income call - slides v20
38 | Barclays 2015 Interim Results | 29 July 2015
1.36
1.23
1.26
1.14
Dec-13 Dec-14 Mar-15 Jun-15
3.0%
3.7% 3.7% 4.1% >4%
Dec-13 Dec-14 Mar-15 Jun-15 2016Target
Leverage ratio progression1 Leverage exposure (£trn)1
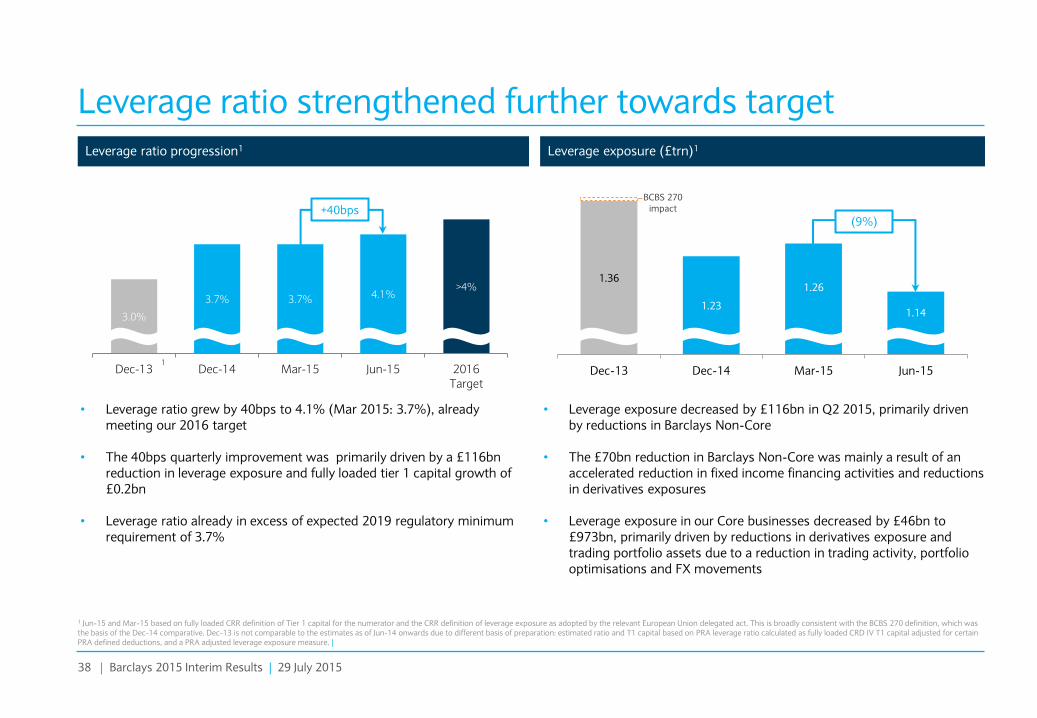
Leverage ratio strengthened further towards target
• Leverage ratio grew by 40bps to 4.1% (Mar 2015: 3.7%), already meeting our 2016 target
• The 40bps quarterly improvement was primarily driven by a £116bn reduction in leverage exposure and fully loaded tier 1 capital growth of £0.2bn
• Leverage ratio already in excess of expected 2019 regulatory minimum requirement of 3.7%
• Leverage exposure decreased by £116bn in Q2 2015, primarily driven by reductions in Barclays Non-Core
• The £70bn reduction in Barclays Non-Core was mainly a result of an accelerated reduction in fixed income financing activities and reductions in derivatives exposures
• Leverage exposure in our Core businesses decreased by £46bn to £973bn, primarily driven by reductions in derivatives exposure and trading portfolio assets due to a reduction in trading activity, portfolio optimisations and FX movements
1
BCBS 270 impact
1 Jun-15 and Mar-15 based on fully loaded CRR definition of Tier 1 capital for the numerator and the CRR definition of leverage exposure as adopted by the relevant European Union delegated act. This is broadly consistent with the BCBS 270 definition, which was the basis of the Dec-14 comparative. Dec-13 is not comparable to the estimates as of Jun-14 onwards due to different basis of preparation: estimated ratio and T1 capital based on PRA leverage ratio calculated as fully loaded CRD IV T1 capital adjusted for certain PRA defined deductions, and a PRA adjusted leverage exposure measure. |
+40bps (9%)
B: Slide 14 A : Slide 38 C: Slide 7 H1 2015 Fixed income call - slides v20
39 | Barclays 2015 Interim Results | 29 July 2015
Balance sheet
FY 14 H1 15
Notes £m £m
Assets
Investment in subsidiary 33,743 34,303
Loans and advances to subsidiary 2,866 5,318
Derivative financial instrument 313 194
Other assets 174 184
Total assets 37,096 39,999
Liabilities
Deposits from banks 528 519
Subordinated liabilities 810 800
Debt securities in issue 2,056 4,518
Other liabilities 10 -
Total liabilities 3,404 5,837
Shareholders’ equity
Called up share capital 4,125 4,193
Share premium account 16,684 17,330
Other equity instruments 4,326 4,326
Capital redemption reserve 394 394
Retained earnings 8,163 7,919
Total shareholders’ equity 33,692 34,162
Total liabilities and shareholders’ equity 37,096 39,999
Barclays PLC parent company balance sheet Notes
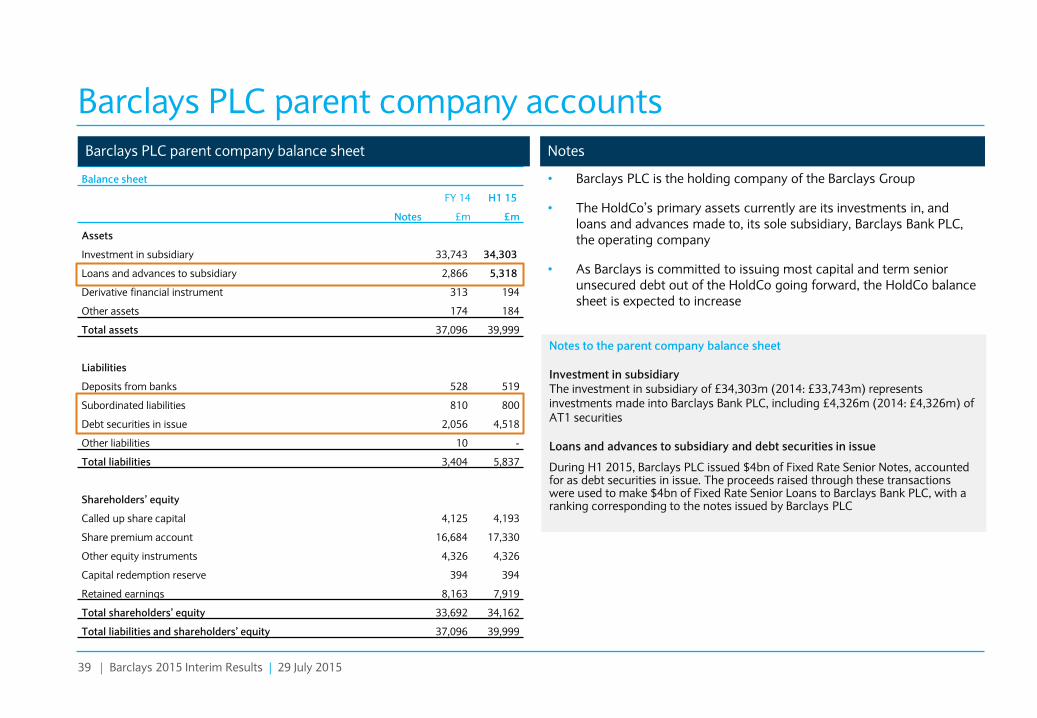
• Barclays PLC is the holding company of the Barclays Group
• The HoldCo’s primary assets currently are its investments in, and loans and advances made to, its sole subsidiary, Barclays Bank PLC, the operating company
• As Barclays is committed to issuing most capital and term senior unsecured debt out of the HoldCo going forward, the HoldCo balance sheet is expected to increase
Barclays PLC parent company accounts
Notes to the parent company balance sheet Investment in subsidiary The investment in subsidiary of £34,303m (2014: £33,743m) represents investments made into Barclays Bank PLC, including £4,326m (2014: £4,326m) of AT1 securities Loans and advances to subsidiary and debt securities in issue
During H1 2015, Barclays PLC issued $4bn of Fixed Rate Senior Notes, accounted for as debt securities in issue. The proceeds raised through these transactions were used to make $4bn of Fixed Rate Senior Loans to Barclays Bank PLC, with a ranking corresponding to the notes issued by Barclays PLC
B: Slide 17 A : Slide 39 C: Slide 17 H1 2015 Fixed income call - slides v20
40 | Barclays 2015 Interim Results | 29 July 2015
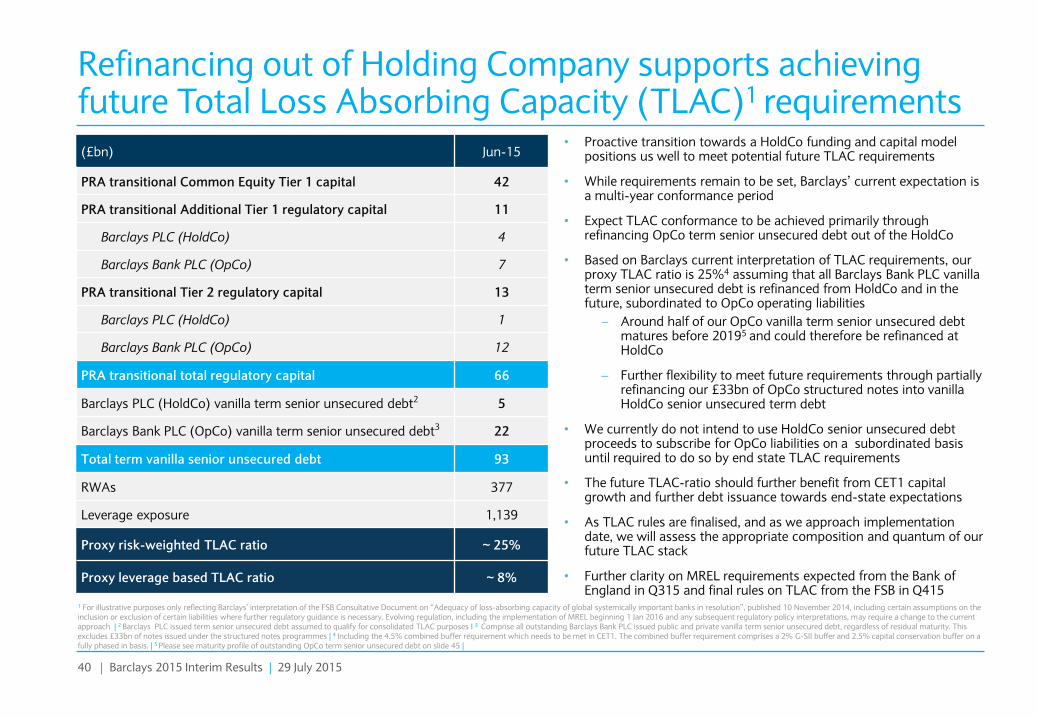
• Proactive transition towards a HoldCo funding and capital model positions us well to meet potential future TLAC requirements
• While requirements remain to be set, Barclays’ current expectation is a multi-year conformance period
• Expect TLAC conformance to be achieved primarily through refinancing OpCo term senior unsecured debt out of the HoldCo
• Based on Barclays current interpretation of TLAC requirements, our proxy TLAC ratio is 25%4 assuming that all Barclays Bank PLC vanilla term senior unsecured debt is refinanced from HoldCo and in the future, subordinated to OpCo operating liabilities
– Around half of our OpCo vanilla term senior unsecured debt matures before 20195 and could therefore be refinanced at HoldCo
– Further flexibility to meet future requirements through partially refinancing our £33bn of OpCo structured notes into vanilla HoldCo senior unsecured term debt
• We currently do not intend to use HoldCo senior unsecured debt proceeds to subscribe for OpCo liabilities on a subordinated basis until required to do so by end state TLAC requirements
• The future TLAC-ratio should further benefit from CET1 capital growth and further debt issuance towards end-state expectations
• As TLAC rules are finalised, and as we approach implementation date, we will assess the appropriate composition and quantum of our future TLAC stack
• Further clarity on MREL requirements expected from the Bank of England in Q315 and final rules on TLAC from the FSB in Q415
Refinancing out of Holding Company supports achieving future Total Loss Absorbing Capacity (TLAC)1 requirements
(£bn) Jun-15
PRA transitional Common Equity Tier 1 capital 42
PRA transitional Additional Tier 1 regulatory capital 11
Barclays PLC (HoldCo) 4
Barclays Bank PLC (OpCo) 7
PRA transitional Tier 2 regulatory capital 13
Barclays PLC (HoldCo) 1
Barclays Bank PLC (OpCo) 12
PRA transitional total regulatory capital 66
Barclays PLC (HoldCo) vanilla term senior unsecured debt2 5
Barclays Bank PLC (OpCo) vanilla term senior unsecured debt3 22
Total term vanilla senior unsecured debt 93
RWAs 377
Leverage exposure 1,139
Proxy risk-weighted TLAC ratio ~ 25%
Proxy leverage based TLAC ratio ~ 8%
1 For illustrative purposes only reflecting Barclays’ interpretation of the FSB Consultative Document on “Adequacy of loss-absorbing capacity of global systemically important banks in resolution”, published 10 November 2014, including certain assumptions on the inclusion or exclusion of certain liabilities where further regulatory guidance is necessary. Evolving regulation, including the implementation of MREL beginning 1 Jan 2016 and any subsequent regulatory policy interpretations, may require a change to the current approach | 2 Barclays PLC issued term senior unsecured debt assumed to qualify for consolidated TLAC purposes I 3 Comprise all outstanding Barclays Bank PLC issued public and private vanilla term senior unsecured debt, regardless of residual maturity. This excludes £33bn of notes issued under the structured notes programmes | 4 Including the 4.5% combined buffer requirement which needs to be met in CET1. The combined buffer requirement comprises a 2% G-SII buffer and 2.5% capital conservation buffer on a fully phased in basis. | 5 Please see maturity profile of outstanding OpCo term senior unsecured debt on slide 45 |
B: Slide 19 A : Slide 40 C: Slide 10 H1 2015 Fixed income call - slides v20
41 | Barclays 2015 Interim Results | 29 July 2015
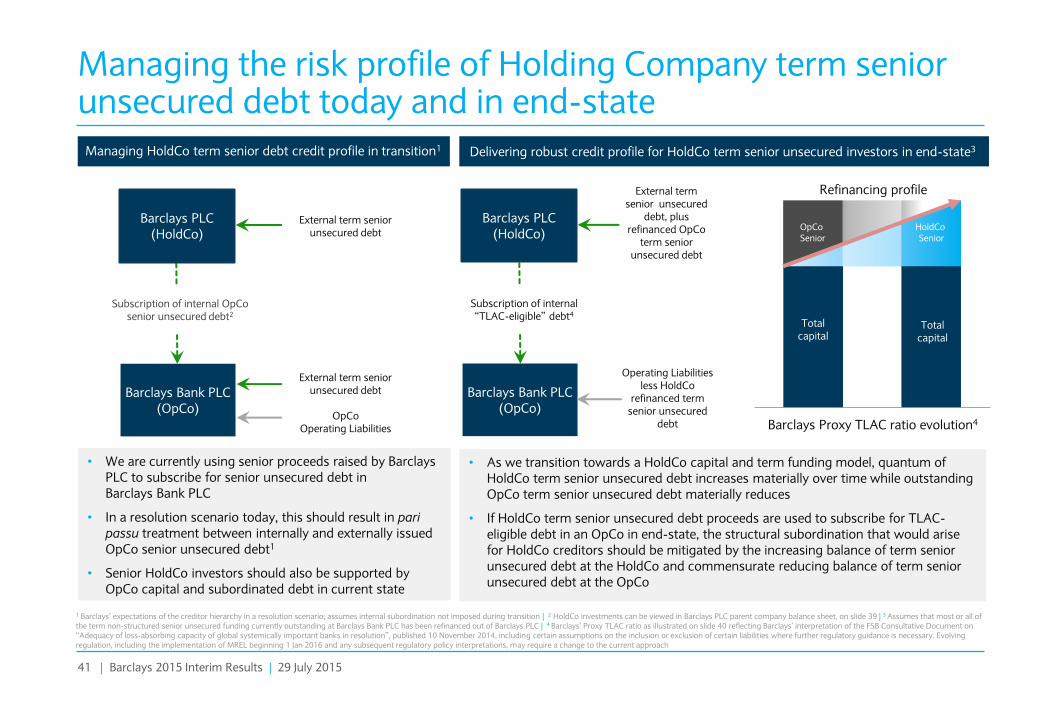
• As we transition towards a HoldCo capital and term funding model, quantum of HoldCo term senior unsecured debt increases materially over time while outstanding OpCo term senior unsecured debt materially reduces
• If HoldCo term senior unsecured debt proceeds are used to subscribe for TLAC-eligible debt in an OpCo in end-state, the structural subordination that would arise for HoldCo creditors should be mitigated by the increasing balance of term senior unsecured debt at the HoldCo and commensurate reducing balance of term senior unsecured debt at the OpCo
• We are currently using senior proceeds raised by Barclays PLC to subscribe for senior unsecured debt in Barclays Bank PLC
• In a resolution scenario today, this should result in pari passu treatment between internally and externally issued OpCo senior unsecured debt1
• Senior HoldCo investors should also be supported by OpCo capital and subordinated debt in current state
Managing the risk profile of Holding Company term senior unsecured debt today and in end-state
Barclays PLC (HoldCo)
Barclays Bank PLC (OpCo)
External term senior unsecured debt
Subscription of internal OpCo senior unsecured debt2
Managing HoldCo term senior debt credit profile in transition1 Delivering robust credit profile for HoldCo term senior unsecured investors in end-state3
Barclays PLC (HoldCo)
Barclays Bank PLC (OpCo)
External term senior unsecured
debt, plus refinanced OpCo
term senior unsecured debt
Subscription of internal “TLAC-eligible” debt4
Operating Liabilities less HoldCo
refinanced term senior unsecured
debt
1 Barclays’ expectations of the creditor hierarchy in a resolution scenario; assumes internal subordination not imposed during transition | 2 HoldCo investments can be viewed in Barclays PLC parent company balance sheet, on slide 39 | 3 Assumes that most or all of the term non-structured senior unsecured funding currently outstanding at Barclays Bank PLC has been refinanced out of Barclays PLC | 4 Barclays’ Proxy TLAC ratio as illustrated on slide 40 reflecting Barclays’ interpretation of the FSB Consultative Document on “Adequacy of loss-absorbing capacity of global systemically important banks in resolution”, published 10 November 2014, including certain assumptions on the inclusion or exclusion of certain liabilities where further regulatory guidance is necessary. Evolving regulation, including the implementation of MREL beginning 1 Jan 2016 and any subsequent regulatory policy interpretations, may require a change to the current approach
External term senior unsecured debt
OpCo
Operating Liabilities
Total capital
Total capital
Barclays Proxy TLAC ratio evolution4
HoldCo Senior
OpCo Senior
Refinancing profile
B: Slide 20 A : Slide 41 C: Slide 11 H1 2015 Fixed income call - slides v20
42 | Barclays 2015 Interim Results | 29 July 2015
Evolving group structure
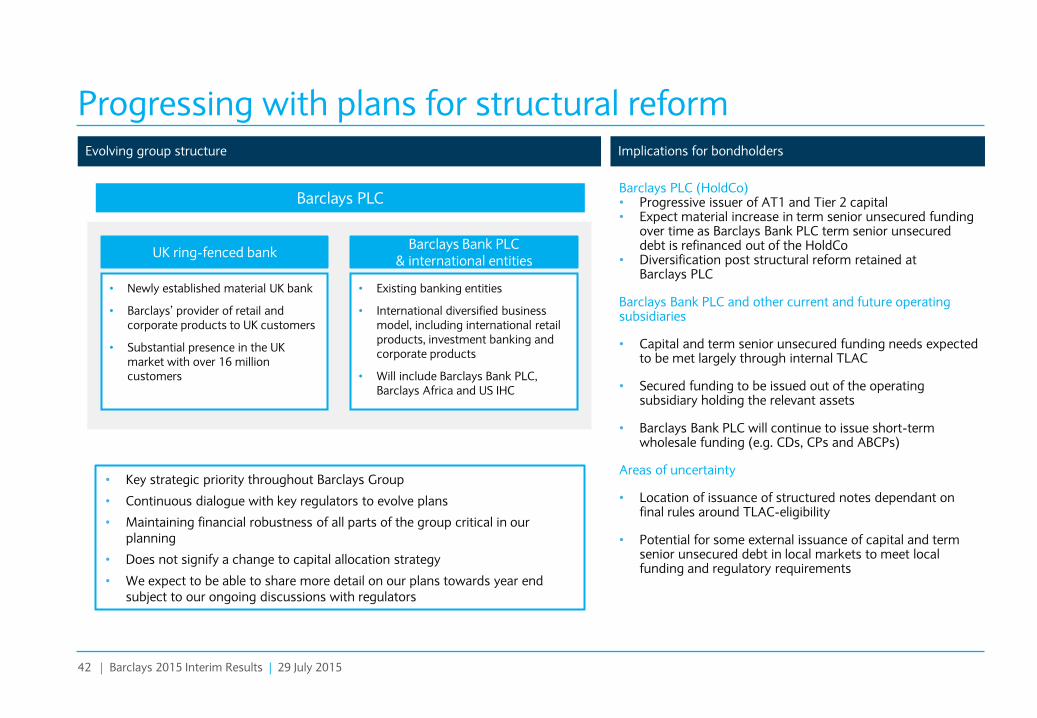
Progressing with plans for structural reform
Barclays PLC Barclays PLC (HoldCo) • Progressive issuer of AT1 and Tier 2 capital • Expect material increase in term senior unsecured funding
over time as Barclays Bank PLC term senior unsecured debt is refinanced out of the HoldCo
• Diversification post structural reform retained at Barclays PLC
Barclays Bank PLC and other current and future operating subsidiaries
• Capital and term senior unsecured funding needs expected to be met largely through internal TLAC
• Secured funding to be issued out of the operating subsidiary holding the relevant assets
• Barclays Bank PLC will continue to issue short-term wholesale funding (e.g. CDs, CPs and ABCPs)
Areas of uncertainty
• Location of issuance of structured notes dependant on final rules around TLAC-eligibility
• Potential for some external issuance of capital and term senior unsecured debt in local markets to meet local funding and regulatory requirements
Barclays Bank PLC & international entities
• Newly established material UK bank
• Barclays’ provider of retail and corporate products to UK customers
• Substantial presence in the UK market with over 16 million customers
• Existing banking entities
• International diversified business model, including international retail products, investment banking and corporate products
• Will include Barclays Bank PLC, Barclays Africa and US IHC
UK ring-fenced bank
Implications for bondholders
• Key strategic priority throughout Barclays Group
• Continuous dialogue with key regulators to evolve plans
• Maintaining financial robustness of all parts of the group critical in our planning
• Does not signify a change to capital allocation strategy
• We expect to be able to share more detail on our plans towards year end subject to our ongoing discussions with regulators
B: Slide 21 A : Slide 42 C: Slide 12 H1 2015 Fixed income call - slides v20
43 | Barclays 2015 Interim Results | 29 July 2015
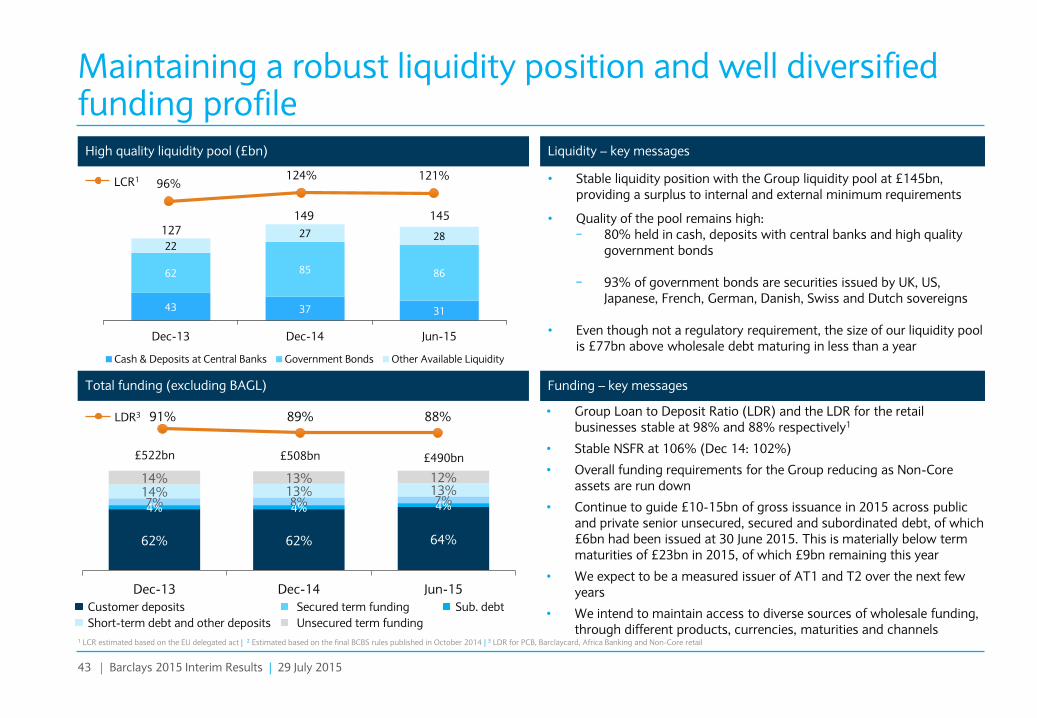
96% 124% 121%
91% 89% 88%
43 37 31
62 85 86
22 27 28
Dec-13 Dec-14 Jun-15
Cash & Deposits at Central Banks Government Bonds Other Available Liquidity
145
• Stable liquidity position with the Group liquidity pool at £145bn, providing a surplus to internal and external minimum requirements
• Quality of the pool remains high: − 80% held in cash, deposits with central banks and high quality
government bonds
− 93% of government bonds are securities issued by UK, US, Japanese, French, German, Danish, Swiss and Dutch sovereigns
• Even though not a regulatory requirement, the size of our liquidity pool is £77bn above wholesale debt maturing in less than a year
Maintaining a robust liquidity position and well diversified funding profile
149 127
1 LCR estimated based on the EU delegated act | 2 Estimated based on the final BCBS rules published in October 2014 | 3 LDR for PCB, Barclaycard, Africa Banking and Non-Core retail
High quality liquidity pool (£bn)
LCR1
62% 62% 64%
4% 4% 4% 7% 8% 7% 14% 13% 13% 14% 13% 12%
Dec-13 Dec-14 Jun-15
£490bn £522bn £508bn
Customer deposits Sub. debt Secured term funding
Short-term debt and other deposits Unsecured term funding
Total funding (excluding BAGL)
Liquidity – key messages
Funding – key messages
LDR3 • Group Loan to Deposit Ratio (LDR) and the LDR for the retail businesses stable at 98% and 88% respectively1
• Stable NSFR at 106% (Dec 14: 102%)
• Overall funding requirements for the Group reducing as Non-Core assets are run down
• Continue to guide £10-15bn of gross issuance in 2015 across public and private senior unsecured, secured and subordinated debt, of which £6bn had been issued at 30 June 2015. This is materially below term maturities of £23bn in 2015, of which £9bn remaining this year
• We expect to be a measured issuer of AT1 and T2 over the next few years
• We intend to maintain access to diverse sources of wholesale funding, through different products, currencies, maturities and channels
A : Slide 43 C: Slide 13 H1 2015 Fixed income call - slides v20
44 | Barclays 2015 Interim Results | 29 July 2015
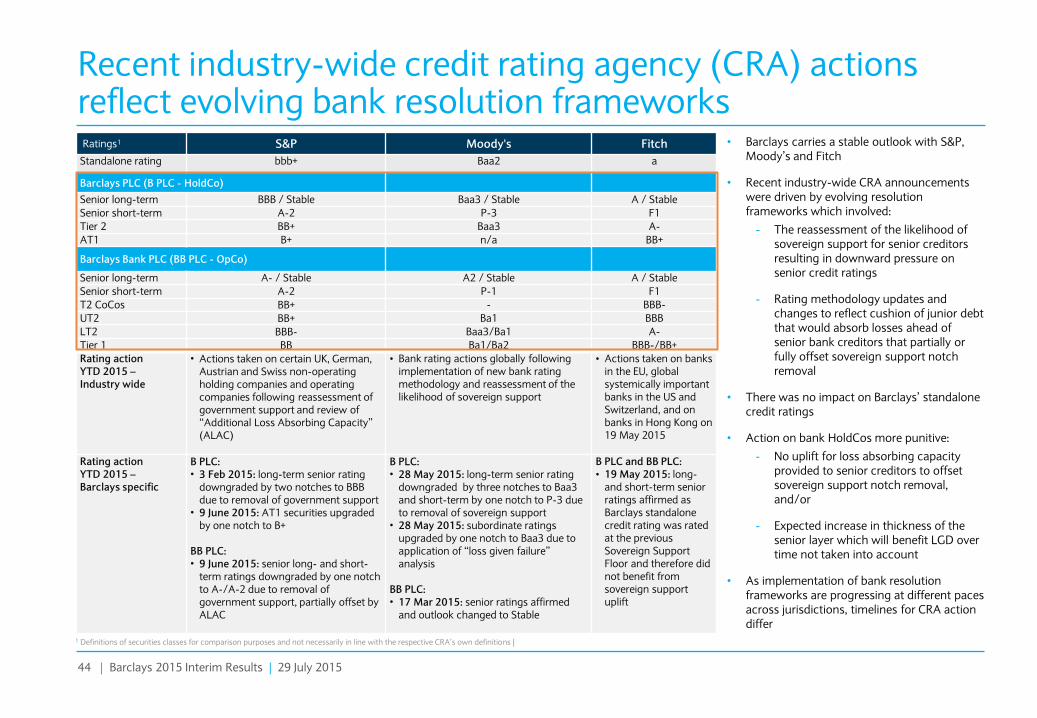
Recent industry-wide credit rating agency (CRA) actions reflect evolving bank resolution frameworks Ratings1 S&P Moody's Fitch
Standalone rating bbb+ Baa2 a
Barclays PLC (B PLC - HoldCo)
Senior long-term BBB / Stable Baa3 / Stable A / Stable
Senior short-term A-2 P-3 F1
Tier 2 BB+ Baa3 A-
AT1 B+ n/a BB+
Barclays Bank PLC (BB PLC - OpCo)
Senior long-term A- / Stable A2 / Stable A / Stable
Senior short-term A-2 P-1 F1
T2 CoCos BB+ - BBB-
UT2 BB+ Ba1 BBB
LT2 BBB- Baa3/Ba1 A-
Tier 1 BB Ba1/Ba2 BBB-/BB+
Rating action YTD 2015 – Industry wide
• Actions taken on certain UK, German, Austrian and Swiss non-operating holding companies and operating companies following reassessment of government support and review of “Additional Loss Absorbing Capacity” (ALAC)
• Bank rating actions globally following implementation of new bank rating methodology and reassessment of the likelihood of sovereign support
• Actions taken on banks in the EU, global systemically important banks in the US and Switzerland, and on banks in Hong Kong on 19 May 2015
Rating action YTD 2015 – Barclays specific
B PLC: • 3 Feb 2015: long-term senior rating
downgraded by two notches to BBB due to removal of government support
• 9 June 2015: AT1 securities upgraded by one notch to B+
BB PLC: • 9 June 2015: senior long- and short-
term ratings downgraded by one notch to A-/A-2 due to removal of government support, partially offset by ALAC
B PLC: • 28 May 2015: long-term senior rating
downgraded by three notches to Baa3 and short-term by one notch to P-3 due to removal of sovereign support
• 28 May 2015: subordinate ratings upgraded by one notch to Baa3 due to application of “loss given failure” analysis
BB PLC: • 17 Mar 2015: senior ratings affirmed
and outlook changed to Stable
B PLC and BB PLC: • 19 May 2015: long-
and short-term senior ratings affirmed as Barclays standalone credit rating was rated at the previous Sovereign Support Floor and therefore did not benefit from sovereign support uplift
• Barclays carries a stable outlook with S&P, Moody’s and Fitch
• Recent industry-wide CRA announcements were driven by evolving resolution frameworks which involved:
- The reassessment of the likelihood of sovereign support for senior creditors resulting in downward pressure on senior credit ratings
- Rating methodology updates and changes to reflect cushion of junior debt that would absorb losses ahead of senior bank creditors that partially or fully offset sovereign support notch removal
• There was no impact on Barclays’ standalone credit ratings
• Action on bank HoldCos more punitive:
- No uplift for loss absorbing capacity provided to senior creditors to offset sovereign support notch removal, and/or
- Expected increase in thickness of the senior layer which will benefit LGD over time not taken into account
• As implementation of bank resolution frameworks are progressing at different paces across jurisdictions, timelines for CRA action differ
1 Definitions of securities classes for comparison purposes and not necessarily in line with the respective CRA’s own definitions |
B: Slide 31 A : Slide 44 C: Slide 18 H1 2015 Fixed income call - slides v20
45 | Barclays 2015 Interim Results | 29 July 2015
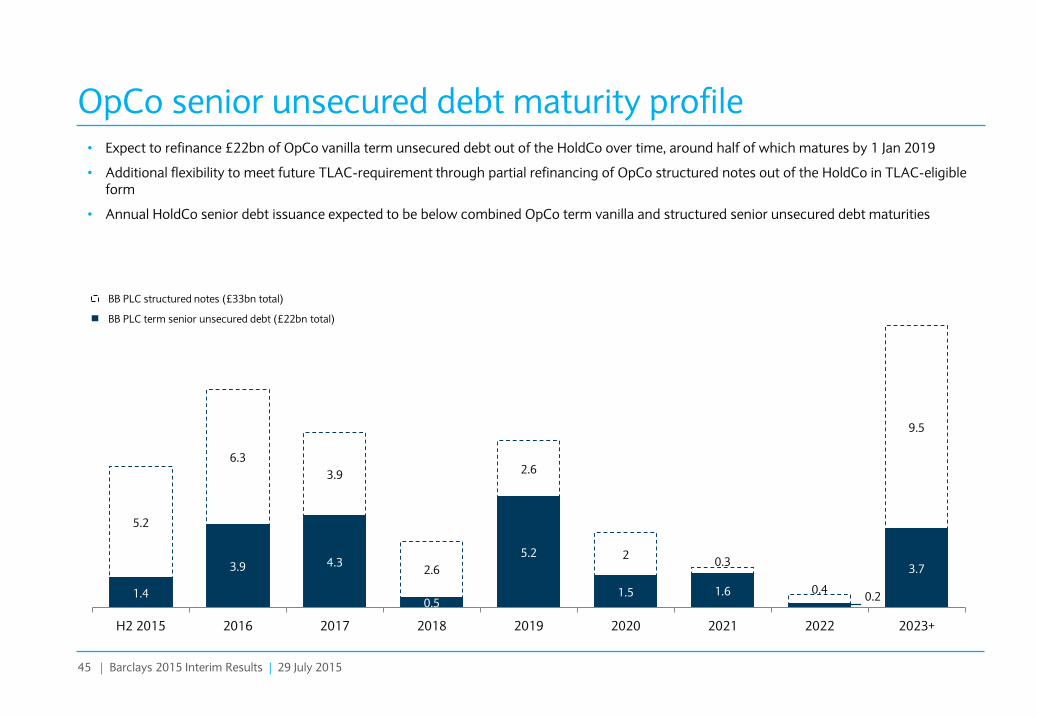
OpCo senior unsecured debt maturity profile
1.4
3.9 4.3
0.5
5.2
1.5 1.6 0.2
3.7
5.2
6.3
3.9
2.6
2.6
2 0.3
0.4
9.5
H2 2015 2016 2017 2018 2019 2020 2021 2022 2023+
BB PLC term senior unsecured debt (£22bn total)
BB PLC structured notes (£33bn total)
• Expect to refinance £22bn of OpCo vanilla term unsecured debt out of the HoldCo over time, around half of which matures by 1 Jan 2019
• Additional flexibility to meet future TLAC-requirement through partial refinancing of OpCo structured notes out of the HoldCo in TLAC-eligible form
• Annual HoldCo senior debt issuance expected to be below combined OpCo term vanilla and structured senior unsecured debt maturities
B: Slide 48 A : Slide 45 C: Slide 19 H1 2015 Fixed income call - slides v20
46 | Barclays 2015 Interim Results | 29 July 2015
Disclaimer
APPENDIX
Important Notice The information, statements and opinions contained in this presentation do not constitute a public offer under any applicable legislation, an offer to sell or solicitation of any offer to buy any securities or financial instruments, or any advice or recommendation with respect to such securities or other financial instruments.
Forward-looking Statements This presentation contains certain forward-looking statements within the meaning of Section 21E of the US Securities Exchange Act of 1934, as amended, and Section 27A of the US Securities Act of 1933, as amended, with respect to the Group. Barclays cautions readers that no forward-looking statement is a guarantee of future performance and that actual results or other financial condition or performance measures could differ materially from those contained in the forward-looking statements. These forward-looking statements can be identified by the fact that they do not relate only to historical or current facts. Forward-looking statements sometimes use words such as ‘may’, ‘will’, ‘seek’, ‘continue’, ‘aim’, ‘anticipate’, ‘target’, ‘projected’, ‘expect’, ‘estimate’, ‘intend’, ‘plan’, ‘goal’, ‘believe’, ‘achieve’ or other words of similar meaning. Examples of forward-looking statements include, among others, statements regarding the Group’s future financial position, income growth, assets, impairment charges and provisions, business strategy, capital, leverage and other regulatory ratios, payment of dividends (including dividend pay-out ratios), projected levels of growth in the banking and financial markets, projected costs or savings, original and revised commitments and targets in connection with the strategic cost Programme and the Group Strategy Update, run-down of assets and businesses within Barclays Non-Core, estimates of capital expenditures and plans and objectives for future operations, projected employee numbers and other statements that are not historical fact. By their nature, forward-looking statements involve risk and uncertainty because they relate to future events and circumstances. These may be affected by changes in legislation, the development of standards and interpretations under International Financial Reporting Standards, evolving practices with regard to the interpretation and application of accounting and regulatory standards, the outcome of current and future legal proceedings and regulatory investigations, future levels of conduct provisions, the policies and actions of governmental and regulatory authorities, geopolitical risks and the impact of competition. In addition, factors including (but not limited to) the following may have an effect: capital, leverage and other regulatory rules (including with regard to the future structure of the Group) applicable to past, current and future periods; UK, US, Africa, Eurozone and global macroeconomic and business conditions; the effects of continued volatility in credit markets; market related risks such as changes in interest rates and foreign exchange rates; effects of changes in valuation of credit market exposures; changes in valuation of issued securities; volatility in capital markets; changes in credit ratings of any entities within the Group or any securities issued by such entities; the potential for one or more countries exiting the Eurozone; the implementation of the strategic cost Programme; and the success of future acquisitions, disposals and other strategic transactions. A number of these influences and factors are beyond the Group’s control. As a result, the Group’s actual future results, dividend payments, and capital and leverage ratios may differ materially from the plans, goals, and expectations set forth in the Group’s forward-looking statements. Additional risks and factors which may impact the Group’s future financial condition and performance are identified in our filings with the SEC (including, without limitation, our Annual Report on Form 20-F for the fiscal year ended 31 December 2014), which are available on the SEC’s website at http://www.sec.gov.
Subject to our obligations under the applicable laws and regulations of the United Kingdom and the United States in relation to disclosure and ongoing information, we undertake no obligation to update publicly or revise any forward looking statements, whether as a result of new information, future events or otherwise.
B: Slide 20 C: Slide 51 H1 2015 Fixed income call - slides v20