Embed Size (px)
Citation preview

BARANGAY TAWANG
PHYSICAL AND SOCIO-ECONOMIC PROFILE
I. HISTORICAL BACKGROUND
There are two (2) versions as to the origin of the name “Tawang”. According to its earlyinhabitants, it came from the Kankanaey word, meaning “catching birds through the use of fireinside the cave”. Others say that it came from the historic cutailment of the performance of theCanao. Due to this, they held their ritual inside the caves of Tawang where they performed the“tayaw”, the local dance of the Ibaloi. Thus, the place was called “Tayawan” and later changedto “Tawang”.
Originally, barangay Tawang was comprised of several sitios distributed over Pico,Alapang and Shilan. The inhabitants of Tawang were originally from the Kankanaey ethnic tribe.They occupied the area in 1898, during the end of Spanish era. As the years passed by, peoplefrom different places flocked into the barangay and today a mixture of different tribes exist. Theold folks continue to practice the traditional customs and beliefs, performing sacrificial rituals.
Since some areas were declared as school reservations, the people of Tawang, alongwith the residents of Poblacion, Wangal, Cruz and other barangays clamored to own the landthey occupied. By virtue of proclamation 209 in 1955, President Ramon Magsaysay proclaimedpart of La Trinidad including Tawang as alienable and disposable land. This gave the occupantsthe right to register their lands as titled property provided they secure certificate from theBenguet State University, formerly known as Mountain State Agricultural College that the pieceof land they are claiming does not fall within the reservation area.
Around 1960’s, the church of advent was erected and it served as a school offering onlyGrade I and Grade II. During the decade, the Tawang Elementary School and the road traversingsitio Boted to Central Tawang were constructed, opening new opportunities for the barangayand the residents.
Tawang was only separated from the mother barangay in 1971, by virtue of a resolutionby the concern citizens of Tawang through the endorsement and approval of the ProvincialGovernment of Benguet. Tawang then became the 16th regular barangay of La Trinidad.
The following are the Barangay Captains/Punong Barangay of Tawang since 1969 up topresent.
1. Salino Dosdos- 1969-19722. Wilson Juan- 1972-19823. James Smith- 1982-19874. Bartolome Locloc- 1987-1992
5. James Marcos- 1992-1998 6. Olindo T. Cuyangan- 1998-2002
7. Denver D. Gomeyac- 2002-2007
1 Sally
8. Lorenzo A. Belino- 2007-2010
9. Denver D. Gomeyac- 2010-2013
10. Denver D. Gomeyac- 2013- Present
II. PHYSICAL PROFILE
Geographic Location
Barangay Tawang lies in the northern portion of the municipality of La Trinidad. About 3kilometers from the Municipal Hall. Bounded on the east by barangay Shilan, on the north bybarangay Bahong, on the south by barangay Lubas and Beckel, and on the west by barangayAlapang and Cruz.
Land Area and Political Subdivision
Barangay Tawang occupies a land area of 247.5998 hectares or representing 3.0648% ofthe municipal land area. It is the 6th largest barangay.
The barangay consist of 6 sitios namely: Dengsi, Papasok, Central Tawang, Tayawan,Banig, and Boted
2 Sally

Abra Kalinga
Apayao
Ifugao
Benguet
Mt. Province
ITOGONTUBA
BOKOD
ATOK
BAKUN
BUGUIAS
KABAYAN
TUBLAY
KIBUNGAN
MANKAYAN
KAPANGAN
BAGUIO CITY
LA TRINIDAD
3 Sally

Accessibility
Barangay Tawang is 3 kilometers away from the Municipal Hall of La Trinidad. Thebarangay is accessible via Baguio-Bontoc National Road. One can take a Public Utility Jeep whichply from Baguio to Upper Tomay. Public Utiliy Jeeps from Pinespark-Lubas-Central Tawang lineare also available at Sitio Pinespark, Balili. There were also taxis available in the area.
III. NATURAL AND PHYSICAL CHARACTERISTICS
Climate and Rainfall
The barangay’s climate falls under the “Type I” with two pronounced seasons, dry fromNovember to April and wet during the rest of the year.
Topography and Slope
Tawang is generally moderately steep.
4 Sally

Soil Type
There are two types of soil in the barangay namely Tacdian loam and Halsema loam.External drainage is good to excessive. Internal drainage is moderately slow. Elevation ofTacdian loam ranges from 1,400 to 1,600 meters above sea level and elevation of Halsema loamranges from 1,200 to 1,400 meters above sea level. This type is very critical when it comes toerosion. The surface soil is very thin and is easily washed off after a few strong rains.
Mountains
There are three mountains found in Barangay Tawang: the Mt. Yangbew, KalugongMountain and Tawang Mountain.
Water Bodies
Barangay Tawang has 8 creeks. There were 4 creeks in Sitio Boted, 3 creeks in SitioBanig and 1 creek in Sitio Dengsi.
5 Sally

6 Sally

Existing Land Use
Agriculture. The dominant land use is agriculture. The agricultural land covers an areaof 115.93 hectares.
Institutional. The institutional area covers an area of 86.44 hectares.
Watershed. The watershed covers an area of 29.09 hectares.
Residential. The residential area covers an area of 11.71 hectares.
Road. The road covers an area of 4.43 hectares.
Land Use Areas in Hectares PercentageAgricultural 115.93 46.82%Institutional 86.44 34.91%Watershed 29.09 11.75%Residential 11.71 4.73%Road 4.43 1.79%
Total 247.60 100.00% Source: Socio-Economic Profile, 1998
IV. DEMOGRAPHY
Population, Growth, and Population Estimates
The population of barangay Tawang as of 1975 was at 638. This has increased to 1,202in 1980, 2,361 persons in 1990 and 3,529 in 1995. It further increased to 4,813 in 2000, 6,294 in2007 and 7,456 in 2010.
Population: Census years 1975-2010Census Year 1975 1980 1990 1995 2000 2007 2010Population 638 1,202 2,361 3,529 4,813 6,294 7,456
Source: NSO
Between 1990 and 1995, the population growth rate was high at 7.8%. This rate wentdown to 6.87% between 1995 and 2000, and 3.907% between 2000 and 2007. And between2007 and 2010, the growth rate was 5.81%.
Intercensal Growth Rate AVERAGEGROWTH RATE1990-1995 1995-2000 2000-2007 2007-2010
7.8 6.87 3.907 5.81 6.10 Source: LT Physical and Socio-economic Profile 2012
7 Sally

Using the computed average growth rate, the projected population for 2014 is 9,447with estimated households of 2,362. For 2015, the projected population is at 10,023 and theestimated households are at 2,506. And the projected population for year 2016 is 10,635 with2,659 estimated numbers of households.
Estimated Population (2012-2020)Year Projected Population Estimated No. of HHs2011 7,911 1,9782012 8,393 2,0982013 8,905 2,2262014 9,447 2,3622015 10,023 2,5062016 10,635 2,6592017 11,283 2,8212018 11,971 2,9932019 12,701 3,1752020 13,475 3,369
Source: MPDO Estimates based on NSO Census 1995, 2000, 2007 & 2010
Population Doubling Time: 11.5 years
According to the result of the Community-Based Monitoring survey conducted last 2010,the total population of Tawang was 6,087. This is comprised of 50.71% or 3,087 males and49.29% or 3,000 females. The total number of household was 1,382 with an average householdsize of 4.
Sex # %Male 3,087 50.71Female 3,000 49.29
Total 6,087 100.00 Total Number of Households : 1,382
Average Household Size : 4 Source: CBMS 2010
Population by Sitio
A big portion of the population, 2,944 persons reside in Sitio Banig, representing 48.37%.This is followed by Sitio Boted with 1,010 residents, representing 16.59%. Papasok had 831residents and Central Tawang had 747 residents, representing 13.65% and 12.27% respectively.
Sitio/Purok HHs Population # %Dengsi 114 482 7.92%Papasok 175 831 13.65%Boted 228 1,010 16.59%Central Tawang 174 747 12.27%
8 Sally
Banig 673 2,944 48.37%Tayawan 18 73 1.20%
Total 1,382 6,087 100.00% Source: CBMS 2010
Density and Classification
The population density in barangay Tawang in year 1990 was at 9.54 persons per squarekilometer. This has increased to 14.25 in 1995, 19.44 in 2000, and 25.42 in 2007. It furtherincreased to 30 persons per square kilometer in 2010.
Population Density (Persons per Square Km)Census Year 1990 1995 2000 2007 2010Density 9.54 14.25 19.44 25.42 30
Source: LT Physical & Socio-Economic Profile 2012
Population by Sex and Age Groups
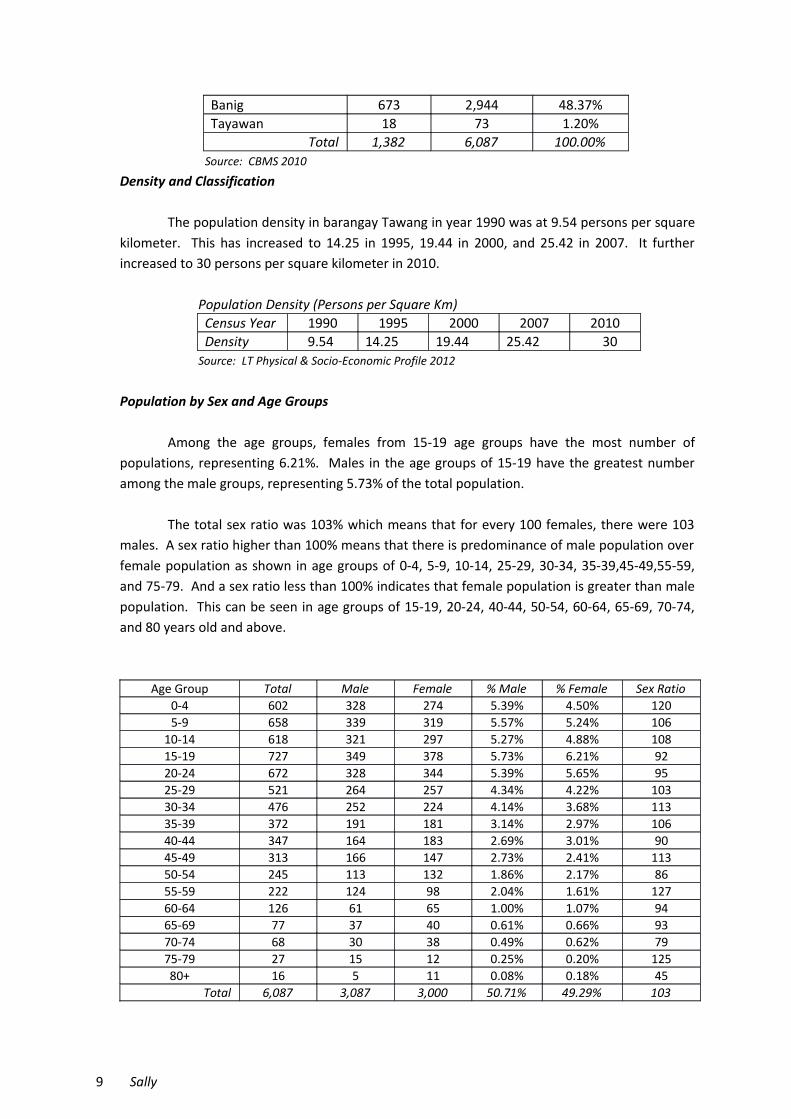
Among the age groups, females from 15-19 age groups have the most number ofpopulations, representing 6.21%. Males in the age groups of 15-19 have the greatest numberamong the male groups, representing 5.73% of the total population.
The total sex ratio was 103% which means that for every 100 females, there were 103males. A sex ratio higher than 100% means that there is predominance of male population overfemale population as shown in age groups of 0-4, 5-9, 10-14, 25-29, 30-34, 35-39,45-49,55-59,and 75-79. And a sex ratio less than 100% indicates that female population is greater than malepopulation. This can be seen in age groups of 15-19, 20-24, 40-44, 50-54, 60-64, 65-69, 70-74,and 80 years old and above.
Age Group Total Male Female % Male % Female Sex Ratio0-4 602 328 274 5.39% 4.50% 1205-9 658 339 319 5.57% 5.24% 106
10-14 618 321 297 5.27% 4.88% 10815-19 727 349 378 5.73% 6.21% 9220-24 672 328 344 5.39% 5.65% 9525-29 521 264 257 4.34% 4.22% 10330-34 476 252 224 4.14% 3.68% 11335-39 372 191 181 3.14% 2.97% 10640-44 347 164 183 2.69% 3.01% 9045-49 313 166 147 2.73% 2.41% 11350-54 245 113 132 1.86% 2.17% 8655-59 222 124 98 2.04% 1.61% 12760-64 126 61 65 1.00% 1.07% 9465-69 77 37 40 0.61% 0.66% 9370-74 68 30 38 0.49% 0.62% 7975-79 27 15 12 0.25% 0.20% 12580+ 16 5 11 0.08% 0.18% 45
Total 6,087 3,087 3,000 50.71% 49.29% 103
9 Sally
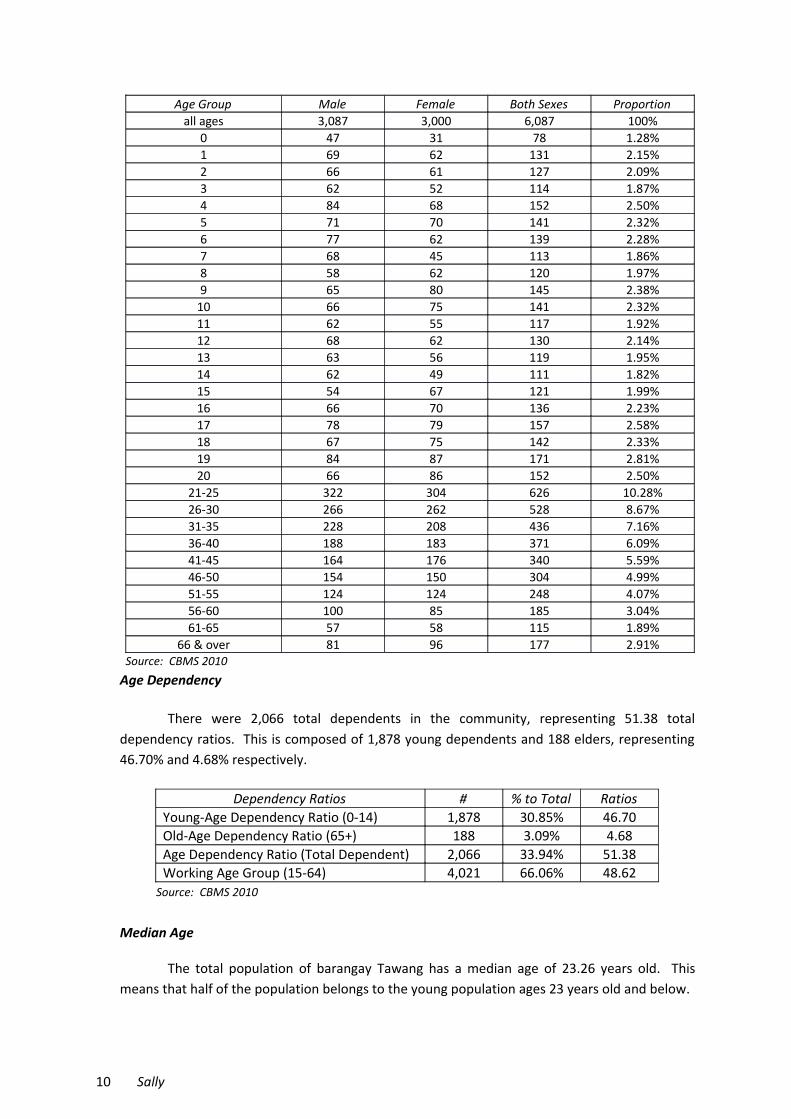
Age Group Male Female Both Sexes Proportionall ages 3,087 3,000 6,087 100%
0 47 31 78 1.28%1 69 62 131 2.15%2 66 61 127 2.09%3 62 52 114 1.87%4 84 68 152 2.50%5 71 70 141 2.32%6 77 62 139 2.28%7 68 45 113 1.86%8 58 62 120 1.97%9 65 80 145 2.38%
10 66 75 141 2.32%11 62 55 117 1.92%12 68 62 130 2.14%13 63 56 119 1.95%14 62 49 111 1.82%15 54 67 121 1.99%16 66 70 136 2.23%17 78 79 157 2.58%18 67 75 142 2.33%19 84 87 171 2.81%20 66 86 152 2.50%
21-25 322 304 626 10.28%26-30 266 262 528 8.67%31-35 228 208 436 7.16%36-40 188 183 371 6.09%41-45 164 176 340 5.59%46-50 154 150 304 4.99%51-55 124 124 248 4.07%56-60 100 85 185 3.04%61-65 57 58 115 1.89%
66 & over 81 96 177 2.91% Source: CBMS 2010
Age Dependency
There were 2,066 total dependents in the community, representing 51.38 totaldependency ratios. This is composed of 1,878 young dependents and 188 elders, representing46.70% and 4.68% respectively.
Dependency Ratios # % to Total RatiosYoung-Age Dependency Ratio (0-14) 1,878 30.85% 46.70Old-Age Dependency Ratio (65+) 188 3.09% 4.68Age Dependency Ratio (Total Dependent) 2,066 33.94% 51.38Working Age Group (15-64) 4,021 66.06% 48.62
Source: CBMS 2010
Median Age
The total population of barangay Tawang has a median age of 23.26 years old. Thismeans that half of the population belongs to the young population ages 23 years old and below.
10 Sally
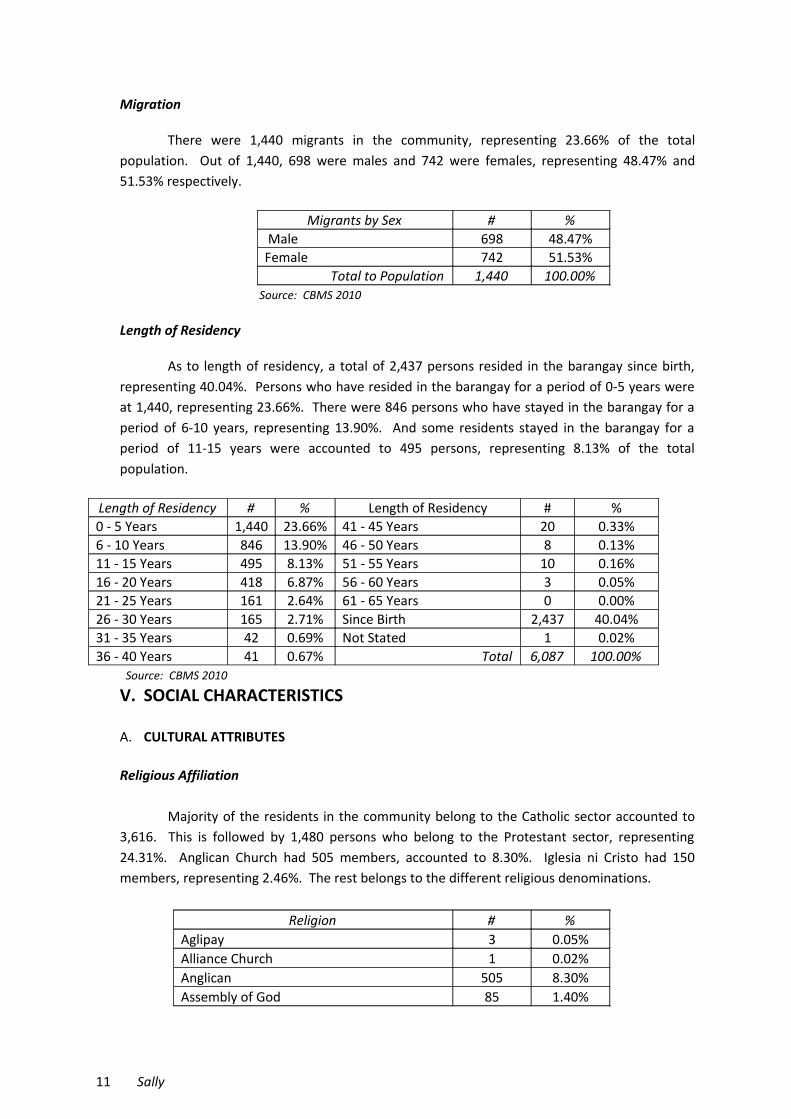
Migration
There were 1,440 migrants in the community, representing 23.66% of the totalpopulation. Out of 1,440, 698 were males and 742 were females, representing 48.47% and51.53% respectively.
Migrants by Sex # % Male 698 48.47%Female 742 51.53%
Total to Population 1,440 100.00% Source: CBMS 2010
Length of Residency
As to length of residency, a total of 2,437 persons resided in the barangay since birth,representing 40.04%. Persons who have resided in the barangay for a period of 0-5 years wereat 1,440, representing 23.66%. There were 846 persons who have stayed in the barangay for aperiod of 6-10 years, representing 13.90%. And some residents stayed in the barangay for aperiod of 11-15 years were accounted to 495 persons, representing 8.13% of the totalpopulation.
Length of Residency # % Length of Residency # %0 - 5 Years 1,440 23.66% 41 - 45 Years 20 0.33%6 - 10 Years 846 13.90% 46 - 50 Years 8 0.13%11 - 15 Years 495 8.13% 51 - 55 Years 10 0.16%16 - 20 Years 418 6.87% 56 - 60 Years 3 0.05%21 - 25 Years 161 2.64% 61 - 65 Years 0 0.00%26 - 30 Years 165 2.71% Since Birth 2,437 40.04%31 - 35 Years 42 0.69% Not Stated 1 0.02%36 - 40 Years 41 0.67% Total 6,087 100.00% Source: CBMS 2010
V. SOCIAL CHARACTERISTICS
A. CULTURAL ATTRIBUTES
Religious Affiliation
Majority of the residents in the community belong to the Catholic sector accounted to3,616. This is followed by 1,480 persons who belong to the Protestant sector, representing24.31%. Anglican Church had 505 members, accounted to 8.30%. Iglesia ni Cristo had 150members, representing 2.46%. The rest belongs to the different religious denominations.
Religion # %Aglipay 3 0.05%Alliance Church 1 0.02%Anglican 505 8.30%Assembly of God 85 1.40%
11 Sally

Baptist 13 0.21%Born Again Christian 33 0.54%Catholic 3,616 59.41%Christian Spiritist 4 0.07%Christian Truth Organization 9 0.15%CSPI 2 0.03%Espiritista 10 0.16%Iglesia ni Cristo 150 2.46%Islam 1 0.02%Jehovah’s Witnesses 19 0.31%LDS 10 0.16%Lutheran 21 0.34%Mormons 10 0.16%Nazarene 24 0.39%Paltiing 14 0.23%Pentecostal 28 0.46%Protestant 1,480 24.31%Seventh Day Adventist 1 0.02%TCDNACI 2 0.03%United Church of Christ of the Philippines 28 0.46%Wesleyan 4 0.07%None 10 0.16%Not Stated 4 0.07%
Total 6,087 100.00% Source: CBMS 2010
Membership to a Community Organization (10 years old and above)
In terms of community affairs participation, there were 1,078 persons who are membersof a community organization, representing 22.33%. This is comprised of 515 males and 563females. While 3,748 persons were not member of any community organization with 1,905males and 1,843 females, representing 77.65% of the total.
Membership To A Community Organization Male Female Total %Member 515 563 1,078 22.33%Non-Member 1,905 1,843 3,748 77.65%Not Stated 0 1 1 0.02%
Total 2,420 2,407 4,827 100.00%Source: CBMS 2010
There were 417 persons who are members of civic associations with 233 males and 184
females, representing 38.68%. The cultural group had 134 members with 64 males and 70females, representing 12.43%. Some 121 were members of a cooperative, of whom 70 were
12 Sally
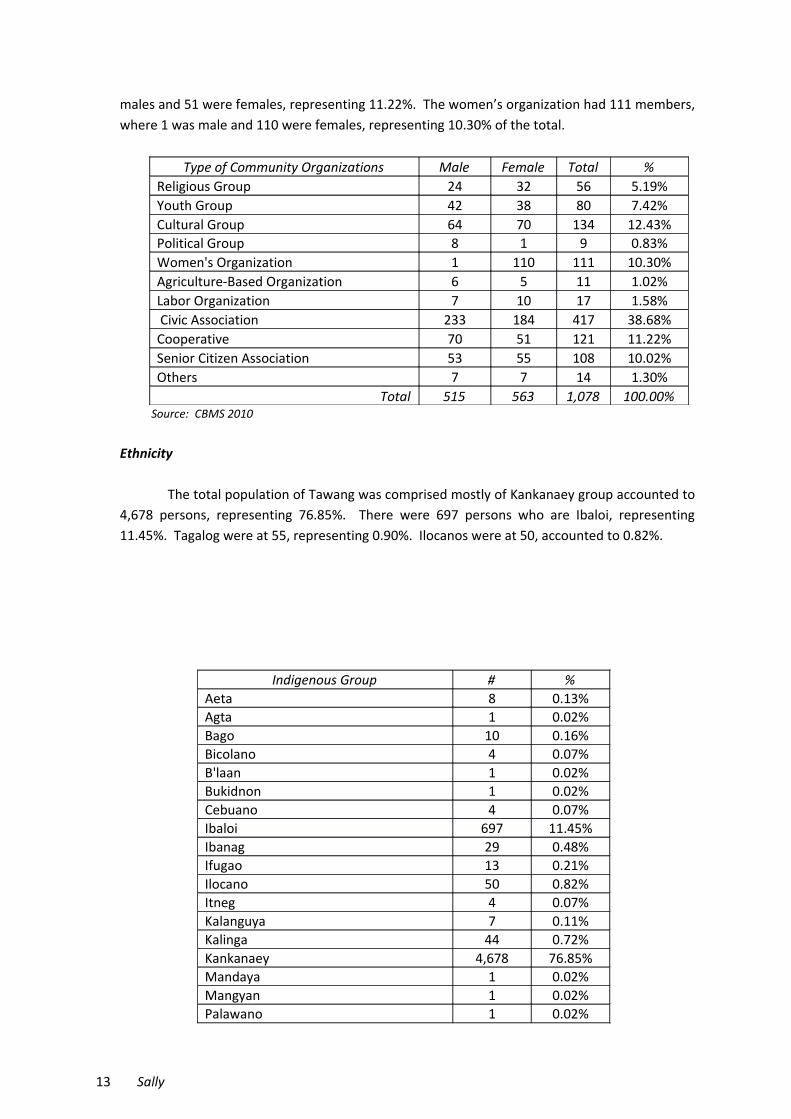
males and 51 were females, representing 11.22%. The women’s organization had 111 members,where 1 was male and 110 were females, representing 10.30% of the total.
Type of Community Organizations Male Female Total %Religious Group 24 32 56 5.19%Youth Group 42 38 80 7.42%Cultural Group 64 70 134 12.43%Political Group 8 1 9 0.83%Women's Organization 1 110 111 10.30%Agriculture-Based Organization 6 5 11 1.02%Labor Organization 7 10 17 1.58% Civic Association 233 184 417 38.68%Cooperative 70 51 121 11.22%Senior Citizen Association 53 55 108 10.02%Others 7 7 14 1.30%
Total 515 563 1,078 100.00% Source: CBMS 2010
Ethnicity
The total population of Tawang was comprised mostly of Kankanaey group accounted to4,678 persons, representing 76.85%. There were 697 persons who are Ibaloi, representing11.45%. Tagalog were at 55, representing 0.90%. Ilocanos were at 50, accounted to 0.82%.
Indigenous Group # %Aeta 8 0.13%Agta 1 0.02%Bago 10 0.16%Bicolano 4 0.07%B'laan 1 0.02%Bukidnon 1 0.02%Cebuano 4 0.07%Ibaloi 697 11.45%Ibanag 29 0.48%Ifugao 13 0.21%Ilocano 50 0.82%Itneg 4 0.07%Kalanguya 7 0.11%Kalinga 44 0.72%Kankanaey 4,678 76.85%Mandaya 1 0.02%Mangyan 1 0.02%Palawano 1 0.02%
13 Sally
Tagalog 55 0.90%Not Stated 105 1.72%Does not Belong to Indigenous Group 373 6.13%
Total Source: CBMS 2010
B. EDUCATION
Literacy (10 years old and above)
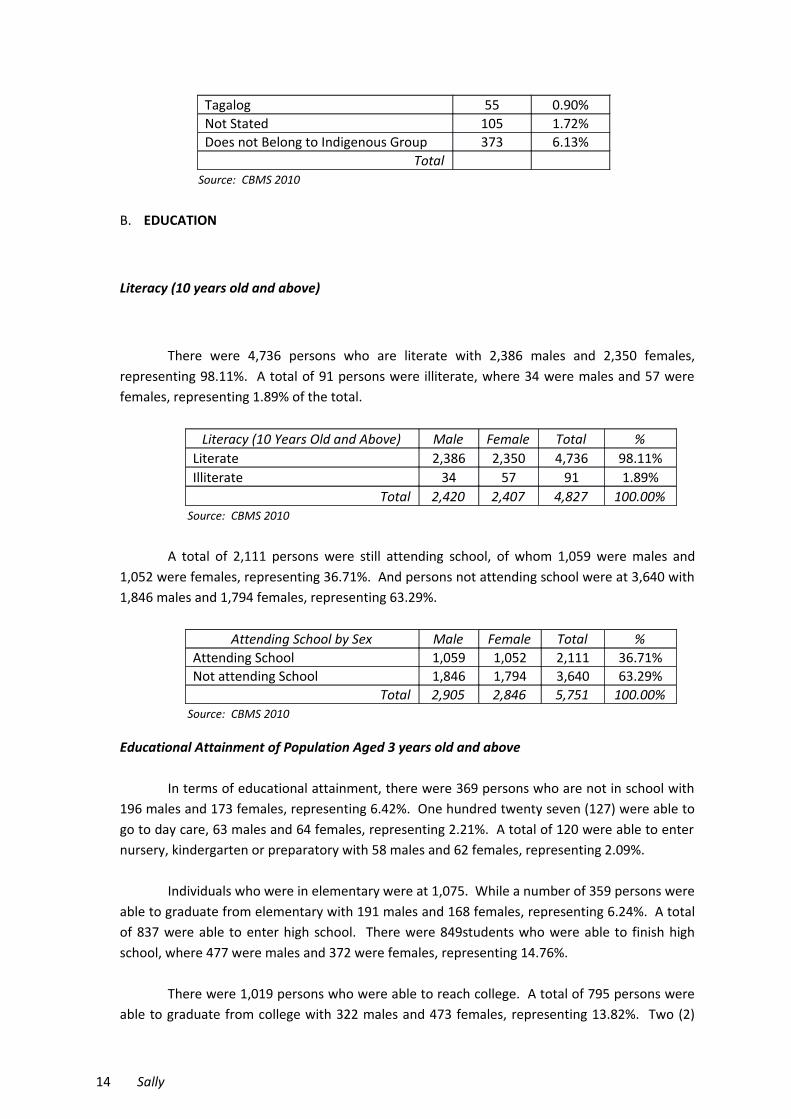
There were 4,736 persons who are literate with 2,386 males and 2,350 females,representing 98.11%. A total of 91 persons were illiterate, where 34 were males and 57 werefemales, representing 1.89% of the total.
Literacy (10 Years Old and Above) Male Female Total %Literate 2,386 2,350 4,736 98.11%Illiterate 34 57 91 1.89%
Total 2,420 2,407 4,827 100.00% Source: CBMS 2010
A total of 2,111 persons were still attending school, of whom 1,059 were males and1,052 were females, representing 36.71%. And persons not attending school were at 3,640 with1,846 males and 1,794 females, representing 63.29%.
Attending School by Sex Male Female Total %Attending School 1,059 1,052 2,111 36.71%Not attending School 1,846 1,794 3,640 63.29%
Total 2,905 2,846 5,751 100.00% Source: CBMS 2010
Educational Attainment of Population Aged 3 years old and above
In terms of educational attainment, there were 369 persons who are not in school with196 males and 173 females, representing 6.42%. One hundred twenty seven (127) were able togo to day care, 63 males and 64 females, representing 2.21%. A total of 120 were able to enternursery, kindergarten or preparatory with 58 males and 62 females, representing 2.09%.
Individuals who were in elementary were at 1,075. While a number of 359 persons wereable to graduate from elementary with 191 males and 168 females, representing 6.24%. A totalof 837 were able to enter high school. There were 849students who were able to finish highschool, where 477 were males and 372 were females, representing 14.76%.
There were 1,019 persons who were able to reach college. A total of 795 persons wereable to graduate from college with 322 males and 473 females, representing 13.82%. Two (2)
14 Sally

females were able to obtain units in masters and/or doctorates, representing 0.03%. Seven (7)persons were able to finish their doctors and/or masters degree with 3 males and 4 females,representing 0.12% of the total.
Educational Attainment by Age (3 y/o +) Male Female Total %No Grade 196 173 369 6.42%Day Care 63 64 127 2.21%Nursery/Kindergarten/Preparatory 58 62 120 2.09%Grade 1 78 86 164 2.85%Grade 2 106 90 196 3.41%Grade 3 107 90 197 3.43%Grade 4 93 87 180 3.13%Grade 5 114 92 206 3.58%Grade 6/7 80 52 132 2.30%Elementary Graduate 191 168 359 6.24%1st Year High School 114 93 207 3.60%2nd Year High School 129 117 246 4.28%3rd Year High School 113 128 241 4.19%4th/5th Year High School 69 74 143 2.49%High School graduate 477 372 849 14.76%1st year Post Secondary 14 13 27 0.47%2nd year Post Secondary 19 28 47 0.82%3rd year Post Secondary 15 11 26 0.45%Post Secondary graduate 50 42 92 1.60%1st year College 133 145 278 4.83%2nd year College 137 138 275 4.78%3rd year College 137 153 290 5.04%4th year College or higher 87 89 176 3.06%College graduate 322 473 795 13.82%With units Masters/Doctors 0 2 2 0.03%Doctors/Masters degree 3 4 7 0.12%
Total 2,905 2,846 5,751 100.00% Source: CBMS 2010
Educational Attainment of those in School
For those who are attending school, Grade 4 had the most number of enrolleesaccounted for 151 with 77 males and 74 females, representing 7.15%. This is followed by Grade3 with 140 enrollees, wherein 79 were males and 61 were females, representing 6.63%. Therewere 138 children enrolled in Day care with 86 males and 52 females, representing 6.54%. And122 children were enrolled in nursery, kindergarten, or preparatory, of whom 57 were malesand 65 were females, representing 5.78%.
For high school, there were 120 students enrolled in first year with 61 males and 59females, representing 5.68%. A total of 109 persons were enrolled in second year with 60 malesand 49 females, representing 5.16%. Third year had 114 enrollees, 48 males and 66 females,
15 Sally

representing 5.40%. For fourth year, there were 126 enrollees with 60 males and 66 females,representing 5.97%.
Grade/Year Level Male Female Total %Day Care 86 52 138 6.54%Nursery/Kindergarten/Preparatory 57 65 122 5.78%Grade 1 62 61 123 5.83%Grade 2 65 71 136 6.44%Grade 3 79 61 140 6.63%Grade 4 77 74 151 7.15%Grade 5 64 67 131 6.21%Grade 6/7 71 60 131 6.21%1st Year HS 61 59 120 5.68%2nd Year HS 60 49 109 5.16%3rd Year HS 48 66 114 5.40%4th/5th Year HS 60 66 126 5.97%1st year PS 6 6 12 0.57%2nd year PS 4 3 7 0.33%3rd year PS 2 6 8 0.38%1st year College 62 68 130 6.16%2nd year College 74 74 148 7.01%3rd year College 54 58 112 5.31%4th year College or higher 67 84 151 7.15%Post Graduate w/ Units 0 2 2 0.09%
Total 1,059 1,052 2,111 100.00% Source: CBMS 2010
A total of 130 students were enrolled in first year college, where 62 were males and 68 were females, representing 6.16%. Second year college had 148 enrollees with 74 males and 74 females, representing 7.01%. Some 112 were enrolled in third year college, wherein 54 were males and 58 were females, representing 5.31%. There were 151 persons who are enrolled in fourth year college with 67 males and 84 females, representing 7.15%. Two (2) females were enrolled with some units in masters and/or doctors degree, representing 0.09%.
Attending and Not Attending School by Age group (3-21 years old)
There were 2,550 persons who belong to the school going age of 3 to 21 years old,wherein 1,283 were males and 1,267 were females. A total of 2,019 persons were in school,representing 79.18%. Five hundred thirty one (531) persons were not attending school,representing 20.82%.
For those in the pre-school age, some of them were in school. For those who are inelementary ages, more than 97% were in school except for those in the age bracket of 6 yearsold wherein only 94% were in school. For ages appropriate for high school, at least 93% were inschool except for the age group of 15 and 16 wherein only 87.60% and 82.35%, respectively,
16 Sally
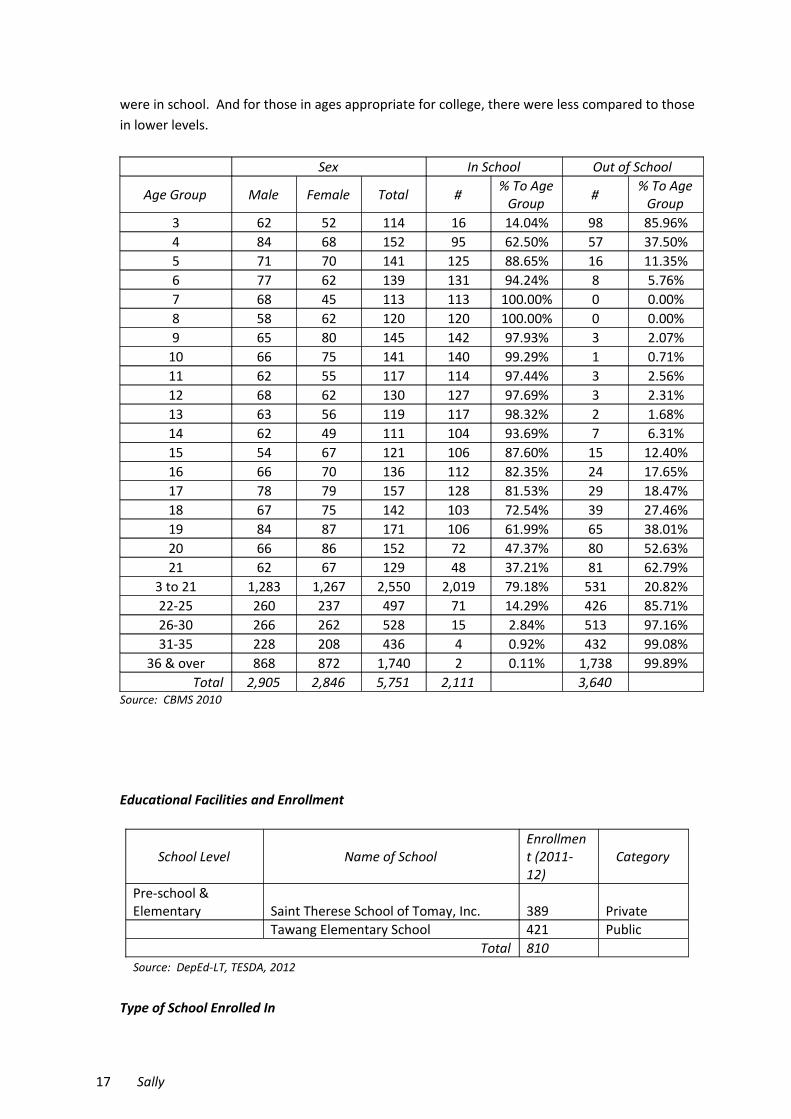
were in school. And for those in ages appropriate for college, there were less compared to thosein lower levels.
Sex In School Out of School
Age Group Male Female Total # % To AgeGroup # % To Age
Group3 62 52 114 16 14.04% 98 85.96%4 84 68 152 95 62.50% 57 37.50%5 71 70 141 125 88.65% 16 11.35%6 77 62 139 131 94.24% 8 5.76%7 68 45 113 113 100.00% 0 0.00%8 58 62 120 120 100.00% 0 0.00%9 65 80 145 142 97.93% 3 2.07%
10 66 75 141 140 99.29% 1 0.71%11 62 55 117 114 97.44% 3 2.56%12 68 62 130 127 97.69% 3 2.31%13 63 56 119 117 98.32% 2 1.68%14 62 49 111 104 93.69% 7 6.31%15 54 67 121 106 87.60% 15 12.40%16 66 70 136 112 82.35% 24 17.65%17 78 79 157 128 81.53% 29 18.47%18 67 75 142 103 72.54% 39 27.46%19 84 87 171 106 61.99% 65 38.01%20 66 86 152 72 47.37% 80 52.63%21 62 67 129 48 37.21% 81 62.79%
3 to 21 1,283 1,267 2,550 2,019 79.18% 531 20.82%22-25 260 237 497 71 14.29% 426 85.71%26-30 266 262 528 15 2.84% 513 97.16%31-35 228 208 436 4 0.92% 432 99.08%
36 & over 868 872 1,740 2 0.11% 1,738 99.89%Total 2,905 2,846 5,751 2,111 3,640
Source: CBMS 2010
Educational Facilities and Enrollment
School Level Name of SchoolEnrollment (2011-12)
Category
Pre-school & Elementary Saint Therese School of Tomay, Inc. 389 Private
Tawang Elementary School 421 PublicTotal 810
Source: DepEd-LT, TESDA, 2012
Type of School Enrolled In
17 Sally
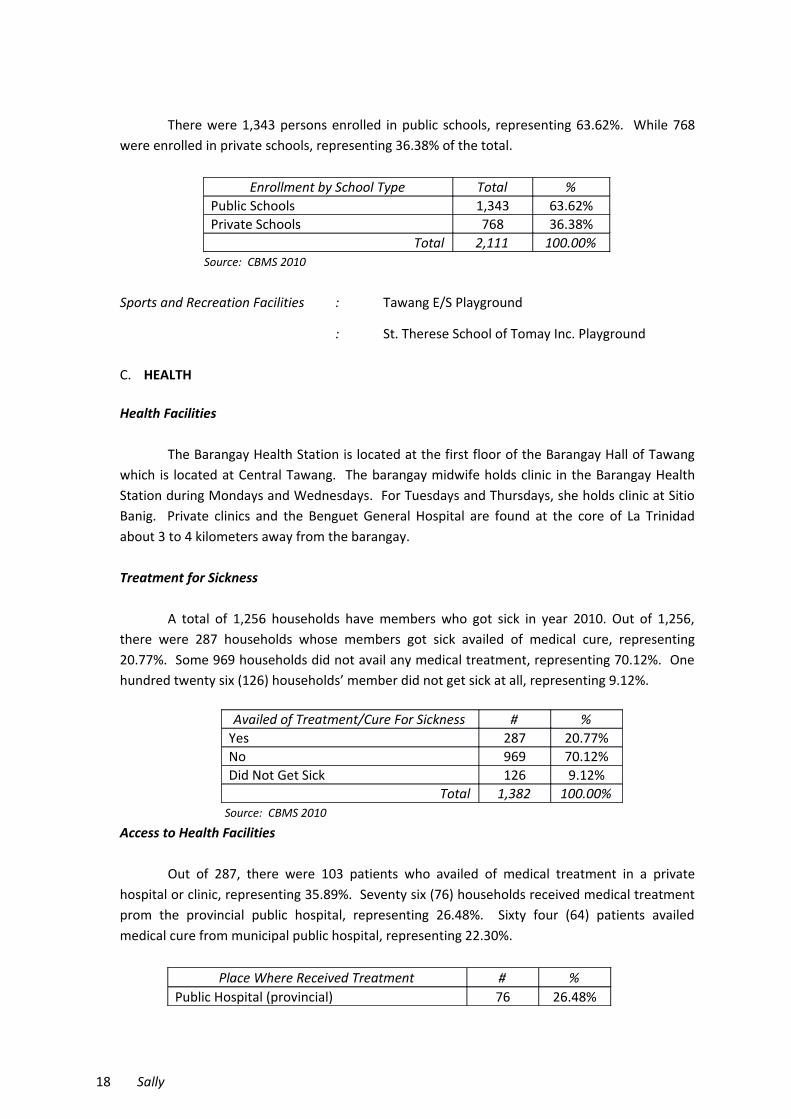
There were 1,343 persons enrolled in public schools, representing 63.62%. While 768were enrolled in private schools, representing 36.38% of the total.
Enrollment by School Type Total %Public Schools 1,343 63.62%Private Schools 768 36.38%
Total 2,111 100.00% Source: CBMS 2010
Sports and Recreation Facilities : Tawang E/S Playground
: St. Therese School of Tomay Inc. Playground
C. HEALTH
Health Facilities
The Barangay Health Station is located at the first floor of the Barangay Hall of Tawangwhich is located at Central Tawang. The barangay midwife holds clinic in the Barangay HealthStation during Mondays and Wednesdays. For Tuesdays and Thursdays, she holds clinic at SitioBanig. Private clinics and the Benguet General Hospital are found at the core of La Trinidadabout 3 to 4 kilometers away from the barangay.
Treatment for Sickness
A total of 1,256 households have members who got sick in year 2010. Out of 1,256,there were 287 households whose members got sick availed of medical cure, representing20.77%. Some 969 households did not avail any medical treatment, representing 70.12%. Onehundred twenty six (126) households’ member did not get sick at all, representing 9.12%.
Availed of Treatment/Cure For Sickness # %Yes 287 20.77%No 969 70.12%Did Not Get Sick 126 9.12%
Total 1,382 100.00% Source: CBMS 2010
Access to Health Facilities
Out of 287, there were 103 patients who availed of medical treatment in a privatehospital or clinic, representing 35.89%. Seventy six (76) households received medical treatmentprom the provincial public hospital, representing 26.48%. Sixty four (64) patients availedmedical cure from municipal public hospital, representing 22.30%.
Place Where Received Treatment # %Public Hospital (provincial) 76 26.48%
18 Sally

Public Hospital (municipal) 64 22.30%Public Hospital (district) 1 0.35%Public Hospital (national) 7 2.44%Private Hospital/Clinic 103 35.89%Rural Health Units 10 3.48%Barangay Health Station/Center 25 8.71%Non-medical/Non-trained Hilot/Personnel 0 0.00%Others 1 0.35%
Total 287 100.00% Source: CBMS 2010
Mortality
There were 8 persons who died in the community in 2010 with 5 males and 3 females.Three (3) individuals died due to pneumonia with 2 males and a female, representing 37.50%.One male died due to disease of the vascular system, representing 12.50%. Another 1 femaledied due to disease of the heart, representing 12.50%. Three (3) individuals died due to othercauses, representing 37.50%.
Cause of Death Male Female Total %Diseases of the heart 0 1 1 12.50%Diseases of the vascular system 1 0 1 12.50%Pneumonia 2 1 3 37.50%Others 2 1 3 37.50%
Total 5 3 8100.00
% Source: CBMS 2010
Nutritional Status of Children (0 to 5 years old)
The Municipal Health Office recorded 812 children aged 0 to 5 years old. This comprisedof 435 males and 377 females. There were 802 children who are of normal weight with 434males and 368 females, representing 98.77%. Eight (8) female children were underweight,representing 0.99%. One male child is severely underweight, representing 0.12%. And there isone female child who is overweight, representing 0.12%.
Nutritional Status of Children 0-5 Years Old Male Female Total %Overweight 0 1 1 0.12%Normal 434 368 802 98.77%Underweight 0 8 8 0.99%Severely Underweight 1 0 1 0.12%
Total 435 377 812 100.00% Source: MHO 2012
Family Planning Methods Usage
19 Sally
There were 1,074 couples in the community. Out of 1,074, 868 were women of child-bearing age. Only 450 couples were practicing family planning.
Number of Couples : 1,074Number of Married Women of Child-bearing Age : 868Couples Practicing Family Planning : 450
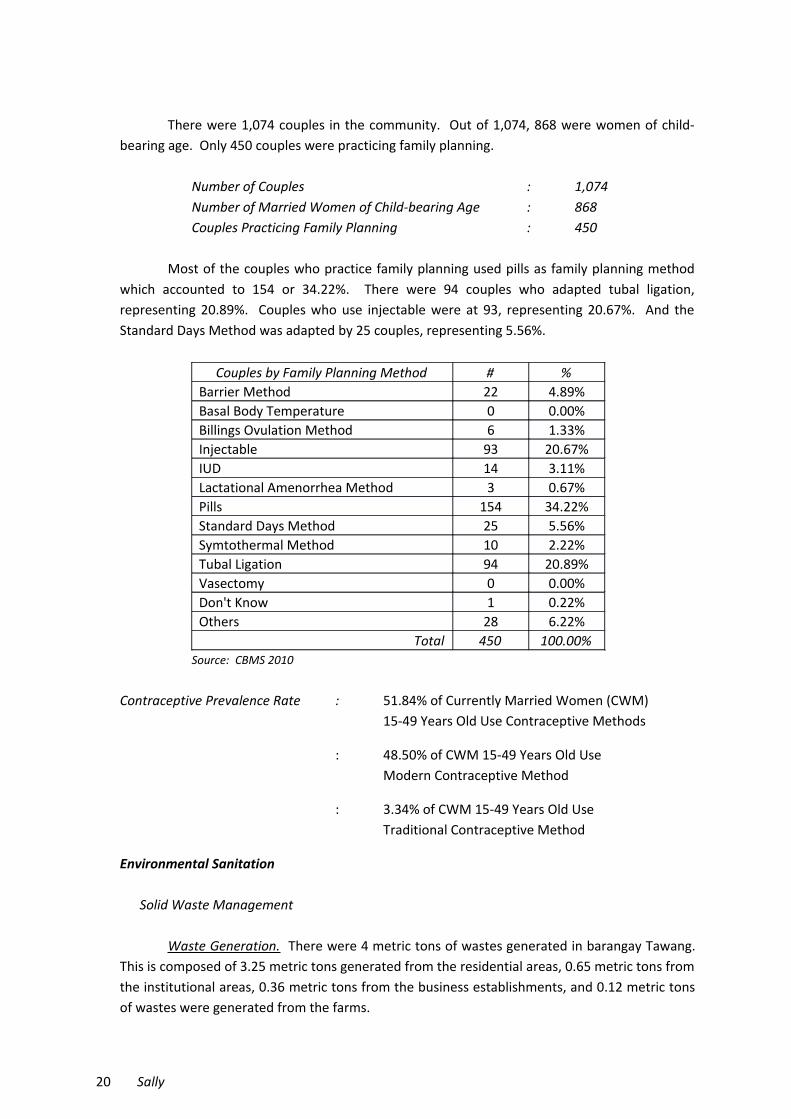
Most of the couples who practice family planning used pills as family planning methodwhich accounted to 154 or 34.22%. There were 94 couples who adapted tubal ligation,representing 20.89%. Couples who use injectable were at 93, representing 20.67%. And theStandard Days Method was adapted by 25 couples, representing 5.56%.
Couples by Family Planning Method # %Barrier Method 22 4.89%Basal Body Temperature 0 0.00%Billings Ovulation Method 6 1.33%Injectable 93 20.67%IUD 14 3.11%Lactational Amenorrhea Method 3 0.67%Pills 154 34.22%Standard Days Method 25 5.56%Symtothermal Method 10 2.22%Tubal Ligation 94 20.89%Vasectomy 0 0.00%Don't Know 1 0.22%Others 28 6.22%
Total 450 100.00%Source: CBMS 2010
Contraceptive Prevalence Rate : 51.84% of Currently Married Women (CWM)15-49 Years Old Use Contraceptive Methods
: 48.50% of CWM 15-49 Years Old UseModern Contraceptive Method
: 3.34% of CWM 15-49 Years Old UseTraditional Contraceptive Method
Environmental Sanitation
Solid Waste Management
Waste Generation. There were 4 metric tons of wastes generated in barangay Tawang.This is composed of 3.25 metric tons generated from the residential areas, 0.65 metric tons fromthe institutional areas, 0.36 metric tons from the business establishments, and 0.12 metric tonsof wastes were generated from the farms.
20 Sally
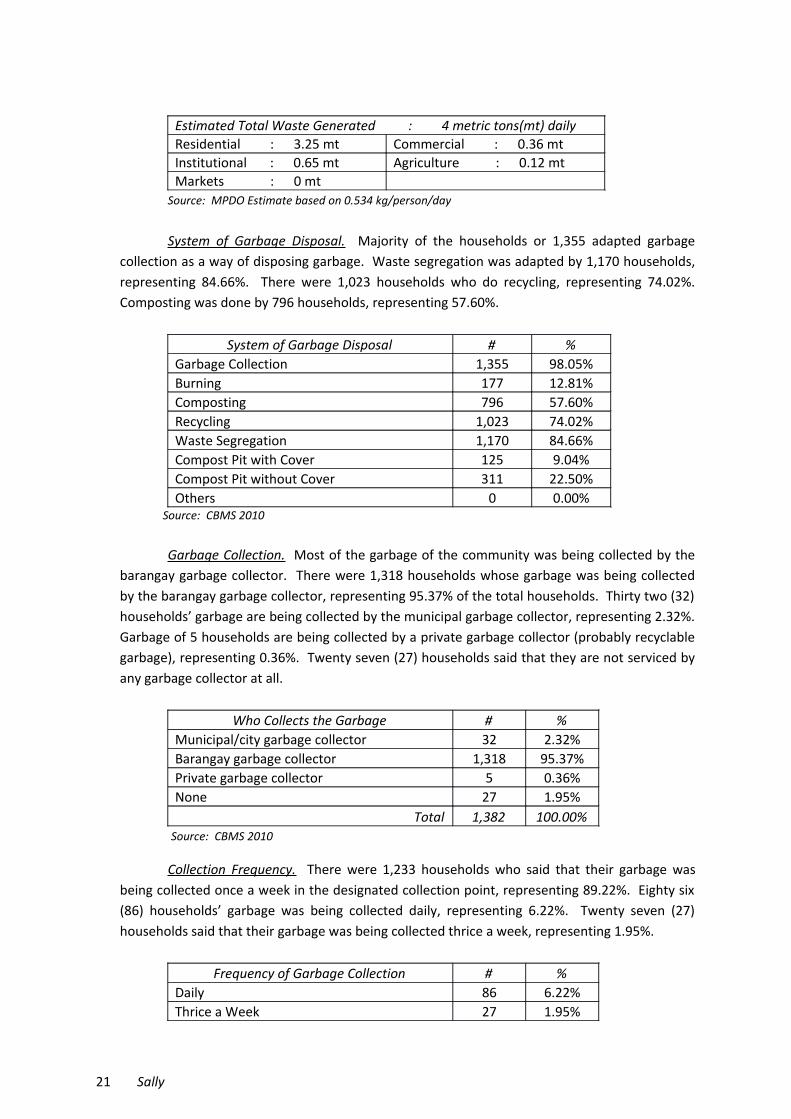
Estimated Total Waste Generated : 4 metric tons(mt) dailyResidential : 3.25 mt Commercial : 0.36 mtInstitutional : 0.65 mt Agriculture : 0.12 mtMarkets : 0 mt
Source: MPDO Estimate based on 0.534 kg/person/day
System of Garbage Disposal. Majority of the households or 1,355 adapted garbagecollection as a way of disposing garbage. Waste segregation was adapted by 1,170 households,representing 84.66%. There were 1,023 households who do recycling, representing 74.02%.Composting was done by 796 households, representing 57.60%.
System of Garbage Disposal # %Garbage Collection 1,355 98.05%Burning 177 12.81%Composting 796 57.60%Recycling 1,023 74.02%Waste Segregation 1,170 84.66%Compost Pit with Cover 125 9.04%Compost Pit without Cover 311 22.50%Others 0 0.00%
Source: CBMS 2010
Garbage Collection. Most of the garbage of the community was being collected by thebarangay garbage collector. There were 1,318 households whose garbage was being collectedby the barangay garbage collector, representing 95.37% of the total households. Thirty two (32)households’ garbage are being collected by the municipal garbage collector, representing 2.32%.Garbage of 5 households are being collected by a private garbage collector (probably recyclablegarbage), representing 0.36%. Twenty seven (27) households said that they are not serviced byany garbage collector at all.
Who Collects the Garbage # %Municipal/city garbage collector 32 2.32%Barangay garbage collector 1,318 95.37%Private garbage collector 5 0.36%None 27 1.95%
Total 1,382 100.00% Source: CBMS 2010
Collection Frequency. There were 1,233 households who said that their garbage wasbeing collected once a week in the designated collection point, representing 89.22%. Eighty six(86) households’ garbage was being collected daily, representing 6.22%. Twenty seven (27)households said that their garbage was being collected thrice a week, representing 1.95%.
Frequency of Garbage Collection # %Daily 86 6.22%Thrice a Week 27 1.95%
21 Sally
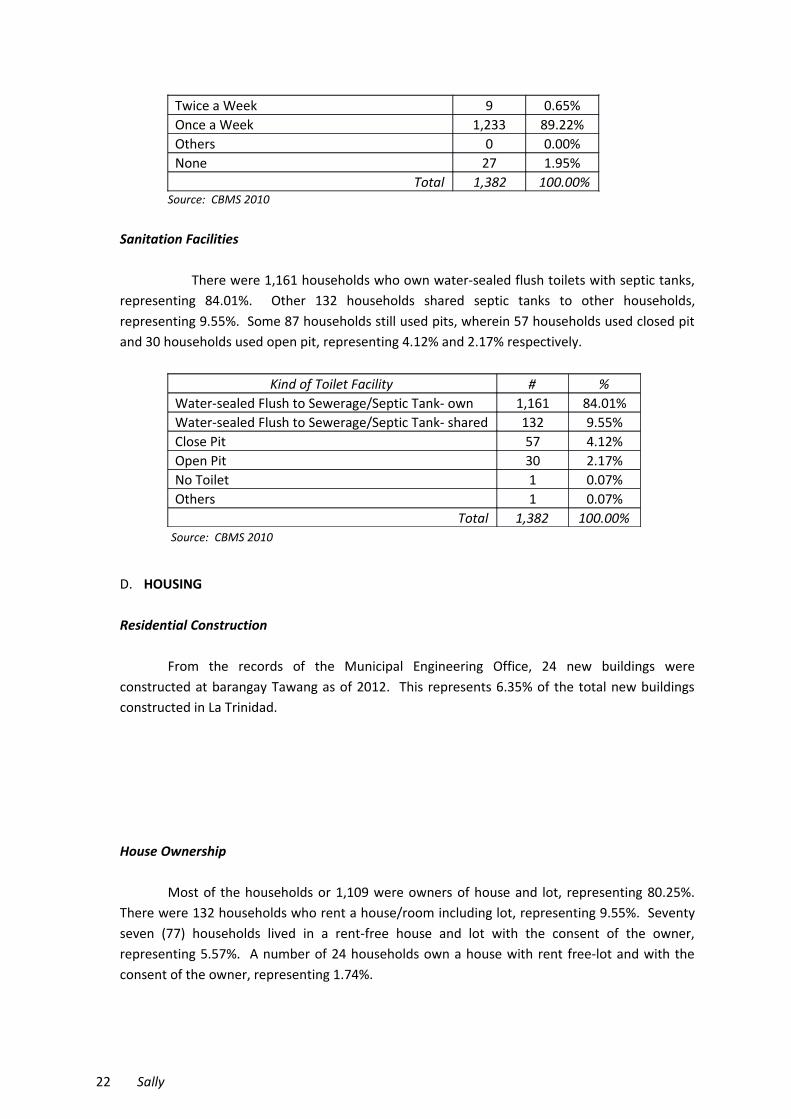
Twice a Week 9 0.65%Once a Week 1,233 89.22%Others 0 0.00%None 27 1.95%
Total 1,382 100.00%Source: CBMS 2010
Sanitation Facilities
There were 1,161 households who own water-sealed flush toilets with septic tanks,representing 84.01%. Other 132 households shared septic tanks to other households,representing 9.55%. Some 87 households still used pits, wherein 57 households used closed pitand 30 households used open pit, representing 4.12% and 2.17% respectively.
Kind of Toilet Facility # %Water-sealed Flush to Sewerage/Septic Tank- own 1,161 84.01%Water-sealed Flush to Sewerage/Septic Tank- shared 132 9.55%Close Pit 57 4.12%Open Pit 30 2.17%No Toilet 1 0.07%Others 1 0.07%
Total 1,382 100.00% Source: CBMS 2010
D. HOUSING
Residential Construction
From the records of the Municipal Engineering Office, 24 new buildings wereconstructed at barangay Tawang as of 2012. This represents 6.35% of the total new buildingsconstructed in La Trinidad.
House Ownership
Most of the households or 1,109 were owners of house and lot, representing 80.25%.There were 132 households who rent a house/room including lot, representing 9.55%. Seventyseven (77) households lived in a rent-free house and lot with the consent of the owner,representing 5.57%. A number of 24 households own a house with rent free-lot and with theconsent of the owner, representing 1.74%.
22 Sally
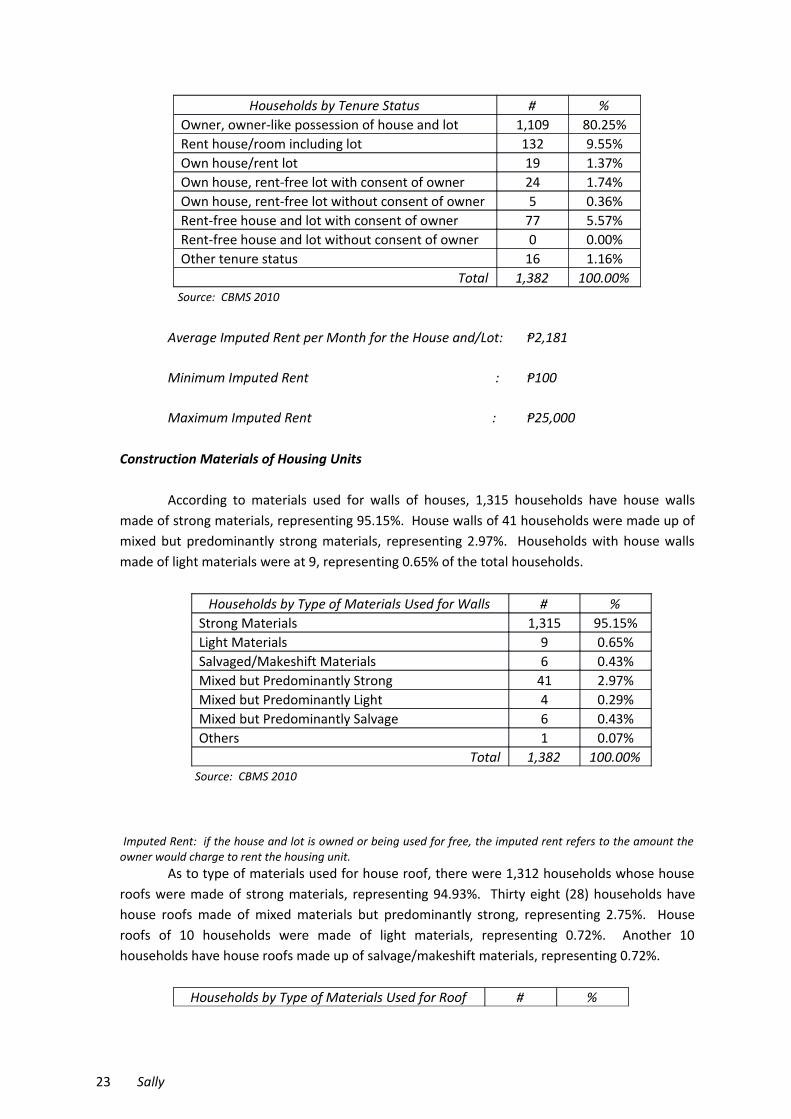
Households by Tenure Status # %Owner, owner-like possession of house and lot 1,109 80.25%Rent house/room including lot 132 9.55%Own house/rent lot 19 1.37%Own house, rent-free lot with consent of owner 24 1.74%Own house, rent-free lot without consent of owner 5 0.36%Rent-free house and lot with consent of owner 77 5.57%Rent-free house and lot without consent of owner 0 0.00%Other tenure status 16 1.16%
Total 1,382 100.00% Source: CBMS 2010
Average Imputed Rent per Month for the House and/Lot: Ᵽ2,181
Minimum Imputed Rent : Ᵽ100
Maximum Imputed Rent : Ᵽ25,000
Construction Materials of Housing Units
According to materials used for walls of houses, 1,315 households have house wallsmade of strong materials, representing 95.15%. House walls of 41 households were made up ofmixed but predominantly strong materials, representing 2.97%. Households with house wallsmade of light materials were at 9, representing 0.65% of the total households.
Households by Type of Materials Used for Walls # %Strong Materials 1,315 95.15%Light Materials 9 0.65%Salvaged/Makeshift Materials 6 0.43%Mixed but Predominantly Strong 41 2.97%Mixed but Predominantly Light 4 0.29%Mixed but Predominantly Salvage 6 0.43%Others 1 0.07%
Total 1,382 100.00% Source: CBMS 2010
Imputed Rent: if the house and lot is owned or being used for free, the imputed rent refers to the amount theowner would charge to rent the housing unit.
As to type of materials used for house roof, there were 1,312 households whose houseroofs were made of strong materials, representing 94.93%. Thirty eight (28) households havehouse roofs made of mixed materials but predominantly strong, representing 2.75%. Houseroofs of 10 households were made of light materials, representing 0.72%. Another 10households have house roofs made up of salvage/makeshift materials, representing 0.72%.
Households by Type of Materials Used for Roof # %
23 Sally

Strong Materials 1,312 94.93%Light Materials 10 0.72%Salvaged/Makeshift Materials 10 0.72%Mixed but Predominantly Strong 38 2.75%Mixed but Predominantly Light 6 0.43%Mixed but Predominantly Salvage 5 0.36%Others 1 0.07%
Total 1,382 100.00% Source: CBMS 2010
Household Conveniences
Most households owned LPG Gas Stove/Range accounted to 1,269, representing91.82%. Television was owned by 1,232 households, representing 89.15%. A total of 1,180households owned a radio or radio cassette, representing 85.38%. Mobile phone or cellularphone was owned by 1,167 households, accounted to 84.44%.
There were 996 households who own a CD/VCD/DVD player, accounted to 72.07%.Some 694 households owned electric iron, representing 50.22%. The refrigerator or freezer wasowned by 646 households, representing 46.74%. Washing machine was owned by 631households, representing 45.66% of the total households.
Households With Appliances/Durables # %Radio/Radio Cassette 1,180 85.38%Television 1,232 89.15%CD/VCD/DVD 996 72.07%Stereo/Component 190 13.75%Karaoke 102 7.38%Refrigerator/Freezer 646 46.74%Electric Fan 140 10.13%Electric Iron 694 50.22%LPG Gas Stove/Range 1,269 91.82%Washing Machine 631 45.66%Microwave Oven 161 11.65%Personal Computer 317 22.94%Mobile Phone/Cellular Phone 1,167 84.44%Landline Telephone 63 4.56%Air-conditioner 13 0.94%Sewing Machine 74 5.35%Car, Jeep, Motorcycle and Other Motorized Vehicles 187 13.53%Source: CBMS 2010
E. SOCIAL WELFARE
Day Care Center Facilities
Central Tawang Day Care Center Lower Banig Day Care CenterUpper Banig Day Care Center Boted Tawang Day Care Center
24 Sally
Clientele Group
Solo Parents
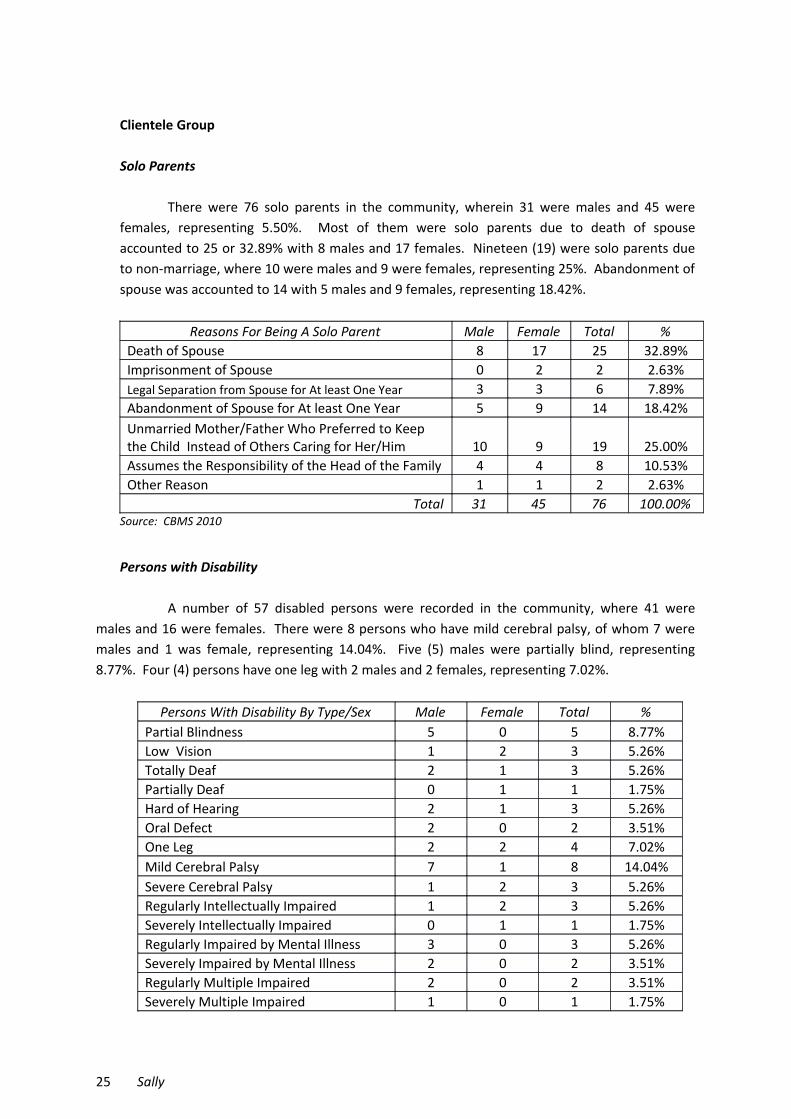
There were 76 solo parents in the community, wherein 31 were males and 45 werefemales, representing 5.50%. Most of them were solo parents due to death of spouseaccounted to 25 or 32.89% with 8 males and 17 females. Nineteen (19) were solo parents dueto non-marriage, where 10 were males and 9 were females, representing 25%. Abandonment ofspouse was accounted to 14 with 5 males and 9 females, representing 18.42%.
Reasons For Being A Solo Parent Male Female Total %Death of Spouse 8 17 25 32.89%Imprisonment of Spouse 0 2 2 2.63%Legal Separation from Spouse for At least One Year 3 3 6 7.89%Abandonment of Spouse for At least One Year 5 9 14 18.42%Unmarried Mother/Father Who Preferred to Keep the Child Instead of Others Caring for Her/Him 10 9 19 25.00%Assumes the Responsibility of the Head of the Family 4 4 8 10.53%Other Reason 1 1 2 2.63%
Total 31 45 76 100.00%Source: CBMS 2010
Persons with Disability
A number of 57 disabled persons were recorded in the community, where 41 weremales and 16 were females. There were 8 persons who have mild cerebral palsy, of whom 7 weremales and 1 was female, representing 14.04%. Five (5) males were partially blind, representing8.77%. Four (4) persons have one leg with 2 males and 2 females, representing 7.02%.
Persons With Disability By Type/Sex Male Female Total %Partial Blindness 5 0 5 8.77%Low Vision 1 2 3 5.26%Totally Deaf 2 1 3 5.26%Partially Deaf 0 1 1 1.75%Hard of Hearing 2 1 3 5.26%Oral Defect 2 0 2 3.51%One Leg 2 2 4 7.02%Mild Cerebral Palsy 7 1 8 14.04%Severe Cerebral Palsy 1 2 3 5.26%Regularly Intellectually Impaired 1 2 3 5.26%Severely Intellectually Impaired 0 1 1 1.75%Regularly Impaired by Mental Illness 3 0 3 5.26%Severely Impaired by Mental Illness 2 0 2 3.51%Regularly Multiple Impaired 2 0 2 3.51%Severely Multiple Impaired 1 0 1 1.75%
25 Sally
Others 10 3 13 22.81%Total 41 16 57 100.00%
Source: CBMS 2010
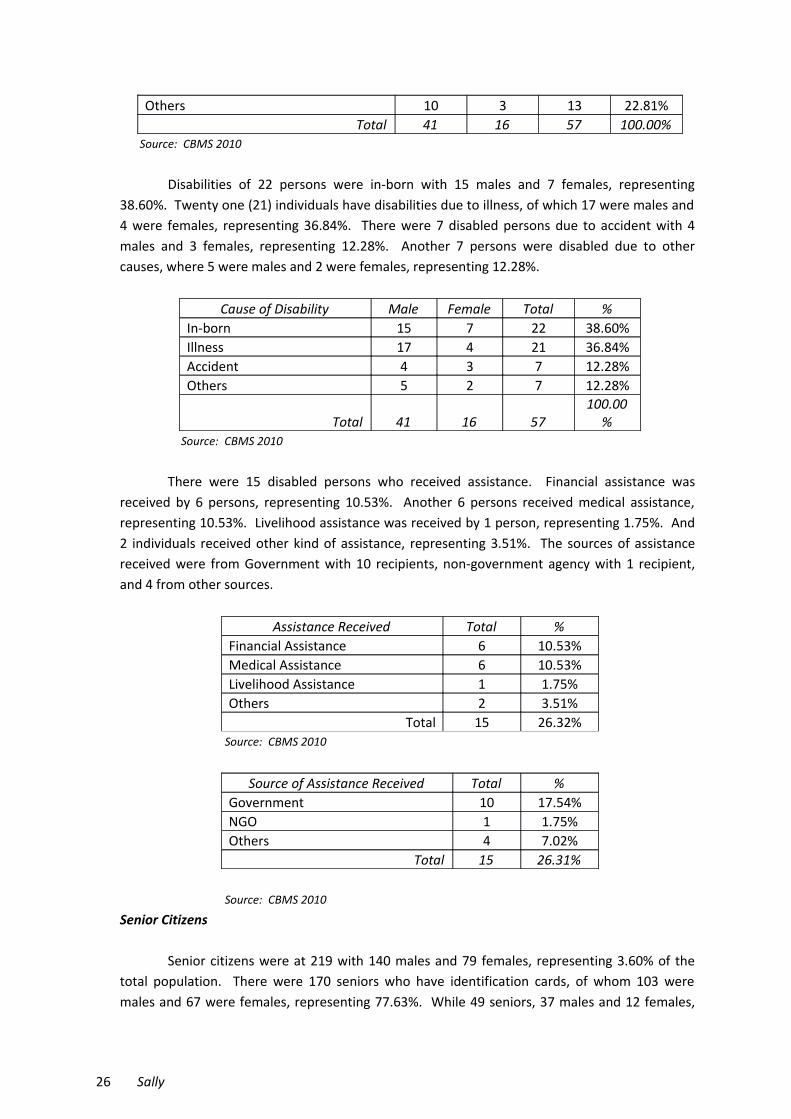
Disabilities of 22 persons were in-born with 15 males and 7 females, representing38.60%. Twenty one (21) individuals have disabilities due to illness, of which 17 were males and4 were females, representing 36.84%. There were 7 disabled persons due to accident with 4males and 3 females, representing 12.28%. Another 7 persons were disabled due to othercauses, where 5 were males and 2 were females, representing 12.28%.
Cause of Disability Male Female Total %In-born 15 7 22 38.60%Illness 17 4 21 36.84%Accident 4 3 7 12.28%Others 5 2 7 12.28%
Total 41 16 57100.00
% Source: CBMS 2010
There were 15 disabled persons who received assistance. Financial assistance wasreceived by 6 persons, representing 10.53%. Another 6 persons received medical assistance,representing 10.53%. Livelihood assistance was received by 1 person, representing 1.75%. And2 individuals received other kind of assistance, representing 3.51%. The sources of assistancereceived were from Government with 10 recipients, non-government agency with 1 recipient,and 4 from other sources.
Assistance Received Total %Financial Assistance 6 10.53%Medical Assistance 6 10.53%Livelihood Assistance 1 1.75%Others 2 3.51%
Total 15 26.32% Source: CBMS 2010
Source of Assistance Received Total %Government 10 17.54%NGO 1 1.75%Others 4 7.02%
Total 15 26.31%
Source: CBMS 2010
Senior Citizens
Senior citizens were at 219 with 140 males and 79 females, representing 3.60% of thetotal population. There were 170 seniors who have identification cards, of whom 103 weremales and 67 were females, representing 77.63%. While 49 seniors, 37 males and 12 females,
26 Sally
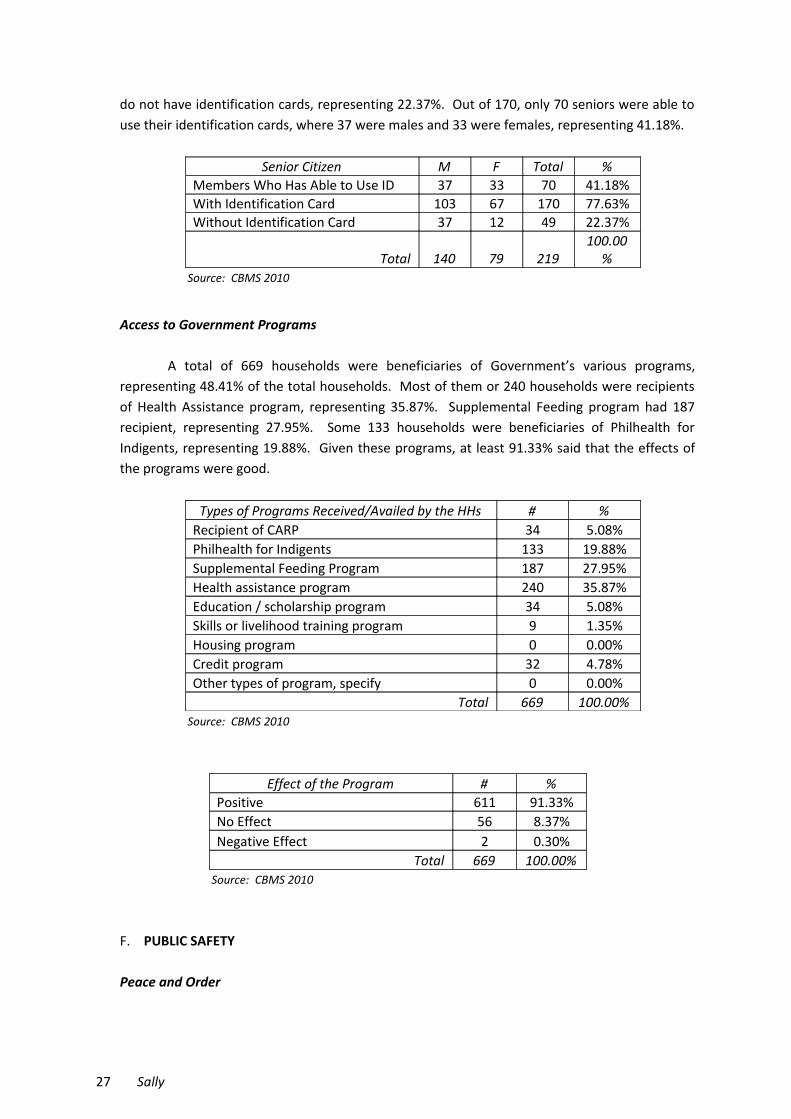
do not have identification cards, representing 22.37%. Out of 170, only 70 seniors were able touse their identification cards, where 37 were males and 33 were females, representing 41.18%.
Senior Citizen M F Total %Members Who Has Able to Use ID 37 33 70 41.18%With Identification Card 103 67 170 77.63%Without Identification Card 37 12 49 22.37%
Total 140 79 219100.00
% Source: CBMS 2010
Access to Government Programs
A total of 669 households were beneficiaries of Government’s various programs,representing 48.41% of the total households. Most of them or 240 households were recipientsof Health Assistance program, representing 35.87%. Supplemental Feeding program had 187recipient, representing 27.95%. Some 133 households were beneficiaries of Philhealth forIndigents, representing 19.88%. Given these programs, at least 91.33% said that the effects ofthe programs were good.
Types of Programs Received/Availed by the HHs # %Recipient of CARP 34 5.08%Philhealth for Indigents 133 19.88%Supplemental Feeding Program 187 27.95%Health assistance program 240 35.87%Education / scholarship program 34 5.08%Skills or livelihood training program 9 1.35%Housing program 0 0.00%Credit program 32 4.78%Other types of program, specify 0 0.00%
Total 669 100.00% Source: CBMS 2010
Effect of the Program # %Positive 611 91.33%No Effect 56 8.37%Negative Effect 2 0.30%
Total 669 100.00% Source: CBMS 2010
F. PUBLIC SAFETY
Peace and Order
27 Sally

From the records of the Philippine National Police of La Trinidad, there were 33incidence of crime in the community. Vehicular accident is the top most crime in the barangaywhich is accounted to 17 or 51.52%. Physical Injury had 4 incidents, representing 12.12%. Andchild abuse had 3 incidents, representing 9.09%.
Victims of Crime # %Child Abuse 3 9.09%Other Non-index 2 6.06%Physical Injuries 4 12.12%Robbery 2 6.06%Theft 2 6.06%Special Laws 1 3.03%VAWC 2 6.06%Vehicular Accidents 17 51.52%
Total 33 100.00% Source: PNP-LT, 2012 Data
Calamity
There were 134 households who are affected by natural or man-made disaster last 2010,representing 9.70% of the total households. Most of them said that they were affected bytyphoon, accounted to 101 or 75.37% of the total. Twenty six (26) households were affected byflood, representing 19.40%. Five (5) households were due to drought, representing 3.73%. And1 household was a victim of earthquake, representing 0.75%.
Types of Calamities # %Typhoon 101 75.37%Flood 26 19.40%Drought 5 3.73%Earthquake 1 0.75%Volcanic Eruption 0 0.00%Armed Conflict 0 0.00%Fire 0 0.00%Others 1 0.75%
Total 134 100.00% Source: CBMS 2010
VI. ECONOMY
A. SOURCES OF INCOME
28 Sally

Entrepreneurial Activities
A total of 706 households were engaged in entrepreneurial activities includingagricultural activities, representing 51.09%. There were 276 households who are engaged inwholesale and retail trade activities with an average income of Ᵽ78,241 annually. Some 162households were in crop farming and gardening having an average annual income of Ᵽ36,112.Transportation, storage and communication services had 96 households with an average annualincome of Ᵽ126,641.
Entrepreneurial Activities by Income
Households Income (Ᵽ)# % Minimum Average Maximum
Crop Farming and Gardening 162 11.72% Ᵽ300 Ᵽ36,112 Ᵽ319,200Livestock and Poultry Raising 61 4.41% 400 20,392 89,100Fishing Activities 0 0% 0 0 0Forestry and Hunting Activities 7 0.51% 400 2,386 5,000Wholesale & Retail Trade Activities 276 19.97% 500 78,241 480,000Manufacturing Activities 35 2.53% 3,000 56,343 216,000Community, Social & Personal 6 0.43% 10,000 35,667 50,000Transportation, Storage, and Communication Services 96 6.95% 1,000 126,641 1,350,000Mining and Quarrying Activities 21 1.52% 5,000 61,467 156,000Construction 26 1.88% 10,000 63,694 108,000Other Activities 16 1.16% 5,000 40,500 100,000Total 706
Source: CBMS 2010
Salaries and Wages
At least 69.18% or 956 households in the community are wage earners. Their averageannual income is Ᵽ143,714.
Salaries and Wages by IncomeHouseholds Income (Ᵽ)# % Minimum Average Maximum
Salaries and Wages 956 69.18% 5,100 143,714 3,988,000 Source: CBMS 2010
Additional Sources of Income
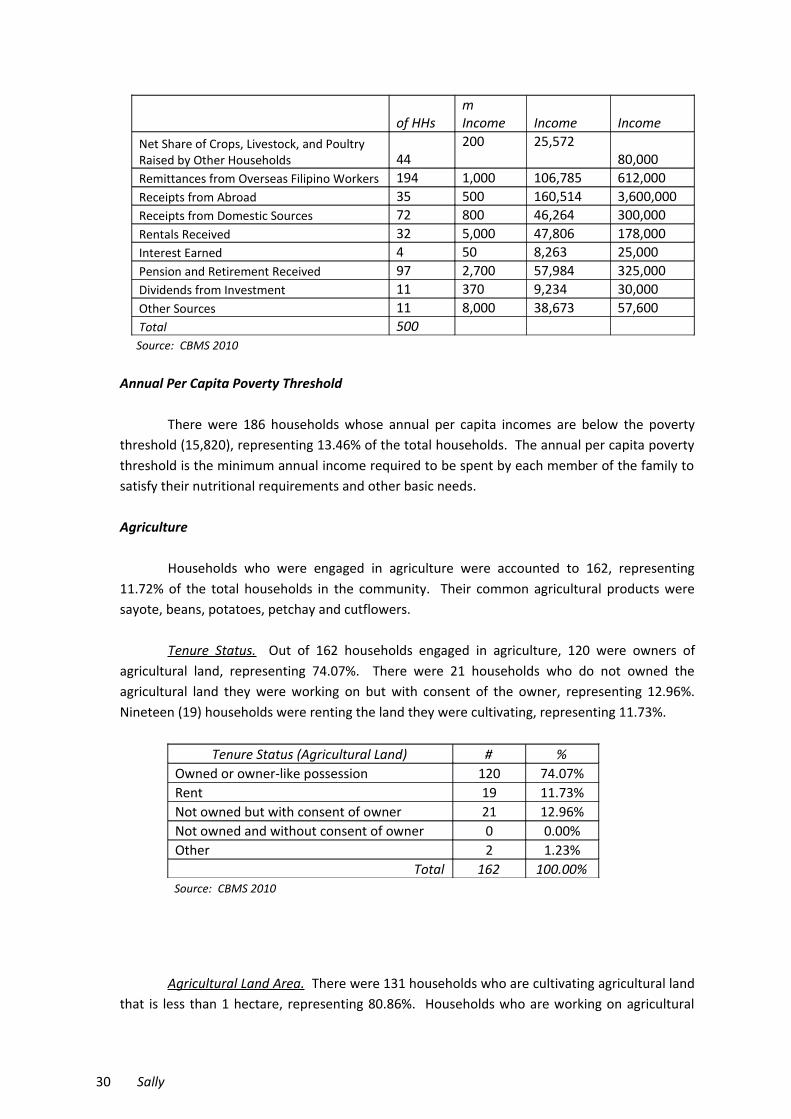
Aside from the main source of income, 500 households had additional sources ofincome. There were 194 households who receive remittances from Overseas Filipino Workerswith an average annual income of Ᵽ106.785. Ninety seven (97) households had an additionalincome from retirement and pension received having an average income of Ᵽ57,984 annually.Seventy two (72) households received cash receipts, support, assistance and relief fromdomestic sources with an average annual income of Ᵽ46,264.
Additional Sources of Income Number Minimu Average Maximum
29 Sally
of HHsm Income Income Income
Net Share of Crops, Livestock, and Poultry Raised by Other Households 44
200 25,57280,000
Remittances from Overseas Filipino Workers 194 1,000 106,785 612,000Receipts from Abroad 35 500 160,514 3,600,000Receipts from Domestic Sources 72 800 46,264 300,000Rentals Received 32 5,000 47,806 178,000Interest Earned 4 50 8,263 25,000Pension and Retirement Received 97 2,700 57,984 325,000Dividends from Investment 11 370 9,234 30,000Other Sources 11 8,000 38,673 57,600Total 500
Source: CBMS 2010
Annual Per Capita Poverty Threshold
There were 186 households whose annual per capita incomes are below the povertythreshold (15,820), representing 13.46% of the total households. The annual per capita povertythreshold is the minimum annual income required to be spent by each member of the family tosatisfy their nutritional requirements and other basic needs.
Agriculture
Households who were engaged in agriculture were accounted to 162, representing11.72% of the total households in the community. Their common agricultural products weresayote, beans, potatoes, petchay and cutflowers.
Tenure Status. Out of 162 households engaged in agriculture, 120 were owners ofagricultural land, representing 74.07%. There were 21 households who do not owned theagricultural land they were working on but with consent of the owner, representing 12.96%.Nineteen (19) households were renting the land they were cultivating, representing 11.73%.
Tenure Status (Agricultural Land) # %Owned or owner-like possession 120 74.07%Rent 19 11.73%Not owned but with consent of owner 21 12.96%Not owned and without consent of owner 0 0.00%Other 2 1.23%
Total 162 100.00% Source: CBMS 2010
Agricultural Land Area. There were 131 households who are cultivating agricultural landthat is less than 1 hectare, representing 80.86%. Households who are working on agricultural
30 Sally
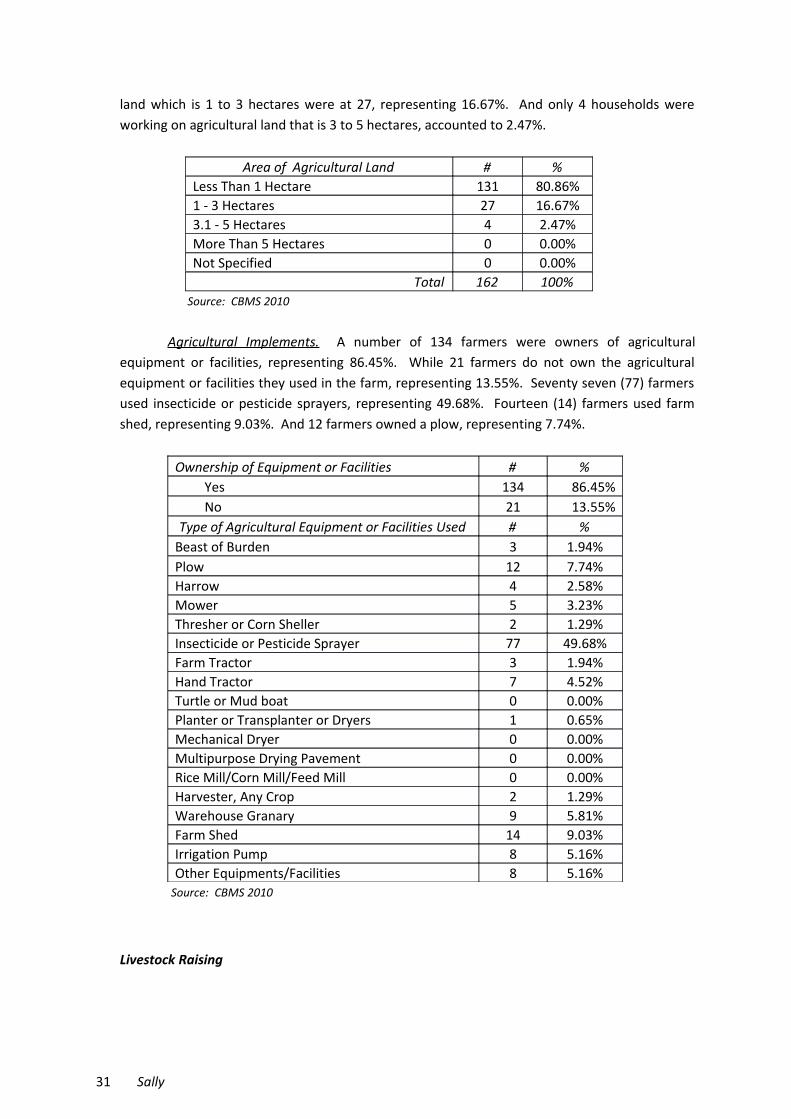
land which is 1 to 3 hectares were at 27, representing 16.67%. And only 4 households wereworking on agricultural land that is 3 to 5 hectares, accounted to 2.47%.
Area of Agricultural Land # %Less Than 1 Hectare 131 80.86%1 - 3 Hectares 27 16.67%3.1 - 5 Hectares 4 2.47%More Than 5 Hectares 0 0.00%Not Specified 0 0.00%
Total 162 100% Source: CBMS 2010
Agricultural Implements. A number of 134 farmers were owners of agriculturalequipment or facilities, representing 86.45%. While 21 farmers do not own the agriculturalequipment or facilities they used in the farm, representing 13.55%. Seventy seven (77) farmersused insecticide or pesticide sprayers, representing 49.68%. Fourteen (14) farmers used farmshed, representing 9.03%. And 12 farmers owned a plow, representing 7.74%.
Ownership of Equipment or Facilities # % Yes 134 86.45% No 21 13.55%Type of Agricultural Equipment or Facilities Used # %
Beast of Burden 3 1.94%Plow 12 7.74%Harrow 4 2.58%Mower 5 3.23%Thresher or Corn Sheller 2 1.29%Insecticide or Pesticide Sprayer 77 49.68%Farm Tractor 3 1.94%Hand Tractor 7 4.52%Turtle or Mud boat 0 0.00%Planter or Transplanter or Dryers 1 0.65%Mechanical Dryer 0 0.00%Multipurpose Drying Pavement 0 0.00%Rice Mill/Corn Mill/Feed Mill 0 0.00%Harvester, Any Crop 2 1.29%Warehouse Granary 9 5.81%Farm Shed 14 9.03%Irrigation Pump 8 5.16%Other Equipments/Facilities 8 5.16%
Source: CBMS 2010
Livestock Raising
31 Sally

There were 66 households who are engaged in livestock raising. Thirty one (31)households raised hogs for fattening, representing 46.97%. Chicken were raised by 18households, representing 27.27%. Ten (10) households raised sow, representing 15.15%. And 2households raised cows, accounted to 3.03%.
Livestock Being Raised by Households # %Hog for Fattening 31 46.97%Sow 10 15.15%Goat 0 0.00%Carabao 1 1.52%Cow 2 3.03%Chicken 18 27.27%Chicken for Egg Laying 1 1.52%Duck 1 1.52%Other Livestock/Poultry 2 3.03%
Total 66100.00
% Source: CBMS 2010
Households who were engaged in livestock or poultry raising had produced 295 liveanimals, 3,761 kilograms of meat and 80 pieces of eggs annually.
Volume of Production of Livestock/Poultry Volume of ProductionLive animals 295 headsMeat 3761 kgs.Milk 0 litersEggs 80 pcs.
Source: CBMS 2010
B. EMPLOYMENT
Labor Force
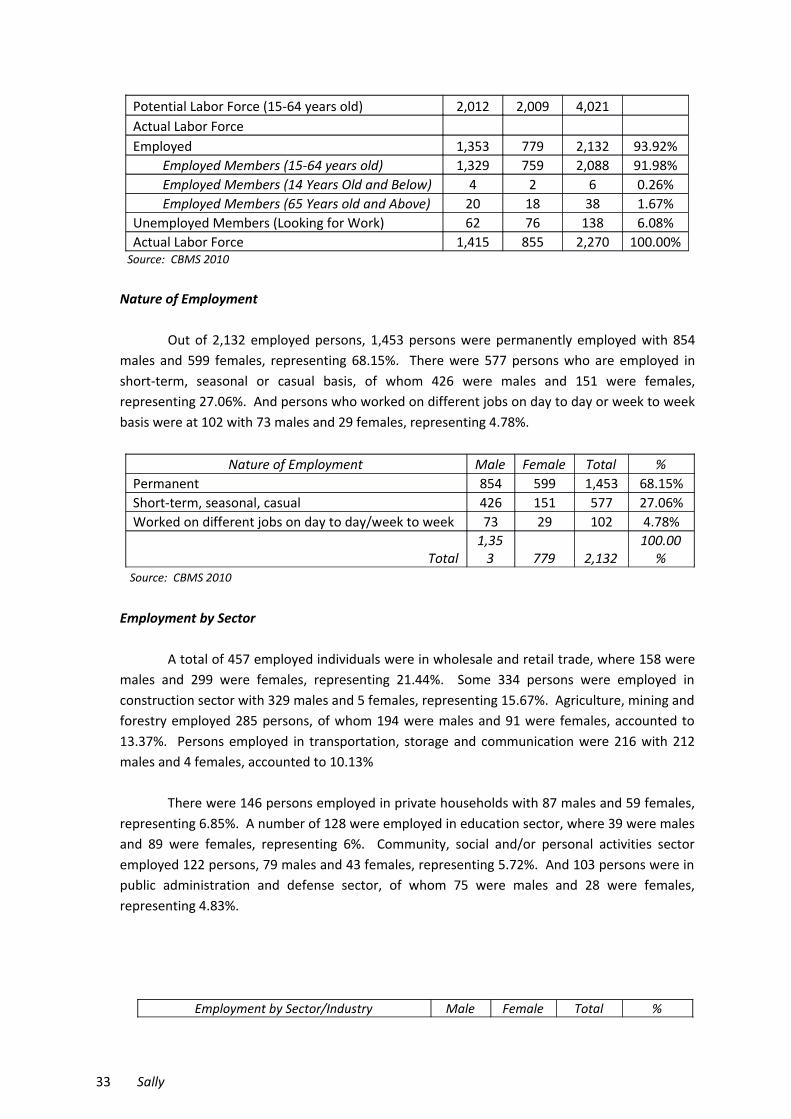
The potential labor force of Tawang is at 4,021 persons with 2,012 males and 2,009females. The actual labor force is 2,270 persons, which does not include those unable, notavailable and not looking for work (such as students, housewives, disabled, retired persons andseasonal workers). Out of 2,270, a total of 2,132 persons were employed, wherein 2,088 were15-64 years old, 38 persons were 65 years old and above, and 6 persons were below 14 year old.This garnered an employment rate of 93.92%. There were 138 unemployed persons with 62males and 76 females, representing 6.08%.
Labor Force Male Female Total %
32 Sally
Potential Labor Force (15-64 years old) 2,012 2,009 4,021Actual Labor ForceEmployed 1,353 779 2,132 93.92% Employed Members (15-64 years old) 1,329 759 2,088 91.98% Employed Members (14 Years Old and Below) 4 2 6 0.26% Employed Members (65 Years old and Above) 20 18 38 1.67%Unemployed Members (Looking for Work) 62 76 138 6.08%Actual Labor Force 1,415 855 2,270 100.00%
Source: CBMS 2010
Nature of Employment
Out of 2,132 employed persons, 1,453 persons were permanently employed with 854males and 599 females, representing 68.15%. There were 577 persons who are employed inshort-term, seasonal or casual basis, of whom 426 were males and 151 were females,representing 27.06%. And persons who worked on different jobs on day to day or week to weekbasis were at 102 with 73 males and 29 females, representing 4.78%.
Nature of Employment Male Female Total %Permanent 854 599 1,453 68.15%Short-term, seasonal, casual 426 151 577 27.06%Worked on different jobs on day to day/week to week 73 29 102 4.78%
Total1,35
3 779 2,132100.00
% Source: CBMS 2010
Employment by Sector
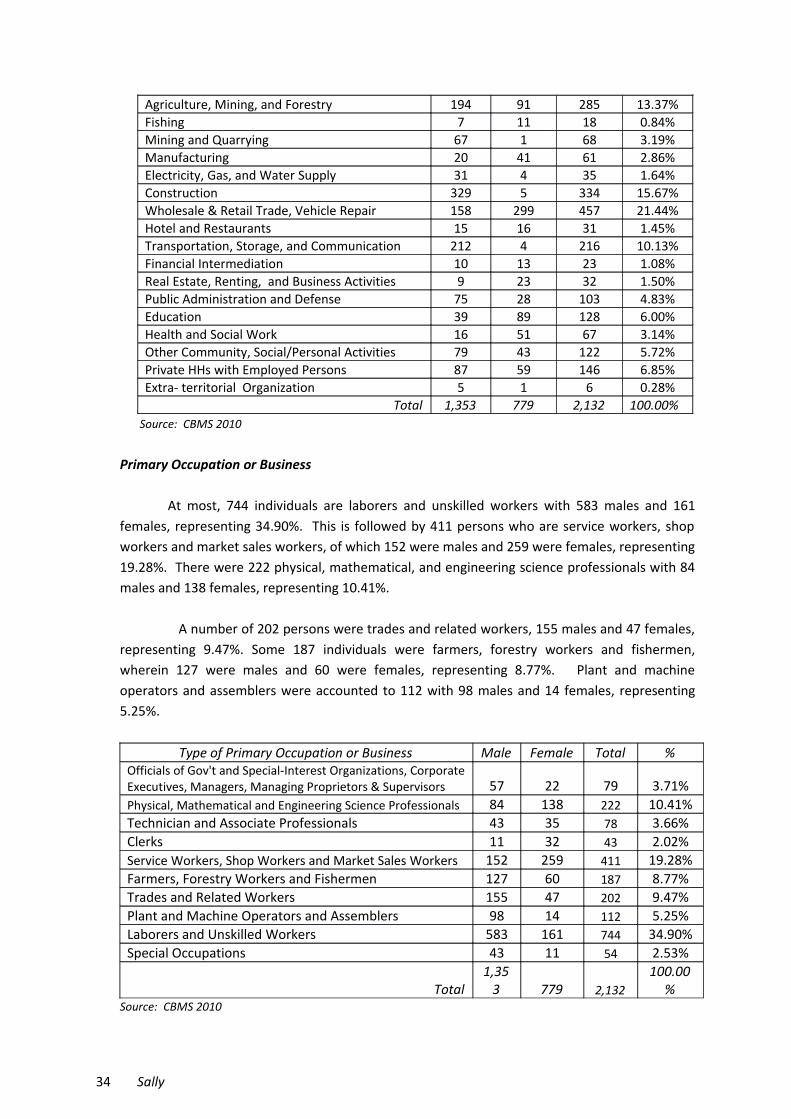
A total of 457 employed individuals were in wholesale and retail trade, where 158 weremales and 299 were females, representing 21.44%. Some 334 persons were employed inconstruction sector with 329 males and 5 females, representing 15.67%. Agriculture, mining andforestry employed 285 persons, of whom 194 were males and 91 were females, accounted to13.37%. Persons employed in transportation, storage and communication were 216 with 212males and 4 females, accounted to 10.13%
There were 146 persons employed in private households with 87 males and 59 females,representing 6.85%. A number of 128 were employed in education sector, where 39 were malesand 89 were females, representing 6%. Community, social and/or personal activities sectoremployed 122 persons, 79 males and 43 females, representing 5.72%. And 103 persons were inpublic administration and defense sector, of whom 75 were males and 28 were females,representing 4.83%.
Employment by Sector/Industry Male Female Total %
33 Sally
Agriculture, Mining, and Forestry 194 91 285 13.37%Fishing 7 11 18 0.84%Mining and Quarrying 67 1 68 3.19%Manufacturing 20 41 61 2.86%Electricity, Gas, and Water Supply 31 4 35 1.64%Construction 329 5 334 15.67%Wholesale & Retail Trade, Vehicle Repair 158 299 457 21.44%Hotel and Restaurants 15 16 31 1.45%Transportation, Storage, and Communication 212 4 216 10.13%Financial Intermediation 10 13 23 1.08%Real Estate, Renting, and Business Activities 9 23 32 1.50%Public Administration and Defense 75 28 103 4.83%Education 39 89 128 6.00%Health and Social Work 16 51 67 3.14%Other Community, Social/Personal Activities 79 43 122 5.72%Private HHs with Employed Persons 87 59 146 6.85%Extra- territorial Organization 5 1 6 0.28%
Total 1,353 779 2,132 100.00% Source: CBMS 2010
Primary Occupation or Business
At most, 744 individuals are laborers and unskilled workers with 583 males and 161females, representing 34.90%. This is followed by 411 persons who are service workers, shopworkers and market sales workers, of which 152 were males and 259 were females, representing19.28%. There were 222 physical, mathematical, and engineering science professionals with 84males and 138 females, representing 10.41%.
A number of 202 persons were trades and related workers, 155 males and 47 females,representing 9.47%. Some 187 individuals were farmers, forestry workers and fishermen,wherein 127 were males and 60 were females, representing 8.77%. Plant and machineoperators and assemblers were accounted to 112 with 98 males and 14 females, representing5.25%.
Type of Primary Occupation or Business Male Female Total %Officials of Gov't and Special-Interest Organizations, CorporateExecutives, Managers, Managing Proprietors & Supervisors 57 22 79 3.71%Physical, Mathematical and Engineering Science Professionals 84 138 222 10.41%Technician and Associate Professionals 43 35 78 3.66%Clerks 11 32 43 2.02%Service Workers, Shop Workers and Market Sales Workers 152 259 411 19.28%Farmers, Forestry Workers and Fishermen 127 60 187 8.77%Trades and Related Workers 155 47 202 9.47%Plant and Machine Operators and Assemblers 98 14 112 5.25%Laborers and Unskilled Workers 583 161 744 34.90%Special Occupations 43 11 54 2.53%
Total1,35
3 779 2,132100.00
%Source: CBMS 2010
34 Sally
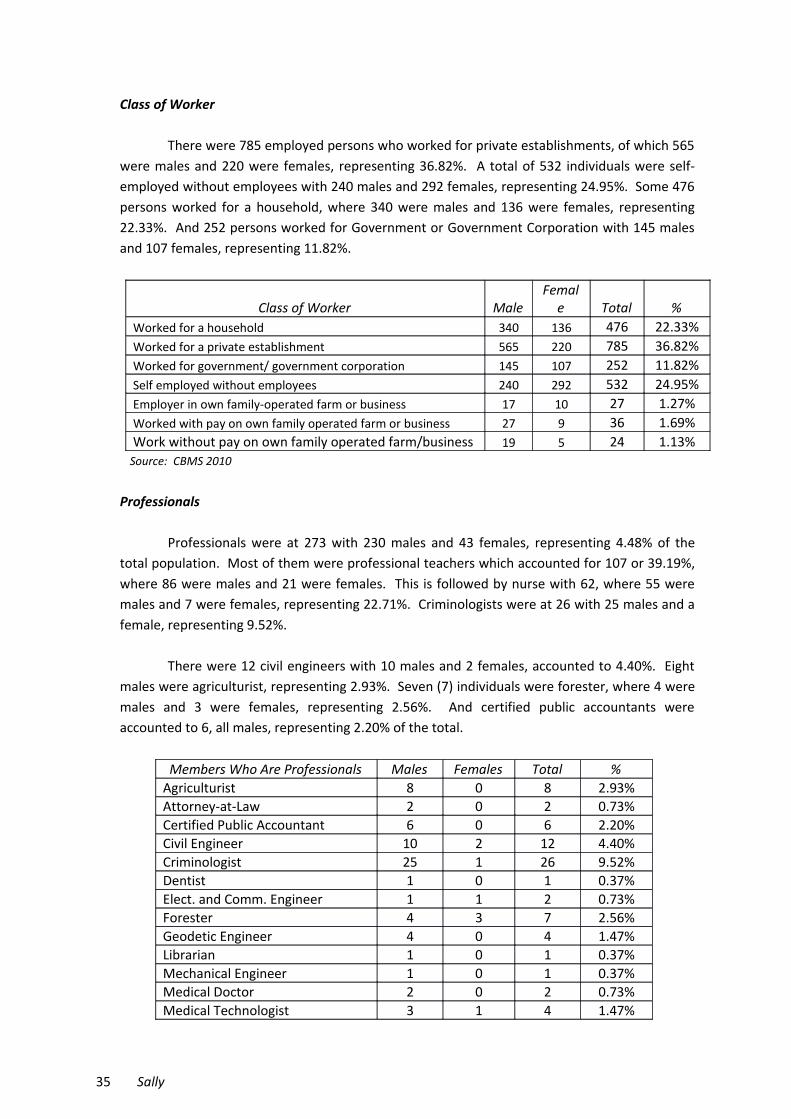
Class of Worker
There were 785 employed persons who worked for private establishments, of which 565were males and 220 were females, representing 36.82%. A total of 532 individuals were self-employed without employees with 240 males and 292 females, representing 24.95%. Some 476persons worked for a household, where 340 were males and 136 were females, representing22.33%. And 252 persons worked for Government or Government Corporation with 145 malesand 107 females, representing 11.82%.
Class of Worker MaleFemal
e Total %Worked for a household 340 136 476 22.33%Worked for a private establishment 565 220 785 36.82%Worked for government/ government corporation 145 107 252 11.82%Self employed without employees 240 292 532 24.95%Employer in own family-operated farm or business 17 10 27 1.27%Worked with pay on own family operated farm or business 27 9 36 1.69%Work without pay on own family operated farm/business 19 5 24 1.13%
Source: CBMS 2010
Professionals
Professionals were at 273 with 230 males and 43 females, representing 4.48% of thetotal population. Most of them were professional teachers which accounted for 107 or 39.19%,where 86 were males and 21 were females. This is followed by nurse with 62, where 55 weremales and 7 were females, representing 22.71%. Criminologists were at 26 with 25 males and afemale, representing 9.52%.
There were 12 civil engineers with 10 males and 2 females, accounted to 4.40%. Eightmales were agriculturist, representing 2.93%. Seven (7) individuals were forester, where 4 weremales and 3 were females, representing 2.56%. And certified public accountants wereaccounted to 6, all males, representing 2.20% of the total.
Members Who Are Professionals Males Females Total %Agriculturist 8 0 8 2.93%Attorney-at-Law 2 0 2 0.73%Certified Public Accountant 6 0 6 2.20%Civil Engineer 10 2 12 4.40%Criminologist 25 1 26 9.52%Dentist 1 0 1 0.37%Elect. and Comm. Engineer 1 1 2 0.73%Forester 4 3 7 2.56%Geodetic Engineer 4 0 4 1.47%Librarian 1 0 1 0.37%Mechanical Engineer 1 0 1 0.37%Medical Doctor 2 0 2 0.73%Medical Technologist 3 1 4 1.47%
35 Sally

Midwife 2 1 3 1.09%Mining Engineer 1 0 1 0.37%Naval Arch. And Marine Engineer 1 0 1 0.37%Nurse 55 7 62 22.71%Nutritionist Dietitian 2 0 2 0.73%Pharmacist 2 0 2 0.73%Physical Therapist 1 0 1 0.37%Physician 2 0 2 0.73%Professional Agricultural Engineer 1 0 1 0.37%Professional Teacher 86 21 107 39.19%Registered Electrical Engineer 1 1 2 0.73%Sanitary Engineer 1 0 1 0.37%Social Worker 1 0 1 0.37%Veterinarian 0 1 1 0.37%Others 6 4 10 3.66%
Total 230 43 273 100.00% Source: CBMS 2010
Unemployment and Job Search Method
There were a total of 138 unemployed persons who were searching for work with 62males and 76 females. As a method of searching for work, 38 persons placed or answeredprivate advertisements with 13 males and 25 females, representing 27.54%. Thirty four (34)persons approached relatives or friends, where 18 were males and 16 were females,representing 24.64%. Twenty seven (27) persons approached employer directly, of whom 15were males and 12 were females, representing 19.57%. Persons who registered in privateemployment agencies were at 25 with 12 males and 13 females, representing 18.12%. Eleven(11) persons registered in public employment agencies with 4 males and 7 females, representing7.97% of the total.
Job Search Method Male Female Total %Registered in public employment agency 4 7 11 7.97%Registered in private employment agency 12 13 25 18.12%Approached employer directly 15 12 27 19.57%Approached relatives/friends 18 16 34 24.64%Placed or answered private advertisements 13 25 38 27.54%Others 0 3 3 2.17%
Total 62 76 138 100.00% Source: CBMS 2010
Reason for Not Searching or Applying for a Job
From the potential labor force, a total of 1,795 persons were not looking for work. Thisis comprised of 621 males and 1,174 females. At most, 775 individuals were students with 365males and 410 females, representing 43.18%. There were 618 persons who were not in searchfor job due to housekeeping duties with 42 males and 576 females, representing 34.43%.
36 Sally

Some 134 were either too young or old, retired and/or permanently disabled with 67males and 67 females, representing 7.47%. A number of 101 individuals were waiting for resultsof previous job application, 54 males and 47 females, representing 5.63%. And 34 personsbelieved that there is no work available for them with 17 males and 17 females, representing1.89% of the total.
Reasons For Not Looking For Work (15-64 years old) Male Female Total %Believes no work is available 17 17 34 1.89%Awaiting results of previous job application 54 47 101 5.63%Temporary illness/disability 9 5 14 0.78%Bad Weather 2 0 2 0.11%Waiting for rehire/job recall 23 11 34 1.89%Too young/old, retired, permanently disabled 67 67 134 7.47%Housekeeping 42 576 618 34.43%Schooling 365 410 775 43.18%Other reasons 42 41 83 4.62%
Total 621 1,174 1,795 100.00% Source: CBMS 2010
Overseas Employment
There were 200 members of the households in Tawang who were Overseas Filipinoworkers. Hong Kong hired 33 workers, representing 16.50%. Thirty (30) workers were in SaudiArabia, representing 15%. Canada accommodated 17 workers, representing 8.50%. Fourteen(14) persons were workers in United Kingdom, representing 7%. Korea hired 12 workers,representing 6%. And another twelve (12) persons were in United Arab Emirates representing6% of the total.
Country of Work # % Country of Work # %Australia 5 2.50% Kuwait 2 1.00%Austria 1 0.50% Malaysia 4 2.00%Bahamas 1 0.50% New Zealand 1 0.50%Belize 1 0.50% Saudi Arabia 30 15.00%Brazil 1 0.50% Singapore 7 3.50%Brunei Darussalam 2 1.00% South Africa 1 0.50%Canada 17 8.50% Spain 1 0.50%Central African Republic 1 0.50% Switzerland 1 0.50%China 9 4.50% Taiwan 6 3.00%Cyprus 4 2.00% Thailand 1 0.50%Germany 1 0.50% United Arab Emirates 12 6.00%Hong Kong 33 16.50% United Kingdom 14 7.00%Israel 7 3.50% United States of America 11 5.50%Italy 4 2.00% Vietnam 1 0.50%Japan 8 4.00% Others 1 0.50%
Korea 12 6.00%Total 200 100.00
%
37 Sally

Source: CBMS 2010
Kind of Work Abroad
As to kind of work abroad, majority or 164 OFWs were service workers, shop workers,and market sales workers, of whom 115 were males and 49 were females, representing 82%.Physical, mathematical and engineering science professionals were at 15 with 7 males and 8females, representing 7.50%. There were 9 who are laborers and unskilled workers with 7 malesand 2 females, representing 4.50%. Another 9 were officials of government and special-interestorganizations, corporate executives, managers, managing proprietors and supervisors with 7males and 2 females, representing 4.50%.
Kind of Work in Abroad Male Female Total %Officials of Gov't & Special-Interest Organizations, CorporateExecutives, Managers, Managing Proprietors & Supervisors 7 2 9 4.50%Physical, Mathematical & Engineering Science Professionals 7 8 15 7.50%Technician and Associate Professionals 0 0 0 0.00%Clerks 0 0 0 0.00%Service Workers and Shop and Market Sales Workers 115 49 164 82.00%Farmers, Forestry Workers and Fishermen 1 0 1 0.50%Trades and Related Workers 0 0 0 0.00%Plant and Machine Operators and Assemblers 0 0 0 0.00%Laborers and Unskilled Workers 7 2 9 4.50%Special Occupations 1 1 2 1.00%
Total 138 62 200 100.00% Source: CBMS 2010
C. INFRASTRUCTURE AND UTILITIES
Electricity
Almost all of the households in the community have electrical connections with BENECO,which accounted to 1,352 households or 97.83% of the total households. Thirty (30) householdshave no electrical connections, representing 2.17%. The average monthly electrical bill was atⱣ416.00.
Number of Households with Electricity Connections: 1,352 (97.83% of total HHs)
Number of Households w/o Electricity Connections: 30 (2.17% of the HHs)
Average Monthly Electric Bill : Ᵽ416.00
Source of Electricity in the House/Building # %Electric Company 1,349 97.61%Generator 2 0.15%Solar 0 0.00%Battery 1 0.07%Others 0 0.00%
38 Sally
None 30 2.17%
Total 1,382100.00
%Source: CBMS 2010
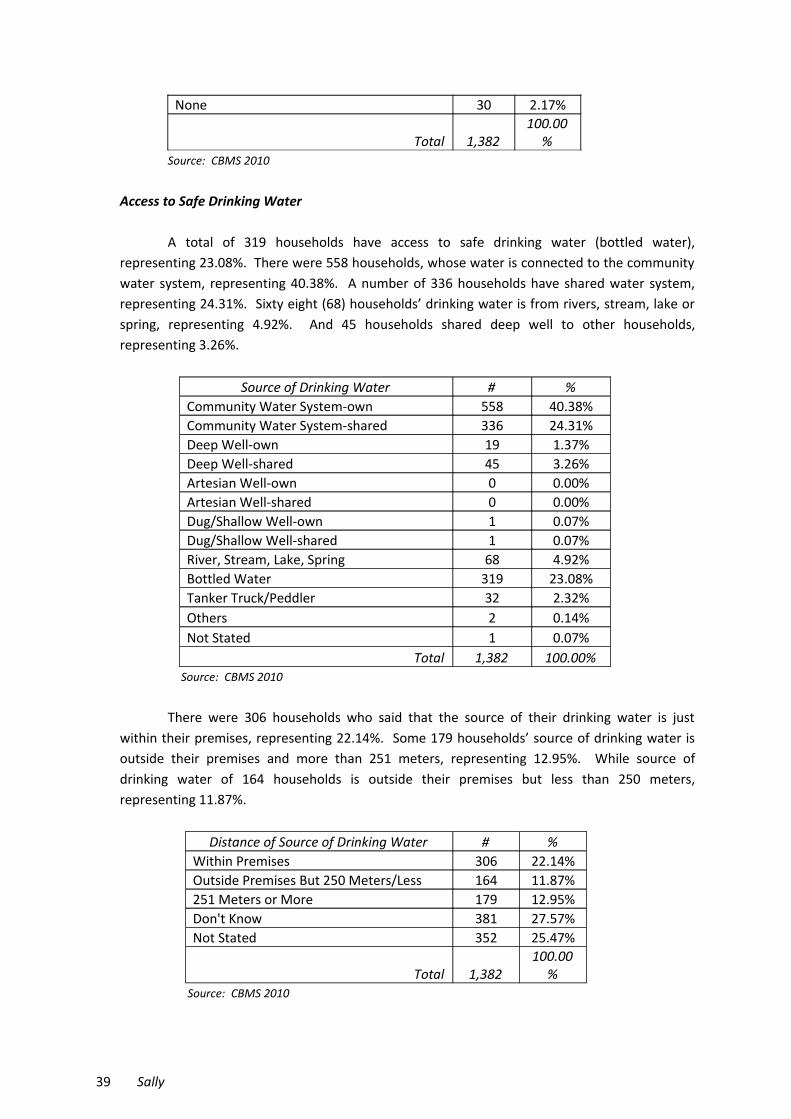
Access to Safe Drinking Water
A total of 319 households have access to safe drinking water (bottled water),representing 23.08%. There were 558 households, whose water is connected to the communitywater system, representing 40.38%. A number of 336 households have shared water system,representing 24.31%. Sixty eight (68) households’ drinking water is from rivers, stream, lake orspring, representing 4.92%. And 45 households shared deep well to other households,representing 3.26%.
Source of Drinking Water # %Community Water System-own 558 40.38%Community Water System-shared 336 24.31%Deep Well-own 19 1.37%Deep Well-shared 45 3.26%Artesian Well-own 0 0.00%Artesian Well-shared 0 0.00%Dug/Shallow Well-own 1 0.07%Dug/Shallow Well-shared 1 0.07%River, Stream, Lake, Spring 68 4.92%Bottled Water 319 23.08%Tanker Truck/Peddler 32 2.32%Others 2 0.14%Not Stated 1 0.07%
Total 1,382 100.00% Source: CBMS 2010
There were 306 households who said that the source of their drinking water is justwithin their premises, representing 22.14%. Some 179 households’ source of drinking water isoutside their premises and more than 251 meters, representing 12.95%. While source ofdrinking water of 164 households is outside their premises but less than 250 meters,representing 11.87%.
Distance of Source of Drinking Water # %Within Premises 306 22.14%Outside Premises But 250 Meters/Less 164 11.87%251 Meters or More 179 12.95%Don't Know 381 27.57%Not Stated 352 25.47%
Total 1,382100.00
% Source: CBMS 2010
39 Sally

Domestic Water System
Tawang Multi-purpose Cooperative runs a domestic water system that serves the five (5)sitios of Tawang namely: Boted, Central Tawang, Papasok, Banig and Dengsi.
The La Trinidad Water District also runs a domestic water system that serves householdsthat are not connected to Tawang Multi-purpose Cooperative. As of 2013, there were 449households whose water is connected to their domestic water system.
Roads
Name of Road Length(km)
RoadRow (m)
Areas ofJurisdiction Remarks
Bayan Park-Ambiong-Lubas-Tawang Rd. 6.962 4.000 Provincial Concrete/Gravel/Dirt
Tawang-Cruz Road 0.530 2.560 Barangay Gravel Source: CLUP 2000-10 &2013-2023
Cemetery
Barangay Tawang houses a registered cemetery located at Sitio Central Tawang. This issituated above the Tawang Barangay Hall. The cemetery can still accommodate tombs.
VI. GOVERNANCE
Vision
“We envision Barangay Tawang that is self-reliant, peaceful, having healthy andprogressive constituents living in an environment-friendly community, participating in thepromotion of competitive eco-tourism destination, improved transportation facilities with theintroduction of alternative source of living and sustained development for a united, harmoniousrelation and peace-loving residents in effective, efficient and orderly governance”.
Mission
“To boost the delivery/introduction of programs, projects, activities and services onlivelihood, tourism, environment and transportation. It is also a mandate to include health,public safety, social welfare and education for the benefit of our constituents and to ensureactive participation/dedication of the community in the implementation of other general publicservices and to strengthen coordination/linking/networking with the different government
40 Sally
agencies and non-government agencies/organization for the ultimate development of BarangayTawang.”
Goal
“To improve the quality of life of its residents economically, socially, morally, physically,and religiously through the maintenance of peace and order, implementation of solid wastemanagement programs, promotion of eco-tourism destination, livelihood programs within thecommunity, and implementation of social services in coordination/linking/networking withdifferent agencies for the ultimate development of the barangay.”
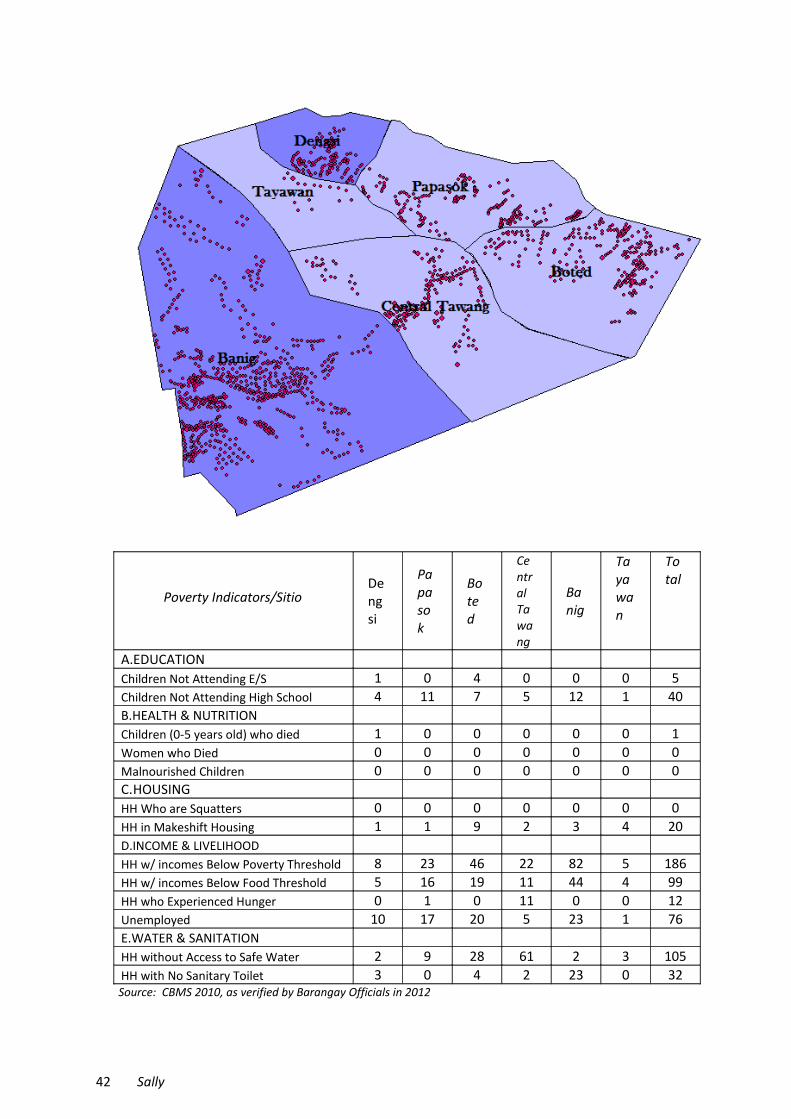
CBMS Indicators of Poverty
Low income is the most felt problem of the residents in barangay Tawang. There were186 households whose income are below 15,820 (poverty threshold), wherein 82 householdswere residents of Banig, 46 households in Boted, 23 in Papasok, 22 in Central Tawang, 8 inDengsi and 5 in Tayawan.
Another felt problem in the community is access to safe water wherein a total of 105households are affected. This comprised 61 households in Central Tawang, 28 household inBoted, 9 in Papasok, 3 in Tayawan, 2 in Dengsi and 2 in Banig.
41 Sally
Poverty Indicators/SitioDengsi
Papasok
Boted
Central Tawang
Banig
Tayawan
Total
A.EDUCATIONChildren Not Attending E/S 1 0 4 0 0 0 5Children Not Attending High School 4 11 7 5 12 1 40B.HEALTH & NUTRITIONChildren (0-5 years old) who died 1 0 0 0 0 0 1Women who Died 0 0 0 0 0 0 0Malnourished Children 0 0 0 0 0 0 0C.HOUSINGHH Who are Squatters 0 0 0 0 0 0 0HH in Makeshift Housing 1 1 9 2 3 4 20D.INCOME & LIVELIHOODHH w/ incomes Below Poverty Threshold 8 23 46 22 82 5 186HH w/ incomes Below Food Threshold 5 16 19 11 44 4 99HH who Experienced Hunger 0 1 0 11 0 0 12Unemployed 10 17 20 5 23 1 76E.WATER & SANITATIONHH without Access to Safe Water 2 9 28 61 2 3 105HH with No Sanitary Toilet 3 0 4 2 23 0 32
Source: CBMS 2010, as verified by Barangay Officials in 2012
42 Sally

/Sally
43 Sally


![[XLS] · Web viewChittorgarh Karur Balarampur ARGENTINA Kurnool Tawang Jorhat Gopalganj Koriya Kachchh Kurukshetra Solan Pulwama Jamtara Chitradurga Pathanamthitta Chhindwara Zunheboto](https://img.pdfslide.us/doc/110x75/5add97bb7f8b9ae1408d310d/xls-viewchittorgarh-karur-balarampur-argentina-kurnool-tawang-jorhat-gopalganj.jpg)