Embed Size (px)
Citation preview
Barangay Mapiña 2005-2006 Socio-Economic Profile 1
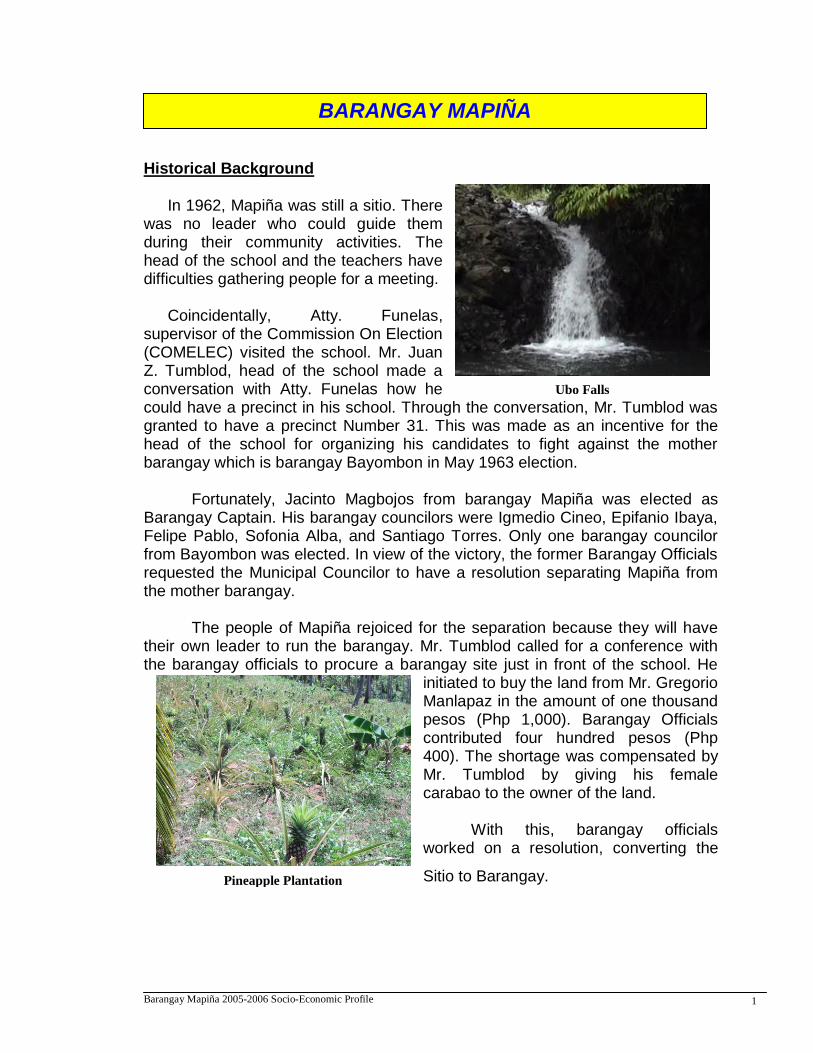
Historical Background In 1962, Mapiña was still a sitio. There
was no leader who could guide them during their community activities. The head of the school and the teachers have difficulties gathering people for a meeting.
Coincidentally, Atty. Funelas, supervisor of the Commission On Election (COMELEC) visited the school. Mr. Juan Z. Tumblod, head of the school made a conversation with Atty. Funelas how he could have a precinct in his school. Through the conversation, Mr. Tumblod was granted to have a precinct Number 31. This was made as an incentive for the head of the school for organizing his candidates to fight against the mother barangay which is barangay Bayombon in May 1963 election. Fortunately, Jacinto Magbojos from barangay Mapiña was elected as Barangay Captain. His barangay councilors were Igmedio Cineo, Epifanio Ibaya, Felipe Pablo, Sofonia Alba, and Santiago Torres. Only one barangay councilor from Bayombon was elected. In view of the victory, the former Barangay Officials requested the Municipal Councilor to have a resolution separating Mapiña from the mother barangay. The people of Mapiña rejoiced for the separation because they will have their own leader to run the barangay. Mr. Tumblod called for a conference with the barangay officials to procure a barangay site just in front of the school. He
initiated to buy the land from Mr. Gregorio Manlapaz in the amount of one thousand pesos (Php 1,000). Barangay Officials contributed four hundred pesos (Php 400). The shortage was compensated by Mr. Tumblod by giving his female carabao to the owner of the land. With this, barangay officials worked on a resolution, converting the
Sitio to Barangay.
BARANGAY MAPIÑA
Ubo Falls
Pineapple Plantation
Barangay Mapiña 2005-2006 Socio-Economic Profile 2
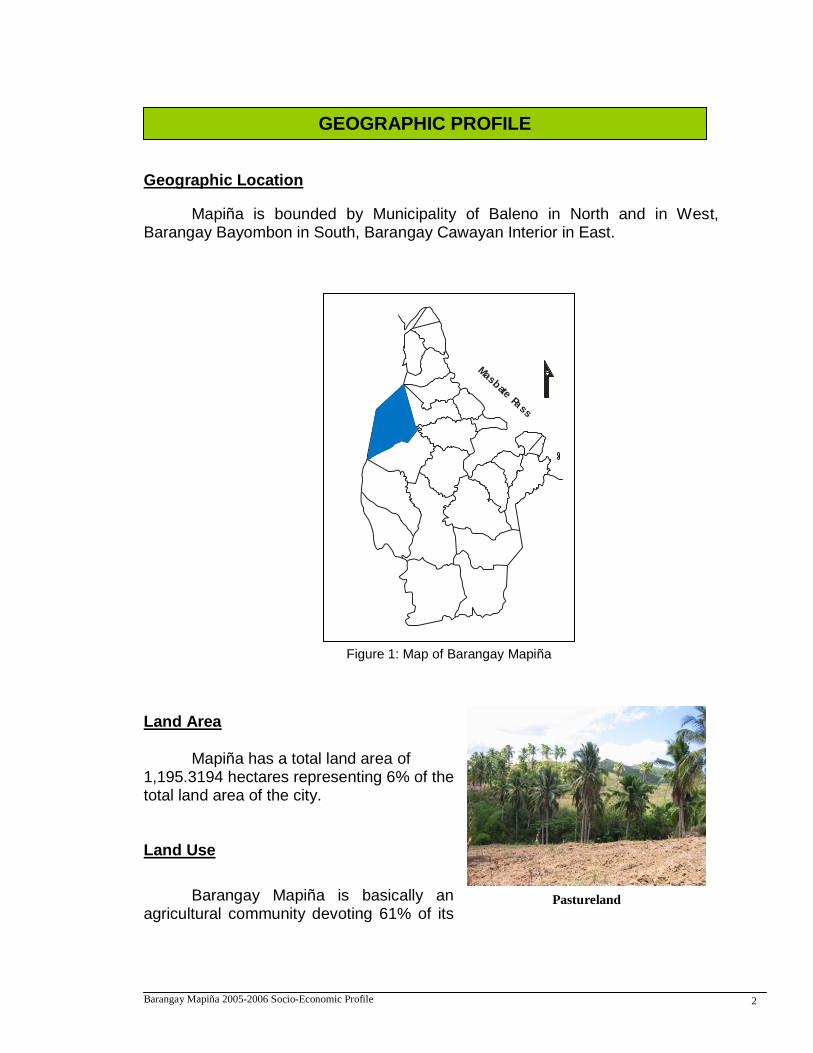
Geographic Location
Mapiña is bounded by Municipality of Baleno in North and in West, Barangay Bayombon in South, Barangay Cawayan Interior in East.
Land Area
Mapiña has a total land area of 1,195.3194 hectares representing 6% of the total land area of the city. Land Use
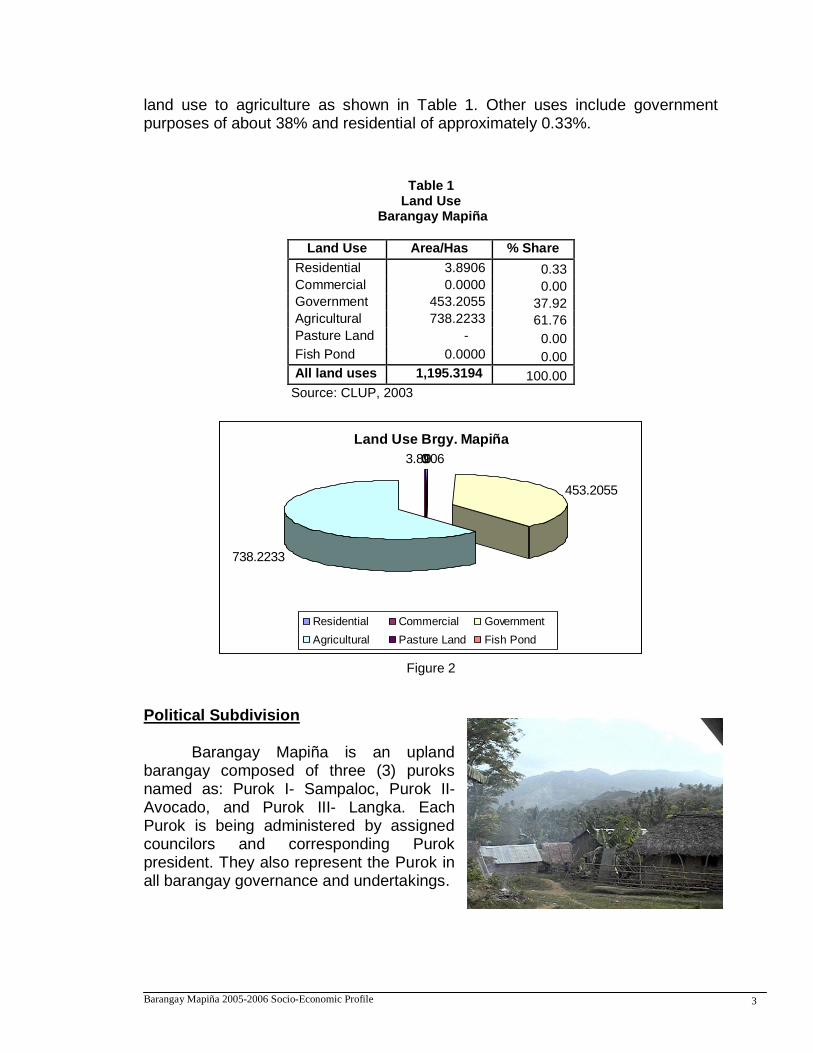
Barangay Mapiña is basically an agricultural community devoting 61% of its
GEOGRAPHIC PROFILE
Figure 1: Map of Barangay Mapiña
Masb
ate Pa
ss
Pastureland
Barangay Mapiña 2005-2006 Socio-Economic Profile 3
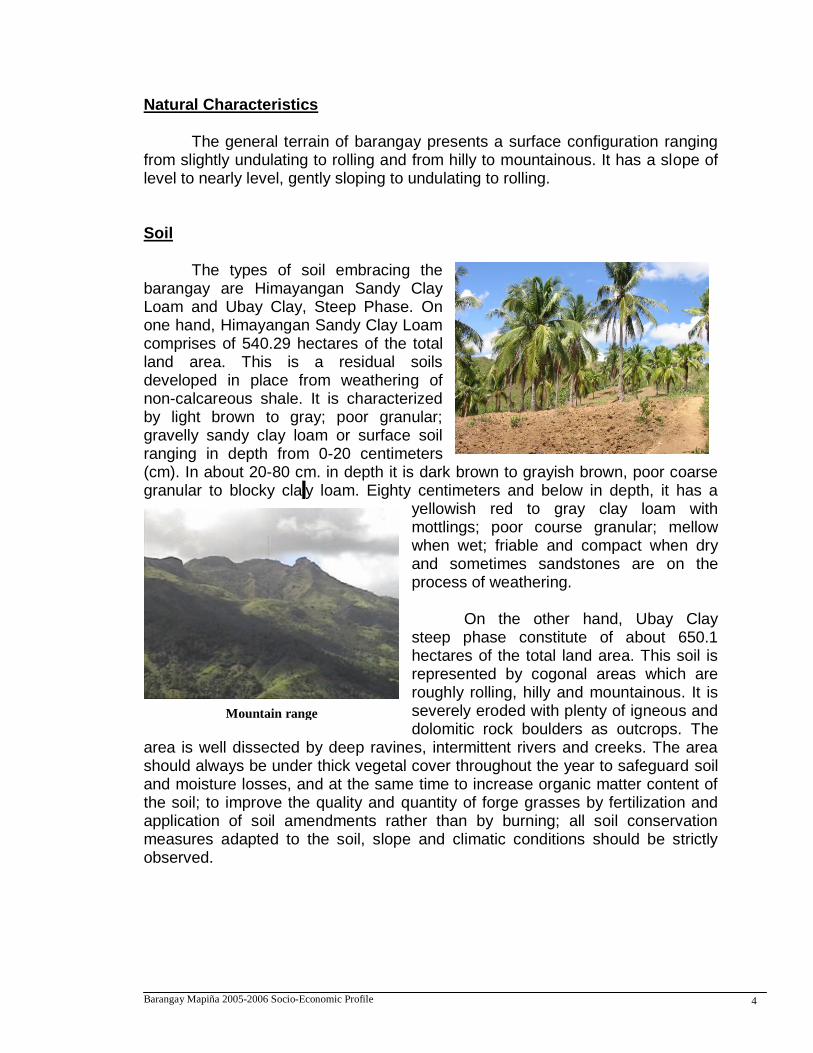
land use to agriculture as shown in Table 1. Other uses include government purposes of about 38% and residential of approximately 0.33%.
Table 1 Land Use
Barangay Mapiña
Land Use Area/Has % Share
Residential 3.8906 0.33 Commercial 0.0000 0.00 Government 453.2055 37.92 Agricultural 738.2233 61.76 Pasture Land - 0.00 Fish Pond 0.0000 0.00
All land uses 1,195.3194 100.00
Source: CLUP, 2003
Figure 2
Political Subdivision
Barangay Mapiña is an upland barangay composed of three (3) puroks named as: Purok I- Sampaloc, Purok II- Avocado, and Purok III- Langka. Each Purok is being administered by assigned councilors and corresponding Purok president. They also represent the Purok in all barangay governance and undertakings.
Land Use Brgy. Mapiña
3.89060
453.2055
738.2233
00
Residential Commercial Government
Agricultural Pasture Land Fish Pond
Barangay Mapiña 2005-2006 Socio-Economic Profile 4
Natural Characteristics
The general terrain of barangay presents a surface configuration ranging from slightly undulating to rolling and from hilly to mountainous. It has a slope of level to nearly level, gently sloping to undulating to rolling. Soil
The types of soil embracing the barangay are Himayangan Sandy Clay Loam and Ubay Clay, Steep Phase. On one hand, Himayangan Sandy Clay Loam comprises of 540.29 hectares of the total land area. This is a residual soils developed in place from weathering of non-calcareous shale. It is characterized by light brown to gray; poor granular; gravelly sandy clay loam or surface soil ranging in depth from 0-20 centimeters (cm). In about 20-80 cm. in depth it is dark brown to grayish brown, poor coarse granular to blocky cla y loam. Eighty centimeters and below in depth, it has a
yellowish red to gray clay loam with mottlings; poor course granular; mellow when wet; friable and compact when dry and sometimes sandstones are on the process of weathering.
On the other hand, Ubay Clay
steep phase constitute of about 650.1 hectares of the total land area. This soil is represented by cogonal areas which are roughly rolling, hilly and mountainous. It is severely eroded with plenty of igneous and dolomitic rock boulders as outcrops. The
area is well dissected by deep ravines, intermittent rivers and creeks. The area should always be under thick vegetal cover throughout the year to safeguard soil and moisture losses, and at the same time to increase organic matter content of the soil; to improve the quality and quantity of forge grasses by fertilization and application of soil amendments rather than by burning; all soil conservation measures adapted to the soil, slope and climatic conditions should be strictly observed.
Mountain range
Barangay Mapiña 2005-2006 Socio-Economic Profile 5
Hydrogeology Water supply of the barangay is rated poor to fair with majority of water coming from dugwell, shallow well and deep wells. Having a residual soil developed from sedimentation, quality of water is influenced with the presence of some sediment. Hence, potability of water is affected. Proper care must be exercised for drinking to prevent water-related diseases. Water in the barangay is commonly use for domestic and agricultural activities.
Natural Resources
At the mountainous part of the barangay in Purok 3 exists an untapped forest ecosystem. It hosts to diverse flora and fauna, as well as forest and commercial trees. Commonly found fauna are wild boar, snakes, birds, and monkeys. A variety of locally known fore st and commercial trees grow abundantly like narra, lauan white and red, acacia, jamorawon, apitong, molave, mahogany etc. This area is actually inaccessible by many residents since the area is very far and mountainous. The protection of this forest must be took in hand for possible threat from man-made destruction. Land Use Potentials
Barangay. Mapiña has a vast tract of agriculture area. Having these resources, it has the potential to develop and turn its unutilized agricultural land into a more productive area for growing fruit trees. Since their major produce is copra, farmers can also discover alternative products from coconut. Pineapple production can also be increased since the barangay has ample produce of “pinya “ before. In addition, it is also suitable for livestock and poultry production.
Communal Faucet
Barangay Mapiña 2005-2006 Socio-Economic Profile 6
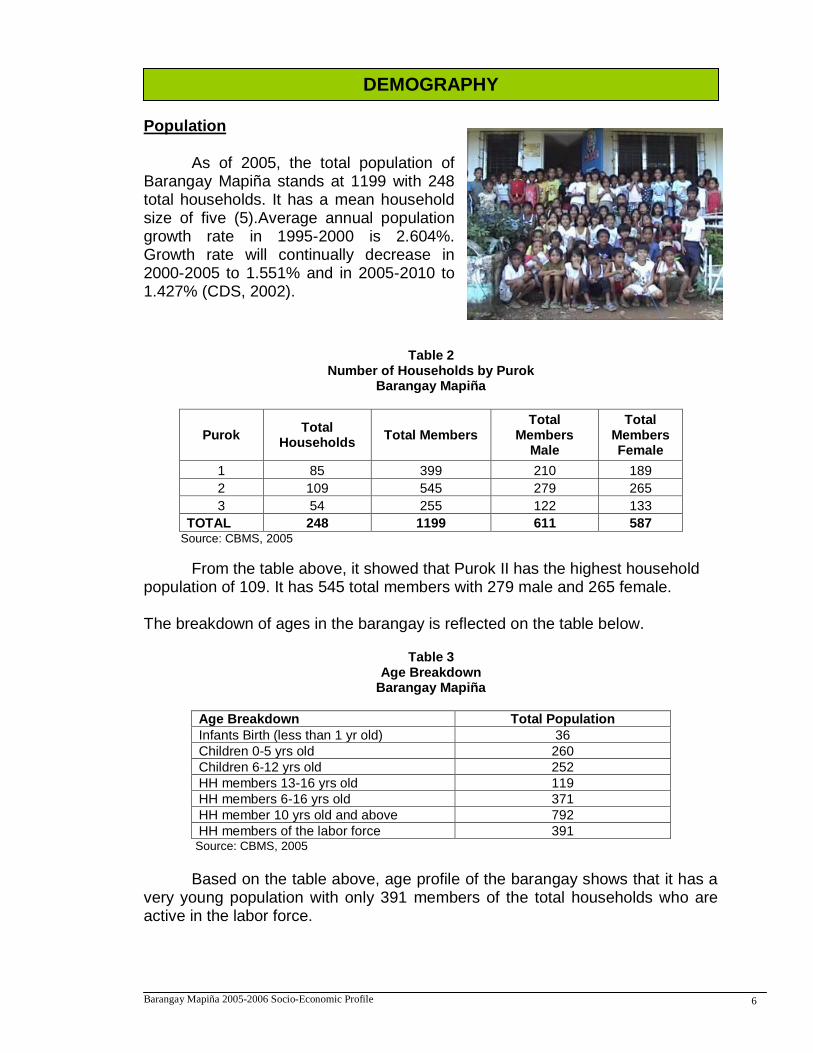
Population
As of 2005, the total population of Barangay Mapiña stands at 1199 with 248 total households. It has a mean household size of five (5).Average annual population growth rate in 1995-2000 is 2.604%. Growth rate will continually decrease in 2000-2005 to 1.551% and in 2005-2010 to 1.427% (CDS, 2002).
Table 2
Number of Households by Purok Barangay Mapiña
Purok Total
Households Total Members
Total Members
Male
Total Members Female
1 85 399 210 189
2 109 545 279 265
3 54 255 122 133
TOTAL 248 1199 611 587 Source: CBMS, 2005
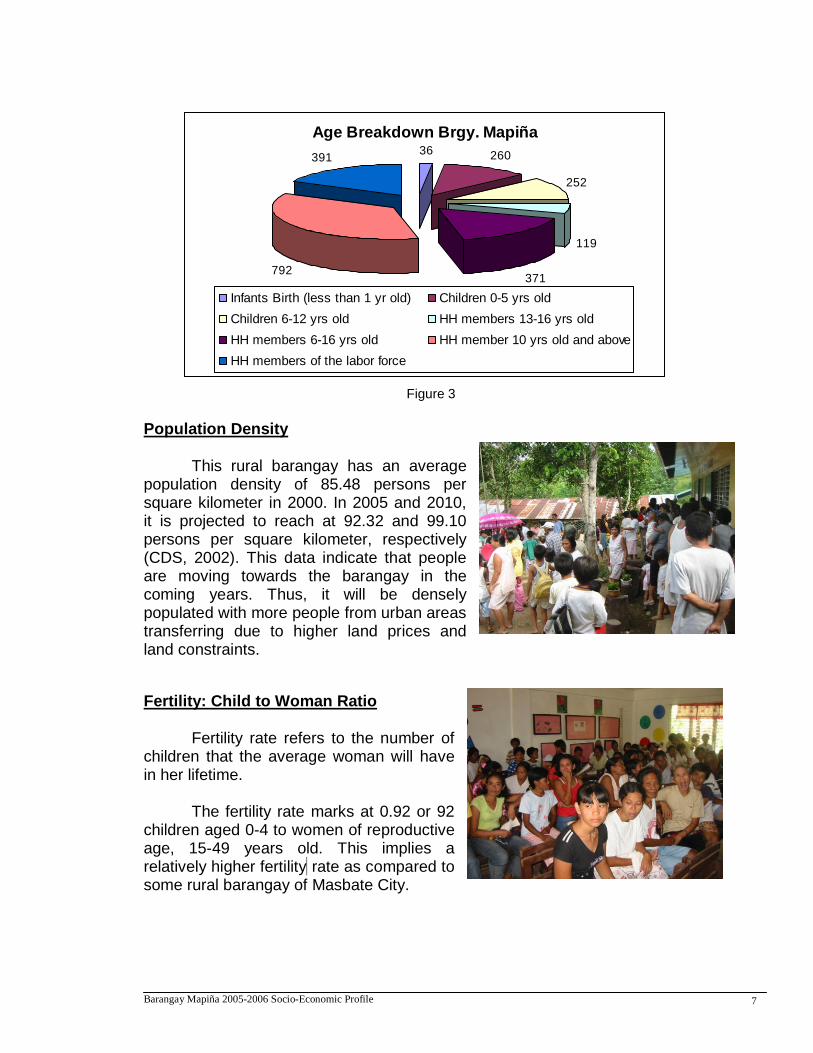
From the table above, it showed that Purok II has the highest household population of 109. It has 545 total members with 279 male and 265 female. The breakdown of ages in the barangay is reflected on the table below.
Table 3 Age Breakdown
Barangay Mapiña
Age Breakdown Total Population
Infants Birth (less than 1 yr old) 36
Children 0-5 yrs old 260
Children 6-12 yrs old 252
HH members 13-16 yrs old 119
HH members 6-16 yrs old 371
HH member 10 yrs old and above 792
HH members of the labor force 391 Source: CBMS, 2005
Based on the table above, age profile of the barangay shows that it has a very young population with only 391 members of the total households who are active in the labor force.
DEMOGRAPHY
Barangay Mapiña 2005-2006 Socio-Economic Profile 7
Figure 3
Population Density
This rural barangay has an average population density of 85.48 persons per square kilometer in 2000. In 2005 and 2010, it is projected to reach at 92.32 and 99.10 persons per square kilometer, respectively (CDS, 2002). This data indicate that people are moving towards the barangay in the coming years. Thus, it will be densely populated with more people from urban areas transferring due to higher land prices and land constraints.
Fertility: Child to Woman Ratio
Fertility rate refers to the number of children that the average woman will have in her lifetime.
The fertility rate marks at 0.92 or 92 children aged 0-4 to women of reproductive age, 15-49 years old. This implies a relatively higher fertility rate as compared to some rural barangay of Masbate City.
Age Breakdown Brgy. Mapiña36 260
252
119
371792
391
Infants Birth (less than 1 yr old) Children 0-5 yrs old
Children 6-12 yrs old HH members 13-16 yrs old
HH members 6-16 yrs old HH member 10 yrs old and above
HH members of the labor force
Barangay Mapiña 2005-2006 Socio-Economic Profile 8
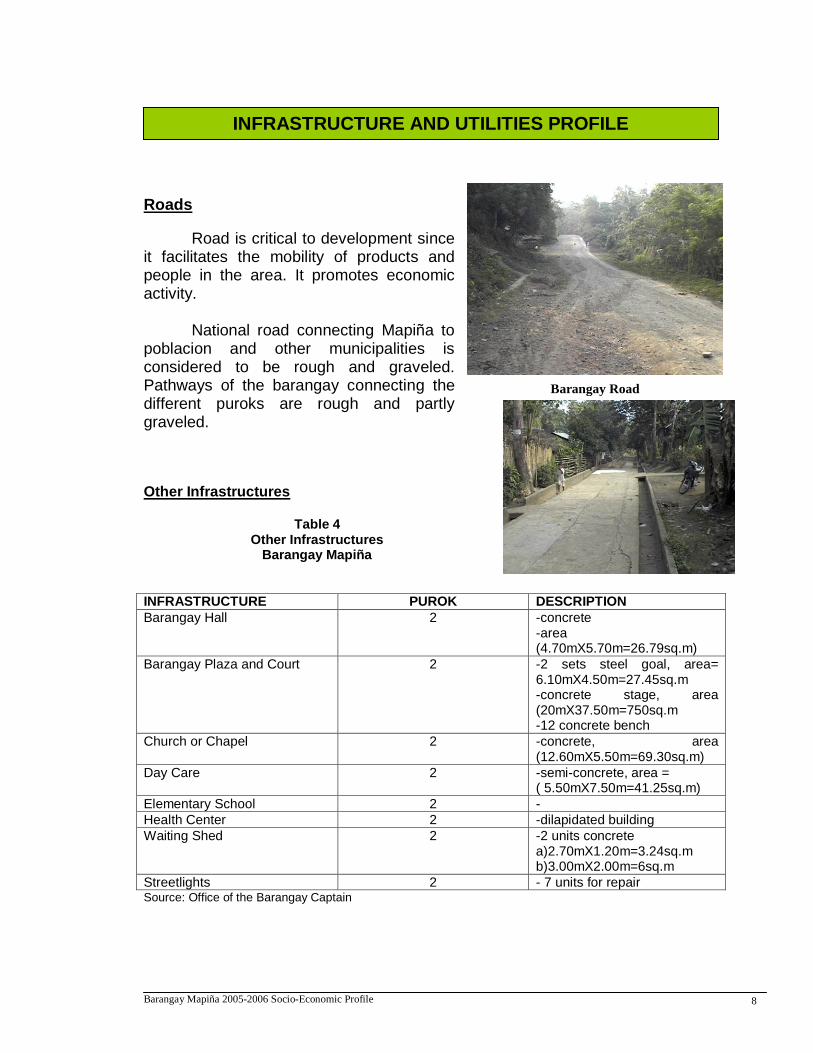
Roads
Road is critical to development since it facilitates the mobility of products and people in the area. It promotes economic activity.
National road connecting Mapiña to poblacion and other municipalities is considered to be rough and graveled. Pathways of the barangay connecting the different puroks are rough and partly graveled. Other Infrastructures
Table 4 Other Infrastructures
Barangay Mapiña
INFRASTRUCTURE PUROK DESCRIPTION
Barangay Hall 2 -concrete -area (4.70mX5.70m=26.79sq.m)
Barangay Plaza and Court 2 -2 sets steel goal, area= 6.10mX4.50m=27.45sq.m -concrete stage, area (20mX37.50m=750sq.m -12 concrete bench
Church or Chapel 2 -concrete, area (12.60mX5.50m=69.30sq.m)
Day Care 2 -semi-concrete, area = ( 5.50mX7.50m=41.25sq.m)
Elementary School 2 -
Health Center 2 -dilapidated building
Waiting Shed 2 -2 units concrete a)2.70mX1.20m=3.24sq.m b)3.00mX2.00m=6sq.m
Streetlights 2 - 7 units for repair Source: Office of the Barangay Captain
INFRASTRUCTURE AND UTILITIES PROFILE
Barangay Road
Barangay Mapiña 2005-2006 Socio-Economic Profile 9
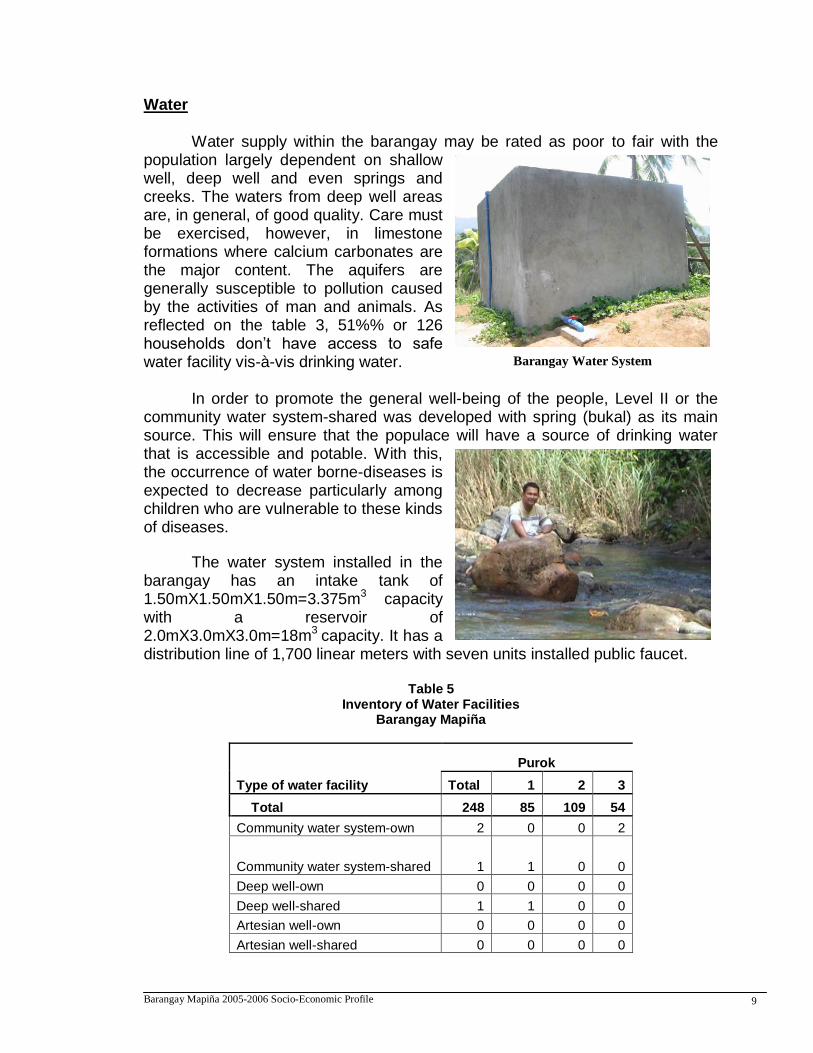
Water
Water supply within the barangay may be rated as poor to fair with the population largely dependent on shallow well, deep well and even springs and creeks. The waters from deep well areas are, in general, of good quality. Care must be exercised, however, in limestone formations where calcium carbonates are the major content. The aquifers are generally susceptible to pollution caused by the activities of man and animals. As reflected on the table 3, 51%% or 126 households don’t have access to safe water facility vis-à-vis drinking water.
In order to promote the general well-being of the people, Level II or the
community water system-shared was developed with spring (bukal) as its main source. This will ensure that the populace will have a source of drinking water that is accessible and potable. With this, the occurrence of water borne-diseases is expected to decrease particularly among children who are vulnerable to these kinds of diseases.
The water system installed in the barangay has an intake tank of 1.50mX1.50mX1.50m=3.375m3 capacity with a reservoir of 2.0mX3.0mX3.0m=18m3 capacity. It has a distribution line of 1,700 linear meters with seven units installed public faucet.
Table 5
Inventory of Water Facilities Barangay Mapiña
Type of water facility
Purok
Total 1 2 3
Total 248 85 109 54
Community water system-own 2 0 0 2
Community water system-shared 1 1 0 0
Deep well-own 0 0 0 0
Deep well-shared 1 1 0 0
Artesian well-own 0 0 0 0
Artesian well-shared 0 0 0 0
Barangay Water System
Barangay Mapiña 2005-2006 Socio-Economic Profile 10
Dug/shallow well-own 10 10 0 0
Dug/shallow well-shared 148 0 106 42
River, stream, lake, spring, bodies of water 86 73 3 10
Bottled water 0 0 0 0
Others 0 0 0 0 Source: CBMS, 2005
Table 6
Access To Safe Water Barangay Mapiña
Purok Total Households
Households W/ Access To
SWS
Percentage Households W/O Access To Safe Water
Percentage
Purok 01 85 2 2.36 83 97.64
Purok 02 109 0 0 109 100
Purok 03 54 2 3.71 52 96.29
TOTAL 248 4 1.60 244 98.40 Source: CBMS, 2005
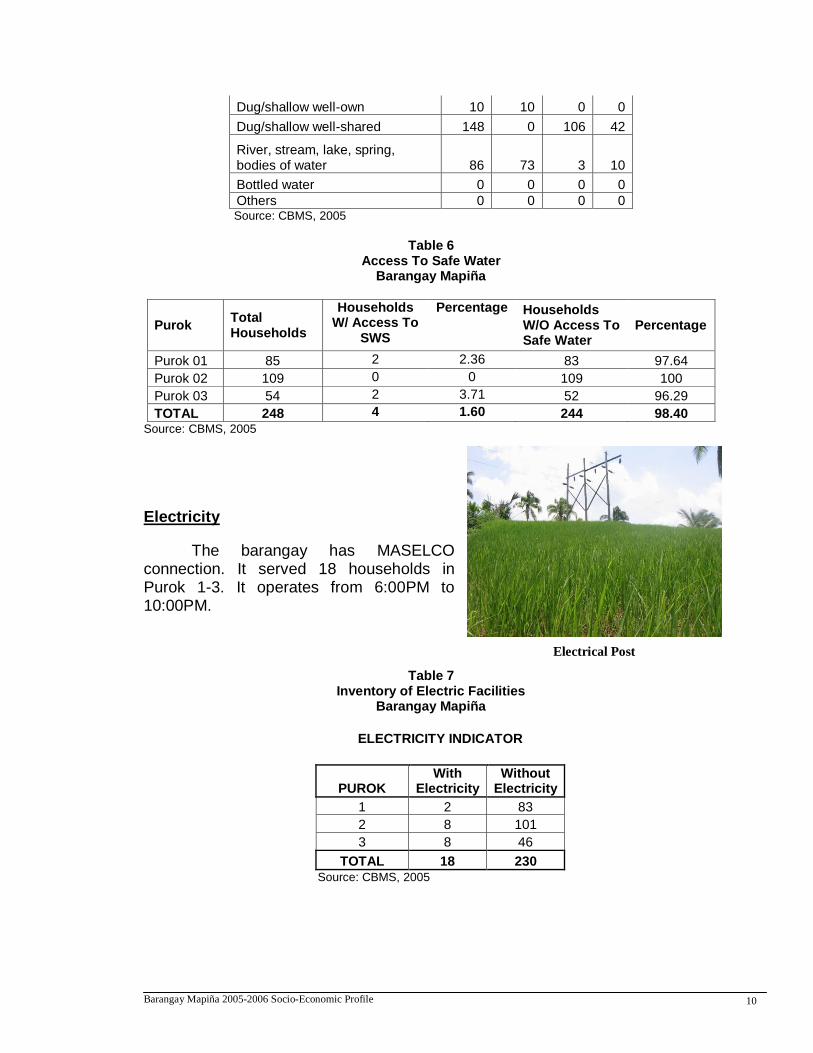
Electricity
The barangay has MASELCO connection. It served 18 households in Purok 1-3. It operates from 6:00PM to 10:00PM.
Table 7 Inventory of Electric Facilities
Barangay Mapiña
ELECTRICITY INDICATOR
PUROK With
Electricity Without
Electricity
1 2 83
2 8 101
3 8 46
TOTAL 18 230 Source: CBMS, 2005
Electrical Post
Barangay Mapiña 2005-2006 Socio-Economic Profile 11
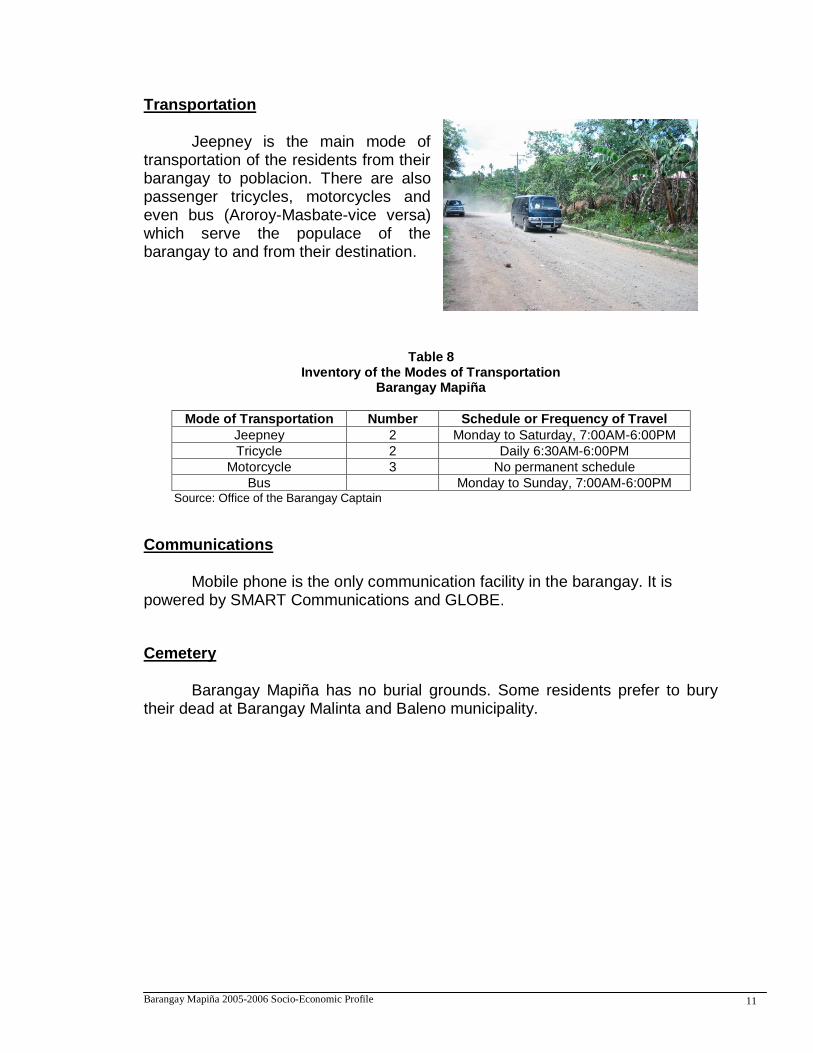
Transportation
Jeepney is the main mode of transportation of the residents from their barangay to poblacion. There are also passenger tricycles, motorcycles and even bus (Aroroy-Masbate-vice versa) which serve the populace of the barangay to and from their destination.
Table 8
Inventory of the Modes of Transportation Barangay Mapiña
Mode of Transportation Number Schedule or Frequency of Travel
Jeepney 2 Monday to Saturday, 7:00AM-6:00PM
Tricycle 2 Daily 6:30AM-6:00PM
Motorcycle 3 No permanent schedule
Bus Monday to Sunday, 7:00AM-6:00PM Source: Office of the Barangay Captain
Communications
Mobile phone is the only communication facility in the barangay. It is powered by SMART Communications and GLOBE.
Cemetery
Barangay Mapiña has no burial grounds. Some residents prefer to bury their dead at Barangay Malinta and Baleno municipality.
Barangay Mapiña 2005-2006 Socio-Economic Profile 12
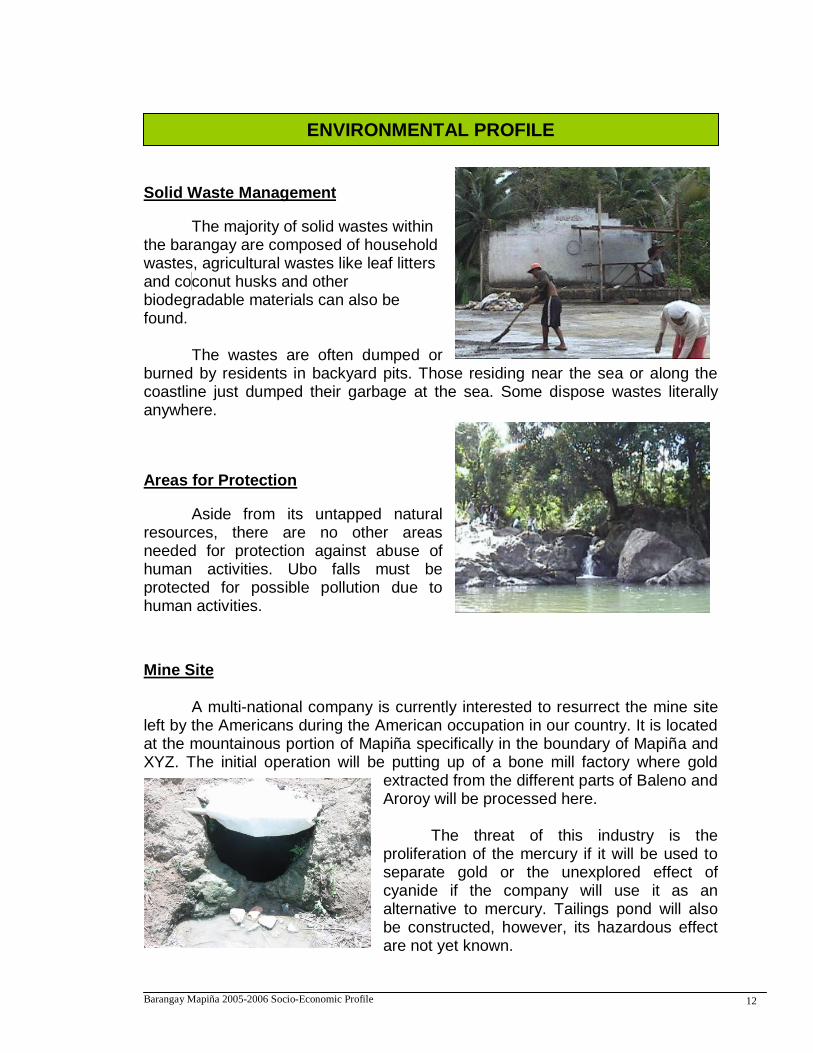
Solid Waste Management
The majority of solid wastes within the barangay are composed of household wastes, agricultural wastes like leaf litters and co conut husks and other biodegradable materials can also be found.
The wastes are often dumped or burned by residents in backyard pits. Those residing near the sea or along the coastline just dumped their garbage at the sea. Some dispose wastes literally anywhere.
Areas for Protection
Aside from its untapped natural resources, there are no other areas needed for protection against abuse of human activities. Ubo falls must be protected for possible pollution due to human activities.
Mine Site
A multi-national company is currently interested to resurrect the mine site left by the Americans during the American occupation in our country. It is located at the mountainous portion of Mapiña specifically in the boundary of Mapiña and XYZ. The initial operation will be putting up of a bone mill factory where gold
extracted from the different parts of Baleno and Aroroy will be processed here. The threat of this industry is the proliferation of the mercury if it will be used to separate gold or the unexplored effect of cyanide if the company will use it as an alternative to mercury. Tailings pond will also be constructed, however, its hazardous effect are not yet known.
ENVIRONMENTAL PROFILE

Barangay Mapiña 2005-2006 Socio-Economic Profile 13
Summary of Indicators Barangay Mapiña
Source: CBMS 2005
Area of Concern
Indicator Number Proportion Rank
Health
1. Proportion of children 0-5 years old who died.
9 3.30 8
2. Proportion of women who died due to pregnancy related-cause. 0 - 14
Nutrition 3. Proportion of children 0-5 years old who are moderately and severely underweight.
4 1.50 12
Shelter
4. Proportion of households who are squatters. 4 1.60 11
5. Proportion of households with makeshift housing. 7 2.80 9
Water & Sanitation
6. Proportion of households without access to safe water.
244 98.40 1
7. Proportion of households without access to sanitary toilet facilities. 172 69.40 2
Education
8. Proportion of children 6-12 years old not in elementary.
56 22.20 7
9. Proportion of children 13-16 years old not in high school.
82 68.90 3
Income
10. Proportion of households with income less than the poverty threshold.
130 52.40 4
11. Proportion of households with income less than the food threshold.
61 24.60 5
12. Proportion of households who eat less than three meals a day. 5 2.00 10
Employment 13. Unemployment Rate 44 11.30 6
Peace and Order
14. Proportion of household members victimized by crime. 2 0.20 13
POVERTY PROFILE
Barangay Mapiña 2005-2006 Socio-Economic Profile 14
Based on the table above, it revealed that the top five Minimum Basic Need of Barangay Mapiña are the following:
1) Proportion of households without access to safe water; 2) Proportion of households without access to sanitary toilet facilities; 3) Proportion of children 13-16 years old not in high school; 4) Proportion of households with income less than the poverty threshold; 5) Proportion of households with income less than the food threshold.
It can be derived that poverty poses the main concern of the barangay as
well as the city. Hence, programs and projects developed by the city government should be geared towards poverty reduction.
Summary of Issues/Concerns and Challenges
1. Proportion of households with no access to safe water.
Construction of Level II water project (communal faucet) should be implemented to cover the whole barangay. Such project will reduce the contamination of water source.
Chlorination of open dug well as well as deep or shallow well.
Periodic monitoring of water source.
2. On proportion of households with no access to sanitary toilet facilities.
Almost 69% or 172 households do not have sanitary toilet. This means that there is an indiscriminate dumping of human waste anywhere which may pose hazard to the health condition of the populace. In view of this, the barangay may allocate funds for this problem so that public or a private toilet should be constructed with common septic tank.
3. Proportion of children 13-16 years old not in high school.
Grant scholarship to poor but deserving students.
Road improvement for the accessibility of high school
4. Proportion of household with income less than the poverty threshold.
Encourage investors in the barangay to open new livelihood opportunities that will provide the residents job that will give them a permanent monthly income.
Barangay Mapiña 2005-2006 Socio-Economic Profile 15
Provide capital for food processing projects and other small scale business.
Skills enhancement training for residents in preparation for job opportunities such as welders, mechanics, and other related works.
Intensification of seeds and animal dispersal with fertilizer and agricultural equipment.
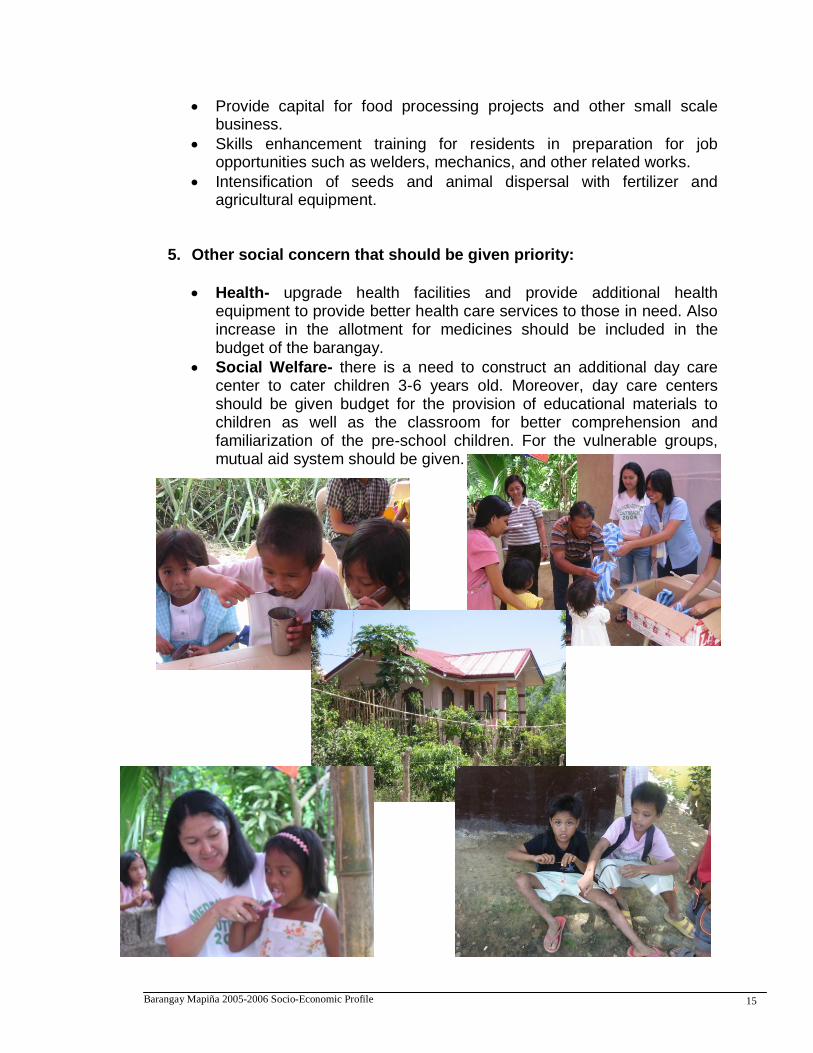
5. Other social concern that should be given priority:
Health- upgrade health facilities and provide additional health equipment to provide better health care services to those in need. Also increase in the allotment for medicines should be included in the budget of the barangay.
Social Welfare- there is a need to construct an additional day care center to cater children 3-6 years old. Moreover, day care centers should be given budget for the provision of educational materials to children as well as the classroom for better comprehension and familiarization of the pre-school children. For the vulnerable groups, mutual aid system should be given.
Barangay Mapiña 2005-2006 Socio-Economic Profile 16
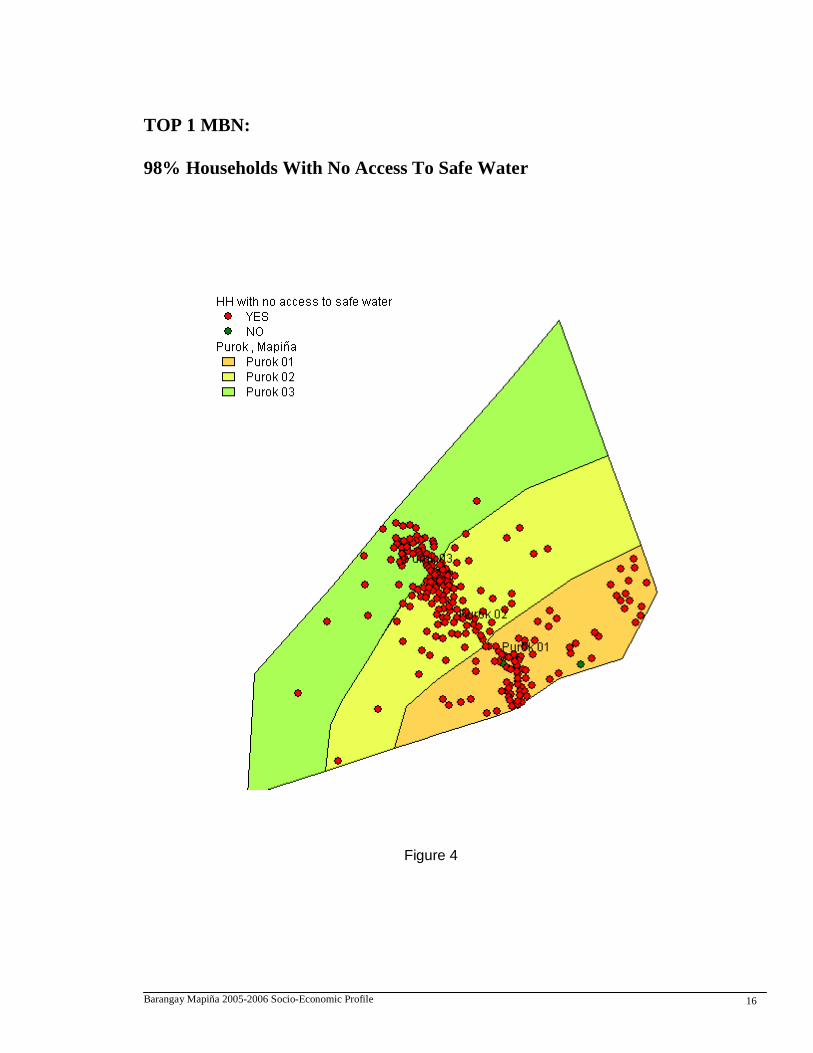
TOP 1 MBN:
98% Households With No Access To Safe Water
Figure 4
Barangay Mapiña 2005-2006 Socio-Economic Profile 17
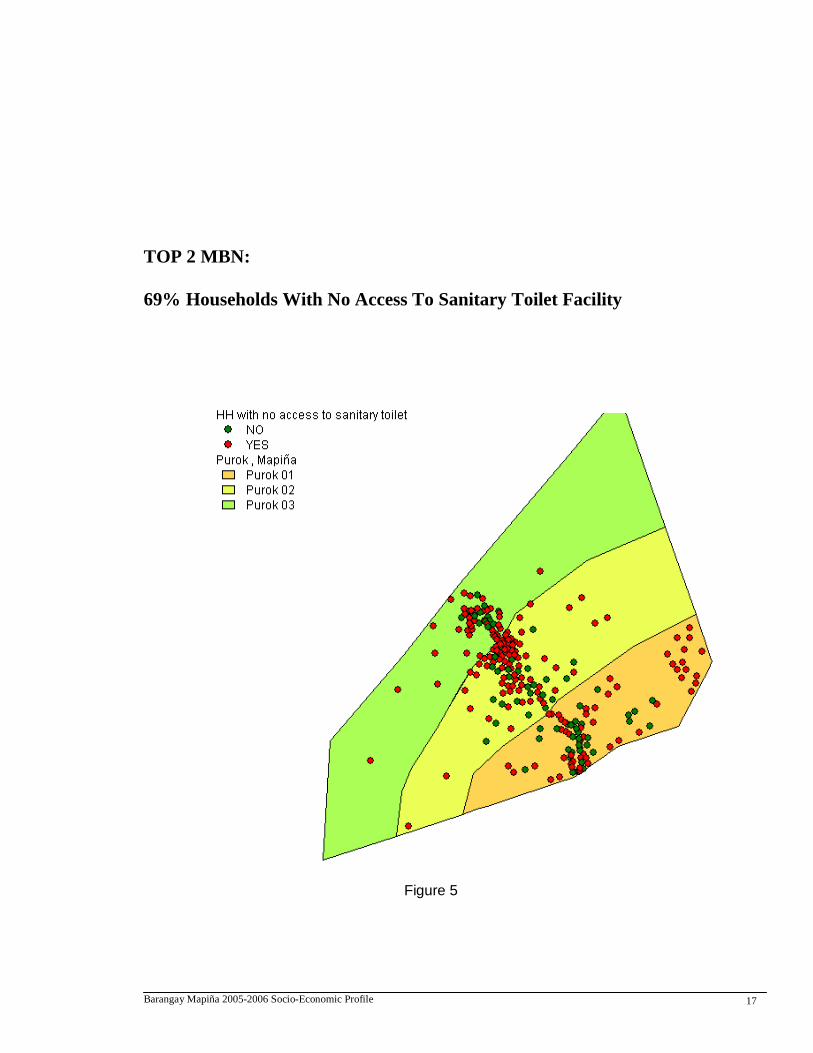
TOP 2 MBN:
69% Households With No Access To Sanitary Toilet Facility
Figure 5
Barangay Mapiña 2005-2006 Socio-Economic Profile 18
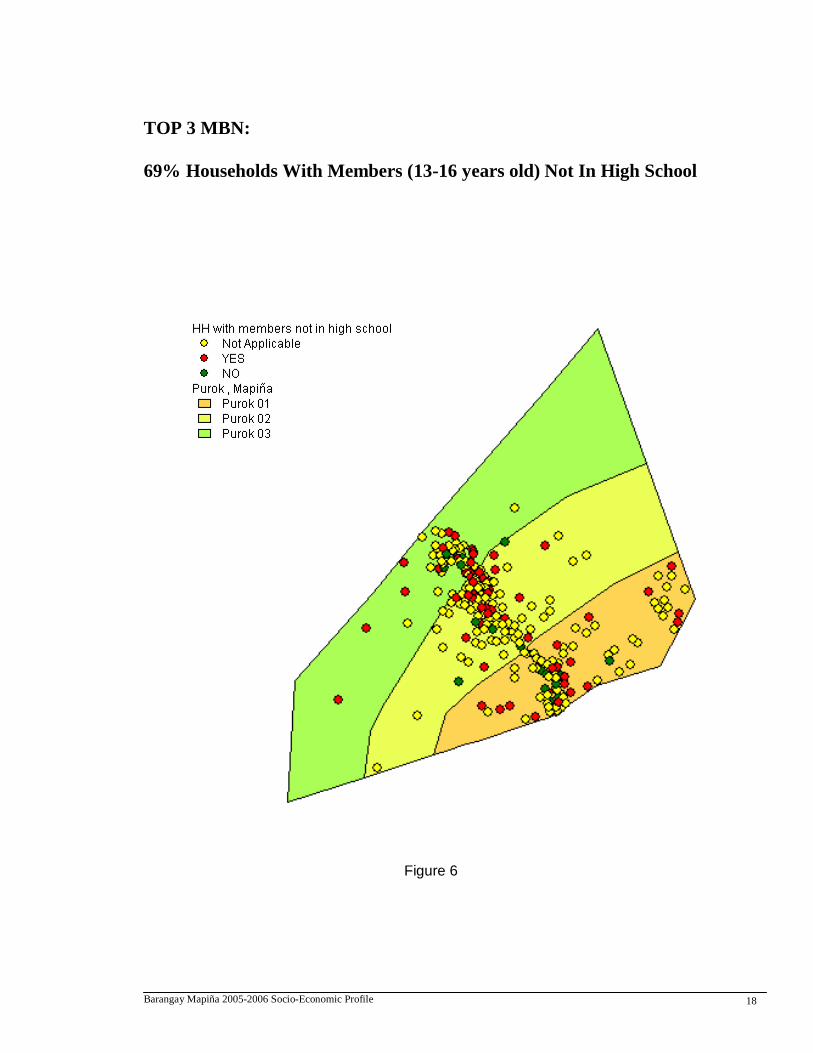
TOP 3 MBN:
69% Households With Members (13-16 years old) Not In High School
Figure 6
Barangay Mapiña 2005-2006 Socio-Economic Profile 19
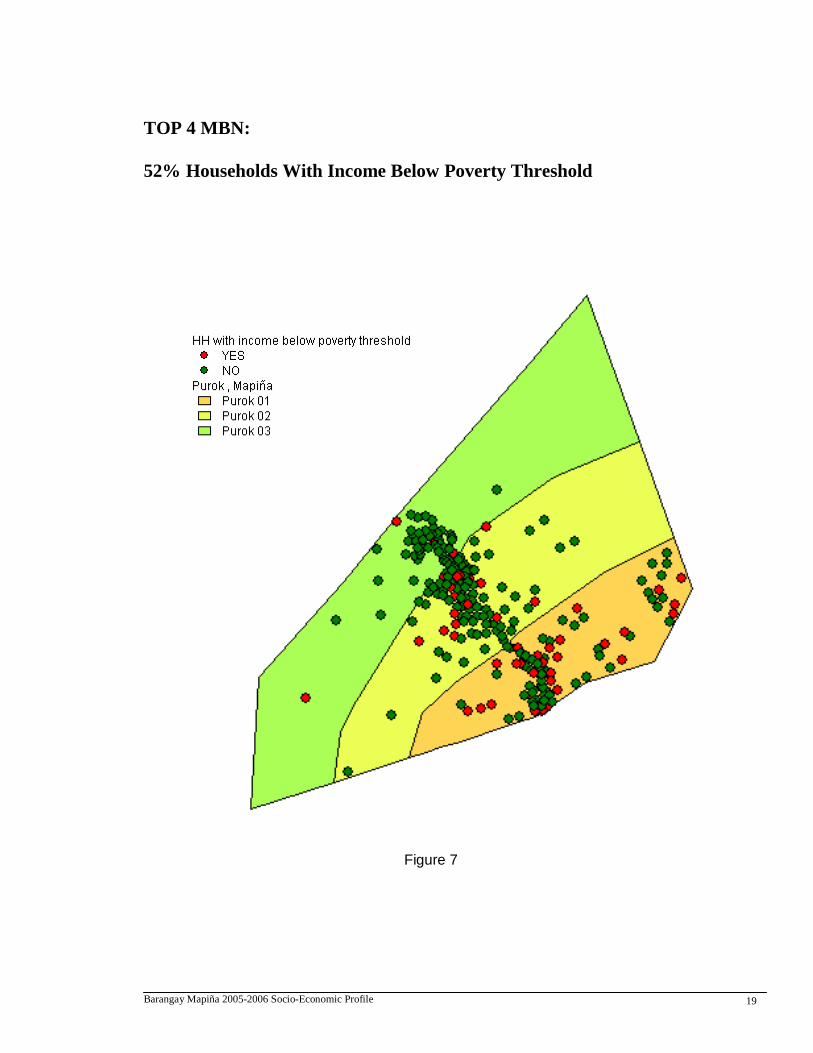
TOP 4 MBN:
52% Households With Income Below Poverty Threshold
Figure 7
Barangay Mapiña 2005-2006 Socio-Economic Profile 20
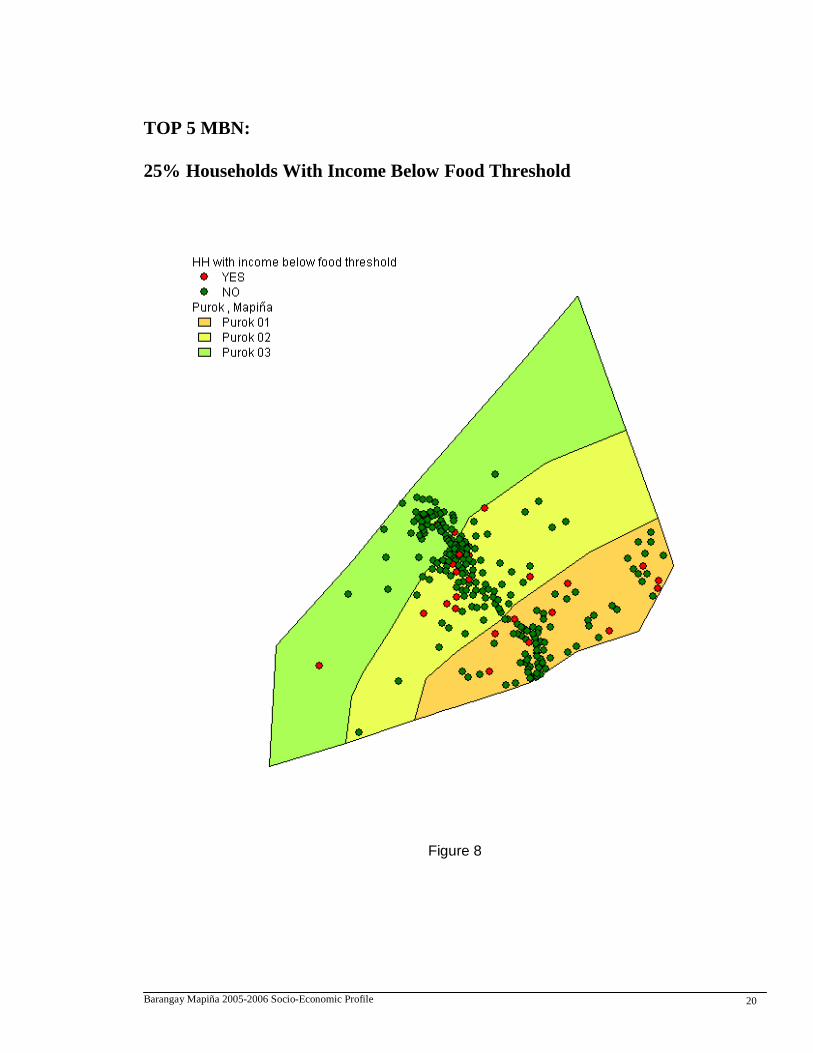
TOP 5 MBN:
25% Households With Income Below Food Threshold
Figure 8
Barangay Mapiña 2005-2006 Socio-Economic Profile 21
The programs of the city government are geared towards poverty
reduction. Developmental social programs and projects are being conceive to provide quality education, better health care, se curity, and empowering all sectors of the society.
Education
The greatest challenge of the Department of Education with the LGU is to provide quality education among children in elementary and secondary level. It may seem elusive but it can be achieved through provision of programs and projects anchored on academic excellence and education for all.
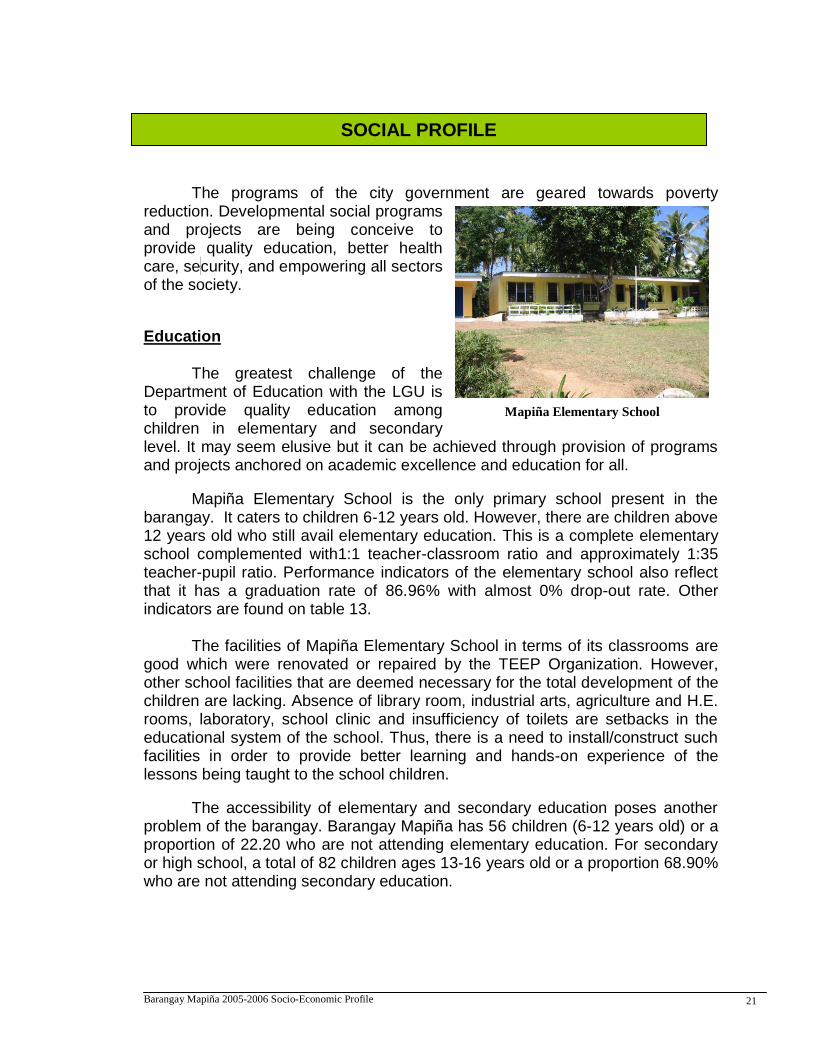
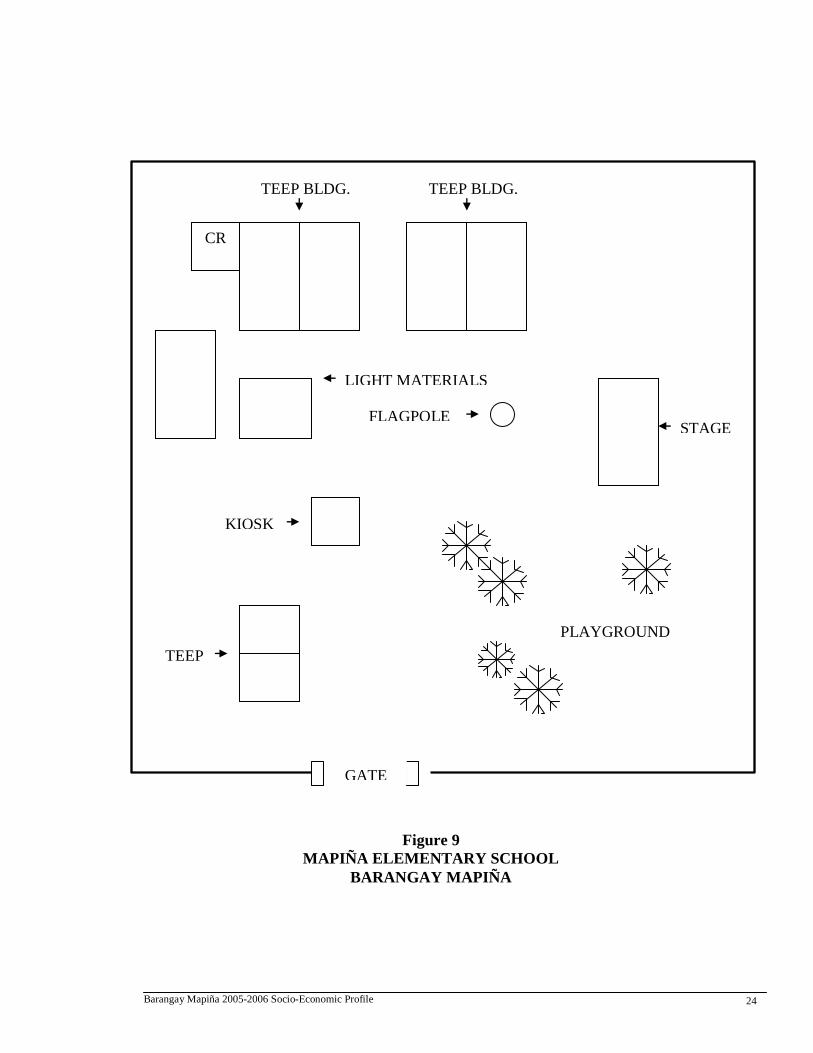
Mapiña Elementary School is the only primary school present in the barangay. It caters to children 6-12 years old. However, there are children above 12 years old who still avail elementary education. This is a complete elementary school complemented with1:1 teacher-classroom ratio and approximately 1:35 teacher-pupil ratio. Performance indicators of the elementary school also reflect that it has a graduation rate of 86.96% with almost 0% drop-out rate. Other indicators are found on table 13.
The facilities of Mapiña Elementary School in terms of its classrooms are
good which were renovated or repaired by the TEEP Organization. However, other school facilities that are deemed necessary for the total development of the children are lacking. Absence of library room, industrial arts, agriculture and H.E. rooms, laboratory, school clinic and insufficiency of toilets are setbacks in the educational system of the school. Thus, there is a need to install/construct such facilities in order to provide better learning and hands-on experience of the lessons being taught to the school children.
The accessibility of elementary and secondary education poses another problem of the barangay. Barangay Mapiña has 56 children (6-12 years old) or a proportion of 22.20 who are not attending elementary education. For secondary or high school, a total of 82 children ages 13-16 years old or a proportion 68.90% who are not attending secondary education.
SOCIAL PROFILE
Mapiña Elementary School
Barangay Mapiña 2005-2006 Socio-Economic Profile 22
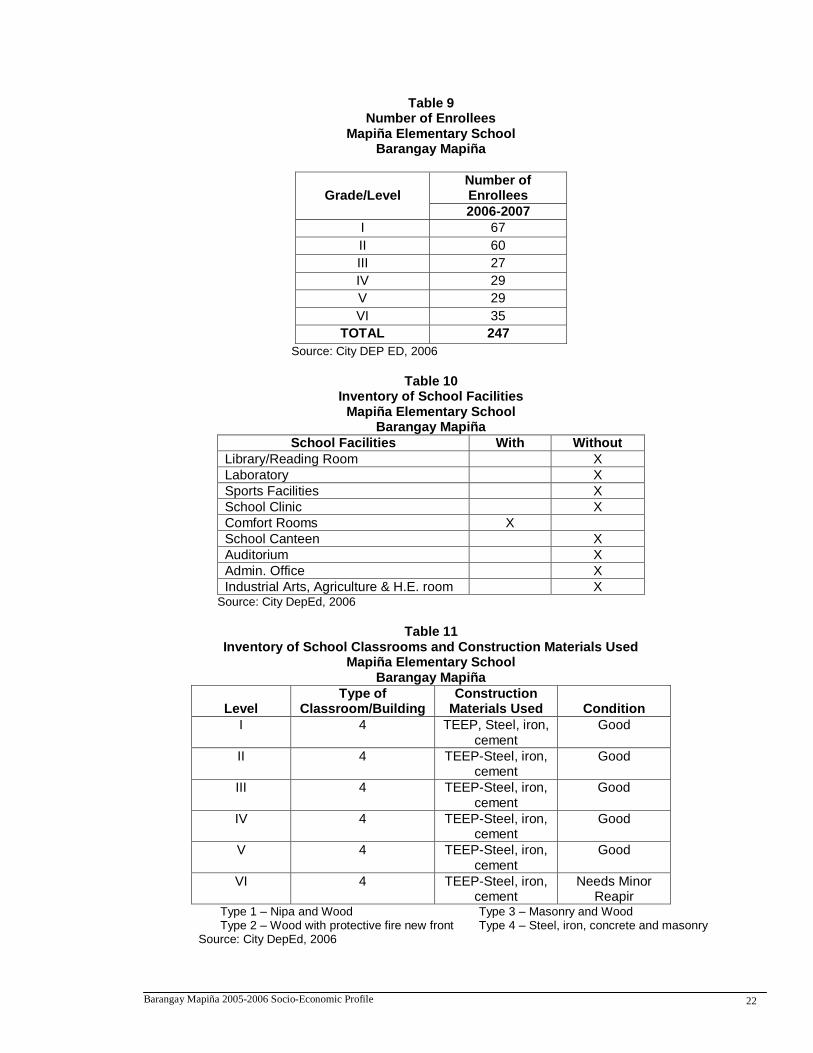
Table 9 Number of Enrollees
Mapiña Elementary School Barangay Mapiña
Grade/Level
Number of Enrollees
2006-2007
I 67
II 60
III 27
IV 29
V 29
VI 35
TOTAL 247
Source: City DEP ED, 2006
Table 10
Inventory of School Facilities Mapiña Elementary School
Barangay Mapiña
School Facilities With Without
Library/Reading Room X
Laboratory X
Sports Facilities X
School Clinic X
Comfort Rooms X
School Canteen X
Auditorium X
Admin. Office X
Industrial Arts, Agriculture & H.E. room X Source: City DepEd, 2006
Table 11
Inventory of School Classrooms and Construction Materials Used Mapiña Elementary School
Barangay Mapiña
Level
Type of Classroom/Building
Construction Materials Used
Condition
I 4 TEEP, Steel, iron, cement
Good
II 4 TEEP-Steel, iron, cement
Good
III 4 TEEP-Steel, iron, cement
Good
IV 4 TEEP-Steel, iron, cement
Good
V 4 TEEP-Steel, iron, cement
Good
VI 4 TEEP-Steel, iron, cement
Needs Minor Reapir
Type 1 – Nipa and Wood Type 3 – Masonry and Wood Type 2 – Wood with protective fire new front Type 4 – Steel, iron, concrete and masonry
Source: City DepEd, 2006
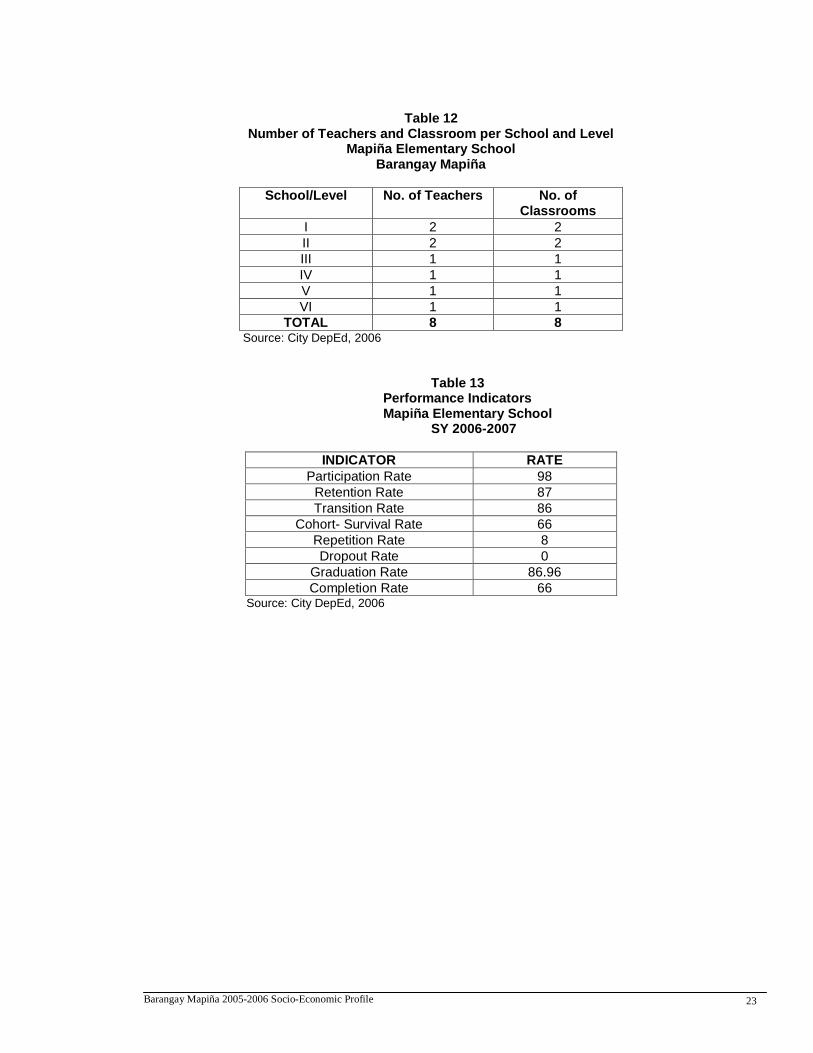
Barangay Mapiña 2005-2006 Socio-Economic Profile 23
Table 12
Number of Teachers and Classroom per School and Level Mapiña Elementary School
Barangay Mapiña
School/Level No. of Teachers No. of Classrooms
I 2 2
II 2 2
III 1 1
IV 1 1
V 1 1
VI 1 1
TOTAL 8 8 Source: City DepEd, 2006
Table 13 Performance Indicators Mapiña Elementary School
SY 2006-2007
INDICATOR RATE
Participation Rate 98
Retention Rate 87
Transition Rate 86
Cohort- Survival Rate 66
Repetition Rate 8
Dropout Rate 0
Graduation Rate 86.96
Completion Rate 66 Source: City DepEd, 2006
Barangay Mapiña 2005-2006 Socio-Economic Profile 24
Figure 9
MAPIÑA ELEMENTARY SCHOOL
BARANGAY MAPIÑA
CR
TEEP BLDG. TEEP BLDG.
FLAGPOLE
KIOSK
TEEP
BLD
G.
GATE
BLDG.
PLAYGROUND
TEEP
BLDG.
STAGE
BLDG.
LIGHT MATERIALS
Barangay Mapiña 2005-2006 Socio-Economic Profile 25
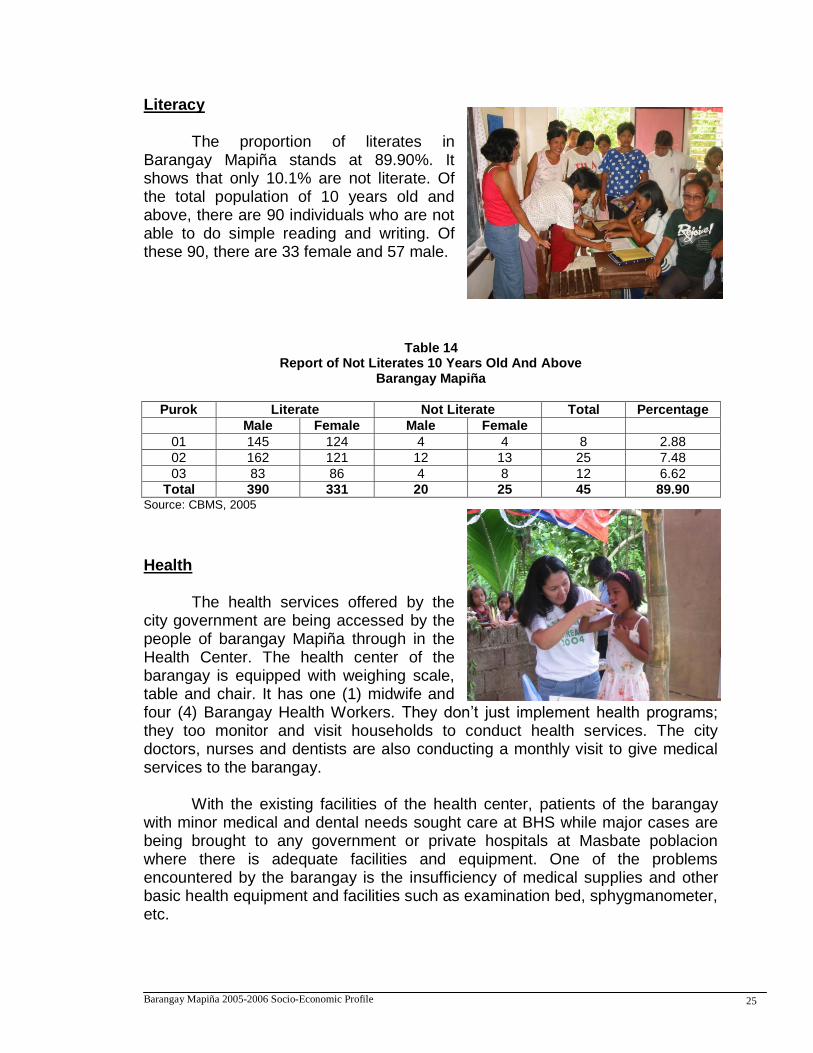
Literacy
The proportion of literates in Barangay Mapiña stands at 89.90%. It shows that only 10.1% are not literate. Of the total population of 10 years old and above, there are 90 individuals who are not able to do simple reading and writing. Of these 90, there are 33 female and 57 male.
Table 14 Report of Not Literates 10 Years Old And Above
Barangay Mapiña
Purok Literate Not Literate Total Percentage
Male Female Male Female
01 145 124 4 4 8 2.88
02 162 121 12 13 25 7.48
03 83 86 4 8 12 6.62
Total 390 331 20 25 45 89.90 Source: CBMS, 2005
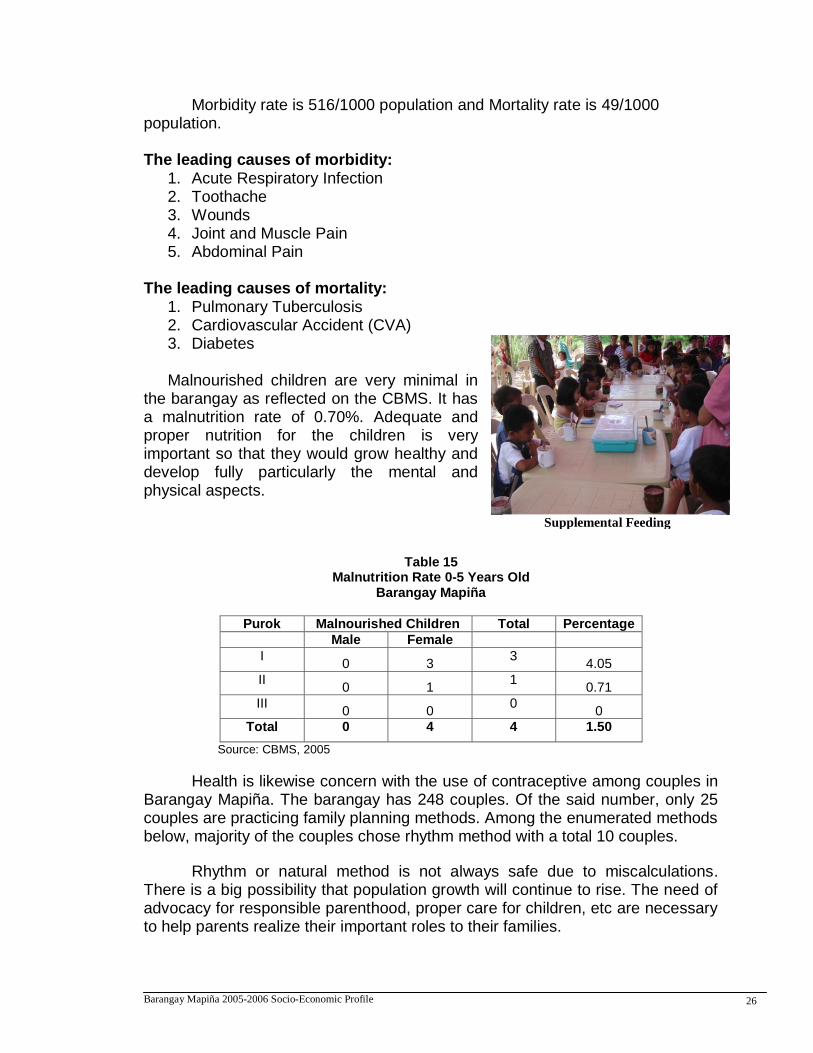
Health
The health services offered by the city government are being accessed by the people of barangay Mapiña through in the Health Center. The health center of the barangay is equipped with weighing scale, table and chair. It has one (1) midwife and four (4) Barangay Health Workers. They don’t just implement health programs; they too monitor and visit households to conduct health services. The city doctors, nurses and dentists are also conducting a monthly visit to give medical services to the barangay.
With the existing facilities of the health center, patients of the barangay
with minor medical and dental needs sought care at BHS while major cases are being brought to any government or private hospitals at Masbate poblacion where there is adequate facilities and equipment. One of the problems encountered by the barangay is the insufficiency of medical supplies and other basic health equipment and facilities such as examination bed, sphygmanometer, etc.
Barangay Mapiña 2005-2006 Socio-Economic Profile 26
Morbidity rate is 516/1000 population and Mortality rate is 49/1000 population. The leading causes of morbidity:
1. Acute Respiratory Infection 2. Toothache 3. Wounds 4. Joint and Muscle Pain 5. Abdominal Pain
The leading causes of mortality:
1. Pulmonary Tuberculosis 2. Cardiovascular Accident (CVA) 3. Diabetes
Malnourished children are very minimal in the barangay as reflected on the CBMS. It has a malnutrition rate of 0.70%. Adequate and proper nutrition for the children is very important so that they would grow healthy and develop fully particularly the mental and physical aspects.
Table 15
Malnutrition Rate 0-5 Years Old Barangay Mapiña
Purok Malnourished Children Total Percentage
Male Female
I 0 3
3 4.05
II 0 1
1 0.71
III 0 0
0 0
Total 0 4 4 1.50
Source: CBMS, 2005
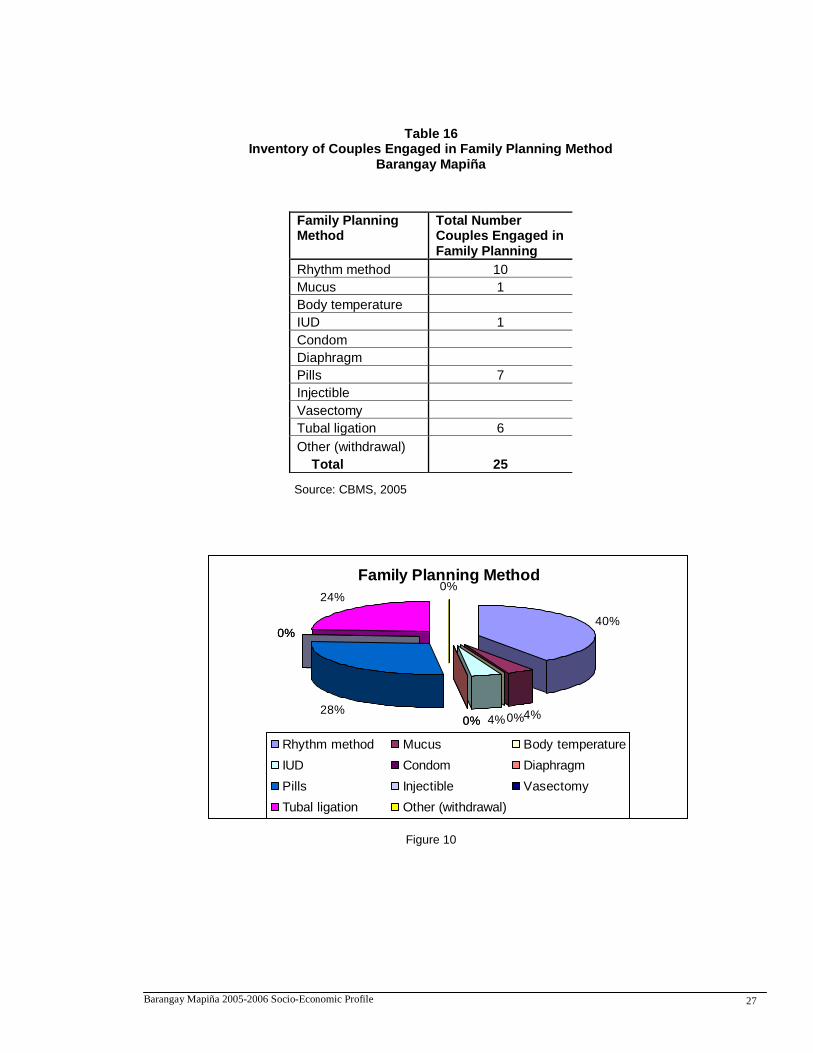
Health is likewise concern with the use of contraceptive among couples in Barangay Mapiña. The barangay has 248 couples. Of the said number, only 25 couples are practicing family planning methods. Among the enumerated methods below, majority of the couples chose rhythm method with a total 10 couples.
Rhythm or natural method is not always safe due to miscalculations. There is a big possibility that population growth will continue to rise. The need of advocacy for responsible parenthood, proper care for children, etc are necessary to help parents realize their important roles to their families.
Supplemental Feeding
Barangay Mapiña 2005-2006 Socio-Economic Profile 27
Table 16 Inventory of Couples Engaged in Family Planning Method
Barangay Mapiña
Source: CBMS, 2005
Figure 10
Family Planning Method
Total Number Couples Engaged in Family Planning
Rhythm method 10
Mucus 1
Body temperature
IUD 1
Condom
Diaphragm
Pills 7
Injectible
Vasectomy
Tubal ligation 6
Other (withdrawal)
Total 25
Family Planning Method
40%
4%0%4%0%0%28%
0%0%
24%0%
Rhythm method Mucus Body temperature
IUD Condom Diaphragm
Pills Injectible Vasectomy
Tubal ligation Other (withdrawal)
Barangay Mapiña 2005-2006 Socio-Economic Profile 28
Sanitary Toilet
Based on Community Based Monitoring System of 2006, 72.9% of the total numbers of households don’t have sanitary toilet facility.
Table 17
Inventory of Toilet Facilities Barangay Mapiña
PUROK NAME TOTAL HOUSEHOLDS
HOUSEHOLDS W/ STF
HOUSEHOLDS W/O STF
PERCENTAGE
1 85 32 53 62.35
2 109 30 79 72.48
3 54 14 40 74.07
TOTAL 248 76 172 69.40
Source: CBMS, 2005
Social Welfare
Improved quality of social services is one of the major concerns of the city. It aims to provide all the essential needs of the people particularly to those who are underprivileged. Social services are geared to reach even the remotest barangay of the city. Services such as family counseling, gender and development, pre marriage counseling, day care services, senior citizens, and self employment assistance and emergency assistance are provided.
On one hand, for the children’s welfare, one day care center is presently existent in the barangay with one (1) day care worker. It has 34 enrollees. There are three community organizations present in the barangay. These are Women’s Organization, Senior Citizen and Youth Organization (MCYC). These organizations remained strong and continue to help in empowering women and youth alike and support to elders.
Persons with disabilities are also a main concern of the social welfare. The barangay has a total of 25 physically challenged individuals.
Barangay Mapiña 2005-2006 Socio-Economic Profile 29
Table 18 Number of Persons with Disabilities
Barangay Mapiña
Purok Number of persons with Disabilities
Type of Disability
I 15 -blind ( 1 eye) -paralytzed (hand and feet) -deaf and mute -mental impairment
II 8 -blind (one/both eyes) -hydrocephalus -paralyzed -polio -lumpo
III 2 - blind (one/both eyes)
Total 25
Source: CBMS, 2005
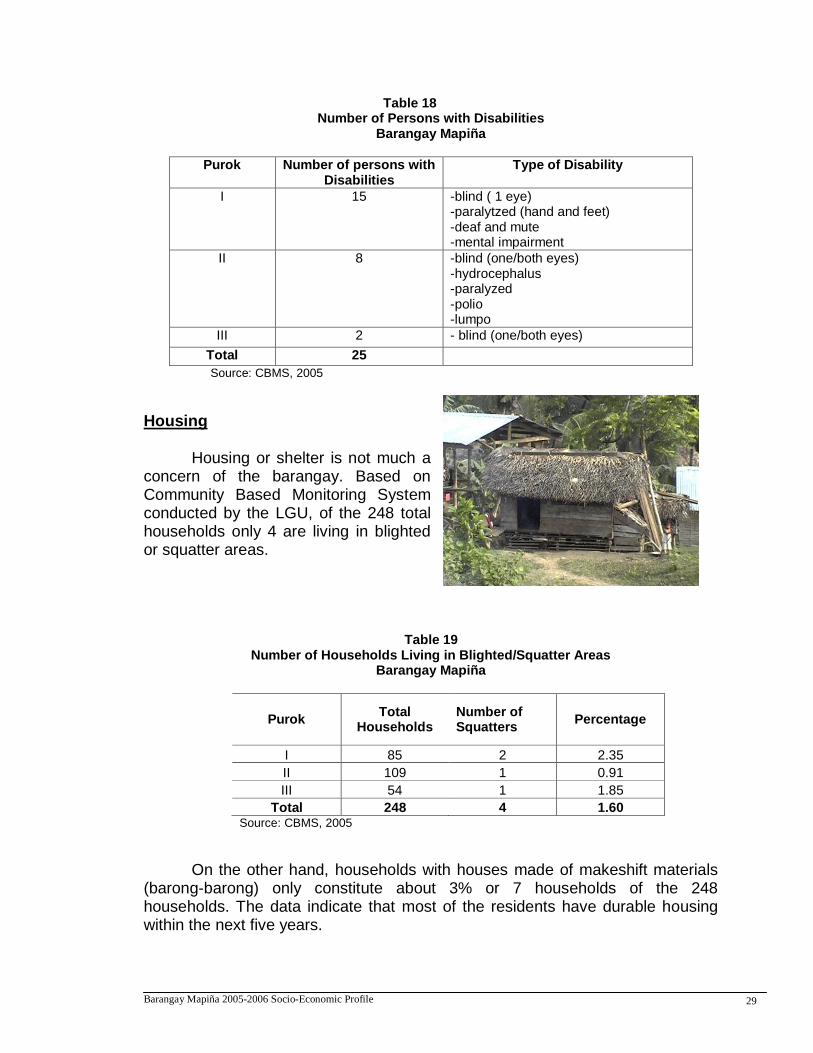
Housing
Housing or shelter is not much a concern of the barangay. Based on Community Based Monitoring System conducted by the LGU, of the 248 total households only 4 are living in blighted or squatter areas.
Table 19 Number of Households Living in Blighted/Squatter Areas
Barangay Mapiña
Purok Total
Households Number of Squatters
Percentage
I 85 2 2.35
II 109 1 0.91
III 54 1 1.85
Total 248 4 1.60 Source: CBMS, 2005
On the other hand, households with houses made of makeshift materials (barong-barong) only constitute about 3% or 7 households of the 248 households. The data indicate that most of the residents have durable housing within the next five years.
Barangay Mapiña 2005-2006 Socio-Economic Profile 30
Table 20 Number of Households with Makeshift Housing
Barangay Mapiña
Purok Total
Households
Households With
Makeshift Materials
Percentage
1 85 6 7.06
2 109 1 0.92
3 54 0 0
Total 248 7 2.80 Source: CBMS, 2005
Protective Services
A total of 12 Barangay Police (“tanods”) were assigned to different puroks of Barangay Mapiña. These police personnel are equipped with paraphernalia like arnis and uniform to effectively implement peace and order. Also, five (5) members of Barangay Unified Force (BUF) are assigned to assist them in monitoring the barangay especially during night time in order to assure the residents of a safe and peaceful community.
The barangay has an organized barangay justice system headed by
Lupon assigned. Through this justice system, petty crimes can be resolved on barangay level. This is reflected on the 0.20% crime rate in Barangay Mapiña in 2005 which is very low.
Table 21
Victims of Crime Per Purok Barangay Mapiña
Purok Victims of Crime Total Percentage
Male Female
01 0 0 0 0
02 0 1 1 0.18
03 1 0 1 0.39
Total 1 1 2 0.20 Source: CBMS, 2005
Table 22 Inventory of Barangay Police Personnel
Barangay Mapiña
Purok No. of Barangay Police Assigned
I 2
II 8
III 7
Total 17 Source: Office of the Barangay Captain,2006
Barangay Mapiña 2005-2006 Socio-Economic Profile 31
Table 23
Inventory of Police Personnel Paraphernalia Barangay Mapiña
Paraphernalia Number
Night Stick None
Flashlight None
Handcuffs None
Arnis 15 units
Whistle None
Uniform 15 sets
Multicab 1
Horse 2 Source: Office of the Barangay Captain,2006
Sports and Recreation
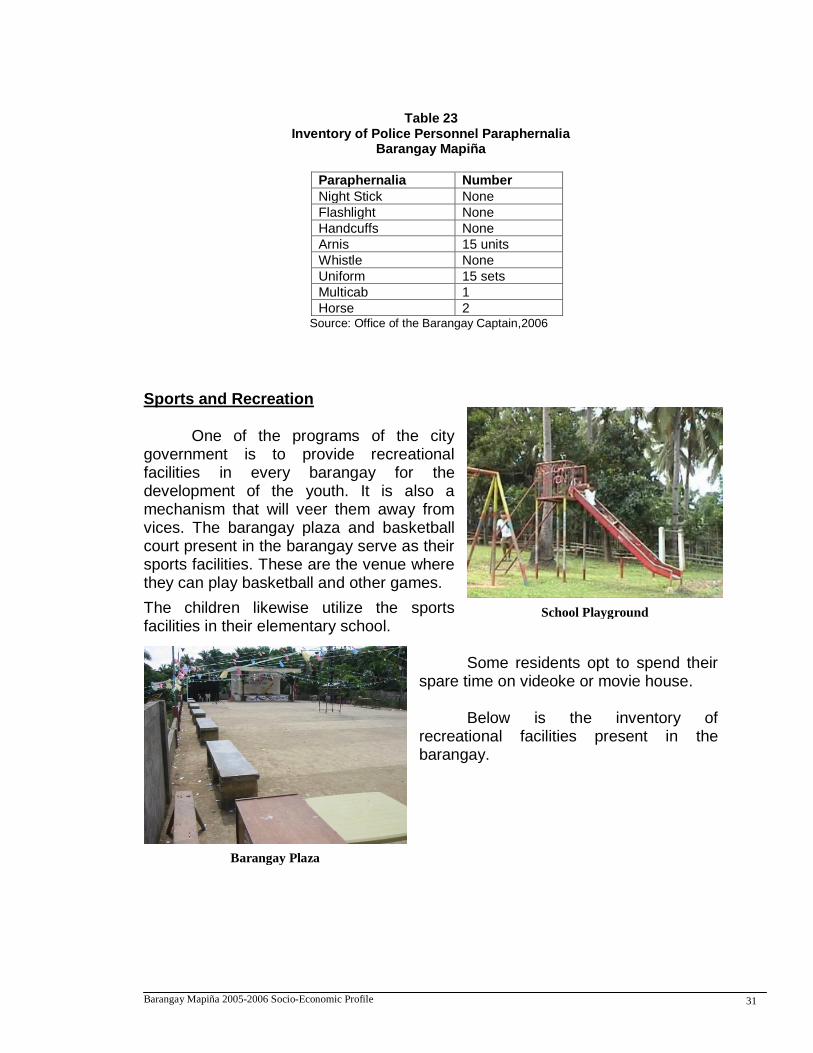
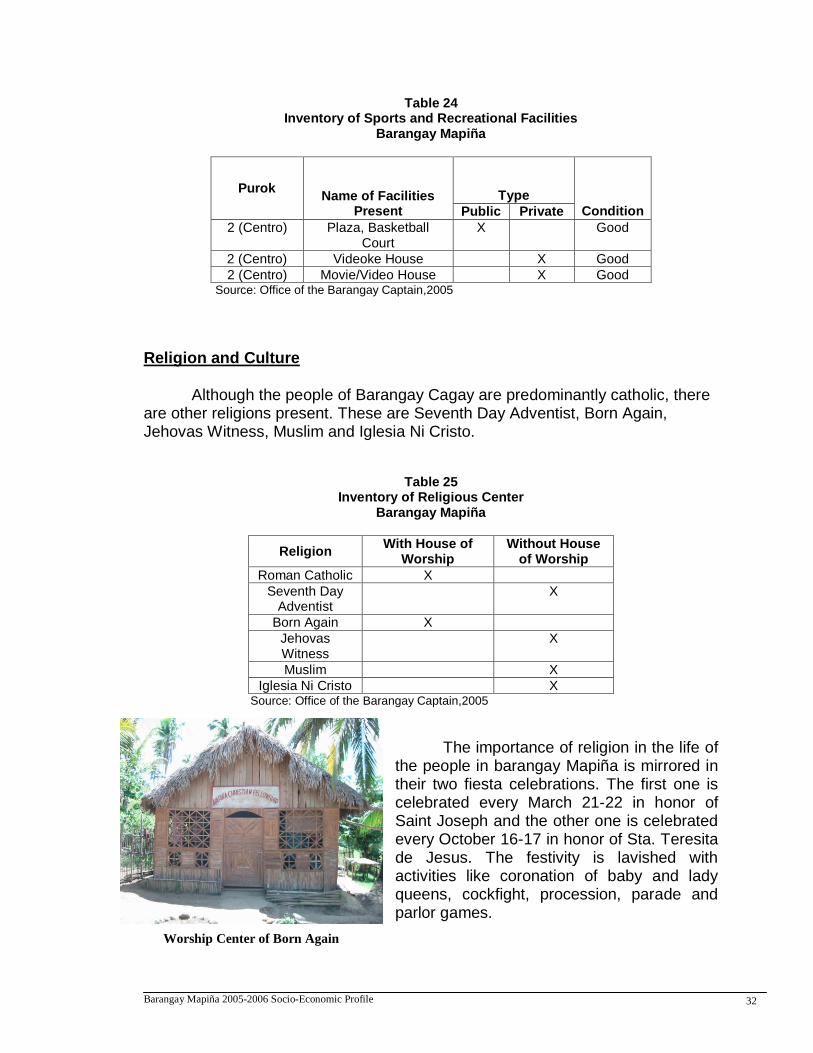
One of the programs of the city government is to provide recreational facilities in every barangay for the development of the youth. It is also a mechanism that will veer them away from vices. The barangay plaza and basketball court present in the barangay serve as their sports facilities. These are the venue where they can play basketball and other games.
The children likewise utilize the sports facilities in their elementary school.
Some residents opt to spend their
spare time on videoke or movie house. Below is the inventory of
recreational facilities present in the barangay.
School Playground
Barangay Plaza
Barangay Mapiña 2005-2006 Socio-Economic Profile 32
Table 24 Inventory of Sports and Recreational Facilities
Barangay Mapiña
Purok
Name of Facilities Present
Type
Condition Public Private
2 (Centro) Plaza, Basketball Court
X Good
2 (Centro) Videoke House X Good
2 (Centro) Movie/Video House X Good Source: Office of the Barangay Captain,2005
Religion and Culture
Although the people of Barangay Cagay are predominantly catholic, there are other religions present. These are Seventh Day Adventist, Born Again, Jehovas Witness, Muslim and Iglesia Ni Cristo.
Table 25
Inventory of Religious Center Barangay Mapiña
Religion With House of
Worship Without House
of Worship
Roman Catholic X
Seventh Day Adventist
X
Born Again X
Jehovas Witness
X
Muslim X
Iglesia Ni Cristo X Source: Office of the Barangay Captain,2005
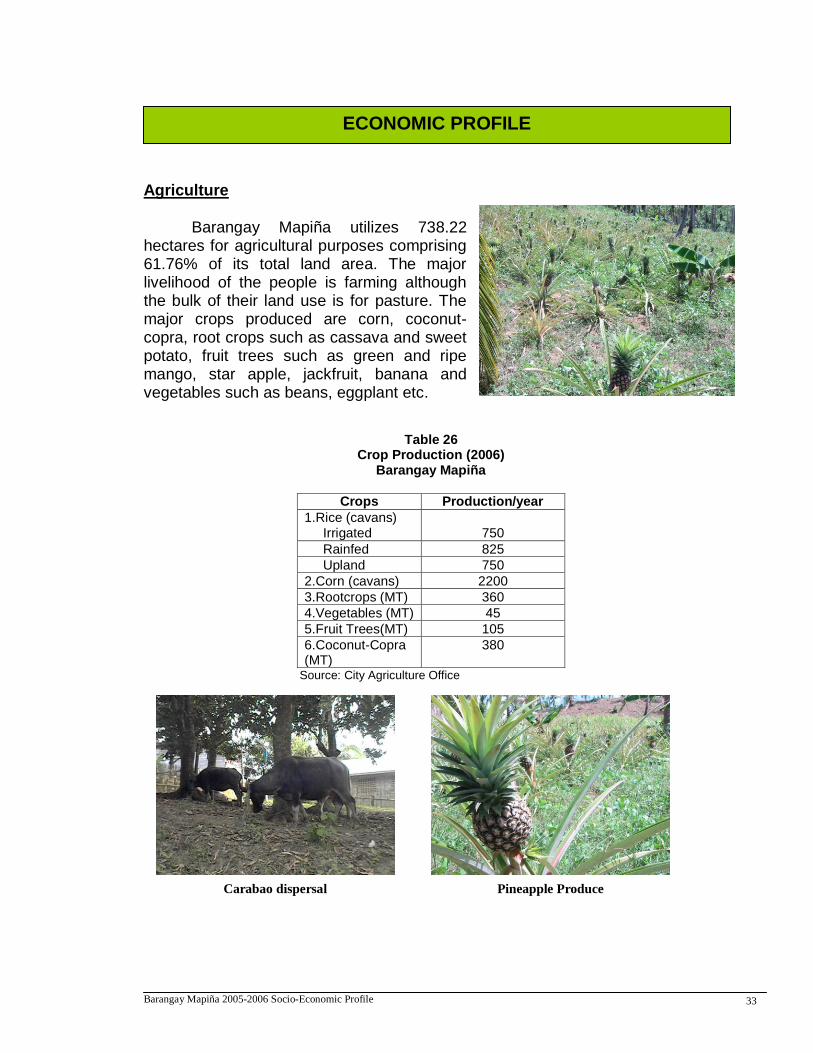
The importance of religion in the life of the people in barangay Mapiña is mirrored in their two fiesta celebrations. The first one is celebrated every March 21-22 in honor of Saint Joseph and the other one is celebrated every October 16-17 in honor of Sta. Teresita de Jesus. The festivity is lavished with activities like coronation of baby and lady queens, cockfight, procession, parade and parlor games.
Worship Center of Born Again
Barangay Mapiña 2005-2006 Socio-Economic Profile 33
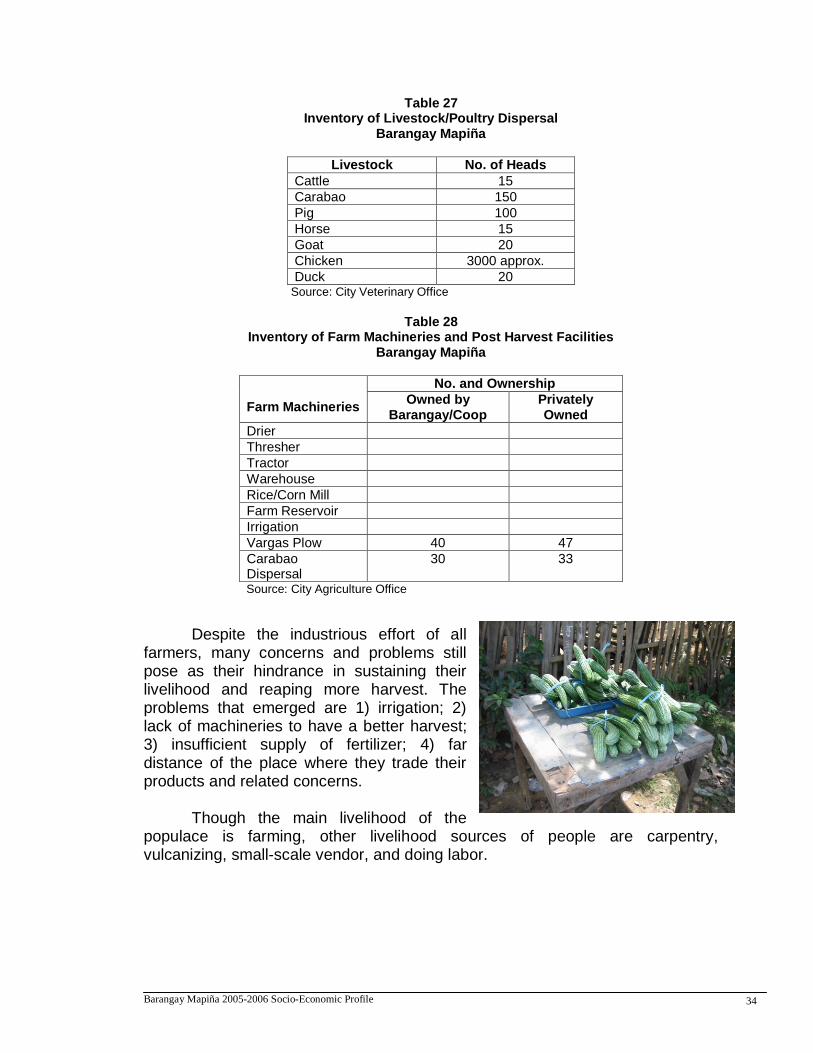
Agriculture
Barangay Mapiña utilizes 738.22 hectares for agricultural purposes comprising 61.76% of its total land area. The major livelihood of the people is farming although the bulk of their land use is for pasture. The major crops produced are corn, coconut-copra, root crops such as cassava and sweet potato, fruit trees such as green and ripe mango, star apple, jackfruit, banana and vegetables such as beans, eggplant etc.
Table 26 Crop Production (2006)
Barangay Mapiña
Crops Production/year
1.Rice (cavans) Irrigated
750
Rainfed 825
Upland 750
2.Corn (cavans) 2200
3.Rootcrops (MT) 360
4.Vegetables (MT) 45
5.Fruit Trees(MT) 105
6.Coconut-Copra (MT)
380
Source: City Agriculture Office
ECONOMIC PROFILE
Carabao dispersal Pineapple Produce
Barangay Mapiña 2005-2006 Socio-Economic Profile 34
Table 27 Inventory of Livestock/Poultry Dispersal
Barangay Mapiña
Livestock No. of Heads
Cattle 15
Carabao 150
Pig 100
Horse 15
Goat 20
Chicken 3000 approx.
Duck 20 Source: City Veterinary Office
Table 28 Inventory of Farm Machineries and Post Harvest Facilities
Barangay Mapiña
Farm Machineries
No. and Ownership
Owned by Barangay/Coop
Privately Owned
Drier
Thresher
Tractor
Warehouse
Rice/Corn Mill
Farm Reservoir
Irrigation
Vargas Plow 40 47
Carabao Dispersal
30 33
Source: City Agriculture Office
Despite the industrious effort of all farmers, many concerns and problems still pose as their hindrance in sustaining their livelihood and reaping more harvest. The problems that emerged are 1) irrigation; 2) lack of machineries to have a better harvest; 3) insufficient supply of fertilizer; 4) far distance of the place where they trade their products and related concerns. Though the main livelihood of the populace is farming, other livelihood sources of people are carpentry, vulcanizing, small-scale vendor, and doing labor.
Barangay Mapiña 2005-2006 Socio-Economic Profile 35
Trade and Commerce
Tradable products of this barangay are agricultural farm produced. These products are mainly traded to flea market in Masbate City every Friday- Sunday. Some are just sold within the barangay. There are no other major business establishments however sari-sari stores abound within the barangay.
Employment Due to its geographical location, the populace is dependent on agriculture
and marine resources as farmers and fishermen. However, others are employed as salesladies, construction workers, household helpers, traders etc. Professionals constitute a very low percentage of the population. The table below shows the unemployment statistics of the barangay which constitutes for only 15 years old and above populace.
Farming is still a predominant livelihood of the residents. However, due to
inadequate employment opportunities at the barangay, some local populace look for jobs in urban areas after being equipped with basic education at school. There are employed as salesladies, traders. Some are employed as construction workers, household helpers, laborers, etc.
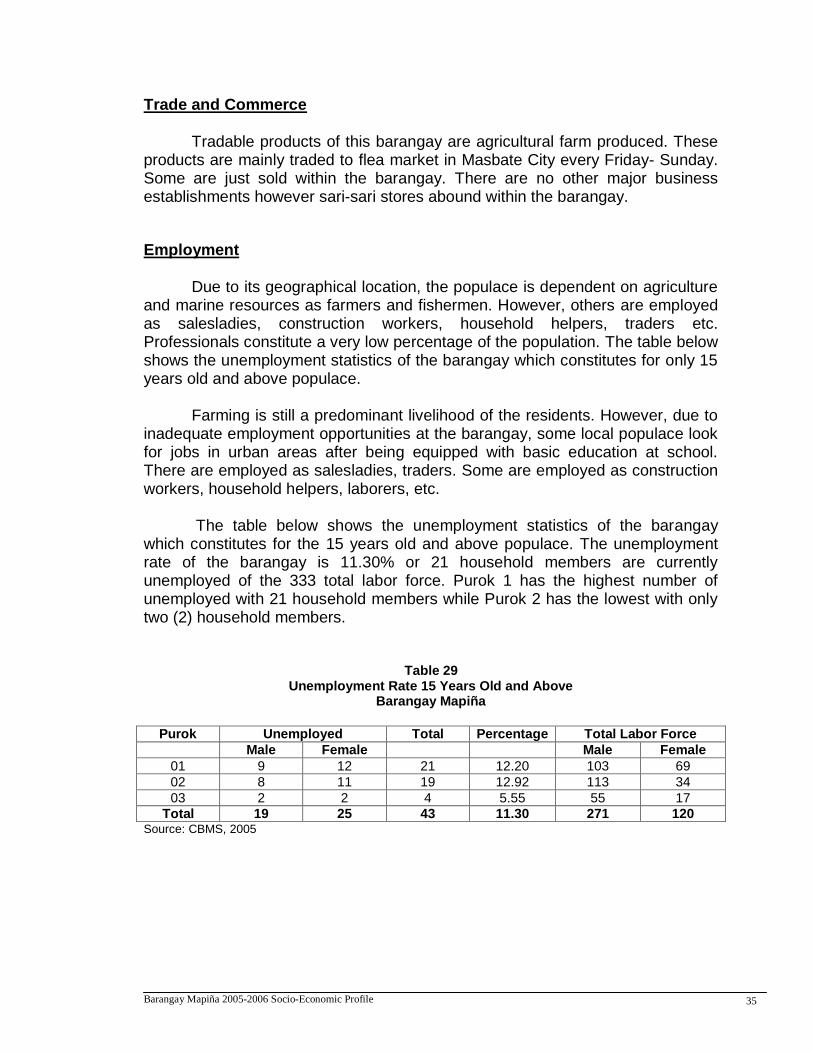
The table below shows the unemployment statistics of the barangay
which constitutes for the 15 years old and above populace. The unemployment rate of the barangay is 11.30% or 21 household members are currently unemployed of the 333 total labor force. Purok 1 has the highest number of unemployed with 21 household members while Purok 2 has the lowest with only two (2) household members.
Table 29 Unemployment Rate 15 Years Old and Above
Barangay Mapiña
Purok Unemployed Total Percentage Total Labor Force
Male Female Male Female
01 9 12 21 12.20 103 69
02 8 11 19 12.92 113 34
03 2 2 4 5.55 55 17
Total 19 25 43 11.30 271 120 Source: CBMS, 2005
Barangay Mapiña 2005-2006 Socio-Economic Profile 36
Vision
Through the years ahead of our service in the community, the constituents of Barangay Mapiña will be more peaceful, united and progressive in the field of agriculture and entrepreneurship.
Mission
As public servants, we are committed to serve to the highest standard of public service in order to improve the living condition of our constituents,
investors through maintenance of peace, unity and prosperity within the community.
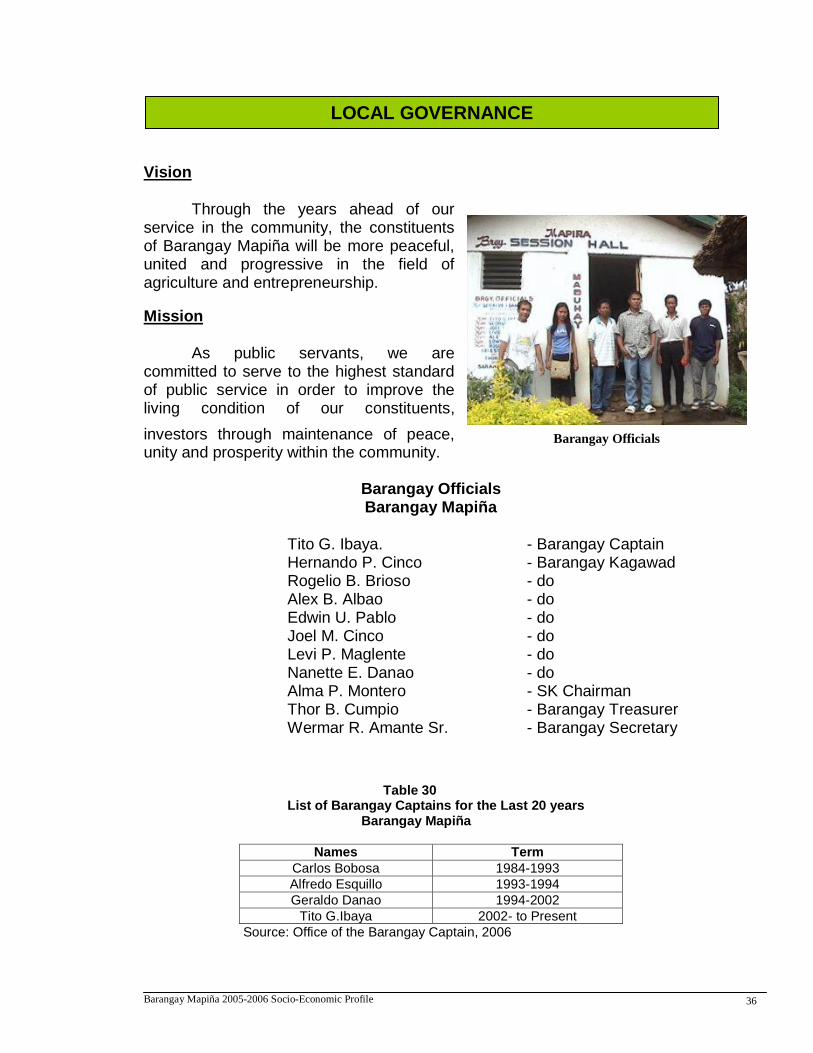
Barangay Officials Barangay Mapiña
Tito G. Ibaya. - Barangay Captain Hernando P. Cinco - Barangay Kagawad Rogelio B. Brioso - do Alex B. Albao - do Edwin U. Pablo - do Joel M. Cinco - do Levi P. Maglente - do
Nanette E. Danao - do Alma P. Montero - SK Chairman Thor B. Cumpio - Barangay Treasurer Wermar R. Amante Sr. - Barangay Secretary
Table 30
List of Barangay Captains for the Last 20 years Barangay Mapiña
Names Term
Carlos Bobosa 1984-1993
Alfredo Esquillo 1993-1994
Geraldo Danao 1994-2002
Tito G.Ibaya 2002- to Present
Source: Office of the Barangay Captain, 2006
LOCAL GOVERNANCE
Barangay Officials
Barangay Mapiña 2005-2006 Socio-Economic Profile 37
The total revenue of Barangay Mapiña posted an increase in 2006 as compared to the previous year. It can be attributed to the increase of their Internal Revenue Allocation (IRA). Nevertheless in the last three years, there is an increase of the said IRA of the barangay. For expenditure, personnel services cover the highest for the last three years. It can be observed that the expenditures for 2006 is higher than its income.
Table 31 Total Revenue for the Last Three Years
Barangay Mapiña
Item 2004 2005 2006
IRA 491,686.00 528,708.00 638,259.00
Real Property Tax 8,344.62 0.00 8,919.10
Operation and Service Income
0.00 0.00 0.00
Business Taxes and Licenses
00.0 8,479.85 0.00
Miscellaneous Income 908.26 496.98 892.40
Aids and Grants and Subsidies
10,000.00 100.000.00 100,000.00
Total 510,938.88 637,684.83 750,076.5 Source: City Budget Office, 2006
Table 32 Total Expenditure for the Last Three Years
Barangay Mapiña
Item 2004 2005 2006
Personal Services 249,136.00 229,136.00 289,120.00
Maintenance and Other Operational Expenses
202,158.43 227,231.07 273,186.52
Capital Outlay 76,559.00 212,002.50 153,357.52
Total 527,853.43 668,369.57 717,670.04 Source: City Budget Office, 2006
Table 33 20% Annual Development Plan
Barangay Mapiña (2004)
Name of Project Location Amount Status
Concrete fencing 76,599.00
Source: City Budget Office
FINANCIAL REPORT
Barangay Mapiña 2005-2006 Socio-Economic Profile 38
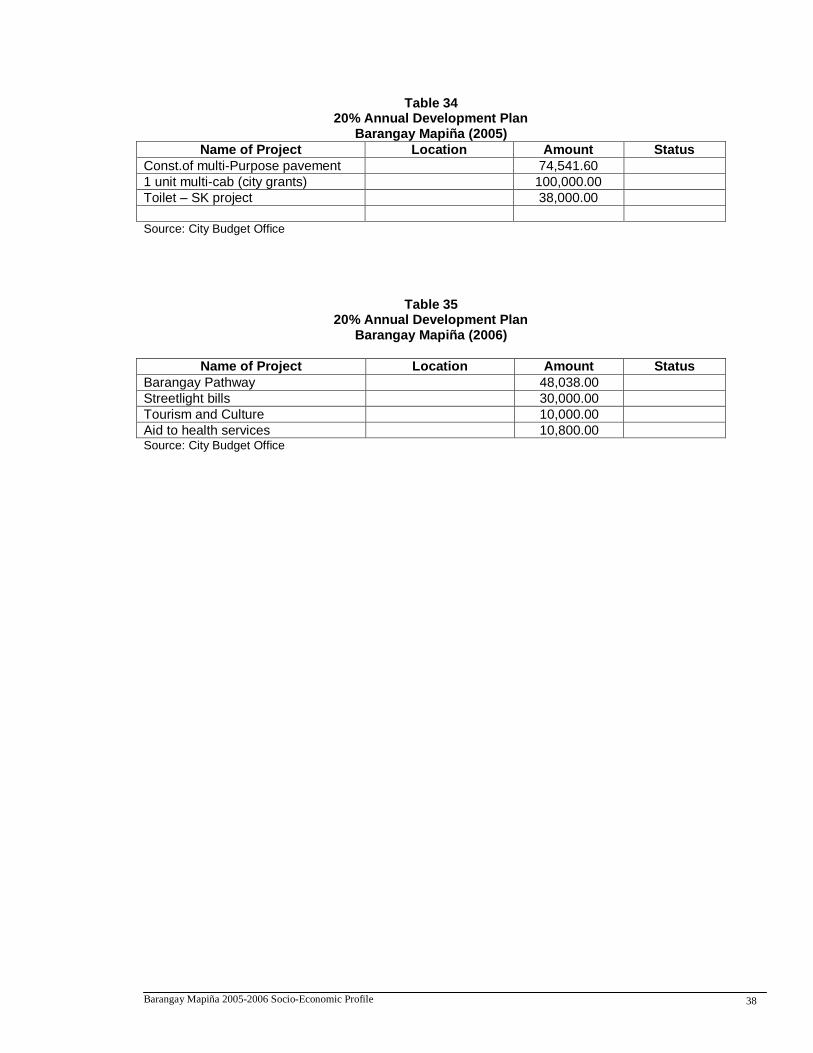
Table 34 20% Annual Development Plan
Barangay Mapiña (2005)
Name of Project Location Amount Status
Const.of multi-Purpose pavement 74,541.60
1 unit multi-cab (city grants) 100,000.00
Toilet – SK project 38,000.00
Source: City Budget Office
Table 35
20% Annual Development Plan Barangay Mapiña (2006)
Name of Project Location Amount Status
Barangay Pathway 48,038.00
Streetlight bills 30,000.00
Tourism and Culture 10,000.00
Aid to health services 10,800.00 Source: City Budget Office