Embed Size (px)
Citation preview
Munich Personal RePEc Archive
Bankruptcy and product-market
competition: evidence from the airline
industry
Ciliberto, Federico and Schenone, Carola
University of Virginia, University of Virginia McIntire School of
Commerce
10 April 2012
Online at https://mpra.ub.uni-muenchen.de/38624/
MPRA Paper No. 38624, posted 07 May 2012 12:55 UTC
Bankruptcy and Product-Market Competition:
Evidence from the Airline Industry�
Federico Cilibertoy
University of VirginiaCarola Schenonez
University of Virginia
February 2012
Abstract
We investigate the e¤ects of Chapter 11 bankruptcy �lings on product marketcompetition using data from the US airline industry. We �nd: i) bankrupt air-lines permanently downsize their national route structure, their airport-speci�cnetworks, and their route-speci�c �ight frequency and capacity; ii) bankrupt air-lines lower their route-speci�c prices while under bankruptcy protection, and in-crease them after emerging. We do not �nd robust evidence of signi�cant changesby the bankrupt airline�s competitors along any of the dimensions above.Keywords: Airline Industry, Bankruptcy, Product Market Competition, Chap-
ter 11.JEL Codes: G33, L13, L93, K2.
�We thank Ken Ayotte, Murillo Campello, Sofronis Clerides, Leora Friedberg, Rick Green, Bar-ton Hamilton, Nick Kumino¤, Michael Levine, Vikas Mehrotra, Amalia Miller, Harikesh Nair, OliverRichard, David Robinson, Nicholas Rupp, Patrik Sandas, David C. Smith, Andrew Sweeting, andWilliam Wilhelm for comments and suggestions. We also thank seminar participants at the Work-shop on Airline Competition organized by the Antitrust Division of the U.S. Department of Justiceon October 23, 2008, in Washington, DC; the North America Econometric Society Meetings in Pitts-burgh; the American Finance Association Meetings in Chicago; the Olin Business School at St. Louis,Virginia Tech, University of Illinois at Urbana-Champaign; the Empirical Research in Corporate Fi-nance Conference at the University of Oregon, Eugene; the International Industrial OrganizationConferences in Boston and Washington; the Southern Economic Association Conference in Wash-ington. Lynn LoPucki generously shared his Bankruptcy Research Database. A previous versionof this paper was circulated under the title �Financial Decisions, Bankruptcy, and Product-MarketCompetition in the Airline Industry�. All remaining errors are our own.
yDepartment of Economics, University of Virginia, [email protected], ph: (434) 924-6755.zMcIntire School of Commerce, University of Virginia, [email protected], ph: (434) 924-
4184.
1
1 Introduction
In the past few years thousands of �rms have �led for bankruptcy protection under
Chapter 11 of the United States Bankruptcy Law.1 Firms �ling for bankruptcy
protection belong to a wide range of industries, from Lehman Brothers to Chrysler
and GM.2 The unprecedented number of �lings has led to a renewed interest in the
economics of bankruptcy. Most of the previous work has examined the direct costs
of bankruptcy proceedings, such as legal and administrative expenses, as well as their
indirect costs, such as lost sales (Franks and Torous (1989), Thorburn (2000), Bris,
Welch, and Zhu (2006), Hennesy and Whited (2007), Bebchuk (2002)).3 There is
also work on the e¤ects of bankruptcy on �rm survival (Hotchkiss (1995)), on equity
returns (Jorion and Zhang (2008)), and on innovation (Acharya and Subramanian
(2009)). Nonetheless, there is surprisingly little work on the e¤ects of bankruptcy
�lings on product market competition.
This paper uses data from the US airline industry to investigate the e¤ect of
Chapter 11 �lings on prices, capacity choices, and networks. These data are from
one single industry for which we have data from a cross-section of local markets.
This allows an examination of how bankruptcy �lings a¤ect the strategic decisions
of �rms, holding industry �xed. In this sense, our approach is in the same spirit
as Chevalier (1995), who uncovers basic stylized patterns in the relationship between
leverage buyouts and the pricing behavior of �rms and their rivals using cross-section
data from the US supermarket industry.
The airline industry provides an interesting empirical framework for several ad-
ditional reasons. First, air transport is arguably the most important means of
transportation in the US Second, the airlines seeking bankruptcy protection form a
heterogeneous group, including low cost carriers such as ATA, and national carriers
such as United and USAir. The range of variation in the identities of the bankrupt
1There has also been an outstanding number of personal bankruptcy �lings. See White [2007] formore on this.
2Lehman Brothers �led in July 2008. Chrysler and GM �led in April and June 2009; respectively.3See also the early work by White [1982]. Recently, there has been extended research comparing
auctions against a reorganization-based bankruptcy system such as Chapter 11. See Hotchkiss andMooradian (2003) and Eckbo and Thorburn (2009).
airlines ensures that our empirical analysis provides insights on other industries as
well. Third, because it is one industry where carriers interact over many distinct
markets and over time, we can identify the e¤ects of bankruptcy on product market
competition, independent of potentially confounding market, �rm, and time e¤ects.
Finally, because there are bankrupt and non-bankrupt carriers serving the same mar-
ket, we can investigate di¤erent carriers� price reactions to one carrier�s bankruptcy.
We start our analysis by looking at how bankruptcy �lings a¤ect the network of
the bankrupt carrier and of its rivals. We �nd that at the US national level, the
bankrupt carrier permanently drops approximately 25 percent of its pre-bankruptcy
routes. We also look at airport speci�c networks. Not surprisingly, we �nd similar
results. The bankrupt carrier reduces its average number of markets out of an airport
by 26 percent while under bankruptcy protection, and by 24 after its emergence from
Chapter 11 relative to its pre-bankruptcy numbers. Its rivals increase the average
number of markets they serve at the US national level, but this result is not very
robust across speci�cations and we do not con�rm it when we look at changes in the
number of markets out of airports. Next, we investigate how bankruptcy �lings a¤ect
the �ight frequency and capacity decisions. We �nd that the bankrupt �rm lowers by
21 percent the average frequency of �ights within a route while operating under court
protection, and by 32:8 percent once the carrier emerges from bankruptcy. We also
�nd that bankruptcy �lings have an equally signi�cant e¤ect on the bankrupt�s aver-
age capacity (measured by seats in a route) both during and following a bankruptcy
�ling. We do not �nd robust evidence of any signi�cant changes by the bankrupt
airline�s competitors along any of the dimensions above. We conclude our analysis
with a study of the e¤ects of bankruptcy �lings on airline market mean prices. We
�nd that the insolvent carrier�s price drops by 3:1 percent while under bankruptcy
protection, and increase by almost 5 percent after emerging, both of these numbers
relative to pre-bankruptcy prices. Again, we do not �nd evidence of any signi�cant
changes by the bankrupt airline�s competitors along any of the dimensions above.
This article contributes to the sparse empirical literature on product-market com-
petition and bankruptcy. Borenstein and Rose (1995, 2003) also study the relation-
1
ship between bankruptcy �lings and product-market competition.4 In looking at
the e¤ect on prices and on frequency, they �nd that in the quarter during which a
carrier �les for Chapter 11 protection, the number of �ights at the airports where the
bankrupt carrier operates declines by about 20 percent relative to the pre-bankruptcy
level. Borenstein and Rose (1995) do not �nd any systematic evidence that either
bankrupt �rms or their competitors changed prices after a bankrupt �rm�s Chapter
11 �ling. Mainly, our analysis di¤ers from theirs along four dimensions. First, we
look at multiple strategic decisions (airport and national network structure, capacity
choices, prices). Thus, we can provide a uni�ed framework to understand the e¤ect of
bankruptcy �lings. Instead, Borenstein and Rose (1995, 2003) limited their analysis
just to changes in prices and in number of markets out of airports. We show that
the most important changes concern capacity choices in the markets that airlines
continue to serve and the size of the network served by the bankrupt airline after
exiting from bankruptcy. Second, we investigate the e¤ects during and after a com-
petitor�s bankruptcy �ling. The post-emergence analysis adds to our understanding
of what the �permanent� changes are in the set of services o¤ered following a �rm�s
bankruptcy �ling. This conforms to the notion that the main purpose of bankruptcy
�lings should be to allow �rms time to reorganize themselves and that the evaluation
of the economic success of a bankruptcy �ling should be made after the �rm�s exit
from bankruptcy. Third, we show that the e¤ects are fundamentally di¤erent for the
bankrupt �rms and their rivals. In contrast, Borenstein and Rose (1995, 2003) esti-
mate the average e¤ect across both �ling and non-�ling carriers, and therefore they
do not identify the e¤ect on the �ling carrier separately from that on its competitors.
This is important because bankruptcies do not only a¤ect the bankrupt �rm but also
its competitors. It is quite emblematic that all the legacy carriers in the United States
have now �led at least once for Chapter 11. Fourth, we include speci�cations that
4 In addition to the di¤erences discussed in the body of the article, our analysis di¤ers from theirsalong two other dimensions. First, it is likely that there are heterogeneous route-carrier unobservablesthat might confound the results in Borenstein and Rose (2003). We control for this using route-carrier �xed e¤ects. Second, bankruptcy categorical variables might proxy for the changes in theservices that the (bankrupt and non-bankrupt) �rms provided even when no carrier was operatingunder bankruptcy protection. We include carrier speci�c dummies in order to avoid confounding thebankruptcy e¤ects with the carrier-speci�c e¤ects.
2
control for such unobserved heterogeneity using route-carrier �xed e¤ects, since it is
likely that there are heterogeneous route-carrier unobservables that might confound
the results in Borenstein and Rose (1995, 2003). Including route-carrier �xed e¤ects
rather than just carrier �xed e¤ects and route �xed e¤ects has been shown to be of
fundamental importance in empirical studies of the airline industry.5
This work is also related to a growing theoretical literature that examines whether
a �rm�s capital structure impacts competition in the market for the �rm�s products.
This literature focuses on how �nancial distress impacts the competitive interaction
of distressed and non-distressed �rms in an industry (Brander and Lewis (1986),
Bolton and Scharfstein (1990), Hendel (1996), Dasgupta and Titman (1998)). Sev-
eral empirical papers followed providing evidence of the interaction between �nancial
distress and product market competition (Bolton and Scharfstein (1990), Chevalier
and Scharfstein (1995, 1996), Chevalier (1995a, 1995b), Phillips (1995), Campello
(2006), Bhagat, Moyen, and Suh (2005), Kovenock and Phillips (1995)), and between
bankruptcy �lings and stock market performance (Ferris, Jayaraman, and Makhija
(1997)). Within this literature, the closest paper to ours is Chevalier (1995a). Our
paper di¤ers from hers along one important dimension: we have data on the individ-
ual price of the �rms, while Chevalier only has data on the average price in a market.
This additional information is of crucial importance in our empirical analysis since
we do not �nd evidence of almost any reaction by the rivals of �rm that �les for
Chapter 11 protection.
2 Bankruptcies in the Airline Industry
Several factors that can alter the competitive interaction between �rms in an indus-
try come into play when one of the �rms reorganizes under Chapter 11.6 First, the
5Gerardi and Shapiro (2009) analyzed the e¤ects of competition on price dispersion in the airlineindustry, using panel data from 1993:Q1 through 2006:Q3 and showed that their results contrastedwith those of Borenstein and Rose (1994), who found that price dispersion increased with competition.Gerardi and Shapiro presented evidence that the di¤erent results in Borenstein and Rose (1994) andGerardi and Shapiro (2009) were reconciled by showing that not including route �xed e¤ects wouldnot be enough to control from omitted-variable bias.
6The United States Bankruptcy Code contemplates two alternative solutions for �rms in �nancialdistress �ling for court protection: Chapter 7 and Chapter 11.
3
bankrupt �rm faces cost shocks inherent to operating under court protection, such as
the ability to renege and renegotiate contracts. Furthermore, the bankrupt �rm faces
demand shocks that can result in reduced demand for its products, as in Opler and
Titman (1994). Finally, reorganization might entail changes in the �rm�s product
quality (see Maksimovic and Titman (1991)), inventory (Hendel (1996)), and capac-
ity. These also have the potential to disrupt the competitive interaction of �rms in
the industry. To capture all of these changes we use bankruptcy categorical variables.
2.1 Stylized Facts of Airline Bankruptcies
Table 1 summarizes some stylized facts.7 Consistent with Bris et al. (2006) and Chen
and Schoar (2007), this table reveals signi�cant heterogeneity among bankruptcies.
This is most evident in the range of time that the �rm spends under bankruptcy (from
18 days for Air South to 1; 513 days for United Airlines), the way in which the �rm
resolves its bankruptcy (emerging or having to convert to Chapter 7 liquidation); and
the speci�c way in which the emerging �rm exits bankruptcy (on its own, or merging
with another carrier). Columns 3 and 4 show that almost all airlines �rst �le for
Chapter 11 protection. Large airlines soon begin to develop a reorganization plan.
Smaller carriers �rst attempt to keep the business alive by seeking an investor that
Chapter 7, entitled Liquidation, allows for an orderly, court-supervised procedure by which atrustee collects the assets of the �rm, reduces them to cash, and makes distributions to creditorssubject to the debtor�s right to retain certain exempt property and to the rights of secured creditors.Chapter 11, entitled Reorganization, allows the bankrupt �rm to continue operating while the �rm�smanagement restructures the �rm�s business. Firms that �le for Chapter 11 are those deemed a viableongoing concern which can potentially repay creditors through a court-approved reorganization plan.We focus on Chapter 11 �lings and drop �rms �ling under Chapter 7 because we are interested in thecompetitive and strategic e¤ect triggered by a �rm in the market that operates under bankruptcyprotection, and �rms �ling for Chapter 7 stop operations and liquidate their assets.
7Airlines that have �led for bankruptcy in the last two decades are identi�ed using the AirTransportation Association (ATA) website. This website provides a list of the names of air carriersthat have �led for protection, the date of the bankruptcy �ling, and the type of protection thatthe airline requested (reorganization under Chapter 11 or liquidation under Chapter 7). We crosscheck this data with the Bankruptcy Research Database compiled by Professor Lynn LoPucki. Foreach of the airlines �ling for Chapter 11 between 1992 and 2007, we manually search Factiva andLexis-Nexus for news report dating to about one year prior to and two years after the �rm�s �ling.This allows us to include items such as whether the �ling was voluntary or not, whether the airlineoriginally �led for Chapter 11 but was forced to convert its �ling to Chapter 7, whether the carrieremerged from bankruptcy or not, the date and the way in which the carrier exited bankruptcy, ifthe carrier was grounded and if so the date when it stopped �ying, and if grounding was voluntaryor a safety requirement imposed by the FAA.
4
would buy the carrier�s �ying certi�cate and any other assets the carrier might still
posses. If the carrier�s management is unsuccessful at �nding such investor(s), the
carrier converts its Chapter 11 �ling into a Chapter 7 �ling. For instance, in the case
of MarkAir�s second �ling the U.S. Bankruptcy court changed the carrier�s Chapter
11 �ling to Chapter 7, after the carrier spent 8 months under Chapter 11. Column
5 shows that in only two cases, Sun Country and Eastwind, the �ling was a Chapter
7 Liquidation initiated by the carrier�s creditors who took the �rm to court.8 Some
airlines �le for Chapter 11 protection multiple times (Column 6). The probability
that it emerges as an independent entity declines with the number of past �lings
and with shorter time spans between �lings (Columns 7 to 11). For example, USAir
emerged from its second Chapter 11 �ling after merging with America West, and
TWA emerged from its third �ling after being acquired by American. We expect
the competitive behavior to change di¤erently when carriers �le for the �rst time,
or for subsequent times and, indeed, this is what we �nd in our empirical analysis.
Column 12 shows substantial heterogeneity in the time that a �rm can operate under
Chapter 11 protection. There is no clear relationship between the duration and the
probability of emergence from bankruptcy.
2.2 The Economics of Airline Industry Bankruptcy Filings
The reorganization of the �rm�s operating plan during bankruptcy can result in
changes in the markets served, as well as in the way these markets are served. For
example, after �ling for bankruptcy protection on September 14, 2005, Delta Air-
lines implemented several major changes. One of the most important ones was its
decision to abandon the Dallas/Fort Worth airport as one of its hubs. This led to
fewer non-stop destinations out of Dallas, and fewer �ights on the routes that were
still served. During reorganization, the insolvent �rm might downsize operations in
markets burdened with excess capacity and in the least pro�table markets. Carriers
can also downsize capacity within a market by adjusting the number of seats o¤ered
8Lessors forced an involuntary liquidation of Sun Country Airlines. The FAA grounded KiwiAirlines, MarkAir, and ProAir for safety concerns, training and maintenance violations. Unless theairline is already under court protection, the FAA grounding precipitates a bankruptcy �ling.
5
and the number of performed departures. The freed capacity can be reallocated to
markets that are more pro�table.9
Under bankruptcy, the insolvent carrier can implement cost-cutting strategies that
are illegal outside of court protection, thus facilitating the �rms return to pro�tability.
Under Section 1110 of Chapter 11, a bankrupt carrier that has defaulted on its
aircraft lease payments has a 60 day grace period to make lease payments and keep
the aircraft. If after 60 days the carrier has not paid its outstanding lease, the
lessor can re-possess the aircraft. Rarely have lessors repossessed aircrafts.10 Most
lessors are willing to renegotiate payments with the bankrupt carrier because a lessor
who repossesses a plane would have to redeploy it elsewhere, and if the industry is in
distress, that might be more costly than extending payment schedules or renegotiating
payment terms. Furthermore, since rescinded leases become a general unsecured
claim on the carrier, the ca rrier has a strong bargaining position with their lessor.11
In rare instances, lessors force a Chapter 11 �ling over missed lease payments.12 One
of the largest burdens a¤ecting most carriers are obligations to employees and retirees
through de�ned bene�t pension programs. Most legacy carriers under bankruptcy
protection use their bankruptcy �lings to renegotiate or renege on their de�ned bene�t
pension obligations. Doing so transfers the burden of pension obligations to taxpayers
via the Federal Pension Bene�t Guarantee Corporation (PBGC).13 Cost reductions
resulting from changes in de�ned bene�t pension programs should outlast the �rm�s
9 In particular, Sections 1110 and 1113 of Chapter 11 facilitate these strategic changes as theyallow the bankrupt carrier to adjust capacity without incurring major costs or contract violations,by granting insolvent carriers the freedom to rescind leases on gates, hangars, and aircraft, and tounilaterally modify labor agreements. For instance, Delta rejected and restructured dozens of leasesat the Tampa, Dallas and Orlando airports.10Repossessions have occurred for small carriers: MarkAir (second bankruptcy), Western Paci�c,
and Sun Country.11During Continental�s second bankruptcy �ling 12 aircraft leasing companies agreed to defer,
reduce, or forgive lease payments on 98 planes in Continental�s �eet. America West negotiated rentrelief on aircarfts leased from Ansett Worldwide Aviation Services. ATA returned 18 planes to lessorGeneral Electric. Delta Airlines requested court approval to reject leases on its aircrafts.12Lessors of USAir considered �ling a lawsuit against the carrier. But Brad Gupta, the president
of Ameriquest Holdings, a USAir lessor, publicly stated on July 25; 2002 that would leave the lessorfacing lower lease rates and lower demand for rejected leases. This discouraged the lessor�s lawsuit.13Under United Airline�s reorganization plan, the PBGC took over all four of the airline�s under-
funded pension plans. Immediately after �ling for Chapter 11, Northwest and Delta Airlines soughtcourt permission to cut o¤ payments to the bulk of the retirement annuities received by thousandsof former employees.
6
stay under bankruptcy protection. Labor union contracts heavily burden the airline
industry. Renegotiations with unions and employees is a key cost-saving strategy in
which airlines engage while operating under protection. The threat that the carrier
can be forced into liquidation, leaving employees jobless, makes labor unions and
employees more willing to renegotiate than they would otherwise be. Under Section
1113 of Chapter 11, an airline can unilaterally modify labor agreements if negotiations
turn out to be unsuccessful.14 Just the threat that the bankrupt carrier can turn to
Section 1113 shifts most of the bargaining power to the airline.
A bankruptcy �ling can a¤ect consumers� willingness to pay for the services that
the insolvent �rm provides. Such a negative demand shock might reverse once the
carrier exits bankruptcy. Reputation costs associated with a bankruptcy �ling can
reduce the demand for the carrier�s �ights. Opler and Titman (1994) show that
highly leveraged �rms lose substantial market share to their more conservatively
�nanced competitors during industry downturns. Similarly, bankrupt �rms (which
represent the extreme case of excessive leverage) might lose signi�cant market share
to competitors. Safety consideration aside, passengers might still prefer to �y non-
bankrupt carriers if they are concerned that the insolvent �rm will not honor its
frequent �ier obligations. Passengers have voiced concerns that, even if the carrier
emerges from bankruptcy, frequent �ier miles might not be honored.15 This can drive
demand away from the distressed carrier to its non-distressed competitor.
3 Data Description
Our data is an original compilation from several sources. From the Air Transportation
Association Web site, Lynn LoPucki�s Bankruptcy Database, and Factiva and Lexis-
14When USAir�s mechanics wouldn�t join other unions in making voluntary concessions, the car-rier�s CEO, David Siegel, �led for Chapter 11. The carrier�s ability to void labor contracts with thebankruptcy judge�s approval allowed Siegel to win concessions from the mechanics. During UnitedAirlines reorganization, the carrier �led a motion with the bankruptcy court to void the unions� laborcontracts and impose new terms to signi�cantly cut the carrier�s expenses. Notice that Section 1113is not speci�c to airlines, while Section 1110 is.15A December 11; 2002 article in the WSJ reveals United�s concern with reputation e¤ects following
its bankruptcy �ling: �United Airlines has launched a national advertising campaign to reassurecustomers that it will keep �ying following its bankruptcy-law �ling,...The all-text, black-and-whiteads assure customers that United, a unit of UAL, is honoring tickets and frequent-�ier miles.�
7
Nexis reports, we obtain the identity of carriers �ling for bankruptcy, the dates on
which each carrier entered and exited court protection, and the speci�c way in which
each carrier emerged from protection. We merge this dataset with data from The �On-
Time Performance Schedule� gathered by the Bureau of Transportation Statistics
(BTS); the T-100 Domestic Segment of Form 41 reported by the BTS; the Origin
and Destination Surveys (DB1B), which is a ten percent sample of airline tickets sold
by airlines within a quarter.
3.1 Carriers, Markets, and Routes
We consider nine national carriers between 1997 and 2007: American (identi�ed by
its airline code, AA), Continental (CO), Delta (DL), America West (HP; until the
third quarter of 2005), Northwest (NW ), Trans World Airlines (TWA, until the
second quarter of 2001), United (UA), USAir (US), and Southwest (WN). Low
cost carriers are grouped in a category labeled LCC (e.g., Jet Blue and Frontier
are in the LCC group).16 This allows us to keep small carriers that are present in
only a few markets or for a few quarters when we include route-carrier �xed e¤ects.
Furthermore, it allows us to use a meaningful grouping that captures the impact of
small carrier presence in the market. In the LCC category we exclude three low
cost carriers which we choose to study independently: Airtran (FL), ATA (TZ), and
National (N7). We do this because they either had a strong presence (Airtran) or
they �led for Chapter 11 during our sample period (ATA and National).17
Next, we identify airlines that have �led for bankruptcy protection between 1997
and 2007. There are six carriers operating under bankruptcy protection during our
sample period: United Airlines (December 9, 2002 through February 2, 2006), USAir
(August 11, 2002 through March 31, 2003 and then again September 12, 2004 through
16For each route-year-quarter, we take the averages across the low cost carriers for the controlvariables.17 In the LCC category we include: Trans States Airlines, Aloha Airlines, Alaska Airlines, Jetblue
Airways, UltrAir, Atlantic Southeast Airlines, Frontier Airlines, Tower Air, Allegiant Air, HawaiianAirlines, Business Express, Valujet Airlines, Midway Airlines, Kiwi International, Legend Airlines,Vanguard Airlines, Spirit Air Lines, Pro Air, Pan American Airways Corp., Reno Air, SunworldInt�l Airlines, Sun Country Airlines, Tristar Airlines, Western Paci�c Airlines, Eastwind Airlines,Air South, Mesaba Airlines, Mesa Airlines, Midwest Airlines, Accessair Holdings.
8
September 27, 2005), ATA (October 26; 2004 through February 28, 2006), Delta
(September 14, 2005 through May 1, 2007), and Northwest (September 14, 2005
through May 31, 2007). Some small carriers operated under court protection for a
small time window, and thus we cannot consider these carriers independently (E.g.,
Independence Air operated under court protection between November 7, 2005 and
January 5, 2006).18
We de�ne a market, denoted by m, as an airport-to-airport trip, irrespective of the
number of connections.19 A route, denoted by r, is a non-stop airport-to-airport trip.
We consider all airport-to-airport pairs between the top 50 Metropolitan Statistical
Areas (MSAs), ranked by population size.
We have four units of observation, which vary by the dataset used in each regres-
sion. First, to study the frequency of services, seats, and load factor, the unit of
observation is a carrier, route, year, quarter, combination. Second, we study prices
using a carrier, market, year, quarter unit of observation. Third, to study a carrier�s
network extent out of an airport, the unit of observation is carrier, airport, year,
quarter speci�c. Finally, for the analysis of the number of markets served in a given
quarter, by a given carrier, we use a carrier, year, quarter unit of observation
We denote carriers by j; airports by a = 1; :::; A; airport-to-airport routes by
r = 1; :::; R; airport-to-airport markets by m = 1; :::;M ; and time period by t =
1; :::T . For example, the combination jrt indicates that airline j (e.g. American)
transports its passengers on route r (Chicago O�Hare to Fort Lauderdale Airport) at
time t (e.g. the second quarter of 2002). In the rest of the analysis, we let g denote
the geographical scope of the analysis: thus, g 2 fr;m; a; ng, where n indicates that
the information is at the national level and the unit of observation is a carrier-year-
quarter. When g = n there is no cross-section variation across markets, and we only
have time-series variation.
18We exclude TWA�s third bankruptcy even though it occurred during our sample period becausethe �rm stayed under bankruptcy protection for less than one quarter. For an analysis of prepackagedbankruptcies, see Carapeto, 2005. We also exclude Chapter 7 �lings because in that case �rmsliquidate, and we do not have information on prices or other strategic variables under liquidation.19For example, one market is Chicago O�Hare (ORD) to Washington Dulles (IAD) and another
market is Chicago Midway (MDW) to Washington National (DCA).
9
3.2 Bankruptcy Categorical Variables
We de�ne the set of K carriers that �led for bankruptcy protection at some point as
� =�
UA;US(1st); US(2nd); NW;DL; TZ;N7
. Notice that USAir �led for Chapter
11 twice. We use the subscript k = 1; :::;K to denote a bankrupt �rm (K is equal
to 7). We want to distinguish the e¤ect that bankruptcy �lings have on the quality
measures we consider, for the bankrupt �rm, and for its competitors, during the time
when the bankrupt �rm operates under Chapter 11, as well as after the �rm emerges
from bankruptcy protection. To measure these e¤ects, we construct the following
categorical variables. First, we de�ne Bktgt equal to 1 if there is at least one carrier
under bankruptcy protection at time t and that carrier provides service in g (for
example, if g = r, then it provides service in route r), otherwise, Bktgt is equal to
zero. For each quality measure, we study the average e¤ect of bankruptcy across
markets and across bankrupt and non-bankrupt carriers. Next, we ask whether any
observed price changes during bankruptcy persist once the bankrupt �rm emerges
from court protection. To do this, we de�ne the categorical variable AftBktgt equal
to 1 if there is at least one carrier that was under bankruptcy protection at a time
before t; and that carrier currently serves g. Otherwise, AftBktgt is equal to zero.
3.3 Networks, Capacity, and Prices
We measure the extent to which a carrier�s downsizing a¤ects the number of markets
served at the national level. We use the scheduling database to construct the count
of origin-destination airport pairs by operating carrier, year, and quarter. We call
NationalNetworkjt the total number of airport-airport combinations served by car-
rier j during year-quarter t.20 Table 2 shows that on average a carrier serves 446:14
markets over the US.
We build a measure of a carrier�s network out of the airport of origin using the
scheduling data. The variable AirportNetworkjat equals the number of routes served
out of airport a; by carrier j; in year-quarter t:21 Table 2 shows that on average a
20Notice that for simplicity we have omitted g = n in the subscript of this variable.21This is a very important variable in the empirical literature of the airline industry. In particular,
it captures the relative attractiveness of an airline�s frequent �yer program and its other services at
10
carrier serves 19 markets out of an airport.
We evaluate the �ight frequency for each speci�c route. There has been active
research on the importance of �ight frequency as a determinant of air travel demand.22
An airline that provides a single �ight per day between two airports is forcing a large
fraction of travelers to �y at a time which is going to be less attractive than the one
o¤ered by an airline that provides two or more �ights per day between the same two
airports. To construct a measure of the �ight frequency between two airports, we
use the scheduling database which provides information on the number of �ights that
each carrier schedules and performs in each market, during a year-quarter period.
We compute the sum of the number of scheduled departures between two airports by
operating carrier, route, year, and quarter. Frequencyjrt equals the total number of
departures performed in route r, on year-quarter t, by carrier j. Table 2 shows that
on average �rms o¤er 362:29 �ights per quarter in each route.
The T � 100 Domestic Segment of Form 41 reported by the BTS provides data
on an airline�s capacity, measured by available seats, denoted by Seatsjrt. Table 2
shows that on average a carrier transports 45; 846:46 seats per quarter.
We de�ne a carriers load factor on a route during a year-quarter as the ratio of
the sum of all passengers transported in a market during a year-quarter to the sum
of all available seats for sale on that market, during that year-quarter. We denote
the load factor by LoadFactorjrt.
To summarize the airline pricing behavior we use the median prices in a market
m, denoted by Farejmt, to exploit information on the distribution of prices available
from the DB1B dataset while using as few statistics as possible.23 We code a round-
the origin and destination airports (the number of ticket counters, customer service desks, etc.). SeeBerry (1990,1992), Berry, Carnall, and Spiller (2006), Bamberger and Carlton (2003), Brueckner,Dyer, and Spiller (1992), Ciliberto and Tamer (2009), Ciliberto and Williams (2009).22Previous work looking at �ight frequency as a means for airlines to di¤erentiate their products
have looked at the relationship between �ight frequency and mergers (Richard, 2003), market com-petition (Borenstein and Netz, 1999), the nature of airline networks (Brueckner and Zhang, 2001),and economies of tra¢c density (Brueckner and Spiller, 1994)23We drop: tickets that are neither one-way nor round-trip travel, such as open-jaw trip tickets;
tickets involving a US-nonreporting carrier �ying within North America and foreign carrier �yingbetween two US points; tickets that are part of international travel; tickets including travel on morethan one airline on a directional trip (known as interline tickets); tickets involving non-contiguousdomestic travel (Hawaii, Alaska, and Territories); tickets with fares less than 20 dollars or larger than
11
trip ticket as one directional trip ticket, which costs half the full round-trip ticket
fare. Fares are measured in 1993 dollars. Table 2 shows that the average fare for a
one-way ticket is 126:46 dollars.
4 Identi�cation and Empirical Speci�cation
The objective of our paper is to compare route structure, prices, and capacities
before, during, and after bankruptcy. The main concern is the following: As the �rm
sinks deeper into �nancial distress, it might change its strategic decisions, like prices,
capacity, and network extent to generate the cash it needs to avoid bankruptcy, but
this can lead the �rm deeper into �nancial distress, and ultimately to a Chapter 11
�ling. This strategy is likely to be the �rm�s desperate attempt to raise cash to avoid
the bankruptcy �ling, and therefore, it is likely to occur in the period immediately
preceding bankruptcy. As a result of this pre-bankruptcy behavior, we might estimate
a lower pre-bankruptcy average price just because of the rapid drop in prices in the
quarters before the bankruptcy �ling.
This problem is conceptually the same as the one in Ashenfelter (1978). In a study
of the e¤ect of training programs on earnings Ashenfelter noted that all trainees suf-
fered unpredicted earning declines in the year prior to entering a training program (see
Ashenfelter (1978, page 51)). This stylized fact has become known as the �Ashen-
felter dip.� Simple comparisons of earnings before and after the training program
would be misleading evidence of the e¤ect of training on earnings. To deal with
this, Ashenfelter dropped the period immediately preceding training (see Ashenfelter
(1978, page 53)). The analogy with our problem of prices and bankruptcy �ling is
clear: Prices could fall prior to bankruptcy and this would dampen the di¤erences in
the prices before, during, and after the bankruptcy �ling.
We follow Ashenfelter (1978) and drop observations corresponding to two quar-
ters prior to the to-be-bankrupt �rm�s bankruptcy �ling date and corresponding to
9999 dollars; and tickets whose fares were in the bottom and top 5 percentile percentile in their year;tickets with more than 6 coupons. We then merge this dataset with the T-100 Domestic Segment(U.S. Carriers) and drop tickets for �ights that have less than 12 departures over a quarter in onedirection (this means less than 1 departure every week in one direction).
12
markets where this �rm was present.24 To further address this concern, we apply a
dynamic program evaluation approach: We look at the average values of the variable
of interest (e.g. price) one quarter before, two quarters before, and three quarters
before the �rm�s bankruptcy �ling. The key point is to see whether there is ev-
idence of signi�cant changes in prices preceding the bankruptcy �ling. Next, we
worry about the possibility of persistent correlation of negative unobserved current
and expected demand shifts (that extend beyond the pre-bankruptcy period we elim-
inate) in markets served by the bankrupt airlines relative to that in markets served
by other airlines. We address this second concern by following Friedberg (1998),
and include linear market time trends to control for such market-speci�c unobserv-
able correlations across time. Further, price changes triggered by demand changes
spurring from seasonal or exogenous shocks (e.g. increases in fuel costs or 9/11) can
confound the e¤ects of bankruptcy on prices. Serially correlated industry-speci�c
shocks to demand can also confound the e¤ects of bankruptcies on prices. To address
this, we include year-quarter �xed e¤ects. Furthermore, a carrier �ying on a certain
time schedule might bene�t business travel in some markets but not in others, a¤ect-
ing the price behavior of that carrier in those markets, but not in others.25 Ignoring
these sources of unobservable heterogeneity associated with an airline�s pricing be-
havior can confound the e¤ects of bankruptcy �lings on prices. To address this, we
include route-carrier �xed e¤ects. Finally, a carrier�s presence in a market can have
an e¤ect on the behavior of other carriers in that market, regardless of whether the
carrier is bankrupt. Thus, we di¤erentiate the e¤ect of a bankruptcy �ling from the
e¤ect that just the presence of a �rm in the market has by including the categorical
variable INgt. The variable INgt switches on when at least one bankrupt �rm is in
g (recall that if g = r, then we would say that at least one bankrupt �rm is in route
r) at time t. This variable is likely a function of the same unobservables that a¤ect
the pricing decisions. This leads us to discuss the issue of sample selection.
There are two sources of sample selection. The �rst is related to the self-selection
24We repeat the analysis excluding the preceding 4 quarters and �nd qualitatively similar results.25Another example: A carrier in a given market might use more modern planes than other carriers
in that market, a¤ecting the price that all carriers in that market can charge.
13
of the �rms into markets. In the literature, this problem is addressed by following
Veerbek and Nijman (1992), who consider the selectivity bias of the �xed and ran-
dom e¤ects estimators and show that the �xed e¤ect estimator is more robust to
nonresponse biases than the random e¤ects estimator. The second sample selection
issue refers to the selection of markets, since we do not have a balanced panel. Thus,
following Veerbek and Nijman (1992), we need to use market �xed e¤ects. In this
paper, we include route-carrier or market-carrier �xed e¤ects to address this concern,
which clearly control for market (or route) and carrier �xed e¤ects. To study the
empirical importance of sample selection we present results when we run regressions
with random e¤ects and compare them with the results we obtain when we include
�xed e¤ects. We show that sample selection is not an issue of empirical signi�cance
in our analysis, since the results are not di¤erent.
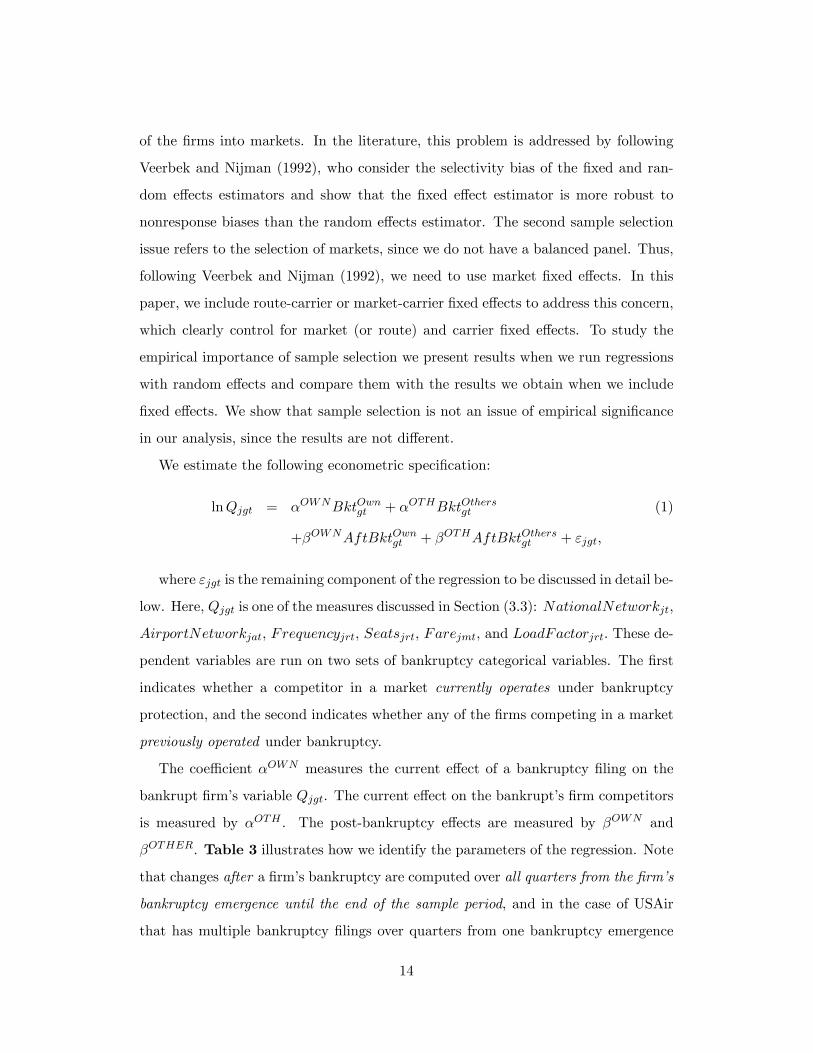
We estimate the following econometric speci�cation:
lnQjgt = �OWNBktOwngt + �OTHBktOthersgt (1)
+�OWNAftBktOwngt + �OTHAftBktOthersgt + "jgt;
where "jgt is the remaining component of the regression to be discussed in detail be-
low. Here, Qjgt is one of the measures discussed in Section (3.3): NationalNetworkjt;
AirportNetworkjat; F requencyjrt, Seatsjrt, Farejmt, and LoadFactorjrt: These de-
pendent variables are run on two sets of bankruptcy categorical variables. The �rst
indicates whether a competitor in a market currently operates under bankruptcy
protection, and the second indicates whether any of the �rms competing in a market
previously operated under bankruptcy.
The coe¢cient �OWN measures the current e¤ect of a bankruptcy �ling on the
bankrupt �rm�s variable Qjgt. The current e¤ect on the bankrupt�s �rm competitors
is measured by �OTH . The post-bankruptcy e¤ects are measured by �OWN and
�OTHER. Table 3 illustrates how we identify the parameters of the regression. Note
that changes after a �rm�s bankruptcy are computed over all quarters from the �rm�s
bankruptcy emergence until the end of the sample period, and in the case of USAir
that has multiple bankruptcy �lings over quarters from one bankruptcy emergence
14
until the next bankruptcy �ling. Similarly, the pre-bankruptcy period is de�ned as all
quarters between the beginning of the sample period until the �rm�s bankruptcy �ling ;
and for the second USAir bankruptcy it is over the quarters between �lings.
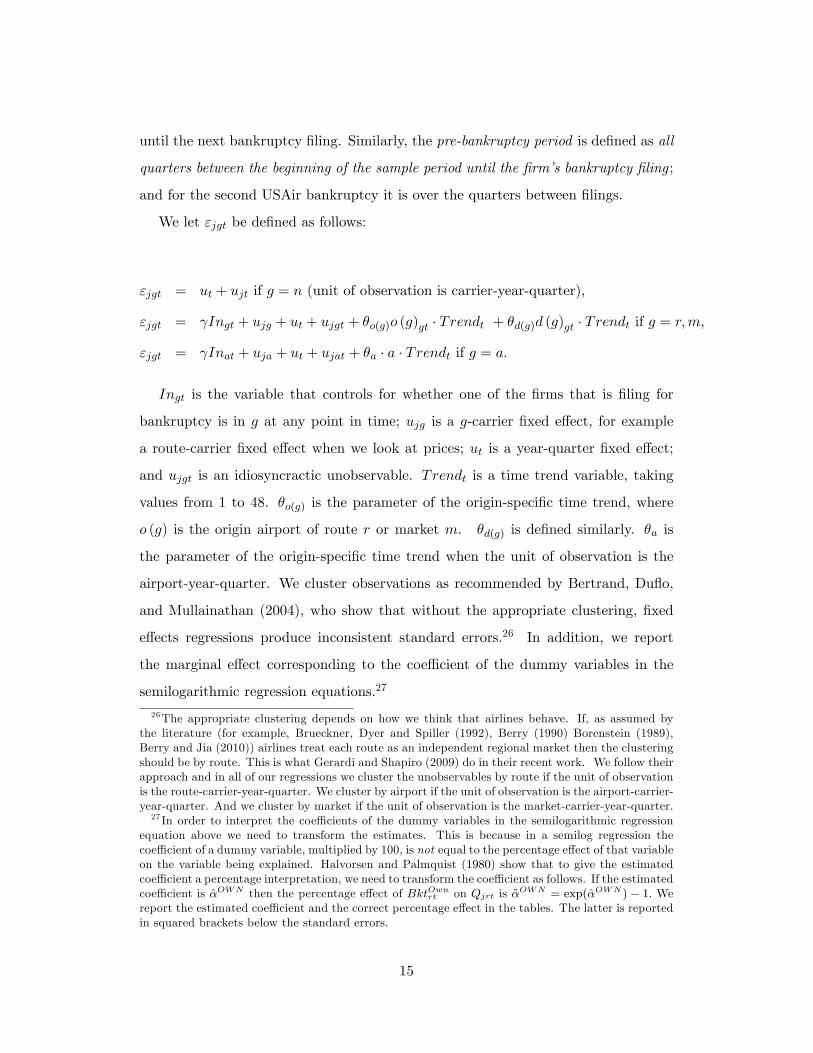
We let "jgt be de�ned as follows:
"jgt = ut + ujt if g = n (unit of observation is carrier-year-quarter),
"jgt = Ingt + ujg + ut + ujgt + �o(g)o (g)gt � Trendt + �d(g)d (g)gt � Trendt if g = r;m;
"jgt = Inat + uja + ut + ujat + �a � a � Trendt if g = a.
Ingt is the variable that controls for whether one of the �rms that is �ling for
bankruptcy is in g at any point in time; ujg is a g-carrier �xed e¤ect, for example
a route-carrier �xed e¤ect when we look at prices; ut is a year-quarter �xed e¤ect;
and ujgt is an idiosyncractic unobservable. Trendt is a time trend variable, taking
values from 1 to 48. �o(g) is the parameter of the origin-speci�c time trend, where
o (g) is the origin airport of route r or market m. �d(g) is de�ned similarly. �a is
the parameter of the origin-speci�c time trend when the unit of observation is the
airport-year-quarter. We cluster observations as recommended by Bertrand, Du�o,
and Mullainathan (2004), who show that without the appropriate clustering, �xed
e¤ects regressions produce inconsistent standard errors.26 In addition, we report
the marginal e¤ect corresponding to the coe¢cient of the dummy variables in the
semilogarithmic regression equations.27
26The appropriate clustering depends on how we think that airlines behave. If, as assumed bythe literature (for example, Brueckner, Dyer and Spiller (1992), Berry (1990) Borenstein (1989),Berry and Jia (2010)) airlines treat each route as an independent regional market then the clusteringshould be by route. This is what Gerardi and Shapiro (2009) do in their recent work. We follow theirapproach and in all of our regressions we cluster the unobservables by route if the unit of observationis the route-carrier-year-quarter. We cluster by airport if the unit of observation is the airport-carrier-year-quarter. And we cluster by market if the unit of observation is the market-carrier-year-quarter.27 In order to interpret the coe¢cients of the dummy variables in the semilogarithmic regression
equation above we need to transform the estimates. This is because in a semilog regression thecoe¢cient of a dummy variable, multiplied by 100, is not equal to the percentage e¤ect of that variableon the variable being explained. Halvorsen and Palmquist (1980) show that to give the estimatedcoe¢cient a percentage interpretation, we need to transform the coe¢cient as follows. If the estimatedcoe¢cient is �̂OWN then the percentage e¤ect of BktOwnrt on Qjrt is ~�
OWN = exp(�̂OWN ) � 1: Wereport the estimated coe¢cient and the correct percentage e¤ect in the tables. The latter is reportedin squared brackets below the standard errors.
15
5 The E¤ect of Bankruptcy Filings on Airline Networks
5.1 National Networks
The dependent variable for equation (1) in Table 4, is the natural logarithm of
NationalNetworkjt and equals the number of origin and destination airport pairs
served by carrier j at time t. In this speci�cation we do not include year-quarter �xed
e¤ects because we cannot use variation in the identity and number of participants in a
local market to identify the e¤ect of bankruptcy �lings. Here, the level of geographical
detail is the whole US.
Column 1 presents the main speci�cation, where we include carrier �xed e¤ects
and we drop observations corresponding to two quarters prior the �lings. We estimate
�OWN equal to �0:233; �OTHER equal to 0:256; �OWN equal to �0:471; �nally,
�OTHER equal to 0:259. They are all precisely estimated.
The economic signi�cance of each coe¢cient can be gauged by looking at the
corresponding square bracket, which reports the transformed coe¢cient as described
above. In particular, �OWN equal to �0:233 means that on average �rms reduce the
number of markets that they serve by 20:8 percentage when they are under Chapter
11.28 After emerging from bankruptcy protection, �rms that �led for bankruptcy
protection serve 37:5 percentage fewer of the markets that they were serving before
�ling for Chapter 11 To understand why we �nd such a strong e¤ect, recall that
our unit of observation is a carrier-year-quarter. So, each carrier is approximately
weighted in an equal way when we estimate the average coe¢cients. This means that
the changes in the number of markets implemented by small carriers carry as much
weight as the ones implemented by the large carriers in the coe¢cient estimates.
To see why this observation is important, in Column 2 we exclude ATA from the
dataset. Immediately we notice that the estimate of �OWN drops to �0:275, which
corresponds to a change of �24 percent in the number of markets served.
Now consider the e¤ect of bankruptcy �lings on the number of markets served
by the rivals of the bankrupt �rms. We �nd that the rivals increase the number of
28The percentage e¤ect is calculated as above, ~�OWN = exp(�0:595)� 1 = 44:8%:
16
the markets they serve by almost 30 percent. This change is permanent. Again this
e¤ect is very large. In the other columns we will see that such e¤ect is closer to 20
percent. Column 3 presents the results when we do not use Ashenfelter�s solution,
that is we do not drop observations corresponding to two quarters prior the �lings.
The results are similar to those in Column 1, which is the �rst piece of evidence that
the endogeneity of the bankruptcy dummies is not empirically signi�cant. Column
4 presents the results when we also exclude the carrier �xed e¤ects. Notice that the
parameters are estimated almost equal to those ion Column 3, suggesting that �rm
speci�c heterogeneity is not a concern in the empirical question that we address in
this paper.
We conclude the table with Column 5, where we follow a dynamic program
evaluation approach. Instead of dropping observations corresponding to two quarters
prior to the �ling, we add lag values of the bankruptcy categorical variables. Formally,
we estimate the coe¢cients of BktOwng;t�1, BktOwng;t�2, Bkt
Othersg;t�1 , and Bkt
Othersg;t�2 . If the
bankruptcy dummies are exogenous, the results should be the same in Column 1 and
Column 5. Moreover, the lag bankruptcy dummies should be neither statistically nor
economically signi�cant. This is exactly what we �nd.
Overall, the results suggest that there is very strong impact of bankruptcy �lings
on the number of markets served by bankrupt �rm, but and on the number of markets
served by its rivals. When looking at these results we need to keep in mind that no
time speci�c controls (i.e. year-quarter �xed e¤ects) are included in the estimation
because we cannot separately estimate the e¤ect of the time variables and that of
the bankruptcy dummies. Next, we will consider the case where we use variation
in local markets and then we can see how robust this �rst set of results is to more
controls.
5.2 Airport Networks
In Table 5 the dependent variable is the natural logarithm of AirportNetworkjat:
Recall that this is the natural logarithm of the total number of markets served by
carrier j out of airport a at time t.
17
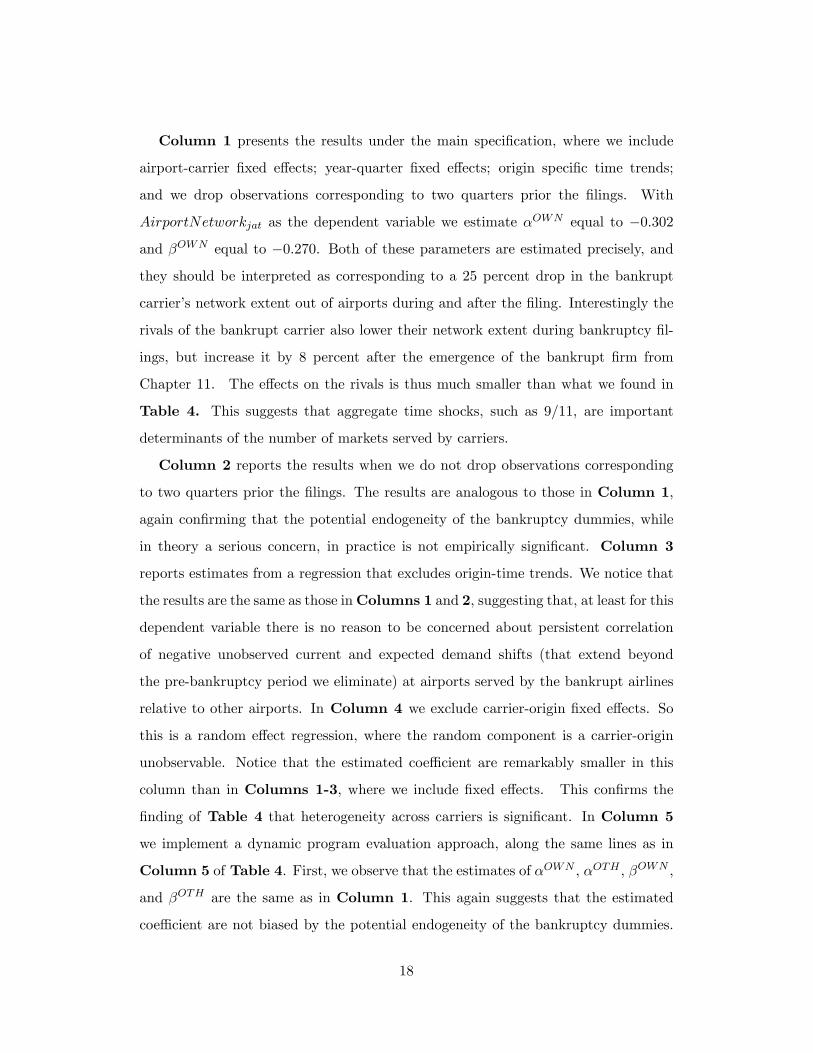
Column 1 presents the results under the main speci�cation, where we include
airport-carrier �xed e¤ects; year-quarter �xed e¤ects; origin speci�c time trends;
and we drop observations corresponding to two quarters prior the �lings. With
AirportNetworkjat as the dependent variable we estimate �OWN equal to �0:302
and �OWN equal to �0:270. Both of these parameters are estimated precisely, and
they should be interpreted as corresponding to a 25 percent drop in the bankrupt
carrier�s network extent out of airports during and after the �ling. Interestingly the
rivals of the bankrupt carrier also lower their network extent during bankruptcy �l-
ings, but increase it by 8 percent after the emergence of the bankrupt �rm from
Chapter 11. The e¤ects on the rivals is thus much smaller than what we found in
Table 4. This suggests that aggregate time shocks, such as 9/11, are important
determinants of the number of markets served by carriers.
Column 2 reports the results when we do not drop observations corresponding
to two quarters prior the �lings. The results are analogous to those in Column 1,
again con�rming that the potential endogeneity of the bankruptcy dummies, while
in theory a serious concern, in practice is not empirically signi�cant. Column 3
reports estimates from a regression that excludes origin-time trends. We notice that
the results are the same as those inColumns 1 and 2, suggesting that, at least for this
dependent variable there is no reason to be concerned about persistent correlation
of negative unobserved current and expected demand shifts (that extend beyond
the pre-bankruptcy period we eliminate) at airports served by the bankrupt airlines
relative to other airports. In Column 4 we exclude carrier-origin �xed e¤ects. So
this is a random e¤ect regression, where the random component is a carrier-origin
unobservable. Notice that the estimated coe¢cient are remarkably smaller in this
column than in Columns 1-3, where we include �xed e¤ects. This con�rms the
�nding of Table 4 that heterogeneity across carriers is signi�cant. In Column 5
we implement a dynamic program evaluation approach, along the same lines as in
Column 5 of Table 4. First, we observe that the estimates of �OWN , �OTH , �OWN ,
and �OTH are the same as in Column 1. This again suggests that the estimated
coe¢cient are not biased by the potential endogeneity of the bankruptcy dummies.
18
Second, we notice that one of the lagged dummies is statistically signi�cant and its
magnitude is quite large. We interpret this as evidence that, prior to bankruptcy, the
insolvent �rm implements changes in its network extent, but the magnitude of such
changes are not precisely estimated.
Overall the results of Table 5 con�rm a strong e¤ect of bankruptcy �lings on the
route structure of airline �rms. Bankrupt carriers drop markets at all their airports,
with an average change of approximately 25 percent. This is clearly a strong e¤ect.
6 The E¤ect of Bankruptcy Filings on Capacity Choices
6.1 Flights Frequency
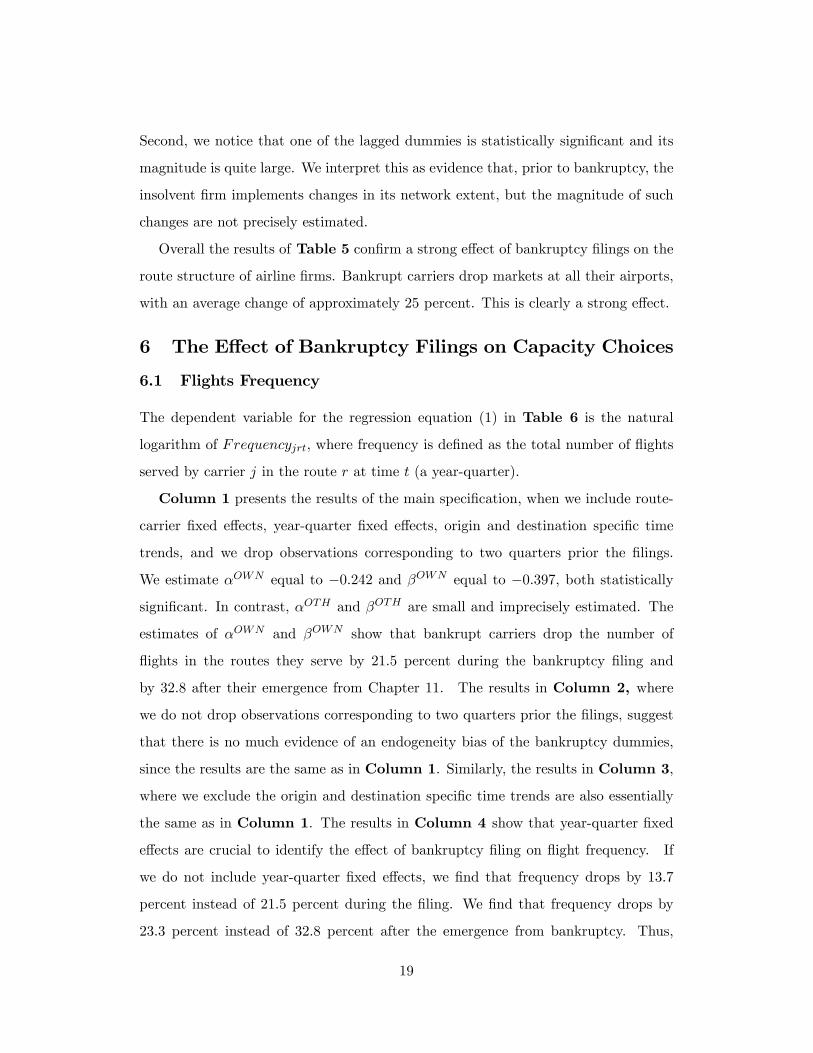
The dependent variable for the regression equation (1) in Table 6 is the natural
logarithm of Frequencyjrt, where frequency is de�ned as the total number of �ights
served by carrier j in the route r at time t (a year-quarter).
Column 1 presents the results of the main speci�cation, when we include route-
carrier �xed e¤ects, year-quarter �xed e¤ects, origin and destination speci�c time
trends, and we drop observations corresponding to two quarters prior the �lings.
We estimate �OWN equal to �0:242 and �OWN equal to �0:397, both statistically
signi�cant. In contrast, �OTH and �OTH are small and imprecisely estimated. The
estimates of �OWN and �OWN show that bankrupt carriers drop the number of
�ights in the routes they serve by 21:5 percent during the bankruptcy �ling and
by 32:8 after their emergence from Chapter 11. The results in Column 2, where
we do not drop observations corresponding to two quarters prior the �lings, suggest
that there is no much evidence of an endogeneity bias of the bankruptcy dummies,
since the results are the same as in Column 1. Similarly, the results in Column 3,
where we exclude the origin and destination speci�c time trends are also essentially
the same as in Column 1. The results in Column 4 show that year-quarter �xed
e¤ects are crucial to identify the e¤ect of bankruptcy �ling on �ight frequency. If
we do not include year-quarter �xed e¤ects, we �nd that frequency drops by 13:7
percent instead of 21:5 percent during the �ling. We �nd that frequency drops by
23:3 percent instead of 32:8 percent after the emergence from bankruptcy. Thus,
19
there are temporal shocks that play an important role in determining the frequency
decisions, which can confound the e¤ect of bankruptcy �lings on frequency. Instead,
Column 5 shows that route-carrier �xed e¤ects are not crucial for the results. Thus,
unobserved heterogeneity across route-carriers is not as important as in Tables 4
and 5. In Column 6 we implement a dynamic program evaluation approach. There
is some small evidence that the bankrupt �rm might have started to change its �ight
frequency before the �ling, but those changes were minimal, compared to those during
and after the bankruptcy �ling. Notice that the estimates of the main parameters, ,
are the same as in Column 1. Together with the results in Columns 1 and 2, this
suggests that the bankruptcy dummies are not endogenous in this regression.
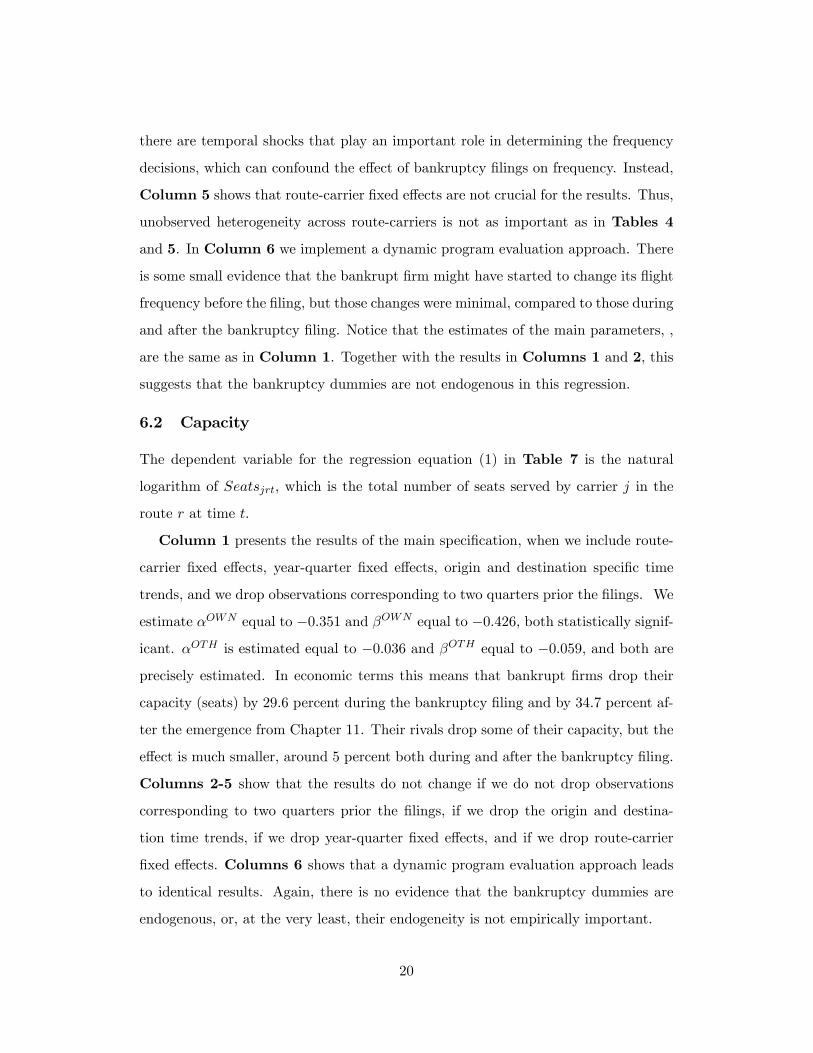
6.2 Capacity
The dependent variable for the regression equation (1) in Table 7 is the natural
logarithm of Seatsjrt, which is the total number of seats served by carrier j in the
route r at time t.
Column 1 presents the results of the main speci�cation, when we include route-
carrier �xed e¤ects, year-quarter �xed e¤ects, origin and destination speci�c time
trends, and we drop observations corresponding to two quarters prior the �lings. We
estimate �OWN equal to �0:351 and �OWN equal to �0:426, both statistically signif-
icant. �OTH is estimated equal to �0:036 and �OTH equal to �0:059, and both are
precisely estimated. In economic terms this means that bankrupt �rms drop their
capacity (seats) by 29:6 percent during the bankruptcy �ling and by 34:7 percent af-
ter the emergence from Chapter 11. Their rivals drop some of their capacity, but the
e¤ect is much smaller, around 5 percent both during and after the bankruptcy �ling.
Columns 2-5 show that the results do not change if we do not drop observations
corresponding to two quarters prior the �lings, if we drop the origin and destina-
tion time trends, if we drop year-quarter �xed e¤ects, and if we drop route-carrier
�xed e¤ects. Columns 6 shows that a dynamic program evaluation approach leads
to identical results. Again, there is no evidence that the bankruptcy dummies are
endogenous, or, at the very least, their endogeneity is not empirically important.
20
7 The E¤ect of Bankruptcy Filings on Prices
In this Section we reconcile the evidence on the e¤ects of Chapter 11 on capacity and
network structure with the evidence on prices. We ask the following questions: How
do prices change? What happens to the demand faced by the bankrupt �rm? Finally,
what are the e¤ects of the bankruptcy �lings on the marginal costs of transporting a
passenger?
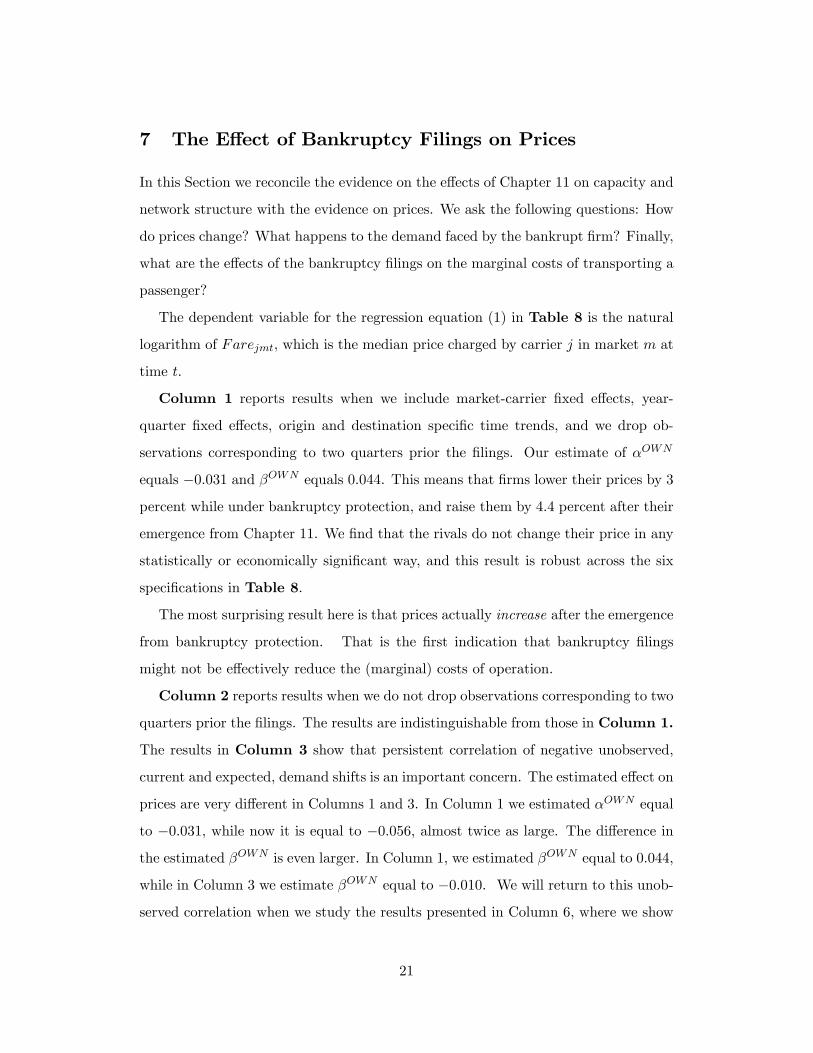
The dependent variable for the regression equation (1) in Table 8 is the natural
logarithm of Farejmt, which is the median price charged by carrier j in market m at
time t.
Column 1 reports results when we include market-carrier �xed e¤ects, year-
quarter �xed e¤ects, origin and destination speci�c time trends, and we drop ob-
servations corresponding to two quarters prior the �lings. Our estimate of �OWN
equals �0:031 and �OWN equals 0:044. This means that �rms lower their prices by 3
percent while under bankruptcy protection, and raise them by 4:4 percent after their
emergence from Chapter 11. We �nd that the rivals do not change their price in any
statistically or economically signi�cant way, and this result is robust across the six
speci�cations in Table 8.
The most surprising result here is that prices actually increase after the emergence
from bankruptcy protection. That is the �rst indication that bankruptcy �lings
might not be e¤ectively reduce the (marginal) costs of operation.
Column 2 reports results when we do not drop observations corresponding to two
quarters prior the �lings. The results are indistinguishable from those in Column 1.
The results in Column 3 show that persistent correlation of negative unobserved,
current and expected, demand shifts is an important concern. The estimated e¤ect on
prices are very di¤erent in Columns 1 and 3. In Column 1 we estimated �OWN equal
to �0:031, while now it is equal to �0:056, almost twice as large. The di¤erence in
the estimated �OWN is even larger. In Column 1, we estimated �OWN equal to 0:044,
while in Column 3 we estimate �OWN equal to �0:010. We will return to this unob-
served correlation when we study the results presented in Column 6, where we show
21
that the linear trends adequately control for it. Column 4 excludes year-quarter
�xed e¤ects, and this signi�cantly alters our results. The coe¢cient �OWN equals
�0:093, which would mean that under in-bankruptcy airline �rms charge prices that
are almost 10 percent lower than in the pre-bankruptcy period. �OWN equals �0:032,
suggesting that some part of the price drop is permanent. Clearly, the conclusions of
our analysis would be di¤erent if we did not control for unobserved temporal shocks,
such as 9/11: We would conclude that bankruptcy �lings lead to lower prices both
during and after the time when a �rm is under Chapter 11 protection. In Column
5 we report results for a speci�cation with route-carrier random e¤ects. The results
are essentially identical to those in Column 1. This means that the changes in prices
are estimated to be the same whether we use variation in prices in markets where
bankrupt airlines are present before, during, and after a bankruptcy �ling or whether
we use variation in prices in all markets. This is important for two reasons. First, it
suggests that there are no selection problems since the results are the same whether
or not we include route-carrier �xed e¤ects. Second, this eliminates the unlikely but
potentially troubling possibility that identi�cation is just o¤ routes that airlines keep
while in bankruptcy but drop them upon emerging. Column 6 presents the results
when we follow a dynamic program evaluation approach. Recall that this approach
is useful to see the extent to which prices set by bankrupt �rms are di¤erent on time-
varying unobservables that are not adequately captured by either the year-quarter
�xed e¤ects or origin/destination linear trends. Given the magnitude of the results
for prices, we include three lags, instead of two as in the previous tables. First, we
�nd that �OWN and �OWN take the same values as in Column 1. Second, we notice
that the lagged variables are small in magnitude and decline as we move further back
in time from the bankruptcy �ling date. Thus, we conclude that there might still be
some di¤erence on time-varying unobservables which is not picked up by the year-
quarter �xed e¤ects or by the origin/destination linear trends, but such di¤erence
does not signi�cantly a¤ect the estimates of the parameters �OWN and �OWN .
Next, we ask what is the e¤ect of bankruptcy on a carrier�s load factor. A carrier�s
load factor is the ratio of passengers �own over the number of seats, by a carrier j,
22
in route r, in year-quarter t; and captures airline j�s capacity utilization. This is
interesting because the load factor is an indicator that tells us about the demand
faced by the airlines for the following reason. We know that the bankruptcy carrier
dropped its capacity and prices did not change much. If the load factor remain
unchanged or is smaller, then this means that the bankrupt carrier must be facing a
lower demand. If the load factor increased, then this means that the bankrupt carrier
might have actually experienced an increase in its demand.
Table 9 considers the case where the dependent variable is the natural logarithm
of the load factor of carrier j, in route r, at year-quarter t, LoadFactorjrt. We
only run one speci�cation, where we include market-carrier �xed e¤ects, year-quarter
�xed e¤ects, origin and destination speci�c time trends, and we drop observations
corresponding to two quarters prior the �lings.
Columns 1 and 2 of Table 9 show that the bankrupt �rm�s load factor declines
during and after its bankruptcy �ling. We know from Table 7 that the bankrupt
�rm decreases the number of seats available. Together, these results suggest that
the bankrupt carrier�s demand fell, and though the �rm decreased capacity and price
during bankruptcy, the price fall was not enough to generate a high capacity uti-
lization rate (load factor). The load factor of the competitors increases, suggesting
an unambiguous shift in demand towards non-bankrupt carriers. The e¤ect on the
bankrupt carrier�s demand is somewhat reversed after the �rm emerges from bank-
ruptcy, since the emerging carrier is able to increase prices by more than 5 percent
even though its planes are not as fully utilized as before the �ling.
7.1 Prices and Marginal Costs
To investigate further why prices do not change much during and after bankruptcy
�lings, we study the marginal cost of transporting a passenger. Recall that a Chapter
11 �ling can grant the bankrupt �rm a cost advantage over its competitors, poten-
tially explaining the marginal fall in prices observed while the �rm operates under
bankruptcy. Cost savings are expected to last even after the �rm emerges from bank-
ruptcy, or at least for a short time following the �rm�s emergence. To investigate the
23
explanatory power of cost driven price changes, we study changes in the marginal
cost of a seat before, during, and after each bankruptcy �ling. Before we discuss this
alternative explanation, it is useful to discuss in more detail the nature of marginal
costs in the airline industry, and the distinction between accounting and economic
opportunity cost.
The accounting marginal cost of a seat is just the passenger cost associated with
issuing tickets, processing passengers through the gate, in-�ight food and beverages,
and insurance and other liability expenses. This cost is very small relative to the
�xed costs faced by an airline to �y a plane on a route. However, as Elzinga and
Mills [forthcoming] convincingly argue, the economic opportunity cost is the price
of the ticket that could have been charged to another passenger to �y on that same
plane but through a connection between two di¤erent airports. This measure of the
economic marginal cost is not observable because we do not have the information
to know what passengers the airline could have �own on that same seat. Yet, we
know the lowest price that the airline charged in a quarter. The idea here is that a
reasonable approximation of the economic marginal cost is the lowest ticket fare that
a carrier charged across all of its routes.29 Notice that our de�nition of economic
marginal cost of a seat is very helpful to clarify an apparent paradox of the role
of bankruptcy �lings in the airline industry. On one hand, while under bankruptcy
protection an airline might be able to decrease the usual business overhead costs, such
as costs associated with sta¤ functions, general administration, brand marketing, and
common-use property. On the other hand, the same airline might still be unable
to lower its operating costs, which are associated with route speci�c marginal costs,
such as aircraft maintenance costs or fuel costs. Thus, a bankruptcy �ling can be
very successful at lowering the �xed overhead costs, but not the marginal cost of a
seat. The failure of the airlines to lower their operating marginal cost is exactly what
we show next.
First, we consider the traditional cost measure used in the airline industry, average
29This notion of economic marginal cost seems to be already in Borenstein and Rose [�Competitionand Price Dispersion in the US Airline Industry, Journal of Political Economy, 1994, vol. 102, no.4, pages 664-665].
24
cost per seat mile (CSM). The average cost to carry one passenger for one mile is
known in the airline industry as the average cost per seat mile. It is constructed
using the ratio of the quarterly operating expenses over the quarterly total of the
product of the number of seats transported and of the number of miles �own by
the airline. We gather data on operating expenses from the Air Carrier Financial
Reports (Form 41 Financial Data) and on the total number of seats and miles �own
from the Air Carrier Statistics (Form 41 Tra¢c). The mean of the average cost
per seat mile is approximately 9 cents per seat mile, and can be as low as 4 cents
and as high as 13 cents. This variable is not market speci�c. Panel I of Table 10
presents the mean CSM for each bankrupt carrier, across markets and year-quarter
observations, for the periods before, during and after its bankruptcy (measured in
US dollars). There is no evidence of persistent cost declines during or after a carrier�s
�ling. In the case of United Airlines, the average CSM prior to the bankruptcy �ling
is 9:4 cents, marginally rising during bankruptcy to 9:8 cents, and continuing to rise
after United�s exit from bankruptcy, to 10:6 cents.30 Similar results hold for USAir�s
�rst �ling, where average CSM pre- and during bankruptcy was 12:1 cents, rising
marginally to 12:5 cents post bankruptcy. For ATA, Delta, and Northwest we observe
that the average CSM increases while the �rm operates under bankruptcy. ATA and
Northwest marginally lowered average CSM after exiting bankruptcy relative to the
in-bankruptcy CSM, yet Delta continues to increase its CSM. It is only in the case
of USAir�s second �ling that we observe a decline in average CSM: pre-bankruptcy
this was 12:5 cents, dropping to 11:4 during bankruptcy, and continued to fall after
USAir exited court protection. The unusual cost pattern observed to USAir�s second
�ling can be explained by the carrier�s exit strategy: USAir emerged after merging
with low cost carrier America West.31
30Another way to look at this issue is to consider the numerator and denominator of the CSMseparately. The numerator is given by the total operating costs. In the case of United, for example,the total operating costs were, on average, equal to $1,259,990,000 before the bankruptcy �lings,and equal to $1,660,385,000 after the exit from bankruptcy. So the total operating costs increasedby 30%. As for the denominator, the number of seat-miles before �ling for bankruptcy protectionwas equal to 1.39e+10 seat-miles and equal to 1.58e+10 after the exit from bankruptcy. So thedenominator increased by 13%. Overall the CSM for United increased.31 In Figures that are available from the authors, we report a time series of CSM for United Airlines
and USAir for the period pre-, during, and post- bankruptcy. Consistent with the above �ndings, we
25
Following our discussion above, for each of the bankrupt carriers, we compute the
lowest ticket fare across markets and year-quarters and summarize it in Panel II of
Table 10. As with the evidence for average CSM, we do not �nd signi�cant changes
in the economic opportunity costs during or after the bankruptcy �ling. Except for
United Airlines� bankruptcy, all other bankrupt carriers temporarily lower economic
costs during bankruptcy, only to increase it again once it emerges from bankruptcy.
The pre-bankruptcy economic cost for USAir�s �rst �ling was 54:14 dollars, falling to
51:22 dollars during bankruptcy, and rising to 55:33 dollars after the carrier exited
bankruptcy protection. For Delta, pre-bankruptcy economic cost was 50:44 dollars,
barely falling to 49:80 dollars during bankruptcy, only to rise above its pre-bankruptcy
cost to 54:09 dollars after exiting bankruptcy. In the cases of ATA and USAir second
�ling, the post-bankruptcy economic cost is above the in-bankruptcy cost, but still
slightly below the pre-bankruptcy one; for instance, ATA�s pre-bankruptcy cost was
68:51 dollars, falling to 49:67 dollars during bankruptcy, and rising to 51:64 post-
bankruptcy (relative to the in-bankruptcy cost). These results on economic costs, pre-
, during, and post- bankruptcy, do not support the hypothesis that �rms operating
under Chapter 11 signi�cantly and permanently lower operating cost.
8 Conclusions
Our paper empirically examines whether a �rm�s bankruptcy �ling a¤ects product
market competition, using evidence from the US airline industry. We �nd that bank-
ruptcy �lings lead to a reduction of capacity and prices in the industry. Together
with the fact that we do not �nd any evidence of changes in the marginal cost of
transporting a passenger, our results suggest that bankruptcy �lings are e¤ective at
reducing �xed costs but not marginal costs.
To our knowledge, there is no simple theoretical connection between bankruptcy
�lings and market competition. Nonetheless, our results are consistent with the
do not observe any signi�cant cost decline during or following the �rm�s bankruptcy �ling. Evidencefrom the average CSM does not support the hypothesis that �rms �ling for bankruptcy protectioncan signi�cantly reduce costs and thereby impact product market competition.
26
idea, often repeated in the mass media, that bankruptcy �lings are the result of
wars of attrition over capacity and network cutbacks. Since capacity cutbacks are a
public good that must be provided privately, each �rm waits for its competitors to
cut capacity �rst.32 Unless the industry outlook improves, the �rm generating the
lowest cash �ows and with the weakest �nancial position becomes unable to meet its
debt obligations, ultimately having to seek bankruptcy protection. Firms engage in
such a war of attrition when Chapter 11 of the U.S. Bankruptcy Code is an option,
since this law protects the insolvent �rm from liquidation by creditors, and allows the
�rm to void contracts and reorganize its business strategy, e¤ectively granting the
�rm a second chance at life. Operating under Chapter 11, the insolvent �rm reduces
capacity and downsizes its network, which can lead to higher product-market prices.
This is the channel through which we link bankruptcy �lings to product market price,
capacity, and network e¤ects.
Our analysis is restrictive in a number of aspects and suggests numerous exten-
sions, which constitute themes for future research. First, our paper focuses on the
e¤ect of bankruptcy �lings on product market competition, but it would be equally
interesting to investigate the determinants of bankruptcy �lings. That new research
might look in more detail into the role of the entry and expansion of low cost carriers.
On the one hand, it is doubtful that it was the advent of low cost carriers per se that
led to bankruptcy �lings since bankruptcies were pervasive at the beginning of the
1990s, before the surge in the number of LCCs. On the other hand, the expansion
of low cost carriers in the contemporary US airline industry might have accelerated
the number and frequency of bankruptcy �lings as well as their duration.
Second, another important feature of a bankruptcy �ling is the shift of control
from equity to debt holders. We do not incorporate such a change in our paper,
as we assume that the objective of the �rm is to maximize pro�ts, regardless of
the ownership structure. Future research might look into the bargaining between
di¤erent agents. Eraslan (2007) and Eraslan and Yilmaz (2007) have made important
contributions on this while looking at personal bankruptcies.
32See Ghemawat and Nalebu¤ [1990].
27
Finally, our paper uncovers stylized empirical patterns and suggests a unifying
explanation. An interesting and challenging line of research would be to estimate
a structural dynamic model of competition that incorporates the possibility of wars
of attritions among airline �rms along with the possibility to �le for bankruptcy
protection. An important contribution in this direction has been made by Takahashi
[2010], who estimates the impact of competition and exogenous demand decline on
the exit process of movie theaters in the US from 1950-1965. Takahashi shows that
theaters that are making negative pro�ts may choose to remain in the market if they
expect to outlast their competitors, because at that point their pro�ts would increase.
Takahashi shows that this creates a signi�cant delay in the exit process.
9 References
Viral V. Acharya and Krishnamurthy V. Subramanian, "Bankruptcy Codes and In-
novation," Review of Financial Studies, 22(12), 4949-4988, 2009.
Ashenfelter O., �Estimating the E¤ect of Training Programs on Earnings,� The
Review of Economics and Statistics, Vol. 60, No. 1 (Feb., 1978), pp. 47-57.
Bamberger Gustavo E., Carlton, Dennis W., �Airline Networks and Fares,� Hand-
book of Airline Economics, 2nd ed., Darryl Jenkins, ed., McGraw Hill (2003).
Berry, Steven., �Airport Presence as Product Di¤erentiation,� American Economic
Review, May, 1990, 80, 394-399.
Berry, Steven, �Estimation of a Model of Entry in the Airline Industry,� Econo-
metrica 1992, 60, 889-917.
S. Berry and P. Jia , �Tracing the woes: An empirical analysis of the airline
industry. MIT, Working Paper, 2010
Marianne Bertrand & Esther Du�o & Sendhil Mullainathan, 2004. "How Much
Should We Trust Di¤erences-in-Di¤erences Estimates?," The Quarterly Journal of
Economics, MIT Press, vol. 119(1), pages 249-275, February.
Sanjai Bhagat, Nathalie Moyen, Inchul Suh, "Investment and internal funds of
distressed �rms," Journal of Corporate Finance, 11, pp. 449-472.
Borenstein, Severin, �Hubs and High Fares: Dominance and Market Power in the
28
U.S. Airline Industry,� Rand Journal of Economics, Autumn 1989, 20: 344-365
Borenstein Severin, and Rose, Nancy, �Bankruptcy and pricing behavior in the
US airline markets,� American Economic Review Papers and Proceedings, May 1995,
85, 397-402
Borenstein Severin and Rose Nancy, �The Impact of Bankruptcy on Airline Service
Levels,� American Economic Review Papers and Proceedings, 93 (May 2003).
Bris, Arturo, Welch, Ivo, and Zhu, Ning, �The Costs of Bankruptcy�, The Journal
of Finance, 2006, 61, 1253-1303.
Brueckner Jan K., and Spiller, Pablo, �Economies of Tra¢c Density in the Dereg-
ulated Airline Industry,� Journal of Law and Economics, October 1994, 37, 379-415.
Jan K. Brueckner & Nichola J. Dyer & Pablo T. Spiller, 1992. �Fare Determina-
tion in Airline Hub-and-Spoke Networks,� RAND Journal of Economics, The RAND
Corporation, vol. 23(3), pages 309-333, Autumn.
Brueckner and Zhang, 2001 J.K. Brueckner and Y. Zhang, A model of scheduling
in airline networks: how a hub-and-spoke system a¤ects �ight frequency, fares and
welfare, Journal of Transport Economics and Policy 35 (2001), pp. 195�222. View
Record in Scopus j Cited By in Scopus (23)
Campello, Murillo, �Debt Financing: Does it Boost or Hurt Performance in Prod-
uct Markets?� Journal of Financial Economics, 2006, 83, 135-172.
Carapeto, M, 2005, "Bankruptcy bargaining with outside options and strategic
delay," Journal of Corporate Finance, 11, pp. 736-746.
Chevalier, Judith, �Do LBO Supermarkets charge more? An empirical analysis of
the e¤ects of LBO on supermarket pricing�� Journal of Finance, 1995a, 50, 1095-1112.
Chevalier, Judith, �Capital Structure and Product-Market Competition: Empir-
ical Evidence from the Supermarket Industry,� American Economic Review, 1995b,
85, 415-435.
Chevalier, Judith, and Scharfstein, David, �Capital-Market Imperfections and
Countercyclical Markups: Theory and Evidence,� The American Economic Review,
September 1996, 86, 703-725.
Chevalier, Judith, and Scharfstein, David, �Liquidity Constraints and the Cyclical
29
Behavior of Markups,� American Economic Review, May 1995, 85, 390-396.
Ciliberto, Federico and Williams, Jonathan, �Limited Access to Airport Facili-
ties and Market Power in the Airline Industry,� 2007, Working Paper, University of
Virginia.
Ciliberto, Federico, and Tamer, Elie, �Market Structure and Multiple Equilibria
in Airline Markets,� Econometrica, Vol. 77, No. 6 (November, 2009), 1791-1828.
Dasgupta, Sudipto, and Titman, Sheridan, �Pricing Strategy and Financial Pol-
icy,� Review of Financial Studies, Winter 1998, 11, 705-737.
Espen Eckbo and Karin Throburn, 2009, "Creditor �nancing and overbidding
in bankruptcy auctions: Theory and tests," Journal of Corporate Finance, 15, pp.
10-29.
Eraslan, Hulya K., �Corporate Bankruptcy Reorganizations: Estimates from a
Bargaining Model,� International Economic Review, 2008, 49:2, 659-681.
Eraslan, Hulya K., and Yilmaz, Bilge, �Deliberation and Security Design in Bank-
ruptcy,� 2008, Working Paper, Wharton School of Management.
Stephen Ferris, Narayanan Jayaraman, and Anil Makhija, 1997, "The response of
competitors to announcements of bankruptcy: An empirical examination of contagion
and competitive e¤ects," Journal of Corporate Finance, 3, pp. 367-395.
Friedberg L., �Did Unilateral Divorce Raise Divorce Rates? Evidence from Panel
Data,� The American Economic Review, Vol. 88, No. 3 (Jun., 1998), pp. 608-627
Hendel, Igal, �Competition Under Financial Distress, �The Journal of Industrial
Economics,� September 1996, 44, 309-324.
Halvorsen R. and Palmquist R, �The interpretation of dummy variables in semi-
logarithmic equations,� American Economic Review 70, 474-5.
Edith Hotchkiss and Robert Mooradian, 2003, Journal of Corporate Finance, 9,
pp. 555-574.
Philippe Jorion and Gaiyan Zhang, "Credit Contagion from Counterparty Risk,"
Journal of Finance, forthcoming.
Kennedy, P.E., �Estimation with correctly interpreted dummy variables in semi-
logarithmic equations,� American Economic Review, 71, 801.
30
Khanna, Naveen, and Tice, Sheri, �Pricing, exit, and location decisions of �rms:
Evidence on the role of debt and operating e¢ciency,� Journal of Financial Eco-
nomics, 2005, 75, 397-427
Kovenock, Dan, and Gordon, Phillips, �Capital Structure and Product Market
Behaviour: An Examination of Plant Exit and Investment Decisions,� Review of
Financial Studies, Autumn 1997, 10, 767-803.
Opler, Tim, and Titman, Sheridan, �Financial Distress and Corporate Perfor-
mance,� Papers and Proceedings Journal of Finance, July 1994, 49, 1015-1040.
Phillips, Gordon, �Increased Debt and Industry Product Markets: An Empirical
Analysis,� Journal of Financial Economics, 1995, 37, 189-238.
Rose, Nancy, �Fear of Flying? Economic Analyses of Airline Safety,� The Journal
of Economic Perspectives, 1992, 6(2), 75-94.
Yuya Takahashi, "Estimating a War of Attrition: The Case of the US Movie
Theater Industry," Working Paper, University of Wisconsin, 2010.
Veerbek, M. and T. Nijman, �Testing for Selectivity Bias in Panel Data Models,�
International Economic Review, 1992, 33(3), pp. 681-703.
Michelle J. White, "Bankruptcy Costs and the New Bankruptcy Code," The Jour-
nal of Finance, Vol. 38, No. 2, Papers and Proceedings Forty-First Annual Meeting
American Finance Association New York, N.Y. December 28-30, 1982 (May, 1983),
pp. 477-488
Michelle J. White, "Bankruptcy Reform and Credit Cards," Journal of Economic
Perspectives, Volume 21, Number 4, Fall 2007, pp. 175�199.
31
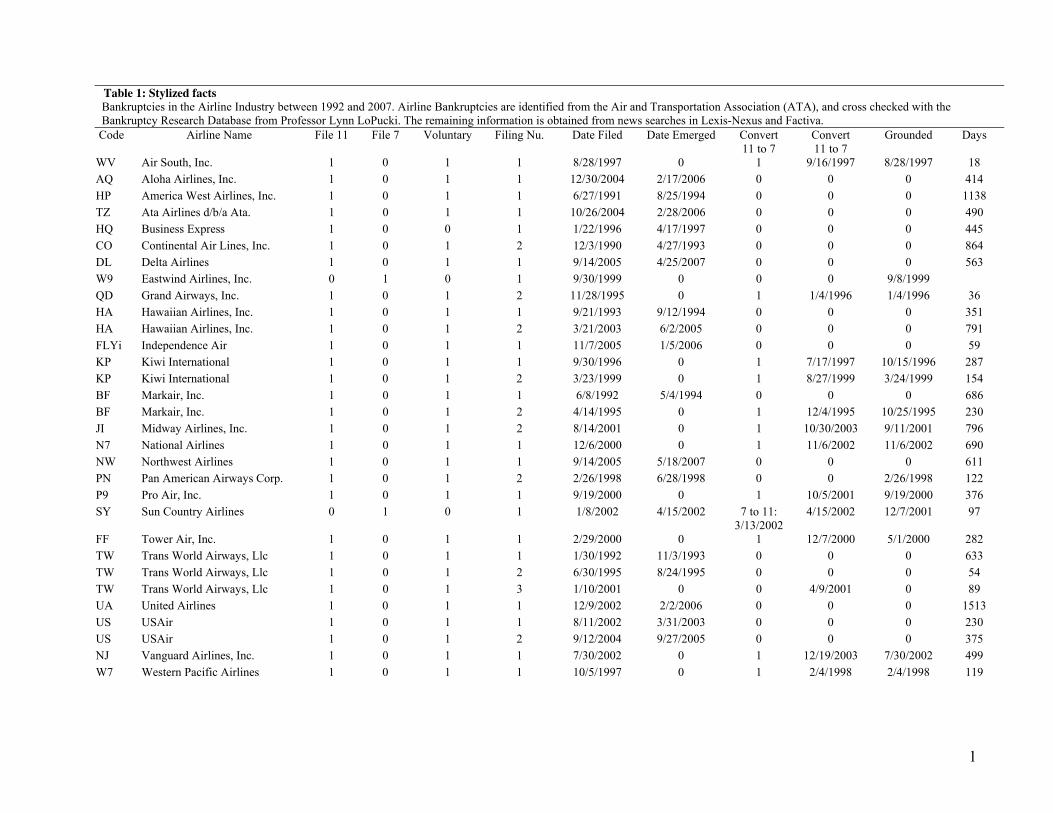
1
Table 1: Stylized facts
Bankruptcies in the Airline Industry between 1992 and 2007. Airline Bankruptcies are identified from the Air and Transportation Association (ATA), and cross checked with the Bankruptcy Research Database from Professor Lynn LoPucki. The remaining information is obtained from news searches in Lexis-Nexus and Factiva.
Code Airline Name File 11 File 7 Voluntary Filing Nu. Date Filed Date Emerged Convert 11 to 7
Convert 11 to 7
Grounded Days
WV Air South, Inc. 1 0 1 1 8/28/1997 0 1 9/16/1997 8/28/1997 18
AQ Aloha Airlines, Inc. 1 0 1 1 12/30/2004 2/17/2006 0 0 0 414
HP America West Airlines, Inc. 1 0 1 1 6/27/1991 8/25/1994 0 0 0 1138
TZ Ata Airlines d/b/a Ata. 1 0 1 1 10/26/2004 2/28/2006 0 0 0 490
HQ Business Express 1 0 0 1 1/22/1996 4/17/1997 0 0 0 445
CO Continental Air Lines, Inc. 1 0 1 2 12/3/1990 4/27/1993 0 0 0 864
DL Delta Airlines 1 0 1 1 9/14/2005 4/25/2007 0 0 0 563
W9 Eastwind Airlines, Inc. 0 1 0 1 9/30/1999 0 0 0 9/8/1999
QD Grand Airways, Inc. 1 0 1 2 11/28/1995 0 1 1/4/1996 1/4/1996 36
HA Hawaiian Airlines, Inc. 1 0 1 1 9/21/1993 9/12/1994 0 0 0 351
HA Hawaiian Airlines, Inc. 1 0 1 2 3/21/2003 6/2/2005 0 0 0 791
FLYi Independence Air 1 0 1 1 11/7/2005 1/5/2006 0 0 0 59
KP Kiwi International 1 0 1 1 9/30/1996 0 1 7/17/1997 10/15/1996 287
KP Kiwi International 1 0 1 2 3/23/1999 0 1 8/27/1999 3/24/1999 154
BF Markair, Inc. 1 0 1 1 6/8/1992 5/4/1994 0 0 0 686
BF Markair, Inc. 1 0 1 2 4/14/1995 0 1 12/4/1995 10/25/1995 230
JI Midway Airlines, Inc. 1 0 1 2 8/14/2001 0 1 10/30/2003 9/11/2001 796
N7 National Airlines 1 0 1 1 12/6/2000 0 1 11/6/2002 11/6/2002 690
NW Northwest Airlines 1 0 1 1 9/14/2005 5/18/2007 0 0 0 611
PN Pan American Airways Corp. 1 0 1 2 2/26/1998 6/28/1998 0 0 2/26/1998 122
P9 Pro Air, Inc. 1 0 1 1 9/19/2000 0 1 10/5/2001 9/19/2000 376
SY Sun Country Airlines 0 1 0 1 1/8/2002 4/15/2002 7 to 11: 3/13/2002
4/15/2002 12/7/2001 97
FF Tower Air, Inc. 1 0 1 1 2/29/2000 0 1 12/7/2000 5/1/2000 282
TW Trans World Airways, Llc 1 0 1 1 1/30/1992 11/3/1993 0 0 0 633
TW Trans World Airways, Llc 1 0 1 2 6/30/1995 8/24/1995 0 0 0 54
TW Trans World Airways, Llc 1 0 1 3 1/10/2001 0 0 4/9/2001 0 89
UA United Airlines 1 0 1 1 12/9/2002 2/2/2006 0 0 0 1513
US USAir 1 0 1 1 8/11/2002 3/31/2003 0 0 0 230
US USAir 1 0 1 2 9/12/2004 9/27/2005 0 0 0 375
NJ Vanguard Airlines, Inc. 1 0 1 1 7/30/2002 0 1 12/19/2003 7/30/2002 499
W7 Western Pacific Airlines 1 0 1 1 10/5/1997 0 1 2/4/1998 2/4/1998 119
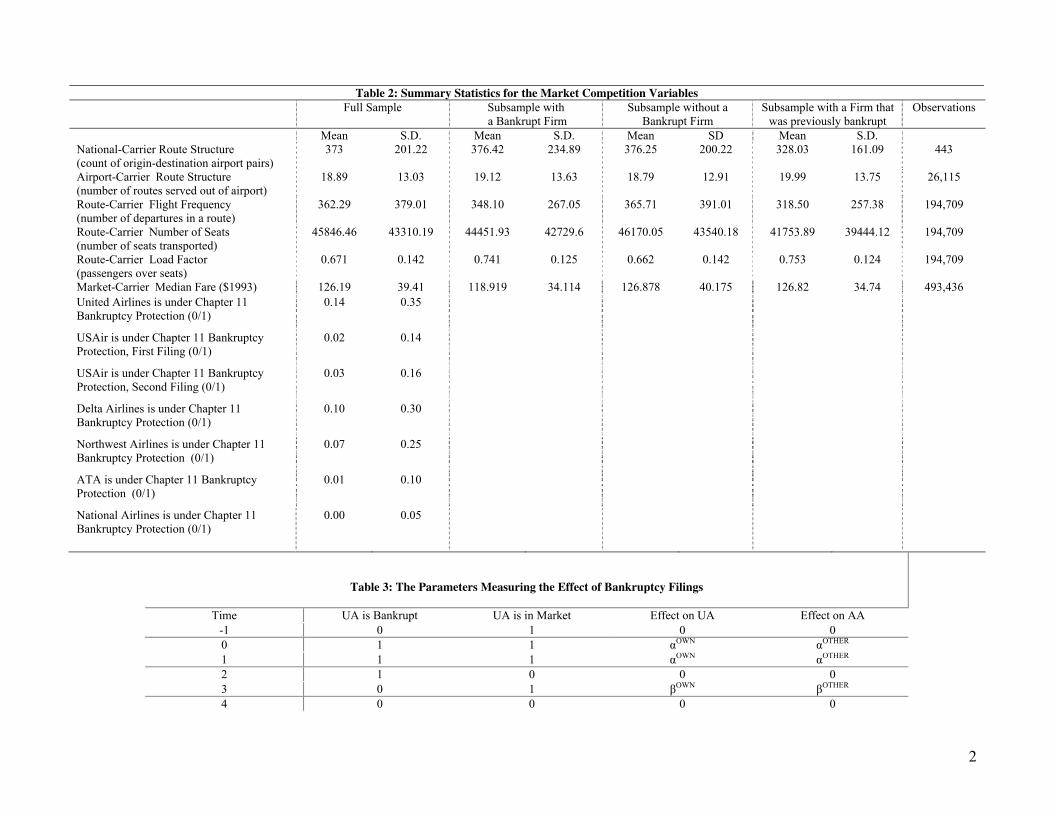
2
Table 2: Summary Statistics for the Market Competition Variables
Full Sample Subsample with a Bankrupt Firm
Subsample without a Bankrupt Firm
Subsample with a Firm that was previously bankrupt
Observations
Mean S.D. Mean S.D. Mean SD Mean S.D. National-Carrier Route Structure (count of origin-destination airport pairs)
373 201.22 376.42 234.89 376.25 200.22 328.03 161.09 443
Airport-Carrier Route Structure (number of routes served out of airport)
18.89 13.03 19.12 13.63 18.79 12.91 19.99 13.75 26,115
Route-Carrier Flight Frequency (number of departures in a route)
362.29 379.01 348.10 267.05 365.71 391.01 318.50 257.38 194,709
Route-Carrier Number of Seats (number of seats transported)
45846.46 43310.19 44451.93 42729.6 46170.05 43540.18 41753.89 39444.12 194,709
Route-Carrier Load Factor (passengers over seats)
0.671 0.142 0.741 0.125 0.662 0.142 0.753 0.124 194,709
Market-Carrier Median Fare ($1993) 126.19 39.41 118.919 34.114 126.878 40.175 126.82 34.74 493,436
United Airlines is under Chapter 11 Bankruptcy Protection (0/1)
0.14 0.35
USAir is under Chapter 11 Bankruptcy Protection, First Filing (0/1)
0.02 0.14
USAir is under Chapter 11 Bankruptcy Protection, Second Filing (0/1)
0.03 0.16
Delta Airlines is under Chapter 11 Bankruptcy Protection (0/1)
0.10 0.30
Northwest Airlines is under Chapter 11 Bankruptcy Protection (0/1)
0.07 0.25
ATA is under Chapter 11 Bankruptcy Protection (0/1)
0.01 0.10
National Airlines is under Chapter 11 Bankruptcy Protection (0/1)
0.00 0.05
Table 3: The Parameters Measuring the Effect of Bankruptcy Filings
Time UA is Bankrupt UA is in Market Effect on UA Effect on AA
-1 0 1 0 0
0 1 1 αOWN αOTHER
1 1 1 αOWN αOTHER
2 1 0 0 0
3 0 1 βOWN βOTHER
4 0 0 0 0
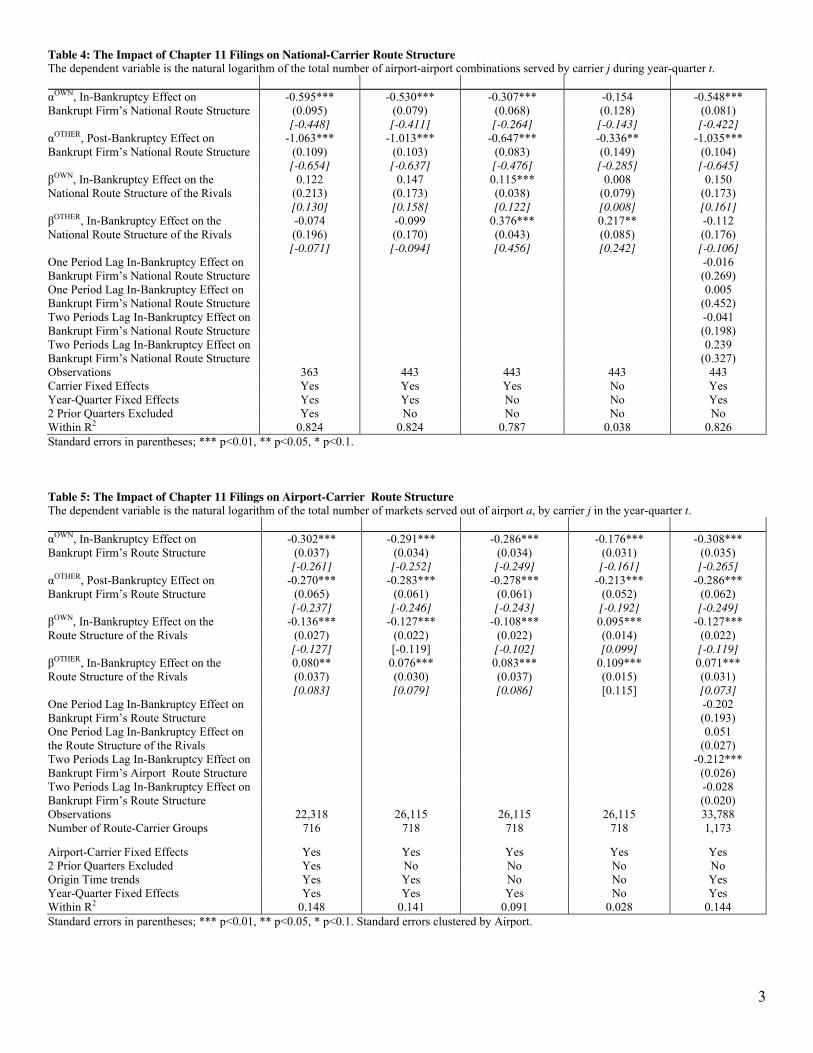
3
Table 4: The Impact of Chapter 11 Filings on National-Carrier Route Structure
The dependent variable is the natural logarithm of the total number of airport-airport combinations served by carrier j during year-quarter t.
αOWN, In-Bankruptcy Effect on -0.595*** -0.530*** -0.307*** -0.154 -0.548*** Bankrupt Firm’s National Route Structure (0.095)
[-0.448]
(0.079) [-0.411]
(0.068) [-0.264]
(0.128) [-0.143]
(0.081) [-0.422]
αOTHER, Post-Bankruptcy Effect on -1.063*** -1.013*** -0.647*** -0.336** -1.035*** Bankrupt Firm’s National Route Structure (0.109)
[-0.654]
(0.103) [-0.637]
(0.083) [-0.476]
(0.149) [-0.285]
(0.104) [-0.645]
βOWN, In-Bankruptcy Effect on the 0.122 0.147 0.115*** 0.008 0.150 National Route Structure of the Rivals (0.213)
[0.130]
(0.173) [0.158]
(0.038) [0.122]
(0.079) [0.008]
(0.173) [0.161]
βOTHER, In-Bankruptcy Effect on the -0.074 -0.099 0.376*** 0.217** -0.112 National Route Structure of the Rivals (0.196)
[-0.071]
(0.170) [-0.094]
(0.043) [0.456]
(0.085) [0.242]
(0.176) [-0.106]
One Period Lag In-Bankruptcy Effect on Bankrupt Firm’s National Route Structure
-0.016 (0.269)
One Period Lag In-Bankruptcy Effect on Bankrupt Firm’s National Route Structure
0.005 (0.452)
Two Periods Lag In-Bankruptcy Effect on Bankrupt Firm’s National Route Structure
-0.041 (0.198)
Two Periods Lag In-Bankruptcy Effect on Bankrupt Firm’s National Route Structure
0.239 (0.327)
Observations 363 443 443 443 443 Carrier Fixed Effects Yes Yes Yes No Yes Year-Quarter Fixed Effects Yes Yes No No Yes 2 Prior Quarters Excluded Yes No No No No Within R2 0.824 0.824 0.787 0.038 0.826
Standard errors in parentheses; *** p<0.01, ** p<0.05, * p<0.1.
Table 5: The Impact of Chapter 11 Filings on Airport-Carrier Route Structure
The dependent variable is the natural logarithm of the total number of markets served out of airport a, by carrier j in the year-quarter t.
αOWN, In-Bankruptcy Effect on -0.302*** -0.291*** -0.286*** -0.176*** -0.308*** Bankrupt Firm’s Route Structure (0.037)
[-0.261]
(0.034) [-0.252]
(0.034) [-0.249]
(0.031) [-0.161]
(0.035) [-0.265]
αOTHER, Post-Bankruptcy Effect on -0.270*** -0.283*** -0.278*** -0.213*** -0.286*** Bankrupt Firm’s Route Structure (0.065)
[-0.237]
(0.061) [-0.246]
(0.061) [-0.243]
(0.052) [-0.192]
(0.062) [-0.249]
βOWN, In-Bankruptcy Effect on the -0.136*** -0.127*** -0.108*** 0.095*** -0.127*** Route Structure of the Rivals (0.027)
[-0.127]
(0.022) [-0.119]
(0.022) [-0.102]
(0.014) [0.099]
(0.022) [-0.119]
βOTHER, In-Bankruptcy Effect on the 0.080** 0.076*** 0.083*** 0.109*** 0.071*** Route Structure of the Rivals (0.037)
[0.083] (0.030) [0.079]
(0.037) [0.086]
(0.015) [0.115]
(0.031) [0.073]
One Period Lag In-Bankruptcy Effect on Bankrupt Firm’s Route Structure
-0.202 (0.193)
One Period Lag In-Bankruptcy Effect on the Route Structure of the Rivals
0.051 (0.027)
Two Periods Lag In-Bankruptcy Effect on Bankrupt Firm’s Airport Route Structure
-0.212*** (0.026)
Two Periods Lag In-Bankruptcy Effect on Bankrupt Firm’s Route Structure
-0.028 (0.020)
Observations 22,318 26,115 26,115 26,115 33,788 Number of Route-Carrier Groups 716 718 718 718 1,173
Airport-Carrier Fixed Effects Yes Yes Yes Yes Yes 2 Prior Quarters Excluded Yes No No No No Origin Time trends Yes Yes No No Yes Year-Quarter Fixed Effects Yes Yes Yes No Yes Within R2 0.148 0.141 0.091 0.028 0.144
Standard errors in parentheses; *** p<0.01, ** p<0.05, * p<0.1. Standard errors clustered by Airport.
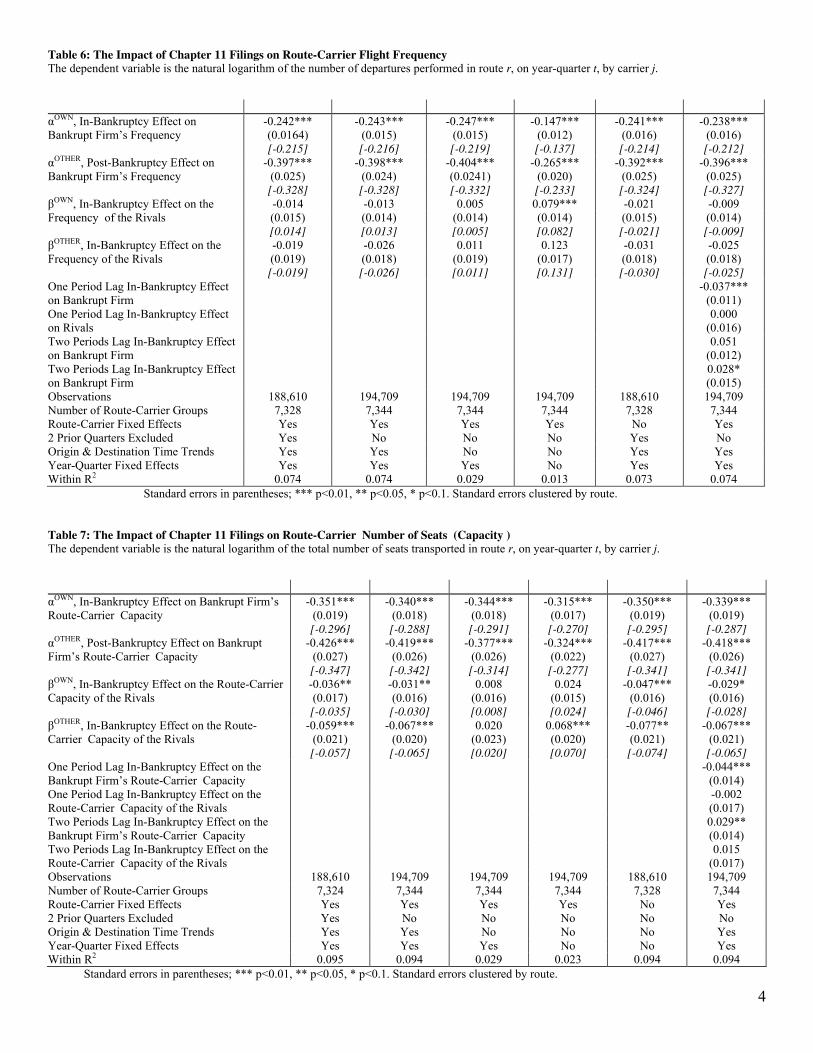
4
Table 6: The Impact of Chapter 11 Filings on Route-Carrier Flight Frequency
The dependent variable is the natural logarithm of the number of departures performed in route r, on year-quarter t, by carrier j.
αOWN, In-Bankruptcy Effect on -0.242*** -0.243*** -0.247*** -0.147*** -0.241*** -0.238*** Bankrupt Firm’s Frequency (0.0164)
[-0.215] (0.015) [-0.216]
(0.015) [-0.219]
(0.012) [-0.137]
(0.016) [-0.214]
(0.016) [-0.212]
αOTHER, Post-Bankruptcy Effect on -0.397*** -0.398*** -0.404*** -0.265*** -0.392*** -0.396*** Bankrupt Firm’s Frequency (0.025)
[-0.328] (0.024) [-0.328]
(0.0241) [-0.332]
(0.020) [-0.233]
(0.025) [-0.324]
(0.025) [-0.327]
βOWN, In-Bankruptcy Effect on the -0.014 -0.013 0.005 0.079*** -0.021 -0.009 Frequency of the Rivals (0.015)
[0.014]
(0.014) [0.013]
(0.014) [0.005]
(0.014) [0.082]
(0.015) [-0.021]
(0.014) [-0.009]
βOTHER, In-Bankruptcy Effect on the -0.019 -0.026 0.011 0.123 -0.031 -0.025 Frequency of the Rivals (0.019)
[-0.019]
(0.018) [-0.026]
(0.019) [0.011]
(0.017) [0.131]
(0.018) [-0.030]
(0.018) [-0.025]
One Period Lag In-Bankruptcy Effect on Bankrupt Firm
-0.037*** (0.011)
One Period Lag In-Bankruptcy Effect on Rivals
0.000 (0.016)
Two Periods Lag In-Bankruptcy Effect on Bankrupt Firm
0.051 (0.012)
Two Periods Lag In-Bankruptcy Effect on Bankrupt Firm
0.028* (0.015)
Observations 188,610 194,709 194,709 194,709 188,610 194,709 Number of Route-Carrier Groups 7,328 7,344 7,344 7,344 7,328 7,344 Route-Carrier Fixed Effects Yes Yes Yes Yes No Yes 2 Prior Quarters Excluded Yes No No No Yes No Origin & Destination Time Trends Yes Yes No No Yes Yes Year-Quarter Fixed Effects Yes Yes Yes No Yes Yes Within R2 0.074 0.074 0.029 0.013 0.073 0.074
Standard errors in parentheses; *** p<0.01, ** p<0.05, * p<0.1. Standard errors clustered by route.
Table 7: The Impact of Chapter 11 Filings on Route-Carrier Number of Seats (Capacity )
The dependent variable is the natural logarithm of the total number of seats transported in route r, on year-quarter t, by carrier j.
αOWN, In-Bankruptcy Effect on Bankrupt Firm’s Route-Carrier Capacity
-0.351*** (0.019) [-0.296]
-0.340*** (0.018) [-0.288]
-0.344*** (0.018) [-0.291]
-0.315*** (0.017) [-0.270]
-0.350*** (0.019) [-0.295]
-0.339*** (0.019) [-0.287]
αOTHER, Post-Bankruptcy Effect on Bankrupt Firm’s Route-Carrier Capacity
-0.426*** (0.027) [-0.347]
-0.419*** (0.026) [-0.342]
-0.377*** (0.026) [-0.314]
-0.324*** (0.022) [-0.277]
-0.417*** (0.027) [-0.341]
-0.418*** (0.026) [-0.341]
βOWN, In-Bankruptcy Effect on the Route-Carrier Capacity of the Rivals
-0.036** (0.017) [-0.035]
-0.031** (0.016) [-0.030]
0.008 (0.016) [0.008]
0.024 (0.015) [0.024]
-0.047*** (0.016) [-0.046]
-0.029* (0.016) [-0.028]
βOTHER, In-Bankruptcy Effect on the Route-Carrier Capacity of the Rivals
-0.059*** (0.021) [-0.057]
-0.067*** (0.020) [-0.065]
0.020 (0.023) [0.020]
0.068*** (0.020) [0.070]
-0.077** (0.021) [-0.074]
-0.067*** (0.021) [-0.065]
One Period Lag In-Bankruptcy Effect on the Bankrupt Firm’s Route-Carrier Capacity
-0.044*** (0.014)
One Period Lag In-Bankruptcy Effect on the Route-Carrier Capacity of the Rivals
-0.002 (0.017)
Two Periods Lag In-Bankruptcy Effect on the Bankrupt Firm’s Route-Carrier Capacity
0.029** (0.014)
Two Periods Lag In-Bankruptcy Effect on the Route-Carrier Capacity of the Rivals
0.015 (0.017)
Observations 188,610 194,709 194,709 194,709 188,610 194,709 Number of Route-Carrier Groups 7,324 7,344 7,344 7,344 7,328 7,344 Route-Carrier Fixed Effects Yes Yes Yes Yes No Yes 2 Prior Quarters Excluded Yes No No No No No Origin & Destination Time Trends Yes Yes No No No Yes Year-Quarter Fixed Effects Yes Yes Yes No No Yes Within R2 0.095 0.094 0.029 0.023 0.094 0.094
Standard errors in parentheses; *** p<0.01, ** p<0.05, * p<0.1. Standard errors clustered by route.
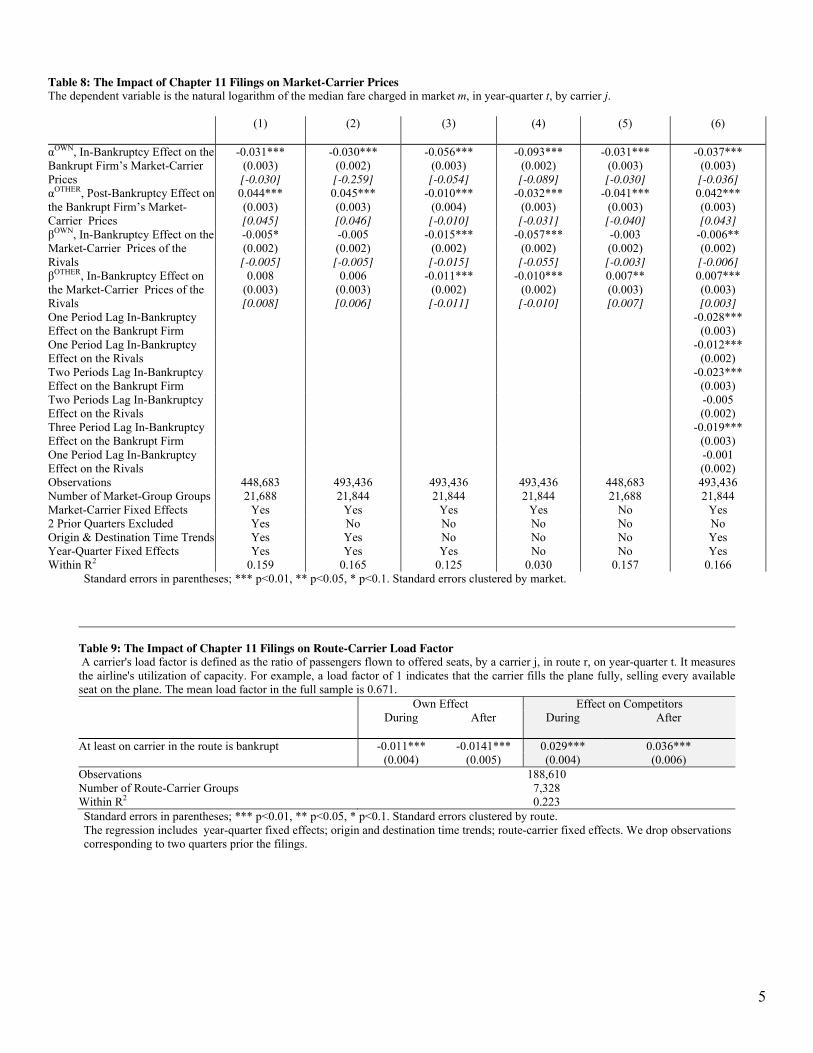
5
Table 8: The Impact of Chapter 11 Filings on Market-Carrier Prices
The dependent variable is the natural logarithm of the median fare charged in market m, in year-quarter t, by carrier j.
(1) (2) (3) (4) (5) (6)
αOWN, In-Bankruptcy Effect on the Bankrupt Firm’s Market-Carrier Prices
-0.031*** (0.003) [-0.030]
-0.030*** (0.002) [-0.259]
-0.056*** (0.003) [-0.054]
-0.093*** (0.002) [-0.089]
-0.031*** (0.003) [-0.030]
-0.037*** (0.003) [-0.036]
αOTHER, Post-Bankruptcy Effect on 0.044*** 0.045*** -0.010*** -0.032*** -0.041*** 0.042*** the Bankrupt Firm’s Market-Carrier Prices
(0.003) [0.045]
(0.003) [0.046]
(0.004) [-0.010]
(0.003) [-0.031]
(0.003) [-0.040]
(0.003) [0.043]
βOWN, In-Bankruptcy Effect on the -0.005* -0.005 -0.015*** -0.057*** -0.003 -0.006** Market-Carrier Prices of the Rivals
(0.002) [-0.005]
(0.002) [-0.005]
(0.002) [-0.015]
(0.002) [-0.055]
(0.002) [-0.003]
(0.002) [-0.006]
βOTHER, In-Bankruptcy Effect on the Market-Carrier Prices of the Rivals
0.008 (0.003) [0.008]
0.006 (0.003) [0.006]
-0.011*** (0.002) [-0.011]
-0.010*** (0.002) [-0.010]
0.007** (0.003) [0.007]
0.007*** (0.003) [0.003]
One Period Lag In-Bankruptcy Effect on the Bankrupt Firm
-0.028*** (0.003)
One Period Lag In-Bankruptcy Effect on the Rivals
-0.012*** (0.002)
Two Periods Lag In-Bankruptcy Effect on the Bankrupt Firm
-0.023*** (0.003)
Two Periods Lag In-Bankruptcy Effect on the Rivals
-0.005 (0.002)
Three Period Lag In-Bankruptcy Effect on the Bankrupt Firm
-0.019*** (0.003)
One Period Lag In-Bankruptcy Effect on the Rivals
-0.001 (0.002)
Observations 448,683 493,436 493,436 493,436 448,683 493,436 Number of Market-Group Groups 21,688 21,844 21,844 21,844 21,688 21,844 Market-Carrier Fixed Effects Yes Yes Yes Yes No Yes 2 Prior Quarters Excluded Yes No No No No No Origin & Destination Time Trends Yes Yes No No No Yes Year-Quarter Fixed Effects Yes Yes Yes No No Yes Within R2 0.159 0.165 0.125 0.030 0.157 0.166
Standard errors in parentheses; *** p<0.01, ** p<0.05, * p<0.1. Standard errors clustered by market.
Table 9: The Impact of Chapter 11 Filings on Route-Carrier Load Factor
A carrier's load factor is defined as the ratio of passengers flown to offered seats, by a carrier j, in route r, on year-quarter t. It measures the airline's utilization of capacity. For example, a load factor of 1 indicates that the carrier fills the plane fully, selling every available seat on the plane. The mean load factor in the full sample is 0.671.
Own Effect Effect on Competitors During After During After
At least on carrier in the route is bankrupt -0.011*** -0.0141*** 0.029*** 0.036*** (0.004) (0.005) (0.004) (0.006)
Observations 188,610 Number of Route-Carrier Groups 7,328 Within R2 0.223
Standard errors in parentheses; *** p<0.01, ** p<0.05, * p<0.1. Standard errors clustered by route. The regression includes year-quarter fixed effects; origin and destination time trends; route-carrier fixed effects. We drop observations corresponding to two quarters prior the filings.
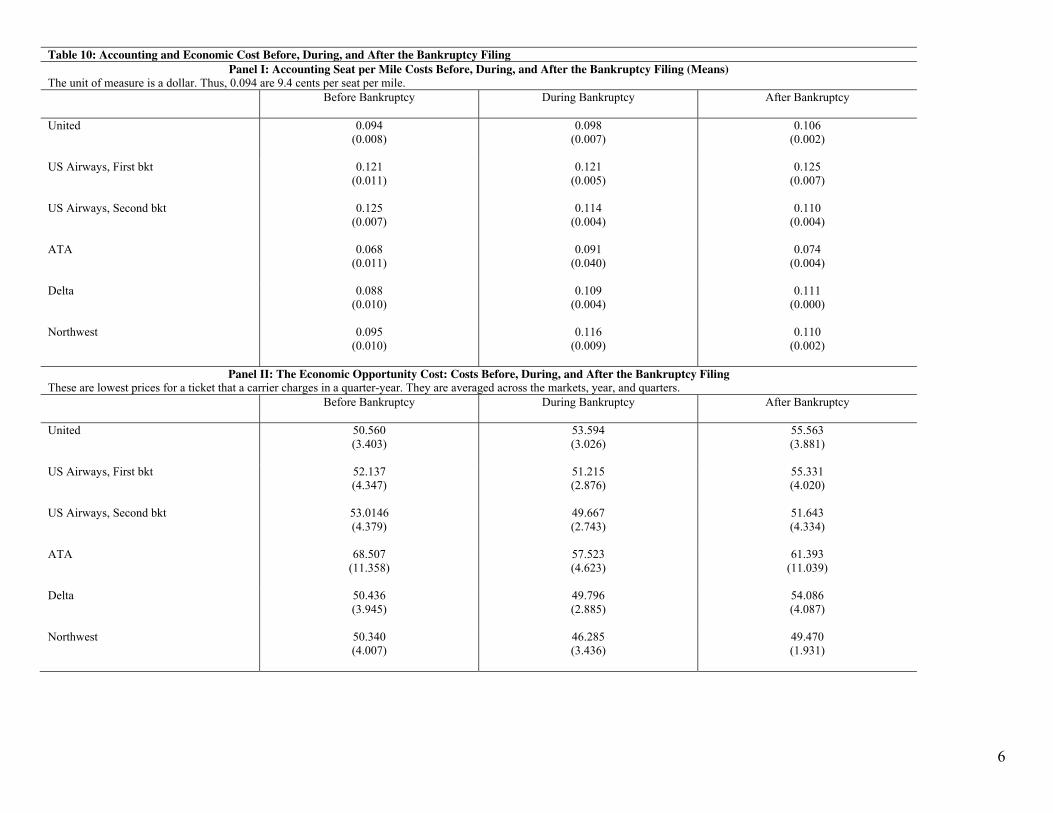
6
Table 10: Accounting and Economic Cost Before, During, and After the Bankruptcy Filing
Panel I: Accounting Seat per Mile Costs Before, During, and After the Bankruptcy Filing (Means)
The unit of measure is a dollar. Thus, 0.094 are 9.4 cents per seat per mile.
Before Bankruptcy During Bankruptcy After Bankruptcy
United 0.094 (0.008)
0.098 (0.007)
0.106 (0.002)
US Airways, First bkt 0.121
(0.011) 0.121
(0.005) 0.125
(0.007)
US Airways, Second bkt 0.125 (0.007)
0.114 (0.004)
0.110 (0.004)
ATA 0.068
(0.011) 0.091
(0.040) 0.074
(0.004)
Delta 0.088 (0.010)
0.109 (0.004)
0.111 (0.000)
Northwest 0.095
(0.010) 0.116
(0.009) 0.110
(0.002)
Panel II: The Economic Opportunity Cost: Costs Before, During, and After the Bankruptcy Filing
These are lowest prices for a ticket that a carrier charges in a quarter-year. They are averaged across the markets, year, and quarters.
Before Bankruptcy During Bankruptcy After Bankruptcy
United 50.560 (3.403)
53.594 (3.026)
55.563 (3.881)
US Airways, First bkt 52.137
(4.347) 51.215 (2.876)
55.331 (4.020)
US Airways, Second bkt 53.0146 (4.379)
49.667 (2.743)
51.643 (4.334)
ATA 68.507
(11.358) 57.523 (4.623)
61.393 (11.039)
Delta 50.436
(3.945) 49.796 (2.885)
54.086 (4.087)
Northwest 50.340
(4.007) 46.285 (3.436)
49.470 (1.931)