Embed Size (px)
Citation preview
NBER WORKING PAPER SERIES
DOES THE STRUCTURE OF BANKING MARKETS AFFECT ECONOMIC GROWTH?EVIDENCE FROM U.S. STATE BANKING MARKETS
Kris James MitchenerDavid C. Wheelock
Working Paper 15710http://www.nber.org/papers/w15710
NATIONAL BUREAU OF ECONOMIC RESEARCH1050 Massachusetts Avenue
Cambridge, MA 02138January 2010
We thank participants in the 2009 NBER Summer Institute workshop on the Development of the AmericanEconomy and the Federal Reserve System Research Committee on Financial Structure and Regulation(especially Mark Vaughan) for comments on previous versions of this paper, and Nilisha Agrawal,Craig Aubuchon, Lydia Fung, and Daniel McDonald for excellent research assistance. Mitchener acknowledgesthe generous financial support of the Hoover Institution while in residence as the W. Glenn Campbelland Rita Ricardo-Campbell National Fellow. The views expressed herein are those of the authors anddo not necessarily reflect the views of the National Bureau of Economic Research.
NBER working papers are circulated for discussion and comment purposes. They have not been peer-reviewed or been subject to the review by the NBER Board of Directors that accompanies officialNBER publications.
© 2010 by Kris James Mitchener and David C. Wheelock. All rights reserved. Short sections of text,not to exceed two paragraphs, may be quoted without explicit permission provided that full credit,including © notice, is given to the source.
Does the Structure of Banking Markets Affect Economic Growth? Evidence from U.S. StateBanking MarketsKris James Mitchener and David C. WheelockNBER Working Paper No. 15710January 2010JEL No. E44,G21,G38,N11,N12,N21,N22,O16,O47
ABSTRACT
This paper examines the relationship between the structure of banking markets and economic growthusing a new dataset on manufacturing industry-level growth rates and banking market concentrationfor U.S. states during 1899-1929—a period when the manufacturing sector was expanding rapidlyand restrictive branching laws segmented the U.S. banking system geographically. Unlike studies ofmodern developing and developed countries, we find that banking market concentration had a positiveimpact on manufacturing sector growth in the early twentieth century, with little variation across industrieswith different degrees of dependence on external financing or access to capital. However, becauseregulations affecting bank entry varied considerably across U.S. states and the industrial organizationof the U.S. banking system differs markedly from those of other countries, we also examine the impactof other aspects of banking market structure and policy on growth. We continue to find that bankingmarket concentration boosted industrial growth. In addition, we find evidence that a greater prevalenceof branch banking and more banks per capita increased the growth of industries that rely relativelyheavily on external financing or have greater access to external funding sources, while deposit insurancedepressed growth in the manufacturing sector. Regulations on bank entry and other banking marketcharacteristics thus appear to exert an independent influence on manufacturing growth in geographicallyfragmented banking markets.
Kris James MitchenerDepartment of EconomicsLeavey School of BusinessSanta Clara UniversitySanta Clara, CA 95053and [email protected]
David C. WheelockResearch DivisionFederal Reserve Bank of St. LouisP.O. Box 442St. Louis, MO [email protected]
1
Does the Structure of Banking Markets Affect Economic Growth? Evidence from U.S. State Banking Markets
A long line of scholarship posits a causal relationship between finance and economic
growth.1 According to this view, well-developed capital markets—especially those imbued with
rights that protect investors—promote the efficient allocation of capital to projects with high
rates of return, in turn stimulating savings, investment, and economic growth.2 Evidence from
both single-country and cross-country studies suggests that economies with more developed
financial markets begin to grow earlier, attain higher growth rates, and achieve higher levels of
per capita income than countries with less developed financial markets.3 These findings have
prompted researchers to consider more carefully how financial markets affect real economic
activity in the long run. For example, in an important paper that exploits cross-country and cross-
industry differences, Rajan and Zingales (1998) conclude that financial development helps firms
surmount moral hazard and adverse selection problems and hence reduces the costs of external
finance to firms.
Many empirical studies have followed Rajan and Zingales (1998) in exploiting
differences across space and time to identify a causal link between finance and development, and
recent research has focused on the mechanisms underlying this relationship. The present paper
contributes to a growing body of literature that examines how banking institutions influence
economic activity. Financial intermediaries are thought to improve resource allocation and fund
projects with higher rates of return by efficiently matching borrowers and lenders and by
monitoring firm behavior (Allen, 1990; Boyd and Prescott, 1986; Greenwood and Jovanovic,
1990; Kashyap et al., 2002; King and Levine, 1993b). Researchers have found considerable
evidence that banking system structure and competition affect economic growth. For example,
based on a cross-section sample of 41 countries for 1980-90, Cetorelli and Gambera (2001) find
that banking market concentration depresses the aggregate growth of the industrial sector, but
boosts the growth of industries that depend relatively heavily on external sources of finance.
Similarly, based on data for regional banking markets in Italy, Bonaccorsi di Patti and
Dell’Ariccia (2004) find that banking market concentration promotes firm creation in industries 1 Recent examples include Beck et al. (2000), Bekaert et al. (2005), King and Levine (1993a, b), Levine and Zervos (1998), and Rajan and Zingales (1998). 2 On the importance of legal traditions influencing financial development, see La Porta et al. (1998, 2000). 3 For surveys of this literature, see Levine (1997, 2003) and Demirgüç-Kunt and Levine (2001). For a within-country example, see Guiso, Sapienza, and Zingales (2004).
2
where the creditworthiness of entrepreneurs is difficult to assess.4 By contrast, Claessens and
Laeven (2005) find that increased competition in banking markets raises the growth of industries
that depend relatively heavily on external financing, though Hoxha (2009) reaches the opposite
conclusion using a somewhat different model and dataset.
With a few exceptions, most empirical studies of the impact of banking market structure
or competition on economic activity assume that each country consists of a single national
banking market. That assumption might be tenable for banking systems that are dominated by a
few large banks with nationwide branch networks. However, the banking systems of countries
with a tradition of unit banking, such as the United States, consist of more geographically
segmented banking markets. Long-standing legal restrictions on both interstate branching and
branching within the borders of most states left the United States with highly fragmented local
banking markets that only recently have become well integrated.5 Although most legal barriers to
branching within and across state lines were eliminated in the 1990s, compared with most
countries, the United States still has a very unconcentrated banking market when measured at the
national level.6 Because of the unusual structure of the U.S. banking system, the findings of
Cetorelli and Gambera (2001) and other studies that examine the impact of banking market
structure on economic development using countries as the unit of observation might not reflect
the U.S. experience.7
To determine whether the findings of cross-country studies generalize to a geographically
segmented banking environment, the present paper investigates the impact of banking market
concentration on the growth of manufacturing industries across U.S. states during the first three
decades of the twentieth century—a period when firms relied heavily on bank financing and 4 Bonaccorsi di Patti and Dell’Ariccia (2004) also find that an increase in concentration raises the rate of entrepreneurship across all industries when banking markets are relatively unconcentrated ex ante, but reduces the overall rate of firm creation when banking markets are already highly concentrated. Guiso, Sapienza, and Zingales (2006) find that resrictions to competition across Italian provinces influence the provision of credit, and where the costs of entry were higher access to credit was lower. 5 The Interstate Banking and Branching Efficiency Act of 1994 permitted interstate branching beginning in 1997. Before then, state laws determined the extent to which banks could branch within states. Several states eased restrictions on branching between 1900 and 1929. A second deregulation wave occurred in the 1970s and 1980s. For purposes of evaluating the competitive implications of proposed bank mergers, U.S. bank regulators define most banking markets at the metropolitan statistical area or county level. Gilbert and Zaretsky (2003) survey the literature evaluating the assumptions regulators use in defining U.S. banking markets. 6 The average three- and five-bank concentration ratios for the United States during 1989-96 were 0.15 and 0.20, respectively. Three-bank ratios for other countries ranged between 0.21 (Japan) and 0.87 (Jordan), and five-bank ratios ranged between 0.32 (Japan) and 0.99 (New Zealand) (Cetorelli and Gambera, 2001, Table 1). 7 Other studies that examine banking market competition and structure at the national level include Barth, Caprio, and Levine (2004), Claessens and Laeven (2004; 2005), and Demirgüç-Kunt, Laeven, and Levine (2004).
3
branching regulations resulted in geographically segmented banking markets. Because the
structure of the U.S. banking system today is evolving rapidly in response to the removal of most
branching restrictions, as well as because of the recent financial crisis and recession, we focus on
a period when interstate branching was prohibited and many states restricted branching within
their boundaries. In addition, because concentration is not necessarily an accurate measure of
competition in contestable markets and state-level concentration measures are unlikely to
adequately capture differences in banking competition across states with different bank
regulations, we also examine explicitly how various state banking policies and other aspects of
market structure affected the growth of manufacturing industries.8 Although we cannot measure
precisely the level of competition in state banking markets in the early twentieth century because
the requisite data to calculate a Panzar and Rosse (1987) H-statistic and similar measures are
unavailable, the heterogeneity in concentration and policies affecting the competitive
environment of state banking markets can provide evidence on the effects of banking market
structure and regulation on industrial growth.
Our study exploits the variation in growth rates across manufacturing industries and
across states, as well as differences in the structure and regulation of U.S. state banking markets.
By contrast, previous studies that examine the effects of regional variation in U.S. banking
markets focused only on the effects of bank regulation or market structure on aggregate growth
rates. For example, several studies investigate the impact of branch banking regulations on state
per capita income growth (e.g., Abrams, Clark, and Settle, 1999; Clarke, 2004; Freeman, 2002;
Garrett, Wagner, and Wheelock, 2007; Jayaratne and Strahan, 1996) or the rate of new business
incorporations (Black and Strahan, 2002; Wall, 2004). Using historical data, Dehejia and Lleras-
Muney (2007) examine the impact of branch banking and deposit insurance on economic
performance at the state level during 1900-40. They find that branching had an unambiguously
positive effect on bank loan growth, output of the agricultural and manufacturing sectors, and on
educational attainment, whereas deposit insurance had mixed effects.
8 Claessens and Laeven (2005) find a positive correlation between banking market concentration and competition, as measured by the Panzar and Rosse (1987) H-statistic, for a sample of 17 countries. And in a cross-country study, Hoxha (2009) finds that banking market concentration remains useful for explaining industrial growth in regressions that also include banking competition (measured by the H-statistic), suggesting that, to some degree, concentration and competition exert independent influences on economic growth. Furthermore, changes in regulation might also alter the empirical relationship between bank concentration and economic activity. For example, Black and Strahan (2002) find that branching deregulation reduced the negative impact of bank market concentration on the rate of new business incorporation.
4
Following the finance literature, we take advantage of our within-country sample to
explore more deeply how banking market structure affects growth across industries that differ in
terms of technology or access to external funding sources. We find (1) that concentration in
banking markets had a positive impact on the growth of manufacturing industries in general, and
(2) no evidence that the impact varied across industries with different degrees of reliance on
external financing. By contrast, we find evidence that more banks per capita and branch banking
increased growth rates among industries that rely relatively heavily on external financing. In
addition, we find that state deposit insurance systems depressed growth of manufacturing
industries.
The next section of the paper describes the U.S. unit banking environment in the first part
of the twentieth century and the role of banks in providing financing to firms in this era. Section
II provides some theoretical background about how banking market structure affects economic
growth, presents new data on the concentration of U.S. state banking markets in the early
twentieth century, and provides some preliminary evidence on how bank concentration affected
sector-specific and overall growth in manufacturing between 1899 and 1929. We compare our
results with previous studies that use samples consisting of modern developed and developing
countries. We suggest that the unit-banking structure of the United States could explain why our
results differ from those of previous studies. In Sections III and IV, we present estimates of
regressions that incorporate other determinants of the structure and competitiveness of state
banking markets, such as branch banking regulations, capital requirements, and deposit
insurance. We examine how these factors affected the growth rates of industries that differ in
terms of their underlying technologies or access to capital. Section V offers conclusions.
I. Firm Finance and Unit Banking
The development of deep and liquid debt and equity markets is often cited as a key
institutional innovation that encouraged the efficient allocation of financial capital to investment
projects and in turn spurred high rates of economic growth in the United States (Goldsmith,
1969; Gurley and Shaw, 1955; Rousseau and Sylla, 2005; Rousseau and Wachtel, 1998; Wachtel
and Rousseau, 1995). Indeed, recent empirical scholarship relies on this fact and uses the United
States as a benchmark to assess the development of financial systems in other countries
(Cetorelli and Gambera, 2001; Masten, et al. 2008; Rajan and Zingales, 1998; Raddatz, 2006).
5
However, the widespread use of capital markets by U.S. business enterprises emerged
gradually. Circa 1900, the market for long-term business credit was limited in scale and scope.
Whereas railroads and telegraph companies had long issued corporate bonds, electric utilities and
firms engaged in manufacturing or trade were just beginning to make use of debt and equity
markets. Moreover, only the largest enterprises issued debt and equity. Most other firms relied
on renewable short-term funds provided by banks or trade credit—even to finance longer-term
investment (Jacoby and Saulnier, 1947). Consequently, as of 1900, commercial banks held two-
thirds of the assets of all financial intermediaries (White, 1997, p. 85).
In the United States, both the federal government and state governments grant bank
charters. Federally chartered (i.e., “national”) banks are subject to federal regulation and
supervision, whereas state-chartered banks are subject to state-based regulations and
supervision.9 At the beginning of the twentieth century, federal banking laws and practices
prohibited national banks from operating branch offices. Similarly, the laws and practices of
most states prohibited branching by state-chartered banks. As a result, the U.S. banking system
consisted of thousands of relatively small unit banks. The United States had 12,427 commercial
banks in 1900, of which 3,731 held federal charters and 8,696 held state charters. Only 87 banks
operated any branches, and most of those had only one branch. The average national bank had
$1.3 million of total assets, whereas the average state bank had a mere $0.5 million.10 By
contrast, the banking systems of most other early industrializing nations were dominated by a
few large banks with extensive nationwide branch networks.11
Federal and state banking regulations began to change during the first decades of the
twentieth century. The Gold Standard Act of 1900 lowered capital requirements for national
banks, which prompted several states to lower the requirements for state-chartered banks.
Several states also established deposit insurance systems or eased restrictions on branching
during this period. The federal government responded by allowing national banks limited
9 State-chartered banks that are members of the Federal Reserve System are subject to supervision by both the Federal Reserve and state banking authorities. 10 Data on the number and total assets of banks are from Board of Governors (1959). Data on the number of banks with branch offices and the number of branches are from Board of Governors (1943, p. 297). 11 The number of banks per capita and average size of banks illustrate the unusual structure of the U.S. banking system. As of 1902, the United States had some 18 banks per 100,000 persons, whereas Canada, Germany, and the United Kingdom had 0.51, 0.22, and 0.18 banks per 100,000 persons, respectively (Grossman, 2007, Table 3.2). As of 1930, U.S. banks held an average of $2.63 million of deposits, whereas banks in Canada, Germany, and the United Kingdom held an average of $225.67 million, $8.27 million, and $601.26 million, respectively (Grossman, 2007, Table 3.4).

6
freedom to operate branch offices in states that permitted branching by state banks.12 By 1929,
751 banks, including 167 national banks, operated a total of 3,522 branches, although unit
banking continued to prevail in many states. Federal banking regulations applied nearly
uniformly to national banks in all states, but differences in state banking regulations and
supervisory systems caused state banking markets to vary widely in terms of entry opportunities
and thus competitive environment. Differences across states in branching laws, capital
requirements, state deposit insurance systems, and other banking market characteristics make the
U.S. states a particularly interesting laboratory for understanding how banking market structure
and policy affect economic growth.
II. Evidence on the Effects of Banking Market Concentration on Growth
As an initial step toward understanding the relationship between bank market structure
and economic activity, we first investigate the impact of concentration in state banking systems
on the growth of manufacturing industries in the first three decades of the twentieth century. As
noted earlier, previous studies have used national bank concentration ratios to investigate the
effects of banking market structure on industrial growth across countries. Our study focuses on
variation within a single country, the United States, which allows us to control better for
differences in financial development. Studies that examine cross-country variation, such as Rajan
and Zingales (1988) and Cetorelli and Gambera (2001), assume that financial development is
uniform within a country and attempt to identify cross-country differences. Following these and
other studies, we assume that the level of financial development is uniform within the United
States (although some of our fixed-effects specifications allow for the possibility that financial
development varied across states).
Table I provides new estimates of four-firm bank concentration ratios for U.S. states
based on total deposits for 1899, 1909, 1919, and 1929.13 In 1899, the four-firm concentration
ratio ranged from 0.09 to 0.60, with a mean of 0.27. Mean (and median) concentration declined
somewhat between 1899, 1909, and 1919 and then increased during the 1920s as the banking
12 The McFadden Act of 1927 permitted national banks to operate branches in states that allowed branching by state-chartered banks. National banks were not, however, permitted to participate in state deposit insurance systems. See White (1983) for information about the evolution of state and federal banking laws and practices during the first three decades of the 20th century. 13 We constructed a four-firm commercial bank concentration ratio for each state based on total deposits using data for individual banks from Polk’s Bankers Encyclopedia (various years) and total deposits from Board of Governors of the Federal Reserve System (1959). Our measure excludes data for mutual savings banks and other mutual savings institutions, which generally made few commercial loans.
7
industry began to consolidate, especially in states that eased branching restrictions. Figure 1
shows the regional patterns of banking market concentration in 1899 and 1929. In 1899 (Figure
1a), Delaware, Florida, Louisiana, Rhode Island, and several western states had the most
concentrated banking systems, whereas the Great Plains states and industrial northeastern states
tended to have the least concentrated systems. The banking systems of several states became
more concentrated between 1899 and 1929, including West Coast states, Georgia (which, like
California, was among the first to eliminate restrictions on branching), Massachusetts, and New
York. The banking systems of most northern plains states remained relatively unconcentrated
(Figure 1b).
Standard theories of industrial organization suggest that deviations from perfect
competition introduce inefficiencies which, in turn, can limit firms’ access to funds and thus
hinder economic growth. On the other hand, recent research suggests that monopoly power
might facilitate firms’ access to credit by giving banks an incentive to establish long-term
relationships with borrowers (Petersen and Rajan, 1995; Mayer, 1988). Further, Marquez (2002)
argues that banks are less capable of screening potential borrowers in competitive banking
markets, which increases lending to low-quality borrowers. This inefficiency can cause
equilibrium interest rates to be higher in banking markets composed of many small banks than in
markets dominated by a few large banks. Because theory yields ambiguous answers, the effect of
banking market competition on economic growth is ultimately an empirical question.
Our empirical strategy exploits state-level differences in growth rates across a variety of
manufacturing industries to examine how banking market structure and regulation influence
economic growth in countries with geographically segmented banking markets. The U.S.
manufacturing sector grew rapidly during the first decades of the twentieth century. The total
value added of the sector increased from $5.5 billion in 1899 to $30.6 billion in 1929, and
employment rose from 5.5 million to 10.7 million.14 To compare our results with those of earlier
studies such as Cetorelli and Gambera (2001), we first investigate the impact of banking market
concentration on the growth of manufacturing in general and across industries with different
degrees of reliance on external financing. However, because concentration alone might not
adequately reflect the competitive environment, especially in a unit banking system, we
14 The growth in manufacturing value added was similar to the growth in total U.S. gross national product. See Historical Statistics of the United States (2000), Series Dd10 (value added), Ba834 (employment), and Ca214 (gross national product).
8
subsequently investigate how various banking policies and other market characteristics affected
manufacturing sector growth rates.
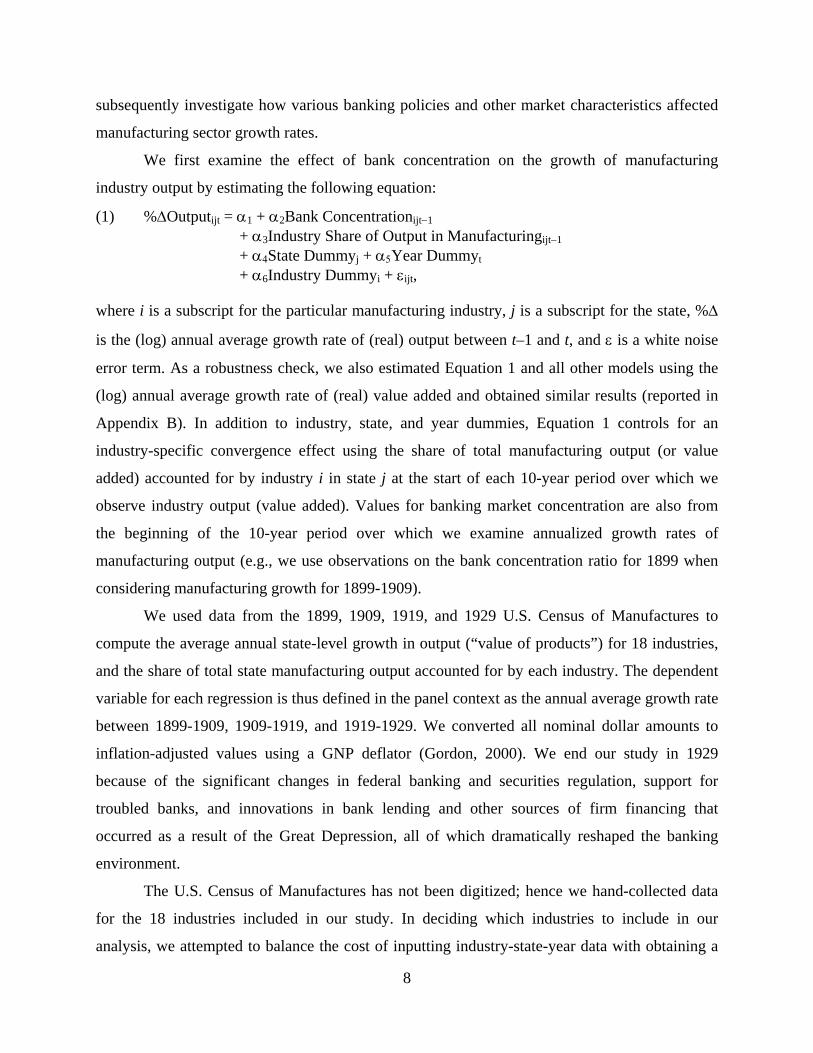
We first examine the effect of bank concentration on the growth of manufacturing
industry output by estimating the following equation:
(1) %ΔOutputijt = α1 + α2Bank Concentrationijt−1 + α3Industry Share of Output in Manufacturingijt−1 + α4State Dummyj + α5Year Dummyt
+ α6Industry Dummyi + εijt,
where i is a subscript for the particular manufacturing industry, j is a subscript for the state, %Δ
is the (log) annual average growth rate of (real) output between t–1 and t, and ε is a white noise
error term. As a robustness check, we also estimated Equation 1 and all other models using the
(log) annual average growth rate of (real) value added and obtained similar results (reported in
Appendix B). In addition to industry, state, and year dummies, Equation 1 controls for an
industry-specific convergence effect using the share of total manufacturing output (or value
added) accounted for by industry i in state j at the start of each 10-year period over which we
observe industry output (value added). Values for banking market concentration are also from
the beginning of the 10-year period over which we examine annualized growth rates of
manufacturing output (e.g., we use observations on the bank concentration ratio for 1899 when
considering manufacturing growth for 1899-1909).
We used data from the 1899, 1909, 1919, and 1929 U.S. Census of Manufactures to
compute the average annual state-level growth in output (“value of products”) for 18 industries,
and the share of total state manufacturing output accounted for by each industry. The dependent
variable for each regression is thus defined in the panel context as the annual average growth rate
between 1899-1909, 1909-1919, and 1919-1929. We converted all nominal dollar amounts to
inflation-adjusted values using a GNP deflator (Gordon, 2000). We end our study in 1929
because of the significant changes in federal banking and securities regulation, support for
troubled banks, and innovations in bank lending and other sources of firm financing that
occurred as a result of the Great Depression, all of which dramatically reshaped the banking
environment.
The U.S. Census of Manufactures has not been digitized; hence we hand-collected data
for the 18 industries included in our study. In deciding which industries to include in our
analysis, we attempted to balance the cost of inputting industry-state-year data with obtaining a
9
representative sample of industries. We selected industries that constituted the largest share of
U.S. manufacturing employment in either 1899 or 1929 so that our sample would reflect the
broad trends encompassing U.S. manufacturing during the first three decades of the twentieth
century. As shown in Table II, the 18 industries in our sample accounted for 47 percent of the
total number of manufacturing establishments, 54 percent of total employment (wage earners),
46 percent of total output, and 47 percent of value added in 1929. Although it would be possible
to expand the sample to include more industries, there are few additional industries for which
data are available for many states. By focusing on industries that are found in a large number of
states, our sample allows us to take full advantage of the cross-state variation in the structure of
the banking environment.15
Our sample includes several established industries with high employment at the start of
our period, such as cotton goods, lumber and timber products, and boots and shoes, but which
subsequently grew slowly between 1899 and 1929. The sample also includes industries with
relatively small employment shares in 1899 but then expanded rapidly over the subsequent three
decades, such as electrical machinery and motor vehicles, which represent some of the “high-
tech” industries of the 1920s. In addition, the sample includes some other historically important
industries, such as iron and steel and railroad cars, that were part of the first wave of U.S.
industrialization but may have had renewed importance with the expansion of industry in the
early twentieth century. Table III reports average annual growth rates of real value of product
(hereafter referred to as “output”; Table IIIa), real value added (Table IIIb), and employment
(wage earners; Table IIIc) for each of the 18 industries in our sample at decade intervals and for
1899 to 1929 as a whole. Appendix A provides additional information about the industries that
comprise our sample and the compilation of the data used in the econometric analysis.16
The first column of Table IV presents an estimate of Equation 1. As described above, the
concentration variable captures the effect of banking market concentration on industrial growth
in general. The regression suggests that concentration had a positive and economically
meaningful impact on growth of manufacturing industries during our sample period. Based on
the coefficient estimate, an increase in concentration from the 25th to the 75th percentile of the 15 We started with the 20 largest industries in terms of employment in each year but were able to construct consistent definitions across time for only 18 industries. 16 The automobile parts and assembly industries are combined in the 1899 census. We use data for the combined industry throughout the sample period, and for automobile parts only for 1909-29. See Appendix A for additional information.
10
distribution would result in a 1.3 percentage point increase in average annual manufacturing
output growth. Although at variance with the findings of Cetorelli and Gambera (2001), which
use relatively recent data for both developed and developing economies, our finding is broadly
consistent with Petersen and Rajan (1995), who argue that monopoly power in banking could
allow newer firms or those without access to public capital markets to tap into funds to finance
new investment projects and grow more quickly (with the bank sharing in the future profit
stream of the company through its monopoly rents). Our results are also broadly consistent with
Marquez (2002), who suggests that concentration in banking markets reduces inefficiencies
associated with evaluating creditworthy borrowers.
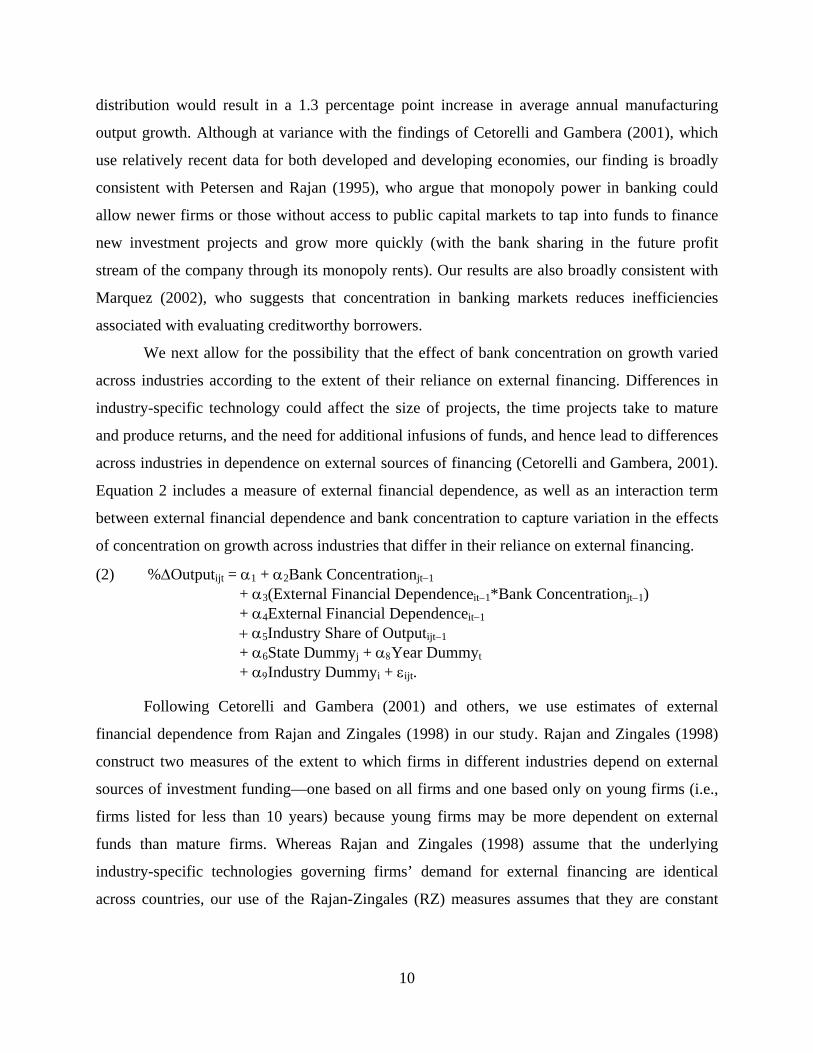
We next allow for the possibility that the effect of bank concentration on growth varied
across industries according to the extent of their reliance on external financing. Differences in
industry-specific technology could affect the size of projects, the time projects take to mature
and produce returns, and the need for additional infusions of funds, and hence lead to differences
across industries in dependence on external sources of financing (Cetorelli and Gambera, 2001).
Equation 2 includes a measure of external financial dependence, as well as an interaction term
between external financial dependence and bank concentration to capture variation in the effects
of concentration on growth across industries that differ in their reliance on external financing.
(2) %ΔOutputijt = α1 + α2Bank Concentrationjt−1
+ α3(External Financial Dependenceit−1*Bank Concentrationjt−1)
+ α4External Financial Dependenceit−1
+ α5Industry Share of Outputijt−1
+ α6State Dummyj + α8Year Dummyt + α9Industry Dummyi + εijt.
Following Cetorelli and Gambera (2001) and others, we use estimates of external
financial dependence from Rajan and Zingales (1998) in our study. Rajan and Zingales (1998)
construct two measures of the extent to which firms in different industries depend on external
sources of investment funding—one based on all firms and one based only on young firms (i.e.,
firms listed for less than 10 years) because young firms may be more dependent on external
funds than mature firms. Whereas Rajan and Zingales (1998) assume that the underlying
industry-specific technologies governing firms’ demand for external financing are identical
across countries, our use of the Rajan-Zingales (RZ) measures assumes that they are constant
11
across time within the United States.17 Neither assumption is ideal, though differences in legal
systems, property rights, culture, etc. that might introduce problems of unobserved heterogeneity
in cross-country studies, especially ones that include developing as well as developed countries,
such as Rajan and Zigales (1998) and Cetorelli and Gambera (2001), are less likely to be
important for our study of a single country. Moreover, by employing the RZ industry-specific
measures of external dependence, we are reasonably confident that our dependence measure is
exogenous. Nonetheless, as a robustness check, in a subsequent section we employ two other
proxies for access to external financing based on time-varying data from our sample period, and
hence relax the assumption of time-invariant industry technologies over the sample period.
Given our definitions and assumptions, we can test the hypothesis that characteristics of
the banking sector had a greater impact on the growth of industries that rely more heavily on
external financing. Columns (2) and (3) of Table IV report regression estimates of Equation 2,
which includes the interaction term for the industry-specific effect of bank concentration on
growth. As before, we find that bank concentration exerted an overall positive effect on
manufacturing growth. The size of the effect is similar to that reported in Column (1). By
contrast, the coefficient on the interaction term is not statistically different from zero using either
the RZ measures of external financial dependence for all firms or for only young firms. Thus we
detect no evidence that the influence of bank concentration on industry growth rates varied
across industries according to their reliance on external financing. However, we find a
statistically significant convergence effect in the regression that uses the RZ dependence measure
based on young firms: the higher an industry’s share of a state’s total manufacturing output in a
base year, the lower its growth rate over the subsequent decade.
As a final robustness check, we estimate an equation that better controls for omitted
variables bias. Equation 3 includes time-industry dummies and time-state dummies to sweep up
other time-varying fixed effects:
17 An underlying assumption in Rajan and Zingales (1998) is that cross-country differences in industry growth rates reflect differences in financial development rather than differences in technologies or other conditions. They base their estimates of external dependence on the difference between investment and cash generated from operations for U.S. firms to investigate the impact of financial development on the growth rates of different industries in all countries. In their model, observed differences in reliance on external financing across U.S. industries reflect fundamental differences in technologies rather than distortions caused by underdeveloped capital markets or other frictions. Rajan and Zingales (1998) report dependence estimates for industrial groups defined by modern International Standard Industrial Classification groups. See Appendix A for the mapping of our 18 sample industries into these groups. For purposes of estimation, we normalize the RZ measures to have a mean of zero and standard deviation of unity.
12
(3) %ΔOutputijt = α1 + α2(External Dependenceit−1*Bank Concentrationjt−1) + α3Industry Share of Output in Manufacturingijt−1
+ α4State*Year Dummyjt + α5Industry*Year Dummyit + εijt.
In this specification, the constituent components of the interaction variable of interest are
absorbed by the fixed effects; only factors varying at the ijt level remain in the regressions. This
specification thus controls for potential time-varying influences at the state level, such as
differences in financial development, which following the assumptions in the cross-country
literature, we had previously assumed to be unimportant.
The fourth and fifth columns of Table IV report the estimates of Equation 3. The
coefficient on the interaction of concentration and external dependence is not statistically
significant in either regression, again suggesting that, during the first three decades of the
twentieth century, the effect of banking market concentration did not vary across industries
according to their dependence on external financing. By contrast, the coefficient on the industry
share variable is statistically significant in both regressions, indicating that industries with a
larger share of a state’s total output at the start of a decade grew more slowly over the subsequent
10 years.
III. The Effects of Banking Policies
Our initial specifications indicate that banking market concentration had a positive effect
on manufacturing output growth in general, but we find little evidence that the impact varied
across industries according to their reliance on external financing. While our findings differ from
those of Cetorelli and Gambera (2001) and other studies, these differences might reflect unique
features of the U.S. banking system (including its unit banking structure) which, in turn,
influence how the banking system affects economic growth.
We postulate that the concentration ratio might not adequately summarize the
competitive environment of U.S. banking markets in the early twentieth century because of
differences in state regulations affecting bank entry and competition. To test this hypothesis, we
now consider a richer empirical model that takes into account additional features of state banking
markets that may have influenced the competitiveness of those markets and the ability of firms to
borrow from banks. Although it might be possible to carry out a similar exercise by examining
bank regulations in developing countries today, the best available database on bank regulation is
not retrospective in nature (Barth, Caprio, and Levine, 2001). Moreover, even if one gathered
13
historical information on bank regulation across developing countries, unobserved heterogeneity
is more likely to be a concern in a cross-country study of developed and developing countries
than in a study of U.S. states. Hence, U.S. states, particularly in the era before the removal of
federal restrictions on interstate branching, represent a fertile environment for studying the
relationship among bank regulations, market structure, and economic growth.
In addition to market concentration, we estimate models with three policy variables
(branch banking, minimum capital requirements, and deposit insurance) and one additional
characteristic of the banking market (the number of banks per capita). Most states restricted the
ability of banks to operate branch offices. Although few states allowed any branching at the end
of the nineteenth century, several permitted branch banking by the 1920s. Some states permitted
banks to establish branches only within their home-office city or county, but a few, such as
California, allowed statewide branching. The easing of restrictions on branching promoted
consolidation in the banking industry during the 1920s via mergers and voluntary liquidations
(Carlson and Mitchener, 2006; Wheelock, 1993; White, 1985). Restrictions on entry may have
influenced the provision of funds to firms, especially since lending is often localized (Petersen
and Rajan, 2002; Bofondi and Gobbi, 2004; Lerner, 1995). Because deregulation unleashed
competitive changes in state banking markets, we include the number of branch offices per
commercial bank at the beginning of each decade as a covariate in our regressions.18
State laws also specified the minimum amount of paid-in capital required to receive a
banking license. Minimum capital requirements act as a barrier to entry, and thus may have
influenced the growth rate of industries by limiting bank competition. Minimum capital
requirements varied widely across states during our sample period. For example, in 1929, the
minimum capital required to obtain a bank charter ranged from $10,000 in several states to
$100,000 in Massachusetts. We include each state’s minimum capital requirement as an
additional covariate.19
Deposit insurance is yet another policy affecting the structure and competitiveness of
state banking markets during the first decades of the twentieth century. Eight states established
18 Some studies examine the impact of branching using dummy variables indicating whether branching was permitted by law (e.g., Dehejia and Lleras-Muney, 2007). However, we use a continuous variable that captures the actual prevalence of branching within a state because branching was limited by custom or by bank supervisors in some states that permitted it by statute. 19 Some states had several tiers of minimum charter capital based on the size of the municipality in which a bank was located. Here we use the state requirement for the smallest municipalities.
14
insurance systems to protect bank depositors in the years following the Panic of 1907. Insurance
premiums were low and unrelated to failure risk, which appears to have encouraged entry and
expanded bank lending initially, but at the expense of increased banking instability during the
1920s (Alston, et al., 1994; Calomiris, 1989, 1992; Dehejia and Lleras-Muney, 2007; Wheelock,
1992a, b). We include an indicator variable set equal to unity for states with an active deposit
insurance system.20
Finally, we include the number of banks per capita as an additional control variable to
help account for the large variation in the number of banks and banking market structure across
U.S. states. Researchers have suggested that the number of banks per capita reflects other aspects
of the structure and competitiveness of banking markets, particularly in an environment of
geographic restrictions and high transportation costs, that help explain the relative performance
and stability of state and national banking systems. For example, Rajan and Ramcharan (2009)
find that a higher number of banks per capita increased the supply of credit across U.S. counties
in the 1920s and 1930s but also contributed to higher bank failure rates during the Great
Depression (see also Grossman, 2007; and Wheelock, 1993). Table V reports summary statistics
for branch banking, minimum capital requirements, and banks per capita.21
The three policy variables and banks per capita enter our estimation equation in two
ways: (1) as a direct influence on output growth and (2) indirectly via an interaction term to test
whether bank regulations had a differential effect on industries that relied more heavily on
external financing.22 Our new estimation equations are as follows:
(4) %ΔOutputijt = α1 + α2Bank Concentrationjt−1 + α3External Dependenceit−1
+ α4(External Dependenceit−1*Bank Concentrationjt−1) + α5(Minimum Capitaljt−1)
+ α6(External Dependenceit−1*Minimum Capitaljt−1) + α7(Deposit Insurancejt−1) + α8(External Dependenceit−1*Deposit Insurancejt−1) + α9(Branch Banksit−1) + α10(External Dependenceit−1*Branch Banksjt−1) + α11(Banks per Capitajt−1)
20 The eight state deposit insurance systems were all established between 1908 and 1919. For purposes of estimation, we treat each state as having had a deposit insurance system in 1909 and 1919. 21 For our regressions we define “banks per capita” as the log of the number of commercial banks divided by state populations. 22 We observe data on the policy variables and banks per capita at the beginning of each 10-year period over which we observe industry growth rates (e.g., in modeling industrial growth over 1919-29, we use observations on the regulatory variables for 1919). Appendix A provides additional detail about these variables.
15
+ α12(External Dependenceit−1*Banks per Capitajt−1) + α13Industry Share of Output in Manufacturingijt−1 + α14State Dummyj + α15Yeart + α16Industry Dummyi + εijt
and (5) %Δ Outputijt = α1 + α2(External Dependenceit−1*Bank Concentrationjt−1)
+ α3(External Dependenceit−1*Minimum Capitaljt−1) + α4(External Dependenceit−1*Deposit Insurancejt−1) + α5(External Dependenceit−1*Branch Banksjt−1) + α6(External Dependenceit−1*Banks per Capitajt−1) + α7Industry Share of Output in Manufacturingijt−1
+ α8Industry*Year dummyit + α9State*Year Dummyjt + εijt. The latter specification sweeps up the direct effects of bank regulation in the time-varying fixed
effects.
Table VI reports estimates of Equations 5 and 6.23 The results again indicate that banking
market concentration exerted a positive influence on output growth in general (with the effect
being similar in size to earlier regressions), even after accounting for differences in regulation
across states. We again find no evidence that the impact of concentration varied across industries
according to their reliance on external financing. However, we find evidence that branching laws
exerted an independent influence on manufacturing industry growth rates. Specifically, branch
banking appears to have boosted the growth rate of industries that rely most heavily on external
financing (with the caveat that the coefficient on the interaction of branching with external
dependence is not statistically significant in our estimate of Equation 5, reported in Column 2).
Based on the coefficient estimates for Equation 4 (reported in Column 1), an increase in the
prevalence of branching from the 25th to the 75th percentile of the distribution would cause a
change in average industry growth ranging from −0.6 percentage points for the shoe industry (the
industry that depends least on external financing) to +0.7 percentage points for the electrical
machinery industry (the industry that depends the most on external financing).
Deposit insurance is another policy that appears to have affected manufacturing output
growth. The coefficient estimate reported in Column (1) indicates that the presence of a state
deposit insurance system reduced average annual manufacturing sector growth by approximately
23 Because our estimates using the Rajan-Zingales (1998) measure of external financial dependence based only on young firms are qualitatively similar, we report only the results based on the measure for all firms in Table VI. Results based on the “young firms” measure are available from the authors on request.
16
4 percentage points. We find no evidence that the impact of deposit insurance varied according
to an industry’s reliance on external financing. By contrast, we find that a higher number of
banks per capita boosted the growth of industries that rely more heavily on external financing,
though the coefficient on the interaction of banks per capita and external dependence is not
statistically significant at conventional levels in the estimate of Equation 5 reported in Column
(2). Finally, we again find a convergence effect in that output growth was lower among
industries with a higher initial-period share of a state’s manufacturing output.
On the whole, our results indicate that both the concentration of banking markets and the
number of banks per capita affected industrial growth during the first decades of the twentieth
century. In addition, we also find some evidence that branch banking boosted output growth
among industries that rely more heavily on external financing. Lastly, we find that the presence
of a state deposit insurance system reduced output growth in the manufacturing sector. As noted
previously, several studies have found that deposit insurance contributed to instability in state
banking markets during the 1910s and 1920s. Our results suggest that this instability had a
detrimental impact on growth in the manufacturing sector in the states that established insurance
systems.24
IV. Alternative Measures of Access to External Financing
We have thus far followed the finance and growth literature in using the Rajan-Zingales
measures of external financial dependence to conduct our industry-level analysis. As discussed
in Section III, there are reasonable theoretical and empirical reasons for using these measures.
However, by design, they are meant to capture only the influence of industry-specific
technology on the extent to which firms within an industry depend on external funds and not the
impact of capital market frictions that could also affect external financial dependence. In cross-
country settings, the RZ measures imply that observed differences in external financing are
unrelated to the underlying development of capital markets and that technological differences
are industry specific but not country specific. Nonetheless, institutional features of capital
markets affecting, for example, how intermediaries assess risk across different types of firms,
24 Dehejia and Lleras-Muney (2007) find that deposit insurance had a positive impact on bank loan growth and manufacturing value added before 1920 and a negative impact after 1920, though the effects on loan growth and value added before 1920 are not statistically significant in a model that includes other time-varying controls. We replaced the deposit insurance variable in Equation 4 with separate variables to test whether the impact of deposit insurance on output growth differed between the decades of the 1910s and 1920s. We were unable to reject the hypothesis that the coefficients on the deposit insurance variables for the two decades are equal.
17
screen potential borrowers, and determine collateral amounts might also affect the extent to
which firms in a given industry rely on external financing. Assessing how credit market features
influence industry-level growth is perhaps more manageable in the context of a single country
where the intermediaries that supply credit and their methods are more likely to be uniform.
In this section, we present growth regressions using two alternative measures of access to
sources of external financing in place of the RZ measures. The first is the average size of
establishments (measured by output) in an industry and the second is the percentage of
establishments in an industry that were operated by incorporated firms. We re-estimated our
equations using these two alternative measures aimed at capturing differences in potential access
to external financing. We use observations on average establishment size and percent
incorporated from the first year of each 10-year period over which we observe output growth.
Similar to Rajan and Zingales (1998), we created benchmark industry values for average firm
size and percent incorporated using data for the United States as a whole rather than for
individual states to minimize potential endogeneity. The main difference is that our data are from
a single nation, so we use the national average rather than a single country as the benchmark.
Approximately 12.5 percent of all U.S. business units were incorporated in 1929,
although the percentage was higher in manufacturing and, in general, much higher for large
firms (more than 95 percent) than small firms (roughly 10 percent) (SEC, 1940, part I). Larger
firms and corporations were able to borrow on capital markets at lower cost than small firms
(SEC, 1940, part II, Table 15) and typically issued more long-term debt than smaller or
unincorporated firms (SEC, 1940, part II, Table 9), suggesting that they probably also received
better terms from banks and had greater access to outside funding sources than smaller and
unincorporated firms. Moreover, in general, smaller and unincorporated firms typically had
fewer years of established profitability, less-liquid assets, were tied more closely to local
financial markets, and had credit needs that were less well suited to standard appraisal than large
and incorporated firms (Jacoby and Saulnier, 1947). Consequently, small and unincorporated
firms found it more difficult to access credit than large, incorporated firms.
In using the average firm size and percent incorporated measures, rather than the RZ
measures, we no longer need to assume that the technology for a given industry is constant over
time. Technological changes did occur in some of the industries in our sample during the 30-
year period. For example, the mechanization of cigarette rolling promoted significant
18
consolidation within the tobacco industry, which may have altered the financing requirements of
the typical tobacco firm. In general, manufacturing firms began to make greater use of labor
saving technology during the first three decades of the twentieth century (Jacoby and Saulnier,
1947, p.159). The demand for capital to finance projects with positive net present values grew,
and the institutional structure described here suggests that industries populated by larger and
more incorporated firms, on average, may have had greater access to investment funding
sources. Since the average firm size and percent incorporated measures are based on data from
the sample period and vary over the sample period, they may be more suitable for dealing with
these types of changes. On the other hand, average firm size and percent incorporated might
proxy for a broader and somewhat less identifiable credit constraint than the RZ measures.25
Table VII displays regression estimates of Equations 5 and 6 using average establishment
size in place of the RZ dependence measure. The results are broadly similar to those shown in
Table VI. Here again, we find a positive effect of banking market concentration on industrial
growth across all industries. Further, we find no evidence of an interaction effect between
concentration and average firm size. Also, as before, we find that deposit insurance reduced
growth, again with no differential effect across industries. By contrast, we find that branch
banking and more banks per capita boosted growth among industries marked by larger average
firm size, similar to our findings in Table VI. However, the interaction of branching and average
firm size is not statistically significant in the fully interactive model (Column 2). Based on the
estimates reported in Column (1), we conclude that the industry-specific impact of an increase in
branching from the 25th to the 75th percentile of the distribution ranges from −0.5 percentage
points in the marble and stone industry (which had the smallest average establishment size) to
+2.8 percentage points for the steel industry (which had the largest average establishment size).
Other industries that would have seen a boost in growth from an increase in branch banking
include the cotton textile, motor vehicle assembly, and meatpacking industries.
Table VIII reports regressions estimates of Equations 5 and 6 using the percentage of
industry establishments operated by incorporated firms as the measure of access to external
25 It would be possible to construct period-based estimates of the Rajan and Zingales (1998) measure for some firms during our sample period, as in Giedeman (2005). However, the Rajan-Zingales measure requires balance sheet and income statement information that are available only for large publicly traded firms and would not be representative of most firms that comprise the industries in our data. Further, because of the depth of modern U.S. capital markets, estimates based on modern data are likely to better reflect the underlying technological demand for external financing.
19
funding sources. Once again, we find that banking market concentration had a positive impact on
output growth. Further, we find no evidence that the impact of concentration varied across
industries that differed in the percentage of incorporated establishments. In addition, we find
some evidence that more banks per capita boosted growth among industries with higher
percentages of incorporated establishments. However, the coefficient on the interaction of
percent incorporated with banks per capita is statistically significant only in Column (1). Further,
as before, the results in Column (1) suggest that deposit insurance had a negative impact on
growth. We find that deposit insurance had a positive impact on growth of industries with more
incorporated establishments in the model with a full set of interactions (Column 2), but we find
no such effect when we estimate the model for the growth rate of real value added, rather than of
total output (see Appendix B).26
In sum, regardless of which measure of external financial dependence or access we use,
we find that banking market concentration exerted a positive impact on industrial growth during
the first three decades of the twentieth century. Further, we find no evidence that the impact of
bank concentration on growth varied across industries with different degrees of dependence on
external financing or access to credit. However, we do find evidence that more banks per capita
and a greater prevalence of branch banking boosted output growth among industries that relied
more heavily on external financing or that had larger average establishment size. In addition, we
find considerable evidence that deposit insurance had a deleterious impact on output growth in
general, except perhaps for industries with more incorporated establishments and hence better
access to capital markets.
V. Conclusion
Many studies have suggested that financial development is an important determinant of a
country’s economic growth. In a path-breaking study, Rajan and Zingales (1998) find that
financial development matters more for industries whose firms rely relatively heavily on external
26 We re-estimated the fully interactive model after replacing the deposit insurance variable with separate variables to test for differences in the effects of deposit insurance between the 1910s and 1920s. In this specification, the estimated coefficient on the interaction of deposit insurance and percentage of incorporated firms is positive and statistically significant for the 1920s, but insignificant for the 1910s. Because deposit insurance contributed to banking instability during the 1920s, we speculate that deposit insurance may have caused industries with higher percentages of incorporated manufacturing firms to grow faster than industries with fewer incorporated firms, which would have been more dependent on state banks for financing. As noted earlier, larger, incorporated firms likely had better access to capital markets than small, unincorporated firms, and perhaps also to loans from national banks, which were not covered by state deposit insurance and may have benefited from the collapse of those systems during the 1920s.
20
sources of financing. More recent research finds that the structure of banking markets affects
economic growth. For example, Cetorelli and Gambera (2001) find that banking market
concentration depresses growth in general, but increases the growth of industries whose firms
depend more heavily on external financing. On the other hand, Claessens and Laeven (2005) find
that more competitive banking markets boost the growth of such industries.
Underlying most modern studies of the impact of financial development and banking
markets on economic growth is an assumption that each country consists of a single national
banking market. That assumption may be reasonable for countries whose banking markets are
dominated by a few large banks with national branching networks, but probably is not reasonable
for countries with geographically segmented banking systems. In the United States, for example,
legal restrictions on branch banking both across state lines and within the borders of many states
produced a geographically fragmented banking system consisting of thousands of small unit
banks. Hence, the experience of the United States, especially before the widespread dismantling
of branching restrictions in the latter decades of the twentieth century, provides a unique
laboratory to examine the effects of banking market structure and regulation on economic
growth.
We investigate the impact of banking market concentration and regulation on the growth
of U.S. manufacturing industries during the first 30 years of the twentieth century. This period
was characterized by both rapid growth of the U.S. manufacturing sector and numerous changes
in state banking policies and market structures. Our research finds that banking market
concentration exerted a positive influence on the growth of U.S. manufacturing industries in the
early twentieth century, with no apparent differences across industries according to their
dependence on external financing or potential access to external funding sources.
Unique features of the U.S. banking system might explain the differences between our
findings and those of studies of modern developed and developing countries. Moreover,
concentration measures may not provide a complete or accurate picture of competition,
especially in a unit banking environment. Hence, we examine the impact of state banking
policies and other aspects of market structure on the growth of manufacturing. We find that, for a
given level of concentration, both higher numbers of banks per capita and more branch banking
boosted output growth among industries whose firms rely relatively heavily on external
financing or tend to have larger establishments (or, in the case of banks per capita, a higher
21
percentage of incorporated firms). Our results are thus consistent with Rajan and Ramcharan
(2009), who find that an increase in the number of banks per capita increases the supply of credit
in local banking markets, as well as with the many studies finding that the removal of state
restrictions on branching in the 1980s and 1990s increased credit supply and boosted economic
growth. Our evidence that deposit insurance retarded the growth of manufacturing output in
general is also consistent with prior research showing that deposit insurance contributed to
instability in state banking systems.
Our research thus contributes to a growing literature demonstrating that the structure and
regulation of banking markets affect economic growth. In particular, we find that the relationship
between the concentration of national banking markets and industrial growth in countries whose
banking systems are dominated by large banks with nationwide branch networks does not reflect
the U.S. experience of unit banking. Although the removal of legal barriers to branching has
promoted consolidation within the U.S. banking industry and the integration of formerly distant
banking markets, the evidence presented here illustrates a general point about how the
institutions that determine the competitive landscape of banking markets can affect economic
growth.
22
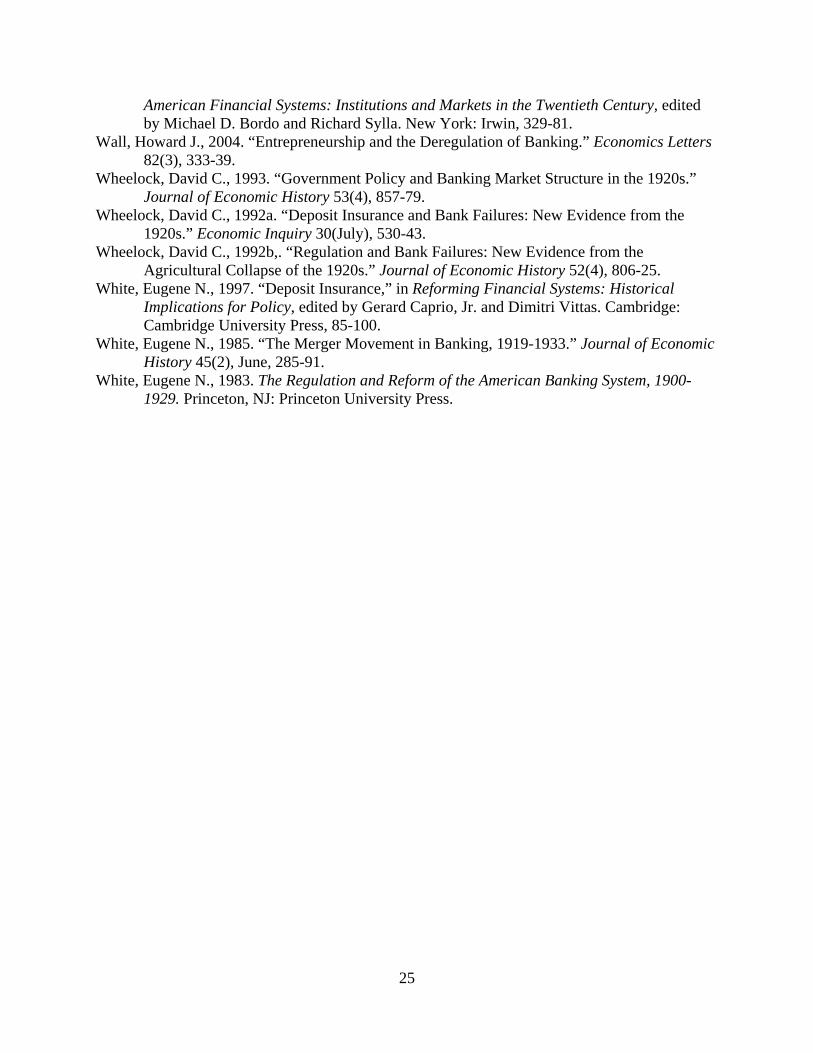
References Abrams, Burton A., Margaret Z. Clarke, and Russell F. Settle, 1999. “The Impact of Banking
and Fiscal Policies on State-Level Economic Growth.” Southern Economic Journal 66(2), 367-378.
Allen, Franklin, 1990. “The Market for Information and the Origin of Financial Intermediaries.” Journal of Financial Intermediation 1, 3-30.
Alston, Lee J.; Wayne A. Grove, and David C. Wheelock, 1994. “Why Do Banks Fail? Evidence from the 1920s.” Explorations in Economic History 31(4), 409-31.
Barth, James R., Gerard Caprio, and Ross Levine, 2001. “The Regulation and Supervision of Banks around the World: A New Database,” in Brookings-Wharton Papers on Financial Services, edited by Robert E. Litan and Richard Herring, pp. 183-240. Washington, DC: Brookings Institution Press.
Barth, James R., Gerard Caprio, and Ross Levine, 2004. “Bank Regulation and Supervision: What Works Best?” Journal of Financial Intermediation 13(2), 205-48.
Beck, Thorsten, Ross Levine, and Norman Loayza, 2000. “Finance and the Sources of Growth.” Journal of Financial Economics 58(1-2), 261–300.
Bekaert, Geert; Harvey Campbell R., and Christian Lundblad, 2005. “Does Financial Liberalization Spur Growth?” Journal of Financial Economics 77, 3-55.
Black, Sandra E. and Philip E. Strahan, 2002. “Entrepreneurship and Bank Credit Availability.” Journal of Finance 57(6), 2807-32.
Board of Governors of the Federal Reserve System, 1959. All Bank Statistics, United States, 1896-1955. Washington, DC.
Board of Governors of the Federal Reserve System, 1943. Banking and Monetary Statistics, 1914-41. Washington, DC.
Bonaccorsi di Patti, Emilia and Giovanni Dell’Ariccia, 2004. “Bank Competition and Firm Creation.” Journal of Money, Credit, and Banking 36(2), 225-52.
Bofondi , Marcello and Giorgio Gobbi, 2004. “Bad Loans and Entry into Local Credit Markets.” Temi di discussione (Economic working papers) 509, Bank of Italy, Economic Research Department.
Boyd, John H. and Edward C. Prescott, 1986. “Financial Intermediary-Coalitions.” Journal of Economics Theory 38(April), 211-32.
Calomiris, Charles W., 1992. “Do Vulnerable Economies Need Deposit Insurance? Lessons from U.S. Agriculture in the 1920s,” in If Texas Were Chile, A Primer on Banking Reform, edited by Philip L. Brock. San Francisco: Institute for Contemporary Studies, 237-314.
Carlson, Mark A. and Kris James Mitchener, 2006. “Branch Banking and Financial Stability.” Journal of Money, Credit, and Banking 38(5), 1293-1328.
Cetorelli, Nicola and Michelle Gambera, 2001. “Banking Market Structure, Financial Dependence, and Growth: International Evidence from Industry Data.” Journal of Finance 106(2), 617-48.
Claessens, Stijn and Luc Laeven, 2005. “Financial Dependence, Banking Sector Competition, and Economic Growth.” Journal of the European Economic Association 3(1), 179-207.
Claessens, Stijn and Luc Laeven, 2004. “What Drives Bank Competition? Some International Evidence.” Journal of Money, Credit, and Banking 36(3), 563-84.
Clarke, Margaret Z., 2004. “Geographic Deregulation of Banking and Economic Growth.” Journal of Money, Credit, and Banking 36(5), 929-942.
23
Dehejia, Rajeev and Adriana Lleras-Muney, 2007. “Financial Development and Pathways of Growth: State Branching and Deposit Insurance Laws in the United States, 1900-1940.” Journal of Law and Economics 50(May), 239-72.
Demirgüç-Kunt, Asli, Luc Laeven, and Ross Levine, 2004. “Regulations, Market Structure, Institutions, and the Cost of Financial Intermediation.” Journal of Money, Credit, and Banking 36(3 Pt 2), 593-622.
Demirgüç-Kunt, Asli and Ross Levine, 2001. Financial Structure and Economic Growth: A Cross-Country Comparison of Banks, Markets, and Development. Cambridge, MA: MIT Press.
Freeman, Donald G., 2002. “Did State Bank Branching Deregulation Produce Large Growth Effects? Economics Letters 75(3), 383-89.
Garrett, Thomas A., Gary A. Wagner, and David C. Wheelock, 2007, “Regional Disparities in the Spatial Correlation of State Income Growth, 1977-2002.” Annals of Regional Science 41(3), 601-18.
Giedeman, Daniel C., 2005. “Branch Banking Restrictions and Finance Constraints in Early-Twentieth-Century America.” Journal of Economic History 65(1), 129-51.
Gilbert, R. Alton and Adam M. Zaretsky, 2003. “Banking Antitrust: Are the Assumptions Still Valid?” Federal Reserve Bank of St. Louis Review 85(6), 29-52.
Goldsmith, Raymond W., 1969. Financial Structure and Development, New Haven, CT: Yale University Press.
Gordon, Robert J., 2000. Macroeconomics. Reading, MA: Addison-Wesley. Greenwood, Jeremy and Boyan Jovanovic, 1990. “Financial Development, Growth, and the
Distribution of Income.” Journal of Political Economy 98(5), 1076-1107. Grossman, Richard S., 2007. (R)Evolution in Banking: The Development of Commercial Banking
in the Industrialized World, 1800-2000. Unpublished manuscript, Wesleyan University. Guiso, Luigi., Paula Sapienza, and Luigi Zingales, 2004. “Does Local Financial Development
Matter?” Quarterly Journal of Economics, 119(3), 929-969. Guiso, Luigi., Paula Sapienza, and Luigi Zingales, 2006 “The Cost of Banking Regulation.”
CEPR Discussion Papers 5864 (October). Gurley, John G. and Edward S. Shaw, 1955. “Financial Aspects of Economic Development.”
American Economic Review 45(September), 515-38. Hoxha, Indrit, 2009. “Big Banks versus Small Banks: Good or Bad for Industries?” University of
Houston working paper. Jacoby, Neil H. and Raymond J. Saulnier, 1947. Business Finance and Banking. New York:
National Bureau of Economic Research. Jayaratne, Jith and Philip E. Strahan, 1996. “The Finance-Growth Nexus: Evidence from Bank
Branch Deregulation.” Quarterly Journal of Economics 111(3), 639-70. Kashyap, Anil K., Raguram G. Rajan, and Jeremy C. Stein, 2002. “Banks as Liquidity Providers:
An Explanation for the Co-existence of Lending and Deposit-Taking.” Journal of Finance 57(1), 33-73.
King, Robert G. and Ross Levine, 1993a. “Financial Intermediation and Economic Development,” in Capital Market and Financial Intermediation, edited by C. Mayer and X. Vives. New York: Cambridge University Press, 156-96.
King, Robert G. and Ross Levine, 1993b. “Finance and Growth: Schumpeter Might Be Right.” Quarterly Journal of Economics 108, 717-38.

24
La Porta, Rafael, Florencia López de Silanes, Andrei Shleifer, and Robert W. Vishny, 2000. “Investor Protection and Corporate Governance.” Journal of Financial Economics 58(1-2), 3-27.
La Porta, Rafael, Florencia López de Silanes, Andrei Shleifer, and Robert W. Vishny, 1998. “Law and Finance.” Journal of Political Economy 106(6), 1113-55.
Lerner, Josh, 1995. “Venture Capitalists and the Oversight of Private Firms.” Journal of Finance 50(1), 301-18.
Levine, Ross, 1997. “Financial Development and Economic Growth: Views and Agenda.” Journal of Economic Literature 35(June), 688-726.
Levine, Ross, 2006.“Finance and Growth: Theory, Evidence, and Mechanisms,” in Handbook of Economic Growth, edited by P. Aghion and S. Durlauf. Amsterdam: Elsevier/North-Holland.
Levine, Ross and Sara Zervos, 1998. “Stock Markets, Banks, and Economic Growth.” American Economic Review, 88(3), 537-58.
Marquez, Robert, 2002. “Competition, Adverse Selection, and Information Dispersion in the Banking Industry.” Review of Financial Studies 15(3), 901-26.
Masten, Arjana B., Fabrizio Coricelli, and Igor Masten, 2008. “Non-Linear Growth Effects of Financial Development: Does Financial Integration Matter?” Journal of International Money and Finance 27(2), 295-313.
Mayer, Colin, 1988. “New Issues in Corporate Finance.” European Economic Review 32(5), Panzar, John C. and James N. Rosse, 1987. “Testing for ‘Monopoly’ Equilibrium.” Journal of
Industrial Economics 35(4), 443-56. Petersen, Mitchell A. and Raghuram G. Rajan, 1995, “The Effect of Credit Market Competition
on Lending Relationships.” Quarterly Journal of Economics 110(2), 407-43. Petersen, Mitchell A. and Raghuram G. Rajan, 2002. “Does Distance Still Matter? The
Information Revolution in Small Business Lending.” Journal of Finance 57(6), 2533-70. Raddatz, Claudio, 2006. “Liquidity Needs and Vulnerability to Financial Underdevelopment.”
Journal of Financial Economics 80(3), 677-722. Rajan, Raghuram G. and Rodney Ramcharan, 2009. “Land and Credit: A Study of the Political
Economy of Banking in the United States in the Early 20th Century.” NBER Working paper no. 15083.
Rajan, Raghuram G. and Luigi Zinagales, 1998. “Financial Dependence and Growth.” American Economic Review 88(3), 559-86.
Rousseau, Peter L. and Richard Sylla, 2005. “Emerging Financial Markets and Early US Growth.” Explorations in Economic History 42(1), 1-26.
Rousseau, Peter and Paul Wachtel, 1998. “Financial Intermediation and Economic Performance: Historical Evidence from Five Industrialized Countries.” Journal of Money, Credit, and Banking 30(4), 657-78.
Securities and Exchange Commission, 1940. A Study of the Capital and Credit Needs of the Smaller Units of Business Enterprise (two volumes). A Report by the Investment Banking Section of the Securities and Exchange Commission to the Temporary National Economic Committee. Washington, DC.
Sylla, Richard, 1969. “Federal Policy, Banking Market Structure, and Capital Mobilization in the United States, 1863-1913.” Journal of Economic History 23(4), 657-86.
Wachtel, Paul and Peter Rousseau, 1995. “Financial Intermediation and Economic Growth: A Historical Comparison of the United States, United Kingdom, and Canada,” in Anglo-
25
American Financial Systems: Institutions and Markets in the Twentieth Century, edited by Michael D. Bordo and Richard Sylla. New York: Irwin, 329-81.
Wall, Howard J., 2004. “Entrepreneurship and the Deregulation of Banking.” Economics Letters 82(3), 333-39.
Wheelock, David C., 1993. “Government Policy and Banking Market Structure in the 1920s.” Journal of Economic History 53(4), 857-79.
Wheelock, David C., 1992a. “Deposit Insurance and Bank Failures: New Evidence from the 1920s.” Economic Inquiry 30(July), 530-43.
Wheelock, David C., 1992b,. “Regulation and Bank Failures: New Evidence from the Agricultural Collapse of the 1920s.” Journal of Economic History 52(4), 806-25.
White, Eugene N., 1997. “Deposit Insurance,” in Reforming Financial Systems: Historical Implications for Policy, edited by Gerard Caprio, Jr. and Dimitri Vittas. Cambridge: Cambridge University Press, 85-100.
White, Eugene N., 1985. “The Merger Movement in Banking, 1919-1933.” Journal of Economic History 45(2), June, 285-91.
White, Eugene N., 1983. The Regulation and Reform of the American Banking System, 1900-1929. Princeton, NJ: Princeton University Press.
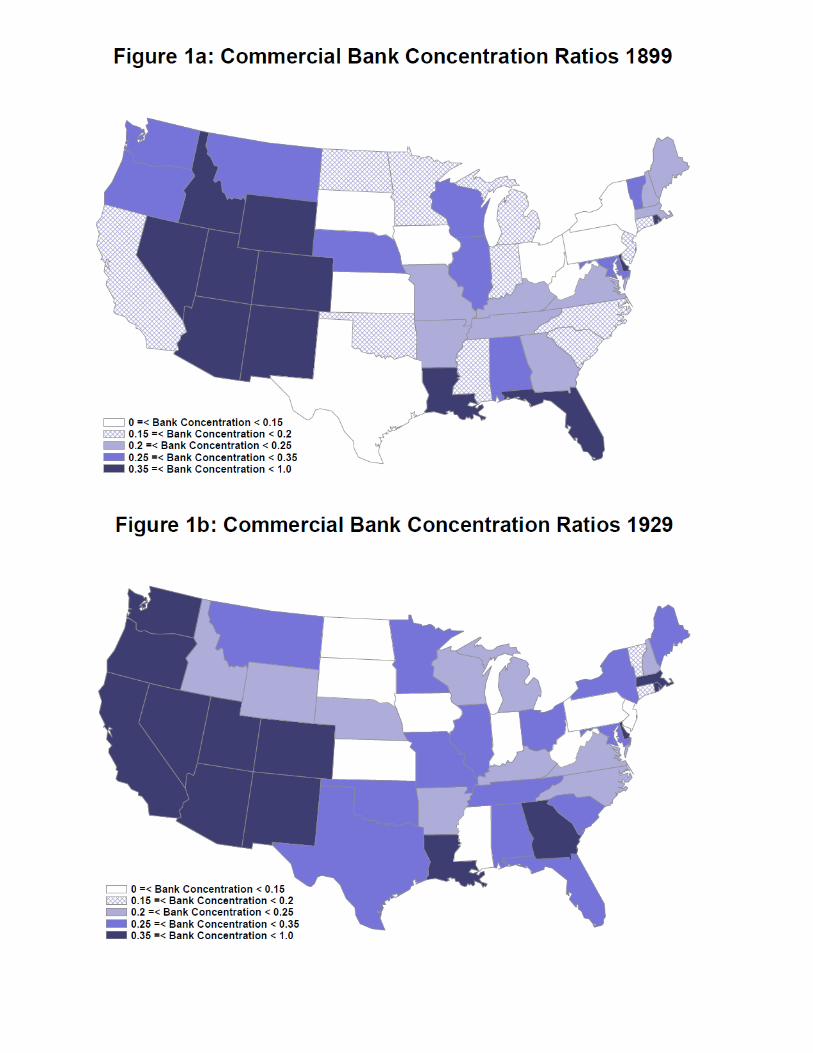
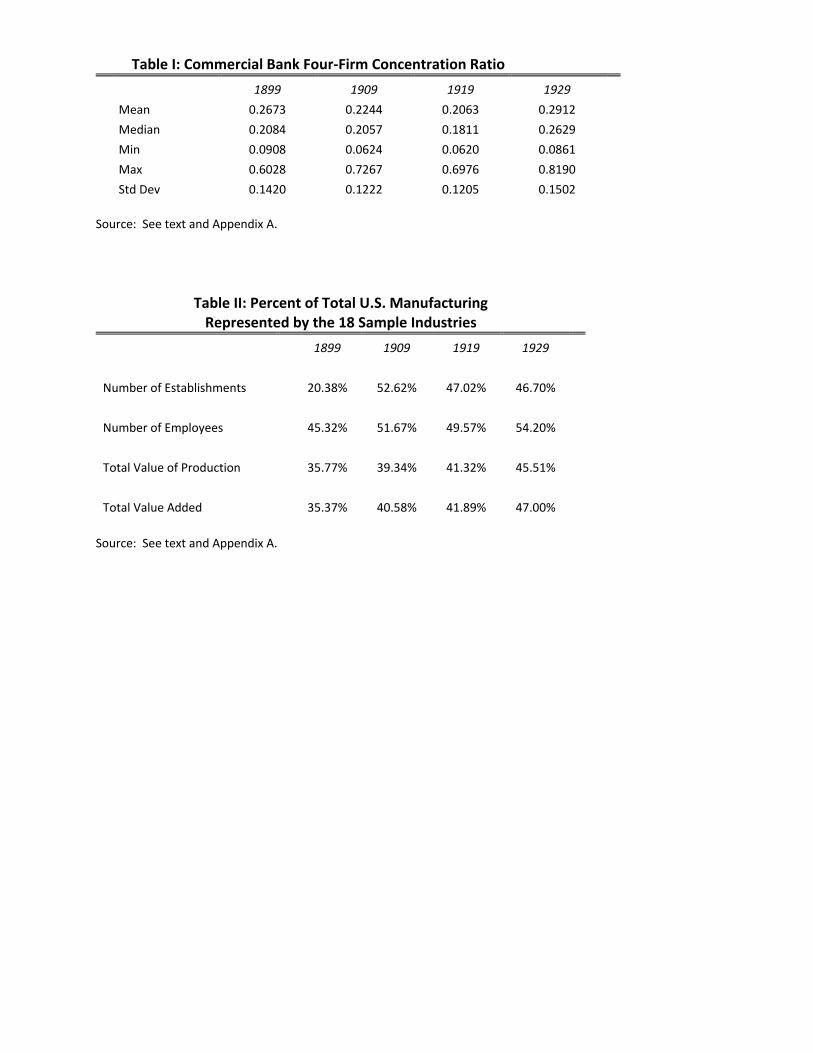
Table I: Commercial Bank Four‐Firm Concentration Ratio
1899 1909 1919 1929 Mean 0.2673 0.2244 0.2063 0.2912 Median 0.2084 0.2057 0.1811 0.2629 Min 0.0908 0.0624 0.0620 0.0861 Max 0.6028 0.7267 0.6976 0.8190 Std Dev 0.1420 0.1222 0.1205 0.1502
Source: See text and Appendix A.
Table II: Percent of Total U.S. Manufacturing Represented by the 18 Sample Industries
1899 1909 1919 1929
Number of Establishments 20.38% 52.62% 47.02% 46.70%
Number of Employees 45.32% 51.67% 49.57% 54.20%
Total Value of Production 35.77% 39.34% 41.32% 45.51%
Total Value Added 35.37% 40.58% 41.89% 47.00% Source: See text and Appendix A.
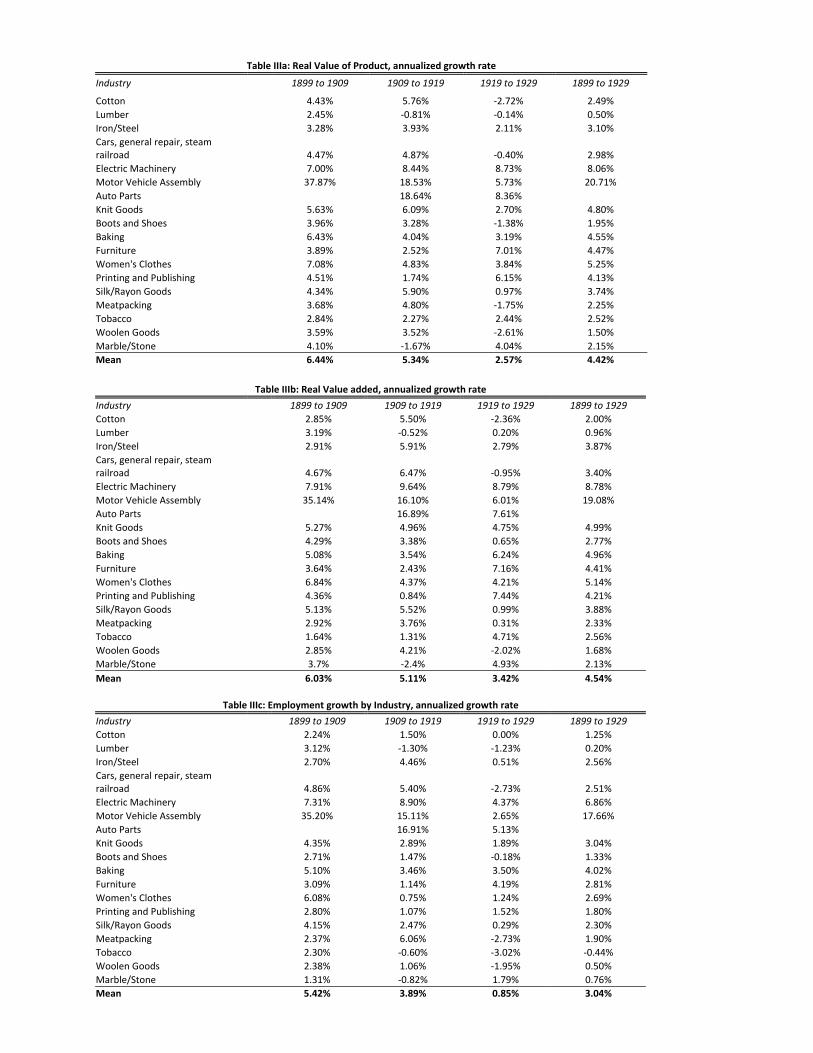
Table IIIa: Real Value of Product, annualized growth rate
Industry 1899 to 1909 1909 to 1919 1919 to 1929 1899 to 1929
Cotton 4.43% 5.76% ‐2.72% 2.49% Lumber 2.45% ‐0.81% ‐0.14% 0.50% Iron/Steel 3.28% 3.93% 2.11% 3.10% Cars, general repair, steam railroad 4.47% 4.87% ‐0.40% 2.98% Electric Machinery 7.00% 8.44% 8.73% 8.06% Motor Vehicle Assembly 37.87% 18.53% 5.73% 20.71% Auto Parts 18.64% 8.36% Knit Goods 5.63% 6.09% 2.70% 4.80% Boots and Shoes 3.96% 3.28% ‐1.38% 1.95% Baking 6.43% 4.04% 3.19% 4.55% Furniture 3.89% 2.52% 7.01% 4.47% Women's Clothes 7.08% 4.83% 3.84% 5.25% Printing and Publishing 4.51% 1.74% 6.15% 4.13% Silk/Rayon Goods 4.34% 5.90% 0.97% 3.74% Meatpacking 3.68% 4.80% ‐1.75% 2.25% Tobacco 2.84% 2.27% 2.44% 2.52% Woolen Goods 3.59% 3.52% ‐2.61% 1.50% Marble/Stone 4.10% ‐1.67% 4.04% 2.15% Mean 6.44% 5.34% 2.57% 4.42%
Table IIIb: Real Value added, annualized growth rate
Industry 1899 to 1909 1909 to 1919 1919 to 1929 1899 to 1929 Cotton 2.85% 5.50% ‐2.36% 2.00% Lumber 3.19% ‐0.52% 0.20% 0.96% Iron/Steel 2.91% 5.91% 2.79% 3.87% Cars, general repair, steam railroad 4.67% 6.47% ‐0.95% 3.40% Electric Machinery 7.91% 9.64% 8.79% 8.78% Motor Vehicle Assembly 35.14% 16.10% 6.01% 19.08% Auto Parts 16.89% 7.61% Knit Goods 5.27% 4.96% 4.75% 4.99% Boots and Shoes 4.29% 3.38% 0.65% 2.77% Baking 5.08% 3.54% 6.24% 4.96% Furniture 3.64% 2.43% 7.16% 4.41% Women's Clothes 6.84% 4.37% 4.21% 5.14% Printing and Publishing 4.36% 0.84% 7.44% 4.21% Silk/Rayon Goods 5.13% 5.52% 0.99% 3.88% Meatpacking 2.92% 3.76% 0.31% 2.33% Tobacco 1.64% 1.31% 4.71% 2.56% Woolen Goods 2.85% 4.21% ‐2.02% 1.68% Marble/Stone 3.7% ‐2.4% 4.93% 2.13% Mean 6.03% 5.11% 3.42% 4.54%
Table IIIc: Employment growth by Industry, annualized growth rate
Industry 1899 to 1909 1909 to 1919 1919 to 1929 1899 to 1929 Cotton 2.24% 1.50% 0.00% 1.25% Lumber 3.12% ‐1.30% ‐1.23% 0.20% Iron/Steel 2.70% 4.46% 0.51% 2.56% Cars, general repair, steam railroad 4.86% 5.40% ‐2.73% 2.51% Electric Machinery 7.31% 8.90% 4.37% 6.86% Motor Vehicle Assembly 35.20% 15.11% 2.65% 17.66% Auto Parts 16.91% 5.13% Knit Goods 4.35% 2.89% 1.89% 3.04% Boots and Shoes 2.71% 1.47% ‐0.18% 1.33% Baking 5.10% 3.46% 3.50% 4.02% Furniture 3.09% 1.14% 4.19% 2.81% Women's Clothes 6.08% 0.75% 1.24% 2.69% Printing and Publishing 2.80% 1.07% 1.52% 1.80% Silk/Rayon Goods 4.15% 2.47% 0.29% 2.30% Meatpacking 2.37% 6.06% ‐2.73% 1.90% Tobacco 2.30% ‐0.60% ‐3.02% ‐0.44% Woolen Goods 2.38% 1.06% ‐1.95% 0.50% Marble/Stone 1.31% ‐0.82% 1.79% 0.76% Mean 5.42% 3.89% 0.85% 3.04%

Table IV. The Effects of Bank Concentration on Output Growth Across Manufacturing
Industries Independent Variable (1) (2) (3) (4) (5) Bank Concentration 0.1032** 0.1037** 0.1060** (Standard Error) (0.0478) (0.0476) (0.0487) [p value] (0.0311) (0.0299) (0.0298) Industry Share of Output ‐0.0207 ‐0.0208 ‐0.0422** ‐0.4699*** ‐0.5089*** (Standard Error) (0.0204) (0.0205) (0.0208) (0.0963) (0.1037)
[p value] (0.3124) (0.3117) (0.0428) 0.0000 0.0000
Bank Concentration X External dependence (RZ all firms) ‐0.0188 ‐0.116 (Standard Error) (0.0142) (0.0903) [p value] (0.1853) (0.1995) Bank Concentration X External dependence (RZ young firms) ‐0.0002 0.0529 (Standard Error) (0.0142) (0.0903)
[p value] (0.9881) (0.5587)
R‐Squared 0.3785 0.3794 0.3489 0.6631 0.6345 Number of Observations 1313 1313 1228 1313 1228 Notes: The regression in Column (1) corresponds to Equation 1 in the text; those in Columns (2) and (3) correspond to Equation 2; and those in Columns (4) and (5) correspond to Equation 3. All regressions include a constant term and state, industry and year fixed effects. Standard Errors are clustered by state and industry. * indicates significance at the 10 percent level, ** significance at the 5 percent level, *** significance at the 1 percent level
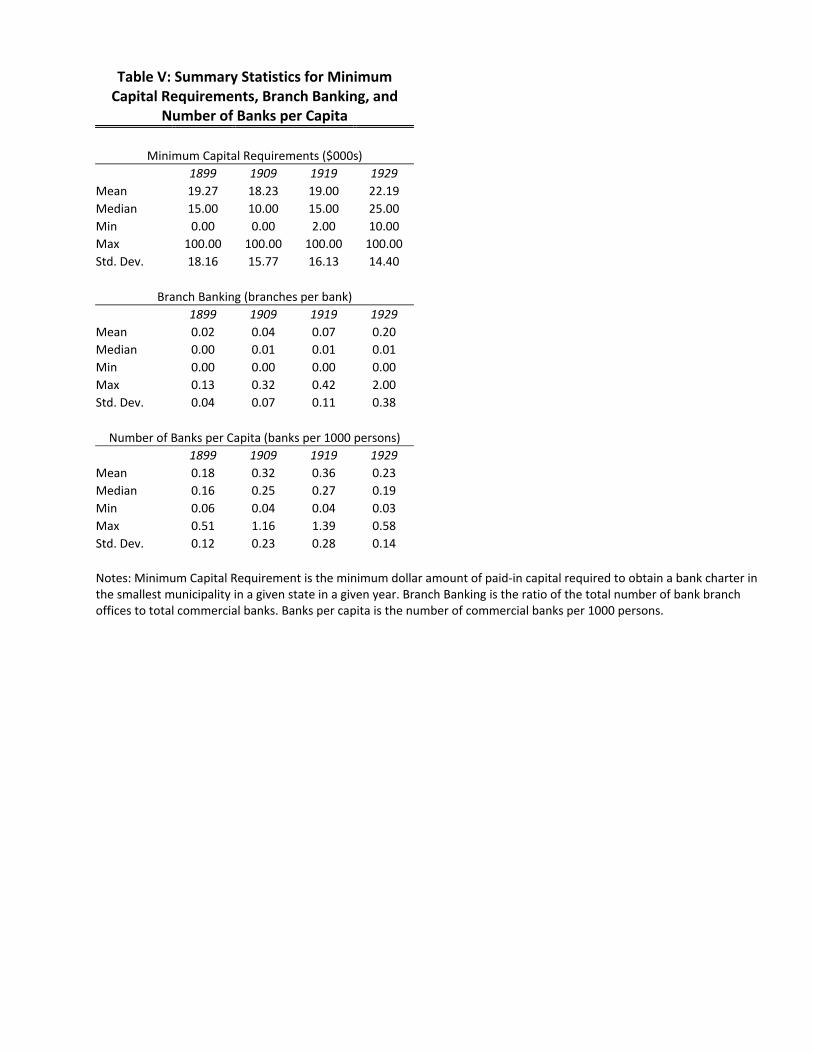
Table V: Summary Statistics for Minimum Capital Requirements, Branch Banking, and
Number of Banks per Capita
Minimum Capital Requirements ($000s) 1899 1909 1919 1929 Mean 19.27 18.23 19.00 22.19 Median 15.00 10.00 15.00 25.00 Min 0.00 0.00 2.00 10.00 Max 100.00 100.00 100.00 100.00 Std. Dev. 18.16 15.77 16.13 14.40
Branch Banking (branches per bank) 1899 1909 1919 1929 Mean 0.02 0.04 0.07 0.20 Median 0.00 0.01 0.01 0.01 Min 0.00 0.00 0.00 0.00 Max 0.13 0.32 0.42 2.00 Std. Dev. 0.04 0.07 0.11 0.38 Number of Banks per Capita (banks per 1000 persons)
1899 1909 1919 1929 Mean 0.18 0.32 0.36 0.23 Median 0.16 0.25 0.27 0.19 Min 0.06 0.04 0.04 0.03 Max 0.51 1.16 1.39 0.58 Std. Dev. 0.12 0.23 0.28 0.14 Notes: Minimum Capital Requirement is the minimum dollar amount of paid‐in capital required to obtain a bank charter in the smallest municipality in a given state in a given year. Branch Banking is the ratio of the total number of bank branch offices to total commercial banks. Banks per capita is the number of commercial banks per 1000 persons.
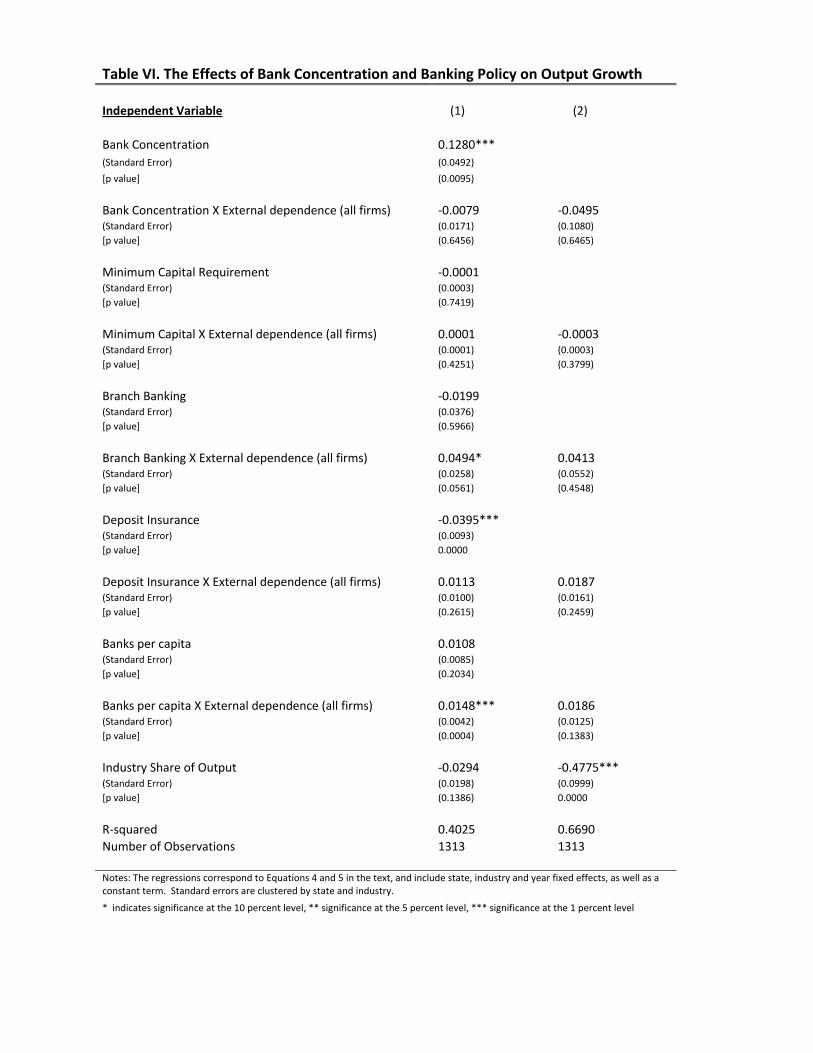
Table VI. The Effects of Bank Concentration and Banking Policy on Output Growth Independent Variable (1) (2) Bank Concentration 0.1280*** (Standard Error) (0.0492) [p value] (0.0095) Bank Concentration X External dependence (all firms) ‐0.0079 ‐0.0495 (Standard Error) (0.0171) (0.1080) [p value] (0.6456) (0.6465)
Minimum Capital Requirement ‐0.0001 (Standard Error) (0.0003) [p value] (0.7419)
Minimum Capital X External dependence (all firms) 0.0001 ‐0.0003 (Standard Error) (0.0001) (0.0003) [p value] (0.4251) (0.3799)
Branch Banking ‐0.0199 (Standard Error) (0.0376) [p value] (0.5966)
Branch Banking X External dependence (all firms) 0.0494* 0.0413 (Standard Error) (0.0258) (0.0552) [p value] (0.0561) (0.4548)
Deposit Insurance ‐0.0395*** (Standard Error) (0.0093) [p value] 0.0000
Deposit Insurance X External dependence (all firms) 0.0113 0.0187 (Standard Error) (0.0100) (0.0161) [p value] (0.2615) (0.2459)
Banks per capita 0.0108 (Standard Error) (0.0085) [p value] (0.2034)
Banks per capita X External dependence (all firms) 0.0148*** 0.0186 (Standard Error) (0.0042) (0.0125) [p value] (0.0004) (0.1383)
Industry Share of Output ‐0.0294 ‐0.4775*** (Standard Error) (0.0198) (0.0999) [p value] (0.1386) 0.0000
R‐squared 0.4025 0.6690 Number of Observations 1313 1313 Notes: The regressions correspond to Equations 4 and 5 in the text, and include state, industry and year fixed effects, as well as a constant term. Standard errors are clustered by state and industry.
* indicates significance at the 10 percent level, ** significance at the 5 percent level, *** significance at the 1 percent level

Table VII. The Effects of Bank Concentration and Banking Policy on Output Growth (Rajan‐Zingales dependence measure replaced by Average Firm Size) Independent Variable (1) (2) Bank Concentration 0.1297*** (Standard Error) (0.0498) [p value] (0.0095)
Bank Concentration X Average Firm Size ‐3.17E‐08 1.54E‐07 (Standard Error) 4.00E‐08 1.48E‐7 [p value] (0.4281) (0.3005)
Minimum Capital Requirement ‐0.0001 (Standard Error) (0.0003) [p value] (0.7003)
Minimum Capital X Average Firm Size 1.49E‐10 8.83E‐10 (Standard Error) 2.25E‐10 8.80E‐10 [p value] (0.5069) (0.3161)
Branch Banking ‐0.0620 (Standard Error) (0.0377) [p value] (0.1003)
Branch Banking X Average Firm Size 1.84E‐07*** 2.52E‐07 (Standard Error) 0.0000 1.83E‐7 [p value] (0.0009) (0.1698)
Deposit Insurance ‐0.0414*** (Standard Error) (0.0108) [p value] (0.0001)
Deposit Insurance X Average Firm Size ‐8.96E‐10 ‐1.35E‐08 (Standard Error) 0.0000 4.53E‐8 [p value] (0.9474) (0.7659)
Banks per capita 0.0043 (Standard Error) (0.0086) [p value] (0.6147)
Banks per capita X Average Firm Size 2.95E‐08*** 8.61E‐08** (Standard Error) 8.13E‐09 0.0000 [p value] (0.0003) (0.0180)
Industry Share of Output ‐0.0061 ‐0.4387*** (Standard Error) (0.0188) (0.0961) [p value] (0.7446) 0.0000
Average Firm Size in Industry ‐7.61E‐09** (Standard Error) 3.50E‐09
[p value] (0.0300) R‐squared 0.3950 0.6677 Number of Observations 1313 1313 Notes: The regressions correspond to Equations 4 and 5 in the text. Regressions include state, industry and year fixed effects, as well as a constant term. Standard errors are clustered by state and industry. Average firm size is defined as average output (“value of product”) per establishment.
* indicates significance at the 10 percent level, ** significance at the 5 percent level, *** significance at the 1 percent level
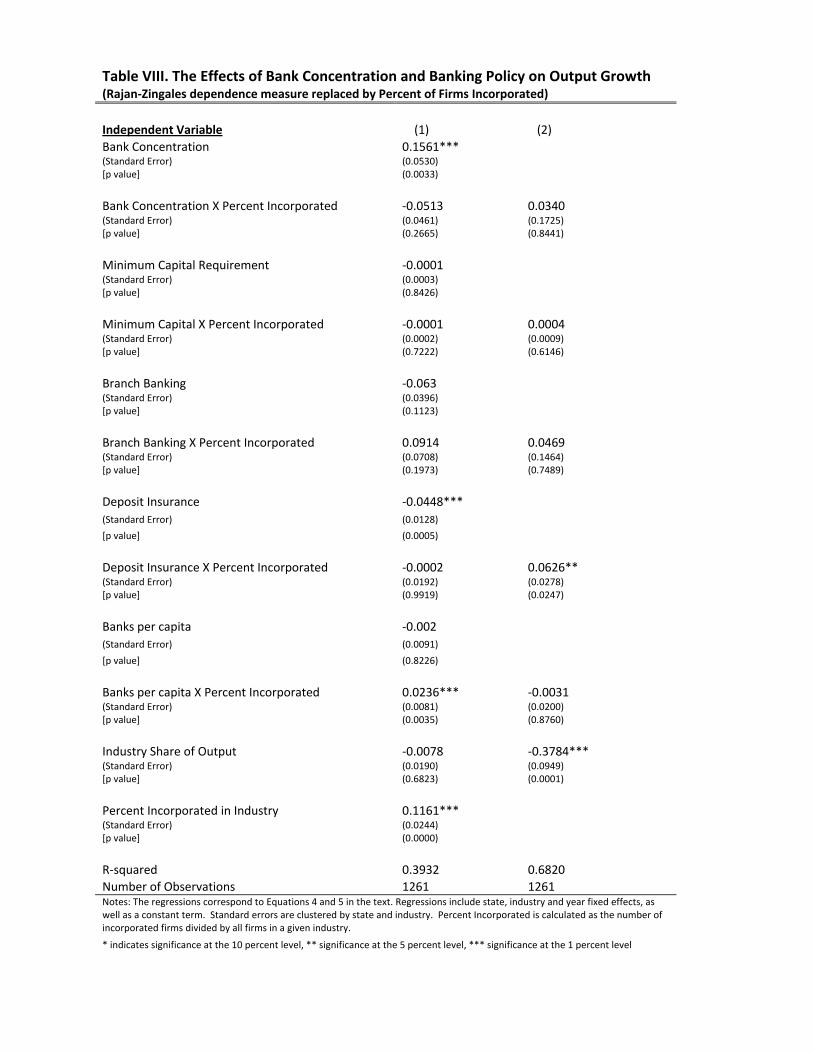
Table VIII. The Effects of Bank Concentration and Banking Policy on Output Growth (Rajan‐Zingales dependence measure replaced by Percent of Firms Incorporated) Independent Variable (1) (2) Bank Concentration 0.1561*** (Standard Error) (0.0530) [p value] (0.0033)
Bank Concentration X Percent Incorporated ‐0.0513 0.0340 (Standard Error) (0.0461) (0.1725) [p value] (0.2665) (0.8441)
Minimum Capital Requirement ‐0.0001 (Standard Error) (0.0003) [p value] (0.8426)
Minimum Capital X Percent Incorporated ‐0.0001 0.0004 (Standard Error) (0.0002) (0.0009) [p value] (0.7222) (0.6146)
Branch Banking ‐0.063 (Standard Error) (0.0396) [p value] (0.1123)
Branch Banking X Percent Incorporated 0.0914 0.0469 (Standard Error) (0.0708) (0.1464) [p value] (0.1973) (0.7489)
Deposit Insurance ‐0.0448*** (Standard Error) (0.0128) [p value] (0.0005) Deposit Insurance X Percent Incorporated ‐0.0002 0.0626** (Standard Error) (0.0192) (0.0278) [p value] (0.9919) (0.0247)
Banks per capita ‐0.002 (Standard Error) (0.0091) [p value] (0.8226) Banks per capita X Percent Incorporated 0.0236*** ‐0.0031 (Standard Error) (0.0081) (0.0200) [p value] (0.0035) (0.8760)
Industry Share of Output ‐0.0078 ‐0.3784*** (Standard Error) (0.0190) (0.0949) [p value] (0.6823) (0.0001)
Percent Incorporated in Industry 0.1161*** (Standard Error) (0.0244) [p value] (0.0000)
R‐squared 0.3932 0.6820 Number of Observations 1261 1261 Notes: The regressions correspond to Equations 4 and 5 in the text. Regressions include state, industry and year fixed effects, as well as a constant term. Standard errors are clustered by state and industry. Percent Incorporated is calculated as the number of incorporated firms divided by all firms in a given industry.
* indicates significance at the 10 percent level, ** significance at the 5 percent level, *** significance at the 1 percent level

Appendix A Census of Manufacturers State-level data on output, value added, employment and number of establishments for various industries are from the Censuses of Manufacturers for 1899, 1909, 1919, and 1929. We identified the 20 largest industries in terms of employment for the United States as a whole in both 1899 and 1929 from the Census of Manufacturers for 1929, Vol. 2, Table 6, p. 34. We subsequently determined that we could obtain reasonably consistent state-level data for 1899, 1909, 1919, and 1929 for the following 18 industries or industry groups: 1. Cotton goods (including “cotton small wares”) 2. Lumber and timber products (including “planning mill products” and “boxes-wooden packing”) 3. Iron and steel works and mills 4. Cars, general construction and repair, steam railroad 5. Electrical machinery (apparatus and supplies) 6. Motor vehicles and motor vehicle bodies and parts 7. Motor vehicle bodies and parts only 8. Knit goods 9. Boots and shoes (including “cut stock” and “findings”) 10. Bread and bakeries 11. Furniture (including refrigerators) 12. Clothing, women’s 13. Printing and publishing (including book and job, newspaper, music publishing, bookbinding, engraving-steel and copperplate, and lithography) 14. Silk and rayon 15. Meat packing (including “sausage not prepared in slaughtering or meat-packing establishments”) 16. Tobacco products (including cigars and cigarettes and other tobacco products). 17. Woolen manufacturers (including woolen goods, worsted goods, carpets and rugs (other than rag), felt goods, and wool hats). 18. Masonry, brick and stone (including brick and tile, marble, granite, slate and other stone products and stone work, and clay products) State-level data for 1919 and 1929 aggregated across all industries, and U.S. aggregated data for individual industries are from the Census of Manufacturers for 1929, Volume 2. We adjusted the data reported for 1919 to exclude data for automobile repair shops, which are not included in the published data for 1899, 1909 or 1929. State-level data for 1899 and 1909 aggregated across all industries, and U.S. aggregated data for individual industries, are from the Census of Manufacturers for 1919, Volume 8, Tables 48 and 49. Dependence on External Financing We use the “all companies” and “young firms” measures of external dependence reported in Rajan and Zingales (1998) for different industrial groups. The following table shows our mapping of the industrial groups reported in Rajan and Zingales (1998) to the groups represented in our data. Rajan-Zingales Industry Corresponding Sample Industry apparel cotton goods wood products lumber/timber products iron/steel iron/steel transportation equipment railroad cars

electrical machinery electrical machinery motor vehicles motor vehicles apparel knit goods footwear boots/shoes food products bread/bakeries furniture furniture apparel women’s clothing printing/publishing printing publishing textiles silk/rayon and woolen goods food products meat packing tobacco tobacco other non-metallic mineral products masonry/stone Banking Data Concentration: For each state, we constructed ratios of the deposits in the four largest banks to deposits in all banks for 1910, 1919, and 1929 using data in Polk’s Bankers Encyclopedia. We constructed two measures, one consisting of data in all banks, and one constructed using data for only commercial banks. The former measure includes data for any mutual savings banks and other mutual savings institutions, whereas the latter consists of data for incorporated commercial banks and trust companies only. Total deposits in all banks and all commercial banks are from All Bank Statistics, 1896-1955 (Board of Governors of the Federal Reserve System, 1959). Regulations: Branch banking restrictions: For each state, we computed the ratio of bank branches to total banks (total commercial banks) and the ratio of branches outside the head-office city to total banks (commercial banks) in 1910, 1920, and 1930. Source: Banking and Monetary Statistics, 1914-1941 (Board of Governors of the Federal Reserve System, 1943, Table 74). Deposit insurance: The following states operated a deposit insurance system (year operation began): Kansas (1909), Mississippi (1914), Nebraska (1911), North Dakota (1917), Oklahoma (1908), South Dakota (1916), Texas (1910), and Washington (1917). All of these systems collapsed during the early 1920s. Source: Federal Deposit Insurance Corporation, Annual Report for 1956. Minimum capital requirement for state chartered banks: smallest dollar amount of capital required to charter a bank. The source of these data are White (1983, Table 1.3) for 1909, and Polk’s Bankers Encyclopedia for 1919 and 1929.
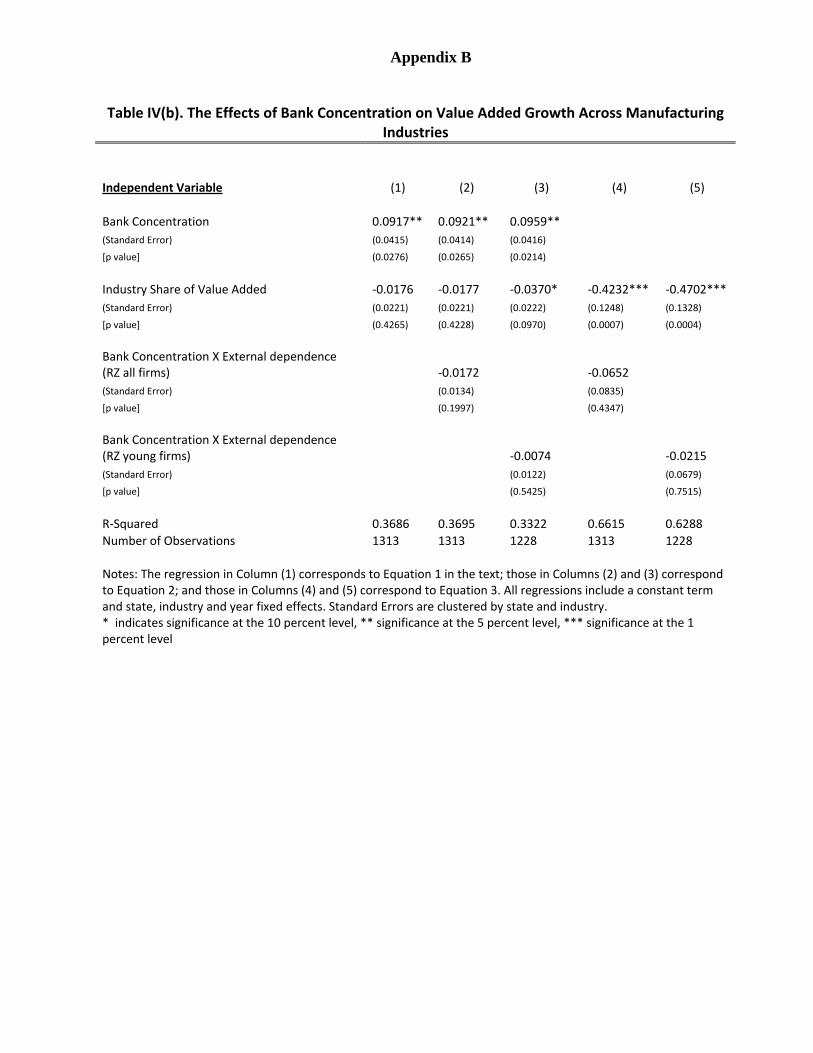
Appendix B Table IV(b). The Effects of Bank Concentration on Value Added Growth Across Manufacturing
Industries Independent Variable (1) (2) (3) (4) (5) Bank Concentration 0.0917** 0.0921** 0.0959** (Standard Error) (0.0415) (0.0414) (0.0416) [p value] (0.0276) (0.0265) (0.0214) Industry Share of Value Added ‐0.0176 ‐0.0177 ‐0.0370* ‐0.4232*** ‐0.4702*** (Standard Error) (0.0221) (0.0221) (0.0222) (0.1248) (0.1328)
[p value] (0.4265) (0.4228) (0.0970) (0.0007) (0.0004)
Bank Concentration X External dependence (RZ all firms) ‐0.0172 ‐0.0652 (Standard Error) (0.0134) (0.0835)
[p value] (0.1997) (0.4347)
Bank Concentration X External dependence (RZ young firms) ‐0.0074 ‐0.0215 (Standard Error) (0.0122) (0.0679)
[p value] (0.5425) (0.7515)
R‐Squared 0.3686 0.3695 0.3322 0.6615 0.6288 Number of Observations 1313 1313 1228 1313 1228 Notes: The regression in Column (1) corresponds to Equation 1 in the text; those in Columns (2) and (3) correspond to Equation 2; and those in Columns (4) and (5) correspond to Equation 3. All regressions include a constant term and state, industry and year fixed effects. Standard Errors are clustered by state and industry. * indicates significance at the 10 percent level, ** significance at the 5 percent level, *** significance at the 1 percent level
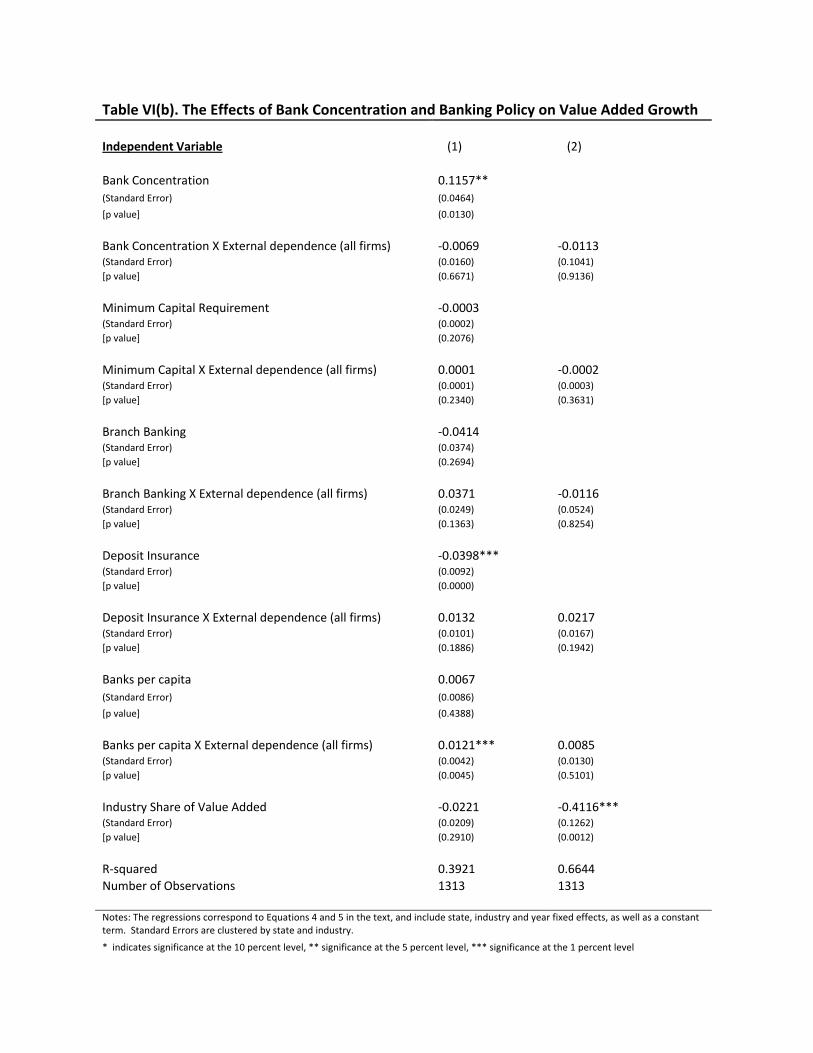
Table VI(b). The Effects of Bank Concentration and Banking Policy on Value Added Growth Independent Variable (1) (2) Bank Concentration 0.1157** (Standard Error) (0.0464) [p value] (0.0130) Bank Concentration X External dependence (all firms) ‐0.0069 ‐0.0113 (Standard Error) (0.0160) (0.1041) [p value] (0.6671) (0.9136)
Minimum Capital Requirement ‐0.0003 (Standard Error) (0.0002) [p value] (0.2076)
Minimum Capital X External dependence (all firms) 0.0001 ‐0.0002 (Standard Error) (0.0001) (0.0003) [p value] (0.2340) (0.3631)
Branch Banking ‐0.0414 (Standard Error) (0.0374) [p value] (0.2694)
Branch Banking X External dependence (all firms) 0.0371 ‐0.0116 (Standard Error) (0.0249) (0.0524) [p value] (0.1363) (0.8254)
Deposit Insurance ‐0.0398*** (Standard Error) (0.0092) [p value] (0.0000)
Deposit Insurance X External dependence (all firms) 0.0132 0.0217 (Standard Error) (0.0101) (0.0167) [p value] (0.1886) (0.1942)
Banks per capita 0.0067 (Standard Error) (0.0086) [p value] (0.4388) Banks per capita X External dependence (all firms) 0.0121*** 0.0085 (Standard Error) (0.0042) (0.0130) [p value] (0.0045) (0.5101)
Industry Share of Value Added ‐0.0221 ‐0.4116*** (Standard Error) (0.0209) (0.1262) [p value] (0.2910) (0.0012)
R‐squared 0.3921 0.6644 Number of Observations 1313 1313 Notes: The regressions correspond to Equations 4 and 5 in the text, and include state, industry and year fixed effects, as well as a constant term. Standard Errors are clustered by state and industry.
* indicates significance at the 10 percent level, ** significance at the 5 percent level, *** significance at the 1 percent level

Table VII(b). The Effects of Bank Concentration and Policy on Manufacturing Value Added Growth (Rajan‐Zingales dependence measure replaced by Average Firm Size) Independent Variable (1) (2) Bank Concentration 0.1169** (Standard Error) (0.0470) [p value] (0.0132)
Bank Concentration X Average Firm Size ‐1.24E‐07 7.26E‐07 * (Standard Error) (1.71E‐07) 3.84E‐07 [p value] (0.4716) (0.0596)
Minimum Capital Requirement ‐0.0003 (Standard Error) (0.0002) [p value] (0.1871)
Minimum Capital X Average Firm Size 3.50E‐10 3.22E‐09 (Standard Error) (1.02E‐09) 2.37E‐09 [p value] (0.7314) (0.1749)
Branch Banking ‐0.0672* (Standard Error) (0.0384) [p value] (0.0812)
Branch Banking X Average Firm Size 3.32E‐07 * 3.37E‐07 (Standard Error) (1.82E‐07) 5.86E‐07 [p value] (0.0682) (0.5659)
Deposit Insurance ‐0.0435*** (Standard Error) (0.0112) [p value] (0.0001) Deposit Insurance X Average Firm Size 2.53E‐08 4.12E‐08 (Standard Error) (5.30E‐08) 1.03E‐07 [p value] (0.6336) (0.6902)
Banks per capita 0.0031 (Standard Error) (0.0089) [p value] (0.7258)
Banks per capita X Average Firm Size 3.82E‐08 2.30E‐07 ***
(Standard Error) (2.91E‐08) 8.43E‐08
[p value] (0.1899) (0.0066)
Industry Share of Value Added 0.0016 ‐0.4144*** (Standard Error) (0.0219) (0.1243) [p value] (0.9426) (0.0009)
Average Firm Size in Industry ‐2.45E‐08
(Standard Error) (3.15E‐08) [p value] (0.4364) R‐squared 0.3818 0.6678 Number of Observations 1313 1313 Notes: The regressions correspond to Equations 4 and 5 in the text. Regressions include state, industry and year fixed effects, as well as a constant term. Standard errors are clustered by state and industry. Average firm size is defined as average value added per establishment.
* indicates significance at the 10 percent level, ** significance at the 5 percent level, *** significance at the 1 percent level
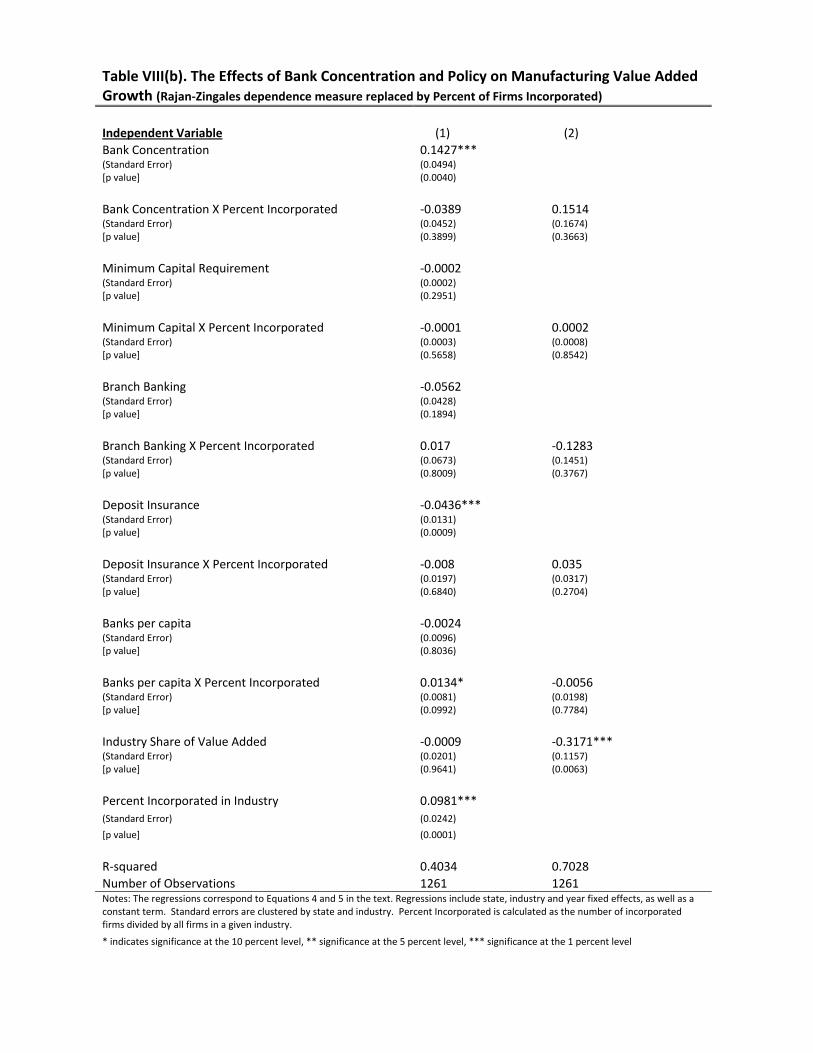
Table VIII(b). The Effects of Bank Concentration and Policy on Manufacturing Value Added Growth (Rajan‐Zingales dependence measure replaced by Percent of Firms Incorporated) Independent Variable (1) (2) Bank Concentration 0.1427*** (Standard Error) (0.0494) [p value] (0.0040)
Bank Concentration X Percent Incorporated ‐0.0389 0.1514 (Standard Error) (0.0452) (0.1674) [p value] (0.3899) (0.3663)
Minimum Capital Requirement ‐0.0002 (Standard Error) (0.0002) [p value] (0.2951)
Minimum Capital X Percent Incorporated ‐0.0001 0.0002 (Standard Error) (0.0003) (0.0008) [p value] (0.5658) (0.8542)
Branch Banking ‐0.0562 (Standard Error) (0.0428) [p value] (0.1894)
Branch Banking X Percent Incorporated 0.017 ‐0.1283 (Standard Error) (0.0673) (0.1451) [p value] (0.8009) (0.3767)
Deposit Insurance ‐0.0436*** (Standard Error) (0.0131) [p value] (0.0009)
Deposit Insurance X Percent Incorporated ‐0.008 0.035 (Standard Error) (0.0197) (0.0317) [p value] (0.6840) (0.2704)
Banks per capita ‐0.0024 (Standard Error) (0.0096) [p value] (0.8036)
Banks per capita X Percent Incorporated 0.0134* ‐0.0056 (Standard Error) (0.0081) (0.0198) [p value] (0.0992) (0.7784)
Industry Share of Value Added ‐0.0009 ‐0.3171*** (Standard Error) (0.0201) (0.1157) [p value] (0.9641) (0.0063)
Percent Incorporated in Industry 0.0981*** (Standard Error) (0.0242) [p value] (0.0001) R‐squared 0.4034 0.7028 Number of Observations 1261 1261 Notes: The regressions correspond to Equations 4 and 5 in the text. Regressions include state, industry and year fixed effects, as well as a constant term. Standard errors are clustered by state and industry. Percent Incorporated is calculated as the number of incorporated firms divided by all firms in a given industry.
* indicates significance at the 10 percent level, ** significance at the 5 percent level, *** significance at the 1 percent level