Embed Size (px)
Citation preview
Bank Risk Ratings and the Pricing of Agricultural Loans
Nick Walraven Federal Reserve BoardWashington DC 20551
and
Peter BarryUniversity of [email protected]
Draft: September 2003
Abstract
In this paper, we review the prevalence of the use of risk ratings by commercial banks thatparticipated in the Federal Reserve’s Survey of Terms of Bank Lending to Farmers between 1997and 2002. We find that adoption of risk rating procedures held about steady over the period, witha little less than half the banks on the panel either not using a risk rating system, or reporting thesame rating for all their loans in the survey. However, most of these banks were small, androughly four-fifths of all sample loans carried an informative risk rating. We found that aftercontrolling for the size and performance of the bank and as many nonprice terms of the loan aspossible, banks consistently charged higher rates of interest for the farm loans that theycharacterized as riskier, with an average difference in rates between the most risky and least riskyloans of about 1-1/2 percentage points.
The analysis and conclusions in this paper are the authors’ and do not necessarily reflect theopinions of the Board of Governors, the University of Illinois, or their respective staffs. Wethank the participants at the NC-221 Regional Research Committee meeting in Denver Colorado,October 3-4, 2002 for helpful comments and suggestions and Edward Johnson for researchassistance.
2
Bank Risk Ratings and the Pricing of Agricultural Loans
The management of risk by commercial banks in the U.S. and other developed countries
has advanced significantly to now address the frequency and severity of loss and an enterprise-
wide perspective on credit, market, and operational risks. The goals of risk management are to
refine the measures of risk, better match economic capital to the overall risk profile, allocate
capital efficiently among the respective bank enterprises, and to price loans and other products
and services consistent with their marginal contributions to economic capital and risk-adjusted
returns on capital (Matten (2000); Beisses (2002; Smithson (2003); Saunders(1999)). The
proposed New Basel Accord emphasizes these refinements, while offering a menu of choices for
institutions of different size, operating environments, complexities, and market characteristics.
The menu ranges from an expanded set of risk weights compared with those in the 1988 Accord
to internal-ratings-based approaches in which institutions estimate probabilities of default and the
resulting loss by rating classes of borrowers and loans.
The use of risk-rating systems to summarize multiple features of a bank’s customers or
loans has been spreading through the banking system for at least a decade, first among larger
banks, and gradually to medium and smaller banks (Brady, English, and Nelson, 1998; Treacy
and Carey, 1998). According to Brady, English, and Nelson, virtually all large banks rated loans
in the August 1998 Survey of Terms of Bank Lending by the Federal Reserve System; in
contrast, most medium to small banks either did not rate loans or assigned all the loans in the
survey to a single rating category. Assessing the adoption of these risk, capital, and pricing
practices by banks with different attributes is important to understanding the scope and depth of
their management resources, their likely adoption of more sophisticated technology in the future,
and the design of risk-based capital regulations for safety and soundness in a diverse banking
system.
Little contemporary evidence is available about the use of such practices on agricultural
loans (for past studies of credit risk management by agricultural banks, see Barry and Calvert
(1983); Moss, Barry and Ellinger (1997); Miller et al (1993); Swackhamer and Doll (1969)). In
2003, about half of U.S. commercial banks lending to farmers occurred through smaller
3
community banks that had less than $500 million of assets (ERS,USDA), half came from larger,
regional or national banks. The diversity in size and management of banks that lend to farmers
suggests the need for a range of capital management and risk assessment guidelines and
continued monitoring of structural change in agricultural lending.
This paper reviews the use of risk ratings, risk-adjusted pricing, and other responses to
credit risk by commercial banks when making new agricultural loans. Quarterly data from the
Federal Reserve’s Survey of the Terms of Bank Lending to Farmers (STBLF) from August 1997
through August 2002 are utilized following the methods employed for business lending by
English and Nelson (1998) (hereafter referred to as EN). Bank characteristics, loan pricing, and
other risk management tools are summarized, compared to the August 1998 findings of EN, and
then evaluated using regression procedures to determine the effects of risk ratings and other risk
control practices on interest rates for new farm loans.
Surveying Banks About Agricultural Lending
The data for our analysis of risk pricing on agricultural loans comes mainly from the
Federal Reserve’s Survey of the Terms of Bank Lending to Farmers. This section provides a
brief history of that survey and reviews its current scope and the selection of its panel (a more
detailed description of the evolution of the survey may be found in Walraven and Slowinski
(1993)).
In 1977, the Federal Reserve Board requested a quarterly survey of banks to gauge the
cost, volume, terms, and purpose of credit extended to both commercial businesses and to
farmers. A single longitudinal survey panel of banks was selected to gather information about
both types of lending. The survey has been modified since that time, most notably in 1989, when
a separate panel of banks was selected to report information on farm loans (some banks remained
on both the business loan panel and the farm loan panel), and in 1998 when questions about the
riskiness of loans were added to both surveys.
Since the panel redesign in 1989, a stratified, random sample of 250 insured commercial
banks reports information on each agricultural loan completed during the first week of the second
1 “Agricultural loan” refers to either of the farm loan definitions employed in thequarterly Report of Condition (Call report). Included are both “loans to finance agriculturalproduction or other loans to farmers” and “loans secured by farm real estate”.
4
month of each quarter 1. Because the volume of agricultural loans is highly skewed across the
universe of commercial banks, the first stratum of the survey panel includes ten agricultural
lenders that are among the largest holders of agricultural loans. The remaining commercial
banks holding at least $1 million in agricultural loans are divided into four strata, with the
members of each stratum holding successively smaller amounts of farm loans. Sixty banks are
chosen randomly from each of these strata.
During the sampling week in each quarter, banks in the survey report the amount, the rate
of interest, the maturity, and some non-price terms of each loan that they complete. In recent
years, around 200 sample banks report roughly 4000 loans in each survey.
The prevalence of risk rating in the STBLF panel
About 1/4 of the banks in the panel (48 of 186) for the August 1998 STBLF did not rate
the farm loans that they closed, and almost as many (36 of 186 banks) assigned the same risk
rating to all of the survey loans that were reported. Similar to the EN findings, almost all of the
banks in the 1998 survey that either did not assign risk ratings or gave all loans the same risk
rating were small banks (less than $1 billion in assets). As a group, these banks accounted for
about 18 percent (739 of 4072) of the total number of farm loans in the August 1998 survey.
Although anecdotes suggest that the use of risk-rating systems has been spreading for all
types of loans, according to the STBLF panel, the proportion of banks that assigned risk ratings
was little changed during the five years following the EN business loan survey. In the August
2002 survey, about 1/5 of the panel (38 of 172 banks) did not rate farm loans, and about 1/4 (42
of 172 banks) reported no variation in risk ratings; although in total, these 80 banks closed a little
fewer than 9 percent of the loans reported in the August 2002 survey (440 of 5105 survey loans),
a proportion well below the 1998 reading, which gives some support to the assertion that the
proportion of farm loans having a risk rating has been growing.
5
Most of the banks remain on the survey from one quarter to the next; indeed, 120 of the
banks that reported closing at least one loan in the August 1998 survey also reported a loan in
August 2002. Among this group of banks, about 50 assigned loans to multiple risk categories in
both 1998 and 2002. This set of banks reported about 2/3 of the number of sample loans (3231
of 5105) in the most recent survey. Another 10 banks that reported in both periods did not rate
farm loans in 1998, but had begun to report ratings by 2002. A set of 22 banks that did not rate
farm loans in 1998 still did not rate farm loans in 2002, and another 10 banks had discontinued
rating farm loans by 2002. These 32 banks reported 245 loans in the August 2002 survey. The
remaining 29 banks that reported loans in both 1998 and 2002 assigned all the loans the same
risk rating. Although this singularity is a little unfortunate from an econometric point of view, to
some degree it was inevitable—most banks in this last group reported closing fewer than 5 loans
during the August 2002 sample week, and given that the risk descriptions were designed so that
most loans fell in the middle of the risk scale, it seems plausible that among only a handful of
loans at a particular bank that they all could be ranked similarly.
Description of risk rating categories
Banks participating in the survey are asked to map their internal risk ratings into a set of
five rating categories that are described in detail in the reporting instructions. The loans are
characterized in terms of the probability of a loss to the bank, rather than the probability of a
default by the borrower. As a result, requirements for compensating balances or collateral can
lower the risk rating of an otherwise more risky loan. Loans placed in Category 1, the “minimal”
risk category, should bear virtually no chance of loss to the bank. Loans in Category 2, are
described as “very unlikely” to result in a loss to the bank. Category 3 loans were termed
“moderate risk” and were intended to be an average loan to a typical borrower under average
economic conditions. The survey was designed so that most loans would fall in Category 3.
Loans placed in Category 4, although still bearing an “acceptable” degree of risk, were in some
sense substandard. Category 5 loans were described as “Special mention” loans, such as work-
out loans--new loans typically would not fall in this category. Two additional rating categories
6
were provided, the first for banks that rated some loans, but not a particular one that was
reported, while the final designation was for banks that did not rate loans.
Farm loan characteristics by risk rating
August 1998 Survey
In order to compare the EN averages for business loans to the STBLF data, we computed
averages by bank size and risk category that were weighted by the size of the loan and by a
stratum blowup factor reflecting the ratio of the volume of farm loans outstanding at the panel
bank to the volume outstanding at banks not in the survey. As shown in Table 1, panel banks in
1998 tended to adjust rates of interest on their loans according to the reported riskiness of the
loans in the sense that loans rated the least risky generally had lower rates and those rated most
risky tended to carry higher rates. However, there was a large degree of variability about this
broad assertion. Large banks, which are defined as having more than $1 billion in assets, closed
transactions on loans with a risk rating of 3 tended that, on average, carried lower rates of interest
than those with less risky ratings. For medium-sized banks (assets between $1 billion and $100
million) and small banks (assets less than $100 million) loans in Category 4 tended to carry
lower rates than loans in Category 3. EN found closer correspondence between reported
riskiness of C&I loans and the average interest rate than these averages suggest for farm loans.

7
Table 1
Average Loan Rate by Risk Rating
(Weighted by Loan Volume)
August 1998 Survey of Terms of Bank Lending to Farmers
Risk Rating
1 2 3 4 5 All
All 9.32% 9.45% 8.68% 8.93% 9.49% 9.06%
Large Bank 7.98% 8.83% 7.96% 8.77% 9.10% 8.44%
Medium Bank 9.39% 9.68% 10.22% 9.92% 10.16% 10.00%
Small Bank 9.33% 9.42% 10.14% 9.86% 10.95% 9.62%
To the extent that reported rates of interest fail to increase with the reported risk rating,
other characteristics of the loan likely compensate the lender for bearing the risk. To examine
this possibility for the August 1998 survey, other reported features of the loans, can be broken
out by risk ratings (Table 2). On average, farm loans in the survey were small; the overall
weighted average amount for each loan was $27.3 thousand, with the weighted-average amount
increasing uniformly with the size of the loan from $15.6 thousand for the least risky loans to
$79.3 thousand for the most risky loans. In general, loans rated as less risky were more likely to
have collateral associated with them, consistent with the Berger and Udell (1990) hypothesis that
collateral requirements often offset some of the risk of the loan. Furthermore, less risky loans
tended to carry provisions allowing the bank to call the note before maturity, likely affording the
bank some protection from post-closing changes in the pattern of interest rates in the general
economy. In addition, riskier loans were more likely to have been made under a prior
commitment, which is consistent with Morgan’s (1998) hypothesis that, as economic conditions
worsen (i.e. the general riskiness in the economy increases), lenders make relatively more loans
under preexisting commitments and relatively fewer new loans . Prepayment penalties, although
rare overall, tended to be more prevalent for loans with risk ratings of 3 or above. Finally, the

8
average maturity of the loans fell with reported riskiness, perhaps suggesting some concerns
about interest rate risk or repayment capability that were not sufficiently assuaged by call
provisions, collateral requirements, and other terms of the loan.
Table 2
Loan Characteristics by Risk Rating
Weighted by Loan Volume
August 1998 Survey of Terms of Bank Lending to Farmers
Risk Rating
1 2 3 4 5 All
Amount (thousand $) 15.6 16.7 31.2 53.7 79.3 27.3
Percent With Collateral 94.9 94.8 61.0 36.9 48.0 66.8
Percent Under
Commitment
57.0 70.0 85.1 92.1 94.7 80.0
Percent Callable 18.4 24.3 14.5 5.9 9.8 14.0
Percent with Prepayment
Penalty
0.1 0.1 3.5 0.8 0.5 1.6
Average Maturity (months) 21.3 18.6 12.4 5.8 9.4 12.8
August 2002 Survey
Despite a multitude of changes between 1998 and 2002 among agricultural lenders, the
agricultural sector, and the economy as a whole, we examined the August 2002 survey data
within the same framework as the August 1998 survey. Summary statistics are shown in Table 3.
In August of 2002, rates of interest at all sizes of banks showed a more consistent tendency to
increase with the reported riskiness of loans, perhaps reflecting a better use of nonprice terms to
adjust the riskiness of the loans than in 1998. For instance, the proportion of loans that were

9
secured rose to more than 90 percent in the August 2002 survey, well above the 67 percent that
were secured in the survey four years earlier. In addition, loans in the riskier categories were
much more likely to be secured in the more recent survey. The proportion of survey loans that
the bank can call prior to the maturity date rose substantially for loans that were of average or
lower risk (risk ratings 1 to 3).
Table 3
August 2002 Survey of Terms of Bank Lending to Farmers
(weighted by loan volume)
Risk Rating
Rates by bank size 1 2 3 4 5 All
Large Bank 4.30% 4.40% 4.72% 5.11% 6.09% 4.99%
Medium Bank 5.91% 6.89% 7.19 % 7.48% 7.63% 7.11%
Small Bank 7.04% 7.01% 7.78 % 8.19% 9.46% 7.36%
All banks 6.75% 6.86% 6.00% 5.39% 6.54% 6.05%
Loan Characteristics
Amount (thousand $) 15.5 19.0 24.0 37.6 34.0 24.9
Percent with Collateral 95.0 96.2 88.6 95.1 98.8 92.7
Percent With Commitment 76.4 73.3 74.7 93.1 92.2 80.3
Percent Callable 27.0 28.2 30.3 3.9 3.3 20.6
Percent with
Prepayment Penalty
1.8 0.4 1.1 3.5 0.5 1.8
Average Maturity 21.5 11.8 15.9 10.0 5.5 13.2
Controlling for variations in termsIn this section we use regression analysis to examine the effect of various terms on the
rate of interest charged by the bank. We include data from all the quarterly surveys from August
1998 through May 2002, which provided 84,265 loans. Roughly following EN, we include either
quantitative or qualitative measures of all the nonprice terms of the loan as explanatory variables
2 The Call reports are quarterly statements of financial information that are submitted tobanking regulators. The information reported typically could be found on a bank’s balance sheetor income statement.
3 In this paper, a nonagricultural bank is one that holds a proportion of agricultural loansin its loan portfolio that is smaller than the unweighted average of the ratios of agricultural loansto total loans at all commercial banks. In recent years, that average has held around 15 percent oftotal loans.
10
for the rate of interest.
The STBLF includes some nonprice indicators that are not included in the STBL survey.
First, respondents to the STBLF survey indicate whether the loan is secured by farm real estate,
some other type of security, or is unsecured–STBL respondents indicate only whether the loan is
secured. Over the entire sample used in this paper, about 8-1/2 percent of loans were secured by
farm real estate, although many of these loans have a maturity that is much shorter than one
might expect for a farm mortgage. The farm survey also asks whether the loan is insured by a
federal agency, an important consideration given the various programs available to bankers
through the Farm Services Agency (formerly the Farmers Home Administration). Finally, the
farm survey asks whether the loan was made in participation with other banks, a traditional
means that rural banks use to limit exposure to individual loans.
Our regression specification also differs from EN in that we add bank-specific factors that
might influence the rate of interest offered on the loan. Banks that maintain a substantial
portfolio of agricultural loans differ markedly across various size and performance measures.
For example, in the March 2003 Call report2, almost half of farm loans were held by
“nonagricultural” banks.3 These institutions typically can diversify risks that they perceive in
their farm loans against those in other parts of their portfolio, perhaps reducing the compensation
they require for more risky loans. We include the ratio of the volume of the bank’s farm loans to
its total loans as a right-hand-side variable to control for this type of difference.
In addition, the March Call report also indicates that almost 60 percent of the outstanding
volume of agricultural loans was held by banks with assets of less than $500 million. These
small banks typically depend more heavily than larger banks on depository sources of loanable
funds, and their cost of funding loans likely differs substantially from larger competitors.
11
Smaller banks also tend to be less diversified geographically, so that they may be more
vulnerable than larger banks to adverse local events; for example, drought conditions in only a
couple of counties could cause a significant proportion of a small bank’s loan customers to have
trouble meeting scheduled payments, while a larger bank might be less vulnerable to this sort of
shock. To account for these potential differences in our regressions, we add the natural logarithm
of the bank’s assets as an explanatory variable.
We include several other ratios that are related to bank performance: 1) return on assets,
2) interest expense/ total assets, 3) delinquent loans / total loans, and 4) net charge-offs / total
loans. We also include the ratio of loans to deposits, a traditional indicator of bank liquidity.
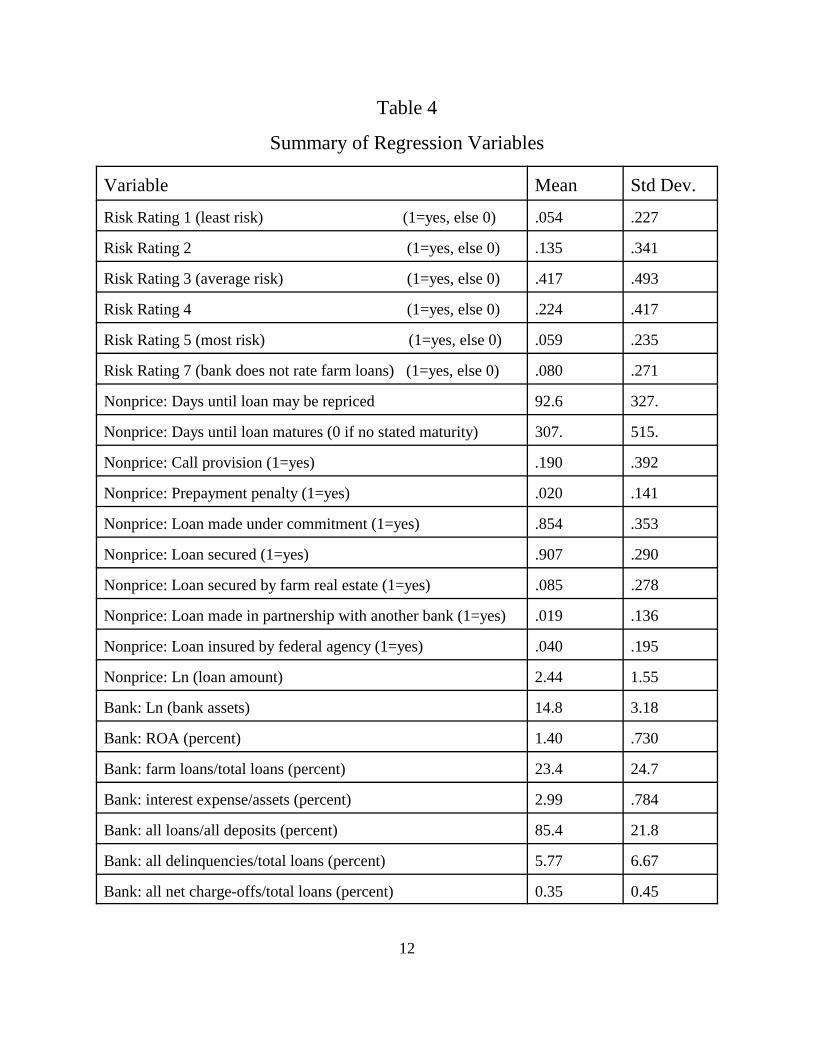
Table 4 lists the all of the variables used in the regressions, along with the mean and
standard deviation for each; contrary to the previous tables, these statistics are calculated from
raw, unweighted data. For instance, the mean of the 0-1 indicators shows that 5.4 percent of the
sample loans fell in the first (least risky) category, while 41.7 percent were rated in the third
(typical risk) category. The average interval until the loan could be repriced was about 3 months,
while the average maturity was a little less than one year. Roughly 1/5 of the loans in the sample
could be called by the bank, and very few (about 2 percent) carried a prepayment penalty. Most
of the loans (more than 85 percent) were made under some sort of prior commitment, and more
than 9 out of every 10 loans were secured (although relatively few were secured by farm real
estate). The loans tended to come from banks that were more profitable–the average ROA for
banks making the loans was 1.4 percent, a good bit above the 1.1 percent average rate of return
for all small agricultural banks between 1997 and 2002 (Agricultural Finance Databook). The
delinquency rate at banks making the loans was about 5-3/4 percent, considerably greater than
the delinquency rate that prevailed at most agricultural banks.
12
Table 4
Summary of Regression Variables
Variable Mean Std Dev.
Risk Rating 1 (least risk) (1=yes, else 0) .054 .227
Risk Rating 2 (1=yes, else 0) .135 .341
Risk Rating 3 (average risk) (1=yes, else 0) .417 .493
Risk Rating 4 (1=yes, else 0) .224 .417
Risk Rating 5 (most risk) (1=yes, else 0) .059 .235
Risk Rating 7 (bank does not rate farm loans) (1=yes, else 0) .080 .271
Nonprice: Days until loan may be repriced 92.6 327.
Nonprice: Days until loan matures (0 if no stated maturity) 307. 515.
Nonprice: Call provision (1=yes) .190 .392
Nonprice: Prepayment penalty (1=yes) .020 .141
Nonprice: Loan made under commitment (1=yes) .854 .353
Nonprice: Loan secured (1=yes) .907 .290
Nonprice: Loan secured by farm real estate (1=yes) .085 .278
Nonprice: Loan made in partnership with another bank (1=yes) .019 .136
Nonprice: Loan insured by federal agency (1=yes) .040 .195
Nonprice: Ln (loan amount) 2.44 1.55
Bank: Ln (bank assets) 14.8 3.18
Bank: ROA (percent) 1.40 .730
Bank: farm loans/total loans (percent) 23.4 24.7
Bank: interest expense/assets (percent) 2.99 .784
Bank: all loans/all deposits (percent) 85.4 21.8
Bank: all delinquencies/total loans (percent) 5.77 6.67
Bank: all net charge-offs/total loans (percent) 0.35 0.45
13
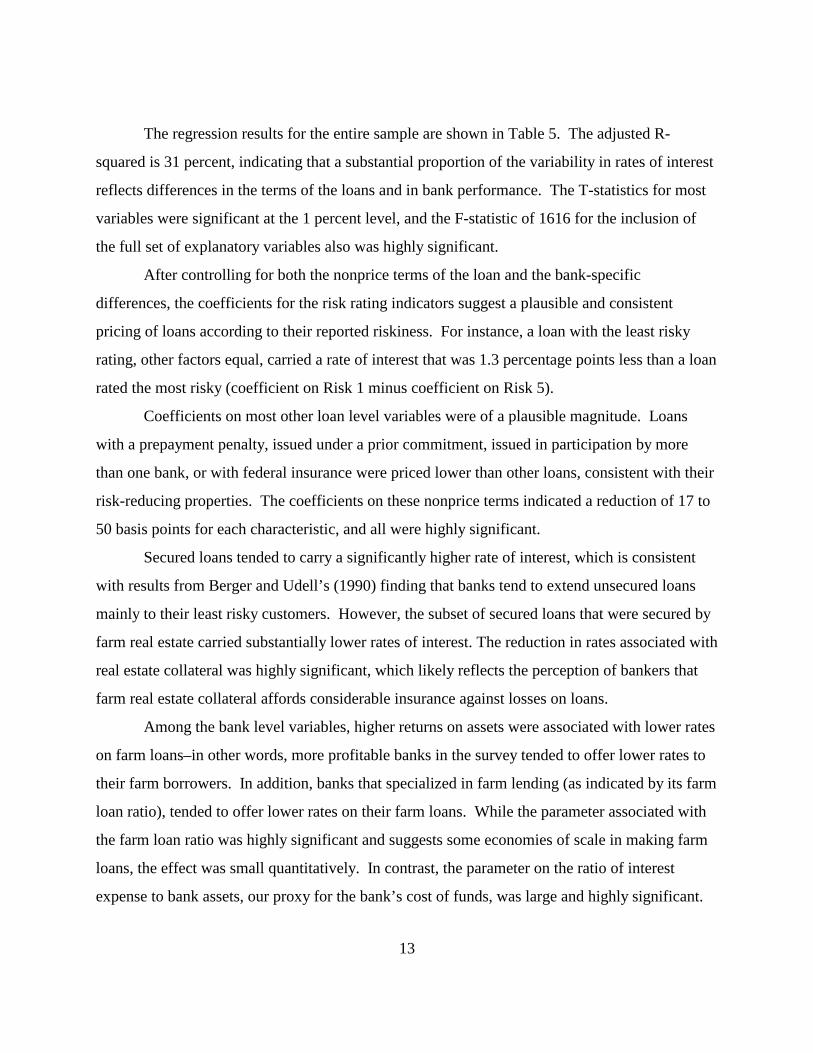
The regression results for the entire sample are shown in Table 5. The adjusted R-
squared is 31 percent, indicating that a substantial proportion of the variability in rates of interest
reflects differences in the terms of the loans and in bank performance. The T-statistics for most
variables were significant at the 1 percent level, and the F-statistic of 1616 for the inclusion of
the full set of explanatory variables also was highly significant.
After controlling for both the nonprice terms of the loan and the bank-specific
differences, the coefficients for the risk rating indicators suggest a plausible and consistent
pricing of loans according to their reported riskiness. For instance, a loan with the least risky
rating, other factors equal, carried a rate of interest that was 1.3 percentage points less than a loan
rated the most risky (coefficient on Risk 1 minus coefficient on Risk 5).
Coefficients on most other loan level variables were of a plausible magnitude. Loans
with a prepayment penalty, issued under a prior commitment, issued in participation by more
than one bank, or with federal insurance were priced lower than other loans, consistent with their
risk-reducing properties. The coefficients on these nonprice terms indicated a reduction of 17 to
50 basis points for each characteristic, and all were highly significant.
Secured loans tended to carry a significantly higher rate of interest, which is consistent
with results from Berger and Udell’s (1990) finding that banks tend to extend unsecured loans
mainly to their least risky customers. However, the subset of secured loans that were secured by
farm real estate carried substantially lower rates of interest. The reduction in rates associated with
real estate collateral was highly significant, which likely reflects the perception of bankers that
farm real estate collateral affords considerable insurance against losses on loans.
Among the bank level variables, higher returns on assets were associated with lower rates
on farm loans–in other words, more profitable banks in the survey tended to offer lower rates to
their farm borrowers. In addition, banks that specialized in farm lending (as indicated by its farm
loan ratio), tended to offer lower rates on their farm loans. While the parameter associated with
the farm loan ratio was highly significant and suggests some economies of scale in making farm
loans, the effect was small quantitatively. In contrast, the parameter on the ratio of interest
expense to bank assets, our proxy for the bank’s cost of funds, was large and highly significant.
14
Indeed, the coefficient of about unity suggests that banks tended to pass higher funding costs
directly to their borrowers. In addition, greater bank liquidity, as measured by the ratio of loans
to deposits, was associated with lower rates on new loans.
Among our indicators of portfolio quality, the higher the rate of delinquencies in the
bank’s portfolio (total delinquencies, both agricultural loans and other loans), the lower the rate
charged on new loans. Similarly, banks with a higher rate of net charge-offs closed new farm
loans with significantly lower rates of interest than other banks in the sample. However, both of
these indicators are somewhat difficult to interpret because they are backward-looking, while
new loans necessarily reflect the bank’s assessment of the borrowers prospects in the future.

15
Table 5
Summary of Regression EstimatesDependent Variable: Effective Rate of Interest Observations: 84265 Adjusted R2: .306 F-statistic: 1616.
Variable Parameter t-value
Intercept 7.55 88.54
Loan-Level Variables
Risk Rating 1 (least risk) .03 .75
Risk Rating 2 .22 6.68
Risk Rating 3 (average risk) .72 23.69
Risk Rating 4 .70 22.35
Risk Rating 5 (most risk) 1.34 37.08
Risk Rating 7 (not rated by bank) .78 22.15
Days until loan may be repriced -.00025 -12.62
Days until loan matures .00004 3.13
Call provision .25 17.10
Prepayment penalty -.33 -9.0
Under commitment -.30 -18.44
Secured .13 7.02
Secured by farm real estate -.44 -22.63
In partnership with another bank -.50 -13.32
Insured by federal agency -.17 -6.22
Ln (loan amount) -.11 -31.04
Bank-Level Variables
Ln (bank assets) .004 1.01
ROA (percent) -.21 -27.11
Farm loans/total loans (percent) -.007 -18.48
Interest expense/assets (percent) 1.05 111.14
All loans/all deposits (percent) -.02 -49.34
All delinquencies/total loans (percent) -.02 -24.13
All net charge-offs/total loans (percent) -.38 -29.95
16
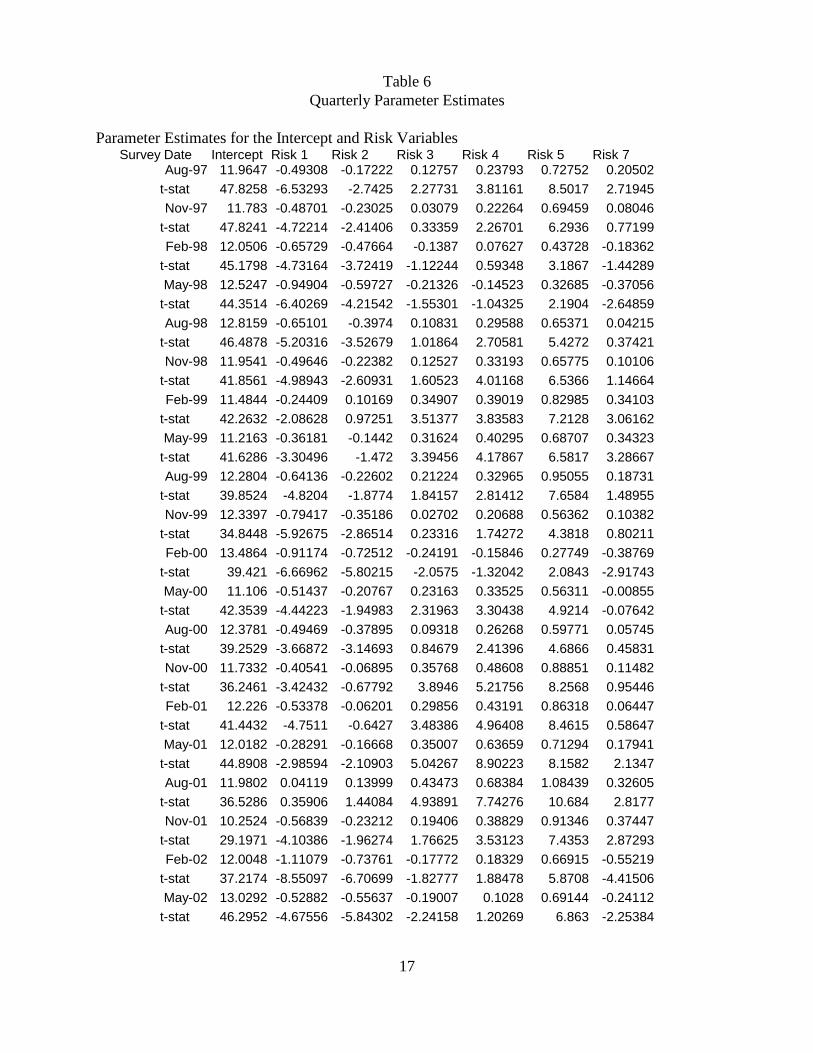
Of course, economic conditions in the farm sector, as well as those in the broader
economy, change considerably over time, and it seems reasonable to expect that these changes
might affect the price and terms offered by banks to their farm customers. To explore changes in
the terms of agricultural lending over time, we fit the regression described above separately to
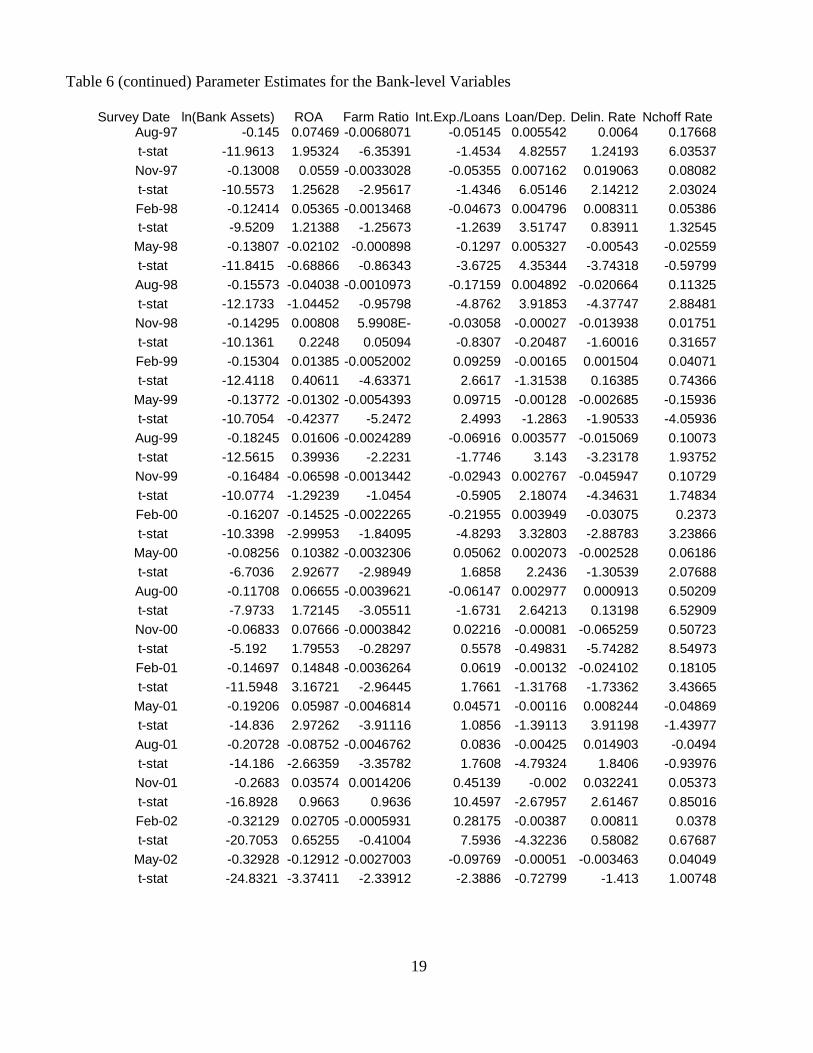
data for each quarter. The resulting lengthy list of parameter estimates is given in Table 6. As in
the previous regression, we controlled for as many terms of the loan as possible and for variation
in bank characteristics and performance in the sample. As a result, one can examine the changes
over time in the spreads for loans of different riskiness. For example, the estimated coefficient
for loans that were rated least risky (risk rating 1) ranged from -0.95 (i.e. 95 basis points) in the
May 1998 survey to 0.04 (and statistically insignificant) in the August 2001 survey. Note that
these spreads were calculated relative to loans in risk category “6", i.e. those loans that were not
rated by the bank, although the bank did have a risk-rating program for loans in place (this was
the risk rating category that was omitted as an explanatory variable in the regressions in order to
avoid multicolinearity among the parameter estimates).
17
Table 6Quarterly Parameter Estimates
Parameter Estimates for the Intercept and Risk VariablesSurvey Date Intercept Risk 1 Risk 2 Risk 3 Risk 4 Risk 5 Risk 7
Aug-97 11.9647 -0.49308 -0.17222 0.12757 0.23793 0.72752 0.20502 t-stat 47.8258 -6.53293 -2.7425 2.27731 3.81161 8.5017 2.71945
Nov-97 11.783 -0.48701 -0.23025 0.03079 0.22264 0.69459 0.08046 t-stat 47.8241 -4.72214 -2.41406 0.33359 2.26701 6.2936 0.77199
Feb-98 12.0506 -0.65729 -0.47664 -0.1387 0.07627 0.43728 -0.18362 t-stat 45.1798 -4.73164 -3.72419 -1.12244 0.59348 3.1867 -1.44289
May-98 12.5247 -0.94904 -0.59727 -0.21326 -0.14523 0.32685 -0.37056 t-stat 44.3514 -6.40269 -4.21542 -1.55301 -1.04325 2.1904 -2.64859
Aug-98 12.8159 -0.65101 -0.3974 0.10831 0.29588 0.65371 0.04215 t-stat 46.4878 -5.20316 -3.52679 1.01864 2.70581 5.4272 0.37421
Nov-98 11.9541 -0.49646 -0.22382 0.12527 0.33193 0.65775 0.10106 t-stat 41.8561 -4.98943 -2.60931 1.60523 4.01168 6.5366 1.14664
Feb-99 11.4844 -0.24409 0.10169 0.34907 0.39019 0.82985 0.34103 t-stat 42.2632 -2.08628 0.97251 3.51377 3.83583 7.2128 3.06162
May-99 11.2163 -0.36181 -0.1442 0.31624 0.40295 0.68707 0.34323 t-stat 41.6286 -3.30496 -1.472 3.39456 4.17867 6.5817 3.28667
Aug-99 12.2804 -0.64136 -0.22602 0.21224 0.32965 0.95055 0.18731 t-stat 39.8524 -4.8204 -1.8774 1.84157 2.81412 7.6584 1.48955
Nov-99 12.3397 -0.79417 -0.35186 0.02702 0.20688 0.56362 0.10382 t-stat 34.8448 -5.92675 -2.86514 0.23316 1.74272 4.3818 0.80211
Feb-00 13.4864 -0.91174 -0.72512 -0.24191 -0.15846 0.27749 -0.38769 t-stat 39.421 -6.66962 -5.80215 -2.0575 -1.32042 2.0843 -2.91743
May-00 11.106 -0.51437 -0.20767 0.23163 0.33525 0.56311 -0.00855 t-stat 42.3539 -4.44223 -1.94983 2.31963 3.30438 4.9214 -0.07642
Aug-00 12.3781 -0.49469 -0.37895 0.09318 0.26268 0.59771 0.05745 t-stat 39.2529 -3.66872 -3.14693 0.84679 2.41396 4.6866 0.45831
Nov-00 11.7332 -0.40541 -0.06895 0.35768 0.48608 0.88851 0.11482 t-stat 36.2461 -3.42432 -0.67792 3.8946 5.21756 8.2568 0.95446
Feb-01 12.226 -0.53378 -0.06201 0.29856 0.43191 0.86318 0.06447 t-stat 41.4432 -4.7511 -0.6427 3.48386 4.96408 8.4615 0.58647
May-01 12.0182 -0.28291 -0.16668 0.35007 0.63659 0.71294 0.17941 t-stat 44.8908 -2.98594 -2.10903 5.04267 8.90223 8.1582 2.1347
Aug-01 11.9802 0.04119 0.13999 0.43473 0.68384 1.08439 0.32605 t-stat 36.5286 0.35906 1.44084 4.93891 7.74276 10.684 2.8177
Nov-01 10.2524 -0.56839 -0.23212 0.19406 0.38829 0.91346 0.37447 t-stat 29.1971 -4.10386 -1.96274 1.76625 3.53123 7.4353 2.87293
Feb-02 12.0048 -1.11079 -0.73761 -0.17772 0.18329 0.66915 -0.55219 t-stat 37.2174 -8.55097 -6.70699 -1.82777 1.88478 5.8708 -4.41506
May-02 13.0292 -0.52882 -0.55637 -0.19007 0.1028 0.69144 -0.24112 t-stat 46.2952 -4.67556 -5.84302 -2.24158 1.20269 6.863 -2.25384

18
Table 6 (continued) Parameter Estimates for the Nonprice Terms of the Loan
Survey Date Reprice Maturity Callable Prepay Pen. Commit Security RE Secure Participat Fed Insur. AmountAug-97 -0.00019 4.75E-06 0.27629 -0.75149 -0.09062 0.05885 -0.10314 -0.11674 0.22815 -0.14028
t- -2.76407 0.10397 7.0784 -7.8939 -2.2137 1.36276 -1.67555 -1.03815 3.41081 -13.6192
Nov-97 -0.00032 -1.3E-05 0.26782 0.51477 -0.32017 0.06446 -0.15162 -0.28636 0.02151 -0.14256
t- -5.58977 -0.37031 6.8464 5.2765 -7.5196 1.39694 -2.33092 -2.93409 0.25447 -14.8321
Feb-98 -0.0003 -4E-05 0.23995 -0.42409 -0.35908 0.01945 -0.18019 -0.44985 0.29851 -0.12166
t- -5.76745 -1.21176 5.7167 -1.9762 -8.6236 0.38693 -3.09432 -4.31259 3.46239 -12.5196
May-98 -0.00023 1.52E-05 0.34895 -0.40166 -0.09822 0.04622 -0.0418 -0.56794 0.19577 -0.13082
t- -4.71837 0.41645 9.3999 -2.5647 -2.3183 1.00048 -0.7631 -5.46906 2.66363 -13.3474
Aug-98 -0.00027 -0.00012 0.34521 0.58627 -0.15088 0.00401 0.04228 -0.15998 0.14138 -0.15889
t- -4.48298 -2.95723 8.5602 4.4534 -3.3392 0.08788 0.65885 -1.64457 1.77816 -15.3195
Nov-98 -0.0002 -2.2E-05 0.31081 -0.10903 -0.1621 0.0609 0.03771 -0.59216 -0.14008 -0.16425
t- -3.17592 -0.56891 6.957 -0.59 -3.4051 1.26022 0.53115 -5.17509 -1.54665 -16.2145
Feb-99 -0.00013 -5.7E-05 0.1744 -0.35993 -0.28489 0.11349 -0.15161 -0.65634 0.15384 -0.14168
t- -2.65477 -1.51624 3.9498 -2.46 -6.8438 2.26891 -2.38337 -6.93978 1.71461 -14.7595
May-99 -0.00013 -1.3E-05 0.11989 -0.05146 -0.22964 0.19214 -0.24325 -0.4327 0.06825 -0.12775
t- -2.51471 -0.43605 3.3406 -0.2896 -5.4573 3.72004 -4.2119 -4.47789 1.04202 -13.0856
Aug-99 -0.00028 1.36E-05 0.16898 0.03648 -0.3568 0.04921 -0.14953 -0.49377 0.03082 -0.13045
t- -4.91228 0.33006 4.5075 0.199 -8.748 0.90245 -2.56279 -4.49874 0.4273 -13.0029
Nov-99 -0.00026 -1.6E-05 0.08725 -0.40761 -0.199 0.1336 0.07481 -0.44283 0.31457 -0.15908
t- -4.00303 -0.38099 1.8748 -1.8032 -3.9471 2.12539 1.22758 -3.78015 3.5399 -13.8542
Feb-00 -0.00039 1.15E-06 0.41934 -0.57311 -0.37955 -0.0337 -0.08152 -0.3555 0.22091 -0.11125
t- -6.47755 0.03222 9.2466 -2.8126 -7.6642 -0.49673 -1.52395 -2.90837 2.44144 -9.8858
May-00 -0.00036 0.000153 0.47257 -0.57029 -0.34004 0.05839 -0.20064 -0.19319 0.17802 -0.11399
t- -6.99077 4.04056 12.5475 -2.8878 -7.4303 1.05269 -4.43548 -1.78079 2.48221 -11.0963
Aug-00 -0.00027 2.66E-05 0.54012 -0.17368 -0.33151 0.06203 -0.12887 -0.1707 0.15098 -0.12048
t- -4.2351 0.6751 11.4835 -0.974 -6.2314 0.96419 -2.40827 -1.47133 1.75042 -10.3344
Nov-00 -0.00026 -5.3E-05 0.3997 -1.00168 -0.35539 0.06623 -0.19657 -0.3162 0.29249 -0.15958
t- -4.5922 -1.41837 7.9204 -13.6575 -6.3474 1.06715 -3.45377 -3.10796 3.2011 -15.8445
Feb-01 -0.00015 -8E-05 0.16658 -0.26712 -0.36045 -0.06803 -0.08393 -0.67956 0.17289 -0.18256
t- -2.75647 -2.7106 3.6348 -3.3755 -7.2201 -1.12731 -1.62159 -6.19707 1.88845 -18.8259
May-01 2.07E-05 -6.8E-05 0.05429 0.24669 -0.1866 -0.18957 0.06327 -0.23384 0.01675 -0.19468
t- 0.35862 -2.12492 1.3039 3.3792 -3.776 -3.98914 1.31036 -2.66617 0.2347 -21.9038
Aug-01 0.000114 -4E-05 -0.10189 0.57022 -0.37818 -0.03912 -0.14094 -0.47429 -0.0431 -0.20218
t- 1.97825 -1.01662 -2.2109 6.1852 -6.8908 -0.78093 -2.64246 -4.36047 -0.598 -20.6828
Nov-01 0.000393 -6.5E-05 -0.34335 1.36634 -0.37509 -0.00087 -0.18095 -0.60181 0.27328 -0.24985
t- 5.93557 -1.56449 -6.6449 13.618 -6.6978 -0.01388 -3.06528 -5.28968 3.06253 -23.8826
Feb-02 0.000329 -5.1E-05 -0.16862 1.10463 -0.35336 -0.12091 -0.0618 -0.78589 -0.30933 -0.20527
t- 5.38693 -1.42508 -3.2232 10.4736 -6.3012 -1.90251 -0.86609 -5.83903 -3.84503 -19.1277
May-02 0.000412 4.17E-05 -0.01275 0.02823 -0.61688 -0.09768 -0.0678 -0.69453 -0.29496 -0.20425
t- 6.70226 1.28604 -0.2889 0.4013 -12.5623 -1.81107 -1.10169 -4.92199 -4.09403 -21.1152
19
Table 6 (continued) Parameter Estimates for the Bank-level Variables
Survey Date ln(Bank Assets) ROA Farm Ratio Int.Exp./Loans Loan/Dep. Delin. Rate Nchoff RateAug-97 -0.145 0.07469 -0.0068071 -0.05145 0.005542 0.0064 0.17668
t-stat -11.9613 1.95324 -6.35391 -1.4534 4.82557 1.24193 6.03537Nov-97 -0.13008 0.0559 -0.0033028 -0.05355 0.007162 0.019063 0.08082
t-stat -10.5573 1.25628 -2.95617 -1.4346 6.05146 2.14212 2.03024Feb-98 -0.12414 0.05365 -0.0013468 -0.04673 0.004796 0.008311 0.05386
t-stat -9.5209 1.21388 -1.25673 -1.2639 3.51747 0.83911 1.32545May-98 -0.13807 -0.02102 -0.000898 -0.1297 0.005327 -0.00543 -0.02559
t-stat -11.8415 -0.68866 -0.86343 -3.6725 4.35344 -3.74318 -0.59799Aug-98 -0.15573 -0.04038 -0.0010973 -0.17159 0.004892 -0.020664 0.11325
t-stat -12.1733 -1.04452 -0.95798 -4.8762 3.91853 -4.37747 2.88481Nov-98 -0.14295 0.00808 5.9908E- -0.03058 -0.00027 -0.013938 0.01751
t-stat -10.1361 0.2248 0.05094 -0.8307 -0.20487 -1.60016 0.31657Feb-99 -0.15304 0.01385 -0.0052002 0.09259 -0.00165 0.001504 0.04071
t-stat -12.4118 0.40611 -4.63371 2.6617 -1.31538 0.16385 0.74366May-99 -0.13772 -0.01302 -0.0054393 0.09715 -0.00128 -0.002685 -0.15936
t-stat -10.7054 -0.42377 -5.2472 2.4993 -1.2863 -1.90533 -4.05936Aug-99 -0.18245 0.01606 -0.0024289 -0.06916 0.003577 -0.015069 0.10073
t-stat -12.5615 0.39936 -2.2231 -1.7746 3.143 -3.23178 1.93752Nov-99 -0.16484 -0.06598 -0.0013442 -0.02943 0.002767 -0.045947 0.10729
t-stat -10.0774 -1.29239 -1.0454 -0.5905 2.18074 -4.34631 1.74834Feb-00 -0.16207 -0.14525 -0.0022265 -0.21955 0.003949 -0.03075 0.2373
t-stat -10.3398 -2.99953 -1.84095 -4.8293 3.32803 -2.88783 3.23866May-00 -0.08256 0.10382 -0.0032306 0.05062 0.002073 -0.002528 0.06186
t-stat -6.7036 2.92677 -2.98949 1.6858 2.2436 -1.30539 2.07688Aug-00 -0.11708 0.06655 -0.0039621 -0.06147 0.002977 0.000913 0.50209
t-stat -7.9733 1.72145 -3.05511 -1.6731 2.64213 0.13198 6.52909Nov-00 -0.06833 0.07666 -0.0003842 0.02216 -0.00081 -0.065259 0.50723
t-stat -5.192 1.79553 -0.28297 0.5578 -0.49831 -5.74282 8.54973Feb-01 -0.14697 0.14848 -0.0036264 0.0619 -0.00132 -0.024102 0.18105
t-stat -11.5948 3.16721 -2.96445 1.7661 -1.31768 -1.73362 3.43665May-01 -0.19206 0.05987 -0.0046814 0.04571 -0.00116 0.008244 -0.04869
t-stat -14.836 2.97262 -3.91116 1.0856 -1.39113 3.91198 -1.43977Aug-01 -0.20728 -0.08752 -0.0046762 0.0836 -0.00425 0.014903 -0.0494
t-stat -14.186 -2.66359 -3.35782 1.7608 -4.79324 1.8406 -0.93976Nov-01 -0.2683 0.03574 0.0014206 0.45139 -0.002 0.032241 0.05373
t-stat -16.8928 0.9663 0.9636 10.4597 -2.67957 2.61467 0.85016Feb-02 -0.32129 0.02705 -0.0005931 0.28175 -0.00387 0.00811 0.0378
t-stat -20.7053 0.65255 -0.41004 7.5936 -4.32236 0.58082 0.67687May-02 -0.32928 -0.12912 -0.0027003 -0.09769 -0.00051 -0.003463 0.04049
t-stat -24.8321 -3.37411 -2.33912 -2.3886 -0.72799 -1.413 1.00748
20
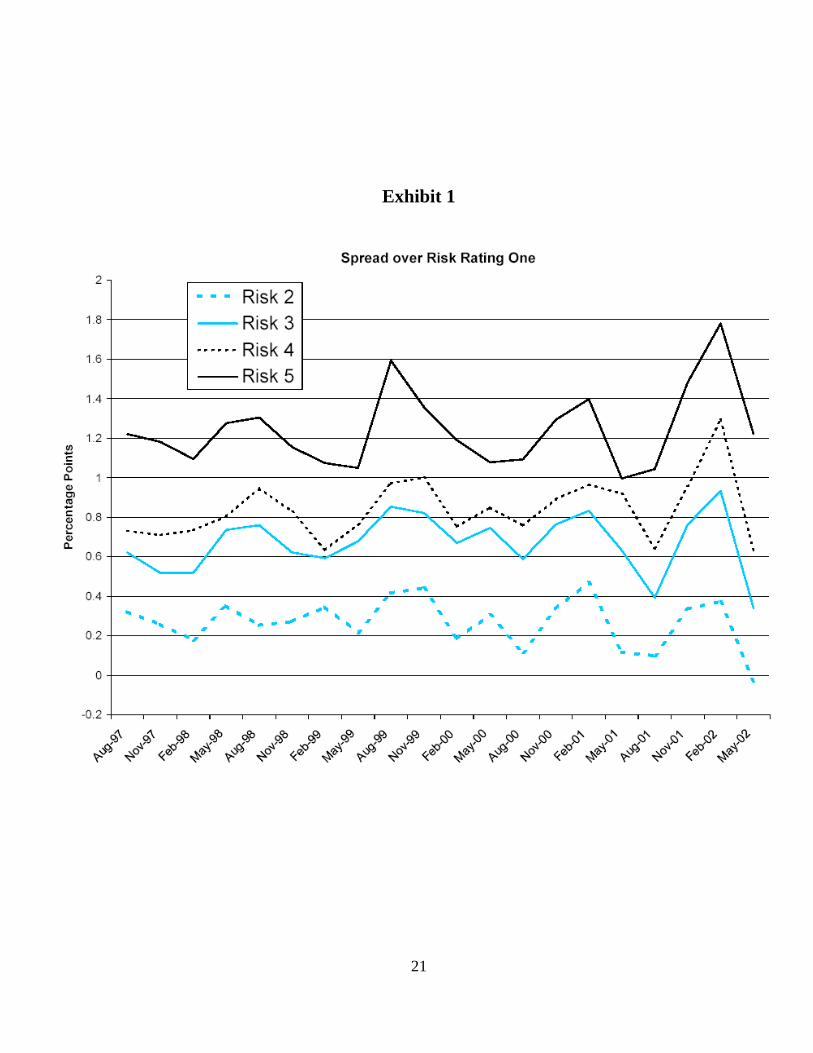
It is common in describing financial markets to translate quoted rates of interest into rate spreads
between instruments of varying degrees of riskiness. As shown in Exhibit 1, the markup for loans in either the
third or fourth risk rating category moved closely together, and for the entire sample period averaged about 70
basis points over loans in the least risky category. As might be expected, fluctuations in the markup for the
most risky loans were much wider than those on other loans, with noticeable spikes in 1999, 2001, and 2002.
In general, the spreads largely exhibited similar patterns of ups and downs over the 20 quarters of the time
period.
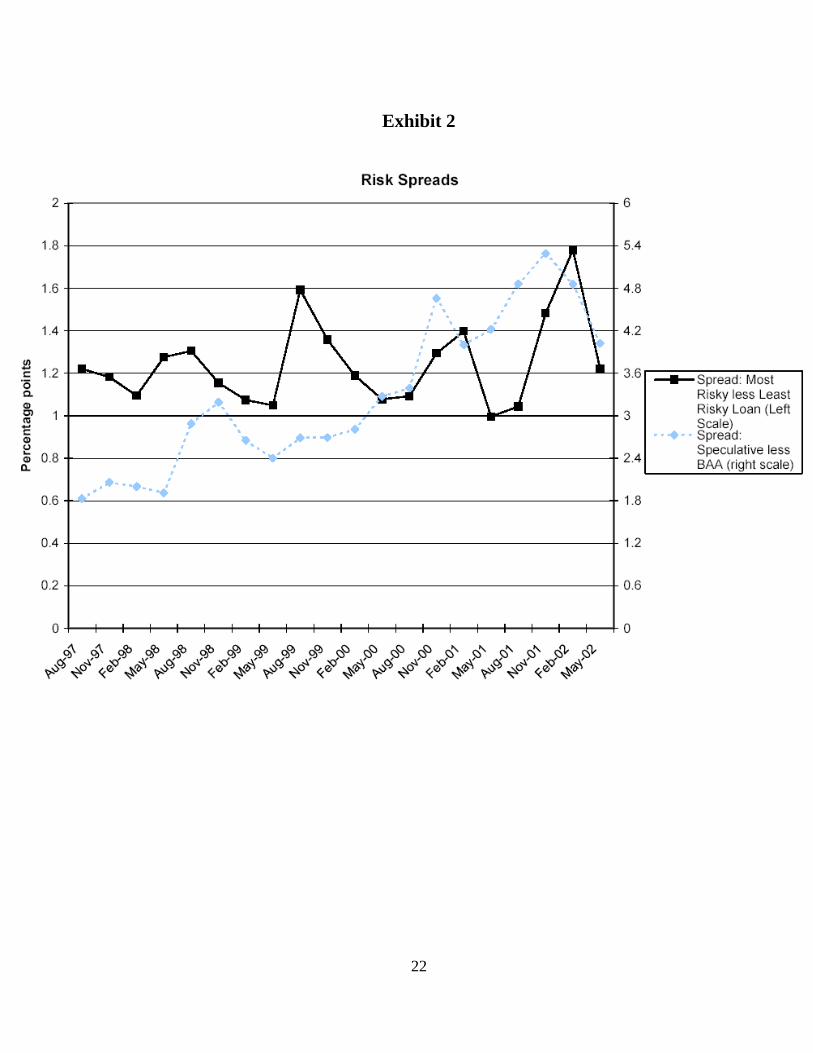
To further examine quarterly changes in the spreads on survey loans of different reported riskiness,
Exhibit 2 compares movements in the estimated spread between survey loans that received the most risky
rating and those with the least risky rating to movements in the spread of speculative-grade issues and those
rated BAA in the corporate credit markets. The spread between the most risky and least risky loans in this
bank survey generally ran a couple of percentage points less than the spread in the corporate markets; although
the corporate spreads seem to show a bit of an upward trend over the sample period, while the spread on
agricultural loans did not. The quarterly swings in the two spreads seemed to match up pretty well over the
sample period, except for a somewhat anomalous spike in the agricultural series in 1999.
21
Exhibit 1
22
Exhibit 2
23
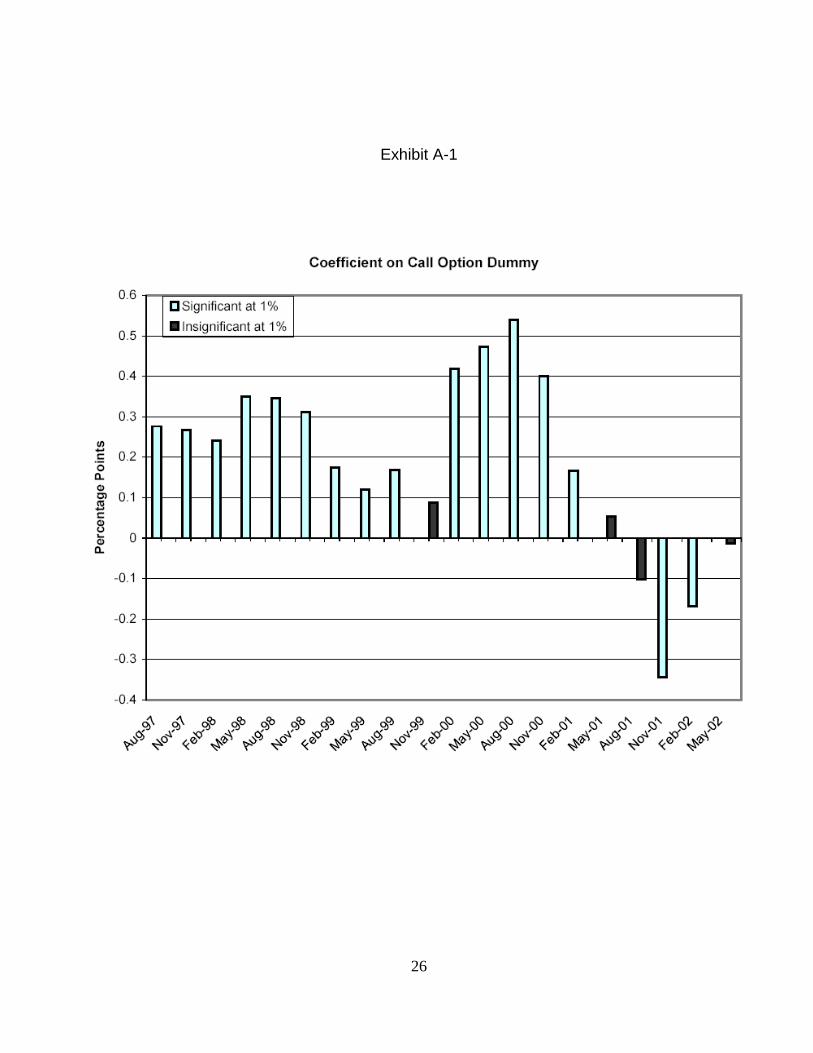
In examining the quarterly parameter estimates, it was apparent that beginning in 2001, the coefficients
on the variables associated with the duration of the loan (the dummy for whether the loan could be called, the
dummy for whether the loan could be prepaid, and the number of days until the loan could be repriced), each
switched sign (the quarterly estimates for these variables are shown in Table 6 and Exhibits 3, 4, and 5 in the
appendix). For almost the entire sample period until 2001, the inclusion of a call provision came along with
an interest rate that was about 30 basis points higher (significant at the 1 percent level); during this period,
about 1/4 of sample loans carried call provisions. Beginning in early 2001, the proportion of sample loans
with call provisions dropped to about 15 percent or less, and the presence of a call provision, on average,
reduced the rate on the loan by about 20 basis points. This switch in sign came as short-term interest rates
were falling sharply in the broader economy and economic activity was sagging, perhaps suggesting that
lenders may have been easing terms on their loans to bolster demand. By contrast, the sign and statistical
significance of the coefficient for prepayment had not shown any particular pattern until 2001, when the
inclusion of a prepayment penalty began to coincide significantly with loan rates that were upwards of a full
percentage point higher.
In the summer of 2000, the average number of days until the loan could be repriced fell sharply in the
survey. In addition, before that time, a longer period until the loan could be repriced was associated with
significantly lower rates. However, by the latter part of 2001, fixing the rate for an additional month tended to
add about 10 basis points to the cost of the loan. This effect was highly significant.
Concluding Comments
The data presented here suggest that, among the smaller community banks that provide a substantial
portion of farm loans, the prevalence of risk rating systems changed little during the 5-year (1997-2002)
sample period. Nevertheless, there is a sizable volume of farm lending that comes from commercial banks

24
and is carried out utilizing rating systems that enable banks to price the perceived riskiness of their loans.
Such risk-adjusted pricing occurs within a framework where loan rates also reflect adjustments for a host of
non-price terms, including security, commitments, call provisions, prepayment penalties, repricing intervals,
and maturity.
The future will likely bring wider use of dual rating systems (frequency of default by borrowers and
severity of default associated with loan transactions), as well as closer linkages between loan pricing, credit
risk, economic capital, and risk-adjusted returns on capital. The systematic pricing practices on farm loans
found in this study thus provide a benchmark to future research on loan pricing as the structure and managing
of banks’ credit risks continues to evolve. The resulting spreads between loans that are rated to be of
minimal risk and those of high risk change over time in a pattern that is broadly consistent with quality
spreads in corporate credit markets. Thus, the risk and other pricing characteristics of farm loans largely
parallel those of non-farm business loans.
25
ReferencesAgricultural Finance Databook, Statistical Release E.15, Federal Reserve Board, various issues.www.federalreserve.gov/releases
Barry, P.J. and J.D. Calvert. “Loan Pricing and Profitability Analysis by Agricultural Banks.” AgriculturalFinance Review 43 (1983): 21-29.
Brady, T.F., W.B. English and W.R. Nelson. “Recent Changes to the Federal Reserve’s Survey of Terms ofBank Lending.” Federal Research Bulletin 84 (August 1998): 604-615.
Berger, Allen, and Greg Udell (1990), “Collateral, Loan Quality, and Bank Risk”, Journal of MonetaryEconomics.
Bessis, J. Risk Management in Banking 2nd ed., New York: John Wiley & Sons 2002.Brady, T.F., W.B. English and W.R. Nelson. “Recent Changes to the Federal Reserve’s Survey of Terms ofBank Lending.” Federal Reserve Bulletin 84 (August 1998): 604-615.
English, William, and William Nelson (1998), “Bank Risk Rating of Business Loans”, Finance andEconomics Discussion Series, 1998-51, Federal Reserve Board
Matten, C. Managing Bank Capital: Capital Allocation and Performance Measurement, 2nd ed., New York:John Wiley & Sons, 2000.
Miller, L.H., P.N. Ellinger, P.J. Barry and K. Lajili. “Price and Non Price Management of Agricultural CreditRisk.” Agricultural Finance Review 53 (1993): 28-41.
Moss, L.M., P.J.Barry, and P.N.Ellinger "The Competitive Environment for Agricultural Bankers in the U.S." Agribusiness: An International Journal 13(July/August 1997):431-444
Morgan, Donald (1998), “The Credit Effects of Monetary Policy: Evidence Using Loan Commitments,” Journal of Money, Credit, and Banking
Saunders, A. and Lina Allen. Credit Risk Measurement, 2nd ed., New York: John Wiley & Sons, 1999.
Smithson, Charles. Credit Portfolio Management, New York: John Wiley & Sons, 2003.
Swackhamer, G. and R. Doll. Financing Modern Agriculture: Banking Problems and Challenges, FederalReserve Bank of Kansas City, 1969.
Treacy, William, and Mark Carey (1998), “Credit Risk Rating at Large U.S. Banks”, Federal ReserveBulletin, November 1998
Walraven, Nick, and Sam Slowinski (1993), “Surveying Banks About Agricultural Lending”, Proceedings ofthe International Conference on Establishment Surveys, June 27-30, 1993. American Statistical Association.
26
Exhibit A-1

27
Exhibit A-2

28
Exhibit A-3