Embed Size (px)
Citation preview

8/3/2019 Bank of Canada Monetary Policy Report January 2012
http://slidepdf.com/reader/full/bank-of-canada-monetary-policy-report-january-2012 1/37
Monetary Policy ReportJanuary 2012

8/3/2019 Bank of Canada Monetary Policy Report January 2012
http://slidepdf.com/reader/full/bank-of-canada-monetary-policy-report-january-2012 2/37
©2012 Bank of Canada
234 Wellington Street
Ottawa, Ontario K1A 0G9
Phone: 613 782-8111 or 1 800 303-1282
ISSN 1201-8783 (Print)
ISSN 1490-1234 (Online)
Canada’s Inflation-Control Strategy1
Ination targeting and the economy
• The Bank’s mandate is to conduct monetary policy to pro-
mote the economic and nancial well-being o Canadians
•
Canada’s experience with ination targeting since 1991has shown that the best way to oster condence in the
value o money and to contribute to sustained economic
growth, employment gains and improved living standards
is by keeping ination low, stable and predictable
• In 2011, the Government and the Bank o Canada renewed
Canada’s ination-control target or a urther ve-year
period, ending 31 December 2016 The target, as measured
by the total consumer price index (CPI), remains at the
2 per cent midpoint o the control range o 1 to 3 per cent
The monetary policy instrument
• The Bank carries out monetary policy through changesin the target overnight rate o interest2 These changes
are transmitted to the economy through their inuence
on market interest rates, domestic asset prices and the
exchange rate, which aect total demand or Canadian
goods and services The balance between this demand and
the economy’s production capacity is, over time, the pri-
mary determinant o ination pressures in the economy
• Monetary policy actions take time—usually rom six to
eight quarters—to work their way through the economy
and have their ull eect on ination For this reason,
monetary policy must be orward looking
• Consistent with its commitment to clear, transparent
communications, the Bank regularly reports its perspec-
tive on the orces at work on the economy and their
implications or ination The Monetary Policy Report
(MPR) is a key element o this approach Policy decisions
are typically announced on eight pre-set days during the
year, and ull updates o the Bank’s outlook, including
risks to the projection, are published our times per year
in the MPR
Ination targeting is symmetric and flexible
• Canada’s ination-targeting approach is symmetric, which
means that the Bank is equally concerned about ination
rising above or alling below the 2 per cent target
• Canada’s ination-targeting ramework is flexible
Typically, the Bank seeks to return ination to target over
a horizon o six to eight quarters However, the most
appropriate horizon or returning ination to target will
vary depending on the nature and persistence o the
shocks bueting the economy
Monitoring ination
• In the short run, a good deal o movement in the CPI is
caused by uctuations in the prices o certain volatile
components (eg, ruit and gasoline) and by changes in
indirect taxes For this reason, the Bank also monitors a
set o “core” ination measures, most importantly the
CPIX, which strips out eight o the most volatile CPI com-
ponents and the eect o indirect taxes on the remaining
components These “core” measures allow the Bank to
“look through” temporary price movements and ocus on
the underlying trend o ination In this sense, core ina-tion is monitored as an operational guide to help the Bank
achieve the total CPI ination target It is not a replace-
ment or it
1 See Joint Statement of the Government of Canada and the Bank of Canada on the Renewal of the Inflation-Control Target (8 November 2011) and
Renewal of the Inflation-Control Target: Background Information—November 2011 , which are both available on the Bank’s website
2 When interest rates are at the zero lower bound, additional monetary easing to achieve the ination target can be provided through three unconven-
tional instruments: (i) a conditional statement on the uture path o the policy rate; (ii) quantitative easing; and (iii) credit easing These instruments
and the principles guiding their use are described in the Annex to the April 2009 Monetary Policy Report

8/3/2019 Bank of Canada Monetary Policy Report January 2012
http://slidepdf.com/reader/full/bank-of-canada-monetary-policy-report-january-2012 3/37
Motr Poc RportJanuary 2012
This is a report o the Governing Council o the Bank o Canada:Mark Carney, Ti Macklem, John Murray, Timothy Lane, Jean Boivin and Agathe Côté.
This report includes data received up to 13 January 2012.

8/3/2019 Bank of Canada Monetary Policy Report January 2012
http://slidepdf.com/reader/full/bank-of-canada-monetary-policy-report-january-2012 4/37
Today, our demographics have turned, our productivity growth has
slowed and the world is undergoing a competitive deleveraging.
We might appear to prosper or a while by consuming beyond our
means. Markets may let us do so or longer than we should. But
i we yield to this temptation, eventually we, too, will ace painul
adjustments. It is better to rebalance now rom a position o strength;
to build the competitiveness and prosperity worthy o our nation.
—Mark Carney
Governor, Bank o Canada
12 December 2011
Toronto, Ontario

8/3/2019 Bank of Canada Monetary Policy Report January 2012
http://slidepdf.com/reader/full/bank-of-canada-monetary-policy-report-january-2012 5/37
Cott
Overview 1
The Global Economy 3
Global Financial Conditions 5
Euro Area 9
United States 12
Other Advanced Economies 15
Emerging-Market Economies 15
Commodity Prices 15
Implications or the Canadian Economy 17
The Canadian Economy 19
Financial Conditions 19
Estimated Pressures on Capacity 22
Economic Activity 23
Ination 29
Risks to the Outlook 31
Technical Boxes
Technical Box 1: Euro-Area Financial Conditions and
Spillover Eects 8
Technical Box 2: Fiscal Austerity in the Euro Area 11

8/3/2019 Bank of Canada Monetary Policy Report January 2012
http://slidepdf.com/reader/full/bank-of-canada-monetary-policy-report-january-2012 6/37

8/3/2019 Bank of Canada Monetary Policy Report January 2012
http://slidepdf.com/reader/full/bank-of-canada-monetary-policy-report-january-2012 7/37
Or
The outlook or the global economy has deteriorated and uncertainty hasincreased since October. The sovereign debt crisis in Europe has intensi-ed, conditions in international nancial markets have tightened and riskaversion has risen. The recession in Europe is now expected to be deeper
and longer than the Bank had anticipated. The Bank continues to assumethat European authorities will implement sucient measures to contain thecrisis, although this assumption is clearly subject to downside risks. In theUnited States, while the rebound in real GDP during the second hal o 2011was stronger than anticipated, the Bank expects the recovery will proceedat a more modest pace going orward, owing to ongoing household delever-aging, scal consolidation and the spillovers rom Europe. Chinese growthis decelerating, as expected, toward a more sustainable pace. Commodityprices—with the exception o oil—are expected to be below the levels antici-pated in October through 2013.
The Bank’s overall outlook or the Canadian economy is little changed romOctober. While the economy had more momentum than anticipated in thesecond hal o 2011, the pace o growth going orward is expected to bemore modest than previously envisaged, largely due to the external environ-ment. Prolonged uncertainty about the global economic and nancialenvironment is likely to dampen the rate o growth o business investment,albeit to a still-solid pace. Net exports are expected to contribute little togrowth, refecting moderate oreign demand and ongoing competitivenesschallenges, including the persistent strength o the Canadian dollar. In con-trast, very avourable nancing conditions are expected to buttress con-sumer spending and housing activity. Household expenditures are expectedto remain high relative to GDP and the ratio o household debt to income isprojected to rise urther.
The Bank estimates that the economy grew by 2.4 per cent in 2011 andprojects that it will grow by 2.0 per cent in 2012 and 2.8 per cent in 2013.
While the economy appears to be operating with less slack than previ-ously assumed, given the more modest growth prole, the economy is onlyanticipated to return to ull capacity by the third quarter o 2013, one quarterearlier than was expected in October.
The dynamics or infation are similar to those anticipated in October,although the prole or infation is marginally rmer. Both total and coreinfation are expected to moderate in 2012 and subsequently rise, reaching2 per cent by the third quarter o 2013 as excess supply is slowly absorbed,
OveRview
1
BANK OF CANADA • Monetary Policy rePort • January 2012

8/3/2019 Bank of Canada Monetary Policy Report January 2012
http://slidepdf.com/reader/full/bank-of-canada-monetary-policy-report-january-2012 8/37
labour compensation grows modestly and infation expectations remainwell-anchored.
Several signicant upside and downside risks are present in the infationoutlook or Canada.
The three main upside risks to infation in Canada relate to the possibilityo stronger-than-expected infationary pressures in the global economy,stronger-than-expected growth in the U.S. economy and strongermomentum in Canadian household spending.
The two main downside risks to infation in Canada relate to sovereign debtand banking concerns in Europe and the possibility that growth in Canadianhousehold spending could be weaker than projected.
Overall, the Bank judges that these risks are roughly balanced over the pro- jection horizon.
Refecting all o these actors, on 17 January, the Bank maintained the targetor the overnight rate at 1 per cent. With the target interest rate near historiclows and the nancial system unctioning well, there is considerable mon-etary policy stimulus in Canada. The Bank will continue to monitor careullyeconomic and nancial developments in the Canadian and global econ-omies, together with the evolution o risks, and set monetary policy con-
sistent with achieving the 2 per cent infation target over the medium term.
2
OveRview
BANK OF CANADA • Monetary Policy rePort • January 2012

8/3/2019 Bank of Canada Monetary Policy Report January 2012
http://slidepdf.com/reader/full/bank-of-canada-monetary-policy-report-january-2012 9/37
The outlook or the global economy has deteriorated and uncertainty hasincreased since the October Monetary Policy Report (Table 1 ). The sovereigndebt crisis in Europe and the associated pressures on the banking sectorhave intensied, and the global ramications through nancial, trade and
condence eects are expanding. Conditions in international nancial mar-kets have tightened and risk aversion has increased, weighing on the pros-pects or global economic growth. Limited progress in rebalancing worlddemand is also contributing to the global slowdown as decient demand inthe major advanced economies is not being suciently oset by increaseddemand rom emerging-market economies. Overall, global economic growthis projected to average roughly 3 per cent per year through 2013.
Table 1: Projection or global economic growth
Share o real globalGDPa (per cent)
Projected growth (per cent)b
2010 2011 2012 2013
United States 21 3.0 (3.0) 1.8 (1.7) 2.0 (1.7) 2.2 (3.3)
Euro area 16 1.8 (1.7) 1.5 (1.5) -1.0 (0.2) 0.9 (1.5)
Japan 6 4.5 (4.0) -0.8 (-0.6) 1.9 (2.0) 1.7 (2.5)
China 11 10.4 (10.4) 9.1 (9.1) 8.2 (8.2) 8.0 (8.2)
Rest o the world 46 5.8 (5.7) 4.2 (4.3) 3.1 (3.3) 3.2 (3.4)
World 100 5.2 (5.1) 3.7 (3.8) 2.9 (3.1) 3.3 (3.7)
a. GDP shares are based on IMF estimates o the purchasing-power-parity (PPP) valuation o countryGDPs or 2010. Source: IMF, WEO, September 2011
b. Numbers in parentheses are projections used or the October 2011 Monetary Policy Report.
Source: Bank o Canada
The recession in the euro area is now expected to last longer and to be some-what deeper than anticipated in the October Report, owing to tighter creditconditions, additional scal austerity measures and more negative condenceeects. The Bank’s base-case scenario assumes that European authoritieswill implement the measures required to contain the crisis, thus supporting agradual recovery in economic growth beginning in late 2012. In the UnitedStates, economic conditions have improved in recent months, with better-than-anticipated growth in real GDP in the second hal o 2011 and somerecovery in consumer condence. Nonetheless, growth in U.S. economicactivity is expected to be relatively modest through 2013, owing to ongoinghousehold deleveraging, scal consolidation and negative spillover eectsrom the European crisis. Growth in emerging-market economies has slowed,
Since October, the outlook or the
global economy has deteriorated and
uncertainty has increased
The recession in the euro area is now
expected to last longer and to be
somewhat deeper
T Go ecoom
The GlObal eCOnOMy
3
BANK OF CANADA • Monetary Policy rePort • January 2012

8/3/2019 Bank of Canada Monetary Policy Report January 2012
http://slidepdf.com/reader/full/bank-of-canada-monetary-policy-report-january-2012 10/37
as expected, and is projected to moderate urther toward a more sustain-able—yet still robust—pace, in response to past tightening in domestic mon-
etary policy and weaker global demand. Declines in commodity prices in thesecond hal o last year and decreasing momentum in the global economyhave begun to dampen infation pressures (Chart 1 ).
Faced with subdued prospects or growth and diminishing infation pres-sures, central banks in some advanced economies have provided additionalmonetary stimulus by lowering policy interest rates or engaging in urtherquantitative easing (Chart 2 and Chart 3 ). They have also adopted addi-tional measures to provide liquidity support to the nancial system. Centralbanks in a number o emerging-market economies have also begun toloosen monetary policy, reversing earlier policy tightening.
In the United States, economic
conditions have improved in recent months
Chart 1: Global ination pressures have begun to moderate
Year-over-year percentage change in total CPI, monthly data
Sources: Statistics Canada, U.S. Bureau o Labor Statistics, Eurostat, National Bureau o Statistics o China
and Instituto Brasileiro de Geograa e Estatíst ica Last observations: November and December 2011
2007 2008 2009 2010 2011-4
-2
0
2
4
6
8
10
%
Canada United States Euro area China Brazil
Chart 2: Central banks in some advanced economies have provided urthermonetary stimulus
Policy interest rates, daily data
Note: On 5 October 2010, the Bank o Japan changed the target or its policy rate rom 0.1 per cent
to a range o 0.0 to 0.1 per cent. The U.S. Federal Reserve has been maintaining a target range or
its policy rate o 0.0 to 0.25 per cent since 16 December 2008.
Sources: Bank o Canada, U.S. Federal Reserve,
European Central Bank and Bank o Japan Last observation: 13 January 2012
2008 2009 2010 2011 2012
%
0.0
0.5
1.0
1.5
2.0
2.5
3.0
3.5
4.0
4.5
Canada United States Euro area Japan
4
The GlObal eCOnOMy
BANK OF CANADA • Monetary Policy rePort • January 2012

8/3/2019 Bank of Canada Monetary Policy Report January 2012
http://slidepdf.com/reader/full/bank-of-canada-monetary-policy-report-january-2012 11/37
Global Financial ConditionsConditions in global nancial markets have tightened in recent months asthe sovereign debt crisis in the euro area has deepened and banking sectorstress has remained elevated. Tensions in euro-area government debt mar-kets have escalated since the October Report. Bond spreads in some o theregion’s largest economies have risen, and yields or most o the peripheralsovereigns have reached post-euro record highs (Chart 4 and Chart 5 ). Incontrast, yields on government bonds in the United States, Germany and anumber o other developed economies have continued to all as investors
shit toward saer and more-liquid assets (Chart 6 ).Conditions in global short-term bank unding markets have generallydeteriorated because o developments in Europe.1 In particular, mostEuropean banks have been shut out o unsecured term-unding markets(Technical Box 1 ) in light o their signicant exposure to euro-area sover-eign debt, large recapitalization needs and major unding requirements. Asa result, the European Central Bank (ECB) has provided increased liquidityto the European banking system against an expanded range o eligiblecollateral or periods o up to three years. European banks have alsoexperienced severe diculty accessing U.S.-dollar unds to nance theiroreign-denominated assets. To alleviate these unding pressures, existingarrangements or temporary U.S.-dollar liquidity swaps between the U.S.Federal Reserve and ve major central banks have been extended, andthe rate on these arrangements has been reduced.2 As a contingencymeasure, these central banks have also agreed to establish a network otemporary bilateral liquidity swap arrangements so that liquidity can beprovided in each jurisdiction, in any o their currencies, should marketconditions warrant.
1 The dierence between interbank oered rates and their respective overnight index swap rates has
reached its highest level since July 2009 in both the United States and Europe.
2 The ve major central banks are the European Central Ba nk and the central banks o the United Kingdom,
Japan, Switzerland and Canada. The swap arrangements between these banks and the U.S. Federal Reserve
were extended through 1 February 2013, and the rate on any drawing was reduced by 50 basis points.
Conditions in global nancial markets
have tightened in recent months
Investors have shited toward saer and
more-liquid assets
Chart 3: Some central banks have expanded their balance sheets urther
Change in total central bank assets relative to GDP
a. The bar or the euro area represents balance-sheet changes o the European Central Bank and
national central banks o those European member states whose currency is the euro.
Sources: U.S. Bureau o Economic Analysis; U.S. Federal Reserve;
Eurostat; European Central Bank; U.K. Oce or National Statistics;
Bank o England; Cabinet Oce, Government o Japan; and Bank o Japan Last observation: 2011Q4
0
2
4
6
8
10
12
14
16
Percentage points
United States Euro areaa United Kingdom Japan
2007Q2–2011Q2 2011Q2–2011Q4
The GlObal eCOnOMy
5
BANK OF CANADA • Monetary Policy rePort • January 2012

8/3/2019 Bank of Canada Monetary Policy Report January 2012
http://slidepdf.com/reader/full/bank-of-canada-monetary-policy-report-january-2012 12/37
Rising investor anxiety has also aected other asset classes, albeit to a
lesser extent. Issuance o U.S. corporate debt has rebounded since theOctober Report, although credit spreads have remained at wider levelsthan in the rst hal o 2011. Global equity indexes are generally unchangedsince late October but have shown considerable volatility (Chart 7 ), whileEuropean nancial subindexes have declined signicantly.
The deterioration in nancial conditions is projected to persist or some timeand to be increasingly transmitted to households and businesses throughtighter borrowing conditions. Financial conditions are expected to improvein 2013, supported by a rebound in global economic activity.
The deterioration in nancial conditions
is projected to persist or some time
Chart 5: … while bond yields or most euro-area peripheral sovereigns
have reached record highs
Yields on 10-year sovereign bonds, daily data
Note: Due to data limitations, yields on 9-year sovereign bonds are used or Ireland.
Source: Bloomberg Last observation: 13 January 2012
2009 2010 2011 2012
0
5
10
15
20
25
30
35
40
%
October Report
Greece Portugal Ireland
Chart 4: Tensions have escalated in unding markets or some larger
euro-area sovereigns …
Yields on 10-year sovereign bonds, daily data
Source: Bloomberg Last observation: 13 January 2012
2009 2010 2011
0
1
2
3
4
5
6
7
8
2012
%
October Report
Germany France Italy Spain
6
The GlObal eCOnOMy
BANK OF CANADA • Monetary Policy rePort • January 2012

8/3/2019 Bank of Canada Monetary Policy Report January 2012
http://slidepdf.com/reader/full/bank-of-canada-monetary-policy-report-january-2012 13/37
Chart 6: Government bond yields in major economies have declined
since the last Report
Yields on 10-year government bonds, daily data
Source: Bloomberg Last observation: 13 January 2012
2009 2010 2011 2012
%
October Report
0.0
0.5
1.0
1.5
2.0
2.5
3.0
3.5
4.0
4.5
Canada United States Germany Japan United Kingdom
Chart 7: Equity indexes have shown considerable volatility since October
Indexes (1 January 2011 = 100), daily data
Source: Bloomberg Last observation: 13 January 2012
65
70
75
80
85
90
95
100
105
110
Jan Feb Mar Apr May Jun Jul Aug Sep Oct Nov Dec Jan
Index
October Report
Canada United States Euro area United Kingdom
The GlObal eCOnOMy
7
BANK OF CANADA • Monetary Policy rePort • January 2012

8/3/2019 Bank of Canada Monetary Policy Report January 2012
http://slidepdf.com/reader/full/bank-of-canada-monetary-policy-report-january-2012 14/37
Technical Box 1
Euro-Area Financial Conditions and Spillover Efects
Concerns about the impact o the sovereign debt crisis on
European banks have escalated Banks rom crisis countries
have relied heavily on borrowing rom the European Central
Bank (ECB), since many o them cannot access unsecured
unding markets (Chart 1-A) Moreover, the strong responseto the ECB’s three-year liquidity operation in December
suggests that an increasing number o European banks ace
unding strains They also continue to experience severe
US-dollar unding pressures, as evidenced by the rising
cost o borrowing US dollars on the oreign exchange swap
market (Chart 1-B)
The spillovers into North American bank unding markets
have thus ar been relatively contained Nevertheless, there
is evidence o credit tiering or US banks in unsecured
term-unding markets Moreover, the timing and pricing o
new debt issues have been heavily inuenced by shiting
sentiments in global markets Canadian banks continue to
have solid access to term-unding markets, both in Canadian
and US dollars
Thus ar, the impact on global nancial conditions rom the
strains in Europe has consisted mostly o a general retrench-
ment rom risk-taking Over the projection period, the
impact is expected to become more widespread, however,
and to take the orm o increased unding pressures, adverse
condence eects and reduced availability o credit In
particular, deteriorating unding conditions are projected to
push banks to restrict access to credit or households and
businesses in Europe and the United States, adding to the
drag on economic growth1
To alleviate concerns over bank solvency, European author-
ities have required banks to increase their core Tier 1 capital
ratios to 9 per cent by the end o June 2012 To improve their
capital positions in a difcult environment or raising capital
rom private sources, a number o European banks have
announced plans to sell assets, notably in their “non-core”
business lines (eg, capital market activities, investment
banking and lending in “non-core” markets)2 Balance-sheet
deleveraging by European banks is projected to aect nan-
cial and economic conditions, both in the euro area and
globally Eastern European countries are particularly vulner-
able to a decline in credit supply, since Western European
1 The October 2011 euro-area Bank Lending Survey indicates that euro-
area banks have tightened their lending standards.
2 The European Banking Authority estimates that European banks ace a
total capital shortall o €114.7 billion to achieve the 9 per cent target or
their core Tier 1 capital ratios. This new gure is slightly higher than the
€106 billion estimate released at the end o October, with German banks
experiencing the largest increase. In an extreme scenario where banks
would aim to achieve this target only by selling assets (i.e., without raising
equity or using retained earnings to boost their capital positions), they
could sell up to €2.8 trillion o assets.
banks provide close to 40 per cent o their total credit
(Table 1-A) With European banks accounting or a notice-
able share o total lending in the United States, especially or
business credit, the US supply o credit is also expected to
decline This drop, in combination with condence eects
Chart 1-A: Banks rom euro-area crisis countries have relied
heavily on borrowing rom the European Central Bank
a. For Ireland and Greece, the gures include both liquidity provided through
renancing operations and liquidity provided by national central banks
through their Emergency Liquidity Assistance programs.
Sources: Banco de España, Last observations:
Banco de Portugal, December 2011 or Italy and Portugal,
Central Bank o Ireland, November 2011 or Spain and Ireland,
Bank o Greece and Banca d’Italia October 2011 or Greece
0
50
100
150
200
250
2008 2009 2010 2011
€ billions
Spain Portugal Irelanda Italy Greecea
Chart 1-B: U.S.-dollar unding markets or European banks
are experiencing acute tensions
Spreads between 3-month U.S.-dollar bank borrowing rates
and U.S. 3-month overnight index swaps
a. Implied borrowing rates
Source: Bloomberg Last observation: 13 January 2012
2008 2009 2010 2011 2012
0
1
2
3
4
5
6
Percentage points
United States Euro areaa United Kingdoma
8
The GlObal eCOnOMy
BANK OF CANADA • Monetary Policy rePort • January 2012

8/3/2019 Bank of Canada Monetary Policy Report January 2012
http://slidepdf.com/reader/full/bank-of-canada-monetary-policy-report-january-2012 15/37

8/3/2019 Bank of Canada Monetary Policy Report January 2012
http://slidepdf.com/reader/full/bank-of-canada-monetary-policy-report-january-2012 16/37
implement sucient measures to contain the crisis, although this assump-tion is clearly subject to downside risks. The ongoing recession is expectedto last our quarters, resulting in a peak-to-trough decline in economicactivity o close to 1.5 per cent. Deteriorating nancial conditions, bankdeleveraging, scal consolidation and large negative condence eects areexpected to lead to a contraction in domestic demand in 2012, and growthin exports is projected to slow notably, owing to weaker global demand.Economic outcomes are expected to vary widely across countries, however,with subdued growth in the core economies and a signicant contractionin the periphery. A modest recovery is expected to begin in the euro area inlate 2012 as nancing conditions begin to improve and condence gradually
Chart 8: In the euro area, purchasing managers indexes point to a contraction
in activity
Manuacturing purchasing managers indexes, monthly data
Note: The purchasing managers index (PMI) is a composite diusion index o manuacturing conditions.
A reading above (below) 50 indicates an improvement (a deterioration) in overall business conditions in the
manuacturing sector compared with the previous month.
Source: Markit Last observation: December 2011
2010 201140
45
50
55
60
65
Balance of opinion
Euro area Germany France Spain Italy
Chart 9: Euro-area banks are restricting access to credit
Net percentages o banks contributing to credit tightening or enterprises
Note: Data refect responses to the euro-area Bank Lending Survey. “Actual tightening” reers to the
tightening that has already occurred, while “expected tightening” reers to the additional tightening
anticipated by banks.
Source: European Central Bank Last observation: 2011Q3
2010 2011 2010 2011 2010 2011 2010 2011 2010 2011
-10
0
10
20
30
40
%
Actual t ightening Expected t ighten ing
Factors contributing to credit tightening
Costs relatedto banks’capitalpositions
Access tomarketnancing
Banks’liquiditypositions
Expectationsregardinggeneraleconomicactivity
10
The GlObal eCOnOMy
BANK OF CANADA • Monetary Policy rePort • January 2012

8/3/2019 Bank of Canada Monetary Policy Report January 2012
http://slidepdf.com/reader/full/bank-of-canada-monetary-policy-report-january-2012 17/37
Technical Box 2
Fiscal Austerity in the Euro Area
From an aggregate perspective, the euro area’s public debt
burden is lower than that o the United States and Japan
However, many individual countries have high public de-
cits and public debt levels well above 90 per cent o GDP 1
Similarly, while the aggregate current account decit orthe whole euro area is about 05 per cent o GDP, with a
small net negative international investment position, there
are signicant variations at the country level ( Table 2-A)
Notably, some o the peripheral countries have had large
negative net international investment positions o more
than 20 per cent o GDP and sizable current account
decits, oten in excess o 5 per cent o GDP, although
these current account decits have decreased markedly in
recent months
Elevated debt levels, lack o competitiveness, prospects o
sluggish growth and deteriorating scal positions (owing
in part to upcoming age-related pressures) have led to
substantial increases in sovereign borrowing costs and,
consequently, to banking sector stress in many euro-
area countries To restore scal balance, most euro-area
countries are introducing additional measures to promote
scal austerity and structural reorms to generate growth
and ensure a sustainable debt path2 Announced austerity
plans include a mix o pension reorms, tax increases and
reductions in government spending, including lower public
sector employment Government spending cuts account
or most o the planned scal adjustment, but sizable tax
1 C. Reinhart and K. Rogo nd that debt starts to have adverse eects on
growth when it exceeds 90 per cent o GDP (“Growth in a Time o Debt,” American Economic Review 100, no. 2 (2010): 573–78.)
2 Moreover, increased scal discipline is being considered or the whole
European Union, with the most recent EU summit calling or additional
scal rules with greater centralized oversight o national budgets.
increases are being enacted in several countries as well
Structural reorms, announced or planned, generally ocus
on improving competition in product markets and exibility
in labour markets
Fiscal and structural reorm policies will ultimately enhance
euro-area growth by reducing borrowing costs, increasing
the exibility o the economy and improving productivity In
the near term, however, the prospects or economic growth
in the euro area are already weak, and tightening scalpolicy will result in even slower growth As Chart 2-A shows,
scal austerity creates a signicant drag on GDP growth in
Table 2-A: Euro-area internal imbalances have led to sizable fscal-adjustment programs
Country
Generalgovernment decit,
2010 (% o GDP)Gross debt, 2010
(% o GDP)
Average currentaccount surplus/ decit, 2005–10
(% o GDP)
10-year bondspread relative
to Germany(basis points)a
Change in 10-yearbond spread since
3 January 2011(basis points)a
Total size oannounced fscal
adjustment, 2012–14(% o GDP)b
Italy 4.5 119 -2 486 305 7
Irelandc 32.0 95 -3 476 -89 8
Spain 9.2 60 -8 343 94 4d
Greece 10.4 143 -12 2,957 1,997 12
Portugal 9.1 93 -11 1,016 646 8
Germany 3.3 84 6 -- -- 3
France 7.1 82 -1 130 88 4
a. As o 13 January 2012
b. Figures or scal adjustments as a share o GDP are Bank o Canada calculations based on national government announcements , as well as IMF and OECD sources.
c. Due to data limitations, yields on 9-year sovereign bonds are used or Ireland.
d. Note that more recent announcements are not included in this gure, as details have not been provided.
Sources: IMF World Economic Outlook database, September 2011, and Eurostat
Chart 2-A: Fiscal austerity measures are expected to reduce
euro-area GDP growth in coming years
Contribution to real GDP growth in percentage points, annual data
Source: Bank o Canada calculations and projections
2012 2013 2014
Percentage points
-1.8
-1.5
-1.2
-0.9
-0.6
-0.3
0.0
(continued)
The GlObal eCOnOMy
11
BANK OF CANADA • Monetary Policy rePort • January 2012

8/3/2019 Bank of Canada Monetary Policy Report January 2012
http://slidepdf.com/reader/full/bank-of-canada-monetary-policy-report-january-2012 18/37
recovers in response to the implementation o required policy measures andstructural reorms. Overall, relative to expectations in the October Report,the level o real GDP in the euro area is projected to be about 1 per centlower at the end o 2013.
United StatesRecent economic activity in the United States has been stronger thananticipated. Boosted by higher consumer spending and business invest-ment, growth in real GDP rebounded to approximately 2.5 per cent in thesecond hal o 2011. Despite this positive surprise, the U.S. recovery isexpected to proceed at a more modest pace through 2012–13, with GDPgrowth averaging roughly 2 per cent per year, owing to headwinds rom
household deleveraging, scal consolidation and spillover eects rom theEuropean crisis.
U.S. infation pressures are projected to decrease in response to lowercommodity prices and signicant excess capacity. As a result, the FederalReserve is expected to maintain very accommodative monetary condi-tions. Average annual GDP growth in the United States is projected to beslightly stronger in 2012 than anticipated in the October Report, mainlyrefecting the rebound in growth in the second hal o 2011 and reducedscal tightening. Growth in 2013 is, however, expected to be signicantlyweaker.
Fiscal consolidation is projected to exert a drag on U.S. real GDP growthamounting to about 0.8 percentage points in 2012 and about 2.5 percentage
points in 2013 (Chart 10 ). The estimated impact in 2012 is smaller than wasanticipated in the October Report, given improved prospects or the exten-sion o the payroll tax cuts and unemployment insurance benets that werescheduled to expire at the end o 2011.4 The estimated drag in 2013 is larger,
4 Although these measures have been renewed or two months, the Bank’s base-case scenario now
assumes that they will be extended to the end o 2012.
Growth in U.S. real GDP rebounded in
the second hal o 2011, but is expected
to proceed at a more modest pace
Fiscal consolidation is projected to
exert a drag on U.S. real GDP growth
the Bank’s outlook, removing about 07 percentage points
rom euro-area growth in 2012, 1 5 percentage points in
2013 and 08 percentage points in 20143 In light o this
deciency in demand, the global rotation o demand (and
hence greater demand or European exports) will be critical
to support growth in the euro area during this period
The negative eects rom austerity are not necessarilylimited to their immediate impact on GDP—there is a risk that
a negative eedback loop between weak economic growth,
declining tax revenues, stress in the banking sector and rising
borrowing costs could become more severe Negative shocks
3 Note that scal austerity will have a net negative eect on growth relative
to a scenario where delayed scal consolidation does not negatively aect
growth.
to growth will lower tax revenues and may raise borrowing
costs, exacerbating government decits and increasing pres-
sures on euro-area banks (since they have large exposures to
sovereign debt) This in turn could create a need or greater
austerity, which would urther reduce GDP growth
Conversely, i too little scal consolidation is implemented,
the outcome could be much worse Insufcient or non-cred-ible commitments to scal and structural reorms risk loss
o investor condence and a rapid escalation o borrowing
costs Such a scenario would likely entail an even deeper
recession and, ultimately, the need or more severe scal
tightening and even debt writedowns
This dilemma underscores the importance o structural
reorms to boost growth
Technical Box 2 (continued)
12
The GlObal eCOnOMy
BANK OF CANADA • Monetary Policy rePort • January 2012

8/3/2019 Bank of Canada Monetary Policy Report January 2012
http://slidepdf.com/reader/full/bank-of-canada-monetary-policy-report-january-2012 19/37
however, refecting the impact o spending cuts that are assumed to takeplace during 2013.5
Consumption growth has been supported in recent months by declines incommodity prices rom the peaks observed a year ago, as well as by animprovement in consumer condence and the increased availability o motorvehicles at U.S. dealerships ollowing the restoration o Japanese supplychains. Growth in personal disposable income has remained weak, how-ever, and the savings rate has allen below the 5 per cent to 6 per cent rangethat the Bank expects will be needed to rebuild household balance sheets
over the medium term (Chart 11 ). U.S. consumption is thereore expectedto grow more modestly through 2013, as households renew eorts to repairtheir balance sheets in an environment o slowly improving labour marketconditions and a persistent drag on incomes due to scal consolidation(Chart 12 ). In addition, U.S. banks are projected to tighten lending stan-dards or consumers and businesses in reaction to increased unding costsrelated to the European crisis.
Restricted access to mortgage credit, together with an elevated inventory ooreclosed properties, is expected to keep the construction o new homesat a low level during most o 2012. Tighter nancial conditions and highvacancy rates should also limit growth in the construction o non-residentialstructures over this period. A modest recovery is projected in both residen-
tial and non-residential construction toward the end o 2012, when nancialconditions are expected to improve.
Exports and business investment in equipment and sotware are expected tocontinue to be important drivers o U.S. economic growth over the projectionhorizon, although their contribution is projected to decrease somewhat in 2012.Indeed, despite support rom healthy corporate balance sheets, growth in
5 In November 2011, the Joint Select Commit tee on Decit Reduction announced that it had ailed to
agree on measures to lower the U.S. budget decit by a minimum o US$1.2 trillion over the next nine
years. As a result, sequestration o this amount has been triggered. According to the Budget Control
Act o 2011, these cuts are to be implemented evenly between 2013 and 2021.
Exports and business investment in
equipment and sotware are expected
to continue to be important drivers o
U.S. economic growth
Chart 10: Fiscal consolidation is projected to exert a drag on U.S. real GDP
growth
Annual data
Note: The contribution o scal policy to growth includes both direct government expenditures and the
indirect eects on other components o aggregate demand.Sources: U.S. Bureau o Economic Analysis and Bank o Canada calculations and projections
2010 2011 2012 2013
-4
-3
-2
-1
0
1
2
3
4
5
6
%
GDP excluding scal policy
GDP
Estimated contribution rom scal policy
The GlObal eCOnOMy
13
BANK OF CANADA • Monetary Policy rePort • January 2012

8/3/2019 Bank of Canada Monetary Policy Report January 2012
http://slidepdf.com/reader/full/bank-of-canada-monetary-policy-report-january-2012 20/37
business investment is expected to be constrained during the year by uncer-tainty over prospects or uture growth, tightening nancial conditions and low
rates o resource utilization. The pace o expansion in business investment isprojected to improve in 2013 once these eects begin to dissipate.
Growth in exports is expected to slow in 2012, owing to weaker growth inglobal demand as well as the recent appreciation o the U.S. dollar, whichpartly refected international investor demand or the saety and liquidityo U.S. Treasury securities. Exports are projected to recover somewhat in2013, however, in response to a gradual strengthening in external demand.
Chart 12: U.S. consumption is expected to grow modestly through 2013
Index: 2007Q4 = 100, chained 2005 U.S. dollars, quarterly data
Note: Dotted lines indicate projections.
Sources: U.S. Bureau o Economic Analysis and Bank o Canada calculations and projections
2007 2008 2009 2010 2011 2012 2013
50
60
70
80
90
100
110
120
130
Index
GDP
Housing
Non-residential construction
Personal consumption
Exports
Business investment in equipment and sotware
Start o the last recession
Chart 11: The U.S. savings rate has allen below the level consistent with
rebuilding household balance sheetsa
Personal savings as a percentage o personal disposable income, monthly data
a. A savings rate o 5 per cent to 6 per cent is considered by the Bank to be consistent with the repair o
U.S. household balance sheets over time.
Source: U.S. Bureau o Economic Analysis Last observation: November 2011
2007 2008 2009 2010 2011
1
2
3
4
5
6
7
8
9
%
14
The GlObal eCOnOMy
BANK OF CANADA • Monetary Policy rePort • January 2012

8/3/2019 Bank of Canada Monetary Policy Report January 2012
http://slidepdf.com/reader/full/bank-of-canada-monetary-policy-report-january-2012 21/37
Other Advanced EconomiesIn Japan, activity related to reconstruction helped boost the growth o realGDP to 5.6 per cent in the third quarter o 2011. Real GDP growth moder-ated sharply in the ourth quarter o last year, however, and is projected toaverage less than 2.0 per cent per year through 2013 as the impetus romthe rebuilding o inrastructure wanes. At the same time, slowing externaldemand and the recent sharp appreciation o the yen are expected to weighon export growth. In reaction to the deceleration in economic activity, the
Bank o Japan has urther expanded the size o its asset-purchase program.The central bank also intervened in oreign exchange markets at the end oOctober to limit the rise o the yen.
Real GDP growth in other advanced economies has slowed recently andis expected to be subdued in coming quarters, refecting a weakening inexternal demand, declining household and business condence, and con-tinued drag rom scal consolidation. To counter the deterioration in eco-nomic conditions, monetary authorities in a number o countries, including
Australia, Norway and Sweden, have lowered their policy interest rates.Some economies with signicant trade and nancial links with the euro areacould experience a recession. Economic activity is expected to gathermomentum toward the end o 2012, supported by a modest recovery in
global growth and an improvement in condence.
Emerging-Market EconomiesEconomic growth in China decelerated to 9.1 per cent in the third quarter
o 2011 in response to the past tightening in monetary policy and slowing
external demand, especially rom Europe, its most important trading
partner. Measures undertaken by the authorities to cool activity in the real
estate sector have led to a sotening in housing demand and a all in
property prices. Moderating ood prices contributed to a marked decline
in the overall infation rate to 4.1 per cent in December rom a recent peak
o 6.5 per cent in July. With infation pressures easing, Chinese authorities
have shited toward a more accommodative monetary policy stance and
in December lowered the reserve requirement ratio or nancial institu-tions by 50 basis points. Growth in real GDP is nevertheless projected to
moderate to around 8 per cent over 2012–13. Structural reorms and a
modest appreciation o the Chinese real exchange rate are expected to
support a gradual rotation o demand away rom investment and exports
and toward consumption.
Despite some slowing due to a moderation in global demand, real GDPgrowth in other emerging-market economies is expected to remain relativelystrong, supported by an easing in monetary policy. This generally positive out-look is tempered, however, by the eects o increased risk aversion in globalnancial markets, which has led to capital outfows rom some emerging-market economies, implying some tightening in credit conditions. Growth is
projected to slow particularly rapidly in the countries o Central and EasternEurope, since their exports are directed principally toward Europe and theirnancial systems are heavily dominated by Western European banks.
Commodity PricesPrices or non-energy commodities are essentially unchanged since theOctober Report. While the prices o base metals and agricultural commod-ities have recovered somewhat in recent weeks ollowing declines in late2011, the prices o non-energy commodities are projected to all in 2012 in
Real GDP growth in Japan is projected
to average less than 2.0 per cent per
year through 2013 as the impetus rom
the rebuilding o inrastructure wanes
Economic growth in China decelerated
to 9.1 per cent in the third quarter
With infation pressures easing,Chinese authorities have shited toward
a more accommodative monetary
policy stance
Prices o non-energy commodities are
projected to all in 2012
The GlObal eCOnOMy
15
BANK OF CANADA • Monetary Policy rePort • January 2012

8/3/2019 Bank of Canada Monetary Policy Report January 2012
http://slidepdf.com/reader/full/bank-of-canada-monetary-policy-report-january-2012 22/37
reaction to diminished prospects or global economic growth, beore par-tially recovering in 2013 when global demand conditions begin to improve(Chart 13 ). This prole is lower over the projection horizon than had beenanticipated in October.
Prices or energy commodities have been mixed in recent months. Pricesor West Texas Intermediate (WTI) crude oil have rebounded to roughlyUS$100 per barrel, refecting low global inventories and geopolitical tensions.
Chart 13: Prices or non-energy commodities have changed little since the
October Report, but oil prices have increased
Bank o Canada commodity price index (rebased to January 2003 = 100), monthly data
Note: Values in January 2012 are estimates based on the average daily spot prices up to 13 January 2012.
Source: Bank o Canada Last observa tion: January 2012
2005 2006 2007 2008 2009 2010 2011 2012
100
140
180
220
260
300
340
380
420
Index
All commoditi es (US$) Non-energy commodi ties (US$) Crude oil (US$)
October Report
Chart 14: Prices or natural gas are projected to rise through 2013,
but WTI oil prices are expected to decline
Monthly data
Spot price or crude oil (13 January 2012)
Spot price or natural gas (13 January 2012)
Based on an average o utures contracts over the two weeks ending 13 January 2012
Note: Values or crude oil and natural gas prices in January 2012 are estimates based on the average daily
spot prices up to 13 January 2012.
Source: NYMEX
0
20
40
60
80
100
120
0
1
2
3
4
5
6
7
8
9
10
2009 2010 2011 2012 2013
US$/BarrelUS$/Million Btu
Natural gas (let scale)
Natural gas utures price
Natural gas utures price (October Report )
WTI crude oil (right scale)
WTI crude oil utures price
WTI crude oil utures price
(October Report )
16
The GlObal eCOnOMy
BANK OF CANADA • Monetary Policy rePort • January 2012

8/3/2019 Bank of Canada Monetary Policy Report January 2012
http://slidepdf.com/reader/full/bank-of-canada-monetary-policy-report-january-2012 23/37
In addition, improved prospects or alleviating the inventory overhang inCushing have led to a narrowing in the WTI-Brent spread to around US$10per barrel rom US$24 per barrel in October. The latest utures curve suggeststhat WTI crude prices are projected to ease modestly through the end o2013, although prices are expected to remain above the levels anticipated atthe time o the October Report (Chart 14 ). In contrast, natural gas prices inNorth America have allen sharply in response to unseasonably warm weather,in an environment o persistent excess supply. While prices are projected torecover through 2013 based on the latest utures curve, the level o natural
gas prices is expected to remain lower through 2013 than anticipated in theOctober Report.
Implications or the Canadian EconomyDespite the relatively subdued outlook or global economic growth, externaldemand or Canada’s exports, as indicated by the oreign activity measure,is projected to grow moderately in 2012 and to pick up urther in 2013 inresponse to an improvement in U.S. residential construction and a reboundin the growth in U.S. business investment (Chart 15 ). Deteriorating eco-nomic conditions in Europe have a relatively modest impact on the oreignactivity measure, given Canada’s limited direct trade links with Europe, and
will aect Canadian exports primarily through their spillover eects on U.S.private domestic demand. Nonetheless, the crisis in Europe is expected tohave an indirect impact on the Canadian economy through its implicationsor nancial conditions, condence and global commodity prices.
The Bank o Canada’s commodity price index (BCPI) has declined since theOctober Report, owing mainly to the impact o lower natural gas prices,which has more than oset the eect o the higher price o WTI oil. Over theprojection horizon, the BCPI is projected to increase as natural gas pricesrise, despite expected declines in the prices o non-energy commoditiesand crude oil, but to remain somewhat below the levels anticipated in theOctober Report.
Natural gas prices in North America
have allen sharply
External demand or Canada’s exports
is projected to grow moderately in 2012
Deteriorating economic conditions inEurope have a relatively modest impact
on the oreign activity measure
The BCPI is projected to increase as
natural gas prices rise but to remain
somewhat below the levels anticipated
in the October Report
Chart 15: The recovery in oreign activity is projected to continue
Index: 2002 = 100, quarterly data
Note: Dotted line indicates projection.
The oreign activity measure captures the composition o oreign demand or Canadian exports by
including components o U.S. private nal domestic demand and economic activity in Canada’s
other trading partners.
Source: Bank o Canada calculations and projections
2007 2008 2009 2010 2011 2012 201395
100
105
110
115
120
125
Index
Foreign activity measure
The GlObal eCOnOMy
17
BANK OF CANADA • Monetary Policy rePort • January 2012

8/3/2019 Bank of Canada Monetary Policy Report January 2012
http://slidepdf.com/reader/full/bank-of-canada-monetary-policy-report-january-2012 24/37
The Canadian dollar has averaged close to 98 cents U.S. since theDecember xed announcement date and is assumed to remain at this levelover the projection horizon (Chart 16 ). This is very close to the 99 cents U.S.level assumed in the October Report.
Chart 16: The Canadian dollar is relatively unchanged since the October Report
Daily data
Note: A rise in either series indicates an appreciation o the Canadian dollar.
Source: Bank o Canada Last observa tion: 13 January 2012
2008 2009 2010 2011 201290
100
110
120
130
0.75
0.80
0.85
0.90
0.95
1.00
1.05
1.10
US$Index
October Report
CERI: Canadian-dollar eective exchange rate index
(against U.S. dollar, euro, yen, U.K. pound, Mexican
peso and Chinese renminbi) (let scale, 1992 = 100)
Closing spot exchange rate
or Canadian dollar vis-à-vis
U.S. dollar (right scale)
18
The GlObal eCOnOMy
BANK OF CANADA • Monetary Policy rePort • January 2012

8/3/2019 Bank of Canada Monetary Policy Report January 2012
http://slidepdf.com/reader/full/bank-of-canada-monetary-policy-report-january-2012 25/37
The Bank’s outlook or the Canadian economy is little changed relative tothe October Report. Although growth in the second hal o 2011 wasstronger than anticipated, the weaker external outlook is expected to aectthe Canadian economy through condence, nancial and trade channels.
The Bank continues to expect that these headwinds will limit economicgrowth in Canada in 2012 to a modest pace, ater which growth is projectedto pick up as the global environment improves. Private domestic demand isanticipated to remain the primary driver o growth in Canada throughout theprojection horizon, with relatively weak global economic growth and com-petitiveness challenges, including the persistent strength o the Canadiandollar, continuing to restrain net exports.
Consistent with this outlook, the Bank continues to expect that the output gapwill persist well into 2013. Excess supply in the economy, together with mod-erate growth in labour compensation and dissipating pressures rom com-modity prices, is anticipated to result in a moderation in both total and coreCPI infation to below 2 per cent around mid-2012. This moderation is pro-
jected to be slightly less pronounced than in the October Report, partlyrefecting some expected persistence in the slightly rmer prices seenrecently or a ew goods, as well as a slightly higher assumed path or oilprices. Nonetheless, the broad prole or infation in Canada is little changed,with the Bank projecting both total and core infation to return gradually to2 per cent over the latter part o the projection horizon as slack in theeconomy is slowly absorbed and infation expectations remain well anchored.
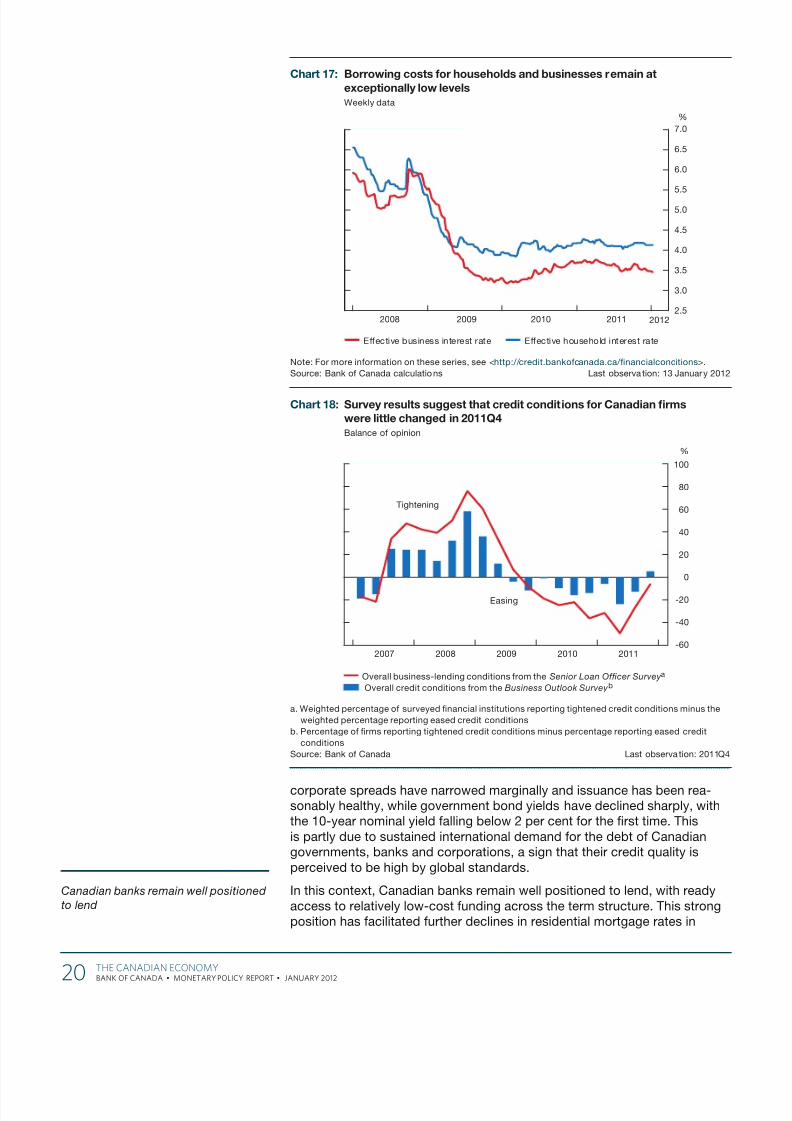
Financial ConditionsDespite the deterioration in global nancial conditions, the aggregate supplyand price o credit to businesses and households in Canada remain verystimulative (Chart 17 ), providing important ongoing support to the economic
expansion. Both the Bank’s Senior Loan Ocer Survey (available on theBank’s website under Publications and Research > Periodicals >SLOS 2011Q4 ) and the Business Outlook Survey (available on the Bank’swebsite under Publications and Research > Periodicals > BOS Winter 2011 )suggested that business-lending conditions were little changed in the ourthquarter, ater several quarters o sustained easing (Chart 18 ). Householdcredit remains readily available at very low rates.
Canadian nancial markets have been resilient in recent months. TheS&P/TSX Composite Index is roughly unchanged since the October Report,as are the relative prices o Canadian bank equities (Chart 19 ). Canadian
The Bank’s outlook or the Canadian
economy is little changed relative to the
October Report
Total and core CPI infation are
expected to moderate to below 2 per
cent around mid-2012 … beore returning gradually to 2 per cent over
the latter part o the projection horizon
The aggregate supply and price o
credit to businesses and households
in Canada remain very stimulative
T C ecoom
The Canadian eCOnOMy
19
BANK OF CANADA • Monetary Policy rePort • January 2012
8/3/2019 Bank of Canada Monetary Policy Report January 2012
http://slidepdf.com/reader/full/bank-of-canada-monetary-policy-report-january-2012 26/37
corporate spreads have narrowed marginally and issuance has been rea-sonably healthy, while government bond yields have declined sharply, withthe 10-year nominal yield alling below 2 per cent or the rst time. Thisis partly due to sustained international demand or the debt o Canadiangovernments, banks and corporations, a sign that their credit quality isperceived to be high by global standards.
In this context, Canadian banks remain well positioned to lend, with readyaccess to relatively low-cost unding across the term structure. This strongposition has acilitated urther declines in residential mortgage rates in
Canadian banks remain well positioned
to lend
Chart 17: Borrowing costs or households and businesses remain at
exceptionally low levels
Weekly data
Note: For more inormation on these series, see <http://credit.bankocanada.ca/nancialconditions>.
Source: Bank o Canada calculations Last observation: 13 January 2012
2008 2009 2010 2011 2012
%
2.5
3.0
3.5
4.0
4.5
5.0
5.5
6.0
6.5
7.0
Eective business interest rate Eective household interest rate
Chart 18: Survey results suggest that credit conditions or Canadian frms
were little changed in 2011Q4
Balance o opinion
a. Weighted percentage o surveyed nancial institutions reporting tightened credit conditions minus the
weighted percentage reporting eased credit conditions
b. Percentage o rms reporting tightened credit conditions minus percentage reporting eased credit
conditions
Source: Bank o Canada Last observation: 2011Q4
-60
-40
-20
0
20
40
60
80
100
2007 2008 2009 2010 2011
%
Overall business-lending conditions rom the Senior Loan Ofcer Survey a
Overall credit conditions rom the Business Outlook Survey b
Tightening
Easing
20
The Canadian eCOnOMy
BANK OF CANADA • Monetary Policy rePort • January 2012

8/3/2019 Bank of Canada Monetary Policy Report January 2012
http://slidepdf.com/reader/full/bank-of-canada-monetary-policy-report-january-2012 27/37
recent weeks, potentially adding to the recent momentum in the growth ohousehold credit, which picked up through the autumn as resale housing
market activity strengthened (Chart 20 ). In contrast, the growth o businesscredit slowed in recent months despite the persistence o historically lowborrowing costs, consistent with a slowing in the growth o business invest-ment amid heightened economic and nancial uncertainty.
Growth in the narrow monetary aggregates continued to rebound in theourth quarter, refecting some increase in liquidity preerence, with height-ened uncertainty and low alternative rates o return likely playing a role.Growth in the broad monetary aggregates has also picked up, albeit to alesser extent, remaining consistent with relatively subdued infation pres-sures ahead.
The growth o household credit picked
up through the autumn
Chart 20: Household credit growth has frmed while business credit growth
has slowed
3-month percentage change (at annual rates)
Source: Bank o Canada Last observat ion: November 2011
2008 2009 2010 2011
-4
-2
0
2
4
6
8
10
12
14
%
Total business credit
Historical average o business credit
growth rom 1992 to present
Total household credit
Historical average o household credit
growth rom 1992 to present
Chart 19: Canadian bank equity indexes have outperormed oreign bank equity
indexes on a relative basis
Bank equity index/broad equity index (1 January 2011 = 100), daily data
Source: Bloomberg Last observation: 13 January 2012
65
70
75
80
85
90
95
100
105
110
115October Report
Jan Feb Mar Apr May Jun Jul Aug Sep Oct Nov Dec Jan
Index
Canada United States Euro area United Kingdom
The Canadian eCOnOMy
21
BANK OF CANADA • Monetary Policy rePort • January 2012

8/3/2019 Bank of Canada Monetary Policy Report January 2012
http://slidepdf.com/reader/full/bank-of-canada-monetary-policy-report-january-2012 28/37
Estimated Pressures on CapacityThe level o real GDP in the ourth quarter o 2011 was 0.6 percentage pointshigher than the Bank had projected in the October Report. Real GDP grew by3.5 per cent in the third quarter o 2011 and is estimated to have risen by2.0 per cent in the ourth quarter, above expectations in the October Report.These stronger results refect a larger rebound rom the temporary actorsthat had restrained growth earlier in the year, as well as greater momentum inhousehold expenditures in Canada and stronger-than-anticipated activity in
the United States. The resulting higher level o activity in Canada implies lessslack in the economy than previously expected. The Bank’s conventional
The higher level o activity in Canada
implies less slack in the economy
Chart 21: Excess supply persists in the Canadian economy
a. Response to Business Outlook Survey question on capacity pressures. Percentage o rms
indicating that they would have either some or signicant diculty meeting an unanticipated
increase in demand/sales.
b. Response to Business Outlook Survey question on labour shortages. Percentage o rms reporting
labour shortages that restrict their ability to meet demand.
c. Dierence between actual output and estimated potential output rom the Bank o Canada’s conven-
tional measure. The estimate or the ourth quarter o 2011 (indicated by * ) is based on a projected
increase in output o 2.0 per cent (at annual rates) or the quarter.
Source: Bank o Canada Last observation: 2011Q4
-4
-3
-2
-1
0
1
2
3
0
10
20
30
40
50
60
70
2007 2008 2009 2010 2011
%%
Some and signicant dicultya (let scale)
Labour shortagesb (let scale)
Conventional measure o
the output gapc (right scale)
Chart 22: Labour market indicators have sotened in recent months
Monthly data, 3-month moving average
Source: Statistics Canada Last observat ion: December 2011
5
6
7
8
9
2008 2009 2010 2011
%Hours
33.0
33.5
34.0
34.5
35.0
Average weekly hours worked (let scale) Unemployment rate (right scale)
22
The Canadian eCOnOMy
BANK OF CANADA • Monetary Policy rePort • January 2012

8/3/2019 Bank of Canada Monetary Policy Report January 2012
http://slidepdf.com/reader/full/bank-of-canada-monetary-policy-report-january-2012 29/37
measure o the output gap has shown similar dynamics, narrowing to -0.7 percent in the ourth quarter o 2011 (Chart 21 ). The Bank’s winter Business
Outlook Survey also showed that the proportion o rms that would havediculty responding to an unexpected increase in demand edged up relativeto the previous survey, remaining at a level close to its historical average.
In contrast, conditions in the labour market have sotened in recentmonths. The unemployment rate rose through the ourth quarter to reach7.5 per cent in December, refecting a decline in private sector employ-
ment, and average weekly hours worked have allen (Chart 22 ). Whileresponses to the Bank’s winter Business Outlook Survey showed anincrease in the proportion o rms reporting labour shortages, this propor-tion remains below its historical average.
On balance, the Bank judges that the economy was operating at roughlythree-quarters o a per cent below its production capacity in the ourthquarter o 2011, a smaller degree o slack than the Bank had anticipated inthe October Report.
Economic ActivityThe Bank expects modest growth in the Canadian economy in the rst hal o2012, ater which growth is projected to improve (Chart 23 ). As in the OctoberReport, this projection assumes that the crisis in Europe will be contained,eventually leading to reduced uncertainty and a gradual return o condence.On an average annual basis, growth in real GDP is projected to moderaterom 2.4 per cent in 2011 to 2.0 per cent in 2012, beore picking up temporarilyabove the rate o the economy’s production potential to 2.8 per cent in 2013(Table 2 ). Private domestic demand, supported by accommodative domesticnancial conditions, is expected to account or almost all o Canada’s eco-nomic growth over the projection horizon (Chart 24 ).
This outlook or the Canadian economy is little changed rom the OctoberReport. While the economy had more momentum in the second hal o 2011than anticipated, the projected pace o growth through 2012 is more modestthan previously envisaged (Table 3 ). The weaker quarterly prole through
2012 refects more persistent uncertainty about the global economic and
Conditions in the labour market have
sotened in recent months
The Bank judges that the economy was
operating at roughly three-quarters o a
per cent below its production capacity
in the ourth quarter o 2011
The Bank expects modest growth in
the Canadian economy in the rst hal
o 2012, ater which growth is projected
to improve
Chart 23: Real GDP growth is expected to pick up in the second hal o 2012,
resulting in a gradual absorption o excess supply
Sources: Statistics Canada and Bank o Canada calculations and projections
-10
-8
-6
-4
-2
0
2
4
6
8
2008 2009 2010 2011 2012 2013
%
Year-over-year percentage change
in real GDP
Base-case projection
Quarter-over-quarter percentage
change in real GDP, at annual rates
Base-case projection
The Canadian eCOnOMy
23
BANK OF CANADA • Monetary Policy rePort • January 2012

8/3/2019 Bank of Canada Monetary Policy Report January 2012
http://slidepdf.com/reader/full/bank-of-canada-monetary-policy-report-january-2012 30/37
nancial outlook, which dampens private domestic demand through con-dence and nancial channels, and weaker projected growth in oreign
activity, which depresses Canadian exports.
Household expenditures—the combination o consumer spending and resi-dential investment—are now projected to grow at a steady pace through 2013,which is a stronger outlook than in the October Report. The Bank continuesto expect that consumption will grow at a rate slightly below the projectedmoderate growth in personal disposable income (Chart 25 ), resulting in amodest rise in the savings rate. Residential investment is, however, nowexpected to remain strong, owing to its greater-than-anticipated momentumin the second hal o last year and avourable mortgage nancing conditions.
This outlook or household
expenditures is stronger than in the
October Report
Chart 24: Private domestic demand is projected to account or most
o the economic growth in Canada
Contributions to real GDP growth
Sources: Statistics Canada and Bank o Canada calculations and projections
2009 2010 2011 2012 2013-6
-4
-2
0
2
4
6
Percentage points
Consumption
Housing
Business xed investment
Government
Net exports
Inventories
GDP
Table 2: Contributions to average annual real GDP growthPercentage pointsa
2010 2011 2012 2013
Consumption 2.0 (2.0) 1.1 (1.0) 1.1 (1.2) 1.4 (1.4)
Housing 0.7 (0.7) 0.2 (0.1) 0.3 (0.0) 0.2 (0.1)
Government 1.2 (1.2) 0.3 (0.3) -0.1 (-0.1) 0.2 (0.3)
Business xed investment 0.8 (0.8) 1.3 (1.4) 0.6 (0.7) 1.0 (1.0)
Subtotal: Final domestic demand 4.7 (4.7) 2.9 (2.8) 1.9 (1.8) 2.8 (2.8)
Exports 1.8 (1.8) 1.3 (1.2) 1.1 (0.9) 1.0 (1.1)
Imports -4.0 (-4.0) -2.0 (-2.1) -0.8 (-0.7) -1.0 (-1.0)
Subtotal: Net exports -2.1 (-2.1) -0.7 (-0.9) 0.3 (0.2) 0.0 (0.1)
Inventories 0.6 (0.6) 0.2 (0.2) -0.2 (-0.1) 0.0 (0.0)
GDP 3.2 (3.2) 2.4 (2.1) 2.0 (1.9) 2.8 (2.9)
Memo items:
Potential output 1.6 (1.6) 1.6 (1.6) 2.0 (2.0) 2.1 (2.1)
Real gross domestic income (GDI) 5.0 (5.0) 3.4 (2.8) 1.9 (1.1) 3.0 (3.6)
a. Figures in parentheses are rom the base-case projection in the October 2011 Monetary Policy Report.Those or potential output are rom Technical Box 2 in the October 2011 Monetary Policy Report.
24
The Canadian eCOnOMy
BANK OF CANADA • Monetary Policy rePort • January 2012

8/3/2019 Bank of Canada Monetary Policy Report January 2012
http://slidepdf.com/reader/full/bank-of-canada-monetary-policy-report-january-2012 31/37
Condence eects stemming rom the weaker and more uncertain globaloutlook are projected to exert only a modest dampening eect on Canadianhousehold spending (Chart 26 ). Refecting the upwardly revised prole orresidential investment, household expenditures are now expected to remainhigh relative to GDP over the projection horizon (Chart 27 ) and the ratio o
household debt to income is projected to rise urther.The underlying pace o growth in business xed investment has moderatedin recent quarters rom the robust rate seen through 2010 and early 2011,consistent with the adverse impact o heightened uncertainty on businesscondence. While this headwind is expected to persist in coming quarters,other undamentals supporting business investment in Canada remainextremely avourable, particularly very stimulative nancial conditions, solidCanadian corporate balance sheets (Chart 28 ), heightened competitivepressures and relatively high commodity prices. Moreover, signicant scoperemains to make up or the unusually sharp decline in investment
Fundamentals supporting business
investment in Canada remain avourable
Table 3: Summary o the base-case projection or Canadaa
2010 2011 2012 2013
Q4 Q1 Q2 Q3 Q4 Q1 Q2 Q3 Q4 Q1 Q2 Q3 Q4
Real GDP (quarter-over-quarterpercentage change at annual rates)
3.1(3.1)
3.5(3.6)
-0.5(-0.4)
3.5(2.0)
2.0(0.8)
1.8(1.9)
1.8(2.5)
2.1(3.0)
2.6(3.0)
3.1(3.0)
3.1(3.0)
3.0(3.0)
2.8(3.0)
Real GDP (year-over-year percentagechange)
3.3(3.3)
2.8(2.9)
2.1(2.2)
2.4(2.1)
2.1(1.5)
1.7(1.1)
2.3(1.8)
1.9(2.1)
2.1(2.6)
2.4(2.9)
2.7(3.0)
2.9(3.0)
3.0(2.9)
Core infation (year-over-yearpercentage change)
1.6(1.6)
1.3(1.3)
1.6(1.6)
1.9(1.9)
2.2(2.0)
2.1(1.8)
2.0(1.7)
1.9(1.7)
1.7(1.6)
1.9(1.8)
1.9(1.9)
2.0(1.9)
2.0(2.0)
Total CPI (year-over-year percentagechange)
2.3(2.3)
2.6(2.6)
3.4(3.4)
3.0(3.0)
2.8(2.7)
2.2(1.9)
1.5(1.0)
1.7(1.2)
1.7(1.5)
1.8(1.8)
1.9(1.9)
2.0(1.9)
2.0(2.0)
Total CPI excluding the eect o theHST and changes in other indirecttaxes (year-over-year percentagechange)
1.9(1.9)
2.1(2.1)
2.9(2.9)
3.0(3.0)
2.7(2.6)
2.1(1.9)
1.4(1.0)
1.6(1.2)
1.6(1.5)
1.8(1.8)
1.9(1.9)
2.0(1.9)
2.0(2.0)
WTIb (level)85(85)
94(94)
103(103)
90(90)
94(85)
101(87)
102(87)
102(87)
101(88)
100(88)
99(88)
98(88)
98(88)
a. Figures in parentheses are rom the base-case projection in the October 2011 Monetary Policy Report.b. Assumptions or the price o West Texas Intermediate crude oil (US$ per barrel), based on an average o utures contracts over the two weeks ending 13 January 2012.
Chart 25: Growth in personal disposable income is projected to be moderatePercentage change, annual data
Sources: Statistics Canada and Bank o Canada calculations and projections
2005 2006 2007 2008 2009 2010 2011 2012 2013
-2
0
2
4
6
8
10
%
Labour and investment income Persona l disposab le income
The Canadian eCOnOMy
25
BANK OF CANADA • Monetary Policy rePort • January 2012

8/3/2019 Bank of Canada Monetary Policy Report January 2012
http://slidepdf.com/reader/full/bank-of-canada-monetary-policy-report-january-2012 32/37
experienced during the recession. As a result, the Bank expects relativelysolid growth in business xed investment through 2012, with some urtherstrengthening in 2013 as condence recovers (Chart 29 ). This projection isconsistent with the Bank’s winter Business Outlook Survey , which showedthat investment intentions remain strongly positive despite indications rom
a number o rms that ongoing nancial market volatility and global eco-nomic uncertainty had aected their investment plans.
The contribution o government spending to real GDP growth is assumed tobe very modest over the projection horizon, in line with scal plans o ederaland provincial governments to consolidate spending.
Foreign activity has been stronger in recent months than the Bank had pre-viously expected, particularly in the United States, contributing to a moreavourable outcome or Canadian exports. Going orward, however, oreignactivity is projected to grow slightly more slowly than anticipated in the
Foreign activity has been stronger
in recent months than the Bank had
previously expected
Chart 27: The share o household expenditures in GDP is now expected
to remain elevated
Quarterly data
Sources: Statistics Canada and Bank o Canada calculations and projections
1975 1980 1985 1990 1995 2000 2005 2010
Ratio
0.56
0.58
0.60
0.62
0.64
0.66
0.68
Nominal consumption and residential
investment to nominal GDP
Average rom 1975Q1 to present
Chart 26: Consumer confdence in Canada has declined in recent months
All respondents; index: 2002 = 100, monthly data
Source: Conerence Board o Canada Last observation: December 2011
2007 2008 2009 2010 2011
50
60
70
80
90
100
110
Index
26
The Canadian eCOnOMy
BANK OF CANADA • Monetary Policy rePort • January 2012

8/3/2019 Bank of Canada Monetary Policy Report January 2012
http://slidepdf.com/reader/full/bank-of-canada-monetary-policy-report-january-2012 33/37
October Report. In addition, competitiveness remains a challenge orCanadian rms. Unit labour costs in Canada have continued to increaserelative to those in the United States over the past year, resulting in a cumu-lative gap o almost 40 per cent between the beginning o 2005 and the third
quarter o 2011 (Chart 30 ). While the appreciation o the Canadian dollaraccounts or most o this deterioration in competitiveness, about one-quarter o it is due to the productivity underperormance o Canadian rms.Refecting these competitiveness challenges and the moderate projectedgrowth in oreign activity, the Bank expects relatively modest growth inCanadian exports through 2013. With imports anticipated to grow at nearlythe same pace, net exports contribute little to real GDP growth in Canadaover the projection horizon, and the current account decit remains signi-cant at around 3 per cent o GDP (Chart 31 ).
Competitiveness remains a challenge
or Canadian rms
Net exports contribute little to real GDP
growth in Canada over the projection
horizon
Chart 28: With leverage at historic lows, non-fnancial frms are well
positioned to invest
Quarterly data
Source: Statistics Canada Last observation: 2011Q3
19 90 19 92 19 94 19 96 19 98 2 00 0 2 00 2 2 00 4 2 00 6 2 00 8 2 010
Ratio
0.8
0.9
1.0
1.1
1.2
1.3
1.4
Debt-to-equity ratio
Chart 29: Business fxed investment is projected to grow aster once some
o the heightened uncertainty starts to dissipate
Comparison o real business xed investment across economic cycles;
quarter beore the downturn in real GDP = 100, quarterly data
Sources: Statistics Canada and Bank o Canada calculations and projections
-1 0 1 2 3 4 5
75
80
85
90
95
100
105
110
115
Index
Yearsbefore the
downturn
Yearsafter the
downturn
Quarterly peak before the
downturn in real GDP
1981–82 cycle 1990–92 cycle Current cycle
The Canadian eCOnOMy
27
BANK OF CANADA • Monetary Policy rePort • January 2012

8/3/2019 Bank of Canada Monetary Policy Report January 2012
http://slidepdf.com/reader/full/bank-of-canada-monetary-policy-report-january-2012 34/37
Overall real GDP in Canada is projected to grow at a pace close to the esti-mated growth rate o potential output in 2012, leaving the current degree oeconomic slack to persist in coming quarters.6 With the pace o real GDPgrowth subsequently picking up to a rate somewhat above potential, theeconomy is anticipated to return gradually to ull capacity by the thirdquarter o 2013, one quarter earlier than expected in the October Report. Inthis regard, the Canadian economy is projected to operate with slightly lessslack throughout the projection horizon than indicated in the October base-case scenario, refecting the slightly higher level o economic activity seen
recently.
6 As discussed in Technical Box 2 o the October Report, the base case assumes that Canada’s potential
output will grow by 2.0 per cent in 2012 and by 2.1 per cent in 2013.
The economy is anticipated to return
gradually to ull capacity by the third
quarter o 2013
Chart 30: Canadian frms are losing competitiveness
Contribution o various actors to the change in Canada’s relative unit labour costs
vis-à-vis those in the United States, quarterly data
Sources: Statistics Canada, U.S. Bureau o Economic Analysis
and Bank o Canada calculat ions Last observa tion: 2011Q3
2005 2006 2007 2008 2009 2010 2011
-5
0
5
10
15
20
25
30
35
40
45
%
Relative wages
Canadian dollar vis-à-vis the U.S. dollar
Relative productivity
Percentage change in relative unit
labour costs vis-à-vis the United States
Chart 31: Canada’s current account balance has declined substantially
in recent years
Quarterly data
Sources: Statistics Canada and Bank o Canada calculations Last observation: 2011Q3
2005 2006 2007 2008 2009 2010 2011
-5
-4
-3
-2
-1
0
1
2
3
4
%
Current account balance as a percentage o nominal GDP
28
The Canadian eCOnOMy
BANK OF CANADA • Monetary Policy rePort • January 2012

8/3/2019 Bank of Canada Monetary Policy Report January 2012
http://slidepdf.com/reader/full/bank-of-canada-monetary-policy-report-january-2012 35/37
InationCore CPI infation was 2.1 per cent in October and November, up rom 1.9 percent in the third quarter and 1.5 per cent in the rst hal o 2011. As anticipated,this increase partly refected the dissipation o the eect o the HST on year-over-year core infation,7 as well as the lagged eects o higher world prices oragricultural products on the prices o ood and clothing. Despite higher coreinfation, total CPI infation has come down rom its peak o 3.4 per cent in thesecond quarter o 2011, as anticipated, refecting some moderation in gasoline
prices together with the unwinding o the direct eects on year-over-year infa-tion o the introduction o the HST in the third quarter o 2010.
Infation expectations have remained well anchored. The JanuaryConsensus Economics orecast or total CPI infation in 2012 and 2013 was2.0 per cent. As reported in the Bank’s winter Business Outlook Survey ,92 per cent o rms expect average infation over the next two years toremain within the 1 to 3 per cent infation-control range. Market-basedmeasures o longer-term infation expectations also remain consistentwith the 2 per cent infation-control target.
Core infation is projec ted to moderate through 2012 to a level somewhatbelow 2 per cent (Chart 32 ), as excess supply persists and the eects ohigher prices or ood and clothing on year-over-year infation unwind. Total CPIinfation is projected to continue to decline to around 1.5 per cent by mid-2012,refecting lower core infation as well as the gradual impact on gasoline priceso the decline in world oil pr ices rom their peak in the second quarter o 2011.Both total and core infation are expected to start to rise gradually by the endo 2012, reaching 2 per cent by the third quarter o 2013 as excess supply inthe economy is slowly absorbed, the growth o labour compensation increasesmodestly and infation expectations remain well anchored.
7 The introduction o the HST in Ontario and Bri tish Columbia in July 2010 had a dampening eect,
amounting to 0.3 percentage points, on core infation through tax reunds passed on by businesses.
This eect was smaller than the direct positive eect o the introduction o the HST, which was
refected in total CPI infation, and resulted in a boost to total infation between the third quar ter o 2010
and the second quarter o 2011. Both o these temporary eects have since unwound, pushing core
infation up and total infation down.
Core infation is projected to moderate
through 2012 … while total CPI infation
is projected to continue to decline to around 1.5 per cent by mid-2012
Chart 32: Total and core CPI ination in Canada are projected to all temporarily
below 2 per cent in 2012
Year-over-year percentage change, quarterly data
Note: Dotted lines indicate projections.
a. CPI excluding eight o the most volatile components and the eect o changes in indirect taxes on
the remaining components
Sources: Statistics Canada and Bank o Canada calculations and projections
2007 2008 2009 2010 2011 2012 2013-2
-1
0
1
2
3
4
%
Total CPI Core CPIa Target Control range
The Canadian eCOnOMy
29
BANK OF CANADA • Monetary Policy rePort • January 2012

8/3/2019 Bank of Canada Monetary Policy Report January 2012
http://slidepdf.com/reader/full/bank-of-canada-monetary-policy-report-january-2012 36/37
These infation dynamics are similar to those anticipated in the OctoberReport, although the overall infation prole is marginally rmer in this pro-
jection, partly refecting some expected persistence in the slightly higher-than-anticipated prices observed recently or motor vehicles and electricity.These upside surprises have resulted in slightly higher-than-expected coreinfation in recent months, the persistence o which is consistent with aneconomy estimated to be operating with somewhat less economic slacksince mid-2011 than previously anticipated. A slightly higher prole or oilprices than previously assumed is also incorporated, as is the estimated
impact o the increase in the Quebec Sales Tax.8
This projection includes a gradual reduction in monetary stimulus over theprojection horizon, consistent with achieving the infation target.
The uncertainty surrounding the Bank’s infation projection is illustratedusing an charts. Chart 33 and Chart 34 depict the 50 per cent and 90 percent condence bands or year-over-year core infation and total CPI infa-tion rom the rst quarter o 2012 to the end o 2013.9
8 The increase in the Quebec Sales Tax in January 2012, rom 8.5 per cent to 9.5 per cent, will boost total
CPI infation by an estimated 0.1 percentage point in 2012.
9 Technical details on the construction o the an charts are available on the Bank’s website; key word
search: an charts.
Both total and core infation are
expected to reach 2 per cent by
the third quarter o 2013
Chart 33: Projection or core CPI ination
Year-over-year percentage change, quarterly data
Source: Bank o Canada
2010 2011 2012 2013
-2
-1
0
1
2
3
4
%
Base-case scenario 50 per cent condence interval
90 per cent condence interval
Chart 34: Projection or total CPI ination
Year-over-year percentage change, quarterly data
Source: Bank o Canada
2010 2011 2012 2013
-2
-1
0
1
2
3
4
%
Base-case scenario 50 per cent condence interval
90 per cent condence interval
30
The Canadian eCOnOMy
BANK OF CANADA • Monetary Policy rePort • January 2012

8/3/2019 Bank of Canada Monetary Policy Report January 2012
http://slidepdf.com/reader/full/bank-of-canada-monetary-policy-report-january-2012 37/37
The infation outlook in Canada is subject to signicant risks. In particular,the Bank’s projection assumes that authorities in Europe are able to containthe ongoing crisis, although this assumption is clearly subject to downsiderisks.
The three main upside risks to infation in Canada relate to the possibilityo stronger-than-expected infationary pressures in the global economy,stronger-than-expected growth in the U.S. economy and strongermomentum in Canadian household spending.
Global infationary pressures could be more persistent than currentlyprojected i growth in emerging-market economies does not decelerateto more sustainable levels or i potential output in advanced economies islower than projected.
Recently observed strength in U.S. consumption could be more persis-tent than anticipated and scal policy could exert a smaller-than-antici-pated drag on growth in the latter part o the projection.
Residential investment in Canada has been stronger than expected andhousehold expenditures could have more momentum than currentlyprojected.
The two main downside risks to infation in Canada relate to sovereign debtand banking concerns in Europe and the possibility that growth in Canadianhousehold spending could be weaker than projected.
Failure to contain the crisis in Europe is the most serious risk acing theglobal and Canadian economies. The eects on Canada through nan-cial, condence and trade channels would be substantial, given the sizeand importance o the euro area to the global economy.
High household debt levels in Canada could lead to a sharper-than-
expected deceleration in household spending. Relatedly, i there were asudden weakening in the Canadian housing sector, it could have sizablespillover eects on other areas o the economy.
Overall, the Bank judges that the risks to the infation outlook in Canada areroughly balanced over the projection horizon.
R to t Otoo