Embed Size (px)
Citation preview

Bank Indonesia
Report for the Financial Year1978/1979

Bank IndonesiaHead office :
JAKARTA
Representatives :
KUALA LUMPUR
LONDON
NEW YORK
SINGAPORE
TOKYO
Branch offices :
AMBON, BANDA ACEH,
BANDUNG, BANJARMASIN, BENGKULU,
CIREBON, DENPASAR, JAMBI, JAYAPURA,
JEMBER, KEDIRI, KENDARI, KUPANG, MALANG,
MATARAM, MEDAN, MENADO, PADANG, PALEMBANG,
PALU, PEKANBARU, PONTIANAK, SAMARINDA, SEMARANG,
SOLO, SURABAYA, TELUKBETUNG, UJUNG PANDANG, YOGYAKARTA.
Cash offices :
BALIKPAPAN
LHOKSEUMAWE
PEMATANG SIANTAR
PURWOKERTO
SIBOLGA
TASIKMALAYA
TEGAL
TERNATE
Position as per end of March 1979.

iii
NOTES, SYMBOLS AND SOURCE OF DATA
r Rivised figures
* Provisional figures
** Incomplete figures
(i.e. compiled from incomplete data)
. . . Data not yet available
-- Nil or less than the last digit
( ) Partial data
x Break in comparability before and after the symbol
$ United States Dollar
Source of data : Bank Indonesia, unless mentioned otherwise.

iv
INTRODUCTION
The implementation of the Second Five
Year Development Plan (PELITA II), which ter-
minated at the end of 1978/79, brought satis-
factory results. Despite recession and various
problems experienced by world economy, the
rate of growth of Indonesia’s economy re-
mained relatively high compared to both de-
veloping and developed countries. Balance of
payments also performed remarkably well
during the last few years, after recording defi-
cits in the first two years of PELITA II due to
PERTAMINA’s financial difficulties. As a con-
sequence, foreign exchange reserves contin-
ued to rise substantially and at the end of
PELITA II attained the highest level ever
achieved. An encouraging trend has also been
noted in prices whose level has remained un-
der control after aggravation toward the end
of PELITA II. The aforementioned satisfactory
results are attributable to Government’s policy
and to substantial funds available for develop-
ment made possible by the rise in the value of
oil export.
Based on the results achieved during
PELITA II, the Government set the major tar-
gets for the Third Five Year Development Plan
(REPELITA III) whose implementation com-
mences in the fiscal year 1979/80. The
REPELITA III has three objectives, namely an
equitable distribution of the fruits of develop-
ment, a high rate of economic growth and a
dynamically stable socioeconomic order. On
the growth of the economy in particular, the
target to be achieved during REPELITA III is
6.5% a year. In order to achieve it, a larger
investment than that of PELITA II is required,
that is 24% of GDP a year. A greater part (79%)
of investment will be financed domestically and
the rest by foreign funds. The REPELITA III is
expected to yield a balanced structure of the
economy through development of non-
agricultural sectors, particularly manufacturing,
transportation, communication and construc-
tion.
Toward the end of PELITA II, the economy
encountered several difficulties, which needed
to be solved in order to pave the way for the
implementation of REPELITA III. One of the
most pressing problems is the deterioration in
the competitiveness of Indonesian economy
vis-a-vis other countries, which will create
pressure on balance of payments and tend to
retard the future development efforts. The re-
duced competitiveness of the economy was
mainly due to the high rate of inflation in Indo-
nesia relative to the world inflation, particularly
those of trading partners and neighboring
countries and the inappropriate exchange rate
of Rupiah in terms of other currencies. This
situation is reflected in disparity of prices be-
tween domestic and imported goods in Ru-
piah.
Consequently, the Government adopted a
set of economic measures known as the No-
vember 15, 1978 package to create a favor-
able climate for the implementation of
REPELITA Ill. These measures comprise the
adjustment of the exchange rate of Rupiah
from Rp 415.- to Rp 625.- per $ 1.-, the man-
aged floating of Rupiah and its virtual linkage
to a basket of foreign currencies. To facilitate
the achievement of the objective of the said
policy, supportive measures were also adopted
in other fields, cornprising the exemption from

v
and reduction in the import duties and sales
taxes levied on raw materials and spare parts
used by domestic industries. Furthermore,
steps were taken to simplify the trade and li-
censing procedures and to ensure mainte-
nance of adequate stocks of basic necessi-
ties. The November 15, 1978 measures are
expected to improve the competitiveness of
domestically produced goods in domestic and
foreign markets and to further encourage ex-
ports, boost savings in foreign exchange and
stimulate capital inflows. In addition the mea-
sures are expected to induce the use of labor
intensive technology, which, in its turn, would
increase employment opportunities and result
in a more equitable distribution of income con-
ducive to one of the objectives of REPELITA
III.
In 1978/79, the fiscal year preceding the
implementation of REPELITA III, Indonesia’s
economy in general showed a satisfactory
performance. The growth of the economy was
maintained at a high rate, which was almost
at the same level as that of the preceding year.
Balance of payments had a larger surplus than
a year before, which resulted in a substantial
increase in foreign exchange reserves. Al-
though there was a decline in receipts from oil
export, the value of non-oil exports rose sub-
stantially and the increase in the value of im-
ports declined. These favorable developments
were attributable to the effects of the Novem-
ber 15, 1978 measures, the rise of prices of
some export commodities in the world market
and the reduced rice imports. The impact of
these measures was also discernible in Gov-
ernment revenue and expenditure, which in-
creased significantly and in real terms ex-
ceeded the preceding year figures. Although
the November 15, 1978 measures caused a
sharp rise in prices of certain commodities,
the Government restrains on monetary and
credit expansion and the controlled adjustment
of prices resulted in overall price increases not
far exceeding that of the preceding year.
Gross Domestic Product at constant prices
increased by 7.2% in 1978 compared to 7.4%
in the preceding year. Substantial increases
in production were recorded in agriculture and
manufacturing, while that of mining declined
following the increases in the previous years.
Agricultural production increased by 7.2%
in 1978/79, mainly as a consequence of an
excellent rice harvest. Rice production re-
corded the highest increase relative to those
achieved during the last decade, that is 10.8%
and reached 17.6 million tons. It was attribut-
able to favorable weather, reduced pest dam-
age and increased intensification efforts. Ac-
cordingly, the rice imports in the year under
report was reduced to 1.2 million tons com-
pared to 2.5 million tons in 1977/78. Among
other food crops, corn showed a substantial
increase in production (23%). While copra out-
put did not register significant change and im-
ports of copra were still needed. The rise in
timber prices in domestic and world markets
led to an increase of 36% of timber output.
Among other export commodities tobacco and
tea showed significant increases of 18% and
12% respectively.
In manufacturing, production increased by
14.7% in 1978/79, mainly reflecting the com-
ing on stream of new projects, expansion and
the increased utilization of the existing capac-
ity, following the November 15, 1978 measures.

vi
After the commencement of production of new
Kujang fertilizer plant in Cikampek, West Java,
urea fertilizer production expanded by 45% to
reach 1,434 thousand tons in 1978/79. Cement
output increased by 26% and reached 3,640
thousand tons after the expansion of Cibinong
plant in West Java and Gresik plant in East
Java were completed. In the year under report
the construction of 11 new paper plants and
the expansion of 8 plants were also completed,
resulting in 99% increase in paper production
to reach 166 thousand tons. Although less
important, production of automobiles, tires,
radios, television sets and agricultural equip-
ment registered large gains. Similarly, several
industries, notably textiles and reinforcing
steel, stepped up their production and export,
mainly as the result of increased capacity uti-
lization following the November 15, 1978 mea-
sures.
In mining, crude oil production, which in-
creased significantly in the previous year de-
clined to 589 million barrels in 1978/79 com-
pared to 616 million barrels in the preceding
year. This decline was caused mainly by the
slackening of exploration activities during
1975-1977. However, the decrease in crude
oil production was offset by the increase in the
production of liquefied natural gas following the
coming on stream of liquefied gas plant in
Arun, Aceh. Among other minerals, tin and coal
production went up by 5% and 3% respectively,
while productions of copper, nickel and baux-
ite declined by 1%, 11% and 21% respectively.
Indonesia’s balance of payments showed
an overall surplus of $ 708 million in 1978/79,
compared to that of $ 651 million in the pre-
ceding year. Consequently, net international
reserves at Bank Indonesia rose from $ 2,208
million at the end of 1977/78 to $ 2,916 million
at the end of the year under report.
Total export earnings rose by 5% to reach
$ 11,353 million in 1978/79 compared to an
increase of 18% in the preceding year. This
relatively small increase was mainly caused
by a 5% decline in the value of oil exports,
even though the value of non-oil and liquefied
gas exports rose by 13%. The value of oil ex-
ports in the year under report amounted to $
6,858 million compared to $ 7,191 million in
1977/78. The decline was due to lower crude
oil production and the difficulties in marketing
the crude of low-sulphur waxy residue. How-
ever, the value of liquefied gas exports rose
substantially from $ 162 million in 1977/78 to
$ 516 million in the year under report. As a
result, the decline in the earning of crude oil
exports was offset, so that the export earn-
ings of these sources of energy taken together
remained almost equal to 1977/78 figures.
Earnings from non-oil and liquefied gas
exports reached $ 3,979 million in 1978/79.
Almost all export commodities registered in-
creases in value terms during the year under
report. Export of tin, rubber and timber showed
substantial increases in the year under report.
Fertilizer exports, which were started in 1977/
78, reached 262 thousand tons or $ 37 million
in the year under report. In addition, cement,
which was previously an imported commod-
ity, has been exported since October 1978,
although imports of certain types of cement
were still required.
The value of imports rose by 7% in the year
under report compared to an increase of 10%
in 1977/78. The lower import increase reflects

vii
reduced rice imports, attributable to excellent
rice harvest.
The services account registered a deficit
of $.4,605 million in 1978/79, which was 10%
greater than that of the preceding year. This
was caused mainly by the increases in inter-
est payment on external debt and transfer of
profits on foreign investments. Due to this
greater deficit in services accounts, the cur-
rent account deficit widened from $ 690 mil-
lion in 1977/78 to $ 1,155 million in the year
under report.
The capital account showed a surplus of $
1,843 million, which was slightly above the
1977/78 figures. This was attributable to the
reduced repayment of Government debts af-
ter the refinancing operation of syndicate loans
was conducted in January 1978. It may be
noted that in 1978/79 the Government began
to enter into international capital market when
it publicly issued Government bonds abroad
amounting to $ 100 million.
As in the previous years, Government bud-
getary policy was aimed at a high rate of eco-
nomic growth, the maintenance of monetary
stability and realization of a more equitable
distribution of income. To achieve these objec-
tives, the Government expenditure was raised
in response to higher revenues while still main-
taining the balance in the budget. Actual Gov-
ernment budget expenditure and receipts in-
creased by 23% over the previous year and
reached Rp 5,300 billion. Taking into account
the inflation rate in that year, Government bud-
get in real terms rose by 11%. Government
saving, defined as the difference between
Government domestic receipts and Govern-
ment routine expenditures, amounted to Rp
1,522 billion, which was 10% above the previ-
ous year.
Government expenditures, divided into rou-
tine and development expenditures respec-
tively increased by 28% and 18% anal reached
Rp 2,744 billion and Rp 2,555 billion in 1978/
79. The increase in routine expenditure was
mainly as a result of the sharp rise in payments
for interest and repayments of principal on for-
eign debts (134%) and subsidy on domestic
oil consumption ( 203% ), reflecting mainly the
adjustment of Rupiah exchange rate on No-
vember 15, 1978 and increased domestic oil
consumption. In addition there was a substan-
tial rise in Government personnel expenditure
(12%), due to the increase in pension allow-
ance, the upward adjustment in the price of
rice for Government employees and the rise
in Government personnel expenditure abroad
after the adjustment of Rupiah exchange rate.
Among components of development expendi-
ture, expenditures for regional development
and fertilizer subsidy rose significantly. The
former comprising development subsidies to
villages, kabupatens, provinces and INPRES
program and IPEDA, was for financing labor
intensive activities, construction of
PUSKESMAS and primary schools, construc-
tion and renovation of market places and re-
forestation and regreening projects. The latter
as fertilizer subsidy registered a marked in-
crease in the year under report because of
the rise in import price and domestic cost of
production after the November 15, 1978 ex-
change rate adjustment of Rupiah.
Government revenue also went up substan-
tially and reached Rp 5,301 billion in the year
under report. All components thereof, classi-

viii
fied into Government domestic revenue and
foreign aid receipts, showed increases. Oil
corporation tax continued to remain an impor-
tant source of domestic revenue, represent-
ing 54% of Government domestic revenue and
44% of total Government receipts. Despite the
decline in oil production and oil export in the
year under report, the corporation tax revenue
went up by 18%, mainly reflecting the adjust-
ment of Rupiah exchange rate in November
15, 1978. Among other Government domestic
revenues, significant increases were recorded
by income tax (17%), corporation tax (34%)
withholding tax (15%) excise duties (39%) and
export tax (105%). In addition to direct and in-
direct effects of Rupiah exchange rate adjust-
ment, these increases were attributable to the
expansion of business activity, the improve-
ment of the taxation apparatus and the adjust-
ment of tax base for excises.
Although the adjustment in Rupiah ex-
change rate had an impact on receipts of im-
port duties and import sales tax, these rev-
enue items showed smaller increases com-
pared to the above mentioned items of Gov-
ernment receipts. These were explained by
total and partial exemption of import duties and
export sales tax on imported commodities
needed by domestic industries, which were
also included in the November 15, 1978 policy
package. Government foreign aid receipts,
consisting of project aid and program aid went
up by 34% in 1978/79. A major part of the in-
crease reflects the adjustment of Rupiah ex-
change rate.
Before the, adoption of the November 15,
1978 measures, prices were relatively stable,
i.e. increased only by 2.4% during the first 7
months of 1978/79. Thereafter, a correspond-
ingly high increase was caused in prices of
export and import commodities. However, due
to elaborate restrains on monetary and credit
expansion and controlled adjustment of prices
of domestically produced goods by the Gov-
ernment, the upward march was decelerated
so that the general price increase was only
11.9% in 1978/79.
Monetary expansion, measured both by
total liquidity and total money supply, aug-
mented substantially by 26% and 33% respec-
tively in 1978/79, compared to 15% and 16%
in the preceding year. Most of these increases
occurred after November 15, 1978. During the
period from November 15, 1978 to the end of
March 1979, total liquidity and money supply
went up by monthly averages of 2.7% and
3.6% respectively, while for the period from
April to November 15, 1978 these increases
were only 1.6% and 1.9% respectively. The
upward surges reflect the higher demand for
liquidity needed to maintain the level of busi-
ness activity as prices rose following the No-
vember 15, 1978 measures.
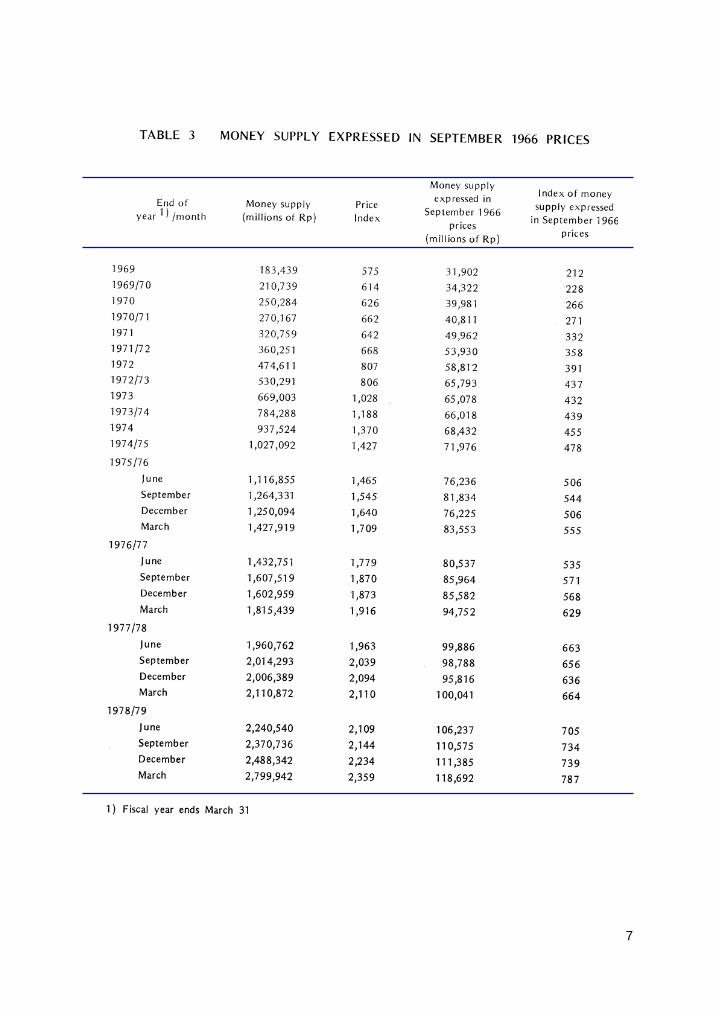
The money supply reached Rp 2,799 bil-
lion at the end of 1978/79, which was Rp 688
billion over the end of March, 1978. As in the
preceding year, foreign transactions and bank
credits had expansionary impacts while Gov-
ernment sector had contractionary influence
on money supply. Bank credit had the largest
expansionary impact, mainly as the result of
credit expansion to BULOG, PERTAMINA, PT
Krakatau Steel and private enterprises, espe-
cially after November 15, 1978. Although the
Government budget was balanced administra-
tively, the actual Government receipts and ex-

ix
penditures had contractionary impact in 1978/
79. In addition, time and .saving deposits rose
faster than the preceding year, but this increase
mainly reflects the valuation adjustment of time
deposit in foreign exchange to the new ex-
change rate of Rupiah.
As an instrument of monetary policy the
ceiling on bank credits and other bank assets
remained in effect in the year under report. For
1978/79 the ceilings on expansion of credit and
other assets of commercial banks was set at
19% over the figure at the end of March 1978.
As prices rose, consequent upon the Novem-
ber 15, 1978 measures, demand for liquidity
increased. To accommodate this increase, the
ceilings on the expansion of bank credits and
other bank assets were raised to 24%, which
amounted to Rp 622 billion. The actual expan-
sion of bank credit and other bank assets in
1978/79 was 23% over the previous year fig-
ure.
In addition to the above quantitative mon-
etary measures, the policy of channeling bank
credit to priority sectors was implemented,
particularly to labor intensive activities and
those creating business opportunities for the
economically-weak group. Accordingly, bank
credits with concessional terms available for
this group, which are known as KIK, KMKP,
Mini credit and INPRES Pasar, were expanded.
Up to the end of 1978/79, the number of KIK
applications approved reached 57 thousand
with aggregate limit of Rp 113 billion and the
number of KMKP applications approved was
438 thousand with the value of Rp 188 billion.
Significant increases were also recorded by
Mini credit and INPRES Pasar.
In an effort to further encourage and assist
the small businessmen ( of economically-weak
group), the participation of the national private
commercial banks and the local development
banks was enhanced. Accordingly, additional
credits from Bank Indonesia are made avail-
able to these banks, subject to the requirement
that they are classified as sound and fairly
sound and have extended KIK and KMKP.
On the supervision of banks and non-bank
financial institutions, further revisions were
taken in the year under report, with respect to
the obligation to disclose bank’s balance sheet
and profit and loss accounts, the issuance of
guaranty by bank and non-bank financial in-
stitutions and the efforts to improve the effi-
ciency of state banks. In addition, the policy of
promoting merger among national private com-
mercial banks was continued with the exten-
sion of the period for obtaining tax relief for
banks participating in mergers up to March 31,
1980. Furthermore, in order to assist non-bank
financial institutions in expanding transactions
in commercial paper, a rediscount facility was
made available by Bank Indonesia up to Rp
500 million a year for each financial institution.
The requirements for obtaining this facility were
relaxed and the amount available for each fi-
nancial institution was raised to around Rp 1.6
billion since December 1978.
Consequent upon the November 15, 1978
measures, several national private commer-
cial banks were expected to encounter liquid-
ity shortages as the result of sudden and large
withdrawals by customers. To assist these
banks in overcoming their difficulties, Bank
Indonesia provided emergency credit facilities,
comprising regular emergency credit and spe-
cial emergency credit for imports, the latter due
x
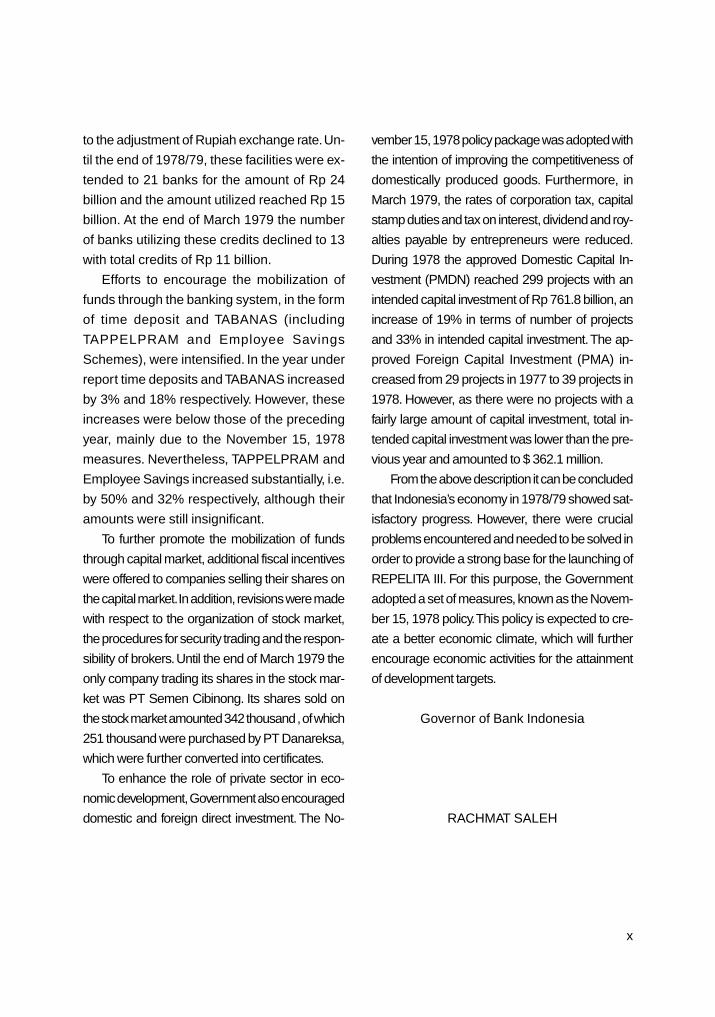
to the adjustment of Rupiah exchange rate. Un-
til the end of 1978/79, these facilities were ex-
tended to 21 banks for the amount of Rp 24
billion and the amount utilized reached Rp 15
billion. At the end of March 1979 the number
of banks utilizing these credits declined to 13
with total credits of Rp 11 billion.
Efforts to encourage the mobilization of
funds through the banking system, in the form
of time deposit and TABANAS (including
TAPPELPRAM and Employee Savings
Schemes), were intensified. In the year under
report time deposits and TABANAS increased
by 3% and 18% respectively. However, these
increases were below those of the preceding
year, mainly due to the November 15, 1978
measures. Nevertheless, TAPPELPRAM and
Employee Savings increased substantially, i.e.
by 50% and 32% respectively, although their
amounts were still insignificant.
To further promote the mobilization of funds
through capital market, additional fiscal incentives
were offered to companies selling their shares on
the capital market. In addition, revisions were made
with respect to the organization of stock market,
the procedures for security trading and the respon-
sibility of brokers. Until the end of March 1979 the
only company trading its shares in the stock mar-
ket was PT Semen Cibinong. Its shares sold on
the stock market amounted 342 thousand , of which
251 thousand were purchased by PT Danareksa,
which were further converted into certificates.
To enhance the role of private sector in eco-
nomic development, Government also encouraged
domestic and foreign direct investment. The No-
vember 15, 1978 policy package was adopted with
the intention of improving the competitiveness of
domestically produced goods. Furthermore, in
March 1979, the rates of corporation tax, capital
stamp duties and tax on interest, dividend and roy-
alties payable by entrepreneurs were reduced.
During 1978 the approved Domestic Capital In-
vestment (PMDN) reached 299 projects with an
intended capital investment of Rp 761.8 billion, an
increase of 19% in terms of number of projects
and 33% in intended capital investment. The ap-
proved Foreign Capital Investment (PMA) in-
creased from 29 projects in 1977 to 39 projects in
1978. However, as there were no projects with a
fairly large amount of capital investment, total in-
tended capital investment was lower than the pre-
vious year and amounted to $ 362.1 million.
From the above description it can be concluded
that Indonesia’s economy in 1978/79 showed sat-
isfactory progress. However, there were crucial
problems encountered and needed to be solved in
order to provide a strong base for the launching of
REPELITA III. For this purpose, the Government
adopted a set of measures, known as the Novem-
ber 15, 1978 policy. This policy is expected to cre-
ate a better economic climate, which will further
encourage economic activities for the attainment
of development targets.
Governor of Bank Indonesia
RACHMAT SALEH

1
I. MONETARY DEVELOPMENTS
A. Monetary developments and measures
During the last few years, the domestic
monetary situation has stabilized as reflected
in the decline in the rate of inflation. However,
mainly as a result of the continued sluggish
world economic conditions in 1978/79, growth
in investment and exports has not been as
buoyant as expected.
To counter the economic slowdown, the
Government has adopted measures intended
to stimulate production, investment and ex-
ports by providing tax and financial incentives
and simplified procedures in order to lower the
cost of production. At the end of December
1977, a package of monetary measures was
introduced, comprising a downward revision
of lending and deposit rates, a relaxation of
lending terms and a lowering of the minimum
reserve requirements. These measures had
their intended effects as reflected in a more
rapid expansion in bank credit, albeit within the
limits considered compatible with monetary
stability (and a reduction of inflationary pres-
sures).
Although inflation has moderated signifi-
cantly in the last few years, the increase in the
price level since 1971, when the Rupiah ex-
change rate was fixed at Rp 415.- per $, was
greater than the rise of world prices in general
and those of Indonesia trading partners and
neighboring countries in particular.1) These dif-
ferences in the rate of inflation led to a dete-
rioration in the competitiveness of domestic
goods against foreign goods, as reflected in a
slow expansion in the volume of nonoil exports,
activities of which are generally labor inten-
sive and provide incomes for broad catego-
ries of the population. The decline in the com-
petitiveness of domestic production was also
reflected in increased imports, which put pres-
sure on the balance of payments and
squeezed import competing industries.
In view of this situation and in an effort to
provide a strong base for PELITA III, the Gov-
ernment took a set of important measures on
November 15, 1978. The exchange rate of the
Rupiah was adjusted from Rp 415.- to Rp 625.-
per $ and the rigid link to the dollar was aban-
doned. Instead, the exchange rate of the Ru-
piah was flexibly linked to a basket of selected
foreign currencies, in a managed float. The
exchange rate adjustment was followed by
other measures in the fields of customs and
taxation, all of which were intended to increase
the competitiveness of Indonesian products in
foreign as well as domestic markets, to boost
exports in the long run, to economize on the
use of foreign exchange, and to encourage
domestic and foreign investment. Further,
these measures were intended to expand em-
ployment opportunities and encourage a shift
in the use of technology from capital to labor
intensive production, leading to a more equi-
table income distribution.
The supportive measures taken to achieve
the above objectives included a reduction or
1) In the 1971-1978 period, Indonesia’s cost of livingindex rose 230% compared with 65% in the UnitedStates, 105% in Japan, 41% in Germany, 47% inMalaysia, 71% in Singapore, 86% in Thailand and111% in the Philippines
Source: International Financial Statistics, August 1971and October 1978

2
elimination in import duties and import sales
tax on raw materials and spare parts for do-
mestic production and exports, a simplifica-
tion of trade regulations and licensing proce-
dures and a maintenance of adequate stock
of certain principal commodities.
The November 15, 1978 measures, never-
theless, caused prices to rise significantly,
averaging 1.8% per month from November
1978 through March 1979, compared with an
average of 0.3% per month during the period
between April and October 1978. In all of 1978/
79, however, price increases were still within
an acceptable rate of 11.8% compared to
10.1% in the 1977/78 fiscal year.
The price increases following the devalua-
tion resulted in a liquidity squeeze and cash
shortages among business enterprises. This
was reflected in an increased demand for bank
credit and a marked deceleration in the growth
of time and savings deposits in the period be-
tween November 1978 and March 1979. In
order to meet the larger demand for bank
credit, the ceiling on bank credit expansion was
raised from 19% of the total amount outstand-
ing at end of the previous year to 24%, while
the actual figure reached 23%. Thus, 96% of
the ceiling was reached, which is the highest
proportion since credit ceilings were intro-
duced. In addition, Bank Indonesia granted
emergency loans to some smaller banks to
save them from financial difficulties following
larger-than-usual withdrawals by their deposi-
tors.
Partly on account of devaluation, total li-
quidity was increased by 27% in 1978/79, com-
pared with the relatively slow growth of 15%
in the previous year. The average monthly in-
crease in total liquidity was only 1.6% in the
period April to October 1978, but reached an
average of 3.0% in the period November 1978
to March 1979.
B. Money supply and factors affecting its
changes
Money supply, comprising currency and
demand deposits, amounted to Rp 2,800 bil-
lion at the end of 1978/79, an increase of Rp
689 billion or 33% compared with Rp 295 bil-
lion or 16% in the previous year. Most of the
acceleration occurred after November, 1978,
with money supply increasing at a monthly
average rate of 3.6%, compared with an aver-
age rate of 1.9% during the period April to
November 1978. Taking into account the rate
of inflation in 1978/79, money supply in real
terms registered an increase of 19% during
the reporting year, compared with a 6% in-
crease during previous year. This real increase
reflected the growth in real incomes and a
wider use of money in economic activities.
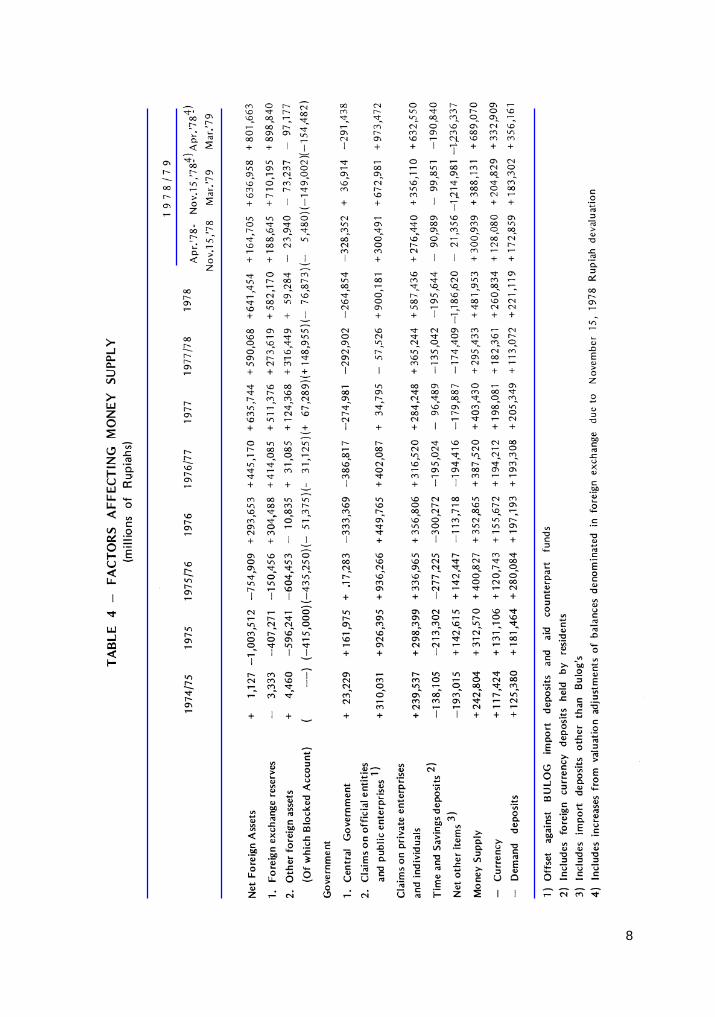
As presented in Table 4, during 1978/79 the
expansionary influences on money supply
were increases in net foreign assets (Rp 802
billion), net claim on official entities and public
enterprises (Rp 973 billion) and net claims on
private enterprises (Rp 633 billion).
Contractionary influences were the decline in
net claims on Central Government (Rp 291
billion), and the increase in time and savings
deposits (Rp 191 billion) and in net other items
(Rp 1,236 billion).
Of the increase in net foreign assets, Rp
603 billion was caused by valuation adjustment
of the net assets in foreign exchange as a re-

3
sult of the devaluation, leaving the remaining
Rp 199 billion comparable to the previous
year’s increase of Rp 590 billion in net foreign
assets. The lower increase in 1978/79 was in
part due to the payments of usance L/C obli-
gations opened by banks for imports in 1977/
78. In order to help importers who faced diffi-
culties in paying out their L/C obligations fol-
lowing the devaluation, foreign exchange
banks were allowed to take over the payments
obligations for the importers accounts.
Net claims on official entities and public
enterprises, which had declined by Rp 58 bil-
lion in 1977/78, increased in 1978/79 by Rp
973 billion of which Rp 567 billion was attrib-
utable to the valuation adjustment of loans
denominated in foreign exchange. The remain-
ing increase was mainly accounted for by an
expansion of net credit to BULOG,
PFRTAMINA and PT Krakatau Steel.
Claims on private enterprises and individu-
als during the reporting year showed an in-
crease of Rp 633 billion compared to Rp 365
billion, in the previous year. The more rapid
expansion of bank credit to the private sector
reflected the increased demand for credit as a
result of the relaxation of lending terms on
January 1 , 1978, as well as the November-
15, 1978 measures.
The Central Government sector registered
a slightly smaller contractionary impact than
in the previous year, amounting to Rp 291 bil-
lion. This contraction was par tly due to
higher-than expected Government receipts
from oil corporation tax as a result of the de-
valuation which was only partially offset by
expenditure increases.
Time and savings deposits recorded an
increase of Rp 191 billion, only about Rp 56
billion higher than during the previous year.
However, most of this increase was the result
of the valuation adjustment to time and sav-
ings deposits denominated in foreign ex-
change. Aside from the valuation adjustment,
the increase in time and savings deposits in
1978/79 amounted to only Rp 91 billion. This
reflected the virtual halt in the expansion of
these deposits after November 15, 1978, as a
result of the cash shortages experienced in
parts of the economy.
Net other items showed a substantial
contractionary impact, amounting to Rp 1,236
billion, of which Rp 993 billion represented the
net amount of the counter entries for valuation
adjustment of foreign exchange denominated
items. Excluding the valuation adjustment, the
contractionary effect amounted to Rp 243 bil-
lion, which was still higher than the previous
year’s Rp 174 billion. The increased
contractionary effect resulted in part from in-
creases in the capital accounts of Bank Indo-
nesia as well as deposit money banks. On the
other hand, import deposits, which is another
major item in this category, registered a lower
increase than in 1977/78, as reflecting the ef-
fect of measures effective January 1978, al-
lowing imports of selected goods under us-
ance L/Cs.
C. Monetary prospect for 1979/80
For 1979/80, the first year of REPELITA III,
monetary policy will continue to be geared to
the achievement of the triple objectives of de-

4
velopment namely, the equitable distribution
of the fruits of development, a respectable
economic growth and national stability. With
the average growth target of 6.5% a year dur-
ing REPELITA III, and allowing for an accept-
able rate of inflation, total liquidity has been
projected to expand by 23% in 1979/80.
The expansionary impact of the foreign
sector is expected to be greater than in 1978/
79, based on the prediction that exports will
be larger than in 1978/79, owing to the recent
stimulation provided by the November 15, 1978
measures, and a rise in oil export prices.
In view of the projected large expansion-
ary impact from the foreign sector and the
Government budget assumed to have neutral
effect, the pace of expansion in bank credit
will have to be kept within the limits consid-
ered compatible with monetary stability. For
that purpose, the imposition of ceilings on bank
credit expansion will be maintained. The ceil-
ing for 1979/80 has been set equal to the pre-
vious year’s ceiling in absolute terms, but ap-
preciably lower in percentage terms. As in the
previous years, however, the ceiling will be
subject to adjustments in the course of the
year, as dictated by economic and monetary
developments.
Beside the above credit ceiling, bank
lending will be directed more toward high
priority sectors, particularly labor inten-
sive ones and those creating business op-
por tunities for the economically weak
groups.

5

6
7
8

9

10

11
II. BANK CREDIT DEVELOPMENT
A. Credit policy
The credit policy aimed at maintaining mon-
etary stability, directing bank lending to the
priority sectors and suppor ting the
economically-weak group was continued dur-
ing the year under report. The steps taken
during the year were designed to make ad-
justments to suit current economic condition.
The monetary stability was sought to be
achieved mainly by imposing ceiling on the
expansion of bank credit and other bank do-
mestic assets. The overall expansion in the
commercial bank credit for 1978/79 was ini-
tially set at 19% of the amount outstanding at
the end of March 1978. However, to meet
higher demand for liquidity consequent upon
the November 15,1978 measures, the allow-
able expansion was raised to 24% or Rp 622
billion. Out of this amount Rp 338 billion was
earmarked for priority ]endings, including Rp
57 billion for KIK and KMKP, and Rp 284 bil-
lion for non-priority lendings. Through the im-
position of sub-ceilings, which set allowable
expansion of credit for each category or sec-
tor according to priority scale, the allocation
of credit was also determined. In the year un-
der report the classification of loans for set-
ting priority scale, which was previously based
on type of loans, was changed to that based
on economic sector, except with respect to KIK
and KMKP. The adjustment in the allocation of
credit was also made by changes in interest
rates for each type of loan or sector, interest
rates of Bank Indonesia refinancing credits and
other credit terms. In 1978/79 these changes
were made both with respect to short-term
credits and investment credits.
In order to encourage export activities, the
interest rate and lending terms of state bank
credits extended to producers of export com-
modities operating under the Foreign Capital
Investment (PMA) and of foreign companies
have been made equal to those applicable to
national exporters and producers of export
commodities since April 1, 1978. The interest
rate for these loans was set at 12% a year1),
while previously it was 13.5%.
Furthermore, effective as of June 26, 1978,
the above rate and terms of lending became
applicable to credits for export and production
of export commodities extended by national
private foreign exchange banks, provided
these credits were refinanced by Bank Indo-
nesia. Refinancing credit available amounted
to 75% of the loan extended, for a period of
not more than 9 months and at 4% interest
per annum. In case of evidence that Bank In-
donesia refinancing facility is abused, the bor-
rowing bank will be charged 7.5% interest a
year. National private foreign exchange banks,
who have extended credits to exporters and
producers of export commodities on the above
mentioned rate and terms are eligible for ad-
ditional Bank Indonesia refinancing credit up
to 50% of paid-in capital.2)
Effective from June, 1978 domestic contrac-
tors exporting services to the Middle East were
eligible for credit in foreign exchange for work-
ing capital or investment at interest rate and on
1) Bank Indonesia circular Letter, SE No. 11/2/UPK,April 22, 1978.
2) Bank Indonesia Circular Letter, SE No. 11/13/UPK,July 25, 1978.

12
terms which would enable them to compete with
foreign contractors. These credits are not sub-
ject to the ceiling on bank credit expansion as
long as they were spent abroad and will be ex-
empted from the ceiling on foreign borrowings
as well as from the minimum reserve require-
ment for liabilities in foreign exchange if they are
financed by foreign borrowings.3)
In line with the Government’s policy to put
an end to domestic trading activities of foreign
companies by the end of 1978, banks have
been prohibited to extend credits to such com-
panies since early 1978, except to those pro-
ducing export commodities. All credit facilities
approved by that time remained in effect on
certain conditions.4)
A new classification and lower interest rates
for investment credits were introduced on Janu-
ary 1, 1978. In 1978/79 the new classification
and interest rates were applied to investment
loans extended by banks for Rupiah financing
of aid financed projects. However, special provi-
sions with respect to Bank Indonesia refinanc-
ing credits remained in effect, the amount of
refinancing credits being 90% of loans extended
in all categories and the interest rate being 7%
for category I, 9% for category II and 11 % for
categories III and IV. These interest rates were
higher than those applicable to investment cred-
its under Bank Indonesia scheme due to the
lower risk of default faced by banks in extend-
ing such credits.5)
In an effort to speed up the processing of
credit applications, state banks were authorized
as of September 1978 to make their own deci-
sions on credit applications involving amounts
up to Rp 200 million. In addition, they were au-
thorized to approve all Government guaranteed
loans and credits extended by consortium of
banks and other credits exceeding Rp 200 mil-
lion but up to Rp 300 million as long as they
were used to finance projects within their spe-
cialized fields. Under a previous regulation, the
handling banks were authorized to decide on
investment credits not exceeding Rp 100 mil-
lion. Besides, the minimum amount of credits
required to be extended jointly by a consortium
of banks was raised from Rp 300 million to Rp
500 million for investment and from Rp 500 mil-
lion to Rp 750 million for working capita.6)
In addition, the interest rate and the percent-
age of Bank Indonesia refinancing credit avail-
able for Government guaranteed investment
credit and for credit extended to finance large
Government projects were revised. The inter-
est rate was reduced from 9.5% per annum to
6% while the percentage was lowered from 90%
to 80%. The interest rate charged by handling
banks to customers remained at 12% a year.7)
In line/ with Government policy to close the
entry into rice milling industry, because this
industry is considered saturated, investment
credits are no longer available for rice milling
companies since early 1979.8)
3) Bank Indonesia Circular Letter, SE No. 11/18/ULN,June 9, 1978.
4) Bank Indonesia Circular Letter, SE No. 11/3/UPK,April 22, 1978.
5) Bank Indonesia Circular Letter, SE No. 11/17/UPK,August 23, 1978.
6) Bank Indonesia Circular Letter, SE No.11/26/UPK,January 12, 1979.
7) Bank Indonesia Circular Letter, SE No. 11/29/UPK,January 26, 1979.
8) Bank Indonesia Circular Letter, SE No. 11/23/UPKand SE No. 11/24/UPK, January 9, 1979.

13
During the year under report the role of
national private banks and local development
banks in promoting business activities of the
economically-weak groups was enlarged. Out
of these banks those which were classified as
sound or fairly sound and extended KIK and
KMKP loans directly (not jointly with other
banks) were made eligible for additional Bank
Indonesia refinancing credits amounting to not
more than 50% of their paid-in capital, thereby
making in aggregate thereof not more than
150% of their paid-in capital.9)
Moreover, in December 1978, the condi-
tion for obtaining additional KIK and KMKP
loans of not more than Rp 10 million was re-
laxed by abolishing the requirement that the
customer must have properly used KIK and
KMKP during the two preceding years. Con-
sequently, the banks were thenceforth empow-
ered to extend KIK and KMKP loans, if in their
judgement the applicants were really in need
of additional credits.
On April 1, 1978, the terms on Mini Credits
were also relaxed through a downward revi-
sion of the interest rate from 15% to 12% per
annum, with the interest rate for investment
purposes remaining at 12% a year. A uniform
rate thus applied to both working capital and
investment purposes.
At the end of 1978, regulations were issued
regarding the extension of loans to low and
middle-level employees to finance purchases
of low-cost houses. These credits known as
KPR (House Purchases Credit), were made
available through Bank Tabungan Negara
(state savings bank) on concessionary terms.
The credit for the purchase of a house, built
by PERUMNAS (National Housing Develop-
ment Corporation), for a price not exceeding
Rp 3.5 million, would be financed by the Gov-
ernment Budget, while credit for the purchase
of a house, constructed by private develop-
ers, for a price not exceeding Rp 6 million
would be financed by the banking system. KPR
financed by the Government Budget would be
extended to civil servants belonging to grades
I, II and III or their equivalents, with repayment
periods ranging from 5 to 20 years. The rate of
interest was 5% for grades I and II and 9% for
grade Ill. KPR financed by the banking system
were available to civil servants and other em-
ployees whose income was not more than that
of grade IV civil servants, with repayment pe-
riods ranging from 5 to 15 years and the inter-
est rate of 9% per annum. Similar to other in-
vestment credits, BTN was entitled to Bank
Indonesia refinancing credits for the latter type
of KPR credits amounting to 80% and subject
to 3% interest.
B. Volume and allocation of credit
At the end of 1978/79, bank credits out-
standing amounted to Rp 5,640 billion, show-
ing an increase of Rp 1,565 billion or 38%
during that financial year, as against Rp 358
billion or 10% in the preceding year. The rapid
expansion occurred mainly after the Novem-
ber 15, 1978 measures. During the 7 1/2
months before November 15, 1978, there was
only 13% increase, compared to 25% increase
during the following 4 1/2 months. Out of the
increase after November 15, 1978, the greater9) Bank Indonesia Circular Letter, SE No. 11 /5/UPK,
April 29, 1978.

14
part i.e., Rp 625 billion was due to the valua-
tion adjustment of credits in foreign exchange.
Excluding the valuation adjustment, out-
standing credit expanded by Rp 940 billion or
23% during 1978/79. Beside the impact of the
monetary measures taken at the end of De-
cember 1977, the expansion of credit was at-
tributable to increased demand for liquidity af-
ter November 15, 1978. It may be added that
out of the total bank credit outstanding, an
amount of Rp 271 billion represented direct
credits from Bank Indonesia, which were
mainly extended to PERTAMINA and BULOG.
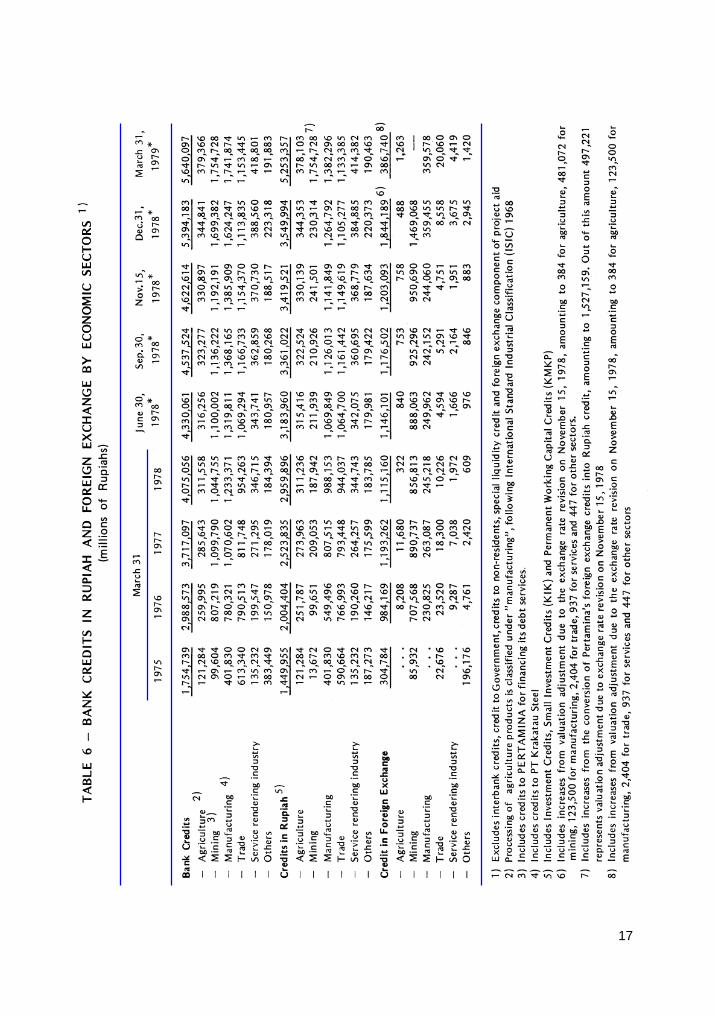
The distribution of credit by economic sec-
tors, which includes credits in foreign ex-
change, is presented in Table 6. During 1978/
79, credit to each economic sector registered
significant increase, i.e. credit for mining in-
creased by Rp 710 billion or 68%, for manu-
facturing by Rp 509 billion or 41%, for trade by
Rp 199 billion or 21 %, for agriculture by Rp
68 billion or 22% and for services by Rp 72
billion or 21%. Out of the increase to the min-
ing and manufacturing sectors, Rp 497 billion
and Rp 124 billion respectively were due to
valuation adjustment of credits in foreign ex-
change. The remaining increase in credits to
manufacturing sector was primarily due to
Krakatau Steel, cement industry and construc-
tion of INPRES market places, while that in
mining sector was mostly on account of
PERTAMINA. The increase in credit in the trade
sector was accounted for by credit to BULOG
for food procurements and by increase in com-
mercial bank credits for financing the distribu-
tion of fertilizers, exports, imports and KIK and
KMKP credits to small-businessmen.
With the above increases, the share of each
sector at the end of 1978/79 became 31 % for
mining, 31 % for manufacturing, 21% for trade,
7% for agriculture and 7% for services. Ex-
cluding the valuation adjustment of credits in
foreign exchange, the share of each sector
remained approximately the same as in the
preceding year, i.e. 25% for mining, 32% for
manufacturing, 23% for trade, 8% for agricul-
ture and 8% for services.
At the end of March, 1979, credits outstand-
ing in Rupiah and in foreign exchange
amounted to Rp 5,253 billion or 93% and Rp
387 billion or 7% respectively. The large in-
crease in credits in Rupiah was mainly due to
the conversion of PERTAMINA credits in for-
eign exchange into Rupiah credits at the end
of 1978/79, which amounted to Rp 1,527 bil-
lion.
Credits in Rupiah outstanding comprise
working capital credits of Rp 2,990 billion or
57% and investment credits of Rp 2,263 bil-
lion or 43%. Working capital credits were pri-
marily extended to trade and manufacturing
sectors, which rose by Rp 182 billion or 20%
and Rp 280 billion or 41 respectively, during
1978/79. Investment credits increased by Rp
1,669 billion or 281%, which was mainly uti-
lized by mining, manufacturing and service
industries.
Out of total investment credits, 15% was
accounted for by Bank Indonesia’s investment
credit scheme10) , 3% by KI K and the rest by
10) As governed by Bank Indonesia’s AnnouncementNo. Peng. 1/DIR/1969, March 7, 1969, and Bank In-donesia Circular Letter, SE No.l/170/UPK/ KPR,March 8, 1969, including supplements andammendment. Includes Rupiah credits foraidfinanced projects.

15
other investment credits. The outstanding
amounts under each category in the last three
years are presented in Table 5.
As shown in Table 8, investment credits
under Bank Indonesia scheme increased dur-
ing 1978/79, both in the amount utilized and
approved. The outstanding amount was Rp
337 billion at the end of March 1979, an in-
crease of Rp 50 billion over the preceding year.
The increase primarily represented expansion
of credits to service industry (Rp 29 billion),
manufacturing (Rp 11 billion) and agriculture
(Rp 6 billion). The amount approved was Rp
441 billion at the end of March 1979, or 22%
over preceding year figures.
As in the case of working capital credits,
Bank Indonesia provides refinancing facilities
to banks for investment credits extended un-
der Bank Indonesia scheme. At the end of
March 1979, total refinancing credit approved
for this purpose amounted to Rp 300 billion,
accounting for approximately 68% of the loans
approved by banks. Nevertheless, due to the
existence of excess reserves at major state
banks, the refinancing facility utilized was only
53% of the amount approved.
The credit scheme intended to assist the
economically-weak small businessmen has
shown remarkable performance, as reflected
by the steady growth in KIK, KMKP, Min. e.i.
credit and INPRES Pasar credit.
Up to the end of 1978/79, the number of KI K
applications approved reached 57,378, with a value
of Rp 113 billion, representing an increase of 15,215
in the number of customers and Rp 34 billion in-
crease in value. The amount used reached Rp 68
billion at the end of March 1979, an increase of
28% over the preceding year figure.
Up to the end of March 1979, KMKP ap-
provals amounted to Rp 188 billion for 438,027
customers reflecting increases of Rp 63 bil-
lion in amount and of 102,661 in number of
customers during the year under report. The
amount used was Rp 93 billion at the end of
March 1979, which was 43% higher than that
a year before.
In implementing the cooperation agreement
between Bank Indonesia and the World Bank
to promote the economically weak small busi-
nessmen, the World Bank has apportioned $
40 million aid funds. Of that amount, $ 2.3 mil-
lion was designated as additional funds for KIK
lendings in West Sumatra, $ 11.1 million in
Central Java, $ 15.5 million in East Java, and
the rest will be used to finance training and
consulting services needed to improve the
administration of that credit program. The ad-
ditional funds will constitute 48% of each KI K
loan and will be channeled through Bank In-
donesia refinancing credit.
A remarkable progress was also recorded
by the Mini credit program, showing an in-
crease of 45% to reach Rp 16 billion at the
end of 1978/79. The funds for Mini credits were
provided through the Government Budget,
which reached a total of Rp 18.2 billion at the
end of 1978/79, including Rp 4 billion provided
in 1978/79.
Since 1976/77, the Government has
launched a credit program to finance the con-
struction and renovation of market places,
called INPRES Pasar. The credit is extended
to local governments, while the interest is paid
by the Government. In 1978/79' the funds pro-
vided amounted to Rp30 billion, making the
total funds available for this program at Rp 75

16
billion at the end of 1978/79. Of this amount,
only Rp 27 billion was utilized. The credits given
to low and medium-level employees under the
KPR scheme reached Rp 6 billion on March
31, 1979. In 1978/79 the Government funded
Rp 20 billion to finance further extensions of
KPR credits.
In addition to the above-mentioned cred-
its schemes, the Government has been
channel l ing f inancial aid for
economically-weak group through KUD (vil-
lage cooperative units) under KCK (Kredit
Candak Kulak) program. During 1978/79,
loans extended under this program
amounted to Rp 11 billion, making the total
disbursements Rp 17 billion at the end of
March 1979. Out of this total, Rp 15 billion
had been repaid. This rapid expansion re-
sulted from the increase in the number of
KUDs participating in the scheme and from
the increased amounts available to success-
ful KUDs. During 1978/79 the number of KUDs
participating in this program rose from 1,500
to 2,196. The amount of funds made available
for the program in 1978/79 was raised from
Rp 3,250 million to Rp 4,250 million.
17

18

19

20

21
III. MOBILIZATION OF FUNDS
Efforts to encourage private savings for fi-
nancing economic development were contin-
ued in 1978/79. These efforts were initiated in
1968 with the introduction of the INPRES time
deposit scheme, followed by a national sav-
ings deposit program, the program for devel-
opment of money and capital markets and the
introduction of other deposit schemes such as
haj-pilgrimage savings and certificates of de-
posit. These efforts have also supported other
monetary measures, which have been continu-
ally adjusted to current economic and mon-
etary developments.
In 1978/79, further steps were taken to
encourage the development of a capital mar-
ket, and to improve the savings deposit
schemes for youths, students and scouts and
participants in the haj-pilgrimage. To encour-
age the development of a capital market the
Government offered additional fiscal incentives
to companies selling their shares to the public
and issuing additional shares for undistributed
profits. In addition, the Government revised and
improved the organization and the procedures
of the Indonesian Stock Market by enlarging
the membership of Capital Policy Council, de-
termining procedures for security trading and
delineating the responsibility of brokers. To
encourage saving habits in the society, the pro-
cedures for withdrawing youths, students and
scouts savings accounts (TAPPELPRAM)
were revised. Meanwhile, a reduction in the
cost of pilgrimage by air and the abolishment
of sea pilgrimage were effected in 1978/79.
A. Time deposit
Despite the downward adjustment of de-
posit rates in January 1978, total time depos-
its outstanding continued to increase moder-
ately by 3% to Rp708 billion in 1978/79. From
April through November 1978 time deposits
increased by 5%, although during the rest of
the fiscal year declined by 2%. The increase
through November 1978 was attributable to the
reduced rate of inflation which raised the real
rate of interest on time deposits, while the de-
crease during the remainder of the fiscal year
mainly reflected cash shortages as a result of
price increases following the devaluation.
The interest rates on INPRES time depos-
its have remained unchanged since January
1, 1978, as shown in Table 10.
In 1978/79, 6-months time deposits grew
at a higher rate than that of either 24-months
or 12-months maturities, so that their share in
total time deposits increased from 5% at the
end of March 1978 to 8% a year thereafter.
The faster growth was associated with the im-
position, from January 1, 1978, of a high inter-
est penalty on premature withdrawal of
24-months and 12-months deposits.1)
Since the rates on time deposits re-
1) As reflected by the very low rates of interest paid ondeposits subject to premature withdrawals, i.e. 3%p.a. on deposits drawn after a period of 6 monthsbut less than 12 months and 6% p.a. for depositsdrawn after a period of 12 months but less than 24months. (Decision of Bank Indonesia Board of Di-rectors No. 10/104/Kep/Dir/UPUM, December 30,1978).

22
mained unchanged, the Government con-
tinued to pay an interest subsidy2) to de-
pository banks at 4.5% for deposits bear-
ing 15% interest and 1.5% for those bear-
ing 12% interest, effective from January
1, 1978. During 1978/79 the Government
paid Rp 33 billion to banks in interest
subsidied compared with Rp 46 billion in
the preceding year. The smaller payment
of subsidy during 1978/79 reflected the
reductions in interest rates on time depos-
its on January 1, 1978.
B. TABANAS and TASKA
The TABANAS and TASKA savings pro-
grams, which were introduced in 1971, were
continued and expanded. Efforts were contin-
ued to encourage savings habit in the society
in order to reach all layers of the community,
mainly the low income groups, youths, stu-
dents and scouts. For youths, students and
scouts a special savings program called
“PERATA P3” was launched in 1973/74, while
for civil servants and military personnel an
Employee Savings scheme was introduced in
1976.
In 1978/79, withdrawal procedures of
youths, students and scouts savings (The
TAPPELPRAM System) adopted in 1974 un-
der the PERATA P3 program, were revised.
Under the new procedures, deposits have to
2) Interest subsidy has been paid by the Governmentto depository banks in compensation for depositrates fixed by the Government at levels above thosethat would be set by the banks themselves in viewof the level of lending rates. The subsidy was there-fore indirectly enjoyed by the depositors.

23
be made collectively by the teacher, while with-
drawals can be made individually by the re-
spective deposit holder.3) Under the previous
procedures, both deposits into and withdraw-
als from savings accounts had to be made
collectively.
Total TABANAS deposits reached Rp 200
billion at the end of 1978/79, showing an
increase of 18% compared with 37% in the
preceding year. The decline in the growth
rate of these savings deposits was notable
between November 15,1978 and March
1979. During this period, the average
monthly increase was only 0.5% against 2%
during April to November 15,1978. As in the
case of time deposits, this development re-
flected the cash shortages brought about by
price increases following the November 15,
1978 measures. This development, not with-
standing the number of depositors, grew at
a rate of 9% to 7.6 millions, compared with
6% during the preceding year.
TABANAS deposits under the PERATA P3
program rose significantly, by 50% compared
with 21% in 1977/78, partly as a result of re-
vised withdrawal procedures of the
TAPPELPRAM system. The number of deposi-
tors under this program rose by 2% to reach
833 thousands, after a decline of 6% in 1977/
78.
Employee savings continued to register a
significant increase; 32% in total deposits and
6% in the number of depositors, compared with
78% and 13%, respectively, in the previous
year.
The TASKA deposits (an installment sav-
ings scheme) continued to decline, however,
despite more options made available since
1977 in terms of amounts and installment ar-
rangements. The number of account holders
declined by 20% to 6,296 and total deposits
fell by 5% to Rp 117 million at the end of March
1979. This declining trend was attributable
mainly to the increased competition from life
insurance companies offering more attractive
terms.
C. Certificates of deposits (CDs)
The introduction of CDs by commer-
cial banks in 1971 has not only provided
a means to raise funds, but also encour-
aged the activities in the money market.
In 1978/79, the value of CDs outstanding
declined by 48% to Rp30 billion. A sub-
stantial decrease was recorded for foreign
banks, whose outstanding CDs declined
from Rp 44 billion to Rp 14 billion, and
this was only marginally offset by an in-
crease in state banks’ CDs. Again, this de-
velopment was attr ibuted to the cash
shortages experienced following the No-
vember 15, 1978 measures. Conse-
quently, the share of state banks in the
total amount of outstanding CDs in-
creased from 24% at the end of March
1978 to 53% a year later.
Maturities on the CDs ranged from two
weeks to twelve months, carrying inter-
est ranging from 3% to 12%. The average
interest rates, weighted by maturities and
the amounts issued during the last three
years, are given below.3) Bank Indonesia Circular Letter, SE No. 11/5/ UPUM,
September 11, 1978.

24
D. ONH (Haj-Pilgrimage) saving
ONH savings are deposits for
haj-pilgrimage expenses by the prospective
pilgrims. As in the previous year, three state
banks were designated to receive these de-
posits, i.e. Bank Negara Indonesia 1946, Bank
Rakyat Indonesia and exclusively for the Irian
Jaya province, Bank Ekspor Impor Indonesia.
ONH savings, which provide a significant
source of funds for banks, increased remark-
ably in 1978/79 to reach Rp 55 billion, up by
104% from the previous year’s level. This sub-
stantial increase resulted from a 122% rise in
the number of pilgrims, who reached a record
of 72,213 persons in 1978/79. These increases
far exceeded those of the previous year, when
total deposits rose by 17% - and the number
of pilgrims by 18%. It should be noted that in
1978/79, only pilgrimage by air was made avail-
able by the Government and the cost of pil-
grimage by air was reduced from Rp 816,000.-
to Rp 766,000.-4) per person.
E. Money and capital markets
1. Money market
The interbank money market, which is in-
tended to provide banks with funds to meet
their clearing obligations, has recently come
to finance also other transactions. Activities in
this market were, however, still limited to trans-
action with funds of 7-days or shorter maturi-
ties.
In 1978/79, the average monthly volume of
transactions in the money market showed a
substantial increase of 55% to reach Rp 144
billion. There was also a significant rise in the
weighted average rate of interest following the
devaluation. The rise in the value of transac-
tions and interest rates reflected the increased
activities of banks to meet the increased de-
mand for liquidity.
The volume of transactions and the
weighted average interest rates in the inter-
bank money market in the last three years are
shown below.
4) Presidential Decision No. 10/1978, May 1, 1978.
In addition to lending in the interbank money
market, there are also direct transactions be-
tween banks and non-bank financial institu-
tions.

25
2. Capital market
In a continued effort -to stimulate the growth
of the stock market, additional incentives were
provided by the Government to the companies
selling their shares in the stock market. In ad-
dition, procedures for offering shares in the
stock market were revised and the operations
of security brokers, organized under the Money
and Stock Brokers Association (PPUE), were
regulated.5)
Fiscal incentives, given to companies for
selling their shares in the stock market, were
reinforced by relaxing the conditions required
for corporate tax deductions, i.e. by lowering
the minimum amount of shares required to be
sold in the stock exchange and by raising the
level of profits subject to the lowest tax rate
(20%). The minimum proportion of shares re-
quired to be sold in the stock market as a con-
dition for tax deduction was reduced from 30%
to 20% and the level of profits subject to the
lowest corporate tax was raised from Rp 10
million to Rp 200 million.6)
It should be noted that in 1977/78, the Gov-
ernment granted tax relief for increases in com-
pany equity resulting from revaluation of the
company’s fixed assets. Such an increase was
exempted from corporate tax, income tax and
tax on interest, dividends and royalties (PBDR
Tax )7). In addition, corporate, income and
PBDR tax exemptions were also applied to divi-
dends paid to shareholders within two years
after the respective company sold its shares
in the stock market. Furthermore, the Govern-
ment fixed the security underwriter’s fee8) and
specified securities allowed to be traded out-
side the stock market. 9)
In 1978/79, the Government also expanded
the membership of the Capital Market Council
(Badan Pembina Pasar Modal) by adding the
Minister of Industry and the State Secretary
to the 6 existing members, who are the Minis-
ter of Finance, the Minister of State Appara-
tus/Deputy Chief of BAPPENAS, Minister of
Trade, Cabinet Secretary, Governor of Bank
Indonesia and Chief of the Capital Investment
Coordinating Board.
Until the end of March 1979, the only com-
pany trading its shares on the stock market
was PT Semen Cibinong. The first placement,
made in August 1977, amounted to 178,750
of new issued shares with a face value of $ 10
per share. In addition, 163,366 shares of the
company’s previous issues had been sold by
their holders in the stock market. Out of the
total of PT Cibinong’s shares sold in the stock
exchange, 251,000 shares were purchased by
PT Danareksa, most of which were converted
into certificates with a nominal value of Rp
10,000,-. Until the end of 1978/79, PT
Danareksa had issued 172,900 certificates.
During 1978/79 transactions in the stock ex-
change amounted to 91,461 certificates sold
and 28,113 certificates bought, while transac-
5) Decree of the Minister of Finance No. 430/KMK.01/1978, November 14, 1978.
6) Decree of the Minister of Finance No. 122/KMK. 04/1979, March 27, 1979.
7) Decree of the Minister of Finance No. 10/KMK. 36/1978, January 1, 1978.
8) Decree of the Minister of Finance No. 78/KMK. 01 /1978, February 17, 1978.
9) Decree of the Minister of Finance No. 122/KMK. 01/1978, March 20, 1978.78.

26
tions in shares amounted to 47,378 shares.
The highest price was quoted in March 1979,
at Rp 12,450,- per share against Rp 11,000.-
in the preceding year. The quoted price for
shares was also applicable to PT Danareksa’s
certificates.
In 1978/79, three companies applied for list-
ing on the stock exchange. The trading of the
shares of these companies was expected to
take place in 1979/80.
Apart from the above shares, government
bonds of old issues were also traded in the
stock market, Le: 3% RI Bonds of 1950, 31/
2% Consolidation Bonds of 1959, 6% Lottery
Bonds of 1959 and 6% Development Bonds
of 1964. The Government has decided to re-
deem all of these bonds effective March 15,
1979 at the face value, except for the 6% De-
velopment Bonds 1964, which are redeemed
at 816 times face value. Redemption is to be
made at Treasury offices within a five-year
period from March 16, 1979.
Following the above decision, government
bonds were no longer listed at the stock ex-
change. To that date, the highest price ever
quoted at the stock market for the 3% RI Bonds
1959, 31/2% Consolidation Bonds 1959, 6%
Lottery Bonds 1959 and 6% Development
Bonds 1964 were 100.0%, 61.5%, 94.0% and
38,000.0% respectively.

27

28

29

30

31
IV. BANKING AND OTHER FINANCIALINSTITUTIONS
A. Banking
1. Policy on banking supervision
In the year under report, further revisions
on banking supervision measures were taken
with respect to the disclosure of bank’s bal-
ance sheet and profit and loss accounts, the
guaranties issued by banks and financial in-
stitutions, the efforts to improve the efficiency
of state banks and the lengthening of the pe-
riod for obtaining tax relief for banks partici-
pating in mergers.
The disclosure of balance sheet and profit
and loss accounts in the improved form, which
was previously required of commercial banks,
was also made obligatory in the year under
report for development and savings banks1)
These measures are intended to encourage a
better and more open management of bank
activities and financial matters Unlike other
banks, savings banks were temporarily ex-
empted from the obligation to disclose their
balance sheet and profit and loss accounts in
newspapers, but they are required to place
them in their offices so as to be disclosed ac-
cessible to their customers. The balance sheet
to be disclosed is the consolidated one and
corresponds to the format specified by Bank
Indonesia and the disclosure is required to be
made at least four times a year.
A new measure on guaranty, issued by
banks and financial institutions of was made
effective as of March 28, 1979, which regu-
lates all types of guaranties comprising bank
guaranty, endorsement of commercial papers
and other contractual guaranties2) , which rise
to contingent liabilities. The previous measures
regulated only the first two of the above types
of guaranty.
The new measure stipulates the maximum
amount of the total and of each guaranty, a
ban on issuance of guaranty for loans ex-
tended or for funds received by other banks
and a prohibition on non-bank financial insti-
tutions to issue their own guaranty and to ask
guaranty from a bank for their loan extended.
It was also provided that endorsement by
banks can be made only on readily market-
able papers and bank guaranty in foreign ex-
change and Rupiah can be issued only to resi-
dents for purposes specified by Bank Indone-
sia. At present the issuance of bank guaranty
in foreign exchange is permitted, inter alia, to
domestic and foreign participants in foreign
tenders for foreign aid financed projects, and
to Indonesian contractors and exporters for
participating in tenders of or for exporting
goods to Middle East projects.3) The policy to
encourage merger among national private
banks, aimed at reducing their number and
improving their soundness was continued in
the year under report. Pursuant to this policy,
the Government extended the time limit for
1) Bank Indonesia Circular Letter, SE No. 11/4 UPPB,October 18, 1978.
2) Bank Indonesia Circular Letter, SE No. 11/11/UPPB,March 28, 1979.
3) Bank Indonesia Circular Letter, SE No. 11/17/ULNand No. SE 11/18/ULN both, June 9, 1978.

32
merging banks to take the advantage of the
tax benefit offered up to March 31, 1980. This
extension was primarily for banks which were
already in the process of merging.
Efforts to improve the efficiency of the state
banks were furthered by implementing the
guidelines on reporting, account and report-
ing procedures. In addition, guidelines on for-
eign exchange transactions, internal audit and
personnel were under preparation, which have
been partly adopted by some state banks.
As mentioned earlier, the November 15, 1978
devaluation caused a sudden and large withdrawal
by some bank customers and created liquidity
shortages for some national private banks. To as-
sist them in overcoming their liquidity problems,
Bank Indonesia extended emergency credits (regu-
lar credits and special emergency credits for im-
ports) to 21 banks. The amount provided was Rp
24 billion, of which Rp 15 billion was utilized. How-
ever, at the end of March 1979 the number of banks
receiving this emergency credit facility decreased
to 13 with total credit of Rp 11 billion.
2. Banking development
In 1978/79 the number of commercial
banks decreased from 99 to 94, comprising 5
state banks, 78 private national banks, 10 for-
eign owned banks and one joint venture bank.
The decrease was the result of mergers
among five private national banks and the re-
vocation of the operating licence of one bank.
The number of bank offices increased from
975 to 9824), which was accounted for by the
opening of 17 new branch offices and the re-
vocation of operating permit for 10 branches
of state banks and private national banks.
The number of development banks re-
mained 28, consisting of one state develop-
ment bank (BAPINDO), 26 local development
banks and 1 private development bank. Not-
withstanding, the number of their offices went
up by 4 to 156 in 1978/79.
Meanwhile, in 1978/79 two private savings
banks were merged into a commercial bank,
so that the number of savings banks de-
creased to five, of which one was state-owned.
Accordingly, the number of savings banks of-
fices were reduced from 14 to 12, including 8
offices of the state savings bank, Bank
Tabungan Negara.
Rural banks, comprising village banks,
paddy banks and petty traders banks, also
decreased in number by 58 to 5,870, owing
to the revocation of operating licences for
114 banks and the issuance of new licences
for 56 banks operating. The revocations of
operating licences were made in regard to
inactive banks and to those that do not fulfill
the requirement for running of such banks
on sound line.
Besides, there are 48 representative offices
of foreign banks, 117 cash offices and 3,308
village units.
In addition to the above-mentioned banks,
there were representative offices of foreign
banks, operating since 1972 as an intermedi-
ary between their head offices and their cli-
ents in Indonesia. With the opening of a new
bank representative office in 1978/79, the num-
ber of foreign banks representative offices rose
to 48, all located in Jakarta.4) Consist of head, branch and sub-branch offices.

33
The banking activities showed a significant
increase in 1978/79 as reflected by banks’ to-
tal assets, deposits and loans, which grew by
40%, 27% and 36% to reach Rp 5,322 billion,
Rp 3,337 billion and Rp 3,673 billion, respec-
tively, as at March 31, 1979.
As indicated by Table 15 the role of national
private commercial banks, private national banks,
local development banks and foreign banks mea-
sured by total assets, deposits acquired and credit
outstanding, generally increased in 1978/79.
The Government’s effort to promote sound
development of national private commercial
banks and local development banks has re-
sulted in increased activities of these banks.
This is reflected by the increases in total as-
sets, deposits acquired and credit extended
of 38%, 39% and 34%, respectively, in 1978/
79.
As mentioned in the 1977/78 report, the
downward revision of bank minimum reserve
requirement, effective as of January 1, 1978,
gave rise to a large excess reserves at com-
mercial banks. Although during January -
March 1978, these banks were able to make
the adjustment and reduced their holding of
liquid assets from 35% to 25% of their current
liabilities, there was almost no change in this
percentage until the end of 1978/79. The con-
tinued existence of large excess reserves was
due to the imposition of credit ceilings and the
payment of interest on excess reserves de-
posited at Bank Indonesia up to 15% of their
current liabilities. In the case of the local devel-
opment banks, their excess reserves were also
associated with the nature of their deposits,
which were mostly owned by local governments.
As for national private commercial banks, the
large excess reserves were related, among oth-
ers, to the need and characteristic of their ac-
tivities. A more detailed account of banking ac-
tivities is presented in Table 18 through 20.

34
B. Other financial institutions
1. Non-bank financial institutions
Non-bank financial institutions, inaugurated
in 1972, serve as an important instrument for
the development of money and capital market
in Indonesia. These institutions were expected
to promote the market in short-term and
long-term papers, so that a more efficient al-
location of financial resources can be affected.
The number of nonbank financial institutions
remained at 12, while the composition changed
from 10 investment finance companies and 2
development finance companies in the previ-
ous year into 9 and 3, respectively, at the end
of 1978/79. This is because one investment
finance company, PT BANANA, changed its
status into a development finance company.
To encourage the transactions in commer-
cial paper, a new rediscount facility has been
made available since April 1978 by Bank In-
donesia to nonbank financial institutions. Un-
der this facility each non-bank financial insti-
tution is eligible for rediscounting commercial
drafts, acceptances and promissory notes is-
sued to the bearer, amounting up to Rp500
million a year. 5) The maximum cash value of
such a paper was 100% of its nominal value
for those issued by an indigenous company,
70% for those issued by a national
non-indigenous company and 20% for those
issued by a foreign-owned company, and with
a discount period of 30 days, 20 days and 10
days respectively. The papers presented for
rediscounting have to be in a package con-
sisting of no less than 10% of papers issued
by indigenous companies, not more than 60%
of papers issued by national non-indigenous
companies and the rest of papers issued by
national non-indigenous companies. Each pa-
per should have three endorsements, of which
at least one is from a company other than
non-bank financial institutions.
The terms for the use of rediscount facil-
ity were, relaxed in Desember 1978. The
above requirement that the papers have to
be in a package was abolished and the maxi-
mum amount available to each non-bank fi-
nancial institution was changed to 20% of
its total current liabilities at October 31,
1978. In addition, the number of endorse-
ments required was reduced to one and the
discount period was shortened to 14 days
for any issue. At the end of 1978/79 the
amount of rediscounting facility utilized
reached Rp 32,962 million.
The activities of finance companies
showed a significant increase in 1978/79.
The total funds acquired and invested in-
creased by 42% to reach Rp 193 billion
and Rp 187 billion respectively.
Borrowings and securities issued con-
stituted the main sources of funds for in-
vestment finance companies, which in-
creased by 17% and 89% respectively
during 1978/79. Almost all of these invest-
ments were made in shor t-term papers
(99%), which rose by 45% during 1978/
79.
Development finance companies ac-
quired most of their funds through borrow-
ings and invested mainly in loans ex-5) Bank Indonesia Circular Letter, SE No. 11/1/ UPUM
April 3, 1978.

35
tended. In 1978/79 their borrowings in-
creased by 52% and their loans extended
rose by 50%.
2. Pawnshops
Pawnshops still play an important role in
meeting cash shortages of the low-income
group, especially because their lending pro-
cedure is simple.
During 1978 the number of pawnshop
offices increased by 5 to reach 446. At the
end of 1978 total loans outstanding
amounted to Rp 16 billion, up by 21 %
from the amount outstanding at the end
of 1977. The increase was due to the rise
in the number of offices and in the value
of goods pawned especially after the No-
vember 15, 1978 measures. Total loans
extended and pawn-redeemed increased
by 28% and 27% in 1978/79 to reach Rp
59 billion and Rp 56 billion respectively.
Amore detailed development of govern-
ment pawnshops activity is shown in Table
16.
3. Credit insurance
Credit insurance, which at present is handled
by PT ASKRINDO, plays an important part in ex-
panding loans to business enterprises especially
to small businesses with relatively high risk of de-
fault. Up to the end of 1978/79, loans covered by
PT ASKRINDO’s credit insurance were mainly KIK
and KMKP which were extended at concession-
ary terms to small businessmen belonging to
economically-weak groups. The insurance pre-
mium for such credits is 3% of the value of credit
insured which is paid by Bank Indonesia and lend-
ing banks.
With the increase in KIK and KMKP, the total
amount of loans insured by PT ASKRINDO also
expanded. During 1978, total value of KIK and
KMKP insured reached Rp 87 billion, involving 109
thousand debtors, which respectively were 45%
and 34% higher than in the previous year.
Other types of credits insured amounted to Rp
61 billion and received by 128 thousand debtors,
registering a 79% and 64% increase over the total
amount insured and the number of debtors in the
previous year.

36

37

38

39

40

41

42
43
V. GOVERNMENT FINANCE
A. General
The objectives of Government budgetary
policy in fiscal year 1978/79, the last year of
PELITA II, correspond closely to the policy
goals of PELITA II, which was to maintain and
accelerate the progress achieved during
PELITA I. Aside from the attainment of steady
economic growth and the maintenance of
monetary stability, measures were directed
towards creating employment opportunities,
strengthening the position of the economically
weak group and expanding opportunities for
education and health services, essential to the
well-being of people.
To achieve the above objectives, the Gov-
ernment has maintained a balanced budget
policy. Efforts to increase Government rev-
enues have continued, inter alia by creating a
tax climate conducive to private business ac-
tivities and by improving tax administration. On
the expenditure side, the Government has
sought to economize on routine spending and
to direct the allocation of development expen-
ditures to activities contributing to the growth
of national production.
The fiscal year 1978/79 budget was bal-
anced at Rp 4,826 billion, or 12% higher than
during the previous year. Actual Government
revenues as well as expenditures were 10%
higher than the budget or 23% over the actual
outcome of the previous year. With the infla-
tion rate of 11.8% in 1978/79, the real increase
in both revenues and expenditures was ap-
proximately 11 %. On the revenue side, this
remarkable increase was primarily due to a
surge in the Rupiah value of oil revenues after
November 15, 1978, while on the expenditure
side it was attributable mainly to greater pay-
ments for debt service denominated in foreign
currencies.
In 1978/79, total Government revenues
reached Rp 5,301 billion and total expenditures
Rp 5,299 billion, the breakdown of which are
shown in Table 24.
Public savings, which is the difference be-
tween domestic revenues and routine expen-
ditures, amounted to Rp 1,522 in 1978/79,
showing an increase of 10% over the previ-
ous year. This increase reflected the
Government’s efforts to finance an increasing
proportion of development expenditures from
domestic sources. During the year under re-
port, 60% of total development expenditures
were financed by public savings, compared to
56% in the last year of PELITA I.
Government budgetary policy for fis-
ca l year 1979/80 , the f i rs t year o f
REPELITA III, will continue to maintain a
balanced budget and aim at achieving the
triple objectives of development, i.e. eq-
uitable development and equal distribution
of the benefits of development, a strong
economic growth and national stability.
The 1979/80 Budget was set at Rp 6,934
billion, an increase of 31 % over 1978/79.
The main reason for this increase is the
rise in oil corporation tax, although sev-
eral other revenue items such as corpo-
ration tax, export tax and excises are also
expected to increase significantly. Public
savings are expected to reach Rp 1,995
billion or 31% over the level realized in
fiscal year 1978/79.

44

45
B. Government revenues
In 1978/79, several adjustments were made
in the tax system as well as in tax rates and
new facilities were introduced for direct as well
as indirect taxes. These facilities, which were
designed to stimulate business activities, in-
cluded a further cut in corporation tax, excises,
capital stamp duties and tax on interest, divi-
dend and royalties. In the context of the No-
vember 15, 1978 devaluation, the Government
granted total and partial exemptions from im-
port duties, import sales tax and import with-
holding tax (WAPU) on certain import goods
needed by domestic industries.
Total Government revenues amounted to
Rp 5,301 billion in 1978/79, an increase of 23%
from the previous year’s level. Domestic rev-
enues rose 21 % to Rp 4,266 billion and de-
velopment (foreign aid) receipts 34% to Rp
1,035 billion. It should be noted that the in-
crease in development receipts was mostly
due to the exchange rate adjustment, Novem-
ber 15, 1978.
All items of domestic revenues, consisting
of direct taxes, indirect taxes and non-tax re-
ceipts, experienced a significant increase. Di-
rect tax increased by 19% to Rp 2,996 billion,
indirect tax by 22% to Rp 1,078 billion and
non-tax receipt by 33% to Rp 191 billion.
Oil corporation tax continued to represent
the largest among direct tax revenues. How-
ever, as in the previous year, non-oil direct
taxes, consisting of corporation tax, income
tax, withholding tax and land tax (IPEDA), re-
corded a higher rate of growth. These non-oil
direct taxes rose by 22% while oil corporation
tax increased by 18%.
Further reduction in the income tax burden
was granted in 1978/79 by raising the level of
non-taxable income and a corresponding up-
ward adjustment in the levels of taxable in-
come. The annual non-taxable income for a
tax payer with a spouse and 3 children was
increased from Rp 450,000.- in 1977 to Rp
528,000.- in 1978. The amount of taxable in-
come subject to the lowest income tax rate
(10%) was also increased from Rp 150,000.-
to Rp200,000.-, while taxable income subject
to the highest rate (50%) was raised from Rp
8.4 million to Rp9.6 million. Although the in-
come tax burden had been reduced from year
to year, income tax revenues rose to Rp 122
billion in 1978/79, or 17% above the amount
collected in 1977/78. This was attributed to the
expansion in business activity as well as to
the increase in the number of tax payers.
Corporation tax amounted to Rp 226 bil-
lion, an increase of 34% over the previous year.
Apart from the expansion of business activity,
the increase was due to intensified tax collec-
tion.
As mentioned earlier, late in fiscal year
1978/79, the Government adopted a set of
measures to lower the corporation tax burden
for business enterprises, especially companies
obtaining an unqualified opinion from a public
accountant, cooperatives, companies going
public and companies investing retained earn-
ings. In addition, the Government allowed com-
panies to use the last-in-first-out (LIFO) sys-
tem of stock valuation and granted an exemp-
tion of corporation tax on profits arising from
the revaluation of fixed assets. These facilities
were intended to promote production activi-
ties, which in turn, were expected to lead to
46
an increase in corporation tax revenues in the
future.
Meanwhile, revenue from the withholding
tax, of which the major part represented pre-
payment of corporation tax, amounted to Rp
232 billion or 15% higher than during the pre-
vious year. However, this increase was much
lower than that recorded in 1977/78 (36%),
partly due to withholding tax exemptions in-
troduced in November 1978 on raw materials,
subsidiary inputs and spare-parts used in the
production of goods for export.
In 1978/79, oil corporation tax receipts, still
the main source of domestic revenues,
amounted to Rp 2,309 billion, or 18% above
the previous year. This increase was primarily
due to the exchange rate adjustment on No-
vember 15, 1978. It should be noted that the
increase in oil export prices coming into effect
as of January 1, 1978, did not have any im-
pact on oil tax revenues in 1978/79, because
oil taxes were paid to the Government in ar-
rears on a quarterly basis.
Revenue from IPEDA rose by 20% to reach
Rp 63 billion in 1978/79. This was made pos-
sible mainly by more intensive collection ef-
forts, especially in urban areas. IPEDA is a tax
on land and its yield, collected by and allo-
cated to local governments for financing de-
velopment projects within their respective ju-
risdictions.
Revenue from tax on interest, dividend and
royalties, property tax and other direct taxes rose
by 26% over the previous year to reach Rp 43
billion. The major part was contributed by tax on
interest, dividend and royalties which rose from
Rp 28 billion to Rp 36 billion in 1978/79.
Indirect taxes which include sales tax, ex-
cises, impor t duties and expor t taxes
amounted to Rp 1,078 billion, showing an in-
crease of 23% as against 19% in the previous
year. Among the main items, export duties and
excises experienced substantial increases in
1978/79.
Sales tax revenue, which was the largest
indirect tax after import duties, registered a 9%
increase, considerably lower than in the previ-
ous year (25%). This was mainly due to the
downward adjustment of tax rates for certain
commodities, notably on logs in early 1978.
Import sales tax reached Rp 126 billion,
registering an increase of 10% over the pre-
ceding year. The increase was slightly lower
than that in the previous year, as a conse-
quence of the total and partial exemptions of
import sales tax on raw materials, subsidiary
inputs and spare parts, effective as of Novem-
ber 15, 1978, along with a decrease in imports.
The exemptions were 50% on imported inputs
used in the production of goods for domestic
consumption and 100% for the production of
goods for exports or for delivery to the Gov-
ernment under an international tender on
foreign-aid financed projects.
The foregoing exemption was also applicable
to import duties, which, as a result, registered
only a marginal increase of 3% to reach Rp 295
billion in 1978/79, compared to a 12% increase
in the previous year. Excises amounted to Rp
253 billion in 1978/79 or 39% over the previous
year. This substantial increase was due to the
intensified control against evasion of excises on
cigarettes and an upward adjustment of the base
prices of tobacco, beer, sugar and refined alco-
hol on which the excises rates were applied.
Export tax revenue recorded a substantial

47
increase of 105% to reach Rp 166 billion. This
is the highest increase in the PELITA II period,
attributable to the higher exchange rate since
November 15, 1978, as well as a rise in the
dollar value of exports.
Other indirect taxes, including stamp and
auction duties, amounted to Rp 17 billion, an
increase of 39% over the previous year. This
increase was mainly due to a marked increase
in stamp duty receipts reaching 37% over the
previous year’s level.
Non tax receipts rose to Rp 191 billion or
33% over the preceding year, partly owing to
the larger receipts from the profits of state
enterprises.
Development receipts, consisting of pro-
gram aid and project aid, rose by 34% to Rp
1,035 billion. This increase principally resulted
from the higher exchange rate following Ru-
piah devaluation on November 15, 1978. In
fact, if expressed in the previous exchange
rate, the increase of development receipts was
only 9%. Project aid receipts amounted to Rp
987 billion.
C. Government Expenditures
Government expenditure policy was aimed
at enlarging the share of development expen-
ditures in total Government spending while at
the same time expanding public services, im-
proving the well-being of civil servants and in-
creasing the efficiency of public administration.
Total Government expenditures rose by
23% to reach Rp 5,299 billion in 1978/79, of
which routine expenditures amounted to Rp
2,744 billion and development expenditures
Rp 2,555 billion. As a result of the Novem-
ber 15, 1978 measures, and the accounting
of certain foreign exchange related expen-
ditures, routine expenditures grew faster
than development expenditures, 28%
against 18%. In addition, actual routine ex-
penditures far exceeded the original budget
estimate, its share in total expenditures
reached 52%, as compared to only 49% in
the original budget.
The larger routine expenditure mainly re-
flected a rise in debt-service payments and
subsidy on domestic oil consumption. Debt
service payments registered a substantial in-
crease of 134% to reach Rp 534 billion, while
the subsidy on domestic oil consumption
reached Rp 197 billion or 203% higher than in
the preceding year.
Personnel expenditure rose to Rp 1,002
billion or 12% over the previous year. This in-
crease was mainly due to a 300% rise in pen-
sion allowance given to pensioners who re-
tired before January 1977, an upward adjust-
ment in the rice price in the calculation of the
rice allowance for civil servants and an in-
crease in personnel expenditure abroad after
the recent exchange - rate adjustment. In ad-
dition, the increase also resulted from the in-
clusion of the Educational Development Con-
tribution (SPP) from primary schools, high
schools and universities in personnel expen-
diture, previously not accounted for in the Bud-
get.
Material expenditure rose by 11 % to Rp
420 billion in the reporting year. The increase
reflected mainly larger material purchases for
security and defense.
Subsidies to autonomous regions reached
a total of fop 552 billion or 9% higher than in
48
the previous year. The increase partly reflected
the higher rice allowance for regional civil ser-
vants and additional compensation to local
governments for the abolishment of SPP in
primary schools. In addition, the increase was
also on account of the increased allowances
for accommodating new health officers, includ-
ing physicians in INPRES health clinics, and
for holding diagnostic test of primary schol-
ars.
Other routine expenditures, consisting
mainly of the subsidy for domestic fuel con-
sumption, reached a total of Rp 266 billion, an
increase of 54%, in line with the increasing
trend in fuel production cost and domestic con-
sumption.
Total development expenditures, broken
down into expenditures by departments and
government institutions, regional development,
project aid and other development expendi-
tures, amounted to Rp 2,555 billion in 1978/
79. Regional development, subsidies on fertil-
izer (included in other development expendi-
ture) and project aid contributed to most of the
increase. Expenditure on project aid was Rp
987 billion in 1978/79.
Development expenditure for departments
and institutions rose to Rp 851 billion in 1978/
79, an increase of 14% compared to an in-
crease of 26% in the previous year. The lower
increase was the result of, among other fac-
tors, the delays in the implementation of sev-
eral development projects following contract
renegotiation after the November 15, 1978
measures.
Regional development expenditures
reached Rp 431 billion, which was 18% higher
than in the previous year, reflecting mainly the
increased allocation of development funds to
provincial governments, larger IPEDA receipts
and higher allocation to regional governments
to finance primary school development and
INPRES regreening projects.
The amount of development subsidy given
to each village remained at Rp 350 thousand.
However, due to the increase in the number of
villages eligible to this subsidy, the total amount
spent rose to Rp 24 billion or an increase of
3%.
A similar moderate increase of 3% was also
recorded by development subsidy given to re-
gencies, or “kabupatens”, which totalled Rp 71
billion in 1978/79. This rise reflected increased
population in each kabupaten and a raise in
the minimum subsidy from Rp40 million in
1977/78 to Rp50 million in the fiscal year 1978/
79. It should be noted that for the calculation
of the amount of subsidy the per capita sub-
sidy remained at Rp 450.
Development subsidy for provinces
throughout Indonesia amounted to Rp 87 bil-
lion or 15% higher than in fiscal year 1977/78.
This reflected an increase in the amount allo-
cated to each province in 1978/79, ranging
from Rp200 million to Rp500 million. Besides,
minimum subsidy for each province was also
increased from Rp 1.5 billion to Rp 2 billion. In
addition to this development subsidy, the Gov-
ernment also provided a special development
subsidy for East Timor and IrianJaya amount-
ing to Rp 5 billion and Rp 6 billion respectively.
This expenditure was intended to speed up
economic development in these provinces
which had been falling behind the others.
Subsidy for the development of primary
schools, which commanded the largest share

49
in regional development expenditures, reached
Rp 112 billion or 32% over the previous year’s
level. This significant increase was, inter alia,
utilized for the construction and renovation of
school buildings, recruiting additional teach-
ers, and for the provision of school facilities.
Development subsidy for public health care
amounted to Rp 27 billion in 1978/79, which
was mainly used for building 300 public health
centers in transmigration and new resettlement
areas and housing facilities for physicians. In
addition, the Government also increased the
number of mobile clinics in order to spread
health care services to isolated areas.
In 1978/79, subsidies for reforestation and
regreening reached Rp 36 billion or increased
by 47%, which financed the restoration of 689
thousand hectares of critical areas and refor-
estation of 288 thousand hectares. The in-
crease in the subsidies was in line with the
expansion in area covered.
The subsidy extended for construction and
renovation of market places amounted to Rp
1 billion in 1978/79, which was the payment of
interest on loans granted by banks for that
purpose to local governments. These loans
have been granted since 1976/77 to support
small traders belonging to the
economically-weak group. The total amount of
subsidies paid up to the end of 1978/79
reached Rp 2.5 billion. Other development
expenditures, including fertilizer subsidy and
Government capital participation in business
enterprises, amounted to Rp 286 billion in
1978/79, declining by 7% compared to the pre-
vious year. The fertilizer subsidy recorded a
very substantial increase of 159% to reach Rp
83 billion, while Government capital participa-
tion and other expenditures declined by 26%.
The substantial increase in the fertilizer sub-
sidy reflected a sharp rise in fertilizer import
prices after November 15, 1978 exchange rate
adjustment and the higher domestic costs of
production and distribution.

50

51

52
VI. INTERNATIONAL ECONOMIC ANDMONETARY DEVELOPMENTS
A. World economic conditions
In 1978, economic growth in the industrial
OECD countries continued to be sluggish. Real
GNP in the OECD countries as a whole ex-
panded at a lower rate than in the preceding
year. Inflation remained a problem and the rate
of unemployment did not decline significantly.
Table 27 shows that real GNP in OECD
countries only increased by an average of
3.5% in 1978 compared with 3.7% in 1977.
Among the major industrial countries, only
Japan achieved a rate of growth above 5%
while Italy recorded the lowest rate of only 2%.
The average rate of inflation in OECD coun-
tries continued high, at 8.2% in 1978. Only
Japan succeeded in reducing the, rate signifi-
cantly from 8.1% in 1977 to 3.3% in 1978, while
the Federal Republic of Germany again re-
corded the lowest rate at 2.1 %. Despite a de-
cline from 17% to 12% in 1978, Italy contin-
ued to register the highest rate of inflation
among these countries.
Besides the sluggish economic growth and
high inflation rate, the unemployment rate in
OECD countries declined slightly from 5.4%
in 1977 to 5.3% in 1978. Among the countries
with a declining rate were the United States,
the United Kingdom and the Federal Republic
of Germany, whereas an increasing rate was
recorded in Japan and France.

53
The growth rate of the United States con-
tinued to decline in 1978. Real GNP increased
by only 3.8% compared with 4.9% in the pre-
ceding year. The slower growth was partly at-
tributable to a prolonged coal miners’ strike and
severe weather conditions during the period
of January-March 1978. The trade account of
the United States deteriorated further in 1978
and registered a deficit of $ 34.2 billion com-
pared with $ 31.1 billion in 1977. Although the
larger trade deficit was partly offset by higher
net receipts in the services account, the cur-
rent account nevertheless showed a deficit of
$ 16.3 billion in 1978. Inflation rose from 6.5%
in 1977 to 8.9% due partly to the increase in
the minimum wage rate and the depreciation
of the US dollar. Despite an increase in the
labor force and a sluggish growth in output,
the unemployment rate was reduced to 5.8%
at the end of 1978 from 6.6% at the end of
1977.
With a 5.8% real growth of GNP in 1978,
Japan continued to achieve the highest rate of
economic growth among the OECD countries.
This growth was mainly attributable to a higher
level of consumer spending and government
expenditures. Domestic consumption reduced
the importance of exports as the impetus to
growth in output. Nevertheless , Japan’s trade
surplus increased substantially from $ 17.3
billion in 1977 to $ 25.1 billion in 1978. Accord-
ingly, the current account surplus rose from $
10.7 billion in 1977 to $ 16.7 billion in 1978.
Japan was also successful in bringing down
its inflation rate from 8.1 % in 1977 to only 3.3%
in 1978. This decline was attributable to higher
productivity of labor and a decline in import
prices of industrial raw materials reflecting the
appreciation of the yen. The average rate of
unemployment, however, rose from 2% in 1977
to 2.3% in 1978, partly reflecting the cautious
attitude of businessmen who preferred to in-
crease overtime work rather than recruiting
labor.
In the Federal Republic of Germany, growth
of real GNP accelerated to 3.0% in 1978 com-
pared with 2.6% in the preceding year. In fact,
economic activity only picked up in the sec-
ond half of 1978, mainly on account of higher
consumption and domestic investment. The
trade surplus of the Federal Republic of Ger-
many also increased from $ 19.4 billion in 1977
to $ 24.4 billion in 1978. This surplus more than
offset the deficit on the services account, which
led to an increase in the current account sur-
plus from $ 3.7 billion in 1977 to $ 8.1 billion in
1978. The lower rate of inflation reflected the
decline in import prices resulting from the sub-
stantial appreciation of the Deutsche mark. The
inflation rate was 2.1% in 1978 compared with
3.9% in the preceding year, and the rate of
unemployment declined from 4.5% in 1977 to
4.3%, mainly because of higher economic
activity.
In the United Kingdom, real GNP increased
by only 3.0% in 1978, although this was a sub-
stantial improvement compared with 1.6% in
the preceding year. The stronger output growth
was caused by a higher level of domestic con-
sumption and investment and a larger output
of North Sea oil. Despite an acceleration of
import growth and a slowdown in export
growth, the trade deficit of the United King-
dom declined from $ 2.9 billion in 1977 to $
2.1 billion in 1978. The sizable surplus on the
services account resulted in a current account

54
surplus of $ 0.2 billion in 1978. Due to the
higher rate of economic growth, the rate of un-
employment declined from 6.1 % at the end of
1977 to 5.6% at the end of 1978. Moreover,
the United Kingdom succeeded in reducing the
rate of inflation significantly from 15.9% in 1977
to 7.8%, inter alia due to lower prices of im-
ports and selected foodstuffs and the imple-
mentation of an income policy by the Govern-
ment.
France maintained the same growth rate
of 3% as in the preceding year. Exports and
domestic consumption expanded, but the rate
of economic activity was restrained by the limi-
tation of government expenditures as part of
the stabilization program. The trade deficit of
$ 2.7 billion in 1977 reversed into a surplus of
$ 1.3 billion, while the services account also
improved, with the result that the current ac-
count deficit of $ 3.3 billion in the preceding
year also swung into a surplus of $ 2.2 billion
in 1978. The inflation rate, however, was re-
duced from 9.8% to 9.3% by restraining gov-
ernment expenditures; the resulting side ef-
fect was an increase in the unemployment rate
from 5.4% in 1977 to 5.8%.
B. International monetary developments
Different rates of economic growth and in-
flation in the industrial countries, in addition to
imbalances in world trade, continued to have
a severe impact on international monetary
developments during the year under report. As
reported earlier, a number of countries, nota-
bly Japan and the Federal Republic of Ger-
many, continued to have a sizable surplus on
current account, whereas the United States
recorded increasing deficits in the last two
years. This situation reduced the public’s con-
fidence in the US dollar which resulted in the
weakening of the currency. On the other hand,
the currencies of other major industrial coun-
tries with a strong balance of payments posi-
tion appreciated, par ticularly the yen,
Deutsche mark, and Swiss franc.
The international monetary developments
affected interest rates in a number of indus-
trial countries during 1978. In order to stabi-
lize domestic conditions and to encourage
capital inflows, the U.S. Federal Reserve Sys-
tem raised the discount rate. Consequently, the
interest rate in the short-term money market
in the United States soared to 11.9%, i.e. the
same height as achieved during the monetary
crisis in 1974. In contrast, short-term interest
rates in Japan and in Western Europe, except
in the United Kingdom, declined in 1978 fol-
lowing the implementation of monetary mea-
sures to discourage capital inflows.
Besides the aforementioned measures
taken by the respective countries, IMF in-
creased its efforts to raise multilateral funds
so as to be in a better position to provide bal-
ance of payments assistance to its members.
In this context the Supplementary Financing
Facility (SIFF) was created which officially
commenced operations in February 1979. At
the end of 1978 there were 13 donor coun-
tries, contributing a total of SDR 7,754 million
in various currencies. Moreover, the amount
of financial assistance available through other
IMF facilities was enhanced with the enlarge-
ment of quotas of member countries under the
Sixth Quota Increase.
In January 1979, IMF issued an allocation

55
of SDR 4 billion which was international liquid-
ity. This allocation was the first part of a total
allocation amounting to SDR 12 billion agreed
for issue in 1979-1981. It may further be men-
tioned that on December 28, 1978, it was
agreed that SDRs may be used in debt repay-
ments and extension of loans.
C. Economic and financial development
of ASEAN Countries
Regional cooperation among the member
countries of ASEAN made further progress
since the Heads of Governments of the
ASEAN countries held their Second Summit
Meeting in Kuala Lumpur in August 1977. As
a follow-up to this meeting, the possibility of
expansion of cooperation in various fields was
further explored. During the year under report,
cooperation materialized in the fields of trade,
finance and industry.
Under the Preferential Trading Arrange-
ments, which became effective on January 1,
1978, the number of items enjoying tariff con-
cessions among the ASEAN countries was
extended by 755 items to a total of 826 items
with effect from September 1, 1978. Further-
more, with effect from March 15, 1979, the list
was expanded by 500 items to comprise 1,326
items in total. The tariff concessions only ap-
plied to goods with an ASEAN content of not
less than 60%.
In the field of monetary cooperation, the
ASEAN Swap Arrangement was extended for
another year in August 1978. Under the ex-
tended Swap Arrangement, the total amount
available was doubled from $ 100 million to $
200 million, with each participant contributing
$ 40 million instead of $ 20 million previously.
Consequently, the amount that each partici-
pant in the event of a temporary liquidity short-
age could swap was also increased from $ 40
million to $ 80 million.
At their seventh meeting in December 1978,
the ASEAN Economic Ministers agreed to the
establishment of the ASEAN Food Security
Reserve comprising 50,000 tons of rice which
would at any time be available to cope with
food shortages in a member country. The
agreement committed each ASEAN member
country to contribute to the aforementioned
food reserve out of its national stock, i.e. Indo-
nesia 12,000 tons, Malaysia 6,000 tons, Phil-
ippines 12,000 tons, Singapore 5,000 tons and
Thailand 15,000 tons.
In 1978, economic activity accelerated in
all ASEAN countries, with Thailand achieving
the highest rate of growth.
Singapore recorded a 8.5% rate of growth
compared with 7.8% in 1977. The stronger
growth mainly originated in the manufacturing,
transportation and communication sectors. The
unemployment rate declined accordingly from
3.9% to 3,6%, in 1978. Imports and exports
increased by 16.7% and 14.0%, respectively,
compared with the preceding year, while con-
sumer prices rose by 4.8% in 1978, compared
with 3.2% in 1977.
Malaysia’s gross national product (GNP)
rose by 7.5% in 1978, compared with 7.2% in
the preceding year. The higher rate of growth
mainly occurred in manufacturing industry,
mining and trade. Agricultural output increased
by only 2%, which was the same rate as in the
preceding year. In 1978, exports also in-
creased at approximately the same rate, i.e.

56
11.4%, whereas imports rose by 24.4% in
1978 compared with 16.3% in the preceding
year. The unemployment rate only declined
slightly from 6.3% to 6.2% in 1978, while prices
rose by 4.9% compared with 4.7% in 1977.
In 1978, the Philippines, recorded a growth
rate of 5.8% compared with 6.3% in the pre-
ceding year. This decline was mainly attribut-
able to the production performance of agricul-
ture, mining and manufacturing. Exports in-
creased by only 2% in 1978 compared with
22% in 1977 while imports rose by 15.6% com-
pared with only 7.7% in the preceding year.
The inflation rate tapered off from 7.9% in 1977
to 7.7%.
Thailand achieved an economic growth rate
of 8.7% compared with 6.9% in 1977. This in-
crease mainly occurred in the agricultural ,
manufacturing, construction and mining sectors.
In 1978, exports and imports increased at the
same rate, i.e. 15.6%, compared with a 17.1 %
export increase and a 34% import increase in
the preceding year, while the inflation rate was
8.5% compared with 7.2% in 1977.
D. Relations between Indonesia and inter-
national financial institutions
a. International Monetary Fund (IMF)
During the year under report, transactions
with the Fund included the Fund’s use of Rupi-
ahs in transactions with other member coun-
tries in the context of the Fund’s operational
budget, receipt of an SDR allocation, receipt of
SDRs for US dollars, purchase of gold at the
official price and receipt of part of the profit from
the Fund’s gold auctions.
During the year under report, Indonesia
was included three times in the operational
budget (before May 1978 known as the cur-
rency budget) for a total amount of SDR 10
million. This meant that Indonesia must make
Rupiahs available for the Fund to an amount
equivalent to SDR 10 million which the Fund
could use in transactions with other countries.
In the context of this operational budget, in
1978/79 Rupiahs were used by Jamaica to an
amount equivalent to SDR 3 million. Till the
end of the year under report, Indonesia made
Rupiahs available ten times for a total cumu-
lative amount of SDR 90 million out of which
SDR 23 million was used by other countries.
In January 1979, the Fund issued an SDR
4 billion allocation to participants. Indonesia
received SDR 49.9 million out of this amount,
making its total cumulative allocation SDR
140.1 million.
In 1978/79, under the quarterly designa-
tion plans Indonesia was committed four times
to make US dollars available to a total amount
of SDR 63 million. In this context, US dollars
were exchanged for SDRs up to SDR 32.6
million. The receipt of the allocation, receipt of
SDRs for US dollars under designation plans
and other SDR transactions caused
Indonesia’s SDR holdings to increase to SDR
114.3 million from SDR 22.6 million at the end
of the preceding year.
In the year under report, the Fund imple-
mented the third stage of the gold restitution to
member countries which involved a quantity of
25 million troy ounces in total. In this context,
55,633 troy ounces of gold at the official value
of SDR 1.9 million was restituted to Indonesia,
adding up to a total of 166,892 troy ounces.

57
Besides restituting gold to its member
countries, the Fund sold 25 million, troy ounces
of gold on the open market. Part of the profit,
i.e. the difference between market prices and
the official price, would be distributed in stages
to developing member countries. Indonesia’s
share in the profit received during the year
under report amounted to $ 11.6 million.
As mentioned in the previous Annual Re-
port, under the Sixth Quota Review the Fund
increased the quotas of its member countries
from a total of SDR 29.2 billion to SDR 39.0
billion. In this context, with effect from May 31,
1978, Indonesia’s quota was increased from
SDR 260 million to SDR 480 million.
b. Bank Group
In the year under report, International De-
velopment Association (IDA) approved cred-
its for a rural and polytechnic project amount-
ing to $ 79.0 million. Thereby, until the end of
1978/79 total credits approved amounted to $
680.8 million for 40 projects. The I DA credits
were subject to a repayment period of 50 years
including 10 years grace and carried no inter-
est. A service charge of 0.75% per annum was
payable on the disbursed amount.
Under the $ 7.6 billion IDA Fifth Replenish-
ment, Indonesia should pay the Rupiah equiva-
lent of $ 168,400 in three equal annual install-
ments. The first and second installments were
made in December 1977 and November 1978,
respectively.
New loans approved by International Bank
for Reconstruction and Development (IBRD)
during 1978/79 amounted to $ 377 million for
projects in the fields of irrigation, agriculture,
mining, urban development and electricity. At
the end of the reporting year, total loans ap-
proved thereby came to $ 1.9 billion for 37
projects. The loans were subject to a repay-
ment period of 15 to 30 years including 3 to 6
years grace, and interest between 7% and
8.85% per annum. Moreover, a commitment
charge was payable amounting to 0.75% per
annum for the undisbursed portion of the loan.
Under IBRD’s capital increase from $ 27
billion to $ 34 billion, Indonesia’s subscription
was raised by $ 168.8 million and became $
388.8 million (in terms of 1944 US dollars) with
effect from May 5, 1978. The amount consisted
of 90% “callable subscription” and 10% “paid-in
subscription”. Pursuant to the effective provi-
sions, 10% of the paid-in subscription was paid
in convertible currency and 90% in Rupiahs.
Until the end of the reporting year, total in-
vestments of International Finance Corpora-
tion (IFC) in Indonesia amounted to $ 41.7
million. The investments were made in 9 pri-
vate companies, including companies in the
filed of textile, cement, tourism, electricity and
a non-bank financial institution. As usual, other
institutions joined IFC in financing the compa-
nies in which I FC made investments.
In order to expand its financing activities, I
FC increased its authorized capital by $ 540
million to $ 650 million. In this connection,
Indonesia’s subscription was increased by $
6.1 million, and became $ 7.4 million with ef-
fect from October 21, 1978.
c. Asian Development Bank (ADB)
During the reporting year, ADB approved
new loans to Indonesia amounting to $ 198.7

58
million for the financing of nine projects in the
fields of electricity, irrigation, manufacturing
industry, urban development and communica-
tion. The loans originated from Ordinary Re-
sources and Special Funds. Loans from Ordi-
nary Resources were subject to a repayment
period of 10 to 30 years including 2 to 8 years
grace and interest between 7.5% and 9.1 %
per annum. Loans from Special Funds were
subject to a repayment period of 40 years in-
cluding 10 years grace and a service charge
of 1% per annum. At the end of the reporting
year, total loan approvals amounted to $ 711.3
million compared with $ 512.5 million at the
end of 1977/78.
d. Islamic Development Bank (IDB)
In 1975 Indonesia became a member of
the Islamic Development Bank with a subscrip-
tion of ID (Islamic Dinar) 25 million (ID 1 = SDR
1) payable in US dollars in five equal annual
installments.
In 1978/79, IDB approved the first loan to
Indonesia amounting to $ 10 million for
co-financing the South-East Sulawesi
transmigration project. The loan had a repay-
ment period of 20 years, carried no interest
and was subject to a service fee of ID 2.55
million payable in semi-annual installments
during the repayment period of the loan. It
should be noted that being an Islamic finan-
cial institution, IDB did not charge interest, but
was not barred from receiving a reward in the
form of share in the profit of its undertakings.
Therefore, IDB continued its efforts to increase
its financial assistance to Indonesia by explor-
ing modes of financing other than lending, such
as equity participation, profit sharing and leas-
ing.
As mentioned in the previous Annual Re-
port, the Central Bank Governors of member
countries of the Islamic Conference would
meet every year in conjunction with the An-
nual Meeting of IDB. In the second meeting
held in March 1979, the Governors approved
the report of the study on financial institution
in member countries, methods to increase the
flow of trade and to develop a money and capi-
tal market among member countries. As a fol-
low up to this study, it was agreed to explore
the possibility of expanding trade through ex-
port credits, other export facilities, and mutual
tariff reductions.
e. Inter-Governmental Group On Indo-
nesia (IGGI)
The 21st IGGI meeting, held in Amsterdam
on May 22-23, 1978, agreed to provide $ 2.5
billion aid in 1978/79. The amount included $
1.75 billion in concessional aid from donor
countries and multilateral financial institutions
while the remainder ($ 0.75 billion) was ex-
pected to constitute export credit facilities. The
amount of concessional aid actually pledged
by donor countries and multilateral financial
institutions at the meeting was $ 1.62 billion.
The greater part of the amount (85%) was
project aid and the balance was made up by
food aid and technical assistance.
Until the end of March 1979, loan agree-
ments signed amounted to $ 11.6 billion, out
of which $ 7.7 billion was disbursed.

59
VII. INDONESIA’S BALANCE OFPAYMENTS
A. Balance of payments policy
Balance of payments policy is an integral
part of the economic policies pursued by the
Government to achieve objectives of develop-
ment planning. In its implementation, the bal-
ance of payments policy has been directed to
increase export earnings for financing imports
which are required to induce productive ac-
tivities and to meet domestic consumption. The
policy has also been aimed at saving foreign
exchange through import substitution and use
of foreign resources, both in the form of loans
and investments, and at expanding employ-
ment opportunities as well as ensuring equi-
table distribution of the fruits of development.
In pursuing this policy, the Government has
taken a set of measures which has come to
be known as the “November 15, 1978 pack-
age”. As mentioned in the chapter on Mon-
etary Developments, the measures were taken
to promote domestic production (i.e. produc-
tion of export commodities and import substi-
tutes) and to strengthen the competitiveness
of Indonesia’s export commodities in the world
markets and of domestic products against
import commodities. The essentials of the
November 15, 1978 package were the Rupiah
devaluation of 33.6% (from Rp 415.- to Rp
625.- per US dollar) and the adoption of a
managed floating scheme for the Rupiah vis-a-
vis a basket of selected currencies. It is worth
noting that the overvaluation of Rupiah during
the last few years until November 15, 1978,
was one of the causes which led to the weak-
ening of the competitiveness of Indonesia’s
economy as reflected in faster growth of im-
ports relative to exports.
Some fiscal measures were also intro-
duced to support the implementation of the
aforesaid measures, vis. A reduction in cus-
tom duties and import sales tax on raw mate-
rials and auxiliary materials used to produce
goods for export or for domestic market. In
addition, steps were taken with respect to trade
procedures in order to facilitate flows of ex-
ports and imports. With respect to capital trans-
fers and services payments, the Government
simplified the procedure of investment appli-
cation and offered some additional fiscal in-
centives to attract foreign investment.
1 . Export measures
In an effort to improve the competitiveness
and production of export goods, companies
producing those goods were granted fiscal in-
centives for imports of raw materials, auxiliary
materials and spare parts/equipment used in
the manufacturing process. Imports of this type
which are subject to fast wear and tear and
which were used for manufacturing industrial
products for export were exempted from im-
port duty, import sales tax and “MPO Impor/
WAPU”1) (import withholding tax/tax collector).
To companies exporting industrial products,
which paid the aforesaid duties on the items
specified above, the exemption was granted
in the form of Export Certificates. The value of
Export Certificates is stated in Rupiah, and
1 ) Decree of the Minister of Finance No. 434/KMK.01/1978 dated November 15, 1978.

60
determined on the basis of a certain percent-
age of the export check prices of the indus-
trial products and the volume of the goods
exported. Export Certificates are negotiable
documents and can be used for payment of
tax or encashed at designated local Treasury
Offices.2) The same facilities were also given
to domestic companies which were awarded
a contract under an international tender for a
domestic project financed with a foreign loan
in regard to imports of raw materials, auxiliary
materials and spare parts/equipment subject
to fast wear and tear which were used for
manufacturing of industrial products to be sold
under the said contract.3)
Companies operating in certain areas
(such as Bonded Warehouses and Export and
Industrial Processing Zones) manufacturing
products exclusively for export were exempted
from payment of import duty, import sales tax
and “MPO Impor/WAPU” with respect to im-
ports of raw materials and auxiliary materials
used in manufacturing the products. Domes-
tic raw materials and auxiliary materials were
also exempted from domestic sales tax.4)
Various measures have been taken to
support the export expansion program, such
as simplification of procedure governing the
issue of exporter’s licenses, provision of
certain facilities, and simplification in the use
of export documents. An Exporter’s Identifi-
cation Number, abbreviated “APE” (stand-
ing for “Angka Pengenal Eksportir”), could
previously only be issued to wholesalers and
had a validity of 3 years, however, as from
November 15, 1978, it could be issued to
any holder of Trade Business Permit (“Surat
Izin Usaha Perdagangan”), whether big,
medium or small, and is valid for a period of
5 years.5) Moreover, the validity of the Re-
stricted Exporter’s Identification Number ,
abbreviated “APET” (standing for “Angka
Pengenal Eksportir Terbatas”), issued to
companies operating under Act No. 1 of
1967 (foreign investment) and Act No. 6 of
1968 (domestic investment) was also pro-
longed from 2 to 5 years. 6)
In addition, other facilities were granted
such as an extension of the kinds of goods
eligible for export under Usance Letter of
Credit7) and an extension of the kinds of handi-
craft products which were not subject to the
regular report procedure and the foreign ex-
change surrender requirement.8)
In order to meet domestic demand and to
maintain price stability, the Government re-
stricted, on the other hand, the export of sev-
eral domestically produced commodities
through annual export quotas, determined on
2) Decree of the Minister of Finance No. 462/KMK.O1/1978 dated November 27, 1978
3) Decree of the Minister of Finance No. 435/KMK. 01/1978 dated November 15, 1978
4) Decree of the Minister of Finance No. 470/KMK.05/1978 dated December 4, 1978
5) Decree of the Minister of Trade and Cooperatives No.237/Kp/XI/1978 dated November 15, 1978 and De-cision of the Director General of ExternalTrade No. 04/Daglu/Kp/X11/1978 dated December9, 1978.
6) Decision of the Director General of External TradeNo. 03/Daglu/Kp/X11/1978 dated December 9, 1978.
7) Decree of the Minister of Trade and CooperativesNo. 235/Kp/XI/1978 dated November 15, 1978.
8) Decree of the Minister of Trade and CooperativesNo. 233/Kp/XI/1978 dated November 15, 1978.
9) Decree of the Minister of Trade and CooperativesNo. 268/Kp/XII/1978 dated December 11, 1978 andNo. 15/Kp/1/1979 dated January 12, 1979.

61
the basis of domestic production and de-
mand.9)
In an effort to encourage the domestic tim-
ber industry and export of processed wood,
the export prohibition of logs was made to
cover sandal wood10) and “ramin” 11) during the
year under report. In addition, under the policy
to prohibit the export of luxury wood, the banks
were no longer allowed since July 1978 to ex-
tend new or additional loans and to extend the
time of repayment of loans for such exports12).
In order to expand the marketing of export
commodities, measures were taken to regu-
late the trade between Indonesia and the East
European Socialist countries. In this regard,
PT (Persero) Panca Niaga was appointed as
the Iiaison.13)
In the context of trade promotion among
ASEAN countries, the types of Indonesian
export commodities enjoying preferential treat-
ment under the ASEAN Preferential Trading
Arrangements were increased from 56 to
1,060 items 14) in the year under report.
As a follow up of the steps which were taken
to promote the export of goods and services
to the Middle East, the state-owned foreign
exchange banks were allowed to issue bank
guarantees denominated in foreign exchange,
and also to extend foreign exchange credits
to Indonesian contractors subject to interest
rates which enabled them to compete with for-
eign contractors.15)
2. Import measures
In order to improve the competitive-
ness of domestic products against im-
ports, the Government decided, in the
context of the November 15,1978 mea-
sures, to grant a 50% exemption from
payment of import duty and import sales
tax on imports of raw materials and auxil-
iary materials used in domestic produc-
tion.16) With the issuance of the aforemen-
tioned decree, the Government revoked
as of December 1978 the Joint Decree of
the Ministers of Trade, Finance and Indus-
try of 1976 concerning import of goods in
the context of protection of domestic in-
dustry17)
In connection with the efforts directed
at encouraging trade with other ASEAN
countries, the number of import items eli-
gible for preferential treatment under the
ASEAN Preferential Trading Arrange-
10) Bank Indonesia Circular Letter, SE No. 11/21/ ULNdated June 22, 1978.
11) Decree of the Minister of Trade and CooperativesNo. 124/Kp/V11/1978 dated July 27, 1978.
12) Bank Indonesia Circular Letter, SE No. 11/14/UPKdated July 26, 1978
13) Decree of the Minister of Trade and CooperativesNo. 234/Kp/XI/1978 dated November 15, 1978.
14) Instructions of the Director General of External TradeNo. HLN 200/DAGLU/INS/09/1978 dated Septem-ber 19, 1978 and No. 03/DAGLU/INS/I 11/1979dated March 15, 1979
15) Bank Indonesia Circular Letter, SE No.. 11/18/ULNdated June 9, 1978.
16) Decree of the Minister of Finance No. 433/KMK. 05/1978 dated November 15, 1978.
17) Joint Decree of the Ministers of Trade and Coopera-tives, Finance and Industry No. 271/KPB/X11/78, No.489/KMK.05/1978 and No. 243/M/SK/12/1978 datedDecember 13, 1978.
18) Instruction of the Director General of External TradeNo. 03/DAGLU/INS/I11/1979 dated March 15, 1979.

62
ments was enlarged from 15 to 266.18)
Similarly, in order to expand trade with the
East European Socialist countr ies, as
mentioned earlier, the Government has
regulated the trade between Indonesia
and said countries.19)
In order to encourage the development of
domes industries, the total number of prod-
ucts eligible for import under Usance L/Cs was
increased from 199 to 273.20) Meanwhile, in
order to help importers overcome the problem
of cash shortage, the payment period of Us-
ance L/Cs opened before November 15, 1978
was extended since November 15, 1978 from
180 days to 12 months after the date of ship-
ment.21)
3. Policy on capital movements and ser-
vice payments
a. Oil sector
During the year under report, efforts were
continuously made to induce oil exploration
and exploitation. In this context, the issue of
calculation and payment of corporation tax and
tax on interest, dividend and royalty by US oil
contractors was settled with the US Internal
Revenue Service (IRS) in May 1978. It may
be mentioned that in April 1976 the IRS ruled
that payments made by US oil companies to
foreign governments under production shar-
ing contracts were no longer treated as tax
payments, but as royalties. The ruling, there-
fore, disallowed the companies from claiming
foreign tax credits in the US for these pay-
ments. Accordingly, the steps unfavorably af-
fected the interest of contractors to increase
investments in oil exploration and exploitation
activities in Indonesia. Since the enforcement
of this regulation, the Indonesian Government
had been negotiating with the US Government
to avoid such double taxation, and an agree-
ment was reached in May 1978. Based on this
agreement, the Government of Indonesia is-
sued in July 1978 a regulation concerning the
calculation and payment of corporation tax and
tax on interest, dividend and royalty by foreign
oil companies under production sharing con-
tracts. 22) According to the regulation, corpora-
tion tax amounted to 45% of taxable profit,
while tax on interest, dividend and royalty
amounted to 20% of taxable profit after pay-
ment of corporation tax with retroactive effect
as from January 1, 1978. Under this method
of calculation, the corporation tax paid by the
US oil companies in Indonesia would be re-
garded as tax credit. The above provisions
were also applied to oil contractors operating
under contracts of works. 23) The agreement
reached between the Governments of Indo-
nesia and the United States was, principally,
an agreement to amend the calculation of profit
sharing so as to meet the IRS requirement
without affecting Indonesia’s share.
It is worth noting that as a result of the ef-
19) Decree of the Minister of Trade and CooperativesNo. 234/Kp/XI/1978 dated November 15, 1978.
20) Decree of the Minister of Trade and CooperativesNo. 165/Kp/IX/1978 dated September 20, 1978.
21) Bank Indonesia Circular Letter, SE No. 11/70/ULNdated February 3, 1979.
22) Decree of the Minister of Finance No. 267/KMK.012/1978 dated July 19, 1978.
23) Decree of the Minister of Finance No. 514/KMK.012/1978 dated December 29, 1978.

63
forts to encourage oil exploration and exploi-
tation, 7 new contracts were signed, i.e. 4 con-
tracts of works and 3 production sharing con-
tracts during the year under report.
b. Non-oil sector
In order to adjust to the developments in
domestic and international money markets, a
number of amendments were made in the pro-
visions on swap transactions between Bank
Indonesia and foreign exchange banks. Previ-
ously, swap transactions were concluded for
not less than one month and not more than 6
months, and subject to a premium of ‘/2% a
month. According to amended provisions,
swap transactions could be concluded for one
month, 3 months and 6 months, subject to a
premium of 2'/4%, 2'/2% and 23/4% per an-
num respectively. Swap transactions are still
limited to US dollars in multiples of $ 10,00024)
Furthermore, a tax concession was granted
in the year under report on the increase of
share capital originating from retained profit in
order to accelerate investments, including for-
eign investments.25) The measure was part of
a series of fiscal policies designed to stimu-
late business activities in Indonesia as men-
tioned earlier in the chapter on Government
Finance.
To encourage companies operating under
the foreign investment law and foreign com-
panies engaged in export activities and pro-
duction of export goods, the Government has
reduced since April 1, 1978 the interest rate
on bank loans for export and production of
export goods from 13'/2% to 12% per an-
num.26)
More detailed information on investment is
provided in Chapter VIII.
B. Balance of payment developments
1. Main features
During the year under report, Indonesia’s
balance of payments showed a substantial
improvement with an overall surplus of $ 708
million as compared with $ 651 million in the
preceding year (see Table 28). As a result, net
foreign exchange reserves increased to $
2,916 million at the end of March 1979.
The aforementioned balance of payments
surplus does not include the net increase of $
110 million in the foreign exchange position of
foreign exchange banks. With the inclusion of
this increase, the overall balance of payments
surplus would in fact be $ 818 million as against
$ 977 million in 1977/78.
In value terms, total exports in 1978/79
showed an increase of 5% over the preceding
year’s level. It may be noted that exports of
non-oil/Liquefied Natural Gas (LNG) increased
by a substantial 13%, exports of oil and LNG
were practically constant, whereas oil exports
declined by 5%. The commodity composition
indicated that the export of most commodities
24) Bank Indonesia Circular Letter, SE No. 11/215/UDdated January 29, 1979.
25) Decree of the Minister of Finance No. 113/KMK.04/1979 dated March 27, 1979.
26) Bank Indonesia Circular Letter, SE No. 11/70/ULNdated February 3, 1979.

64
other than oil showed increases. This was par-
ticularly so for tin, rubber, timber as well as
animals and animal produce. Cement was until
recently imported in sizable quantities. How-
ever, cement imports declined gradually and
since October 1978 a certain type of cement
is even being exported.
The total value of imports rose by 7% which
was attributable to a 15% increase in imports
by oil and LNG enterprises and a 6% in other
imports.
It is worthy of note that during the year un-
der report rice imports decreased significantly
in volume as well as in value, compare with
the increase of the preceding year. Imports of
consumer goods declined both in value and in
percentage of total imports. On the contrary,
imports of raw material increased.
In line with the continuing improvement of
Indonesia’s economy and balance of pay-
ments, the Government entered international
capital markets by launching foreign bond is-
sues denominated in yen, Deutsche mark and
Netherlands guilder.
2. Current account
The current account recorded a deficit of $
1,155 million in 1978/79, compared with that
of $ 690 million in 1977/78. This larger deficit
was due to an increase in the deficit on ser-
vices account and a decline in the surplus on
balance of trade. The deficit on services ac-
count amounted to $ 4,065 million in 1978/79
while the surplus on balance of trade was only
$ 2,910 million, as compared with $ 3,684 mil-
lion and $ 2,994 million respectively in the pre-
ceding year. The increase in the deficit on ser-
vices account was mainly attributable to
PERTAMINA’S expenditures on services.
a. Balance of trade
As mentioned before, the surplus on bal-
ance of trade declined in 1978/79 relative to
the preceding year, due to a larger increase in
imports ($ 577 million) than in exports ($ 493
million).
The following figures exhibit the balance of
trade during the last five years (in millions of
$).
a.1. Exports
Total exports in 1978/79 amounted to $
11,353 million, an increase of only 5% com-
pared with 18% in the preceding year (see
Table 29). The relatively small increase in ag-
gregate exports resulted because exports of
oil and LNG hardly increased even though
non-oil/ LNG exports went up by 13%.
The increase in the value of nonoil/LNG ex-
ports was attributable to a higher volume and price
of certain commodities. The decline in the oil ex-
port value was closely related to a decrease in pro-
duction, whereas the increase in the export value
of LNG was mainly caused by a larger volume.
Japan was still the main country of desti-
nation for Indonesia’s exports (40%), followed
by the United States of America (25%), while
ASEAN countries accounted for 13% of the
total export value.

65
i. Non-oil/LNG exports
In 1978/79 the value of non-oil/LNG exports
rose by 13% to $ 3,979 million as compared
with 22% in 1977/78. The increase was mainly
attributable to exports of timber, rubber, tin,
palm oil, as well as animals and animal pro-
duce (particularly shrimps). On the contrary,
exports of coffee and tea decreased.
Among the countries of Indonesia’s export
destination, Japan ranked first (24%), followed
by the United States of America (16%). The
share of exports to the ASEAN countries in
the year under report rose significantly to 17%
compared with 12% in 1977/78.
The development in the exports of selected
commodities is described below.
Timber
Timber was the main contributor to foreign
exchange receipts, and accounted for 28% of
the total non-oil/LNG export value. In 1978/79
the export value of timber amounted to $ 1,130
million, an increase of 20% compared with only
7% in 1977/78. The increase was caused by a
17% rise in price and a 3% increase in vol-
ume. Timber was mainly exported to Japan
(46%), South Korea (25%) and Taiwan (14%).
The value and volume of timber exports in
the last five years are shown below.
Rubber
In the year under report, rubber replaced
coffee as the second most important commod-
ity among non-oil/ LNG exports. The value of
rubber exports rose by a sizable 27% in 1978/
79, compared with only 5% in 1977/78. The
increase was due to a 21 % increase in price
and a 5% increase in volume.
Singapore and the United States of
America were the main impor ters of
Indonesia’s rubber, and respectively ac-
counted for 40% and 37% of Indonesia’s total
rubber exports.
The following figures show the rubber ex-
port value and volume during the last five
years.
Coffee
Although in 1978/79 the volume of coffee
exports rose significantly by 29%, its value
declined by 19% to $ 508 million. This was in
contrast to a sharp increase of 90% experi-
enced in the preceding year. During the year
under report, the export value of coffee de-
clined on account of the drop in the world
market coffee price, following an increase in
coffee supply from Brazil, where production
was recovering from frost damages.
Coffee was mainly exported to the United States
of America (28%) and the Netherlands (13%).

66
The value and volume of coffee exports
during the last five years were as follows.
Palm oil
Despite a 6% decline in the export volume
of palm oil during the year under report, due
to a price increase of around 16%, the export
value increased by 9% to $ 221 million, com-
pared with a sharp increase of 37% in 1977/
78. The decline in the export volume was
caused by an increase in the demand for palm
oil by cooking oil factories to meet domestic
consumption, although palm oil output rose by
4% in 1978/79. It may be mentioned that the
Government had directed that palm oil produc-
ers must make a part of their output available
for use by domestic cooking oil factories.
Palm oil was primarily exported to Iraq
(26%), the Netherlands (17%) and India (9%).
The value and volume of palm oil exports
during the last five years were as follows.
Tin
Similar to the preceding year, the value of
tin exports in 1978/79 increased by 28% to $
324 million. The increase was due both to price
and volume which rose by 23% and 4% re-
spectively.
Japan ranked first among the countries of
destination by accounting for 28% of
Indonesia’s tin exports, followed by the Neth-
erlands (27%) and Singapore (23%).
It may be mentioned that considering the
soaring price of tin in the world market, the
International Tin Council (ITC) increased the
floor price by 12.5% to M$ 1,350 per picul and
the ceiling price by 13.3% to M$ 1,700 per
picul.27) The new floor and ceiling prices be-
came effective as from July 14, 1978.
Tin exports in the last five years were as
follows.
Animals and animal produce
Similar to the preceding year, the export
value of animal produce in 1978/79 rose sig-
nificantly, i.e. by 18% to $ 212 million. The in-
crease was the result of a 10% rise in price
and an 8% increase in volume. The major part
of the export value came from shrimps which
27) 1 picul = 60.5 kilograms
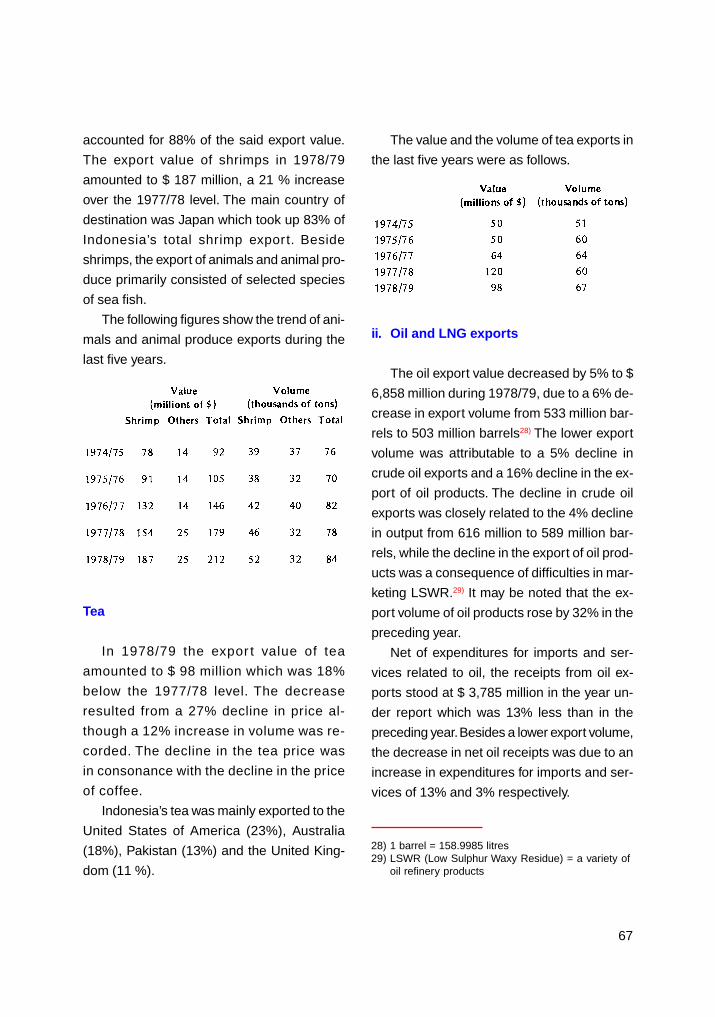
67
accounted for 88% of the said export value.
The export value of shrimps in 1978/79
amounted to $ 187 million, a 21 % increase
over the 1977/78 level. The main country of
destination was Japan which took up 83% of
Indonesia’s total shrimp export. Beside
shrimps, the export of animals and animal pro-
duce primarily consisted of selected species
of sea fish.
The following figures show the trend of ani-
mals and animal produce exports during the
last five years.
The value and the volume of tea exports in
the last five years were as follows.
Tea
In 1978/79 the expor t value of tea
amounted to $ 98 million which was 18%
below the 1977/78 level. The decrease
resulted from a 27% decline in price al-
though a 12% increase in volume was re-
corded. The decline in the tea price was
in consonance with the decline in the price
of coffee.
Indonesia’s tea was mainly exported to the
United States of America (23%), Australia
(18%), Pakistan (13%) and the United King-
dom (11 %).
ii. Oil and LNG exports
The oil export value decreased by 5% to $
6,858 million during 1978/79, due to a 6% de-
crease in export volume from 533 million bar-
rels to 503 million barrels28) The lower export
volume was attributable to a 5% decline in
crude oil exports and a 16% decline in the ex-
port of oil products. The decline in crude oil
exports was closely related to the 4% decline
in output from 616 million to 589 million bar-
rels, while the decline in the export of oil prod-
ucts was a consequence of difficulties in mar-
keting LSWR.29) It may be noted that the ex-
port volume of oil products rose by 32% in the
preceding year.
Net of expenditures for imports and ser-
vices related to oil, the receipts from oil ex-
ports stood at $ 3,785 million in the year un-
der report which was 13% less than in the
preceding year. Besides a lower export volume,
the decrease in net oil receipts was due to an
increase in expenditures for imports and ser-
vices of 13% and 3% respectively.
28) 1 barrel = 158.9985 litres29) LSWR (Low Sulphur Waxy Residue) = a variety of
oil refinery products

68
In accordance with the decision taken in
the OPEC meeting on December 20, 1977 in
Caracas, there were no changes in oil prices
till the end of 1978. The OPEC meeting held
on December 16 and 17, 1978, in Abu Dhabi
decided to increase oil prices in four stages
on a cumulative basis, i.e. by 5.0% with effect
from January 1, 1979, 3.8% from April 1, 1979,
2.3% from July 1 , 1979, and 2.7% from Octo-
ber 1, 1979, coming up to the new price of $
14.54 per barrel. Subsequent to this decision,
Indonesia raised the export price of crude oil
by only 3.3% from January 1 to March 31,
1979, since certain other crudes had previ-
ously been overpriced. The OPEC decision
taken in Abu Dhabi was reviewed in Geneva
on March 27, 1979, when it was decided to
raise the base price of crude oil by 9.05% with
effect from April 1, 1979, resulting in the price
which would take effect as from October 1,
1979 as decided in Abu Dhabi. The meeting in
Geneva also decided that OPEC members be
allowed to impose a surcharge of not more
than $ 4 per barrel.
Japan and the U.S.A. were still the major
importers of Indonesian oil, accounting for 43%
and 35% respectively of Indonesia‘s exports
of oil and oil products, followed by Trinidad and
Tobago, Singapore and the Philippines.
Since the completion of the LNG plant in
Arun (Aceh), LNG exports increased consid-
erably from $ 162 million in 1977/78 to $ 516
million in 1978/79. It may be mentioned that
LNG exports remained limited, as Japan was
the only country of destination and exports to
the U.S.A. were still under negotiation in the
year under report. The value of LNG exports,
net of expenditures for imports and services
relating to LNG production, amounted to $ 225
million in 1978/79.
a. 2. Imports
Compared with 1977/78, total merchandise
imports increased by 7% to $ 8,443 million,
because of a 6% rise in non-oil/LNG imports
($ 6,732 million) and a 15% rise in imports of
oil companies ($ 1,711 million) (Table 31). Most
of the non-oil/LNG imports were financed with
general foreign exchange and foreign borrow-
ings, amounting to $ 4,425 million and $ 1,797
million respectively. Those two sources fi-
nanced 92% of total non-oil/LNG imports,
whereas the remaining 8% were imports un-
der direct investment and imports under other
capital inflows. Imports financed with general
foreign exchange rose only by 13% compared
with 55% in the preceding year. The consider-
able increase in imports financed with general
foreign exchange in 1977/78, as stated in the
1977/78 report, was mainly due to an increase
in rice and sugar imports and a shift from Mer-
chant L/Cs to general foreign exchange as a
source of import financing. The lower rate of
increase in imports in 1978/79 primarily re-
sulted from the decrease in imports of rice,
sugar and cement.
Imports under project loans increased by
2% to $ 1,703 million in the year under report,
while imports under direct investment and
other capital inflows decreased by 7% to $ 510
million, largely because of lower imports for
an LNG plant of which the construction has
since been completed.

69
Government program imports amounted to
$ 619 million of which $ 525 million or 85%
was financed with general foreign exchange
and $ 94 million or 15% with foreign aid. Com-
pared with 1977/78, these imports decreased
by 27%, largely due to a 48% decline in rice
imports. This decline in the value of rice im-
ports was in line with a decrease in volume
from 2.5 million tons valued at $ 650 million
(C&F) to 1.2 million tons valued at $ 341 mil-
lion (C & F), which was attributable to an im-
provement in domestic rice production during
1978/79. The value of wheat imports, by con-
trast, rose by 43% to $ 195 million (C & F)
resulting from an increase in volume and price
of around 21%. The higher level of wheat im-
ports was meant to maintain adequate stocks
to meet domestic demand.
Imports of cement continued to decrease
markedly and dropped by 65% in 1978/79 fol-
lowing the rise in domestic production. Cement
imports in 1978/79 were only 297 thousand
tons compared with 1,741 thousand tons in
1975/76.
A breakdown of imports by economic cat-
egories indicates that import of raw materials
ranked first replacing capital goods. The share
of raw material imports in total nonoil/LNG
imports rose from 32% to 39%, while the share
of capital goods imports remained at 36%.
Imports of consumer goods, ranking second
in the preceding year, shifted to the third place,
and accounted for 25% of total non-oil/LNG
imports. The increase in percentage share of
raw material imports reflected the effect of the
November 15, 1978 devaluation, while the
decrease in percentage share of consumer
goods was largely due to lower rice imports.
The trend in the composition of imports by
economic category during the last five year
was as follows.
The value of imports by oil and LNG com-
panies in 1978/79 rose by 15% to $ 1,711 mil-
lion compared with a decrease of 15% in the
preceding year. Imports by foreign oil compa-
nies and PERTAMINA rose by 12% and 14%
respectively.
The pattern of imports by country of origin
hardly changed during the year under report.
Most of them, i.e. 59% of total imports, came
from Asian countries, while imports from Eu-
ropean and American countries accounted for
a share of 22% and 16% respectively. Japan,
as in the preceding years, was still the major
country of origin, accounting for 30% of total
imports, followed by the U.S.A. and West Ger-
many with a share of 13% and 9%, respec-
tively, while 10% of total imports came from
ASEAN countries.
b. Services account
The services account in 1978/79 showed a
deficit of $ 4,065 million, an increase of 10% over
the preceding year, largely as a result of increases
in payments for profit remittance from $ 1,826 mil-
lion to $ 1,925 million and for other services from $
558 million to $ 853 million (Table 28).
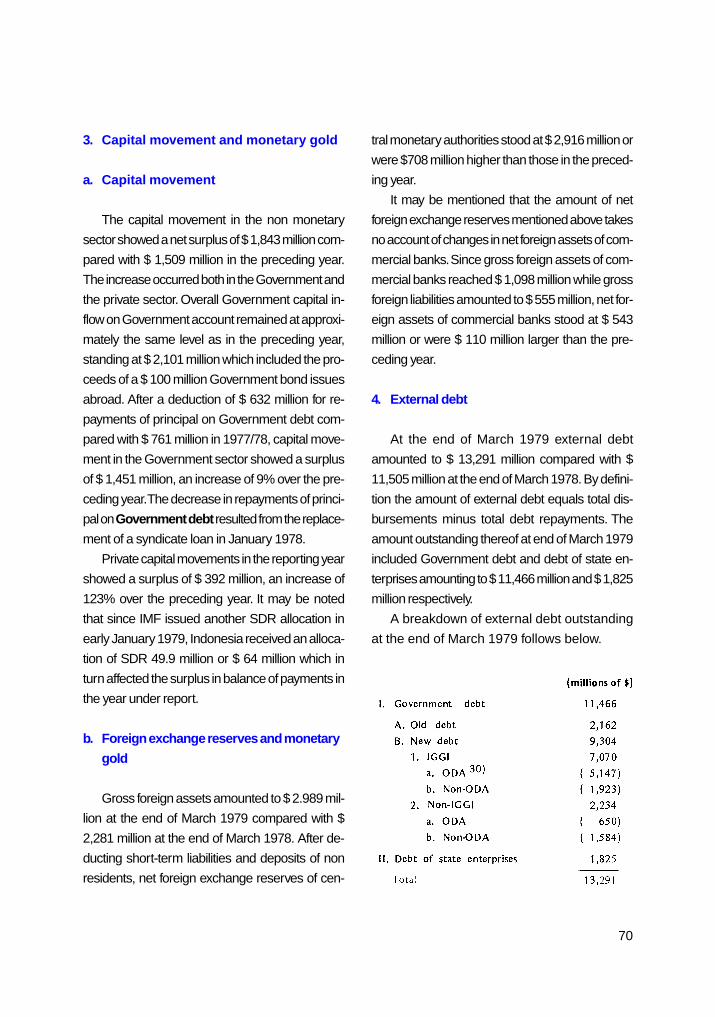
70
3. Capital movement and monetary gold
a. Capital movement
The capital movement in the non monetary
sector showed a net surplus of $ 1,843 million com-
pared with $ 1,509 million in the preceding year.
The increase occurred both in the Government and
the private sector. Overall Government capital in-
flow on Government account remained at approxi-
mately the same level as in the preceding year,
standing at $ 2,101 million which included the pro-
ceeds of a $ 100 million Government bond issues
abroad. After a deduction of $ 632 million for re-
payments of principal on Government debt com-
pared with $ 761 million in 1977/78, capital move-
ment in the Government sector showed a surplus
of $ 1,451 million, an increase of 9% over the pre-
ceding year. The decrease in repayments of princi-
pal on Government debt resulted from the replace-
ment of a syndicate loan in January 1978.
Private capital movements in the reporting year
showed a surplus of $ 392 million, an increase of
123% over the preceding year. It may be noted
that since IMF issued another SDR allocation in
early January 1979, Indonesia received an alloca-
tion of SDR 49.9 million or $ 64 million which in
turn affected the surplus in balance of payments in
the year under report.
b. Foreign exchange reserves and monetary
gold
Gross foreign assets amounted to $ 2.989 mil-
lion at the end of March 1979 compared with $
2,281 million at the end of March 1978. After de-
ducting short-term liabilities and deposits of non
residents, net foreign exchange reserves of cen-
tral monetary authorities stood at $ 2,916 million or
were $708 million higher than those in the preced-
ing year.
It may be mentioned that the amount of net
foreign exchange reserves mentioned above takes
no account of changes in net foreign assets of com-
mercial banks. Since gross foreign assets of com-
mercial banks reached $ 1,098 million while gross
foreign liabilities amounted to $ 555 million, net for-
eign assets of commercial banks stood at $ 543
million or were $ 110 million larger than the pre-
ceding year.
4. External debt
At the end of March 1979 external debt
amounted to $ 13,291 million compared with $
11,505 million at the end of March 1978. By defini-
tion the amount of external debt equals total dis-
bursements minus total debt repayments. The
amount outstanding thereof at end of March 1979
included Government debt and debt of state en-
terprises amounting to $ 11,466 million and $ 1,825
million respectively.
A breakdown of external debt outstanding
at the end of March 1979 follows below.

71
The aforesaid amount of Government debt
included $ 2,162 million, being the balance of
old debt for which loan agreements were
signed prior to July 1966. The new debt total-
ling $ 9,304 million, consisted of borrowings
from IGGI members and non-IGGI members,
amounting to $ 7,070 million and $ 2,234 mil-
lion respectively.
Soft-term borrowings (ODA) as part of the IGGI
borrowings consisted of an amount of $ 3,941 mil-
lion, while multilateral borrowings from international
and regional financial institutions i.e. IBRD, IDA and
ADB amounted to $ 1,206 million. At the end of
March 1979 outstanding borrowings from IGGI on
semiconcessional (non-ODA)30) terms amounted
to $ 1,923 million, mainly consisting of export cred-
its. With regard to non-IGGI debt, outstanding
soft-term loans and semiconcessional loans
amounted to $ 650 million and $ 1,584 million re-
spectively. The aforesaid semi-concessional loans
inter alia included a syndicated loan and a bond
loan issued abroad.
5. Balance of payments prospect for 1979/80
The balance of payments improvement in
1978/79 is expected to accelerate in 1979/80.
Based on prudent assumptions the balance
of payments is projected to show a surplus of
around $ 1.5 billion. The value of total exports
and imports is estimated to increase by 40%
and 22% respectively. This high rate of export
growth is based on the assumption that there
would be an increase in the price of crude oil
and an insignificant decline in volume. More-
over, the value of LNG exports is expected to
increase considerably, mainly due to a rise in
volume, while the value of non-oil/LNG exports
is also projected to rise substantially. The ex-
pected increase in the value of imports will
mainly result from an increase in imports un-
der development project loans and Govern-
ment programs, and imports of oil and LNG
companies, whereas non-program imports (fi-
nanced with general foreign exchange) are
projected to increase by about 18%. Service
payments are expected to increase by 27%.30) ODA = Official Development Assistance.

72

73

74
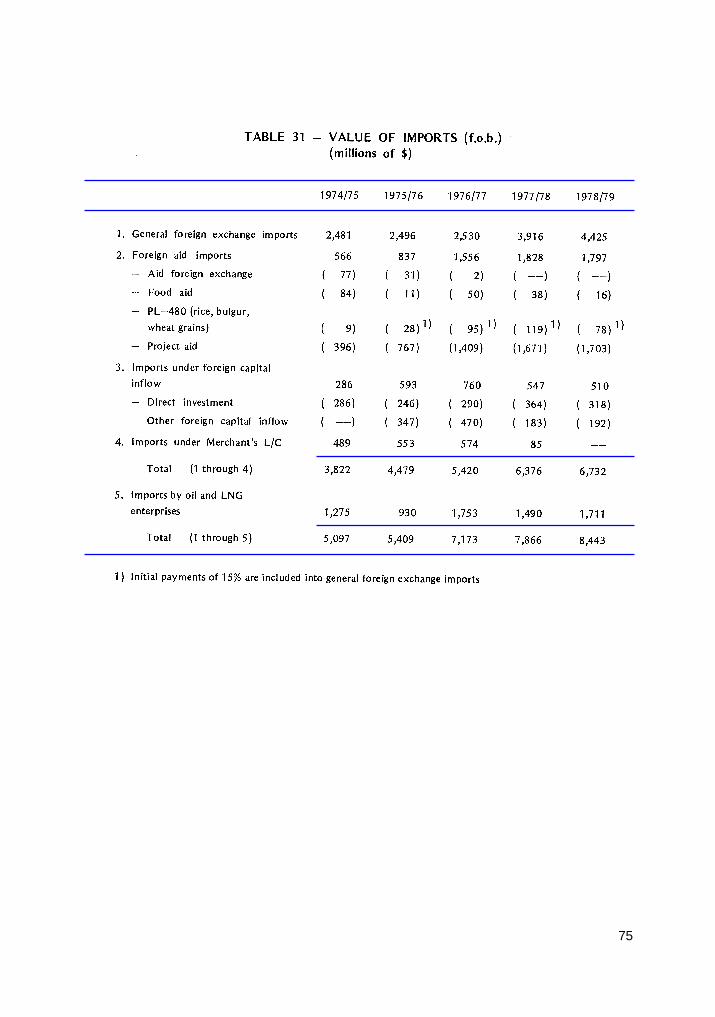
75

76

77

78

79

80

81

82

83
VIII. PRODUCTION, INFRASTRUC-TURE AND PRICES
A. National income
The national development efforts made by
the Government through the rive Year Devel-
opment Plans had satisfactory results as re-
flected in the rate of economic growth. During
the Second Five Year Development Plan,
Gross Domestic Product (GDP) increased at
an annual average rate of 6.9%. Although this
rate was lower than those attained by a num-
ber of Asian countries, it was higher than that
of the industrial OECD member countries.
In 1978, the Indonesian economy experi-
enced a fairly high rate of growth, namely 7.2%
compared with 7.4% in 1977 (see Table 34) .
This rate of growth was closely related to the
relatively high production increases in agricul-
ture and manufacturing.
With regard to the development of each
economic sector, the value added in the agri-
cultural and manufacturing sectors increased
by 7.2% and 14.7%, respectively, whereas the
value added in the mining sector decreased
by 2.8%. In the agricultural sector, rice pro-
duction registered the highest rate of increase
ever reached during the last few decades, that
is 10.8% to become 17.6 million tons. This
performance was attributable to favorable
weather conditions and reduced damage
caused by pests. Production of other food
crops as well as some export crops, such as
palm oil, tea and tobacco also registered en-
couraging increases. In the manufacturing sec-
tor, the increase in value added was mainly
attributable to the production of fertilizer (Urea)
and cement which went up by 44.8% and
26.4% respectively, consequent upon the
completion of expansion of existing plants and
the construction of new ones. The decrease in
value added in the mining sector was mainly
attributable to lower crude oil production,
namely by 3.0%, which could not be offset by
increases in the production of natural gas (51.1
%), coal (14.6%) and tin (5.8%).
GDP at current market prices, amounted
to Rp 21,788.4 billion in 1978 compared with
Rp 18,705.9 billion in the preceding year. With
mid-year population estimates of 135.3 million
in 1978 and 132.6 million in 1977, the corre-
sponding per capita GDP in 1978 amounted
to Rp 161,038.- ($ 372)1) compared with Rp
141,070.- ($ 340) in 1977.
In so far as the contribution of economic
sectors to GDP was concerned, the agricul-
tural sector continued to be the most signifi-
cant contributor, although its importance had
been gradually declining, that is from 49.0%
of GDP in 1969 (the first year of the First Five
Year Development Plan) to 34.1at the end of
the Second Five Year Development Plan. On
the other hand, the contribution of other sec-
tors, particularly the mining and manufactur-
ing sectors, increased from 5.2% to 11.1 and
from 8.8% to 12.3% respectively. This phenom-
enon reflected the success of the development
efforts made during the First and Second Plan
periods to enhance the role of nonagricultural
sectors.
1). Converted on the basis of time-weighted averageexchange rates which prevailed during 1978, namelyRp r115: per $ 1 through November 15, 1978, andRp 625.- thereafter

84
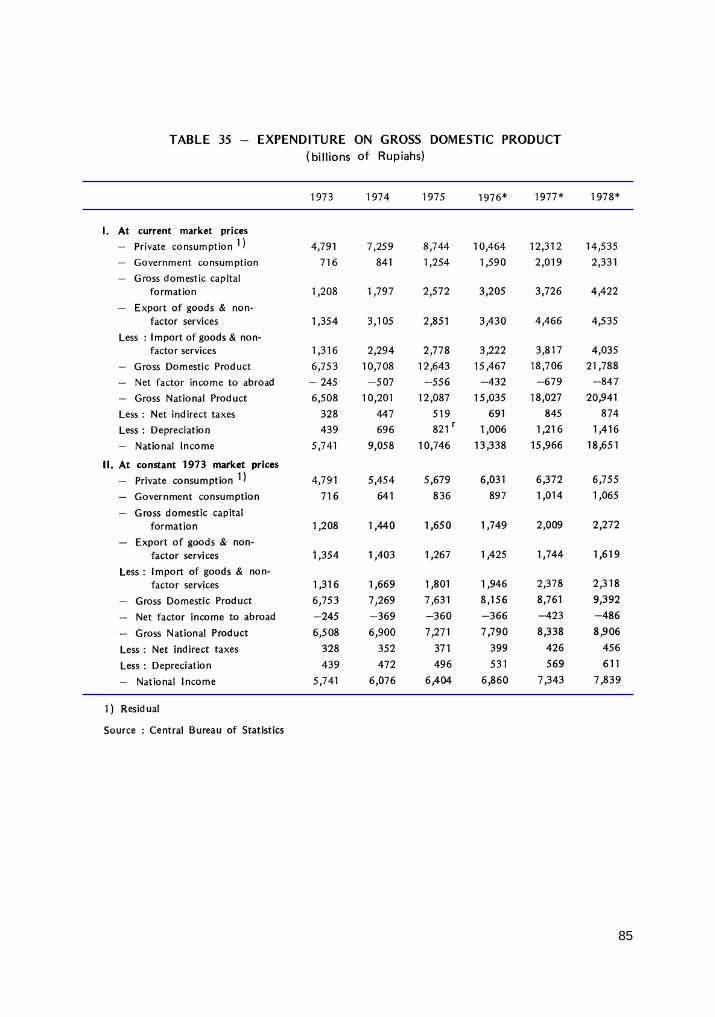
85

86
The composition of GDP by type of expen-
ditures also exhibited an encouraging facet
namely that gross domestic capital formation
as a percentage of GDP increased from an
average of 14.5% during the First Plan period
to 19.6% during the Second Plan. In 1978,
gross domestic capital formation accounted for
20.3% of GDP (see Table 35).
As the amount of foreign investments in
Indonesia exceeded Indonesia’s investments
abroad, Gross National Product (GNP) was
smaller than GDP. GNP at current market
prices in 1977 and 1978 amounted to Rp
18,027.4 billion and Rp 20,941.8 billion, re-
spectively. On the basis of mid-year popula-
tion estimates, per capita GNP amounted to
Rp 135,953.- ($ 328) in 1977 and
Rp154,780.-($ 357)2) in 1978.
B. Capital investment
It was stated in the previous annual report
that as an incentive to domestic production
activities and capital investment, the Govern-
ment had introduced a number of measures,
such as simplification of the procedure for ap-
proving capital investment applications, reduc-
tion in bank lending rates and relaxation of
terms of credit, as well as amendment of the
Priority List (DSP). Furthermore, on Novem-
ber 15, 1978, the Government introduced a
series of measures designed to improve the
competitiveness of domestically produced
goods in international as well as domestic
markets, which was expected to boost produc-
tion and capital investments. Besides, the ad-
justment of the Rupiah exchange rate vis-a-vis
foreign currencies, the above mentioned mea-
sures also included tax concessions, such as
exemption from and reduction of import du-
ties and sales tax on certain raw materials/
semi finished goods used by domestic manu-
facturing industries. On March 27, 1979, a tax
regulation was also issued, which inter alia
reduced the rates of corporation tax, capital
stamp duties and tax on interest, dividend and
royalties payable by entrepreneurs.
1. Domestic capital investment
During 1978, the Government approved
299 domestic investment projects with an in-
tended capital investment of Rp 761.8 billion.
Compared with the preceding year, the num-
ber of projects and intended capital approved
in 1978 increased by 19% and 33%, respec-
tively (see Table 36). These increases were
mainly the outcome of Government policies
as stated above, particularly those concern-
ing the simplification of the procedure for ap-
proval of investment applications as of Octo-
ber 1977, and the amendment of the Priority
List in February 1978, which provided greater
opportunities to the domestic investor.
As in the preceding years, most of the do-
mestic investment projects approved in 1978
were in manufacturing sector, namely 218
projects (73%) with an intended capital invest-
ment of Rp 531.2 billion (70%). Other sectors
which also attracted domestic investors to a
considerable extent were forestry (36 projects
2). converted on the basis of time-weighted averageexchange rates which prevailed during 1978, namelyRp 415.- per $ 1 through November 15, 1978, andRp 625,-thereafter.

87

88
involving Rp 58.5 billion) and agriculture (22
projects involving Rp 100.4 billion).
The total number of domestic capital invest-
ment projects approved by the Government
since the effectiveness of the Domestic Invest-
ment Law in July 1968 through the end of 1978
totalled 3,080 with an intended capital of Rp
3,354.4 billion. Out of this total, 2,251 projects
(73%) with an intended capital of Rp 2,232.5
billion were in manufacturing. Of the investment
projects in manufacturing, Rp 690.7 billion (31
%) were in textile industry, Rp 378.2 billion
(17%) in chemical industry, Rp 326.6 billion
(15%) in food industry and Rp 289.5 billion
(13%) in nonmetallic mineral industry.
In terms of geographic distribution of the
projects, Jakarta was the area absorbing most
of the domestic investment projects, i.e. 745
projects (24%), successively followed by West
Java with 669 projects (22%), East Java with
363 projects (12%), Central Java with 269
projects (9%), North Sumatra with 185 projects
(6%) and East Kalimantan with 152 projects
(5%). In terms of amount of intended capital
investment, however, West Java ranked first
with 26%, followed by Jakarta (20%), East Java
(14%), South Sumatra (7%), North Sumatra
(6%) and Central Java (6%).
2. Foreign capital investment
Foreign investment projects approved by the
Government in 1978 totalled 39, compared with
29 in 1977. However, as there were no projects
with a fairly large amount of capital, total intended
capital investments in 1978 were 46% lower than
in 1977 and came to $ 362.1 million (see Table 37).
Out of the total projects approved in 1978,
25 projects (63%) involving $ 202.0 million
(56%) were in manufacturing, and 7 projects
involving $ 45.6 million (13%) were in forestry.
Since the enactment of the 1967 Foreign In-
vestment Law through the end of 1978, the
Government approved 808 foreign investment
projects with a total intended capital of $
7,124.5 million. Out of this total, most of the
projects, that is 481 projects (59%) with total
intended capital of $ 4,185.2 million (59%)
were in manufacturing, while mining and for-
estry covered 13 projects with an intended
capital of $ 1,448.4 million and 86 projects with
$ 610.1 million, respectively. Within the manu-
facturing sector, the largest amount of intended
investment was in the basic metal industry,
followed by the textile industry, non-metal min-
eral industry, metal industry and chemical in-
dustry. As in the case of the geographical dis-
tribution of domestic capital investment, most
of the foreign investment projects approved by
the Government were located in the Jakarta
area, that is 308 projects (38%). Other regions
with a fairly large number of foreign investment
projects were West Java with 153 projects
(19%), East Java with 80 projects (10%), North
Sumatra with 48 project (6%), East Kalimantan
with 23 projects (3%) and Central Java with
20 projects (3%). Based on the value of in-
tended capital, West Java ranked first with
24%, followed by Jakarta (18%), Nor th
Sumatra (15%), East Kalimantan (6%) and
East Java (5%).
In aggregate terms, foreign capital invest-
ments implemented till the end of 1978
amounted to $ 3,374.7 million, compared with
$ 2,969.5 million at the end of the preceding

89

90

91
year (see Table 38). By type of industry, the
largest amount of foreign capital investment
was implemented in manufacturing, namely
65% of the total implemented foreign capital
investment, followed by mining (11 %), forestry
(8%) and services (6%).
By country of origin, Japan was the largest
investor, accounting for 36% of the total in-
tended foreign investments. Other countries
with sizable capital investments were
Hongkong, the United States and the Philip-
pines, each covering 12%, 6% and 4% of the
total intended investment. In terms of the imple-
mentation of foreign capital investments, Ja-
pan also took up the largest share, that is 38%,
followed by Hongkong (11 %), the United
States (5%), Australia (2%) and multination-
als (32%).
C. Agriculture, forestry and fishery
During the Second Five Year Development
Plan (PELITA II), the Government development
policy in the field of agriculture was primarily
designed to increase production, to expand
employment opportunities and to raise farm-
ers’ incomes. The policy also aimed at encour-
aging the growth of manufacturing industries,
particularly those which process agricultural
produce and increase foreign exchange earn-
ings.
The efforts to increase food production
continued to include intensification such as
development and use of high yielding seeds,
irradication of pests and diseases, increased
use of appropriate fertilizers, and improvement
of irrigation and cultivation techniques. Besides
these efforts, usually known as “Panca Usaha
Tani”, measures were also taken to expand the
area under cultivation (i.e. extensification). The
policy with respect to estate agriculture was
designed at increasing production through re-
habilitation of neglected plantations,
extensification of the replanted area, and in-
tensification. The policy on forestry aimed at
reforestation and greening, better control of
forest cutting, prohibition of low quality timber
exports and promotion of domestic wood pro-
cessing industries. Fishery development com-
prised modernization of sea fishcatching meth-
ods, development of fresh water fish catching
methods and expansion of fresh water fishing
grounds.
The aforementioned efforts resulted in an
increase in the output of nearly all types of
agricultural products in 1978 (see Table 39).
This was reflected in the magnitude of agri-
cultural output in GDP which increased by
7.2% in 1978 as against 1.6% in the preced-
ing year.
1. Agriculture
a. Production of foodcrops
In the reporting year, the efforts to increase
the output of foodcrops through intensification
continued through BIMAS and INMAS pro-
grams. As is well known, BIMAS is an intensi-
fication program implemented through “Panca
Usaha Tani” coupled with BIMAS credit in cash
for cost of living and purchase of high quality
seed and credit in kind, i.e. fertilizer and in-
secticide. INMAS is similar to BIMAS but only
provides for credit in kind, i.e. fertilizer and in-
secticide. Besides, extensification has been

92

93
conducted through expansion of tidal irrigated
land and the opening up of transmigration ar-
eas.
During the year under report, the area un-
der BIMAS and INMAS intensification pro-
grams for paddy increased by 4.7% and came
to 5,669 thousand hectares, while the area
under BIMAS and INMAS programs for sec-
ondary crops increased by 4.9% and came to
1,692 thousand hectares. Particularly with the
objective to promote the implementation of
BIMAS and INMAS programs, 40 BRI village
units were added which raised the total to
3,310. BRI village units were initially designed
for channeling of BIMAS/INMAS credits, but
were later also entrusted with channeling of
small credits and handling of TABANAS de-
posits.
Meanwhile, in the context of extensification,
the Government opened 87 thousand hectares
of tidal irrigated land in Riau, South Sumatra,
Jambi, West Kalimantan and South Kalimantan
in 1978/79. As a result, the area of tidal irri-
gated land was expanded to 282 thousand
hectares by the end of the Second Five Year
Development Plan.
In order to serve the farmers better, the
Government increased the quality and the to-
tal number of KUDs which were mainly en-
trusted with the allocation of agricultural input,
cost of living allowances to farmers and mar-
keting of farm output. The quality of KUDs ;vas
improved through training and guidance of their
managers. The need for operating capital was
met by soft bank loans through BRI village
units. At the end of the year under report there
were 4,427 KUDs, of which 104 were “Model
KUDs”.
In order to stimulate paddy production and
to increase farmers’ incomes, the Government
raised from February 1, 1979 the purchase
price of dried rice-in-the-husk from Rp 74.- per
kg to Rp 85.- per kg at village level and of rice
from Rp 119.50 per kg to Rp 140,per kg. The
Government concurrently rehabilitated and
added the number of rice mills and hullers to a
total of 38.4 thousand units with a capacity of
16.1 million tons at the end of 1978. The trend
in the number and capacity of rice mills and
hullers during the last five years was as fol-
lows.
a.1. Rice
Compared with the preceding year, rice
output in 1978 rose by a substantial quantity
of 1,722 thousand tons (or 10.8%) to a total of
17,598 thousand tons. This was mainly attrib-
utable to favorable weather, effective pest con-
trol, and improved intensification efforts. The
harvested area expanded by 6% and came to
8,893 thousand hectares and the average yield
per hectare increased from 1.90 tons in 1977
to 1.98 tons. The trends in output, harvested
area and average yield per hectare during the
last ten years were as follows.
In order to keep the price of paddy/ rice at
farmer’s level, higher than the floor price, the
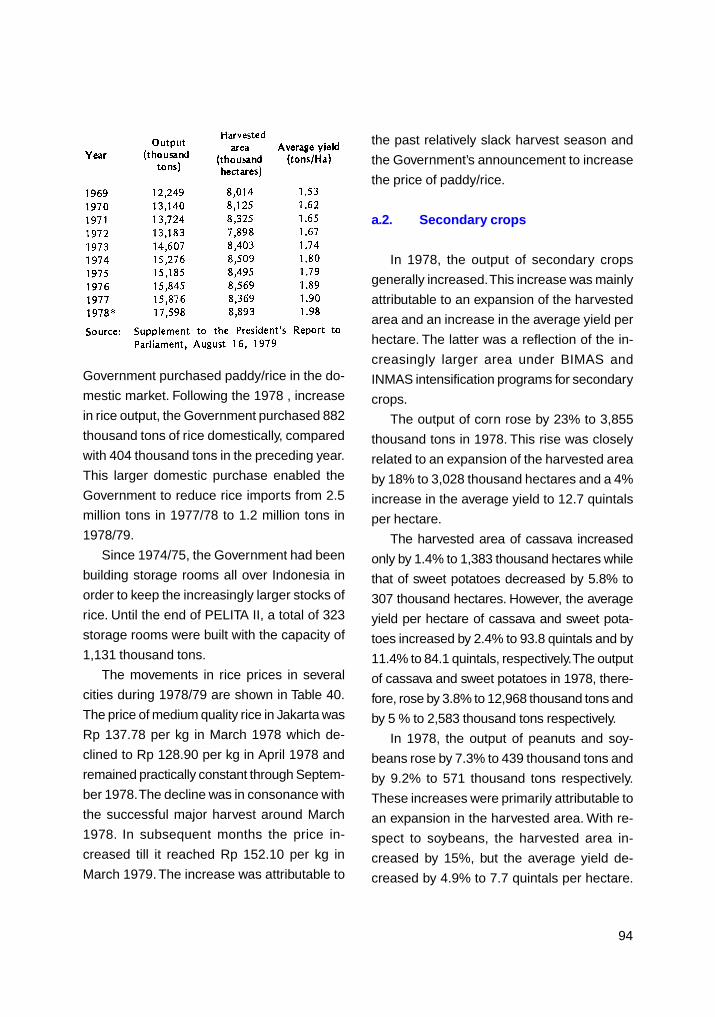
94
Government purchased paddy/rice in the do-
mestic market. Following the 1978 , increase
in rice output, the Government purchased 882
thousand tons of rice domestically, compared
with 404 thousand tons in the preceding year.
This larger domestic purchase enabled the
Government to reduce rice imports from 2.5
million tons in 1977/78 to 1.2 million tons in
1978/79.
Since 1974/75, the Government had been
building storage rooms all over Indonesia in
order to keep the increasingly larger stocks of
rice. Until the end of PELITA II, a total of 323
storage rooms were built with the capacity of
1,131 thousand tons.
The movements in rice prices in several
cities during 1978/79 are shown in Table 40.
The price of medium quality rice in Jakarta was
Rp 137.78 per kg in March 1978 which de-
clined to Rp 128.90 per kg in April 1978 and
remained practically constant through Septem-
ber 1978. The decline was in consonance with
the successful major harvest around March
1978. In subsequent months the price in-
creased till it reached Rp 152.10 per kg in
March 1979. The increase was attributable to
the past relatively slack harvest season and
the Government’s announcement to increase
the price of paddy/rice.
a.2. Secondary crops
In 1978, the output of secondary crops
generally increased. This increase was mainly
attributable to an expansion of the harvested
area and an increase in the average yield per
hectare. The latter was a reflection of the in-
creasingly larger area under BIMAS and
INMAS intensification programs for secondary
crops.
The output of corn rose by 23% to 3,855
thousand tons in 1978. This rise was closely
related to an expansion of the harvested area
by 18% to 3,028 thousand hectares and a 4%
increase in the average yield to 12.7 quintals
per hectare.
The harvested area of cassava increased
only by 1.4% to 1,383 thousand hectares while
that of sweet potatoes decreased by 5.8% to
307 thousand hectares. However, the average
yield per hectare of cassava and sweet pota-
toes increased by 2.4% to 93.8 quintals and by
11.4% to 84.1 quintals, respectively. The output
of cassava and sweet potatoes in 1978, there-
fore, rose by 3.8% to 12,968 thousand tons and
by 5 % to 2,583 thousand tons respectively.
In 1978, the output of peanuts and soy-
beans rose by 7.3% to 439 thousand tons and
by 9.2% to 571 thousand tons respectively.
These increases were primarily attributable to
an expansion in the harvested area. With re-
spect to soybeans, the harvested area in-
creased by 15%, but the average yield de-
creased by 4.9% to 7.7 quintals per hectare.

95

96

97

98
Output, harvested area and average yield per
hectare of secondary crops during the last few
years developed as shown in Table 41.
b. Plantation crops
Plantation crops play an important role as
foreign exchange earners as well as raw ma-
terial for domestic industries. In 1978, exports
of plantation crops constituted around 45% of
total non-oil exports. A large part of these crops
was produced by smallholder and the rest by
estates. In 1978, output of plantation crops
generally increased, except copra, coffee and
cloves which showed a decline.
b.1. Rubber
The major part of rubber output (about
70%) originated from smallholders. In 1978,
rubber output increased by approximately
0.7% to 844 thousand tons. The trend of rub-
ber production in the last five years was as
follows (in thousand tons).
Since the introduction of the First Five Year
Development Plan, the Government took the
necessary steps to increase rubber output
through rejuvenation of trees. With regard to
smallholders’ rubber, rejuvenation was imple-
mented through free distribution of high yield-
ing seed and application of better cultivation
techniques.
The smallholders were guided by the local
Agricultural Service and, over the last few
years, by PN Perkebunan as well. However,
due to financial constrains, the rejuvenation
efforts have not shown appreciable results, as
the total of old trees still exceed the young
trees. Rejuvenation of estate rubber trees, ini-
tiated in the past few years, was continued.
Meanwhile, the credit program to private na-
tional estates, introduced since 1976/77, was
expanded. This facility was designed for the
financing of rejuvenation efforts and rehabili-
tation of processing equipment.
In order to increase the quality of rubber,
the Government has since 1969 encouraged
the processing of smallholders rubber into
crumb rubber. Since then crumb rubber pro-
duction has been increasing, but in 1978 de-
clined by 8% to 445 thousand tons compared
with the preceding year.
The trend of crumb rubber production in
the last five years was as follows (in thousand
tons).
The major part of crumb rubber produced
consisted of SIR 20 and SIR 50. This was due
to the availability of raw material to produce
those types of crumb rubber.
In 1978/79, rubber ranked second after tim-
ber among the non-oil/LNG export commodi-
ties. The value of exports of rubber increased
by 27% to $ 774 million. The increase was at-
tributable to soaring world market prices of
rubber. This phenomenon was closely related
to the higher price of crude oil which is a raw
material for synthetic rubber production.
World production of natural and synthetic

99

100
rubber, which was 12,090 thousand tons in
1977, increased by 3% to 12,410 thousand
tons in 1978. Meanwhile, world consumption
of rubber, which was 12,160 thousand tons in
1977, increased by 2% to 12,400 thousand
tons in 1978. World rubber production and
consumption during the last 10 years is shown
in Table 42.
The above table reveals that the share of
natural rubber production in total world rubber
production was 30% in 1978 as against 35%
in 1969. This means that during the last 10
years the share of natural rubber production
in total world rubber production declined by
approximately 5%.
b.2. Copra
Copra output, mostly originating from
smallholders, did not progress satisfactorily
during the last few years. Production could not
meet the increasingly higher level of consump-
tion. Consequently the export of copra, which
used to be a major export commodity, was
gradually suspended, and in 1977 copra was
even imported. In 1978 copra output de-
creased slightly to 1,467 thousand tons com-
pared with 1,518 thousand tons in 1977, mainly
due to overaged trees. Copra output during the
last five years developed as follows (in thou-
sand tons).
In order to increase output, the Government
has been making efforts to rejuvenate coco-
nut trees by using high yielding seeds and
application of better cultivation techniques.
In the last few years, a high yielding hybrid
seed was developed to grow high yielding trees
in relatively short periods of time. Till the end
of 1978/79, a total of 4.7 million hybrid seed-
lings were distributed, originating from seed
stations in Aceh, Nias, West Java, South
Sulawesi, North Sulawesi and Lampung.
b.3. Palm oil
Among plantation crops, palm oil output has
been increasing continuously. This increase
materialized because since 1960, the Govern-

101
ment has regularly replanted and expanded
the area under cultivation with high yielding
seeds, introduced improved cultivation tech-
niques and rehabilitated factories. As a result,
palm oil production rose continuously and in-
creased by 7% to 519 thousand tons in 1978.
During the last 10 years, palm oil production
increased by nearly 200% as shown below (in
thousand tons).
In consonance with the increase in produc-
tion, the volume of palm oil exports also in-
creased continually in the preceding years.
However, in the reporting year the volume of
palm oil export declined by 6% to 413 thou-
sand tons, mainly due to a rise in domestic
demand for palm oil as raw material to pro-
duce cooking oil as a substitute for coconut
oil. Nevertheless, the export value increased
by 9% to $ 221 million, mainly on account of
an increase in the world market price of palm
oil. The average price of palm oil in the Lon-
don market quoted at $ 558.96 per long ton in
1977/78, rose by 17% to $ 655.42 per long
ton in the year under report.
b.4. Granulated sugar
The Government’s efforts to increase pro-
duction of granulated sugar was mainly chan-
neled through an intensification program for
sugar cane farmers (TRI Program), which was
also designed to increase their incomes. Be-
sides, measures were undertaken to expand
the area under sugar cane cultivation and to
increase the production capacity of the exist-
ing sugar mills. The result of these measures
is reflected in the following figures on granu-
lated sugar production (in thousand tons).
The area under the TRI Program in 1978/
79 covered a cultivated area of 77,632 hect-
ares compared with a total area under sugar
cane of approximately 200,000 hectares. The
area covered till the end of 1978 was below
the target, nevertheless it was 33% more than
the preceding year.
Although granulated sugar output in-
creased, it was still inadequate to meet the
expanding domestic demand and therefore,
sizable imports were necessary.
Granulated sugar imports in 1978/79 at 496
thousand tons were practically unchanged
compared with the preceding year.
b.5. Tea
Most of Indonesia’s tea is produced by es-
tates. The output thereof, which in the main is
black tea, increased by 15% to 71 thousand
tons, while that of green tea produced by
smallholders remained at about the same level
as of the preceding year. The increased es-
tate tea output was, inter alia, attributable to
the expansion of the area under tea cultiva-
tion and rehabilitation of the existing tea facto-
ries.
The trend of tea production during the last
few years was as follows (in thousand tons).
A large part of the production of estate tea
was exported. In the year under report tea

102
exports increased by 12% to 67 thousand tons,
but its value declined by 18% to $ 98 million
because of lower prices abroad. The average
tea price in London market for instance, which
was f 1.23 per kg in 1977/78, declined by 37%
to f 0.78 per kg in the year under report.
b.6. Coffee
Most of Indonesia’s coffee output originated
from smallholders. The volume thereof de-
clined in 1978 by 5% to 187 thousand tons.
The figures on coffee production during the
last five years are as follows (in thousand tons).
As in the case of estate tea, most of the
coffee was destined for export. In 1978/79, the
volume of coffee exports increased by 29% to
reach 231 thousand tons, but its value declined
by 19% to $ 508 million, so as to relegate its
proceeds, which ranked second in total non-oil
foreign exchange earnings in 1977/78 to the
third position. The lower earnings were closely
related to the decline of coffee price in world
markets, mainly due to the recovery of coffee
production in Brazil after having experienced
a decline in 1976.
b.7. Tobacco
Most of tobacco production originated from
smallholders, mainly in East and Central Java.
Efforts to increase production and to improve
the quality of smallholder tobacco were con-
tinued, especially through better cultivation and
processing techniques and provision of
concessional loans. Tobacco production in
1978 increased by 18% to reach 99 thousand
tons. Figures on tobacco production during the
last five years are as follows ( in thousand
tons).
Besides domestic consumption, tobacco
was exported mainly to West Germany. In
1978/79, the export volume of tobacco was at
about the same level as that in the preceding
year, i.e. 27 thousand tons, but its value de-
clined by 2% to $ 58 million.

103
b.8. Spices
About 90% of spices, such as pepper, nut-
meg and cloves, are produced by smallholders.
The production trend of these three types of
spices in the last five years was as follow (in
thousand tons).
In 1978 cloves production decreased by 41
% to 23 thousand tons. It fell short of domestic
demand, therefore necessitating imports which
amounted to 10 thousand tons in 1978 valu-
ing $ 49 million. In order to reduce imports,
the Government has continuously made efforts
to increase clove production through intensifi-
cation and extensification programs.
2. Forestry
Forestry products play an important role in
Indonesia’s economy, because, in addition to
serving needs .of raw material for domestic
industries, they rank as the largest non-oil for-
eign exchange earner. The most important for-
estry product is timber, while others meriting
specific mention are rattan, resin and copal.
Pepper production, consisting of white and
black pepper, increased by 2% to reach 44
thousand tons in 1978. Most of the output was
destined for export, whose volume increased
by 23% to 38 thousand tons in 1978, while its
value rose by only 6% to $ 66 million. The
smaller rate of increase in value relative to
volume was attributable to the declining price
of black pepper in world markets due to the
emergence of Brazil as a new pepper produc-
ing country. The average price of black pepper
in New York, for example, which was $ 1.14
per lb in 1977/78 declined by 12% to $ 1.00
per lb in 1978/79.
Nutmeg production in 1978 increased by
13% to reach 17 thousand tons. Export vol-
ume of nutmeg in that year increased by 4.4%
to 7.4 thousand tons, while its value rose by
only 2.5% to $ 11 million. This was mainly due
to the decline in the average price of nutmeg
abroad, i.e. from Sin. $ 345.0 per picul3) in 1977/
78 to Sin. $ 291.3 per picul in 1978/79. 3) 1 picul = 60.5 kg
Efforts to expand forestry produce were
continued with due regard to the conservation
of natural resources. This found expression
through control on forestry exploitation as well
as forestation and greening measures. The
results of reforestation and greening efforts
during PELITA II were as follows (in thousand
hectares).

104
Timber production in 1978 increased by
36% to reach 31,094 thousand cubic meters.
This significant increase was mainly attribut-
able to higher timber prices in domestic as well
as in international markets.
The production of timber during the last five
years was as follows (in thousand m’)
In order to develop domestic timber indus-
try, the Government has, since January 1978,
discouraged exports of logs by increasing ex-
port tax thereon from 10% to 20%, and by ex-
empting processed timber from export tax.
Besides, companies selling logs to domestic
timber processing industries were also ex-
empted from sales tax.
In 1978/79, the export volume of timber in-
creased from 15.7 million tons to 16.1 million
tons, while its value increased by 20% to reach
$ 1,130 million. Most of timber exports con-
sisted of meranti. Other types of wood which
were exported included keruing, ramin, pulai,
agathis and teak wood.
Based on Forest Exploitation Rights issued
through December 31, 1978, the number of
companies licensed to operate in forest exploi-
tation under the Domestic Capital Investment
Law as well as Foreign Capital Investment Law
totalled 382, covering an area of 36 million
hectares and an intended capital investment
of approximately $ 1.1. billion.
In 1978, exports of other forestry products,
except rattan, such as resin and copal, regis-
tered declines in volume as well as in value.
The trend of exports of these products during
the last few years was as follows.
3. Fishery
Fishery undertaking is mainly carried out
by small fishermen and fish breeders. Besides,
fishcatching is also done by fishery compa-
nies using modern equipments, which prod-
uct is mainly destined for export.
In order to increase fishery production and
to improve the standard of living of small fish-
ermen and fish breeders, the Government has
provided guidance with respect to fish cultiva-
tion and assisted in the construction of facili-
ties such as public fish auctions, hatcheries
and fish fry markets. Besides, the banking sec-
tor continuously has increased the availability

105
of credit under the Small Investment Credit and
Permanent Working Capital Credit programs.
In order to protect small fishermen and to
preserve fishery resources, the Government
has made classification of fishing boats and
made restrictions with respect to their respec-
tive area of operation.
Fishery production in 1978 increased by
5% to reach 1,655 thousand tons. The trend
of fishery production during the last five years
was as follows (in thousand tons).
In 1978, exports of fishery products in-
creased by 10% to 64 thousand tons in vol-
ume and by 18% to $ 193 million in value. Most
of it was shrimp and the main countries of des-
tination were Japan, Taiwan and South Korea.
Exports of fishery products during the last five
years is shown in the following figures.
get which was increased by 222% to Rp 58
billion. As a result of the policy measures in-
troduced in earlier years, the total number of
foreign contractors in the field of crude oil and
natural gas exploitation increased by 6 to 39,
while the total number of those engaged in the
exploitation of other mineral products in-
creased by 1 to 10.
In 1978/79, natural gas, tin and coal output
increased, while that of other mineral products
such as crude oil, copper concentrate, nickel
ore, bauxite, iron sand concentrate, gold and
silver decreased.
1. Crude oil
After a substantial increase in 1976/77 and
1977/78, crude oil output in 1978/79 declined
by 4% to 589 million barrels or 1.6 million bar-
rels per day on the average. Exploration activ-
ity, decreasing since 1976 however, increased
again in 1978. A total of 154 wells were drilled
in 1978, compared with 148 and 135 in 1976
and 1977 respectively. This increase was a
consequence of the incentives provided to for-
eign contractors operating under contracts of
work or production sharing contracts or in joint
ventures with PERTAMINA.
D. Mining
Mining maintained its important role in
Indonesia’s economy during the year under
report, both as a source of foreign exchange
and of Government revenue. The Government
therefore, continued to encourage mining ac-
tivities, as inter alia reflected in the share of
mining in the Government development bud-

106
Crude oil production during the last few
years was as follows (in million barrels).
Out of the 589 million barrels of crude oil
produced in 1978/79, 462 million barrels (78%)
were exported, while the rest was refined do-
mestically to meet the internal demand for fu-
els. As domestic refinery output could not yet
suffice domestic demand, 23 million barrels of
fuels had to be imported in the year under re-
port. The total domestic need for fuels in 1978/
79 amounted to 117 million barrels.
The domestic price of fuels in 1978/79 re-
mained practically constant, i.e. Rp 90: per li-
ter for super, Rp 70.- for avtur, avgas and pre-
mium, Rp 25.- for automotive diesel oil, Rp 22.-
for industrial diesel and fuel oil, and Rp 18: for
kerosene. As the production cost of fuels ex-
ceeded their price in 1978/79, the Government
paid Rp 197 billion as subsidy compared with
Rp 65 billion in the preceding year.
2. Natural gas
With the completion of the liquefied natural
gas (LNG) plant in Arun (Aceh) during the year
under report, there are now 2 LNG plants in
Indonesia. The first plant was constructed in
Badak (East Kalimantan) in 1977. Both plants
are able to process 1 ,130 thousand MSCF4)
of natural gas per day into 8.1 million tons of
LNG per year. Natural gas has, therefore, been
put to better use as a source of energy for
domestic and export purposes.
Meanwhile, in the year under report, con-
struction was completed of a network in West
Java to pipe natural gas to a number of facto-
ries such as Krakatau Steel, the Kujang fertil-
izer plant, the Cibinong cement plant and the
State Gas Corporation. Since then, Indonesia
had 4 networks of pipes for natural gas, i.e. in
South Sumatra, East Kalimantan, Aceh and
West Java.
In consonance with the aforementioned de-
velopments, the output and use of natural gas
in 1978 increased by 51 % and 111 %, re-
spectively.
The production and use of natural gas5)
during the last few years was as follows (in
million MSCF).
3. Tin
In the year under report, tin output in-
creased by 5% to 28 thousand tons. This in-
crease was attributable to enhanced offshore
exploration activity, among other through the
addition of a dredger with an annual capacity
of 1,500 tons of tin.
Output of tin-in-concentrate during the last
five years was as follows. (In thousand tons).
4) MSCF = Mile Standard Cubic Feet
5) The output of natural gas consists of associated gasand non associated gas. The use of natural gas isthe total volume of natural gas actually used for sev-eral purposes. Part of the natural gas output, (espe-cially associated gas), not or not yet used, was burnedlocally to prevent pollution and fires

107
Along with the increase in production, the
volume and value of tin exports also increased
in 1978/79, i.e. by 4% to 26 thousand tons and
by 28% to $ 324 million respectively. As men-
tioned in the 1977/78 report, there are currently
4 companies engaged in tin mining, namely
PT Timah, PT Koba Tin, PT Broken Hill Pro-
prietary Indonesia (PT BHPI) and Billiton
Exploratie Maatschappij Indonesia NV (BEMI
NV).
Pursuant to Act No. 1 of 1967 concerning
foreign investment, companies established
under this Act shall be incorporated under In-
donesian law. Consequently, in December
1977, BEMI NV established PT Riau Tin Min-
ing (PT RITIN) which, since March 1978, has
officially taken over all activities of BEMI NV.
In the year under report, activities of PT RITIN
were confined to preparations for exploitation.
4. Nickel
Nickel ore production in 1978/79 decreased
by 11% to 1,178 thousand tons, inter alia due
to the depletion of nickel ore reserves in the
old mining areas. Mining in new areas was not
yet undertaken because of the weak world
nickel market.
Nickel ore output during the last five years
was as follows (in thousand tons).
The aforementioned nickel ore output was
partly exported, and partly processed into ferro
nickel and nickel matte. Ferro nickel was pro-
duced by PT Aneka Tambang while nickelmatte
was produced by PT Inco.
Ferro nickel and nickel-matte production
during the last three years was as follows (in
tons)1)
Mining and processing of nickel ore on the
island of Gag by PT Nickel Indonesia, initially
expected to be completed in 1983, was de-
layed. Hopefully production would resume in
1984. Meanwhile, the Government has given
approval to PT Aneka Tambang for mining of
nickel ore on the island of Gebe (Halmahera)
in order to enable the continuation of tin ore
exports.
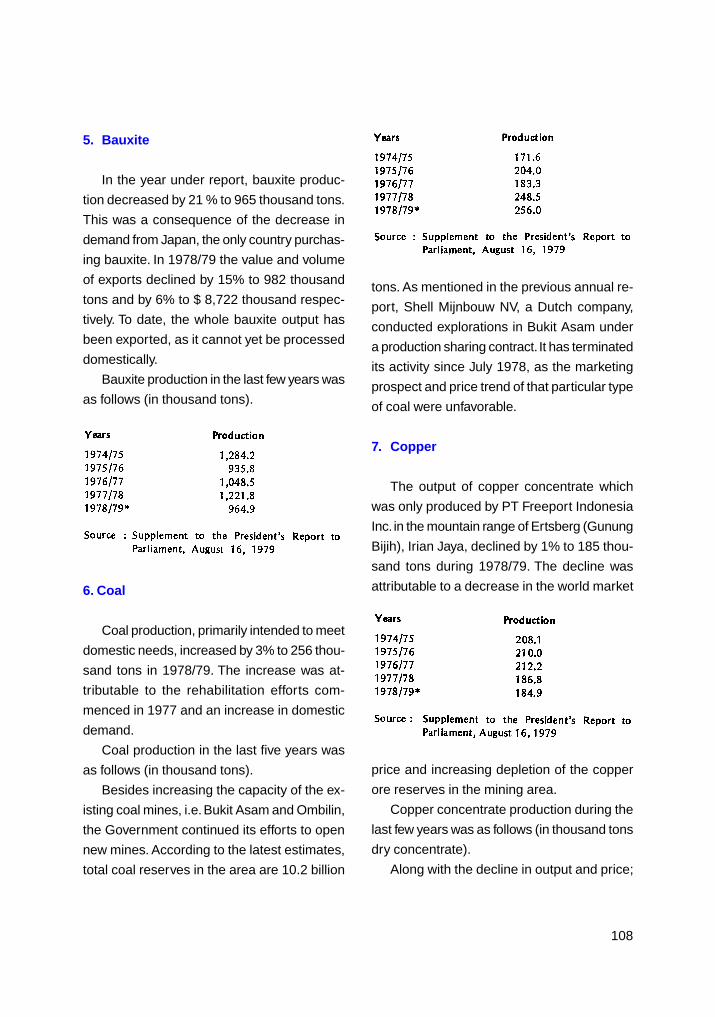
108
5. Bauxite
In the year under report, bauxite produc-
tion decreased by 21 % to 965 thousand tons.
This was a consequence of the decrease in
demand from Japan, the only country purchas-
ing bauxite. In 1978/79 the value and volume
of exports declined by 15% to 982 thousand
tons and by 6% to $ 8,722 thousand respec-
tively. To date, the whole bauxite output has
been exported, as it cannot yet be processed
domestically.
Bauxite production in the last few years was
as follows (in thousand tons).
tons. As mentioned in the previous annual re-
port, Shell Mijnbouw NV, a Dutch company,
conducted explorations in Bukit Asam under
a production sharing contract. It has terminated
its activity since July 1978, as the marketing
prospect and price trend of that particular type
of coal were unfavorable.
7. Copper
The output of copper concentrate which
was only produced by PT Freeport Indonesia
Inc. in the mountain range of Ertsberg (Gunung
Bijih), Irian Jaya, declined by 1% to 185 thou-
sand tons during 1978/79. The decline was
attributable to a decrease in the world market6. Coal
Coal production, primarily intended to meet
domestic needs, increased by 3% to 256 thou-
sand tons in 1978/79. The increase was at-
tributable to the rehabilitation efforts com-
menced in 1977 and an increase in domestic
demand.
Coal production in the last five years was
as follows (in thousand tons).
Besides increasing the capacity of the ex-
isting coal mines, i.e. Bukit Asam and Ombilin,
the Government continued its efforts to open
new mines. According to the latest estimates,
total coal reserves in the area are 10.2 billion
price and increasing depletion of the copper
ore reserves in the mining area.
Copper concentrate production during the
last few years was as follows (in thousand tons
dry concentrate).
Along with the decline in output and price;

109
the volume and value of exports also de-
creased by 11 % to 168 thousand tons and by
14% to $ 64 million respectively.
To increase production in the near future,
PT Freeport Indonesia Inc. has planned to
mine underground in the eastern area of
Ertsberg which was scheduled to commence
production in 1982. It may be added that in
September 1978, a joint venture company, PT
Coperindo Utama, has signed a contract of
work to conduct exploration in Karang
Nunggal, Tasikmalaya.
8. Iron
Production of iron concentrate, which is one
of the raw materials for steel and cement pro-
duction, declined by 62% to 120 thousand tons
in 1978/79 as exports to Japan, the only coun-
try of destination, have stopped since June
1978 because there was no agreement regard-
ing price and export volume.
Iron concentrate production in the last few
years was as follows (in thousand tons).
Due to stoppage of exports from June 1978,
the volume and value of iron concentrate ex-
ported in 1978/79 were only 67 thousand tons
valued at $ 0.6 million, compared with 219
thousand tons or $ 1.8 million in the preceding
year.
It may be noted that research is being con-
ducted for the processing of iron sand into
pellet iron in the area South of Yogyakarta. The
pellet iron so derived is planned to serve as
raw material for PT Krakatau Steel.
9. Gold and silver
Gold and silver are mined exclusively by
PT Aneka Tambang in the area of Cikotok and
Cirotan in West Java. As the declining trend in
production continued during the year under
report, gold and silver output fell by 13% to
220 kgs and by 21 % to be 2,216 kgs respec-
tively. The decline was due to the depletion of
reserves and the increasingly higher sulphide
content which made processing difficult.
The gold and silver production in the last
few years exhibited the following trend (in kgs).
Meanwhile, PT Aneka Tambang continued
exploration in search for new reserves. It was
also engaged in research to extract lead and
zinc from gold and silver ore.
E. Manufacturing industry
In the year under report, the policy with
respect to industry was still directed toward
efforts to support the agriculture sector and to
develop the construction material and textile
industry. Those efforts had gained satisfactory

110

111
results, which were reflected in the increase
of fertilizer, cement and textile production. Be-
sides, production of vehicle tires, paper and
basic metal also showed an encouraging de-
velopment (see Table 43). The aforesaid pro-
duction increase was achieved through reha-
bilitation and expansion of existing plants and
construction of new ones as well as the issu-
ance of Government’s policies with respect to
taxes, credit and foreign exchange. Those ef-
forts were also supported by the availability of
Government development budget for the
manufacturing sector which was increased by
26% to Rp 164 billion. Besides, bank credits
extended to the manufacturing sector also
showed a significant increase, so that at the
end of the reporting year it amounted to Rp
1,707 billion, compared to Rp 1,233 billion at
the end of the preceding year.
With respect to capital investment in manu-
facturing industry, an intended investment of
Rp 531 billion for 218 projects under the Do-
mestic Capital Investment Law and $ 202 mil-
lion for 25 projects under the Foreign Capital
Investment Law were approved by the Gov-
ernment in 1978.
1. Textile
To meet the increasing domestic demand
for textiles, efforts have been continuously
made since the last few years to develop the
textile industry.
Along with those developments measures have
also been taken to increase the supply of raw ma-
terials, primarily through the extension of weaving
yarn and synthetic fibre production.
One of the difficulties faced by domestic
textile industry was the competition in market-
ing vis-a-vis imported textile. To overcome this
difficulty, particularly in 1976, the Government
had introduced a number of measures, such
as import restrictions on selected items of tex-
tiles which could be produced domestically and
the imposition of higher import duties6) . With
the issuance of the November 15, 1978 mea-
sures, which strengthen the competitiveness
of the domestic products, the former measures
which were particularly designed to protect
domestic textile production were abolished.7)
Textile production in the reporting year
amounted to 1,400 million meters, i.e. 5%
higher than that in the preceding year.
Meanwhile, weaving yarn production, as
a raw material for textile production, in-
creased by 33% to 900 thousand bales in
the year under report. It should be added
that the textile export value showed an
encouraging increase to reach $ 27 mil-
lion in 1978/79 compared to $ 11 million
in the preceding year. The above men-
tioned increase in production and exports
of textile were closely related to the ef-
fects of the November 15, 1978 measures.
Textile and weaving yarn production
during the last few years were as follows.
2. Fertilizer
6) Joint Decision of three Ministers (Minister of Finance,Minister of Trade and Minister of Industry) No.314/KPB/X11/76; No. KEP1699/MK/III/ 12/1976; No.475/M/SK/12/76, December 31, 1976.
7) Joint Decision of three ministers (Minister of Finance,Minister of Trade & Cooperatives and Minister of In-dustry) No.271/KPB/X11/1978, No. 489/KMK/05/1978; No.243/M/SK/12/1978, December 13, 1978

112
In the year under report, the construction
of the Urea fer tilizer plant “Kujang” in
Cikampek, West Java, has been completed,
with an annual production capacity of 570 thou-
sand tons. With the completion of the plant,
the total production capacity of Urea fertilizer
increased by 34% to reach 2,235 thousand
tons. Meanwhile, the annual production capac-
ity of Ammonium Sulphate fertilizer remained
unchanged, that is 150 thousand tons.
Along with the additional production capac-
ity, the Urea production increased sharply from
990 thousand tons to 1,434 thousand tons in
the year under report. Ammonium Sulphate,
produced only by PT Petro Kimia in Gresik,
showed a production increase of 24% to reach
116 thousand tons.
Due to the production increases dur-
ing the last few years, the Urea produc-
tion was not only able to fulfill the domes-
tic needs, but it has also been exported.
The first export was realized in 1977, and
in the year under report it amounted to
262 thousand tons with an export value
of $ 37 million. Yet, to fulfill the domestic
needs for other kinds of fer tilizer, 180
thousand tons of TSP and Ammonium Sul-
phate were imported in 1978.
Under ASEAN cooperation, a plan has
been made to build a Urea fertilizer plant in
Aceh, with an annual production capacity of
570 thousand tons. The plant is a joint venture
of the ASEAN member countries, the shares
of which are mainly owned by Indonesia, i.e.
60%, while those owned by Malaysia, Thai-
land and the Philippines totalled 13 %, respec-
tively, and Singapore 1 %. The plant is esti-
mated to commence production in 1982. An-
other Urea fertilizer plant,i.e. Kaltim I, in East
Kalimantan, with an annual production capac-
ity of 570 thousand tons, was also under con-
struction and was estimated to be completed
in 1982.
3. Cement
In the year under report the expansion of port-
land cement plants implemented by PT Indocement
in Cibinong and PT Semen Gresik in Gresik, have
been completed, adding the production capacity
of each plant by 1 million tons. With the addition,
the total annual production capacity of cement in-
creased by 53% to 5,750 thousand tons.
The increase in the production capacity was
reflected in the cement production which increased
by 26% to reach 3,640 thousand tons in 1978/79.
The development of cement production in the last
few years is shown in the following figures (in thou-
sand tons).
Due to the increasing production, imports
of cement had been reduced, and even port-

113
land cement began to be exported in the year
under report, totalling 106 thousand tons with
an export value of $ 4.8 million. It can be stated
that in the reporting year 297 thousand tons
of cement was imported, most of which was
white cement that was not produced domesti-
cally.
4. Motor vehicle tires
In the year under report, the annual pro-
duction capacity of automobile tires has been
increased by 11 % to reach 2,766 thousand
pieces. Following the expansion in capacity,
the output of automobile tires increased by 13/
0 to 2,641 thousand pieces. Meanwhile, the
output of motorcycle tires also increased, i.e.
by 2% to 2,490 thousand pieces. The devel-
opment of tires production during the last few
years was as follows (in thousand pieces).
of 8 factories. With the additional new facto-
ries, the number of paper factories totalled 27.
Following the increase in capacity, paper
production increased significantly in the report-
ing year, i.e. by 99% to 166 thousand tons. The
development of production capacity and pa-
per output during the last few years was as
follows (in thousand tons).
Types of paper produced up to the year
preceding the year under report were mainly
writing paper, printing paper, cigarette paper,
wrapping paper and some types of cardboard.
In the year under report, some other types of
cardboard had also been produced, such as
coated multiple board, liner board, duplex
board and corrugated board.
Although paper production increased sig-
nificantly in the reporting year, it could, how-
ever, only meet about 30% of the domestic
demand. Consequently, paper imports in that
year amounted to 246 thousand tons with an
import value of $ 123.1 million, mainly con-
sisting of newsprint and wrapping paper for
cement.
6. Salt
Salt production, which is one of the nine
essential commodities, mostly originated from
5. Paper
To meet the increasing demand for paper,
the annual production capacity of paper had
been expanded during the year under report,
i.e. by a significant 127% to reach 291 thou-
sand tons. The said increase was due to the
completion of 11 new factories and expansion

114
smallholders (around 65%), especially in Cen-
tral and East Java (including Madura), while
the rest is produced by P.N. Karam. In the re-
porting year, salt production dropped sharply
from 786 thousand tons to 165 thousand tons,
due to prolonged rainy season. Nevertheless,
the domestic salt consumption could be ful-
filled by previous year’s stock.
The development of salt production during
the last few years was as follows (in thousand
tons).
tic prices of reinforcing steel, which was closely
related to the effects of the November 15, 1978
measures. Meanwhile, the production of elec-
tric/ telecommunication cord and steel wire
rose by 5% to 13 thousand tons and 14% to
112 thousand tons. Respectively, while galva-
nized iron sheet production was at about the
same level as the previous year, i.e. 185 thou-
sand tons.
It is worth noting, that in the reporting year
PT Krakatau Steel has succeeded in produc-
ing “sponge iron” and “billet”. Meanwhile, PT
Barata has completed the construction of a
steel foundry center in Surabaya, which pro-
duce i.a. grinding balls, small railway vans and
components of road rollers.
8. Machinery, factory equipment and elec-
tronic appliances
Production of machinery, factory equipment
and electronic appliances in the reporting year
showed a significant increase. Production of
agricultural equipment rose sharply, i.a. hand
tractors from 44 to 280 units, rice hullers from
830 to 2,200 units, and insecticide hand spray-
ers from 15 thousand to 24 thousand units.
Moreover, production of diesel engines rose
from 25 thousand to 30 thousand units and
sewing machine from 484 thousand to 501
thousand units. Due to the expansion of the
use of electricity and television transmission
network, output of electronic appliances gen-
erally increased. Production of television set
rose by 27% to 611 thousand units, radio re-
ceiver by 13% to 1,128 thousand units, light
bulbs/TL tubes by 17% to 29 million pieces
and refrigerators by 15% to 75 thousand units.
As it was stated in the previous annual re-
port, in addition to its function as a producer,
P.N. Karam was also assigned to maintain the
price stability of salt, mainly to protect
smallholder’s salt producers. In this context,
the floor price for small holder’s salt procure-
ment by PN Garam, which was introduced
since 1977, remained unchanged in the report-
ing year, i.e. Rp 7.-/kg for grade I and Rp 5.-/
kg for grade II.
7. Metal
Metal production in the reporting year
showed an encouraging development. Produc-
tion of reinforcing steel, which was the most
important metal product, rose by 25% to 300
thousand tons in the year under report. The
increase was mainly due to the higher domes-

115
9. Vehicles
In the year under report, production of vehicles
generally increased. Automobile production in-
creased by 18% to 99 thousand units and motor-
cycle by 18% to 320 thousand units. Meanwhile,
CASA-212 aircraft assembled by PT Nurtanio in-
creased by 9 units to 16 units, whereas BO-105
helicopters rose from 6 units to 33 units. It is worthy
to note that in the year under report, 2 CASA-212
aircrafts were exported. Production of steel ships
in the reporting year totalled 114 units (12 thou-
sand BRT) compared to 78 units (13 thousand
BRT) in the preceding year.
F. Electric power and gas
In order to increase the output and use by con-
sumers of electric power and gas, the Government
has made numerous efforts such as increasing
the production capacity and extension in the area
of distribution.
In 1978, the electric power generating capacity
of PLN (State Electricity Corporation) increased
by 18% to 2,200 MW. The additional production
capacity was mostly in East Java, i.e. 170 MW,
raising the total capacity in that region to 427 MW.
The progress of installed capacity of PLN during
the last few years was as follows (in Mega Watt) .
In line with the increasing capacity, electric
power output increased by 20% to 5,449 mil-
lion KWH. Out of the total, 13% was gener-
ated outside the framework of PLN. Electric
power generation during the last few years is
shown below (in million KWH).
Production and sales of gas by Perusahaan
Gas Negara (State Gas Corporation) in 1978
increased to 80 million cubic meters and 68
million cubic meters respectively. Production
and sales of gas during the last few years was
as follows (in million cubic meters).
Due to the completion of the construction
of gas pipelines network in West Java, the
State Gas Corporation in Jakarta has been
able to utilize natural gas produced in Cemara
oil field, West Java. The said natural gas re-
placed diesel oil which was thus far used as
raw material.

116
G. Communications
Efforts to augment the availability and use
of transportation and communication facilities
made during the previous years in land, sea
and air transportation as well as in postal and
telecommunication services were continued in
the year under report.
Due to the increase in investment and ex-
ploitation cost for the production of commu-
nication services, mainly after the introduc-
tion of the November 15, 1978 measures,
the Government took some measures in the
year under report to increase rates for cer-
tain communication services8). Charges for
highway transportation were increased by
an average of 16.7%, while for railway trans-
portation by 26.0% for passenger on main
routes and by 24.6% for certain commodi-
ties (in bulk). Charges for sea and domestic
air transportation were increased by 7.9%
and 35.0% respectively, while for postal and
giro services by 40% to 50% and telephone
services by 100% to 257%. It may be noted,
that fares for buses in certain cities, for lo-
cal railways and for the transportation of 9
essential commodit ies remained un-
changed.
The salient features of the production of ser-
vices in each communication sector during the
year under report are described below.
1. Land transportation
In order to improve land transportation ser-
vices, the capacity and the quality of roads and
bridges have been continuously improved
through a renovation program as well as the
construction of new roads and bridges. Dur-
ing the year under report, a total of 2,226 km
roads and 4,560 m bridges have been reno-
vated, besides construction of 60 km new
roads and 913 m new bridges. In aggregate
terms, 7,484 km roads and 23,683 m bridges
have been renovated and 693 km new roads
and 5,771 m new bridges have been built dur-
ing the second plan period.
Along with improvement of the above men-
tioned infrastructure , the number of land trans-
portation vehicles also showed a noteworthy
increase in 1978. Commercial vehicles, such
as buses and trucks, increased by 24% and
22% respectively, while passenger cars and
motorcycles both rose by 13%. The position
of the number of land transportation vehicles
during the last few years was as follows (in
thousands).
8) Decrees of the Minister of Communications, datedFebruary 27,1979a. No. 63/PR.303/PHB -- 79b. No. 64/PR.301/PHB - 79c. No. 65/PR.301/PHB - 79d. No. 66/PR.304/PHB - 79e. No. 67/PR.304/PHB -- 79f. No. 68/PR.302/PHB - 79
With respect to railway transportation, ef-
forts were continued to recondition and to aug-
ment the availability of facilities during the pre-
ceding year. In addition, efforts have been

117
made to improve the services and the opera-
tion schedules of passenger and goods trains,
particularly for medium and long distance
transportation to maintain the balance between
railway and highway transportation systems.
The above mentioned efforts have resulted in
increased turnover of railway transportation
services. In 1978, passengers and cargo car-
ried increased by 24% to 26,001 thousand
passengers and by 19% to 4,744 thousand
tons respectively. The position of railway trans-
portation during the last few years was as fol-
lows.
2. Sea transportation
Maritime services have mainly been pro-
vided by the national merchant fleet, pioneer
sailings and the ocean going fleet in accor-
dance with the needs of an archipelago. Com-
pared with the preceding year, the number of
vessels, capacity and cargo transportation of
the national merchant fleet in 1978 did not
show a significant change, as may be seen
from the following figures.
Pioneer sailings continued to receive attention,
mainly to facilitate transportation among isolated
regions which were generally unattractive for ship-
ping companies. Regions served by the pioneer
sailings were the west coast of Sumatra, Riau is-
lands, West and East Nusa Tenggara, the coast of
North, South and Central Sulawesi, Maluku and
Irian Jaya. The number of vessels operated and
cargo transported by the pioneer sailings during
the last five years was as follows.
As auxiliary to land transportation, mea-
sures had also been taken to improve river,
lake and ferry transportation, with emphasis
on the construction of supporting networks
overheads, such as piers and terminals, and
the provision of ferry boats, water-buses and
river beacons. The trend in river, lake and ferry
transportation is reflected by the following fig-
ures.

118
The number of vessels operated by the
ocean going fleet decreased from 54 to 52 in
1978, but the capacity increased from 491
thousand DWT to 513 thousand DWT. This in-
crease was due to the replacement of vessels
of a higher capacity. However, the volume of
cargo transported by ocean going fleet during
1978 decreased by 5% to 5,635 thousand tons.
The development of the ocean going fleet and
services provided during the last few years
were as follows.
The number of airplanes operated by
scheduled airlines, served by 6 companies,
increased from 114 in 1977 to 119 in 1978.
The air transportation fleet during the last few
years progressed as follows.
3. Air transportation
In an effort to establish an integrated na-
tional air transportation, the Government trans-
ferred in 1978 the management of the
Government’s capital invested in PT Merpati
Nusantara Airlines (MNA) to PT Garuda Indo-
nesian Airways (GARUDA) 9). Accordingly,
MNA became an affiliated company of
GARUDA, and inter alia assured charge of pio-
neer air transportation, transportation of
transmigrants and chartered flights for tour-
ists.
9) Government Regulation No.30/1978, October 26,1978.
Along with the development of the air
transpor tation fleet, effor ts have been
continuously made to gradually increase
the capacity of the airports. Among exist-
ing airports, 4 have landing capability for
DC-10 airplanes, 7 for DC-8, 14 for DC-9
and 35 for F28 airplanes. With improved
capacity of the airports, all provincial capi-
tal cities, except Palangkaraya in Central
Kalimantan, are presently connected by
jet airplanes. Moreover, attention was also
being paid to the improvement of airports
for non-jet airplanes, mainly for pioneer
air transpor tation.
The above mentioned efforts resulted in a
significant increase in the output of domestic
as well as international air transportation ser-
vices. Passengers and cargo carried on do-
mestic flights increased by 18% and 9% re-
spectively, while those carried on international
flights increased by 10% and 8% respectively.
The progress of air transportation services
during the last few years was as follows.

119
4. Postal and giro services
In order to provide extension in services to
the public, an additional 74 post offices have
been built during 1978, thereby increasing the
number to 1,351. Besides, a number of mo-
bile postal units played an important role. As a
result, the performance of postal and giro ser-
vices showed a significant improvement in
1978. Postal deliveries, drafts, giro & cheques,
and parcels increased by 6%, 14%, 27% and
8% respectively.
Postal and giro services also assisted Bank
Tabungan Negara (State Savings Bank) in its
operations to promote public savings under the
TABANAS and TASKA schemes. In 1978, to-
tal savings mobilized by Post and Giro offices
increased by a significant 45% to reach Rp 16
billion. Postal and giro services during the last
few years were as follows.
5. Telecommunication
Progress in telecommunication services
showed a gratifying result from year to year
as was reflected in the increasing capacity of
the telephone and telex services. In 1978, the
telephone capacity increased significantly by
46% to 477 thousand subscribers, which was

120
made possible by the use of the PALAPA Do-
mestic Satellite Communication System, in
addition to other telecommunication systems,
such as the microwave transmission network
and the tropos catter system. The number of
telephone exchanges and their capacity de-
veloped as follows during the last few years.
The above mentioned progress had in-
creased telecommunication services as was
reflected in the extension of the use of Long Dis-
tance Direct Connections (SLJJ). In 1978, SLJJ
was extended to several cities, including Bogor,
Karawang, Banda Aceh and Bukittinggi, thus
making the number of cities included in the SLJJ
network a total of 32 cities at the end of 1978.
In order to take extensive advantage of the
PALAPA Domestic Satellite Communication
System, the possibility of cooperation with
some ASEAN member countries, i.e. the Phil-
ippines, Malaysia and Thailand was explored.
The probable use of a submarine cable com-
munication system (SKKL) jointly with Malay-
sia for communications between Medan and
Penang was also investigated.
6. Tourism
Efforts to expand the tourist trade were
continued through propagation of tourism pro-
motion abroad and the development of tourist
attractions in Indonesia. In addition to the tour-
ism promotion centers already existing in
Frankfurt, San Francisco and Tokyo, a new one
was established in February 1979 at Singapore
to serve the ASEAN region. Besides, efforts
to advertise Indonesia’s tourist attractions
abroad were also made through international
tourism exhibitions.
The development of tourism has also been
supported by the improvement of transporta-
tion services during the last few years and the
rendering of better services to foreign tourists
through speeding up the issuance of visas and
related formalities.
Attention has also been given to accom-
modation facilities, which showed an increase
from 54,776 rooms in 1977 to 59,223 rooms
in 1978, mostly in Java & Bali (39.802 rooms)
and in Sumatra (3,803 rooms). The number of
foreign tourists visiting Indonesia during the
last few years is shown by the following fig-
ures (in thousands).
The figures above show that the number
of foreign tourists increased from 486.8 thou-
sands in 1977 to 488.6 thousands in 1978.
Based on an estimated average length of stay
of 5 days and a daily expenditure of $ 35,- per
tourist, foreign exchange earnings from tour-
ism were estimated at $ 86 million.
H. Prices
The trend in prices usually measured by
the Jakarta Cost of Living Index, showed an
increase of 11.9% in 1978/79, compared with
the rise of 10.1% in the preceding year. The
higher increase in the year under report pri-
marily reflected the effect of the Rupiah ex-

121

122

123

124
change rate adjustment made on November
15, 1978. Till the end of October 1978, prices
showed a gentle rise, that is only 2.4% com-
pared with 6.7% during the same period in the
preceding year. Due to the price adjustments
following the November 15, 1978 measures,
the rate of inflation of 9.3% during the period
from November 1978 through March 1979
tended to be steep (see Table 44).
The increase in the Cost of Living Index in
1978/79 was particularly marked in the Cloth-
ing and Miscellaneous components, which
registered rises of 16.0% and 19.7% respec-
tively. In contrast, the Food index increased by
10.2% (compared with 10.6% in 1977/78),
which was attributable to higher prices of food-
stuffs, except rice. Despite its decision to in-
crease the floor price of domestically procured
rice by 13.0%, the Government managed to
keep the rice price stable. This success was
achieved through the availability of an ad-
equate supply of rice, on account of an in-
crease in domestic rice production. The price
index for Housing did not show a significant
increase, that is only 3.0%, due to, among oth-
ers, the stable price of kerosene and electric-
ity.
The relative price stability during 1978/79
can also be gauged from the movement of the
price index of 9 essential commodities, which
rose by only 3.1%, compared with 4.4% in
1977/78 (see Table 45). The subdued increase
during the year under report was mainly at-
tributable to the 0.3% decline in the price of
rice, coupled with increases in the prices of
some other commodities, such as cooking oil
(16.0%), textiles (15.8%), granulated sugar
(13.5%) and batiks (11.4%). With the excep-
tion of cooking oil, the increase in other prices
occurred almost entirely after the adoption of
the November 15, 1978 measures.
The domestic price of certain export com-
modities of Indonesia generally increased dur-
ing the year under report (see Table 46). Price
increases before November 1978 were closely
related to spurts in world market prices,
whereas those occurring thereafter particularly
reflected the result of the Rupiah exchange
rate adjustment. The average domestic rub-
ber price of RSSI increased significantly in
1978/79, that is by 47.9% to reach Rp 430.42
per kg. Besides the boost provided by the
Rupiah exchange rate adjustment, the in-
crease was also caused by a 28.2% rise in
the world rubber prices, resulting from, among
others, the expansion in the demand of indus-
trial countries for natural rubber due to the in-
creasing production cost of synthetic rubber.
In contrast with the preceding year, the
average coffee price (Robusta) in Jakarta de-
creased by 21.8% to Rp908.41 per kg in 1978/
79. This price development followed the 35.5%
decrease in the world average coffee prices
mainly attributable to the recovery of Brazil’s
coffee output.
Due to the increase in output of some pro-
ducing countries, the world tea supply also
expanded, resulting in a price decline. In the
London market, the price of BOP tea declined
by 36.6% to £ 0.78 per kg. This price develop-
ment adversely affected the domestic tea price
in Jakarta, which registered a decrease of
13.5% to Rp 626.14 per kg for BOP tea.
The average domestic price of white pep-
per recorded an increase of 8.1 % to reach
Rp 983.55 per kg in 1978/79. This increase

125
was particularly the outcome of the Novem-
ber 15, 1978 measures, since prices in the
world market did not show any significant
change. However, the average price of black
pepper declined by 14.0% to Rp 564.54 per
kg, in line with the 11.9% decrease to $ 1.00
per kg in the world market.
I. Wages and salaries
The average rate of wage and salary for
workers (with wife and 2 children) paid by en-
terprises engaged in various economic activi-
ties, serves as an indicator to monitor changes
in wages and salaries in Indonesia. On the
basis there of, the average minimum and maxi-
mum wages at the end of 1978 increased by
14% and 12% respectively compared with that
in 1977. Since the cost of living index only rose
by 6.7% during the same period, it can be con-
cluded that their real income did rise.
The monthly rates of minimum and maxi-
mum wages paid by enterprises to workers
engaged in various economic activities at the
end of 1977 and 1978 were as follows (in Ru-
piahs).
As mentioned in the 1977/78 annual re-
port, the Government, within the scheme of mini-
mum wage regulations still directed its efforts
on the stipulation of minimum wages for spe-
cific economic sectors in certain regions due to
the price differences therein. For this purpose,
the Regional Wage Councils, which have been
established by the Government in 22 provinces,
have to make studies on minimum wage levels
considered reasonable for their respective re-
gions and recommend their assessments to the
Central Government for approval.
J. Manpower
Based on the figures of the Intercensal Popula-
tion Survey conducted in 1976, population growth
in Indonesia was estimated at annual rate of 2.0%,
compared with 2.3% obtained from the data of the
1971 census.10) On the basis thereof, the labor force
in 1978 was projected at 54.8 million people.
In view of the growing labor force and the inad-
equacy of employment opportunities, the creation
of employment opportunities had become a seri-
ous matter, which need adequate attention. In this
connection, the Government’s policy still places
emphasis on measures to implement and stimu-
late labor intensive development activities, such as
the construction of infrastructures and regional
development projects as well as the development
of smallscale industries and handicrafts. These ef-
forts were also supported by investment and credit
policies such as Small Investment Credits (KIK)
and Permanent Working Capital Credits (KMKP),
Candak Kulak and Mini Credits.
10) As a result, the population of Indonesia in 1978.

126
Besides expansion of employment oppor-
tunities, the Government’s policy also gave
weightage to the regional distribution of the
labor force which was projected at 136.6 mil-
lion people would be realized through the trans-
migration program and the dispersion of in-
vestment projects to regions outside Java.
It may be added that on the basis of the
results of the above mentioned Intercensal
Population Survey, the employment distribu-
tion in 1976 was 66.0% in the agricultural sec-
tor, 25.1 in the services sector, 6.7% in the
manufacturing sector, 2.1 % in construction
and 0.1 % in mining sector.
K. Transmigration
In line with the Second Five Year Develop-
ment Plan strategy, which gave priority to the
development of the agricultural sector, the
transmigration policy was also directed to-
wards efforts to increase the production of
foodcrops and agricultural export commodities.
To support the said policy, the implementation
of transmigration programs had been con-
nected to various development activities, such
as the construction of roads, irrigation facili-
ties and the extensification of smallholding es-
tates.
The target for transmigration program dur-
ing the Second Plan period was set at 250.0
thousand families. Only 57.9 thousand fami-
lies, covering 254.2 thousand people, had been
transmigrated, of which 2.4 thousand families
covering 10.5 thousand people moved in the
year under report. It may be added that the
dispersion of transmigrants during the Second
Plan period was 57% in Sumatra, 24% in
Sulawesi, 18% in Kalimantan, and the remain-
der in Maluku and Irian Jaya.
The failure to meet the transmigration tar-
get during the Second Plan period was attrib-
utable, inter alia, to obstacles in preparing re-
settlement areas, which were closely related
to coordinative problems. To overcome these
problems the Government has established a
Transmigration Coordinating Board (Badan
Koordinasi Penyelenggaraan Transmigrasi)11),
whose membership consists of ministers of
several Departments; the Board is chaired by
the Minister of Manpower and Transmigration.
The main job of the Board is to assist the Min-
ister of Manpower and Transmigration in for-
mulating integrated transmigration programs
and coordinating the implementation thereof.
The progress of the implementation of trans-
migration program during the last few years is
shown in Table 47.
11) Presidential Decree No.26/1978, August 31,1978.

127

APPENDICES

129
APPENDIX A

130

131
APPENDIX B
MANAGEMENT OF BANK INDONESIA
As per March 31, 1979
Government Commissioner : Soegiono
BOARD OF MANAGING DIRECTORS
Governor : Rachmat Saleh
Managing Director : Marathon Wirija Mihardja
Managing Director : Soeksmono Besar Martokoesoemo
Managing Director : Arifin Mohamad Siregar
Managing Director : Durmawel Ahmad
Managing Director : J.E. Ismael
Managing Director : M. Djoko Soedomo
Managing Director : Kamardy Arief

132
GENERAL MANAGERS
Office of the Board : Soetomo Administration and
Administration and
Organization Department : R. Soejatno Soemardjo
Budget Department : P. Siregar
Foreign Exchange Department : W. Kidarsa
Economics and Statistics
Department : R. Paryono
Legal Department : Darmadji Hardjakusumah
International Department : T.M. Zahirsjah
General Services Department : A. Nelwan
Money and Capital Market
Department : Sutadi
Loan Department : R. Djamu Achmad
Bank Supervision Department : Abdullah Ali
Internal Control Department : Lulu Prawira Subrata
Issue Department : Nandang Komar
Credit Planning and Credit
Supervision Department : Sidharta S.P. Soerjadi
Personnel Department : H.P. Toar
REPRESENTATIVES
Kuala Lumpur and Singapore : Muljana Wiraatmadja
London : Marjanto Danusaputro
New York : Achmad Effendie
Tokyo : Eddy Suwardi
133
BRANCH MANAGERS
Ambon : Azwahin
Banda Aceh : Sugiono
Bandung : Suparto Wignyasubrata
Banjarmasin : Tom Hartono
Bengkulu : R. Husni Djojoseputro
Cirebon : Sutedja Trisnaatmadja
Denpasar : Saenan Soesanto
Jambi : Soetrisno
Jayapura : A.A. Ngurah Alit Mahawan
J ember : Kamaruddin
Kediri : Purtomo
Kendari : Thamrin Soerawisastra
Kupang : Usman Sugiarto
Malang : R. Poewarso Djoko Joewono
Mataram : Mohamad Zain Sidin
Medan : Mahfud Jakile
Menado : Ph. K. I ntama
Padang : R. Suyatno
Palembang : A. Sulaeman Gandabrata
Palu : R. Saptadi Baroto
Pekanbaru : R. Soetrisno
Pontianak : Muchtar Abdullah
Samarinda : Sofjan Lumad
Semarang : Bambang Susilo
Solo : Sahruddin Siata
Surabaya : R. Sujanto
Telukbetung : Abdul Kadir Hadi
Ujung Pandang : Ahmad Sirod
Yogyakarta : Isbianto Poerwodinoto
CASH OFFICE MANAGERS
Balikpapan : Samidjo
Lhokseumawe : M. Junus Abdurachman
Pematang Siantar : Purwoko
Purwokerto : Judjono Gandasubrata
Sibolga : Jatno Soesilarto
Tasikmalaya : Afnan
Tegal : Aibar Durin
Ternate : R. Muhammad Komar
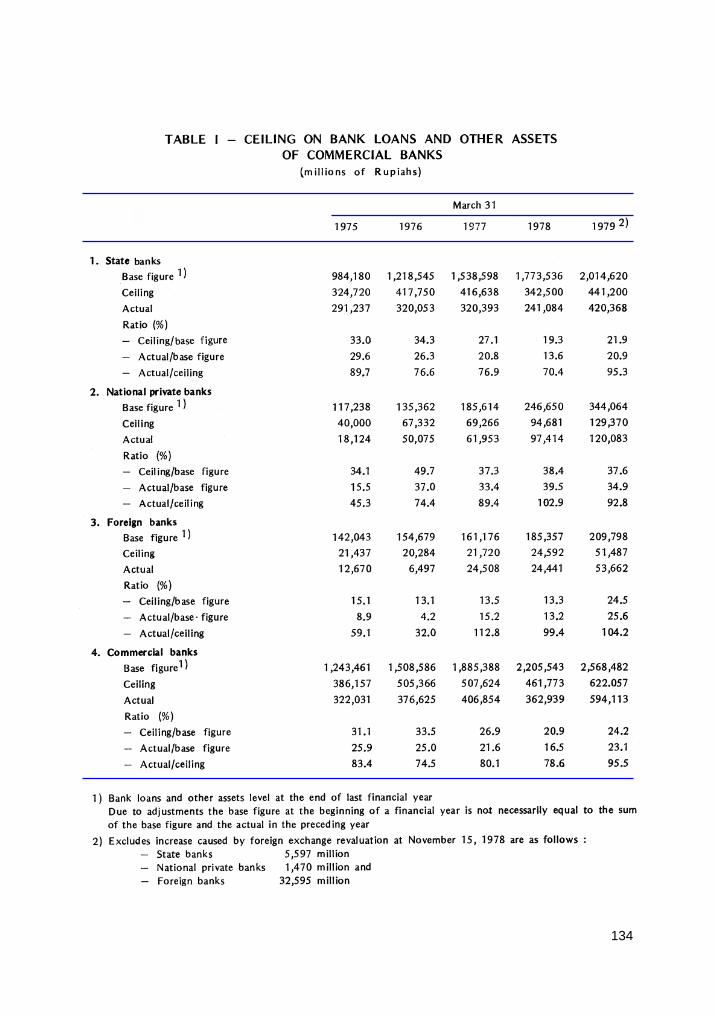
134
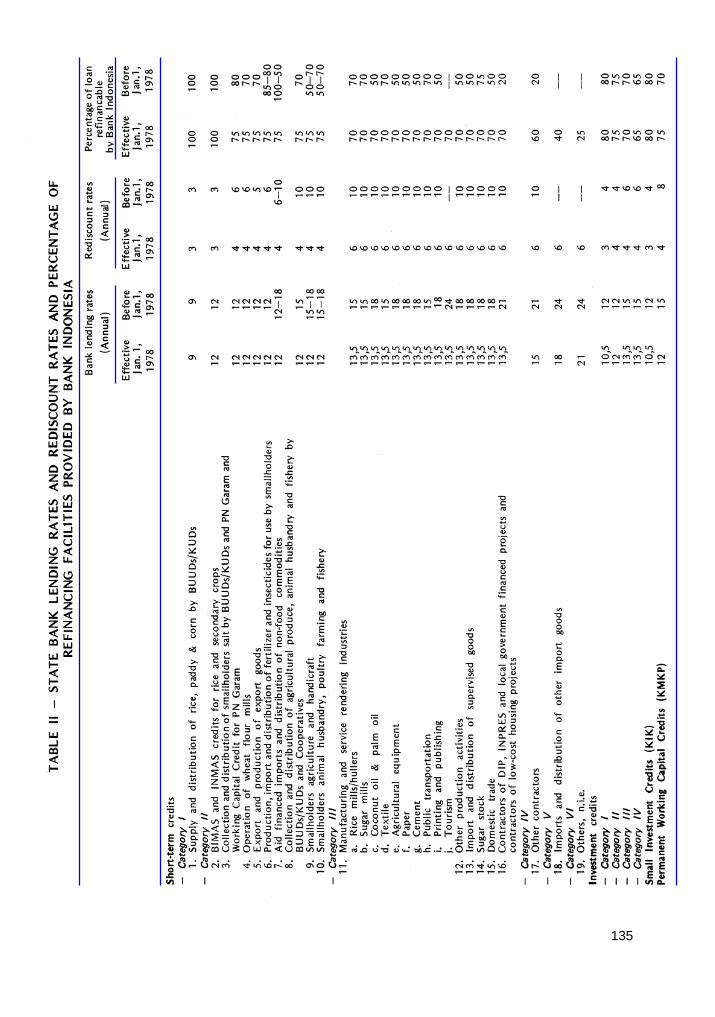
135

136

137

138

139
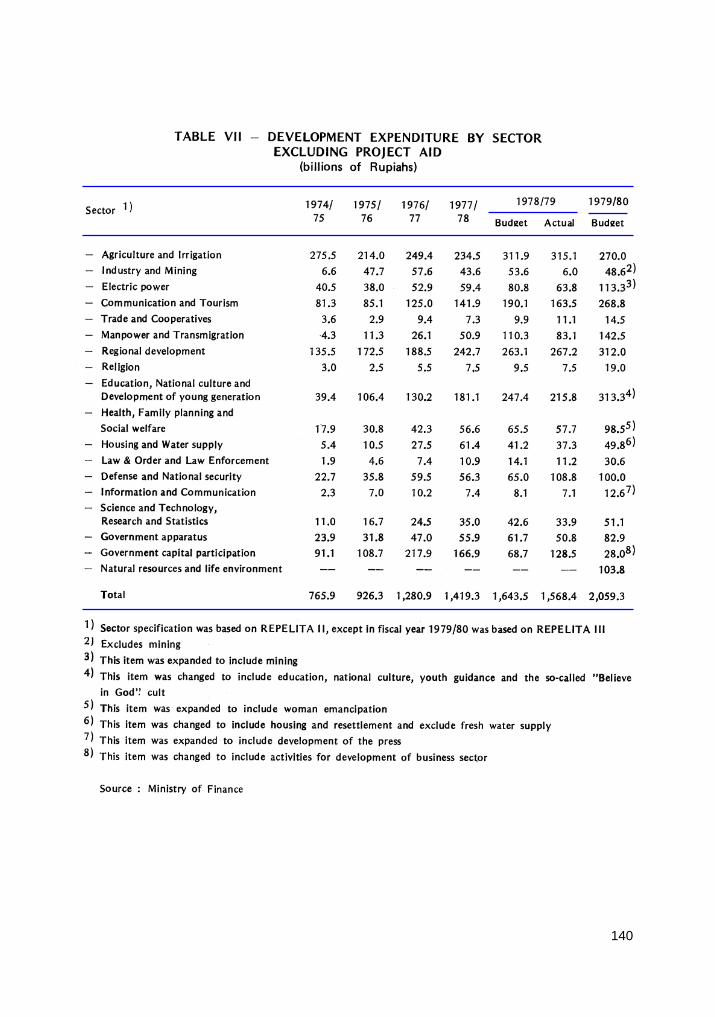
140

141

142

143

144

145

146

147

148

149

150