Embed Size (px)
Citation preview
BANGLADESH SKILLS SNAPSHOT 2012
Funded by the Swiss Agency for Developmentand Cooperation SDC and managed by the ILO TVET Reform Project.
National Skills Survey Phase 1

BangladeshSkills
Snapshot 2012
Funded by the Swiss Agency for Developmentand Cooperation SDC and managed by the
ILO TVET Reform Project.
National Skills Survey Phase 1

1. FOREWORD
Whilst the report herein addresses each of these four objectives, the following key issues should be noted;
Delayed establishment of NSDC Secretariat: The NSDC Secretariat was not physically established until 2012, and at the time of this report, is developing its capacity for skills supply and demand data collection and analysis. This NSS Phase 1 was thus a driving force in beginning the processes within the Secretariat, but there were some significant delays during the process.
Capacity within contributing organizations: Industry Skills Councils (ISCs) and some key industry representative groups are, with few exceptions, embryonic. This survey also provided the impetus for many ISCs to not only coordinate their collective skills demands but to recognize and codify these demands. Success in developing the ISCs for this purpose has been moderate, and strenuous efforts continue to develop industry’s leading role in skill development in Bangladesh. Attempts were made to involve the nine existing ISCs in providing supply data, resulting in the survey concentrating on those nine industry sectors.
Lack of initial data: Whilst key government agencies do collect more extensive data on skills supply, much of it is incomplete and incompatible, resulting in a less than comprehensive picture of skills supply being available. Due in part to the NSS Phase 1, that government is taking a more coordinated and homogeneous approach to recording skills supply in the country.
Whilst the limited capacity of agencies to collect and analyse data was recognised before the NSS Phase 1, the survey has provided the impetus for agencies, especially the NSDC Secretariat and the Bangladesh Technical Education Board, to begin implementing new, more comprehensive, data systems.
Overall there were difficulties faced by the NSS Phase 1 process. However, any limitations to the size and scope of the survey are easily outweighed by the development of the agencies involved and the begin-ning of a more accurate picture of skills supply and demand in Bangladesh. Improved information and data of this type will support further development of an industry led TVET system based on industry com-petency standards and the new National Qualifica-tions Framework to specifically target actual skills in demand. Along with this, the use of ISCO (and BISCO) occupational codes will assist TVET practitioners to focus on employment outcomes for learners and more closely align individual courses and qualifica-tions with specific occupations and jobs. All these factors will be reflected in the new TVET data collec-tion and analysis systems currently being developed. More importantly, the use of NTVQF, recognized com-petency standards and employment codes will help industry to identify and codify their own needs in a standard way and in a way that government can respond to their immediate and future needs.
The National Skills Survey (NSS) Phase 1 was commissioned on behalf of the National Skills Development Council Secretariat funded by the Swiss Development Corporation (SDC).
The NSS was funded by SDC as part of its support to the National Skills Development Council (NSDC) to:
• Coordinate data collection, analyse supply demand gaps and develop a national summary of the supply and demand for skills;• Work with key industry bodies to collect demand side data on skills and occupations in demand in the medium and long term;• Work with key government agencies to collect supply side data on the nature and scope of skills supply in the medium and long term; and• Build the capacity of key organisations with key data roles for the future operation of the National Skills Data System.
P-01
FOREWORD
The report itself consists of two separate reports which were produced through two parallel processes:
The first process was the extensive and time consum-ing process of developing and engaging ISCs to participate in the survey and the on-going collection and data analysis process. As stated above, this process was limited to the nine sectors capable of participating and was also limited in the ability of those ISCs to accurately recognise their sector’s own skill needs. It interrogated existing government data knowing that some of this data was incomplete. It is therefore a “bottom-to-top” mainly qualitative approach that has moderate immediate validity but in the long term, will provide the most useful and valid information on skills demand.
The second process took an econometric approach, taking statistical data where it was available and drawing empirical conclusions based on logical assumptions. Whilst this approach is more traditional, conclusions were cross-referenced with the results of the ISC led approach above to validate the data where possible and thus overcome previous industry criticisms of the econometric approach as being disconnected with the realities of the workplace.
In conclusion, whilst the shortcomings of this first NSS must be acknowledged, it should also be recog-nised as an important first step by the NSDC to better understand the dynamics and key issues with the supply and demand of skills in Bangladesh.
P-02
Dr. Kamal Abdul Naser ChowdhuryCo-Chair, Executive Council,National Skills Development Council (NSDC)Secretary, Ministry of Education
Salauddin Kasem KhanCo-Chair, Executive Council,
National Skills Development Council (NSDC)Chairman, Chittagong Skills Development Centre
FOREWORD
2. TABLE OF CONTENT
1 FOREWORD 01
2 TABLE OF CONTENT 03
3 LIST OF TABLES 06
4 LIST OF BOXES 07
5 LIST OF FIGURES 07
5 LIST OF ACRONYMS 08
7 EXECUTIVE SUMMARY
8 SKILLS SNAPSHOT PART I: SUPPLY AND DEMAND
8.1 SCOPE OF THE SURVEY 14
8.2 OBJECTIVES 15
8.3 METHODOLOGY 15
8.4 ACTIVITIES 15
8.5 DATA COLLECTION 16
8.6 DATA ANALYSIS 16
8.7 DEMAND DATA FROM INDUSTRIES/ORGANIZATIONS 17
8.7.1 Employed workforce background 19
8.7.2 Education level achieved 19
8.7.3 Training received 20
8.7.4 Experience acquired 20
8.7.5 NTVQF levels self-classification 21
8.8 FOCUS GROUP DISCUSSIONS - RATIONALE 22
8.8.1 Step 1 Discussions – Methods and criteria used for selection and recruitment of skilled workers 22
8.8.2 Step 2 Discussions – Reviewing Step 1 discussions and looking forward 25
8.9 MANPOWER EXPORT DATA 26
8.9.1 Exported manpower and classification 26
8.9.2 Overseas employment trends 27
8.9.3 Category wise overseas employment and remittances 28
8.10 TRENDS OF ENROLMENT IN FORMAL COURSES AFFILIATED BY BTEB 28
8.10.1 Analysis of enrolment trends in TVET courses 28
8.10.2 Trends of the BTEB formal examination results 29
8.10.3 Capacity and enrollment gap of BTEB-affiliated courses 30
8.10.4 Staff capacity in the public TVET institutions 32
8.11 NON-FORMAL PUBLIC AND PRIVATE/NGO TVET PROVIDERS DATA 34
8.11.1 Summary of data collected from the public and private/NGO providers 34
P-03
TABLE OF CONTENT
8.11.2 Analysis of the public providers’ data 35
8.11.3 Analysis of the private/NGO providers data 36
8.12 DEMAND SUPPLY RATIO AND GAP ANALYSIS 37
8.12.1 Demand supply analysis and gap analysis for skilled workforce 37
8.12.2 Matching of the demand supply data 37
8.12.3 Research findings and demand supply ratio of skilled workforce 39
8.12.4 Establishing the demand/supply ratio of skilled workers in Bangladesh 40
8.12.5 Establishing workforce demand supply analysis and gap analysis mechanism 41
8.12.6 SHARING OF SURVEY FINDINGS WITH STAKEHOLDERS 42
8.12.7 RECOMMENDATIONS 42
9 SKILLS SNAPSHOT PART II: QUANTITATIVE ASSESSMENT OF SKILL DEMAND AND SKILL GAP 45
9.1 BACKGROUND AND OBJECTIVES 46
9.2 SCOPE AND ORGANIZATION OF THE PAPER 46
9.3 SKILL GAP: QUANTITATIVE ASSESSMENT AT AGGREGATE LEVEL 47
9.4 UNEMPLOYMENT RATE AND LFPR AMONG THOSE WITH VOCATIONAL/TECHNICAL TRAINING 48
9.5 INDIRECT ASSESSMENT OF WHETHER TECHNICAL/VOCATIONAL TRAINING IS IN EXCESS SUPPLY 48
9.6 SECTORAL DEMAND STRUCTURE FOR SKILLED LABOUR FORCE: CURRENT SITUATION AND FUTURE PROJECTIONS 50
9.7 CURRENT STRUCTURE OF SKILL OF WORKERS IN DIFFERENT SECTORS 50
9.7.1 Skill Demand 52
9.7.2 Skill Demand: Ready made Garmnets Sector 53
9.7.3 Skill Demand: IT sector 54
9.7.4 Skill Demand: Leather sector 54
9.7.5 Skill Demand: food processing sector 55
9.7.6 Skill Demand: construction and tourism 55
9.8 THE SUPPLY SIDE 56
9.9 EMPLOYERS’ VIEWS AND QUALITATIVE ASSESSMENTS OF SKILL GAP 59
9.10 NATIONAL SKILLS DATA SYSTEM PLAN 62
9.10.1 Demand Side 62
9.10.2 Supply Side 62
9.10.3 Institutional issues related to skill-data base creation 63
9.10.4 Future priority for applied research on demand-supply matching of skills 63
9.10.5 Use of skills data 63
P-04
TABLE OF CONTENT
9.11 CONCLUDING OBSERVATIONS AND POLICY RECOMMENDATIONS 64
9.11.1 Recommendation 1: Macro policies for industrialization and linking with skill 65
9.11.2 Recommendation 2: Policies for regionally dispersed industrialization and skill training 65
9.11.3 Recommendation 3: Assess-Find-Train-Employ-Retrain (AFTER) Scheme 65
9.11.4 Recommendation 4: Skill development geared to NTVQF 66
9.11.5 Recommendation 5: Institutional aspects 67
9.11.6 Recommendation 6: Training for overseas employment 67
9.11.7 Recommendation 7: Equity issues 67
9.11.8 Recommendation 8: Gender equity in TVET: creation of supply and matching demand 68
9.12 REFERENCES 69
10 ANNEXURES 71
ANNEX 1: LIST OF NINE SELECTED SECTORS AND 35 SELECTED JOBS 72
ANNEX 2: SKILLS CONTENT OF SELECTED JOBS 73
ANNEX 3: LIST OF RESEARCH ASSOCIATES, ISC REPRESENTATIVES AND DATA COLLECTORS 92
ANNEX 4: QUESTIONNAIRE OF INDUSTRY DATA COLLECTION AND NTVQF LEVEL WITH DESCRIPTORS 94
ANNEX 5: SECTOR AND JOB WISE RESPONDENT NUMBERS WITH GEOGRAPHICAL MAP 101
ANNEX 6: PROJECTION OF UNCLASSIFIED SKILLED WORKFORCE FOR 2013 TO 2015 103
ANNEX 7: EMPLOYED WORKFORCE EDUCATION LEVELS OF NINE SECTORS 105
ANNEX 8: TRAINING OF SKILLED WORKFORCE OF NINE SECTORS 106
ANNEX 9: EXPERIENCE ACQUIRED BY SKILLED WORKFORCE OF NINE SECTORS 107
ANNEX 10: NTVQF LEVEL SELF-CLASSIFICATION OF SKILLED WORKFORCE OF NINE SECTORS 108
ANNEX 11: SAMPLE OF 15 SELF-CLASSIFIED SKILLED WORKFORCE WITH DETAILED PARTICULARS 109
ANNEX 12: QUESTIONNAIRE FOR NON-FORMAL PROVIDERS DATA COLLECTION 110
ANNEX 13: SURVEY AND ASSESSMENT TEAM 114
TABLE OF CONTENT
P-05
3. LIST OF TABLES
Table 1 Projection of skilled workforce demand from ISCs 18
Table 2 Trends of overseas employment in selected countries 27
Table 3 BTEB affiliated courses up to December 2011 31
Table 4 Trends of enrollment of BTEB affiliated courses 31
Table 5 Capacity of government polytechnic staff 33
Table 6 Summary of public and private/NGO non-formal TVET enrollment 34
Table 7 Non-formal enrollment of 4 public providers according to course durations 35
Table 8 Non-formal enrollment of 9 selected NGO providers according to course durations 36
Table 9 Unemployment rate among labour force with vocational training and general SSC/HSC holders in Bangladesh 49
Table 10 LFPR among persons with and without skill training 49
Table 11 Determinants of wage: Results of OLS regression 50
Table 12 Share of various skill categories in different sector 51
Table 13 Projection of skilled workforce demand from ISCs (total) 53
Table 14 Projections of skill demand and actual skilled employment in RMG 53
Table 15 Skill requirement and forecast in IT 54
Table 16 Skilled employment projection in IT 54
Table 17 Projections of labour requirement and labour available in leather sector 55
Table 18 Projection of demand and available workers with different skill levels in food processing industry 55
Table 19 Projection of skill demand in construction sector 56
Table 20 Projection of skill demand in the tourism and hospitality industry 56
Table 21 Results of BTEB Examinations of different levels 57
Table 22 Trends of enrollment in the public-private institutions affiliated with BTEB 57
Table 23 Classification of NTVQF levels of 4 selected courses affiliated with BTEB 58
Table 24 Pass rate in various TVET courses of BTEB 58
Table 25 Intake capacity of Bangladesh Technical Education Board (BTEB), 2011 58
Table 26 Trends of public-private enrollment in the available courses affiliated by BTEB, 2011 58
Table 27 Summary of public and private/NGO non-Formal TVET enrollment in 2011 59
Table 28 Frequency distribution of occupations by areas of current skill gaps of the workers 60
Table 29 Adequacy of supply, quality and relevance for formally trained workers 61
Table 30 Occupations of curren skills gaps 61
P-06
LIST OF TABLE
Box 1 Summary of recommendations of the FGD 25
Box 2 Outcomes of the meeting with BMET Directors 26
Box 3 Summary of the recommendations of NSDC, DTE and BTEB 33
Box 4 Demand and supply analysis and gap analysis 39
Box 5 Workforce demand-supply analysis and gap analysis mechanism with projection in three phases 41
Figure 6.1 Responses from 206 industries/organizations and their sectors wise number 17
Figure 6.2 1164 respondents from 206 industries and their sector wise distribution 17
Figure 6.3 Target/focus market 17
Figure 6.4 Ownership of the industry/organization 17
Figure 6.5 Projection of skilled workforce demand in percentage 18
Figure 6.6 Education levels achieved by the respondents 19
Figure 6.7 Training received by the respondents 20
Figure 6.8 Experience acquired by the respondents 20
Figure 6.9 Self-stated NTVQF levels by the respondents 21
Figure 6.10 Job profile prepared and used 23
Figure 6.11 Advertisement approach/methodology followed 23
Figure 6.12 Gender preference for recruitment 23
Figure 6.13 Methods/approaches for selection 24
Figure 6.14 Criteria followed for selection /recruitment 24
Figure 6.15 Difficulties face in filling the post of skilled workforce 24
Figure 6.15 (a) Trends of overseas employment in the five highest countries 27
Figure 6.15 (b) Trends of overseas employment in selected countries 27
Figure 6.16 Category wise overseas employment 2007 to 2011 28
Figure 6.17 Remittance earned (million US$) from 2007 to 2011 28
Figure 6.18 Trends of enrollment in the public-private institutions affiliated by BTEB 29
Figure 6.19 Trends of the BTEB formal examination results 29
Figure 6.20 Classification of NTVQF levels of 04 selected courses affiliated by BTEB 30
Figure 6.21 Classification of NTVQF levels by non-formal 4 public providers 35
Figure 6.22 Classification of NTVQF levels by non-formal 9 private/NGO providers 37
Figure 6.23 Classification of NTVQF levels by 9 sectors, BTEB and non-formal public & private/NGO providers 38
Figure 6.24 Factors Influencing Demand for Skilled Workers in Industries 51
4. LIST OF BOXES
5. LIST OF FIGURES
P-07
6. LIST OF ACRONYMS
P-08
BANBEIS Bangladesh Bureau of Educational Information and Statistics
BBS Bangladesh Bureau of Statistics
BITAC Bangladesh Industrial Technical Assistance Centre
BM Business Management
BMET Bureau of Manpower Employment and Training
BNFE Bureau of Non-Formal Education
BRAC Bangladesh Rural Advancement Committee
BSCO Bangladesh Standard Classification of Occupations
BTEB Bangladesh Technical Education Board
CAMPE Campaign for Popular Education
CBT&A Competency Based Training and Assessment
CEO Chief Executive Officer
CMES Centre for Mass Education in Science
DAM Dhaka Ahsania Mission
DTE Directorate of Technical Education
DYD Department of Youth Development
ECNSDC Executive Committee of NSDC
FGD Focus Group Discussion
FIVDB Friends in Village Development Bangladesh
GDP Gross Domestic Product
HSC (Voc) Higher Secondary School Certificate (Vocational)
ILO International Labor Organization
ISC Industry Skills Council
ISCO International Standard Classification of Occupation
ISSQ Industry Sector Standards and Qualifications
IT Information Technology
KSA Kingdom of Saudi Arabia
MAWTS Mirpur Agricultural Workshop and Training School
MIS Management Information System
MOE Ministry of Education
MOEWO Ministry of Expatriates’ Welfare & Overseas Employment
MOLE Ministry of Labor and Employment
NGO Non Government Organization
NHTTI National Hotel and Tourism Training Institute
NSDC National Skills Development Council
NSDP National Skills Development Policy
LIST OF ACRONYMS
NSS National Skills Survey
NTVQF National Technical Vocational Qualification Framework
RMG Ready Made Garments
RPL Recognition of Prior Learning
SDC Swiss Development Corporation
SIT Science and Information Technology
SOS Save Our Soul
SQA Skills Quality Assurance
SSC (Voc) Secondary School Certificate (Vocational)
TMSS Thengamara Mohila Somobay Samity
TOR Terms of Reference
TSC Technical School and College
TTC Technical Training Centre
TTTC Technical Teachers Training College
TVET Technical Vocational Education and Training
UAE United Arab Emirates
UCEP Under Privilege Children’s Educational Programmes
VTI Vocational Training Institute
VTTI Vocational Teachers Training Institute
WB World Bank
LIST OF ACRONYMS
P-09
7. EXECUTIVE SUMMARY
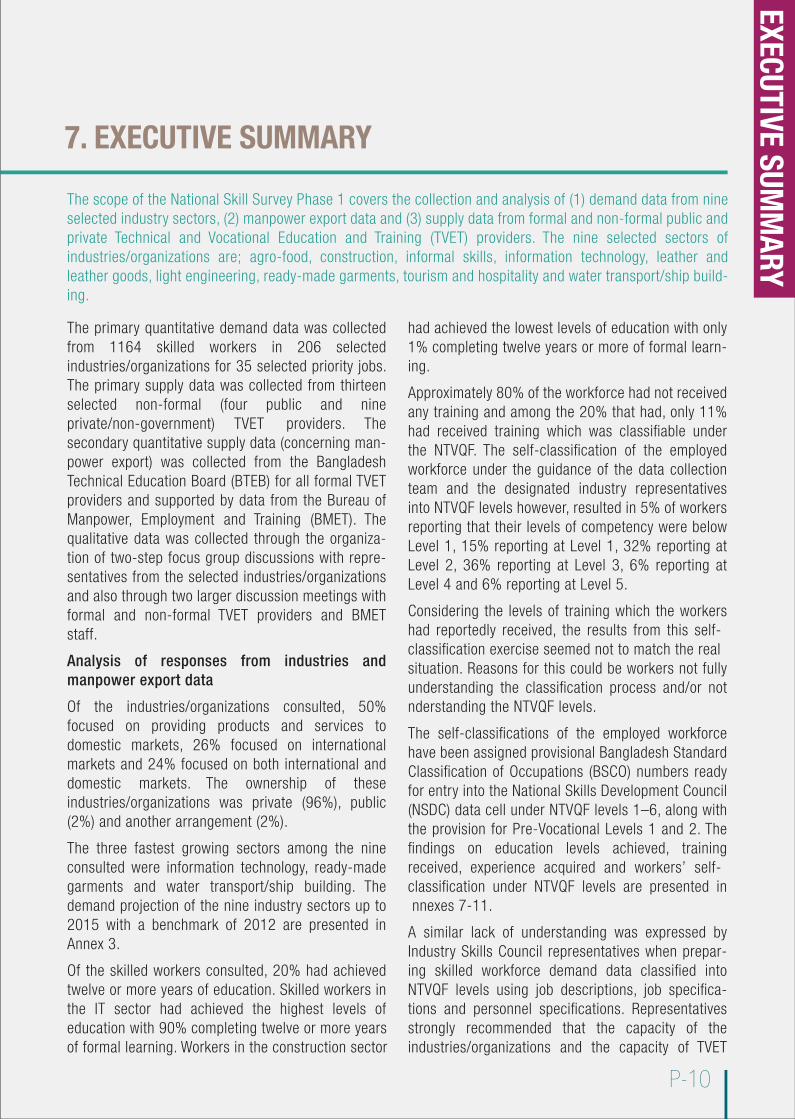
The primary quantitative demand data was collected from 1164 skilled workers in 206 selected industries/organizations for 35 selected priority jobs. The primary supply data was collected from thirteen selected non-formal (four public and nine private/non-government) TVET providers. The secondary quantitative supply data (concerning man-power export) was collected from the Bangladesh Technical Education Board (BTEB) for all formal TVET providers and supported by data from the Bureau of Manpower, Employment and Training (BMET). The qualitative data was collected through the organiza-tion of two-step focus group discussions with repre-sentatives from the selected industries/organizations and also through two larger discussion meetings with formal and non-formal TVET providers and BMET staff.
Analysis of responses from industries and manpower export data
Of the industries/organizations consulted, 50% focused on providing products and services to domestic markets, 26% focused on international markets and 24% focused on both international and domestic markets. The ownership of these industries/organizations was private (96%), public (2%) and another arrangement (2%).
The three fastest growing sectors among the nine consulted were information technology, ready-made garments and water transport/ship building. The demand projection of the nine industry sectors up to 2015 with a benchmark of 2012 are presented in Annex 3.
Of the skilled workers consulted, 20% had achieved twelve or more years of education. Skilled workers in the IT sector had achieved the highest levels of education with 90% completing twelve or more yearsof formal learning. Workers in the construction sector
had achieved the lowest levels of education with only 1% completing twelve years or more of formal learn-ing.
Approximately 80% of the workforce had not received any training and among the 20% that had, only 11% had received training which was classifiable under the NTVQF. The self-classification of the employed workforce under the guidance of the data collection team and the designated industry representatives into NTVQF levels however, resulted in 5% of workers reporting that their levels of competency were below Level 1, 15% reporting at Level 1, 32% reporting at Level 2, 36% reporting at Level 3, 6% reporting at Level 4 and 6% reporting at Level 5.
Considering the levels of training which the workers had reportedly received, the results from this self-classification exercise seemed not to match the realsituation. Reasons for this could be workers not fully understanding the classification process and/or not nderstanding the NTVQF levels.
The self-classifications of the employed workforce have been assigned provisional Bangladesh Standard Classification of Occupations (BSCO) numbers ready for entry into the National Skills Development Council (NSDC) data cell under NTVQF levels 1–6, along with the provision for Pre-Vocational Levels 1 and 2. The findings on education levels achieved, training received, experience acquired and workers’ self-classification under NTVQF levels are presented in nnexes 7-11.
A similar lack of understanding was expressed by Industry Skills Council representatives when prepar-ing skilled workforce demand data classified into NTVQF levels using job descriptions, job specifica-tions and personnel specifications. Representatives strongly recommended that the capacity of the industries/organizations and the capacity of TVET
P-10
The scope of the National Skill Survey Phase 1 covers the collection and analysis of (1) demand data from nine selected industry sectors, (2) manpower export data and (3) supply data from formal and non-formal public and private Technical and Vocational Education and Training (TVET) providers. The nine selected sectors of industries/organizations are; agro-food, construction, informal skills, information technology, leather and leather goods, light engineering, ready-made garments, tourism and hospitality and water transport/ship build-ing.
EXECUTIVE SUMM
ARY
EXECUTIVE SUMMARY
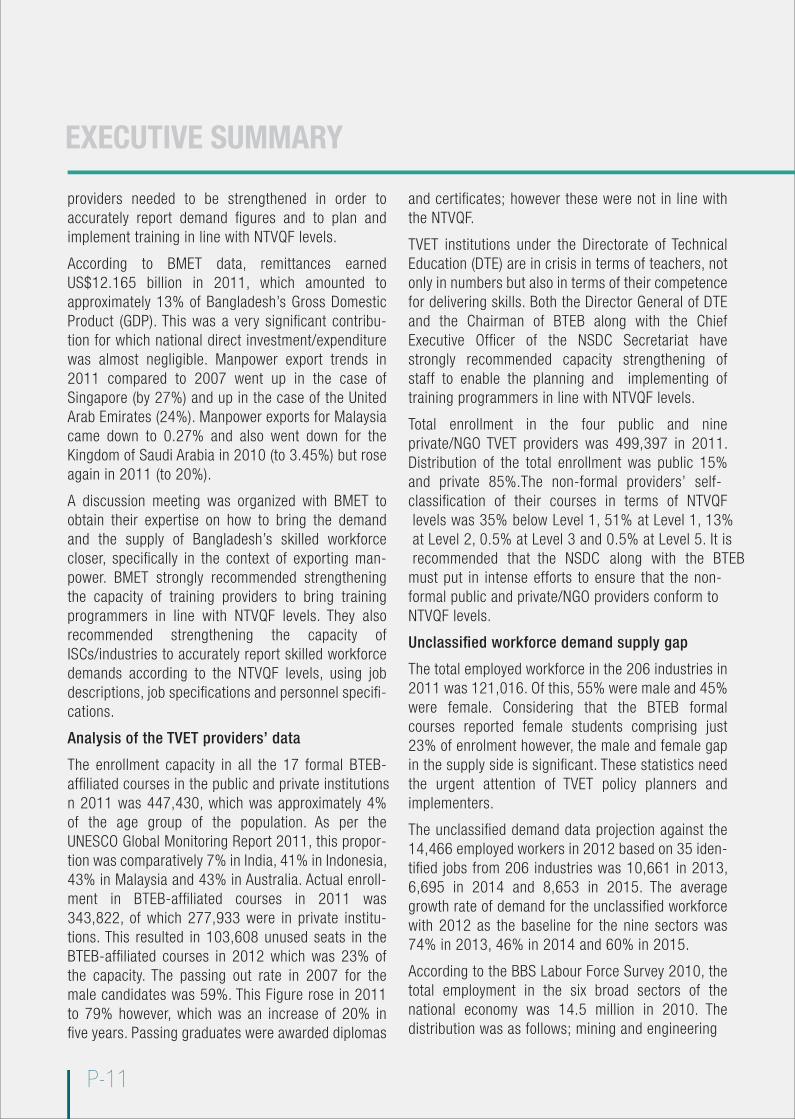
providers needed to be strengthened in order to accurately report demand figures and to plan and implement training in line with NTVQF levels.
According to BMET data, remittances earned US$12.165 billion in 2011, which amounted to approximately 13% of Bangladesh’s Gross Domestic Product (GDP). This was a very significant contribu-tion for which national direct investment/expenditure was almost negligible. Manpower export trends in 2011 compared to 2007 went up in the case of Singapore (by 27%) and up in the case of the United Arab Emirates (24%). Manpower exports for Malaysia came down to 0.27% and also went down for the Kingdom of Saudi Arabia in 2010 (to 3.45%) but rose again in 2011 (to 20%).
A discussion meeting was organized with BMET to obtain their expertise on how to bring the demand and the supply of Bangladesh’s skilled workforce closer, specifically in the context of exporting man-power. BMET strongly recommended strengthening the capacity of training providers to bring training programmers in line with NTVQF levels. They also recommended strengthening the capacity of ISCs/industries to accurately report skilled workforce demands according to the NTVQF levels, using job descriptions, job specifications and personnel specifi-cations.
Analysis of the TVET providers’ data
The enrollment capacity in all the 17 formal BTEB- affiliated courses in the public and private institutions n 2011 was 447,430, which was approximately 4% of the age group of the population. As per the UNESCO Global Monitoring Report 2011, this propor-tion was comparatively 7% in India, 41% in Indonesia, 43% in Malaysia and 43% in Australia. Actual enroll-ment in BTEB-affiliated courses in 2011 was 343,822, of which 277,933 were in private institu-tions. This resulted in 103,608 unused seats in the BTEB-affiliated courses in 2012 which was 23% of the capacity. The passing out rate in 2007 for the male candidates was 59%. This Figure rose in 2011 to 79% however, which was an increase of 20% in five years. Passing graduates were awarded diplomas
and certificates; however these were not in line with the NTVQF.
TVET institutions under the Directorate of Technical Education (DTE) are in crisis in terms of teachers, not only in numbers but also in terms of their competence for delivering skills. Both the Director General of DTE and the Chairman of BTEB along with the Chief Executive Officer of the NSDC Secretariat have strongly recommended capacity strengthening of staff to enable the planning and implementing of training programmers in line with NTVQF levels.
Total enrollment in the four public and nine private/NGO TVET providers was 499,397 in 2011. Distribution of the total enrollment was public 15% and private 85%.The non-formal providers’ self-classification of their courses in terms of NTVQF levels was 35% below Level 1, 51% at Level 1, 13% at Level 2, 0.5% at Level 3 and 0.5% at Level 5. It is recommended that the NSDC along with the BTEBmust put in intense efforts to ensure that the non-formal public and private/NGO providers conform to NTVQF levels.
Unclassified workforce demand supply gap
The total employed workforce in the 206 industries in 2011 was 121,016. Of this, 55% were male and 45% were female. Considering that the BTEB formal courses reported female students comprising just 23% of enrolment however, the male and female gap in the supply side is significant. These statistics need the urgent attention of TVET policy planners and implementers.
The unclassified demand data projection against the 14,466 employed workers in 2012 based on 35 iden-tified jobs from 206 industries was 10,661 in 2013, 6,695 in 2014 and 8,653 in 2015. The average growth rate of demand for the unclassified workforce with 2012 as the baseline for the nine sectors was 74% in 2013, 46% in 2014 and 60% in 2015.
According to the BBS Labour Force Survey 2010, the total employment in the six broad sectors of the national economy was 14.5 million in 2010. The distribution was as follows; mining and engineering
P-11
EXECUTIVE SUMMARY
was 0.109 million (0.7%), manufacturing was 6.731 million (47%), electrical gas and water supply was 0.123 million (0.7%), construction was 2.617 million (18%), hotel and restaurant was 0.832 million (6%) and transport and communication was 4.037 million (28%).
The average national growth rate of employment including these six broad sectors from 2005 to 2010 was 3.32% with 6.34% in manufacturing, 13% in construction, 4% in hotels and restaurants and 3.81% in transportation and communication. Demand of the unclassified workforce, estimated on the annual growth rates, should be approximately 0.9 million in the six broad sectors of the economy and accordingly the national demand for employment in the country should be 1.6 million.
As per BMET data, the total manpower exported in 2011 was 568,062 with 402 categories of jobs, how-ever there was overlapping of similar categories. Of this manpower, 0.2% were classified as professional, 40% were classified as skilled, 5% were classified as semi-skilled and 55% were classified as less skilled. Using these trends, the total unclassified skilled workforce demand including export of manpower was approximately 2.168 million per year.
On the supply side, in the BTEB-affiliated formal courses the enrolment capacity was 447,430 and in the non-formal non-affiliated courses by the 13 public and private/NGO providers, enrolment capacity was 499,397. As per these figures, the gross estimate of the total certifiable enrolment capacity of the non-formal non-affiliated courses was approxi-mately 500,000.
The total enrolment in the formal and non-formal courses was approximately 946,827 students, which does not include the numbers receiving pre-service/normal training provided by some industries. With the average passing rate of the BTEB standing at approximately 75%, the optimum number of grad-uates both from formal and non-formal courseswith unclassified skills is stimated to be approxi-mately 0.71 million.
These results demonstrate that with these trends in the employment growth rate of the unclassified workforce, the gap between demand and supply is estimated at approximately 1.458 million each year. These are numbers which can be used by both industries/organizations and TVET providers for planning purposes.
Recommendations
The summary above highlights some very important recommendations of the industries/organizations and the formal TVET providers. These warrant establish-ment and operationalising of a demand supply analy-sis and gap analysis mechanism at the national level. This should be initiated by the National Skills Devel-opment Council and fully staffed by professionals who possess high levels of competence in demand supply analysis and gap analysis. A mechanism and series of sequential steps for how these analyses can be carried out have been developed and added in Section 7 of this report. The mechanism describes how to establish the demand supply ratio of the skilled workforce at present and also how to project ratios up to 2030.
Based on the findings of the analysis and synthesis, a series of key recommendations have been presented for the consideration of industries, concerned govern-ment ministries and departments and public/private/formal/non-formal TVET providers.
P-12
EXECUTIVE SUMM
ARY

SKILLS SNAPSHOT PART I:SUPPLY AND DEMAND
8. SUPPLY AND DEMAND
The survey focused on identifying the extent of the gap between the demand for skilled workers and the supply of suitable graduates from TVET institutions. This was done in order to recommend appropriate remedial measures to be taken to reduce this gap. The demand side had two components; the demand of local industries and the demand of the global employment market. The supply of TVET graduates comes normally from two routes; formal public and private providers affiliated with BTEB and the non-formal public and private providers. The other important source to supplement supply is the industries themselves taking proactive measures to update and upgrade the employed workforce.
In the process of deciding the scope/size of industry demand, considerable consultation was conducted with the ILO, ISC representatives and other stakeholders concerned. This resulted in the selection of nine key industry sectors. The ISCs of these nine sectors (created by and working with the ILO’s TVET Reform Project and Swiss Development Corporation’s Skill Development Project) were then asked to work with the survey team to provide insight into skill demands. The sectors chosen were: agro-food, construction, informal skills, information technology, leather and leather goods, light engineering, ready-made garments, tourism and hospitality and water transport/ship building.
In consultation with the ISCs, a total of 35 priority jobs were selected from the nine sectors. The list of 35 jobs with skills matched to NTVQF Levels 1-5 was derived from Competency-Based Training and Assess-ment documents prepared by the ISCs and approved by the BTEB. These documents were very important in the design of this survey. A copy of the list of nine sectors and 35 jobs is provided in Annex 1.
Each of the NTVQF levels is dependent upon the job, with three components: job description, job specifi-cation and personnel specification. Each of the components is composed of a number of tasks/work units. A task/work unit is the smallest part that cannot be logically sub-divided and is measurable in terms of its elements. An occupation consists of a series of jobs with overlapping tasks/work units or a single job with a task/work unit. Understanding these concepts and their importance in the NTVQF is an essential precondition for the preparation of skilled workforce demand data by industry and for the preparation of the curriculum by TVET providers to produce graduates with skills and competences which match the needs of industries.
Demand side data for the global employment market was derived by the survey team mainly through reviewing man power export data and remittances from the period 2007-2011, obtained from BMET. BMET is the government agency which maintains manpower export data records.
Supply side data on the numbers of TVET graduates employed as skilled workers from public and private formal providers was collected from BTEB.
Supply side data on trained skilled workforce by the selected non-formal public and private non-affiliated providers was collected through a questionnaire and a discussion with them. The supplementary source for the supply of skilled workforce data from the industries’ own training courses could not be used due to the non-responsiveness of the industries.
P-14
8.1 SCOPE OF THE SURVEY
The design of the survey consisted of two main components:
• Skilled workforce demand by the industries• Supply of graduates as skilled workers by TVET providers
SUPPLY AND DEMAND
P-15
8.2 OBJECTIVES
The main purpose of the NSS Phase 1 was to examine the extent of the gap between the supply and the demand of skilled workers in Bangladesh and to establish a mechanism for minimizing this gap, both now and in the future. Consideration was given to the rapid growth of Bangladesh’s working-age population.
The survey envisaged achieving the following specific objectives:
• Assess the demand of the skilled workforce from the selected sectors of the industries/organizations.• Examine the supply of skilled/trained graduates by the public and private and formal and non-formal TVET providers.• Identify the gap between the demand of skilled workforce from the industries and supply of trained graduates for employment by the TVET providers.• Recommend a gap analysis mechanism and set of operationalization strategies for the present and the future changing pattern of demand supply ratio of skilled workforce.
8.3 METHODOLOGY
The scope of the NSS Phase 1 was decided in consultation with the representatives of ISCs, Bangladesh Employers Federation (BEF) and the NSDC Secretariat. It covered 35 prioritized jobs from the nine selected sectors with their skills content derived from the CBT&A documents approved by the BTEB. Skill content of the 35 jobs in the NTVQF levels is presented in Annex 2. The list of the 35 prioritized jobs was prepared through consultations mainly with ISC representatives. The primary and secondary quantitative data were collected from four sources and qualitative data collected through focus groups and discussion meetings.
The primary data was collected through sampling 206 industries by the ISCs and selected non-formal public and private/NGO non-affiliated providers of TVET courses of different durations ranging from two days up to more than one year. The secondary data was collected from the BTEB for all formal TVET courses and BMET for the manpower export data.
Organization of FGDs with ISC representatives from the nine sectors of industries generated qualitative data. The other source of the qualitative data collected through the organization of discussion meetings with formal and non-formal TVET providers.
8.4 ACTIVITIES
Main activities planned and implemented in the process of data collection, data analysis and synthesis of the findings leading to the preparation of the NSS report were:
• Collection and reading of the Acts, regulations and policies, relevant records, reports, orders and other relevant information;
• Identification of the priority sectors for collection of the demand data from the industries and the skilled workforce;
• Selection of the jobs and the skill contents from the BTEB approved CBT&A documents developed by the ISCs;
• Preparation of questionnaires for primary data collection and format for secondary data collection;
• Organization of training for the data collectors, industry representatives and research associates;
• collection of the demand data from the industries, organization of the FGDs with representative from the selected sectors, export market trend from BMET, supply data for the public and private providers from BTEB and supply data from the non-formal public and private providers; and
• Analysis of data and synthesis of the findings leading to preparation of the report.
P-16
8.5 DATA COLLECTION
The survey team selected and engaged four data collectors and one ISC representative from each of the nine sectors nominated by the chair of the ISCs. A total of nine research associates, one for each of the sectors were engaged to provide technical support in process of data collection from the industries. The list of research associates, ISC representatives and data collectors is presented in Annex 3.
A day-long training was organized in July 2012 for the data collectors, ISC representatives and research associates. The training session started with a presentation explaining the objectives of the NSS, details of the questionnaires and how the respondents should fill it in and other related issues of data collection. The questionnaire used for industry data collection is given in Annex 4. The presentation was followed by detailed discussion and question-answer and clarification of issues in this context. A data collection plan was discussed and agreed upon to complete the data collection within the period of 8-20 July 2012. The data collection from the industries was completed within the agreed date. The survey team prepared a plan and collected data from the four different sources using questionnaires and other formats as appro-priate.
Primary data was collected using questionnaires from the two different sources in the following manner:
• 206 selected industry respondents and 1164 skilled workers from those selected industries through the nine ISC representatives along with 34 data collectors supported by nine research associates.
• 13 selected (4 public and 9 private/NGO) non-formal providers of TVET courses of different durations ranging from two days up to more than one year.
Secondary data was collected from:
• BTEB for all formal TVET courses • BMET for the manpower export
Qualitative data was collected through the organization of:
• Three FGDs in Step 1 with the selected industry representatives from the nine selected sectors of industries/organizations and two FGDs in Step 2 with selected representatives from eight sectors of the industries.
Qualitative data have also been collected through the organization of two discussion meetings with the
• Director General DTE, CEO NSDC Secretariat and Chairman BTEB along with their senior officers • Directors of the BMET mainly focusing the manpower export as well as skill training.
8.6 DATA ANALYSIS
The demand data collected from the nine sectors of the industries and BMET and supply data from the BTEB and non-formal TVET providers were thoroughly scrutinized and the appropriate data of the five sets selected for analysis.
Analysis of the five sets of data were carried out and presented in the sequence of:
a demand data from • industries/organizations; • FGD; and • Manpower export data
b supply data from • BTEB for formal TVET providers • non-formal and non-affiliated TVET providers
SUPPLY AND DEMAND
P-17
8.7 DEMAND DATA FROM INDUSTRIES/ORGANIZATIONS
Data collected from the industries comprised of information about the industries/organizations, employed workforce and future projection for three years and employed workforce skill levels in the NTVQF.
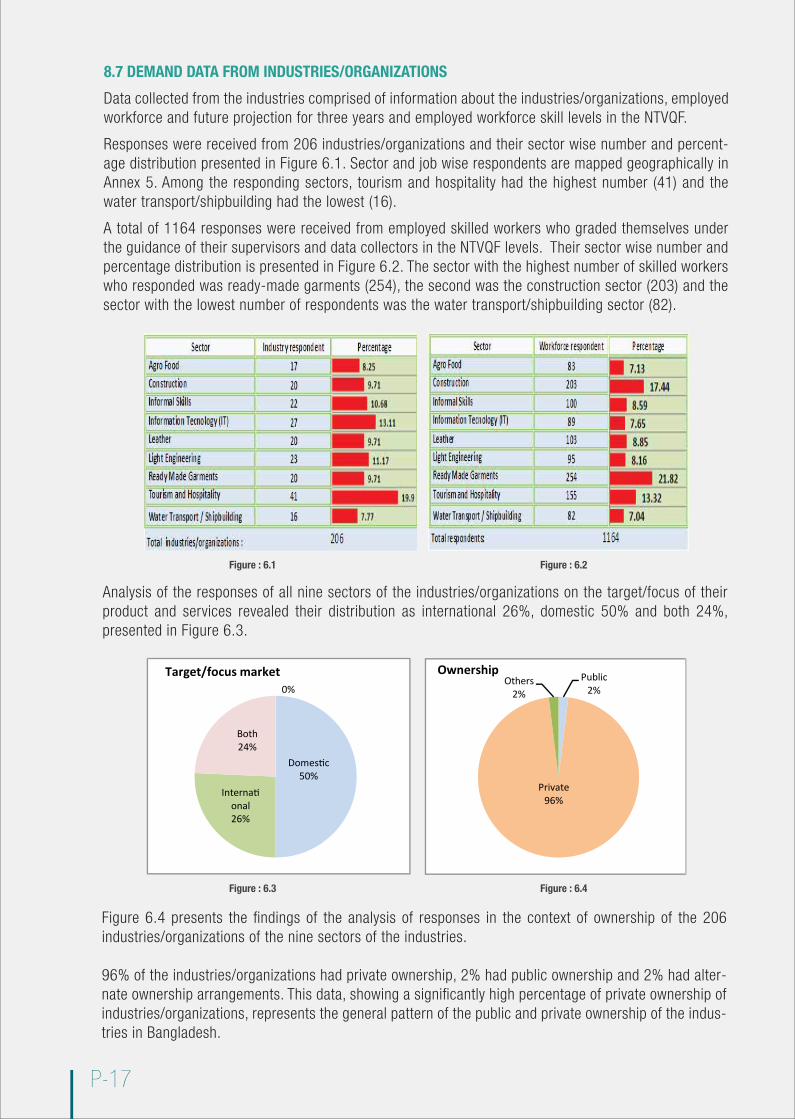
Responses were received from 206 industries/organizations and their sector wise number and percent-age distribution presented in Figure 6.1. Sector and job wise respondents are mapped geographically in Annex 5. Among the responding sectors, tourism and hospitality had the highest number (41) and the water transport/shipbuilding had the lowest (16).
A total of 1164 responses were received from employed skilled workers who graded themselves under the guidance of their supervisors and data collectors in the NTVQF levels. Their sector wise number and percentage distribution is presented in Figure 6.2. The sector with the highest number of skilled workers who responded was ready-made garments (254), the second was the construction sector (203) and the sector with the lowest number of respondents was the water transport/shipbuilding sector (82).
Analysis of the responses of all nine sectors of the industries/organizations on the target/focus of their product and services revealed their distribution as international 26%, domestic 50% and both 24%, presented in Figure 6.3.
Figure 6.4 presents the findings of the analysis of responses in the context of ownership of the 206 industries/organizations of the nine sectors of the industries.
96% of the industries/organizations had private ownership, 2% had public ownership and 2% had alter-nate ownership arrangements. This data, showing a significantly high percentage of private ownership of industries/organizations, represents the general pattern of the public and private ownership of the indus-tries in Bangladesh.
Figure : 6.1 Figure : 6.2
Figure : 6.3 Figure : 6.4
Domestic 50%
International 26%
Both 24%
0%Target/focus market Public
2%
Private96%
Others2%
Ownership
P-18
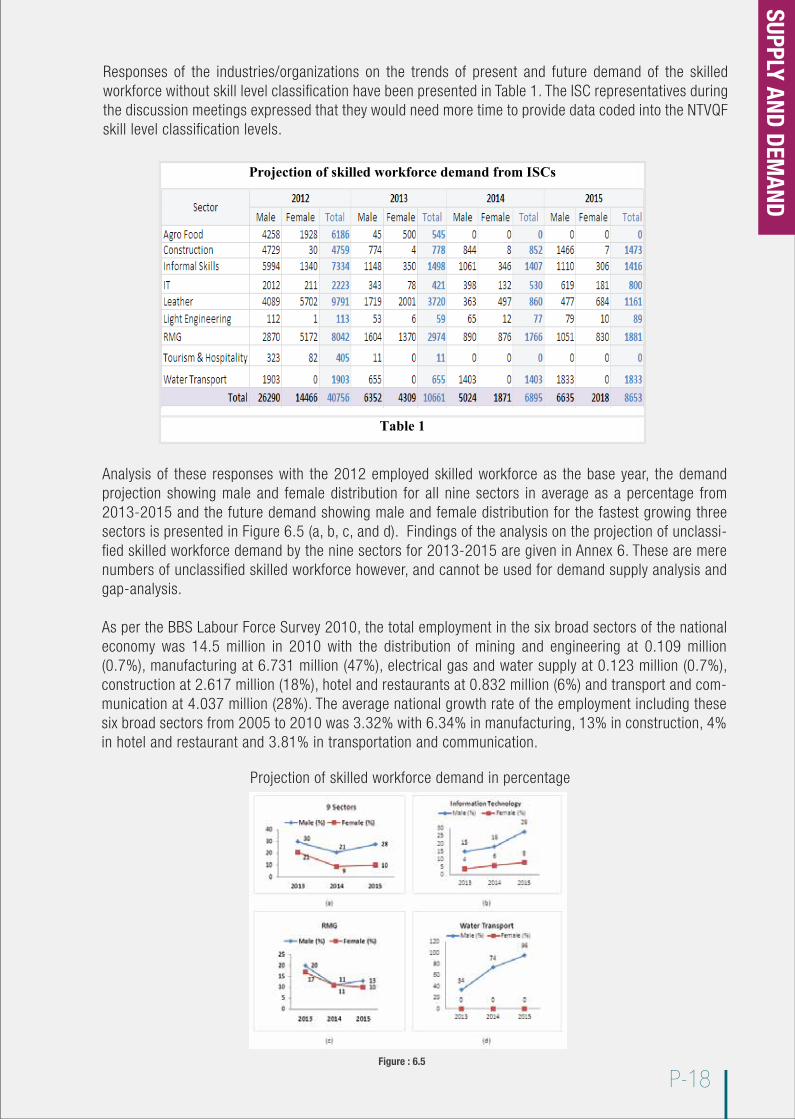
Responses of the industries/organizations on the trends of present and future demand of the skilled workforce without skill level classification have been presented in Table 1. The ISC representatives during the discussion meetings expressed that they would need more time to provide data coded into the NTVQF skill level classification levels.
Analysis of these responses with the 2012 employed skilled workforce as the base year, the demand projection showing male and female distribution for all nine sectors in average as a percentage from 2013-2015 and the future demand showing male and female distribution for the fastest growing three sectors is presented in Figure 6.5 (a, b, c, and d). Findings of the analysis on the projection of unclassi-fied skilled workforce demand by the nine sectors for 2013-2015 are given in Annex 6. These are mere numbers of unclassified skilled workforce however, and cannot be used for demand supply analysis and gap-analysis.
As per the BBS Labour Force Survey 2010, the total employment in the six broad sectors of the national economy was 14.5 million in 2010 with the distribution of mining and engineering at 0.109 million (0.7%), manufacturing at 6.731 million (47%), electrical gas and water supply at 0.123 million (0.7%), construction at 2.617 million (18%), hotel and restaurants at 0.832 million (6%) and transport and com-munication at 4.037 million (28%). The average national growth rate of the employment including these six broad sectors from 2005 to 2010 was 3.32% with 6.34% in manufacturing, 13% in construction, 4% in hotel and restaurant and 3.81% in transportation and communication.
Figure : 6.5
Projection of skilled workforce demand from ISCs
Table 1
Projection of skilled workforce demand in percentage
SUPPLY AND DEMAND
P-19
Figure : 6.6(c)
(a) (b)
(d)
8.7.1 EMPLOYED WORKFORCE BACKGROUND
Responses from 1164 employed skilled workers have been analyzed mainly focusing on education, training, experience and their self-classification in the NTVQF level with the guidance of the data collec-tors and their supervisors. Percentage distribution of the education level achieved, training received, experience acquired and their NTVQF levels self-classification along with their age and national ID have been analyzed. These types of detailed statistics about the skilled workforce when developed are not only an essential requirement for the industry and TVET providers but also the most important data for the present and future planning of the country.
The main purpose of initiating the self-classification in the NTVQF levels by the 1164 skilled workforce was to provide opportunities to them and to the ISCs to learn, understand and to start applying the NTVQF levels using the three components of jobs; job description, job specification and personnel speci-fication. The three components are basic, necessary requirements for the recruitment, promotion, demo-tion, training, remuneration and productivity of the workforce. They are also the fundamental require-ments for preparation of curriculum by TVET providers to produce graduates that meet industry needs.
8.7.2 EDUCATION LEVEL ACHIEVED
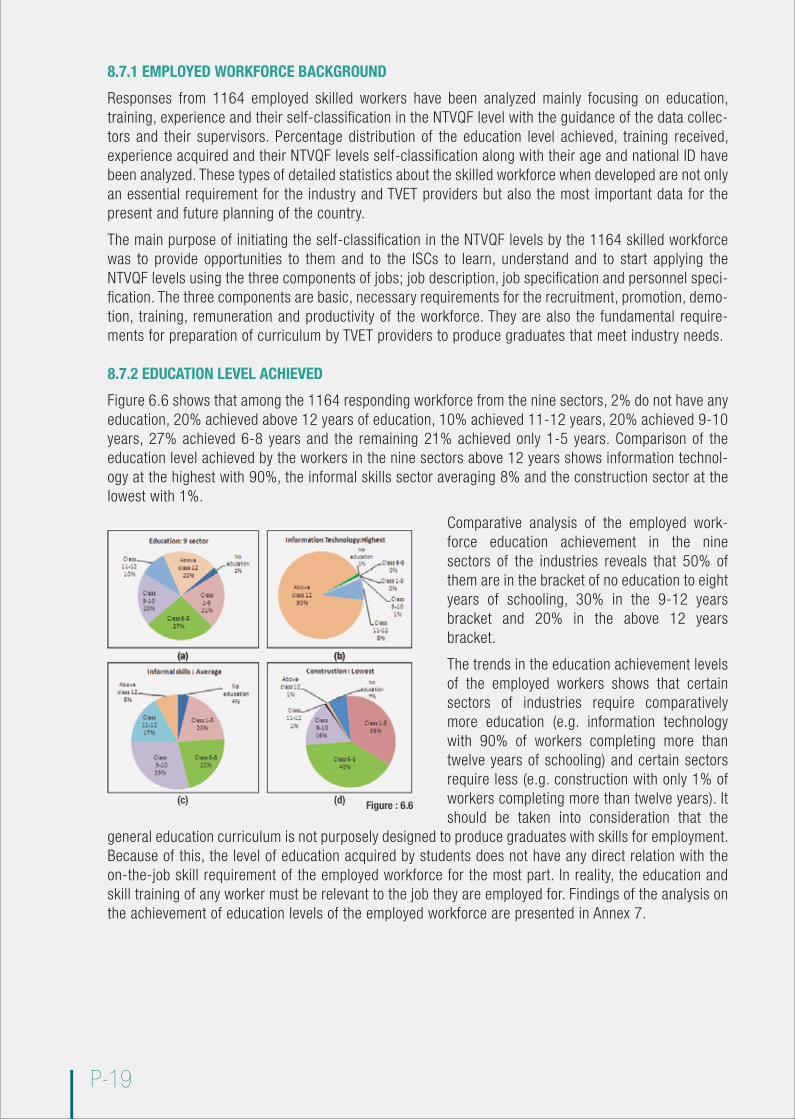
Figure 6.6 shows that among the 1164 responding workforce from the nine sectors, 2% do not have any education, 20% achieved above 12 years of education, 10% achieved 11-12 years, 20% achieved 9-10 years, 27% achieved 6-8 years and the remaining 21% achieved only 1-5 years. Comparison of the education level achieved by the workers in the nine sectors above 12 years shows information technol-ogy at the highest with 90%, the informal skills sector averaging 8% and the construction sector at the lowest with 1%.
Comparative analysis of the employed work-force education achievement in the nine sectors of the industries reveals that 50% of them are in the bracket of no education to eight years of schooling, 30% in the 9-12 years bracket and 20% in the above 12 years bracket.
The trends in the education achievement levels of the employed workers shows that certain sectors of industries require comparatively more education (e.g. information technology with 90% of workers completing more than twelve years of schooling) and certain sectors require less (e.g. construction with only 1% of workers completing more than twelve years). It should be taken into consideration that the
general education curriculum is not purposely designed to produce graduates with skills for employment. Because of this, the level of education acquired by students does not have any direct relation with the on-the-job skill requirement of the employed workforce for the most part. In reality, the education and skill training of any worker must be relevant to the job they are employed for. Findings of the analysis on the achievement of education levels of the employed workforce are presented in Annex 7.
P-20
8.7.3 TRAINING RECEIVED
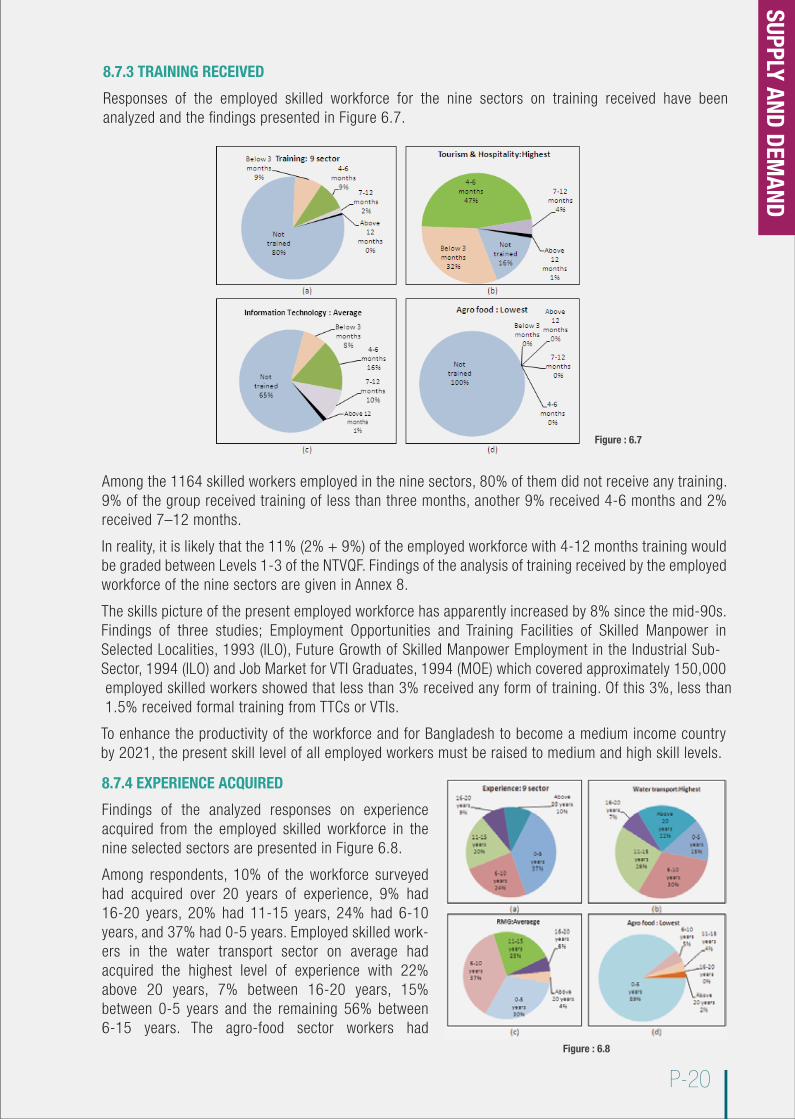
Responses of the employed skilled workforce for the nine sectors on training received have been analyzed and the findings presented in Figure 6.7.
Among the 1164 skilled workers employed in the nine sectors, 80% of them did not receive any training. 9% of the group received training of less than three months, another 9% received 4-6 months and 2% received 7–12 months.
In reality, it is likely that the 11% (2% + 9%) of the employed workforce with 4-12 months training would be graded between Levels 1-3 of the NTVQF. Findings of the analysis of training received by the employed workforce of the nine sectors are given in Annex 8.
The skills picture of the present employed workforce has apparently increased by 8% since the mid-90s. Findings of three studies; Employment Opportunities and Training Facilities of Skilled Manpower in Selected Localities, 1993 (ILO), Future Growth of Skilled Manpower Employment in the Industrial Sub-Sector, 1994 (ILO) and Job Market for VTI Graduates, 1994 (MOE) which covered approximately 150,000 employed skilled workers showed that less than 3% received any form of training. Of this 3%, less than 1.5% received formal training from TTCs or VTIs.
To enhance the productivity of the workforce and for Bangladesh to become a medium income country by 2021, the present skill level of all employed workers must be raised to medium and high skill levels.
Figure : 6.8
Figure : 6.7
8.7.4 EXPERIENCE ACQUIRED
Findings of the analyzed responses on experience acquired from the employed skilled workforce in the nine selected sectors are presented in Figure 6.8.
Among respondents, 10% of the workforce surveyed had acquired over 20 years of experience, 9% had 16-20 years, 20% had 11-15 years, 24% had 6-10 years, and 37% had 0-5 years. Employed skilled work-ers in the water transport sector on average had acquired the highest level of experience with 22% above 20 years, 7% between 16-20 years, 15% between 0-5 years and the remaining 56% between 6-15 years. The agro-food sector workers had
SUPPLY AND DEMAND
P-21
acquired the lowest experience among the nine sectors with 89% between 0-5 years, 2% above 20 years and the remaining 9% between 6-20 years. The ready-made garments workforce stood at an average experience level with 4% above 20 years, 6% between 16-20 years, 30% between 0-5 years and the remaining 60% between 6-15 years.
Findings of the analysis on experience acquired by the workforce of the nine sectors are presented in Annex 9.
8.7.5 NTVQF LEVELS SELF-CLASSIFICATION
Workers in nine sectors were provided with opportunities to rate their individual skills in the NTVQF levels under the guidance of the data collectors and their direct supervisors. The data collection team and the industry representatives were given training about data collection procedures, specifically to support the employed skilled workers in the process of their self-classification using the NTVQF levels and their descriptors.
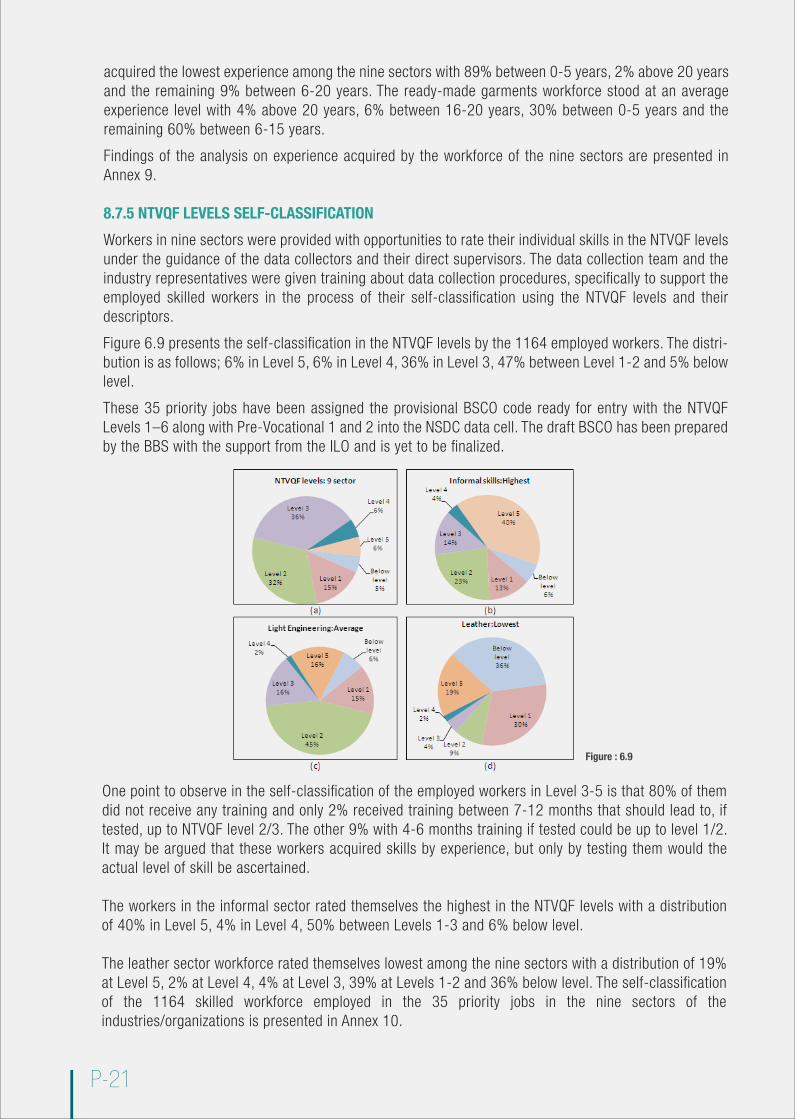
Figure 6.9 presents the self-classification in the NTVQF levels by the 1164 employed workers. The distri-bution is as follows; 6% in Level 5, 6% in Level 4, 36% in Level 3, 47% between Level 1-2 and 5% below level.
These 35 priority jobs have been assigned the provisional BSCO code ready for entry with the NTVQF Levels 1–6 along with Pre-Vocational 1 and 2 into the NSDC data cell. The draft BSCO has been prepared by the BBS with the support from the ILO and is yet to be finalized.
One point to observe in the self-classification of the employed workers in Level 3-5 is that 80% of them did not receive any training and only 2% received training between 7-12 months that should lead to, if tested, up to NTVQF level 2/3. The other 9% with 4-6 months training if tested could be up to level 1/2. It may be argued that these workers acquired skills by experience, but only by testing them would the actual level of skill be ascertained.
The workers in the informal sector rated themselves the highest in the NTVQF levels with a distribution of 40% in Level 5, 4% in Level 4, 50% between Levels 1-3 and 6% below level.
The leather sector workforce rated themselves lowest among the nine sectors with a distribution of 19% at Level 5, 2% at Level 4, 4% at Level 3, 39% at Levels 1-2 and 36% below level. The self-classification of the 1164 skilled workforce employed in the 35 priority jobs in the nine sectors of the industries/organizations is presented in Annex 10.
Figure : 6.9

P-22
Rating of the light engineering sector workforce ranks them as average among the nine sectors in the NTVQF levels with distribution of 16% in Level 5, 2% in Level 4, 76% in Levels 1-3 and 6% below Level 1.
A sample of 15 self-classified skilled workers with detailed particulars is presented in Annex 11. In the actual classification of the skilled workforce such detailed particulars should be included for the national database in order to facilitate tracing out individual skilled workforce as and when required.
8.8 FOCUS GROUP DISCUSSIONS - RATIONALE
The Focus Group Discussions (FGD) were organized in two sequential steps instead of the one step usual practice of FGD for qualitative data generation. In Step 1, three FGDs were organized. In Step 2, two FGDs were organized to review and improve the findings of the Step 1 discussions.
8.8.1 STEP 1 DISCUSSIONS – METHODS AND CRITERIA USED FOR SELECTION AND RECRUITMENT OF SKILLED WORKERS
Each of the FGDs was started with a presentation briefly mentioning the main aspects of the National Skill Development Policy including the NTVQF, objectives of the NSS Phase 1 along with the objectives of the FGD. A set format was used for guiding the discussions, the main issues included were: methods and criteria used for selection and recruitment of the skilled workforce, difficulties faced in the selection and recruitment of skilled workforce and training facilities available for updating and upgrading skilled work-force. In addition, the format contained two subsidiary issues such as: present employed workforce and the future demand (2012-2016) for skilled workforce in the NTVQF levels 1-5 ready for transfer to ISCO/BSCO. For the two subsidiary issues and for one main issue facilities for training, opinions expressed have been found inadequate for analysis.
The opinions expressed and recorded by the respective industry representatives in the Step 1 discussions and the opinions expressed in the Step 2 discussions recorded and moderated by the coordinator have been analyzed and presented in the following two sections.
Methods and criteria used for selection and recruitment of the skilled workforce:
With detailed discussion on each of the main issues and technical support provided by the trained Research Associates in the Step 1 FGDs, instead of recording their opinions by an expert for each sector, each of the industry representatives as per the request of the organizers recorded their opinion in the formats. Their opinions have been summarized sector-wise, analyzed separately and the findings presented.
A Job profile prepared and used
The term job profile has been repeatedly explained to the ISC representatives, ISC chairs and members, representatives of the BEF, data collectors, industries/organizations in the process of design and data collection and all others concerned with the NSS. A job profile consists of three components, which are:
• Job description (describes what to do)• Job specification (describes how to do it, in other words, the skills, techniques• and competences required to do the job)• Personnel specification (personalizes the attitude, behavior, approach towards the job, work environment, peers, superiors including belongingness to the job for ensuring the best performance)
Figure : 6.10
SUPPLY AND DEMAND
The findings of the analysis of the opinions on job profile prepared and used have been presented in Figure 6.10. This shows that 55% of industries/organizations are using the job description and 52% prepared it. Similar is the situation in the case of job specification and personnel specification. In both cases, the percentage of industries using the components are more than the percentages which are preparing it. How and why did this occur is a valid question to be resolved. The answer to this such other questions warranted the organization of the Step 2 FGD.
B Advertising approach/methodology followed
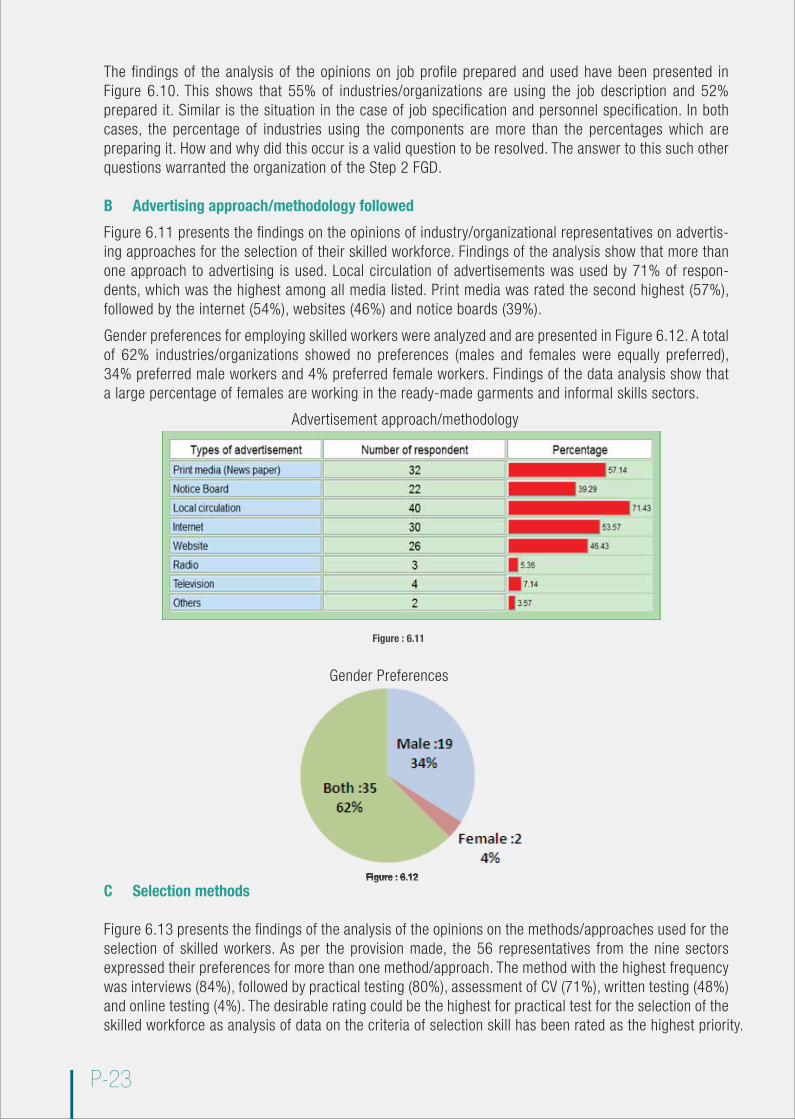
Figure 6.11 presents the findings on the opinions of industry/organizational representatives on advertis-ing approaches for the selection of their skilled workforce. Findings of the analysis show that more than one approach to advertising is used. Local circulation of advertisements was used by 71% of respon-dents, which was the highest among all media listed. Print media was rated the second highest (57%), followed by the internet (54%), websites (46%) and notice boards (39%).
Gender preferences for employing skilled workers were analyzed and are presented in Figure 6.12. A total of 62% industries/organizations showed no preferences (males and females were equally preferred), 34% preferred male workers and 4% preferred female workers. Findings of the data analysis show that a large percentage of females are working in the ready-made garments and informal skills sectors.
C Selection methods
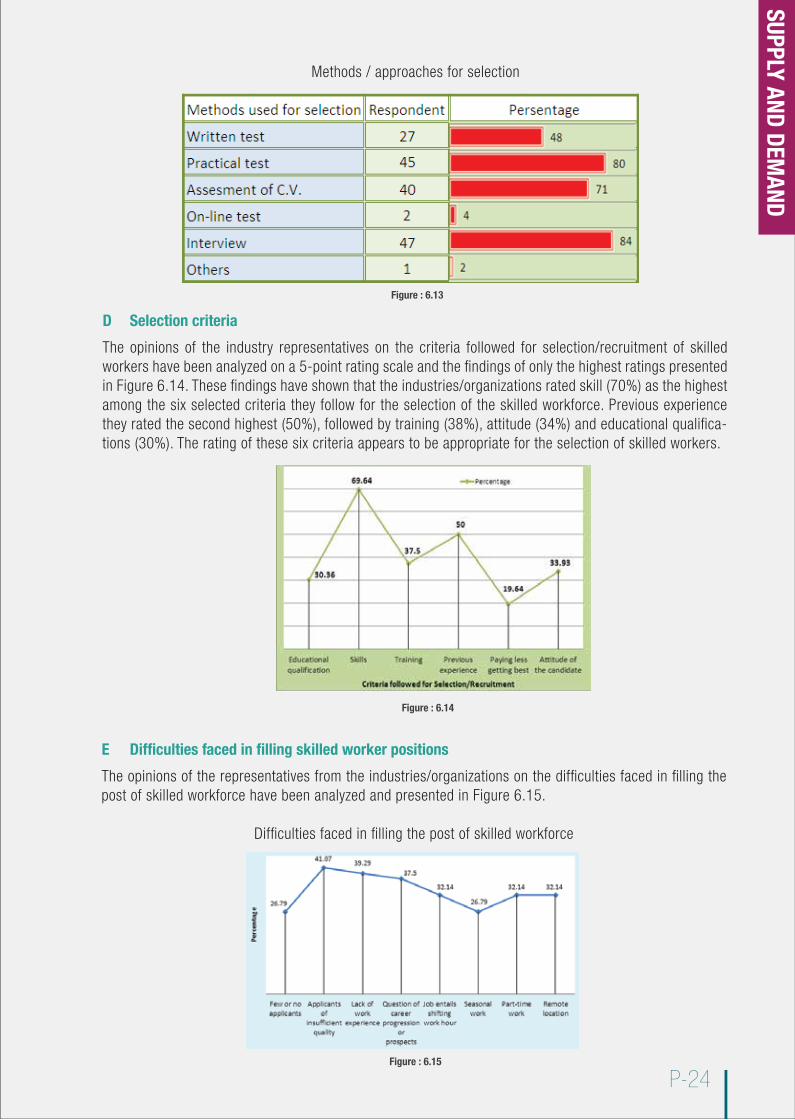
Figure 6.13 presents the findings of the analysis of the opinions on the methods/approaches used for the selection of skilled workers. As per the provision made, the 56 representatives from the nine sectors expressed their preferences for more than one method/approach. The method with the highest frequency was interviews (84%), followed by practical testing (80%), assessment of CV (71%), written testing (48%) and online testing (4%). The desirable rating could be the highest for practical test for the selection of the skilled workforce as analysis of data on the criteria of selection skill has been rated as the highest priority.
Figure : 6.11
Figure : 6.12
P-23
Advertisement approach/methodology
Gender Preferences
Figure : 6.12
P-24
Methods / approaches for selection
D Selection criteria
The opinions of the industry representatives on the criteria followed for selection/recruitment of skilled workers have been analyzed on a 5-point rating scale and the findings of only the highest ratings presented in Figure 6.14. These findings have shown that the industries/organizations rated skill (70%) as the highest among the six selected criteria they follow for the selection of the skilled workforce. Previous experience they rated the second highest (50%), followed by training (38%), attitude (34%) and educational qualifica-tions (30%). The rating of these six criteria appears to be appropriate for the selection of skilled workers.
E Difficulties faced in filling skilled worker positions
The opinions of the representatives from the industries/organizations on the difficulties faced in filling the post of skilled workforce have been analyzed and presented in Figure 6.15.
Difficulties faced in filling the post of skilled workforce
Figure : 6.13
Figure : 6.14
Figure : 6.15
SUPPLY AND DEMAND

According to the findings of analysis the representatives of the nine sectors of industries rated at 41% the highest for applicants of insufficient quality among the eight criteria, the second highest at 39% the lack of work experience then followed by career progression 38%, shift work and remote location both at 32% and the lowest 27% both for few or no applicants and seasonal work.
8.8.2 STEP 2 DISCUSSIONS – REVIEWING STEP 1 DISCUSSIONS AND LOOKING FORWARD
Step 2 discussions started with a presentation briefly mentioning the findings of the Step 1 discussions. This focused on industries using job profiles even they did not prepare them, linkage of job profiles with the NTVQF, objectives of the Step 2 discussions and the reasons that warranted Step 2 discussions.
The presentation also included the brief findings of the comparative analysis of the workforce employ-ment pattern and productivity of Bangladesh, Pakistan, India, Indonesia, Malaysia, Australia and Japan.
According to the findings of the comparative analysis Bangladesh stands as a country with:
• low skills• low labour cost• low productivity of the workforce, and• circumscribed by mainly employment market non-responsive education and training programmes
With the situations described above the step 2 FGDs have been organized and moderated mainly focusing the following questions in order to explore the possibility of preparing demand tuned to NTVQF levels:
• What should the country do to come out of this low skill and low productivity? • How the country should resolve the causes? • How to match the demand with the supply?or• How to match the supply with demand?
The opinions expressed by the industry representatives on behalf of the respective sectors and their own industries/organizations have been recorded sector wise. The findings in the form of recommendations in order of frequency are presented in Box 1.
P-25
Sl. No. Recommendations Frequency
1 Demand should be placed by the industry as per NTVQF levels with the job description, 8 job specification & personnel specification.
2 Skill training should be tuned to the NTVQF levels. 6
3 Capacity of the industries and TVET providers should be strengthened for placing demand and for planning & implementing training tuned to NTVQF levels. 6
4 Training providers and industry should jointly set demand and implement training programme tuned to the NTVQF levels. 3
5 NSDC-secretariat should be established by an Act of the Parliament in order to act as the national coordinating authority for skill development. 3
6 NTVQF levels should be extended to level 10 for paraprofessional (7), professional (8), researcher(9) and policymakers (10). 2
7 Skill training should be integrated with general education at the NTVQF levels. 2
8 Both IT and Tourism & Hospitality sectors pointed out that priority of jobs used in NSS (Phase -1) are not as per actual priority jobs of these sectors. The ISCs should prioritize the job in consultation with all members. 2
9 Leather sector pointed out that specific skill should be focused in limited area with NTVQF levels. TVET providers should ensure specific skills as per demand from the industries. 1
10 Informal skills sector pointed out that trained workforce are not available to start a new business. Industry should prepare the projection for skilled workforce as per NTVQF levels. 1
Box 1 : Summary of recommendations of the FGD on 18 Oct 2012
P-26
The recommendation ‘demand should be placed by the industry as per NTVQF levels with the job descrip-tion, job specification & personnel specification’ has the highest frequency and therefore is the highest priority. The next two recommendations both had the second highest frequency and are therefore both considered as the second highest priority areas.
8.9 MANPOWER EXPORT DATA
According to data received from BMET remittances earned US$12.165 billion in 2011 was approximately 13% of Bangladesh’s GDP, a very significant contribution for which national direct investment/expenditure was almost negligible. In other words, this may be considered as the citizen’s contribution. This contribution comes from the exported manpower partly from their earnings and partly through translation of their very hard earned/acquired Bangladesh taka invested in seeking and getting overseas employment.
8.9.1 EXPORTED MANPOWER AND CLASSIFICATION
The list received from BMET presented the exported manpower for 2011 in 402 categories, though there was overlapping of a number of similar categories. According to the list, five categories of manpower: carpenter, cleaner, farmer, construction worker and waiter made up 19% whereas labourers/workers made up 42%. The proportion of the manpower exported in 1976 was professional 9%, skilled worker 29%, semi-skilled 9% and less skilled 53%. This figure for 2000 were professional 5%, skilled 45%, semi-skilled 12% and less skilled 38% but the figure in 2011 were professional 0.2%, skilled 40%, semi-skilled 05% and less skilled 55%.
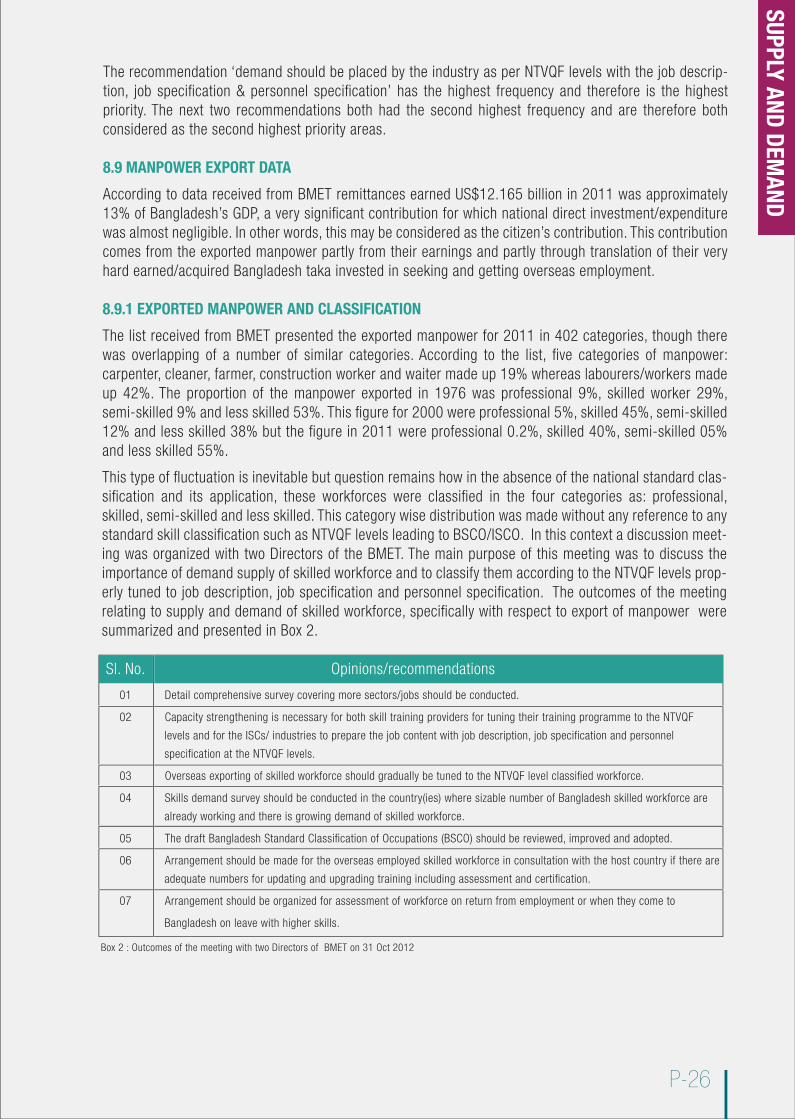
This type of fluctuation is inevitable but question remains how in the absence of the national standard clas-sification and its application, these workforces were classified in the four categories as: professional, skilled, semi-skilled and less skilled. This category wise distribution was made without any reference to any standard skill classification such as NTVQF levels leading to BSCO/ISCO. In this context a discussion meet-ing was organized with two Directors of the BMET. The main purpose of this meeting was to discuss the importance of demand supply of skilled workforce and to classify them according to the NTVQF levels prop-erly tuned to job description, job specification and personnel specification. The outcomes of the meeting relating to supply and demand of skilled workforce, specifically with respect to export of manpower were summarized and presented in Box 2.
Sl. No. Opinions/recommendations
01 Detail comprehensive survey covering more sectors/jobs should be conducted.
02 Capacity strengthening is necessary for both skill training providers for tuning their training programme to the NTVQF
levels and for the ISCs/ industries to prepare the job content with job description, job specification and personnel
specification at the NTVQF levels.
03 Overseas exporting of skilled workforce should gradually be tuned to the NTVQF level classified workforce.
04 Skills demand survey should be conducted in the country(ies) where sizable number of Bangladesh skilled workforce are
already working and there is growing demand of skilled workforce.
05 The draft Bangladesh Standard Classification of Occupations (BSCO) should be reviewed, improved and adopted.
06 Arrangement should be made for the overseas employed skilled workforce in consultation with the host country if there are
adequate numbers for updating and upgrading training including assessment and certification.
07 Arrangement should be organized for assessment of workforce on return from employment or when they come to
Bangladesh on leave with higher skills.
Box 2 : Outcomes of the meeting with two Directors of BMET on 31 Oct 2012
SUPPLY AND DEMAND
Exported manpower usually comes back with not only foreign exchange but also with higher skills that should be recognized as prior learning, so that they can qualify as NTVQF-classified workforce. 8.9.2 OVERSEAS EMPLOYMENT TRENDS
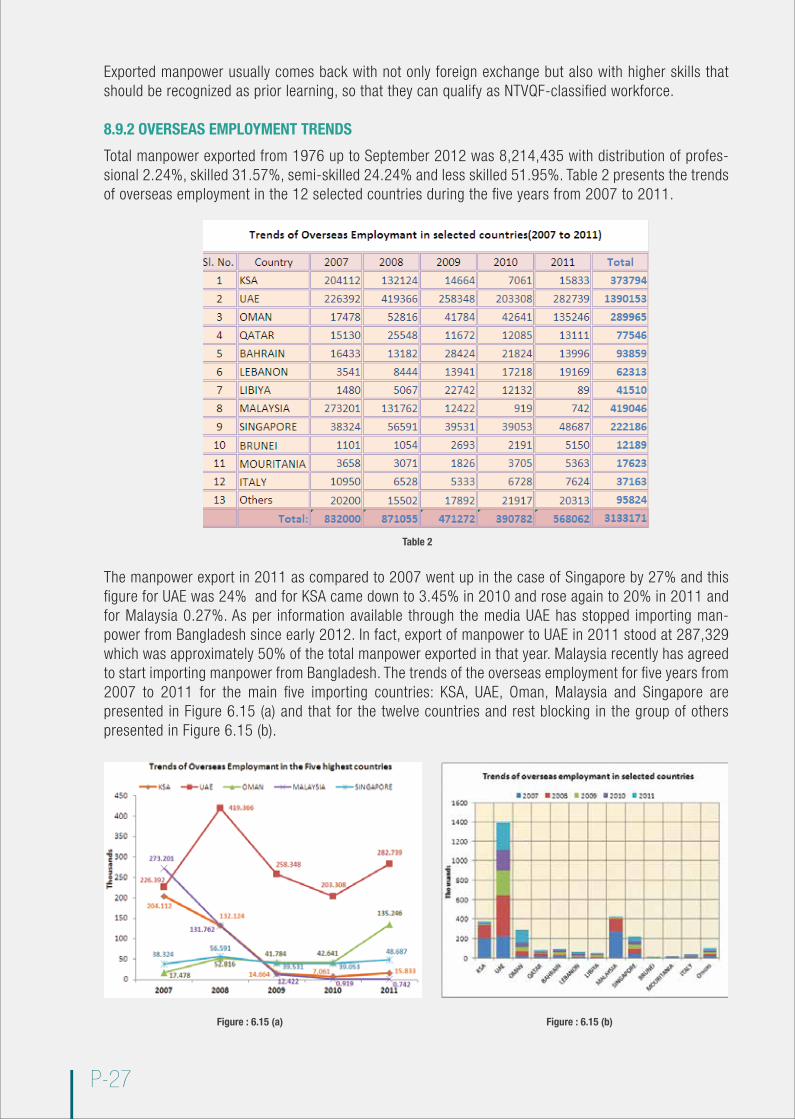
Total manpower exported from 1976 up to September 2012 was 8,214,435 with distribution of profes-sional 2.24%, skilled 31.57%, semi-skilled 24.24% and less skilled 51.95%. Table 2 presents the trends of overseas employment in the 12 selected countries during the five years from 2007 to 2011.
The manpower export in 2011 as compared to 2007 went up in the case of Singapore by 27% and this figure for UAE was 24% and for KSA came down to 3.45% in 2010 and rose again to 20% in 2011 and for Malaysia 0.27%. As per information available through the media UAE has stopped importing man-power from Bangladesh since early 2012. In fact, export of manpower to UAE in 2011 stood at 287,329 which was approximately 50% of the total manpower exported in that year. Malaysia recently has agreed to start importing manpower from Bangladesh. The trends of the overseas employment for five years from 2007 to 2011 for the main five importing countries: KSA, UAE, Oman, Malaysia and Singapore are presented in Figure 6.15 (a) and that for the twelve countries and rest blocking in the group of others presented in Figure 6.15 (b).
P-27
Table 2
Figure : 6.15 (a) Figure : 6.15 (b)
P-28
The key questions surround the decreasing manpower import from Bangladesh during five years by Malaysia, KSA and even UAE in 2012 not to import manpower from Bangladesh. In 2007 only these three countries imported 85% of the total manpower exported from Bangladesh. For their decisions and not importing manpower from Bangladesh the total manpower export in 2009 came down to 54% and in 2010 the figure further came down to 49% compared to that of the export of the 2008. Apparent and real effect of this was evident that the country lost 46% of the remittances in 2009 and 51% of the remit-tances in 2010. The remittances lost in 2009 and 2010 could amount to US$10,573 million [US$4930 =10.771.46 x 0.46 for 2009 + US$5143 = 11064.73 x 0.51 for 2010].
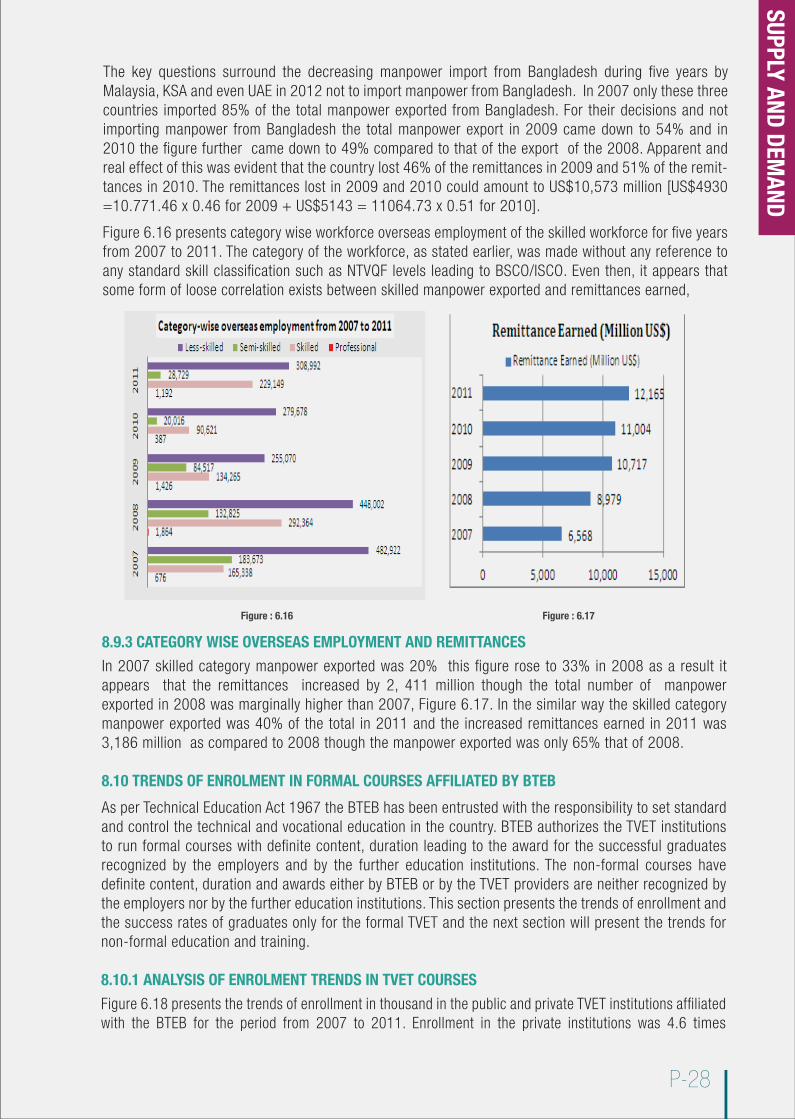
Figure 6.16 presents category wise workforce overseas employment of the skilled workforce for five years from 2007 to 2011. The category of the workforce, as stated earlier, was made without any reference to any standard skill classification such as NTVQF levels leading to BSCO/ISCO. Even then, it appears that some form of loose correlation exists between skilled manpower exported and remittances earned,
8.9.3 CATEGORY WISE OVERSEAS EMPLOYMENT AND REMITTANCES
In 2007 skilled category manpower exported was 20% this figure rose to 33% in 2008 as a result it appears that the remittances increased by 2, 411 million though the total number of manpower exported in 2008 was marginally higher than 2007, Figure 6.17. In the similar way the skilled category manpower exported was 40% of the total in 2011 and the increased remittances earned in 2011 was 3,186 million as compared to 2008 though the manpower exported was only 65% that of 2008.
8.10 TRENDS OF ENROLMENT IN FORMAL COURSES AFFILIATED BY BTEB
As per Technical Education Act 1967 the BTEB has been entrusted with the responsibility to set standard and control the technical and vocational education in the country. BTEB authorizes the TVET institutions to run formal courses with definite content, duration leading to the award for the successful graduates recognized by the employers and by the further education institutions. The non-formal courses have definite content, duration and awards either by BTEB or by the TVET providers are neither recognized by the employers nor by the further education institutions. This section presents the trends of enrollment and the success rates of graduates only for the formal TVET and the next section will present the trends for non-formal education and training.
8.10.1 ANALYSIS OF ENROLMENT TRENDS IN TVET COURSES
Figure 6.18 presents the trends of enrollment in thousand in the public and private TVET institutions affiliated with the BTEB for the period from 2007 to 2011. Enrollment in the private institutions was 4.6 times
Figure : 6.16 Figure : 6.17
SUPPLY AND DEMAND
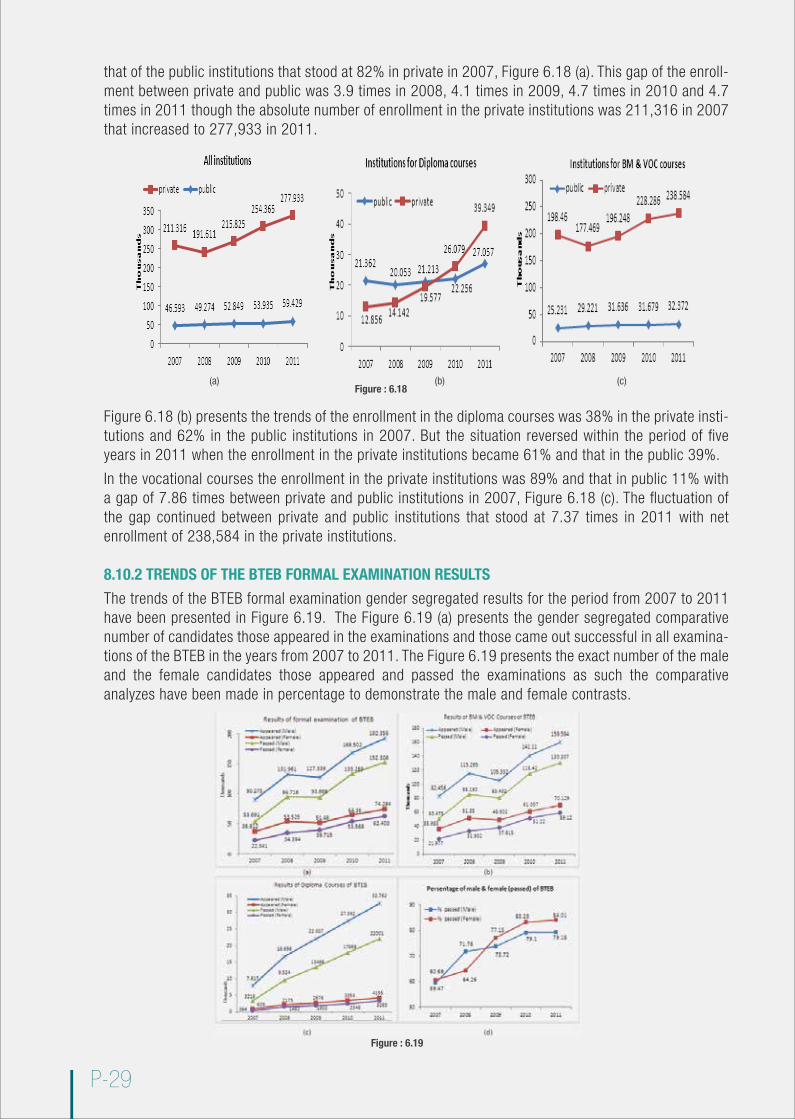
that of the public institutions that stood at 82% in private in 2007, Figure 6.18 (a). This gap of the enroll-ment between private and public was 3.9 times in 2008, 4.1 times in 2009, 4.7 times in 2010 and 4.7 times in 2011 though the absolute number of enrollment in the private institutions was 211,316 in 2007 that increased to 277,933 in 2011.
Figure 6.18 (b) presents the trends of the enrollment in the diploma courses was 38% in the private insti-tutions and 62% in the public institutions in 2007. But the situation reversed within the period of five years in 2011 when the enrollment in the private institutions became 61% and that in the public 39%.
In the vocational courses the enrollment in the private institutions was 89% and that in public 11% with a gap of 7.86 times between private and public institutions in 2007, Figure 6.18 (c). The fluctuation of the gap continued between private and public institutions that stood at 7.37 times in 2011 with net enrollment of 238,584 in the private institutions.
8.10.2 TRENDS OF THE BTEB FORMAL EXAMINATION RESULTS
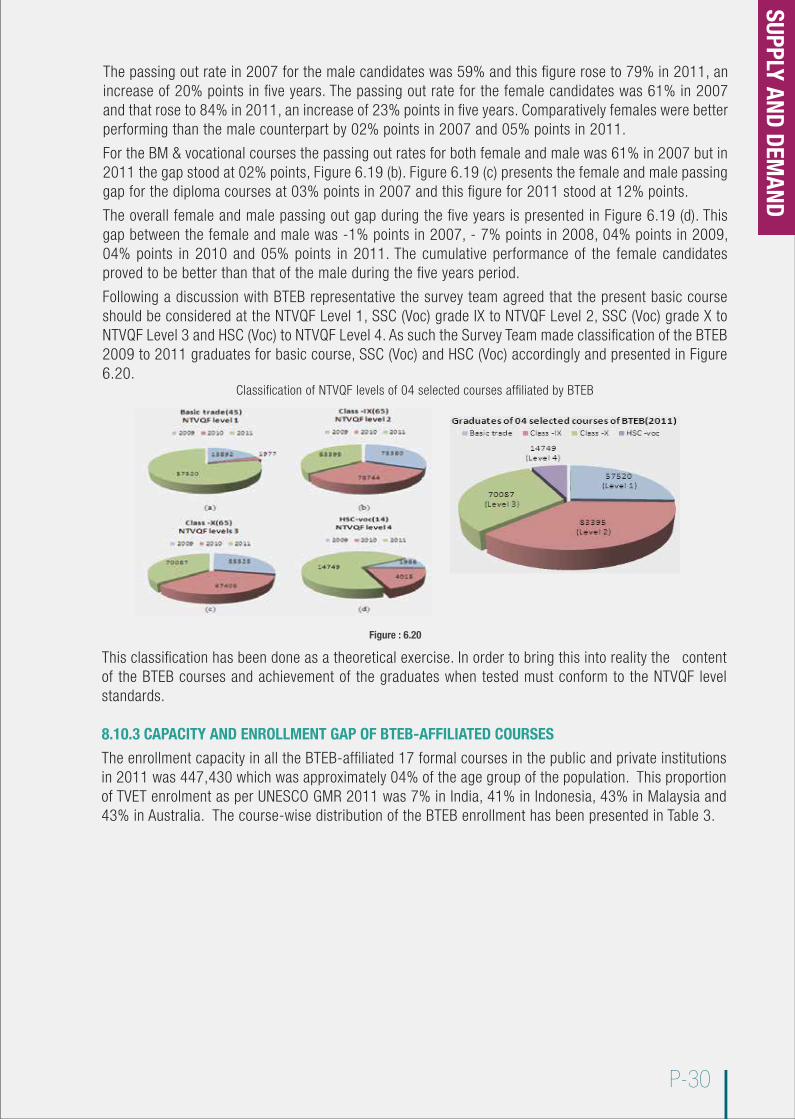
The trends of the BTEB formal examination gender segregated results for the period from 2007 to 2011 have been presented in Figure 6.19. The Figure 6.19 (a) presents the gender segregated comparative number of candidates those appeared in the examinations and those came out successful in all examina-tions of the BTEB in the years from 2007 to 2011. The Figure 6.19 presents the exact number of the male and the female candidates those appeared and passed the examinations as such the comparative analyzes have been made in percentage to demonstrate the male and female contrasts.
P-29
(a) (b) (c)Figure : 6.18
Figure : 6.19
P-30
The passing out rate in 2007 for the male candidates was 59% and this figure rose to 79% in 2011, an increase of 20% points in five years. The passing out rate for the female candidates was 61% in 2007 and that rose to 84% in 2011, an increase of 23% points in five years. Comparatively females were better performing than the male counterpart by 02% points in 2007 and 05% points in 2011.
For the BM & vocational courses the passing out rates for both female and male was 61% in 2007 but in 2011 the gap stood at 02% points, Figure 6.19 (b). Figure 6.19 (c) presents the female and male passing gap for the diploma courses at 03% points in 2007 and this figure for 2011 stood at 12% points.
The overall female and male passing out gap during the five years is presented in Figure 6.19 (d). This gap between the female and male was -1% points in 2007, - 7% points in 2008, 04% points in 2009, 04% points in 2010 and 05% points in 2011. The cumulative performance of the female candidates proved to be better than that of the male during the five years period.
Following a discussion with BTEB representative the survey team agreed that the present basic course should be considered at the NTVQF Level 1, SSC (Voc) grade IX to NTVQF Level 2, SSC (Voc) grade X to NTVQF Level 3 and HSC (Voc) to NTVQF Level 4. As such the Survey Team made classification of the BTEB 2009 to 2011 graduates for basic course, SSC (Voc) and HSC (Voc) accordingly and presented in Figure 6.20.
Classification of NTVQF levels of 04 selected courses affiliated by BTEB
This classification has been done as a theoretical exercise. In order to bring this into reality the content of the BTEB courses and achievement of the graduates when tested must conform to the NTVQF level standards.
8.10.3 CAPACITY AND ENROLLMENT GAP OF BTEB-AFFILIATED COURSES
The enrollment capacity in all the BTEB-affiliated 17 formal courses in the public and private institutions in 2011 was 447,430 which was approximately 04% of the age group of the population. This proportion of TVET enrolment as per UNESCO GMR 2011 was 7% in India, 41% in Indonesia, 43% in Malaysia and 43% in Australia. The course-wise distribution of the BTEB enrollment has been presented in Table 3.
Figure : 6.20
SUPPLY AND DEMAND
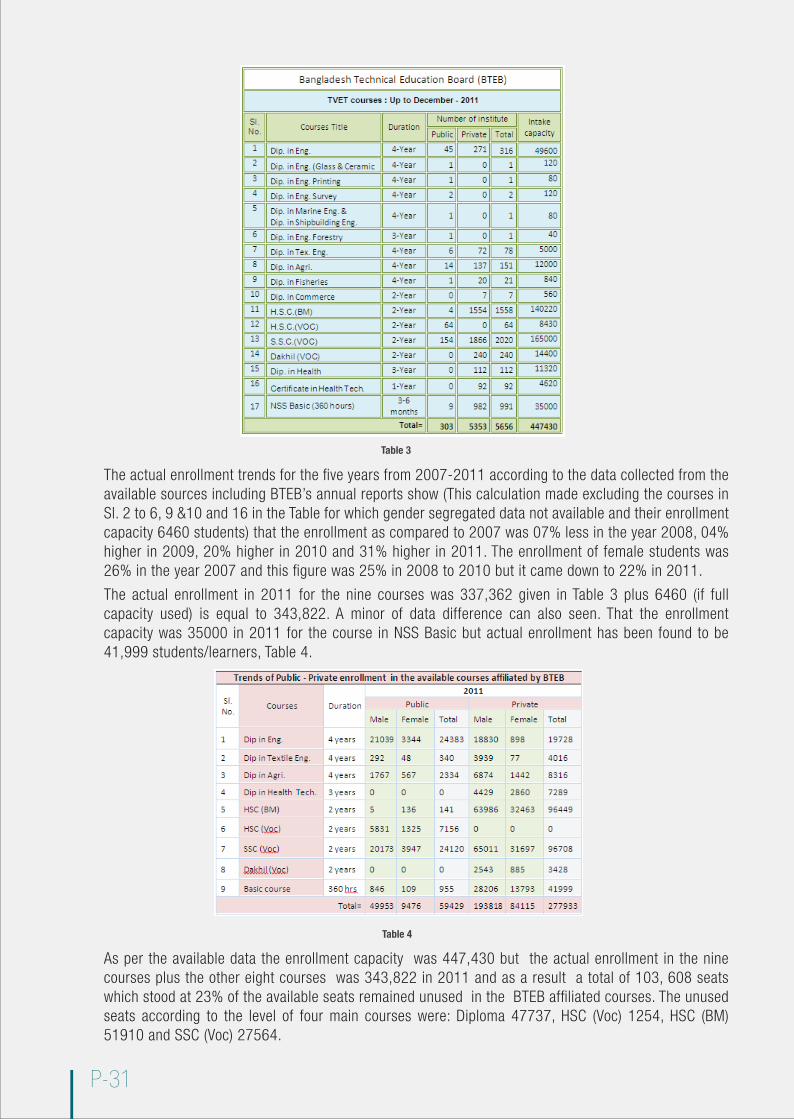
The actual enrollment trends for the five years from 2007-2011 according to the data collected from the available sources including BTEB’s annual reports show (This calculation made excluding the courses in Sl. 2 to 6, 9 &10 and 16 in the Table for which gender segregated data not available and their enrollment capacity 6460 students) that the enrollment as compared to 2007 was 07% less in the year 2008, 04% higher in 2009, 20% higher in 2010 and 31% higher in 2011. The enrollment of female students was 26% in the year 2007 and this figure was 25% in 2008 to 2010 but it came down to 22% in 2011.
The actual enrollment in 2011 for the nine courses was 337,362 given in Table 3 plus 6460 (if full capacity used) is equal to 343,822. A minor of data difference can also seen. That the enrollment capacity was 35000 in 2011 for the course in NSS Basic but actual enrollment has been found to be 41,999 students/learners, Table 4.
As per the available data the enrollment capacity was 447,430 but the actual enrollment in the nine courses plus the other eight courses was 343,822 in 2011 and as a result a total of 103, 608 seats which stood at 23% of the available seats remained unused in the BTEB affiliated courses. The unused seats according to the level of four main courses were: Diploma 47737, HSC (Voc) 1254, HSC (BM) 51910 and SSC (Voc) 27564.
P-31
Table 3
Table 4

P-32
It was not clear why and how the affiliation was granted, why students were not enrolled in these unused seats? The BTEB must take urgent action to assess the causes and on the findings, and if required cancel the affiliation forthwith for those institutions and stop giving such affiliation in the future.
The BTEB’s capacity is very limited in terms of technical competence and has almost no linkage with industries for collection of the changing patterns of the skilled workforce job contents for curriculum preparation and updating. BTEB has been entrusted with the responsibilities for ensuring implementation of the NTVQF, ISSQ (Industry Sector Standards and Qualifications), RPL, SQA (Skills Quality Assurance) and Equity Issues in the implementation of the NSDP.
BTEB does not maintain a comprehensive and systematic data base for the registered students and graduates together with the employment market trends for curriculum preparation and updating. As such, curriculum preparation and updating are done by the BTEB by engaging subject teachers with no industrial experience. In such a situation, the prepared, updated and on-going curriculum of the BTEB is not at all tuned to the job market demand in the form of NTVQF levels and remains irrelevant and redundant to the ever changing needs of the job market.
8.10.4 STAFF CAPACITY IN THE PUBLIC TVET INSTITUTIONS
The staff capacity issue focuses only on student-teacher ratio and training of teachers of the public institutions based on the findings of the two assessments concerning the teachers.
Student-teacher ratio
An assessment was conducted with secondary data from the DTE in 2011 on the student-teacher ratio in the public polytechnics under the Ministry of Education run by the DTE. The findings of the assessment are briefly presented as:
In short, the student- teacher ratio in polytechnics faces a very serious crisis in the manner of:four-year diploma course 1: 24
• with present 47% teachers vacant position raises to 1: 47• practical session with 12 student per teacher 1:70 • double shift diploma course in operation may push the ratio to 1:140
The national average student-teacher ratio reflects the overall picture of availability of teachers but there are a number of new polytechnics with almost no teachers except a few borrowed from other institutes and some limited numbers engaged purely on temporary muster roll basis.
As a result, there are instances where public polytechnic teachers are encouraged to take classes for monetary benefit in the nearby private polytechnic institutions.The reasons for the serious crisis concerning the student- teacher ratio are not simple to explain. This partly may be attributed to the unusually lengthy and faulty teacher selection and recruitment processes, inadequate flow of resources and the lack of attention and clear understating about the needs and impor-tance of designing and implementing contextual TVET sub-sector programmes.
Training of teachers
An extract from the assessment of the training needs of polytechnic teachers shows that a good TVET teacher must possess required academic qualification along with integrated training and experience compo-nents of:
• subject skills and pedagogy, • TVET teaching experience,• industrial experience, • industrial training and• management training.
A comparative capacity assessment in 1983 and repeated in 2011 at an interval of approximately 30 years on the capacity of public polytechnic employed teachers/staff in the context of the above mentioned five components represents in a limited way hidden picture of the deplorable conditions presented in Table 5.
SUPPLY AND DEMAND
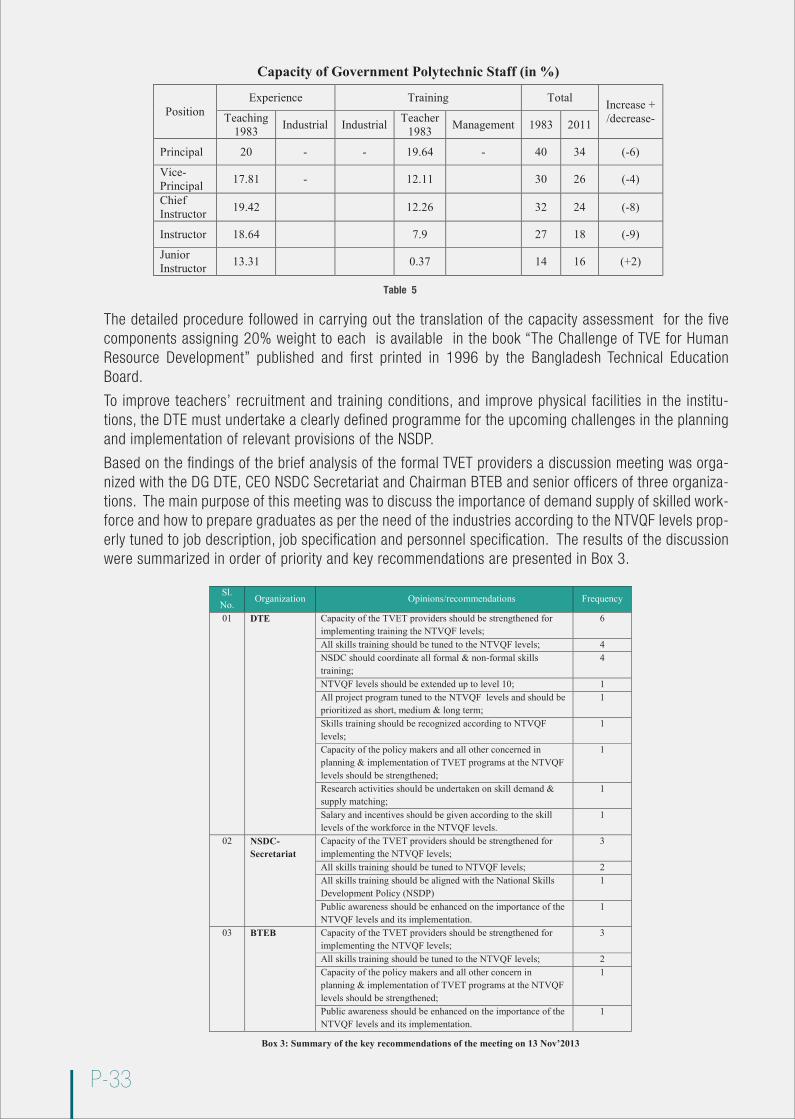
The detailed procedure followed in carrying out the translation of the capacity assessment for the five components assigning 20% weight to each is available in the book “The Challenge of TVE for Human Resource Development” published and first printed in 1996 by the Bangladesh Technical Education Board.
To improve teachers’ recruitment and training conditions, and improve physical facilities in the institu-tions, the DTE must undertake a clearly defined programme for the upcoming challenges in the planning and implementation of relevant provisions of the NSDP.
Based on the findings of the brief analysis of the formal TVET providers a discussion meeting was orga-nized with the DG DTE, CEO NSDC Secretariat and Chairman BTEB and senior officers of three organiza-tions. The main purpose of this meeting was to discuss the importance of demand supply of skilled work-force and how to prepare graduates as per the need of the industries according to the NTVQF levels prop-erly tuned to job description, job specification and personnel specification. The results of the discussion were summarized in order of priority and key recommendations are presented in Box 3.
P-33
Capacity of Government Polytechnic Staff (in %)
PositionExperience Training Total Increase +
/decrease-Teaching 1983 Industrial Industrial Teacher
1983 Management 1983 2011
Principal 20 - - 19.64 - 40 34 (-6)
Vice-Principal 17.81 - 12.11 30 26 (-4)
Chief Instructor 19.42 12.26 32 24 (-8)
Instructor 18.64 7.9 27 18 (-9)
Junior Instructor 13.31 0.37 14 16 (+2)
Table 5
Sl. No.
Organization Opinions/recommendations Frequency
01 DTE Capacity of the TVET providers should be strengthened for implementing training the NTVQF levels;
6
All skills training should be tuned to the NTVQF levels; 4NSDC should coordinate all formal & non-formal skills training;
4
NTVQF levels should be extended up to level 10; 1All project program tuned to the NTVQF levels and should be prioritized as short, medium & long term;
1
Skills training should be recognized according to NTVQF levels;
1
Capacity of the policy makers and all other concerned in planning & implementation of TVET programs at the NTVQF levels should be strengthened;
1
Research activities should be undertaken on skill demand & supply matching;
1
Salary and incentives should be given according to the skill levels of the workforce in the NTVQF levels.
1
02 NSDC-Secretariat
Capacity of the TVET providers should be strengthened for implementing the NTVQF levels;
3
All skills training should be tuned to NTVQF levels; 2All skills training should be aligned with the National Skills Development Policy (NSDP)
1
Public awareness should be enhanced on the importance of the NTVQF levels and its implementation.
1
03 BTEB Capacity of the TVET providers should be strengthened for implementing the NTVQF levels;
3
All skills training should be tuned to the NTVQF levels; 2Capacity of the policy makers and all other concern in planning & implementation of TVET programs at the NTVQF levels should be strengthened;
1
Public awareness should be enhanced on the importance of the NTVQF levels and its implementation.
1
Box 3: Summary of the key recommendations of the meeting on 13 Nov’2013
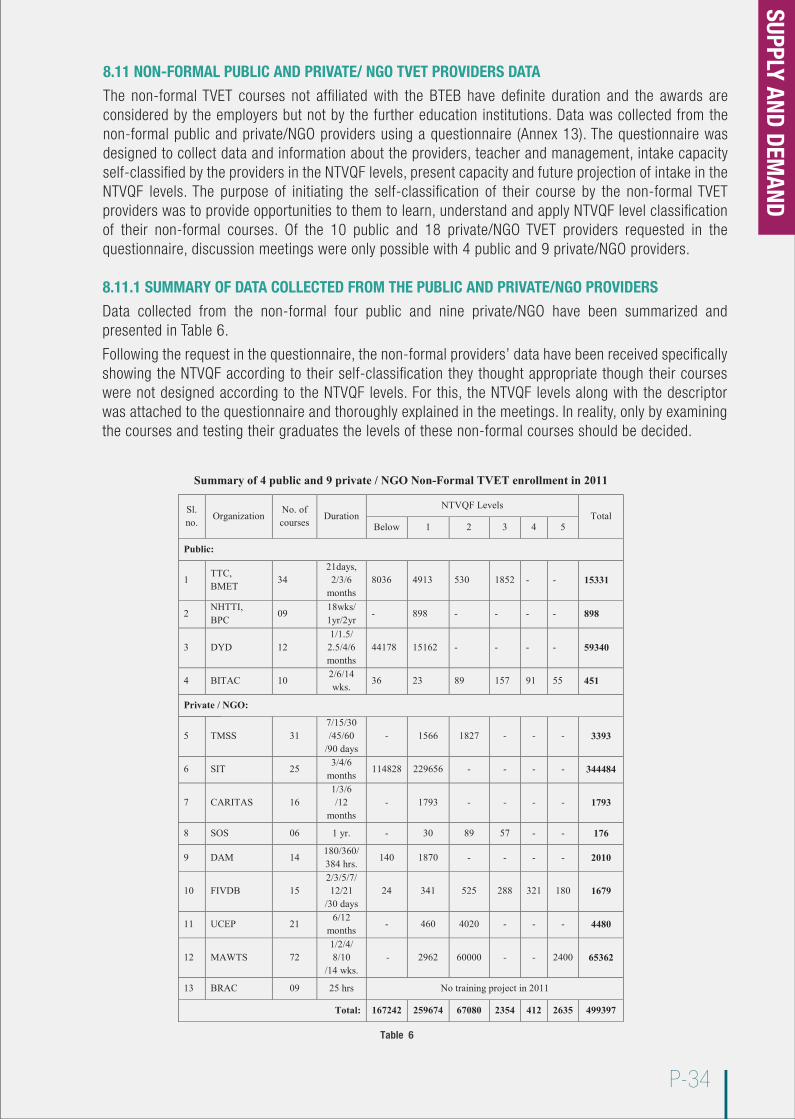
P-34
8.11 NON-FORMAL PUBLIC AND PRIVATE/ NGO TVET PROVIDERS DATA
The non-formal TVET courses not affiliated with the BTEB have definite duration and the awards are considered by the employers but not by the further education institutions. Data was collected from the non-formal public and private/NGO providers using a questionnaire (Annex 13). The questionnaire was designed to collect data and information about the providers, teacher and management, intake capacity self-classified by the providers in the NTVQF levels, present capacity and future projection of intake in the NTVQF levels. The purpose of initiating the self-classification of their course by the non-formal TVET providers was to provide opportunities to them to learn, understand and apply NTVQF level classification of their non-formal courses. Of the 10 public and 18 private/NGO TVET providers requested in the questionnaire, discussion meetings were only possible with 4 public and 9 private/NGO providers.
8.11.1 SUMMARY OF DATA COLLECTED FROM THE PUBLIC AND PRIVATE/NGO PROVIDERS
Data collected from the non-formal four public and nine private/NGO have been summarized and presented in Table 6.
Following the request in the questionnaire, the non-formal providers’ data have been received specifically showing the NTVQF according to their self-classification they thought appropriate though their courses were not designed according to the NTVQF levels. For this, the NTVQF levels along with the descriptor was attached to the questionnaire and thoroughly explained in the meetings. In reality, only by examining the courses and testing their graduates the levels of these non-formal courses should be decided.
Summary of 4 public and 9 private / NGO Non-Formal TVET enrollment in 2011
Sl. no.
OrganizationNo. of courses
DurationNTVQF Levels
TotalBelow 1 2 3 4 5
Public:
1TTC,BMET
3421days,
2/3/6 months
8036 4913 530 1852 - - 15331
2NHTTI,BPC
0918wks/ 1yr/2yr
- 898 - - - - 898
3 DYD 121/1.5/
2.5/4/6 months
44178 15162 - - - - 59340
4 BITAC 102/6/14 wks.
36 23 89 157 91 55 451
Private / NGO:
5 TMSS 317/15/30/45/60
/90 days- 1566 1827 - - - 3393
6 SIT 253/4/6
months114828 229656 - - - - 344484
7 CARITAS 161/3/6/12
months- 1793 - - - - 1793
8 SOS 06 1 yr. - 30 89 57 - - 176
9 DAM 14180/360/ 384 hrs.
140 1870 - - - - 2010
10 FIVDB 152/3/5/7/12/21
/30 days24 341 525 288 321 180 1679
11 UCEP 216/12
months- 460 4020 - - - 4480
12 MAWTS 721/2/4/8/10
/14 wks.- 2962 60000 - - 2400 65362
13 BRAC 09 25 hrs No training project in 2011
Total: 167242 259674 67080 2354 412 2635 499397
Table 6
SUPPLY AND DEMAND
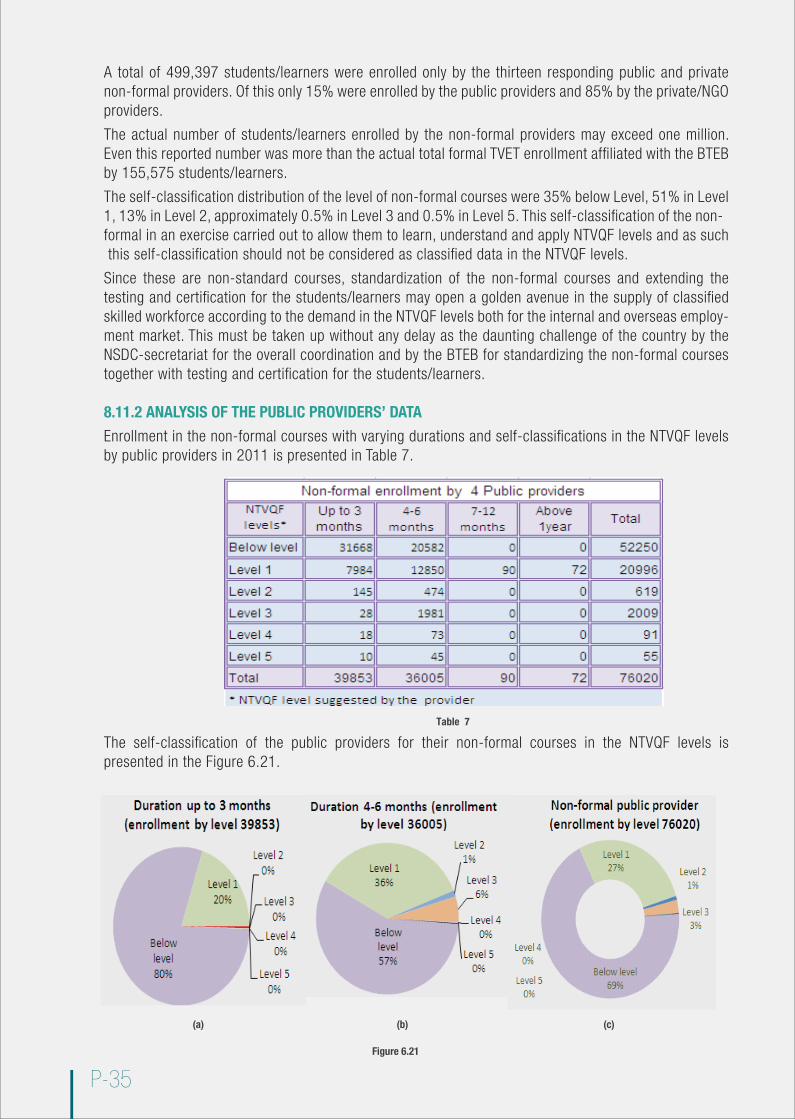
A total of 499,397 students/learners were enrolled only by the thirteen responding public and private non-formal providers. Of this only 15% were enrolled by the public providers and 85% by the private/NGO providers.
The actual number of students/learners enrolled by the non-formal providers may exceed one million. Even this reported number was more than the actual total formal TVET enrollment affiliated with the BTEB by 155,575 students/learners.
The self-classification distribution of the level of non-formal courses were 35% below Level, 51% in Level 1, 13% in Level 2, approximately 0.5% in Level 3 and 0.5% in Level 5. This self-classification of the non-formal in an exercise carried out to allow them to learn, understand and apply NTVQF levels and as such this self-classification should not be considered as classified data in the NTVQF levels.
Since these are non-standard courses, standardization of the non-formal courses and extending the testing and certification for the students/learners may open a golden avenue in the supply of classified skilled workforce according to the demand in the NTVQF levels both for the internal and overseas employ-ment market. This must be taken up without any delay as the daunting challenge of the country by the NSDC-secretariat for the overall coordination and by the BTEB for standardizing the non-formal courses together with testing and certification for the students/learners.
8.11.2 ANALYSIS OF THE PUBLIC PROVIDERS’ DATA
Enrollment in the non-formal courses with varying durations and self-classifications in the NTVQF levels by public providers in 2011 is presented in Table 7.
The self-classification of the public providers for their non-formal courses in the NTVQF levels is presented in the Figure 6.21.
P-35
Table 7
(a) (b) (c)
Figure 6.21
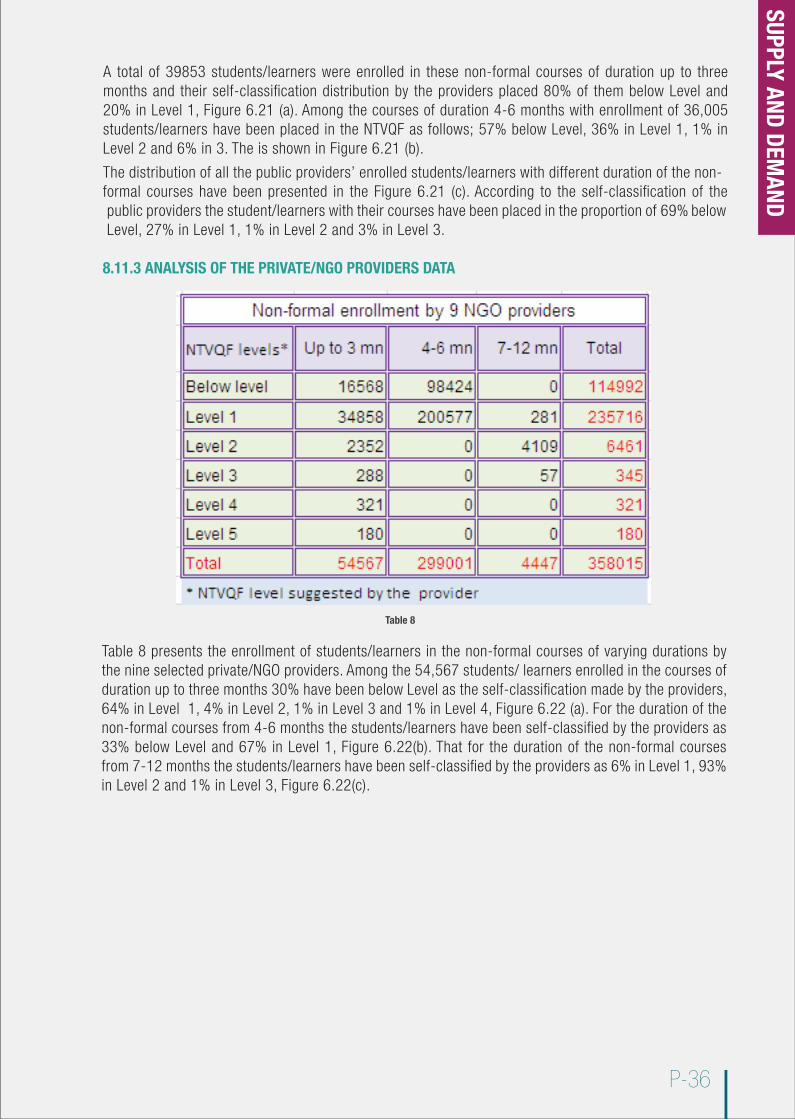
P-36
A total of 39853 students/learners were enrolled in these non-formal courses of duration up to three months and their self-classification distribution by the providers placed 80% of them below Level and 20% in Level 1, Figure 6.21 (a). Among the courses of duration 4-6 months with enrollment of 36,005 students/learners have been placed in the NTVQF as follows; 57% below Level, 36% in Level 1, 1% in Level 2 and 6% in 3. The is shown in Figure 6.21 (b).
The distribution of all the public providers’ enrolled students/learners with different duration of the non-formal courses have been presented in the Figure 6.21 (c). According to the self-classification of the public providers the student/learners with their courses have been placed in the proportion of 69% below Level, 27% in Level 1, 1% in Level 2 and 3% in Level 3.
8.11.3 ANALYSIS OF THE PRIVATE/NGO PROVIDERS DATA
Table 8 presents the enrollment of students/learners in the non-formal courses of varying durations by the nine selected private/NGO providers. Among the 54,567 students/ learners enrolled in the courses of duration up to three months 30% have been below Level as the self-classification made by the providers, 64% in Level 1, 4% in Level 2, 1% in Level 3 and 1% in Level 4, Figure 6.22 (a). For the duration of the non-formal courses from 4-6 months the students/learners have been self-classified by the providers as 33% below Level and 67% in Level 1, Figure 6.22(b). That for the duration of the non-formal courses from 7-12 months the students/learners have been self-classified by the providers as 6% in Level 1, 93% in Level 2 and 1% in Level 3, Figure 6.22(c).
Table 8
SUPPLY AND DEMAND
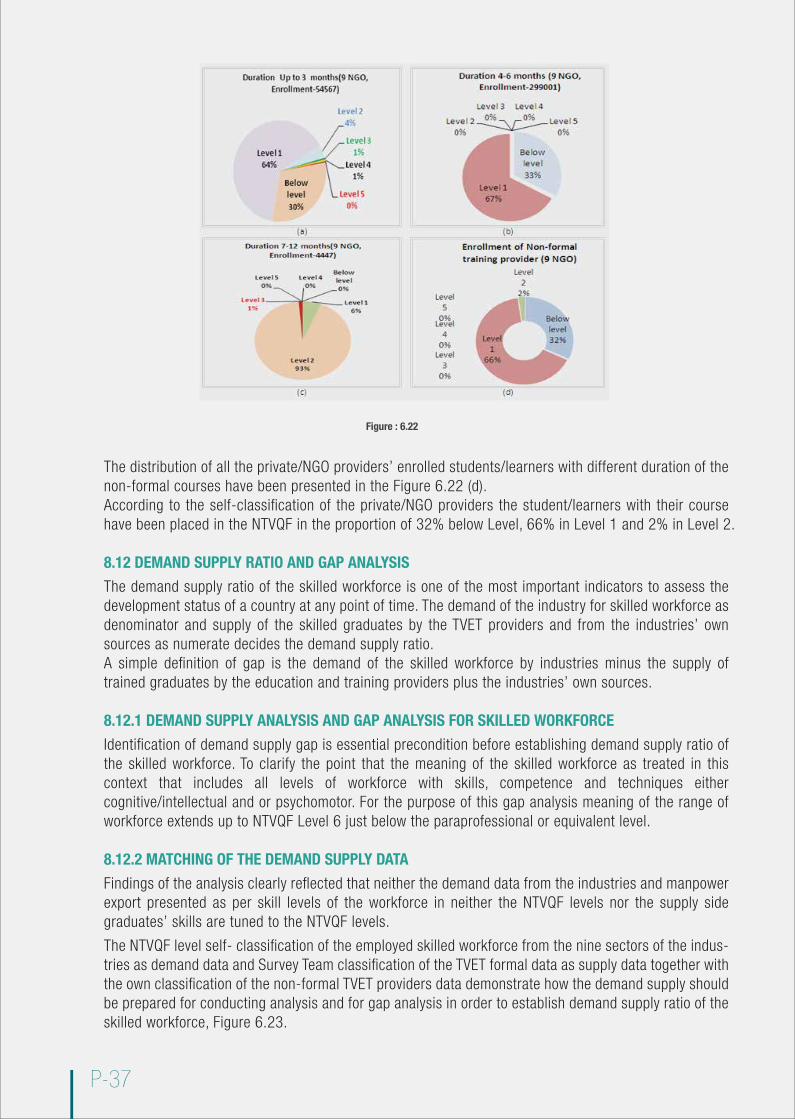
The distribution of all the private/NGO providers’ enrolled students/learners with different duration of the non-formal courses have been presented in the Figure 6.22 (d). According to the self-classification of the private/NGO providers the student/learners with their course have been placed in the NTVQF in the proportion of 32% below Level, 66% in Level 1 and 2% in Level 2.
8.12 DEMAND SUPPLY RATIO AND GAP ANALYSIS
The demand supply ratio of the skilled workforce is one of the most important indicators to assess the development status of a country at any point of time. The demand of the industry for skilled workforce as denominator and supply of the skilled graduates by the TVET providers and from the industries’ own sources as numerate decides the demand supply ratio. A simple definition of gap is the demand of the skilled workforce by industries minus the supply of trained graduates by the education and training providers plus the industries’ own sources.
8.12.1 DEMAND SUPPLY ANALYSIS AND GAP ANALYSIS FOR SKILLED WORKFORCE
Identification of demand supply gap is essential precondition before establishing demand supply ratio of the skilled workforce. To clarify the point that the meaning of the skilled workforce as treated in this context that includes all levels of workforce with skills, competence and techniques either cognitive/intellectual and or psychomotor. For the purpose of this gap analysis meaning of the range of workforce extends up to NTVQF Level 6 just below the paraprofessional or equivalent level. 8.12.2 MATCHING OF THE DEMAND SUPPLY DATA
Findings of the analysis clearly reflected that neither the demand data from the industries and manpower export presented as per skill levels of the workforce in neither the NTVQF levels nor the supply side graduates’ skills are tuned to the NTVQF levels.
The NTVQF level self- classification of the employed skilled workforce from the nine sectors of the indus-tries as demand data and Survey Team classification of the TVET formal data as supply data together with the own classification of the non-formal TVET providers data demonstrate how the demand supply should be prepared for conducting analysis and for gap analysis in order to establish demand supply ratio of the skilled workforce, Figure 6.23.
P-37
Figure : 6.22
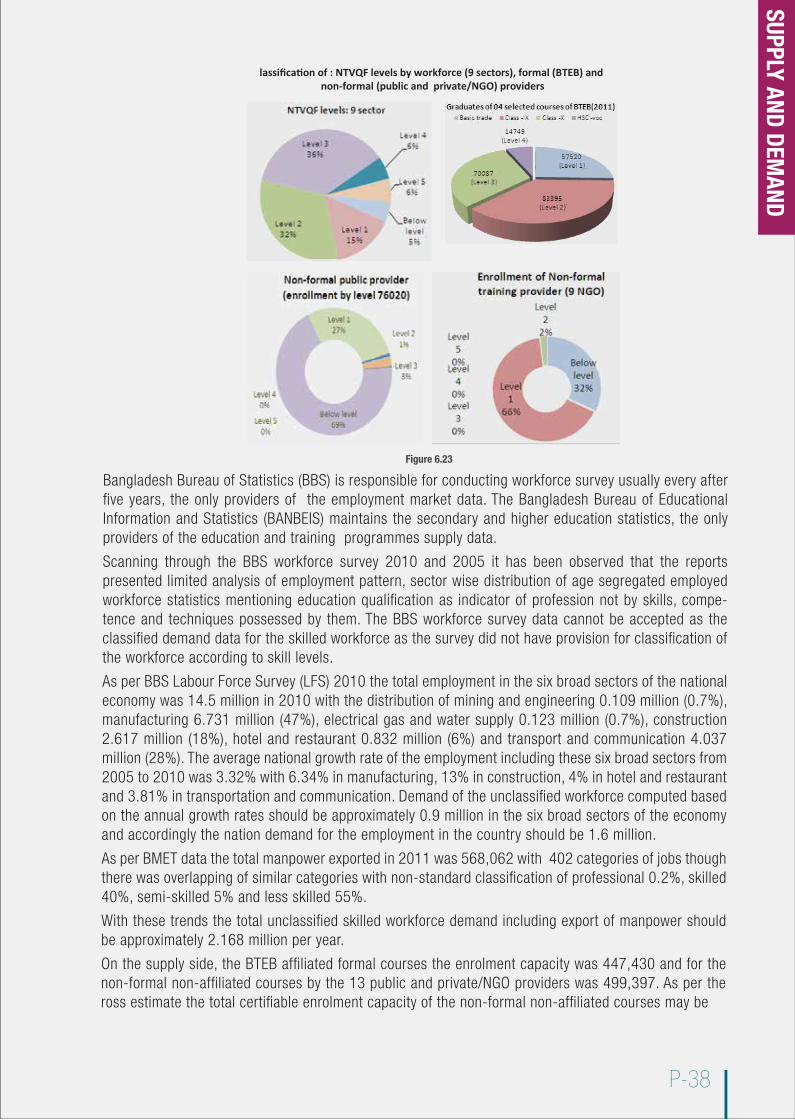
P-38
Bangladesh Bureau of Statistics (BBS) is responsible for conducting workforce survey usually every after five years, the only providers of the employment market data. The Bangladesh Bureau of Educational Information and Statistics (BANBEIS) maintains the secondary and higher education statistics, the only providers of the education and training programmes supply data.
Scanning through the BBS workforce survey 2010 and 2005 it has been observed that the reports presented limited analysis of employment pattern, sector wise distribution of age segregated employed workforce statistics mentioning education qualification as indicator of profession not by skills, compe-tence and techniques possessed by them. The BBS workforce survey data cannot be accepted as the classified demand data for the skilled workforce as the survey did not have provision for classification of the workforce according to skill levels.
As per BBS Labour Force Survey (LFS) 2010 the total employment in the six broad sectors of the national economy was 14.5 million in 2010 with the distribution of mining and engineering 0.109 million (0.7%), manufacturing 6.731 million (47%), electrical gas and water supply 0.123 million (0.7%), construction 2.617 million (18%), hotel and restaurant 0.832 million (6%) and transport and communication 4.037 million (28%). The average national growth rate of the employment including these six broad sectors from 2005 to 2010 was 3.32% with 6.34% in manufacturing, 13% in construction, 4% in hotel and restaurant and 3.81% in transportation and communication. Demand of the unclassified workforce computed based on the annual growth rates should be approximately 0.9 million in the six broad sectors of the economy and accordingly the nation demand for the employment in the country should be 1.6 million.
As per BMET data the total manpower exported in 2011 was 568,062 with 402 categories of jobs though there was overlapping of similar categories with non-standard classification of professional 0.2%, skilled 40%, semi-skilled 5% and less skilled 55%.
With these trends the total unclassified skilled workforce demand including export of manpower should be approximately 2.168 million per year.
On the supply side, the BTEB affiliated formal courses the enrolment capacity was 447,430 and for the non-formal non-affiliated courses by the 13 public and private/NGO providers was 499,397. As per the ross estimate the total certifiable enrolment capacity of the non-formal non-affiliated courses may be
Figure 6.23
lassification of : NTVQF levels by workforce (9 sectors), formal (BTEB) and non-formal (public and private/NGO) providers
SUPPLY AND DEMAND
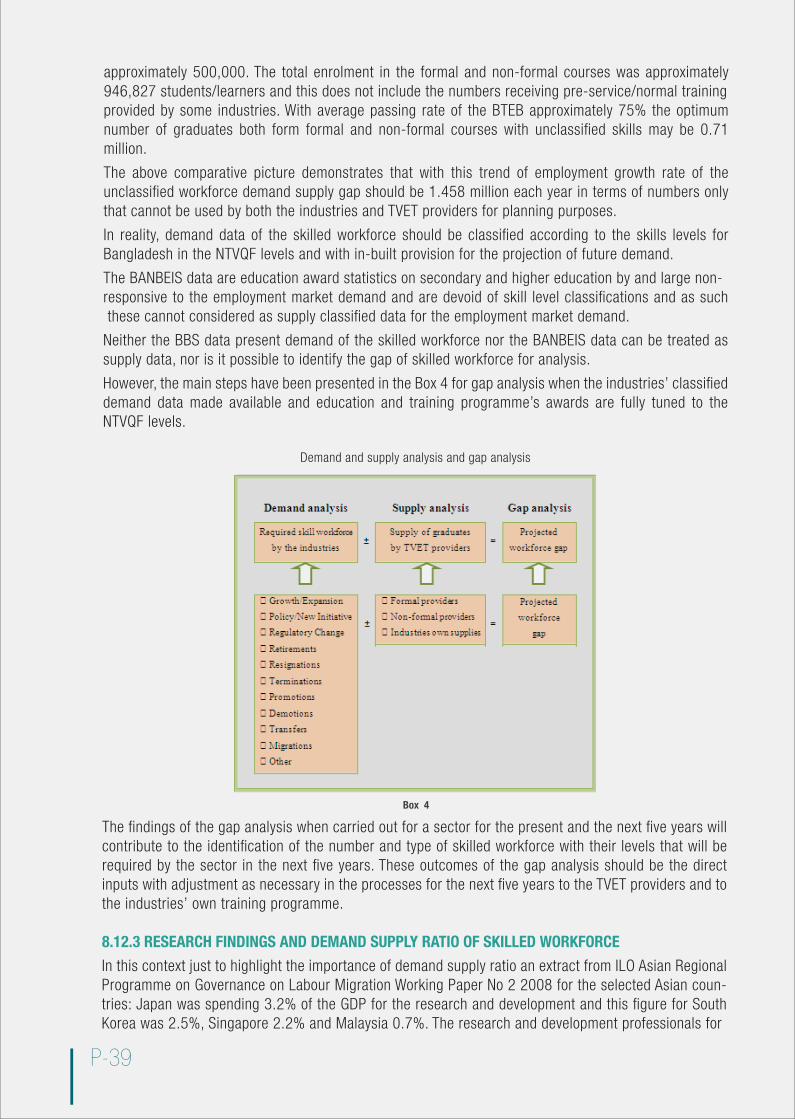
P-39
approximately 500,000. The total enrolment in the formal and non-formal courses was approximately 946,827 students/learners and this does not include the numbers receiving pre-service/normal trainingprovided by some industries. With average passing rate of the BTEB approximately 75% the optimum number of graduates both form formal and non-formal courses with unclassified skills may be 0.71 million.
The above comparative picture demonstrates that with this trend of employment growth rate of the unclassified workforce demand supply gap should be 1.458 million each year in terms of numbers only that cannot be used by both the industries and TVET providers for planning purposes.
In reality, demand data of the skilled workforce should be classified according to the skills levels for Bangladesh in the NTVQF levels and with in-built provision for the projection of future demand.
The BANBEIS data are education award statistics on secondary and higher education by and large non-responsive to the employment market demand and are devoid of skill level classifications and as such these cannot considered as supply classified data for the employment market demand.
Neither the BBS data present demand of the skilled workforce nor the BANBEIS data can be treated as supply data, nor is it possible to identify the gap of skilled workforce for analysis.
However, the main steps have been presented in the Box 4 for gap analysis when the industries’ classified demand data made available and education and training programme’s awards are fully tuned to the NTVQF levels.
Demand and supply analysis and gap analysis
The findings of the gap analysis when carried out for a sector for the present and the next five years will contribute to the identification of the number and type of skilled workforce with their levels that will be required by the sector in the next five years. These outcomes of the gap analysis should be the direct inputs with adjustment as necessary in the processes for the next five years to the TVET providers and to the industries’ own training programme.
8.12.3 RESEARCH FINDINGS AND DEMAND SUPPLY RATIO OF SKILLED WORKFORCE
In this context just to highlight the importance of demand supply ratio an extract from ILO Asian Regional Programme on Governance on Labour Migration Working Paper No 2 2008 for the selected Asian coun-tries: Japan was spending 3.2% of the GDP for the research and development and this figure for South Korea was 2.5%, Singapore 2.2% and Malaysia 0.7%. The research and development professionals for
Box 4
P-40
one million population in Japan was 5,000, South Korea 3,000, Singapore 4,200 and Malaysia 300.This figure for Bangladesh stands at 51 (presumably not actively as relevant researchers).
This study finding recommended that investment in research and development contributes to enhanced capacity of establishing better demand supply ratio of workforce and their higher productivity. The findings also suggested that the skill level classification of the workforce is the essential precondition for establishing demand supply ratio.
What Malaysia is doing
Malaysia has planned to transform the number of highly skilled workers to at least 33 per cent by 2015 and 50 per cent by 2020 to become a developed nation. Currently, only 28 percent of the country's work-force is highly skilled. This projection has been made mandatory for the industries for their employed workforce and for the Ministry of Education (MoE) to tune education and training programme to supply graduates accordingly.
What India is doing
India has undertaken a massive programme and started implementation to produce 700 million globally employable skilled workforces by 2020 of which 200 million university graduates and above and the 500 million skilled workforce.
What happened to Australia?
According to the Department of Education Employment and Workplace Relations, Australia could fill up only 62% of the positions in 2011 for which only 1.7 qualified applicants were available. Australia's energy industry, which is driving growth with more than $150 billion worth of new projects for next 10 years is in a serious skills crisis.
Among the demand supply projection of the three countries, India’s projection of globally employment of 700 million workforce appears to be more dynamic and challenging as this does not define the specific-ity of the skills and their levels the country’s needs. Malaysia has made very specific projection directly mentioning level of skills. But in case of Australia the projection of skills crisis has been translated in terms of economic value and appears to be more sophisticated planning for skills.
8.12.4 ESTABLISHING THE DEMAND/SUPPLY RATIO OF SKILLED WORKERS IN BANGLADESH
Reference to NSS Phase 1 in Figure 6.9 where the self-classification of the employed workforce rated them in the NTVQF levels that far exceeded the level of training received by them presented in Figure 6.7. Figure 6.10 presents that the industries used components of the job profile more than they prepared because they were not capable of preparing NTVQF level demand for skilled workforce. In this context the key extracted recommendations of the industry representatives on their capacity strengthening are:
• Demand should be placed by the industry as per NTVQF levels with the job description, job specification & personnel specification. • Capacity of the industries and TVET providers should be strengthened for placing demand and for planning & implementing training tuned to NTVQF levels.
Reference to section 6.3.1 the BMET Directors responsible for maintaining manpower export data recom-mended for the capacity strengthening both for placing demand for manpower export and for planning & implementing training tuned to NTVQF levels. Their key recommendations taken from Box 2 are:
Capacity strengthening is necessary for both skill training providers for tuning their training programme to the NTVQF levels and for the ISCs/industries to prepare the job content with job description, job specifi-cation and personnel specification tuned to the NTVQF levels.
Reference to the findings of sections 6.4.1 to 6.4.4 the formal TVET providers DG DTE and Chairman BTEB including CEO NSDC Secretariat recommended for their capacity strengthening for tuning the skill levels of their graduates to the NTVQF levels. Their key prioritized recommendations extracted from Box 3 are:
SUPPLY AND DEMAND
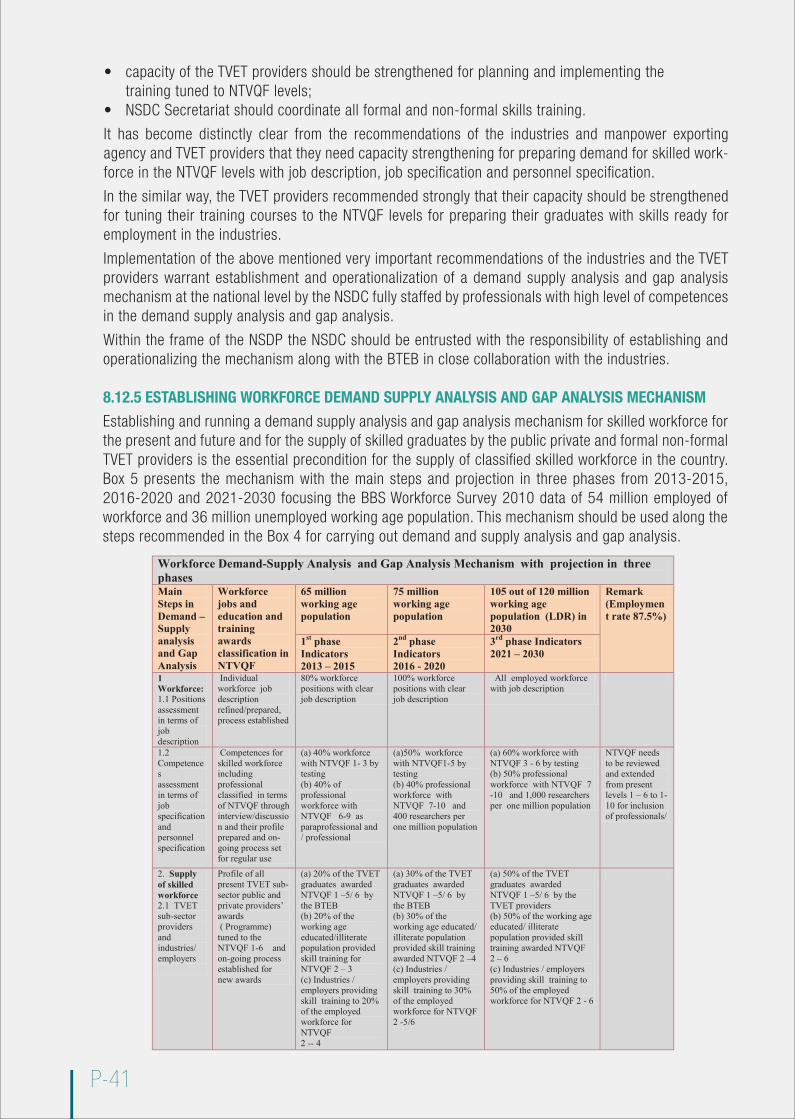
P-41
• capacity of the TVET providers should be strengthened for planning and implementing the training tuned to NTVQF levels; • NSDC Secretariat should coordinate all formal and non-formal skills training.
It has become distinctly clear from the recommendations of the industries and manpower exporting agency and TVET providers that they need capacity strengthening for preparing demand for skilled work-force in the NTVQF levels with job description, job specification and personnel specification.
In the similar way, the TVET providers recommended strongly that their capacity should be strengthened for tuning their training courses to the NTVQF levels for preparing their graduates with skills ready for employment in the industries.
Implementation of the above mentioned very important recommendations of the industries and the TVET providers warrant establishment and operationalization of a demand supply analysis and gap analysis mechanism at the national level by the NSDC fully staffed by professionals with high level of competences in the demand supply analysis and gap analysis.
Within the frame of the NSDP the NSDC should be entrusted with the responsibility of establishing and operationalizing the mechanism along with the BTEB in close collaboration with the industries.
8.12.5 ESTABLISHING WORKFORCE DEMAND SUPPLY ANALYSIS AND GAP ANALYSIS MECHANISM
Establishing and running a demand supply analysis and gap analysis mechanism for skilled workforce for the present and future and for the supply of skilled graduates by the public private and formal non-formal TVET providers is the essential precondition for the supply of classified skilled workforce in the country. Box 5 presents the mechanism with the main steps and projection in three phases from 2013-2015, 2016-2020 and 2021-2030 focusing the BBS Workforce Survey 2010 data of 54 million employed of workforce and 36 million unemployed working age population. This mechanism should be used along the steps recommended in the Box 4 for carrying out demand and supply analysis and gap analysis.
Workforce Demand-Supply Analysis and Gap Analysis Mechanism with projection in three phasesMain Steps in Demand –Supply analysis and Gap Analysis
Workforce jobs and education and training awards classification in NTVQF
65 million working age population
75 million working age population
105 out of 120 million working age population (LDR) in 2030
Remark(Employment rate 87.5%)
1st phase Indicators2013 – 2015
2nd phase Indicators2016 - 2020
3rd phase Indicators2021 – 2030
1 Workforce:1.1 Positions assessment in terms of job description
Individual workforce job description refined/prepared, process established
80% workforce positions with clear job description
100% workforce positions with clear job description
All employed workforce with job description
1.2 Competences assessment in terms of job specification and personnel specification
Competences for skilled workforce including professional classified in terms of NTVQF through interview/discussion and their profile prepared and on-going process set for regular use
(a) 40% workforce with NTVQF 1- 3 by testing(b) 40% of professional workforce with NTVQF 6-9 as paraprofessional and / professional
(a)50% workforce with NTVQF1-5 by testing(b) 40% professional workforce with NTVQF 7-10 and 400 researchers per one million population
(a) 60% workforce with NTVQF 3 - 6 by testing(b) 50% professionalworkforce with NTVQF 7 -10 and 1,000 researchers per one million population
NTVQF needs to be reviewed and extended from present levels 1 – 6 to 1-10 for inclusion of professionals/
2. Supply of skilled workforce2.1 TVET sub-sector providers and industries/employers
Profile of all present TVET sub-sector public and private providers’ awards ( Programme)
tuned to the NTVQF 1-6 and on-going process established for new awards
(a) 20% of the TVET graduates awarded NTVQF 1 –5/ 6 by the BTEB (b) 20% of the working age educated/illiterate population provided skill training for NTVQF 2 – 3 (c) Industries / employers providing skill training to 20% of the employed workforce for NTVQF 2 -- 4
(a) 30% of the TVET graduates awarded NTVQF 1 –5/ 6 by the BTEB (b) 30% of the working age educated/ illiterate population provided skill training awarded NTVQF 2 –4 (c) Industries / employers providing skill training to 30% of the employed workforce for NTVQF 2 -5/6
(a) 50% of the TVET graduates awarded NTVQF 1 –5/ 6 by the TVET providers(b) 50% of the working age educated/ illiterate population provided skill training awarded NTVQF2 – 6 (c) Industries / employers providing skill training to 50% of the employed workforce for NTVQF 2 - 6

P-42
The detailed planning for operationalization of the Mechanism can be found in the book “Capacity Strengthening on Policy and Performance Analysis and TVET Sub-sector Programme Preparation in Bangladesh ID: 3085069” E-published by the Amazon Kindle Direct Publishing, November 2012.
The full achievement of the three phases will ensure transformation of 87.5% of the working age popula-tion as skilled and highly skilled workforce that should place Bangladesh in the group of the developed nations of the world by 2030.
8.12.6 SHARING OF SURVEY FINDINGS WITH STAKEHOLDERS
With a view to obtaining pinions and views of the stakeholders including development partners on the findings of the NSS a meeting was organized on 8 December 2012. The meeting was presided and mod-erated by Ms Rasheda K Chowdhury former Adviser to the Caretaker Government and Executive Director of the Campaign for Popular Education and Kazi Saleh Ahmed former Vice-Chancellor of the Jahangir Nagar University was the key note speaker.
The meeting started with a briefing on the background of the NSS Phase 1 followed by power point presentation highlighting the key findings of the NSS Phase 1. Following the address of the keynote speaker the floor was opened for comments, suggestions, clarifications, discussions, opinions and recommendations from and by the participants/guests.
The findings of the survey were also shared in the SDC office conference room in an exclusive session on 14 December 2012 through a presentation followed by discussions and clarifications.
8.12.7 RECOMMENDATIONS
As a result of analysis and synthesis of the findings of the data and opinions/recommendations received through the FGDs along with the outcome of the two discussion meetings conducted with formal TVET providers and manpower exporting agency and the outcome of the sharing meetings with the stakehold-ers, a series of recommendations have immerged and important among are:
2.2 University/ tertiary education institutions
Public/private universities and other tertiary education awards (programme) tuned to NTVQF 7 – 10 with on-going processes
(a) 40% of the graduates with NTVQF 7 -10 as processional and researchers (b) University/ tertiary enrolment raised from present 7% to 10% of age group
(a) 60% of graduates with NTVQF 7 -10 as processional, researchers/ policymakers(b) University/tertiary enrolment raised to 15% of age group
(a) 90% of the graduates with NTVQF 7 -10 as processional , researchers/ policymakers (b) University/ tertiary enrolment raised to 30% of age group
(a) University/tertiary education enrollment raised from 7% to 30% of the age group
3. Gap analysis of demand supply of skilled workforce employment as regular process
Analysis of matching of skilled jobs classification and education and training providers award tuned to NTVQF 1 - 10
Analysis of: (a)National and global employment market demand(b)Education and training providers’ graduates(c) Gap between (a) and (b)
Analysis of: (a)National and global employment market demand(b)Education and training providers’ graduates(c) Gap between (a) and b)
Analysis of: (a)National and global employment market demand(b)Education and training providers’ graduates(c) Gap between (a) and (b)
Gap of demand -supply of skilled workforce established in NTVQF 1 – 10 and projection made and updated as regular process for all providers in phases
Box 5
SUPPLY AND DEMAND

P-43
A Demand should be placed by the industry for the present and for the future phases as per NTVQF levels with the job description, job specification & personnel specification;
B Capacity of the industries and TVET providers should be strengthened for placing demand and for planning and implementing training tuned to NTVQF levels;
C TVET providers and industry should jointly set demands and implement training programme tuned to the NTVQF levels;
D National Skill Survey initiatives must be continued with urgency to cover all industry sectors and all other sectors employing skilled workers with a view to operationalizing the NTVQF standards for accelerated economic growth;
E The NSDC should be established by an Act of the Parliament in order to act as the national coordi-nating authority for skill development and should be staffed by professionals with high levels of competence in the six key functions and eight supporting functions outlined in the NSDP;
F Within the frame of the NSDP, the NSDC should be entrusted with the responsibility of establish-ing and operationalizing the demand supply and demand supply gap mechanism along with the BTEB, in close collaboration with industry;
G NTVQF levels should be extended to level 10. Paraprofessional will be Level 7, Professional will be Level 8, Researcher will be Level 9 and Policymakers (including politicians) will be Level 10;
H Skill training should be integrated with general education in the NTVQF levels;
I Capacity of the policy makers and all other concerned in planning and implementation of TVET programmme at the NTVQF levels should be strengthened.
J Public awareness should be enhanced on the importance of the NTVQF levels and their imple-mentation;
K Overseas exporting of skilled workforce should gradually be tuned to NTVQF levels;
L Skills demand surveys should be conducted in the countries where there is high potential for exporting classified workers where sizable numbers of Bangladeshi skilled workers are in demand and where demand is growing for the skilled workers;
M The draft Bangladesh Standard Classification Occupations (BSCO) should be reviewed, improved and adopted;
N Arrangements should be made for overseas employed skilled workers in consultation with the host country. If there are adequate numbers for updating and upgrading skills including assess-ment and certification should be encouraged;
O BTEB must engage in research on the trends and rate of change of skill workforce job contents in collaboration with the ISCs and NSDC to regularly update curriculum contents;
P Employers and TVET providers should be proactive on gender equity and inclusion of disabled and disadvantaged groups;
Q Allocation of approximately 2% operation of the BTEB’s own budget should be earmarked and used for research, establishment and operation of a database to monitor the implementation of the affiliated TVET courses;
R BTEB must undertake clear programmes urgently for strengthening their organizational and insti-tutional capacity.

SKILLS SNAPSHOT PART II:QUANTITATIVE ASSESSMENT OF SKILL DEMAND AND SKILL GAP

9. QUANTITATIVE ASSESSMENT OF SKILL DEMAND AND SKILL GAP
9.1 BACKGROUND AND OBJECTIVES
During the last two decades Bangladesh has achieved considerable success both in terms of accelera-tion of economic growth and in terms of social development, especially poverty reduction. The pace of acceleration of economic growth has however, been slowed down or even reversed in some of the recent years and therefore all out efforts will be needed for further acceleration of GDP growth.
In the modern period, economic growth and even social development are conditioned by improvements in technology and innovation. This in turn requires improvement in skill and knowledge base. In the globalised world of present day, there are continuous flows of technology. Skill development can play a critical role in grasping the opportunities offered by the progress of technology. In fact, the ‘new growth theories’ (Barro 1991, Barros 1993) recognize the role of human capital, education and skill as impor-tant contributors of economic growth.
The government of Bangladesh has considered the importance of skill development as an important strategy for achieving faster adoption of modern technology. This has been reflected in the continuous efforts for expansion of skill development capacity and improvement of quality of skill available. In this context, the National Skill Development Policy has been framed with the objective that it will ‘guide skill development strategies and facilitate improved coordination of all elements of skill training and the parties involved.’ (BNSDP 2011).
The National Skill Policy aims to expand demand driven, flexible and responsive training. Such provision requires ‘capacity with agencies, industries and authorities to identify and communicate the demand for skills.’ (BNSDP 2011).
The above objectives require development of a strengthened system for understanding and anticipating the labour market’s demand for skills.
The present study will therefore provide estimates of demand for skills at present and arrive at some projections for next two years. It will examine whether there are skill gaps in some major sectors. It will also present qualitative findings on the skill demand-supply gap in general and discuss the role of the existing TVET system in meeting the skill requirement of the country. The study discusses some major aspects of the supply of skills though various channels.
Appropriate policy suggestions will be provided for improvement of the system including plan for a NSDC data base.
9.2 SCOPE AND ORGANIZATION OF THE PAPER
In addition to the discussion of the background and objectives of the study, the first section presents the scope of the paper. It also discusses the data sources used in the study. Section 2 provides assessment of skill gap at the aggregate level. It will include an explanation of the indicators and methodology used for provision of empirical evidences as well as actual findings.
Section 3 presents skill demand projections disaggregated for sectors.
Section 4 examines the supply of skills though various channels.
Section 5 discusses qualitative findings on demand-supply gap of skill and discusses the role of the existing TVET system in meeting the skill requirement of the country.
Section 6 presents a plan for NSDC to put in place a skill data base. It will also include suggestions for utilization of NTVQF in the context of skill development in Bangladesh.
Section 7 presents some general recommendations and concluding observations.
P-46
QUANTITATIVE ASSESSMENT OF SKILL DEM
AND AND SKILL GAP
P-47
9.3 SKILL GAP: QUANTITATIVE ASSESSMENT AT AGGREGATE LEVEL
An assessment of the balance between demand and supply of skill (“skill gap”) should be made at both aggregate level and also for individual sectors, sub-sectors. Sub-sectors within industry deserve special attention since the technology and investment level within the sub-sectors are expected to be diverse, creating different types of demand for skills. The present section will provide an assessment of aggregate skill gap.
The methodological and conceptual questions require clarification of the outset. In this context the relevant question is whether we arrive at aggregate supply gap on the basis of the supply gaps for the individual sectors or through some direct assessment. If it is the former, then the first step would be to assess the sector wise skill gaps.
In the context of Bangladeshi labour market, the estimation of sector wise skill gap can be quite problematic.1 Therefore an independent assessment of the presence of excess supply/demand through the use of proxy indicators at aggregate level can serve useful purposes.
This exercise can be an essential first step in countries like Bangladesh where there is a deep rooted pessimism about the usefulness of skills and the vocational training system imparting such skill. It is true that the vocational education system in Bangladesh was initiated in early phase of development when industrialization was at a rudimentary stage with minimal demand for skilled labour force. Moreover, technical education was socially less acceptable than the general stream. As a result, enrolment in the vocational institutes was less than the capacity and the diploma holders faced widespread unemploy-ment, or it was believed to be so. There is thus a need to make a fresh assessment of whether the pessi-mistic scenario is an accurate description of the present picture.
A recent assessment of the employment/unemployment situation of TVET diploma holders has been done by the World Bank (2007). The study used tracer survey conducted in 2007. Survey data shows high rates of unemployment. This is in conformity with the prevailing notion of low usefulness of skill training.
There is need for caution in interpreting or unconditionally accepting the findings of WB (2007) Report. The loopholes in the survey methods can lead to overestimation of unemployment rates. Major reason behind this is the expectation of survey respondents that reporting unemployment status may lead to some form of benefit. Moreover, those who were not willing to participate in the labour force and were not looking for job may report themselves as unemployed. The third reason is that those involved in self/family employment may not consider/report themselves employed unless specific probing is done.
Another factor may be responsible for TVET diploma holder remaining unemployed or not participating in employment. This is the geographical concentration of industrialization in Dhaka and Chittagong area whereas the trained people are scattered over rural areas of all regions. Quality of training is also impor-tant in this context. Industries wish to employ persons with more specific skills and with practical experi-ence which is often lacking among the recognised TVET trained persons.
The following analysis proposes to present information based on alternative sources of data and thus assess the unemployment situation of those with vocational/technical qualifications. Fresh data used for this analysis include: (a) Estimates of unemployment rate and labour force participation rate (LFPR) for those with technical education using Labour Force Survey 2010 data (b) Employers’ views on the adequacy of skilled workers, (c)Impact of training on wage
1. The problems will be elaborated later in Section 4 while sectoral assessment is attempted.
P-48
9.4 UNEMPLOYMENT RATE AND LFPR AMONG THOSE WITH VOCATIONAL/TECHNICAL TRAINING
Analysing unit records of LFS data, unemployment rates have been calculated for male and female labour force and has been broken down for various education levels. Data for SSC, HSC and technical diploma has been presented in Table 2.1.
Before a discussion2 of the data it should be mentioned that LFS gives very low unemployment rate which is often attributed to the fact that in the formal labour market, workers do not actively search for jobs they do not consider themselves unemployed, being usually engaged in some family employment. The defini-tion of open unemployment is relevant for only those with some education and seeking job in the formal labour market.3 Therefore in the present context we shall focus on only those with education (SSC/HSC/technical) for whom unemployment data can be dependable.
Data presented in Table 2.1 shows very low unemployment rate among those with technical training. The rates are much lower than those with general education (SSC/HSC).
Moreover, unemployment rate among those with technical qualification decreased during 2006 to 2010. It implies that during this period demand for skills increased because of acceleration of economic growth without much increase of supply of such skills produced by VTI.
Again one cannot rule out problems of data quality. It can be argued that some of the skilled persons may not report themselves as labour force members because knowing that there is no job, they do not opt for job search, whereas in tracer surveys everyone with technical diploma are followed up. To examine whether it can be a serious problem, some more data analysis has been done. For various levels of education, estimates of labour force participation rates have been obtained. These are shown in Table 2.2. Data shows that LFPR is highest among those with technical skills. In fact, it is much higher than those with SSC/HSC levels. This is a positive aspect that those with technical skills are more likely to be either employed or seeking jobs.
In section 5 we shall consider whether employers’ views about skill shortage/excess are commensurate with the above findings of low unemployment rate.
9.5 INDIRECT ASSESSMENT OF WHETHER TECHNICAL/VOCATIONAL TRAINING IS IN EXCESS SUPPLY
An indirect test of whether there is excess supply of technical/vocational training in Bangladesh’s labour market is to examine the contribution of such training on productivity/ wage. In the following exercise, such test has been done on the basis of LFS 2010 data of BBS.
Econometric analysis of unit records of data of Bangladesh Labour Force Survey 2010 has been conducted. Regression equations on wage/salary have been estimated using OLS method. Dependent variable has been used in logarithmic form.
Explanatory variables used in standard earning function analysis have been included as independent variables. These variables include human capital in the form of education and training. Other variables include dummies for region (six division), sex of worker, etc.
Four levels of education including primary; secondary and higher secondary; Bachelors, Masters, special-ized higher education (medicine, engineering); and technical/vocational diploma have been used.Three equations have been estimated, one each for urban, rural and aggregate sample (Table 2.3). Expla-nation of all the coefficients is not required in the present context. Only the coefficients of education dum-mies and training receive attention. The results show significant positive impact of vocation/technical diploma on wage/salary. The value of the coefficient of this dummy is higher than the coefficient of SSC/HSC and is close to the higher education dummy’s coefficient. This rules out the hypothesis of excess supply of trained personnel.
A separate dummy variable ‘whether received any training’ over and above each education level has also been included as independent variable. Its coefficient is also positive and significant which implies that more supply of trained personnel would be in demand in the labour market.
2. Data for all individuals aged 15+ years. Rahman (2006) provides a discussion of enumeration and definition related problems which result in low unemployment rate
3. The questions to identify unemployed workers ask whether one was without work and was ‘looking for job”.
QUANTITATIVE ASSESSMENT OF SKILL DEM
AND AND SKILL GAP
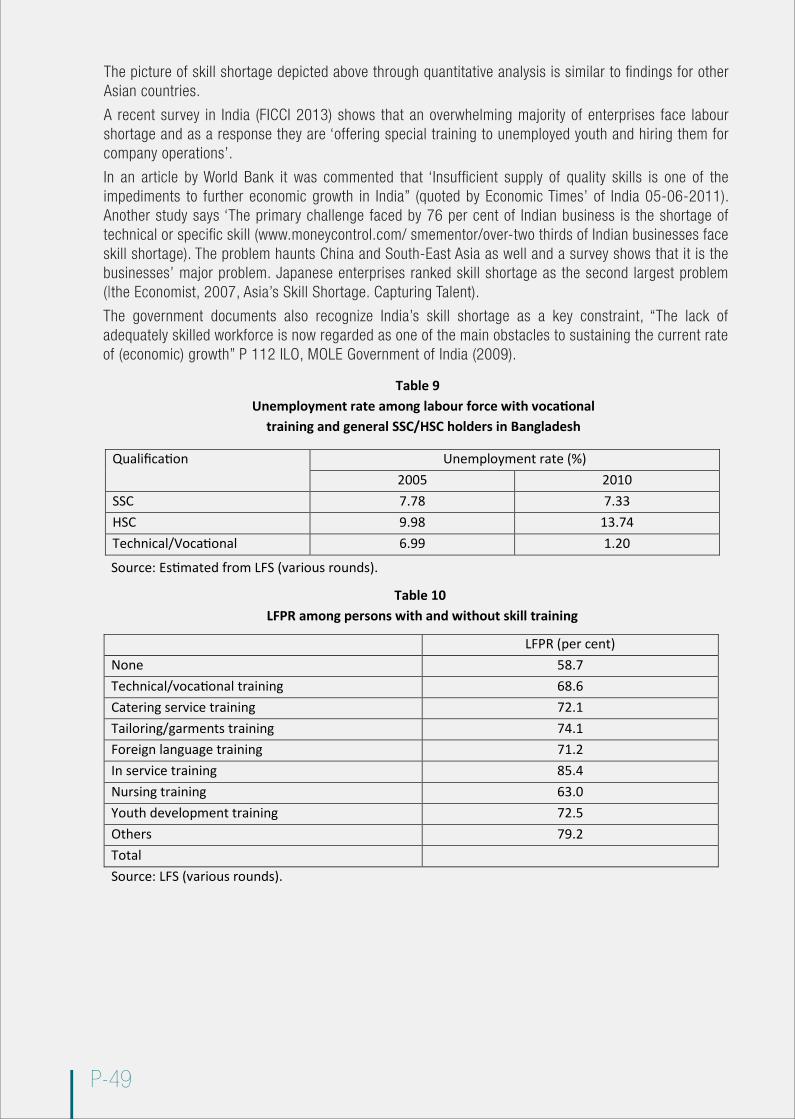
P-49
The picture of skill shortage depicted above through quantitative analysis is similar to findings for other Asian countries.
A recent survey in India (FICCI 2013) shows that an overwhelming majority of enterprises face labour shortage and as a response they are ‘offering special training to unemployed youth and hiring them for company operations’.
In an article by World Bank it was commented that ‘Insufficient supply of quality skills is one of the impediments to further economic growth in India” (quoted by Economic Times’ of India 05-06-2011). Another study says ‘The primary challenge faced by 76 per cent of Indian business is the shortage of technical or specific skill (www.moneycontrol.com/ smementor/over-two thirds of Indian businesses face skill shortage). The problem haunts China and South-East Asia as well and a survey shows that it is the businesses’ major problem. Japanese enterprises ranked skill shortage as the second largest problem (|the Economist, 2007, Asia’s Skill Shortage. Capturing Talent).
The government documents also recognize India’s skill shortage as a key constraint, “The lack of adequately skilled workforce is now regarded as one of the main obstacles to sustaining the current rate of (economic) growth” P 112 ILO, MOLE Government of India (2009).
Table 9Unemployment rate among labour force with vocational
training and general SSC/HSC holders in Bangladesh
Qualification Unemployment rate (%)2005 2010
SSC 7.78 7.33HSC 9.98 13.74Technical/Vocational 6.99 1.20
Table 10LFPR among persons with and without skill training
LFPR (per cent)None 58.7Technical/vocational training 68.6Catering service training 72.1Tailoring/garments training 74.1Foreign language training 71.2In service training 85.4Nursing training 63.0Youth development training 72.5Others 79.2TotalSource: LFS (various rounds).
Source: Estimated from LFS (various rounds).
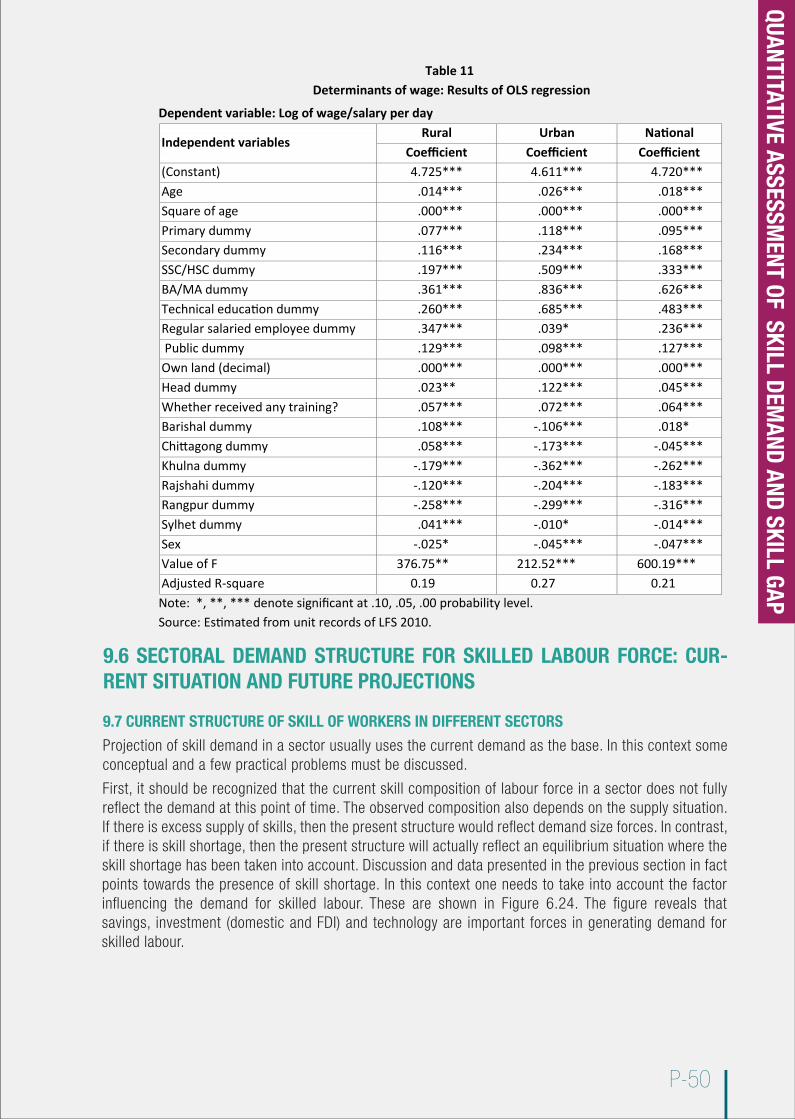
P-50
9.6 SECTORAL DEMAND STRUCTURE FOR SKILLED LABOUR FORCE: CUR-RENT SITUATION AND FUTURE PROJECTIONS
9.7 CURRENT STRUCTURE OF SKILL OF WORKERS IN DIFFERENT SECTORS
Projection of skill demand in a sector usually uses the current demand as the base. In this context some conceptual and a few practical problems must be discussed.
First, it should be recognized that the current skill composition of labour force in a sector does not fully reflect the demand at this point of time. The observed composition also depends on the supply situation. If there is excess supply of skills, then the present structure would reflect demand size forces. In contrast, if there is skill shortage, then the present structure will actually reflect an equilibrium situation where the skill shortage has been taken into account. Discussion and data presented in the previous section in fact points towards the presence of skill shortage. In this context one needs to take into account the factor influencing the demand for skilled labour. These are shown in Figure 6.24. The figure reveals that savings, investment (domestic and FDI) and technology are important forces in generating demand for skilled labour.
Table 11Determinants of wage: Results of OLS regression
Dependent variable: Log of wage/salary per day
Independent variablesRural Urban National
Coefficient Coefficient Coefficient(Constant) 4.725*** 4.611*** 4.720***Age .014*** .026*** .018***Square of age .000*** .000*** .000***Primary dummy .077*** .118*** .095***Secondary dummy .116*** .234*** .168***SSC/HSC dummy .197*** .509*** .333***BA/MA dummy .361*** .836*** .626***Technical education dummy .260*** .685*** .483***Regular salaried employee dummy .347*** .039* .236***Public dummy .129*** .098*** .127***
Own land (decimal) .000*** .000*** .000***Head dummy .023** .122*** .045***Whether received any training? .057*** .072*** .064***Barishal dummy .108*** -.106*** .018*Chittagong dummy .058*** -.173*** -.045***Khulna dummy -.179*** -.362*** -.262***Rajshahi dummy -.120*** -.204*** -.183***Rangpur dummy -.258*** -.299*** -.316***Sylhet dummy .041*** -.010* -.014***Sex -.025* -.045*** -.047***Value of F 376.75** 212.52*** 600.19***Adjusted R-square 0.19 0.27 0.21Note: *, **, *** denote significant at .10, .05, .00 probability level.Source: Estimated from unit records of LFS 2010.
QUANTITATIVE ASSESSMENT OF SKILL DEM
AND AND SKILL GAP
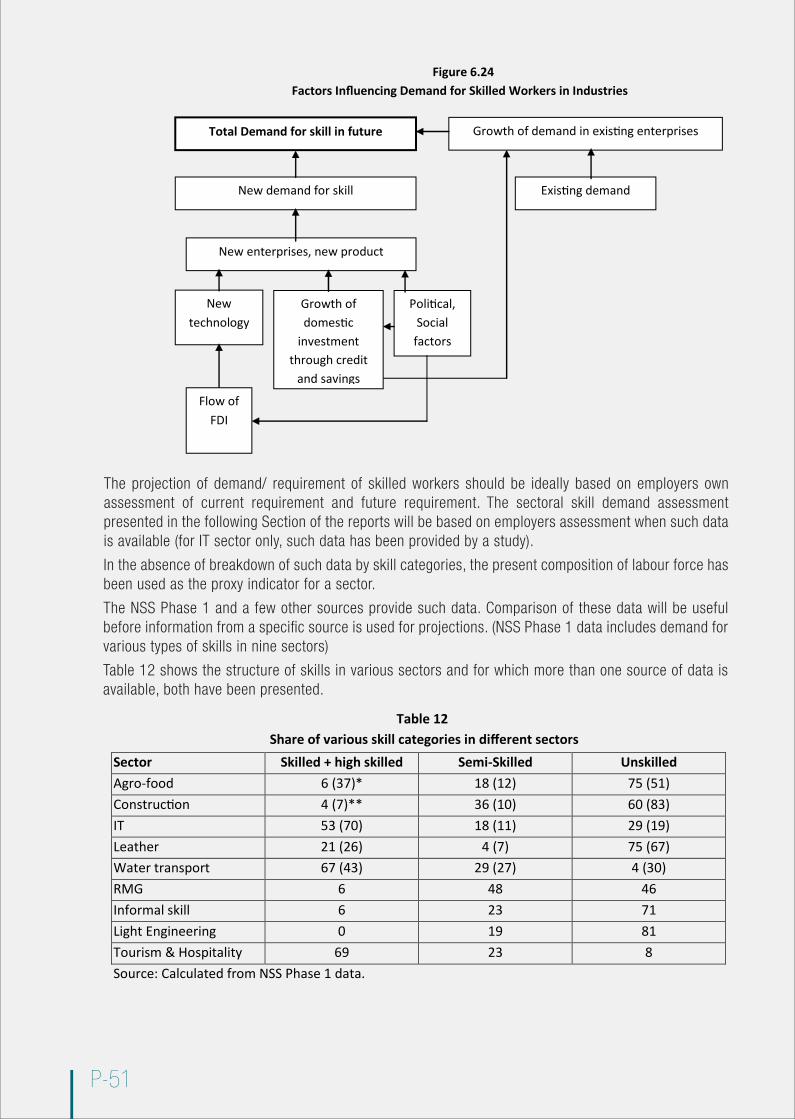
P-51
The projection of demand/ requirement of skilled workers should be ideally based on employers own assessment of current requirement and future requirement. The sectoral skill demand assessment presented in the following Section of the reports will be based on employers assessment when such data is available (for IT sector only, such data has been provided by a study).
In the absence of breakdown of such data by skill categories, the present composition of labour force has been used as the proxy indicator for a sector.
The NSS Phase 1 and a few other sources provide such data. Comparison of these data will be useful before information from a specific source is used for projections. (NSS Phase 1 data includes demand for various types of skills in nine sectors)
Table 12 shows the structure of skills in various sectors and for which more than one source of data is available, both have been presented.
Figure 6.24Factors Influencing Demand for Skilled Workers in Industries
Total Demand for skill in future Growth of demand in existing enterprises
New demand for skill Existing demand
New enterprises, new product
Growth of domestic
investment through credit
and savings
Political, Social
factors
Flow of FDI
New technology
Table 12Share of various skill categories in different sectors
Sector Skilled + high skilled Semi-Skilled UnskilledAgro-food 6 (37)* 18 (12) 75 (51)Construction 4 (7)** 36 (10) 60 (83)IT 53 (70) 18 (11) 29 (19)Leather 21 (26) 4 (7) 75 (67)Water transport 67 (43) 29 (27) 4 (30)RMG 6 48 46Informal skill 6 23 71Light Engineering 0 19 81Tourism & Hospitality 69 23 8Source: Calculated from NSS Phase 1 data.
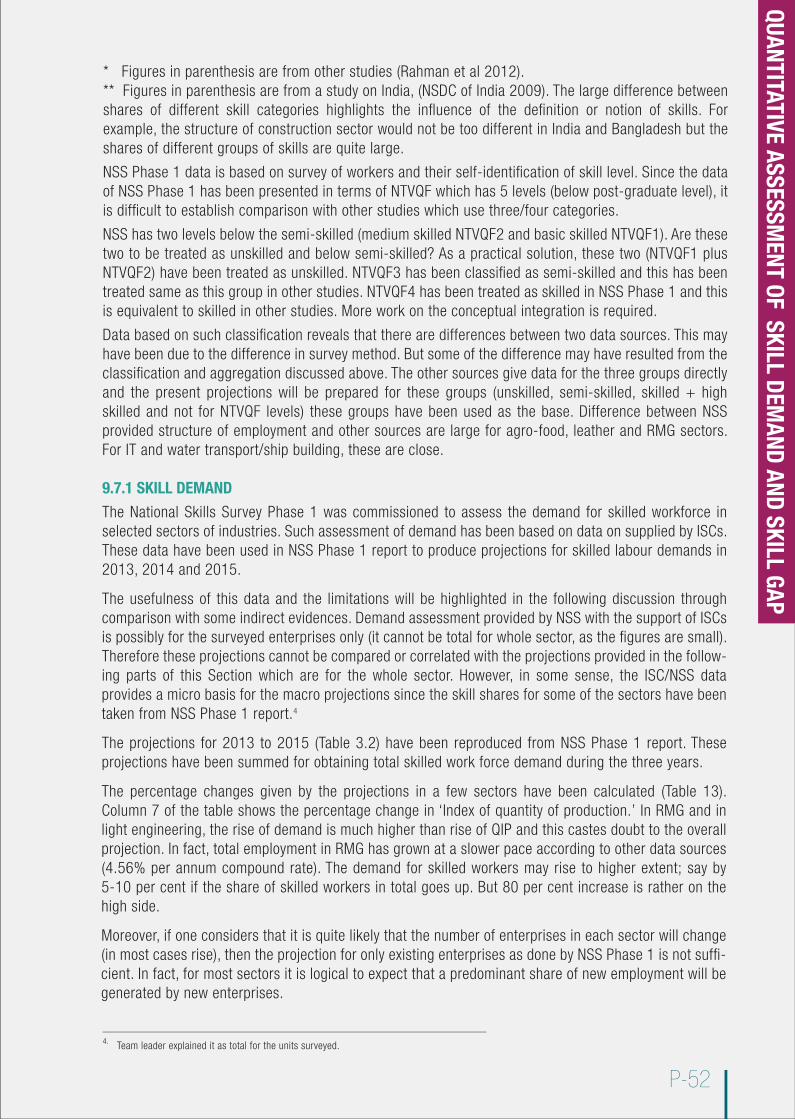
P-52
* Figures in parenthesis are from other studies (Rahman et al 2012).** Figures in parenthesis are from a study on India, (NSDC of India 2009). The large difference between shares of different skill categories highlights the influence of the definition or notion of skills. For example, the structure of construction sector would not be too different in India and Bangladesh but the shares of different groups of skills are quite large.
NSS Phase 1 data is based on survey of workers and their self-identification of skill level. Since the data of NSS Phase 1 has been presented in terms of NTVQF which has 5 levels (below post-graduate level), it is difficult to establish comparison with other studies which use three/four categories.
NSS has two levels below the semi-skilled (medium skilled NTVQF2 and basic skilled NTVQF1). Are these two to be treated as unskilled and below semi-skilled? As a practical solution, these two (NTVQF1 plus NTVQF2) have been treated as unskilled. NTVQF3 has been classified as semi-skilled and this has been treated same as this group in other studies. NTVQF4 has been treated as skilled in NSS Phase 1 and this is equivalent to skilled in other studies. More work on the conceptual integration is required.
Data based on such classification reveals that there are differences between two data sources. This may have been due to the difference in survey method. But some of the difference may have resulted from the classification and aggregation discussed above. The other sources give data for the three groups directly and the present projections will be prepared for these groups (unskilled, semi-skilled, skilled + high skilled and not for NTVQF levels) these groups have been used as the base. Difference between NSS provided structure of employment and other sources are large for agro-food, leather and RMG sectors. For IT and water transport/ship building, these are close.
9.7.1 SKILL DEMAND
The National Skills Survey Phase 1 was commissioned to assess the demand for skilled workforce in selected sectors of industries. Such assessment of demand has been based on data on supplied by ISCs. These data have been used in NSS Phase 1 report to produce projections for skilled labour demands in 2013, 2014 and 2015.
The usefulness of this data and the limitations will be highlighted in the following discussion through comparison with some indirect evidences. Demand assessment provided by NSS with the support of ISCs is possibly for the surveyed enterprises only (it cannot be total for whole sector, as the figures are small). Therefore these projections cannot be compared or correlated with the projections provided in the follow-ing parts of this Section which are for the whole sector. However, in some sense, the ISC/NSS data provides a micro basis for the macro projections since the skill shares for some of the sectors have been taken from NSS Phase 1 report.4
The projections for 2013 to 2015 (Table 3.2) have been reproduced from NSS Phase 1 report. These projections have been summed for obtaining total skilled work force demand during the three years.
The percentage changes given by the projections in a few sectors have been calculated (Table 13). Column 7 of the table shows the percentage change in ‘Index of quantity of production.’ In RMG and in light engineering, the rise of demand is much higher than rise of QIP and this castes doubt to the overall projection. In fact, total employment in RMG has grown at a slower pace according to other data sources (4.56% per annum compound rate). The demand for skilled workers may rise to higher extent; say by 5-10 per cent if the share of skilled workers in total goes up. But 80 per cent increase is rather on the high side.
Moreover, if one considers that it is quite likely that the number of enterprises in each sector will change (in most cases rise), then the projection for only existing enterprises as done by NSS Phase 1 is not suffi-cient. In fact, for most sectors it is logical to expect that a predominant share of new employment will be generated by new enterprises.
4. Team leader explained it as total for the units surveyed.
QUANTITATIVE ASSESSMENT OF SKILL DEM
AND AND SKILL GAP
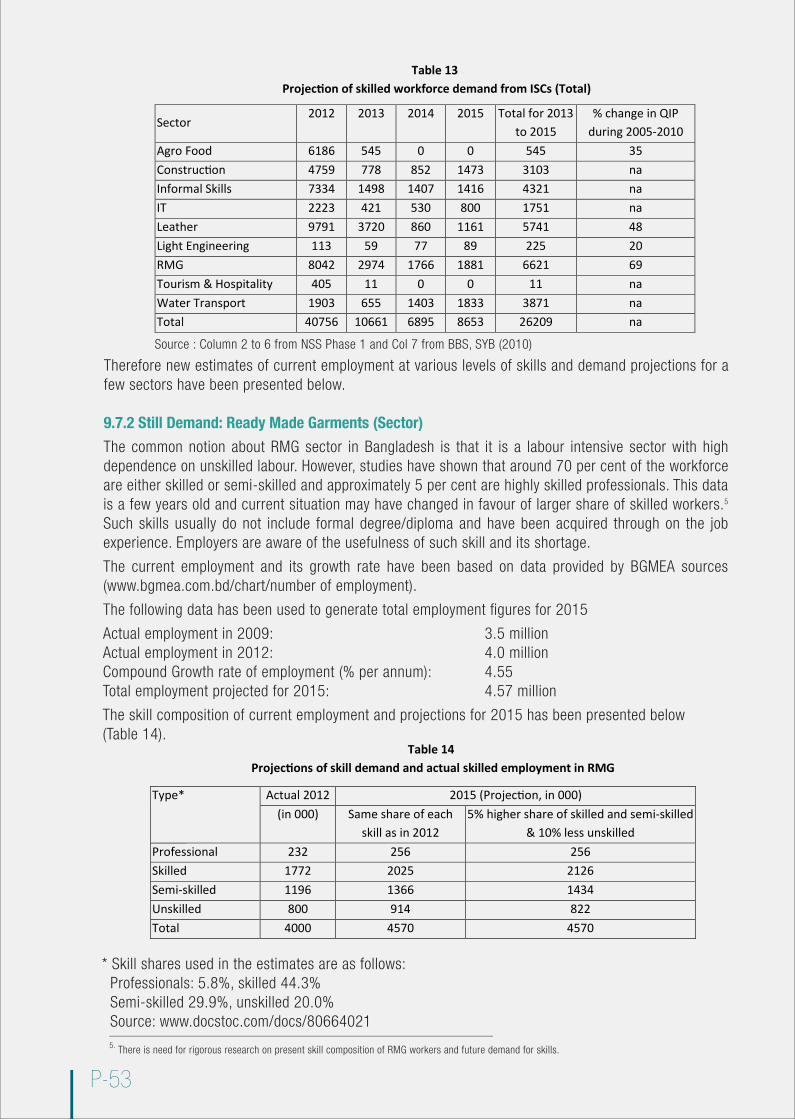
P-53
Therefore new estimates of current employment at various levels of skills and demand projections for a few sectors have been presented below.
9.7.2 Still Demand: Ready Made Garments (Sector)
The common notion about RMG sector in Bangladesh is that it is a labour intensive sector with high dependence on unskilled labour. However, studies have shown that around 70 per cent of the workforce are either skilled or semi-skilled and approximately 5 per cent are highly skilled professionals. This data is a few years old and current situation may have changed in favour of larger share of skilled workers.5 Such skills usually do not include formal degree/diploma and have been acquired through on the job experience. Employers are aware of the usefulness of such skill and its shortage.
The current employment and its growth rate have been based on data provided by BGMEA sources (www.bgmea.com.bd/chart/number of employment).
The following data has been used to generate total employment figures for 2015
Actual employment in 2009: 3.5 millionActual employment in 2012: 4.0 millionCompound Growth rate of employment (% per annum): 4.55 Total employment projected for 2015: 4.57 million
The skill composition of current employment and projections for 2015 has been presented below (Table 14).
* Skill shares used in the estimates are as follows: Professionals: 5.8%, skilled 44.3% Semi-skilled 29.9%, unskilled 20.0% Source: www.docstoc.com/docs/80664021
Table 13Projection of skilled workforce demand from ISCs (Total)
Source : Column 2 to 6 from NSS Phase 1 and Col 7 from BBS, SYB (2010)
Sector2012 2013 2014 2015 Total for 2013
to 2015% change in QIP
during 2005-2010Agro Food 6186 545 0 0 545 35Construction 4759 778 852 1473 3103 naInformal Skills 7334 1498 1407 1416 4321 naIT 2223 421 530 800 1751 naLeather 9791 3720 860 1161 5741 48Light Engineering 113 59 77 89 225 20RMG 8042 2974 1766 1881 6621 69Tourism & Hospitality 405 11 0 0 11 naWater Transport 1903 655 1403 1833 3871 naTotal 40756 10661 6895 8653 26209 na
Table 14Projections of skill demand and actual skilled employment in RMG
Type* Actual 2012 2015 (Projection, in 000)(in 000) Same share of each
skill as in 20125% higher share of skilled and semi-skilled
& 10% less unskilledProfessional 232 256 256Skilled 1772 2025 2126Semi-skilled 1196 1366 1434Unskilled 800 914 822Total 4000 4570 4570
5. There is need for rigorous research on present skill composition of RMG workers and future demand for skills.
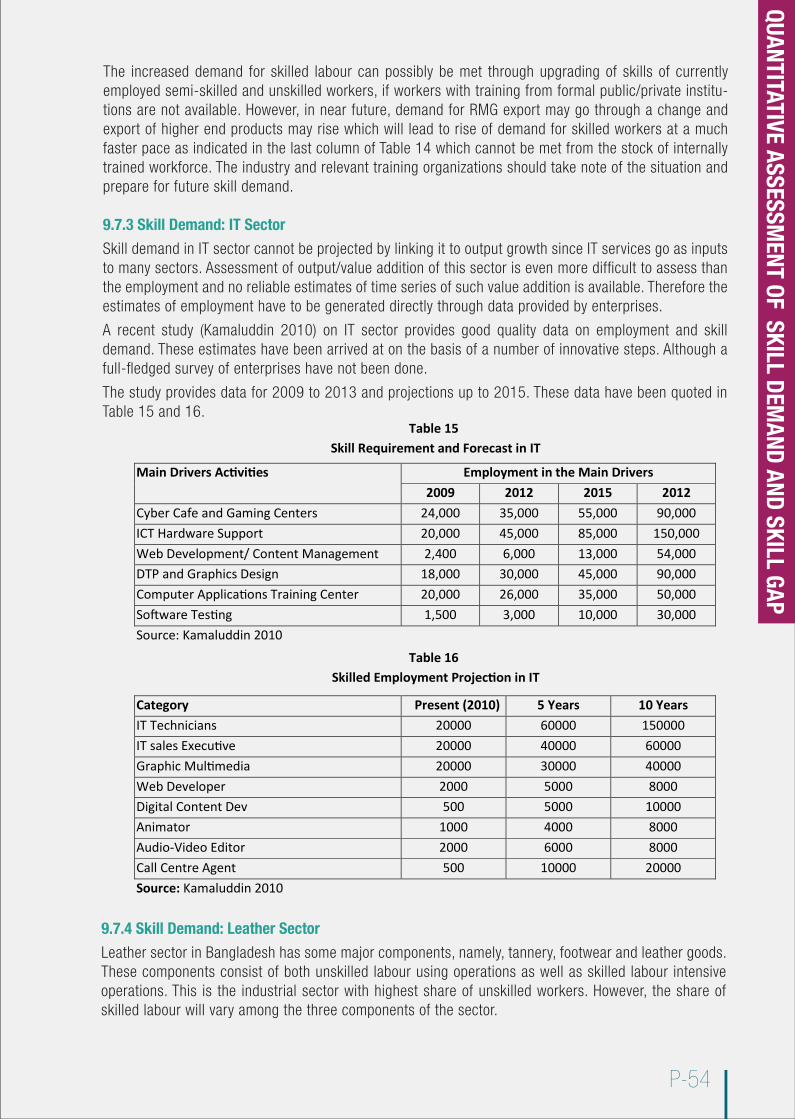
P-54
The increased demand for skilled labour can possibly be met through upgrading of skills of currently employed semi-skilled and unskilled workers, if workers with training from formal public/private institu-tions are not available. However, in near future, demand for RMG export may go through a change and export of higher end products may rise which will lead to rise of demand for skilled workers at a much faster pace as indicated in the last column of Table 14 which cannot be met from the stock of internally trained workforce. The industry and relevant training organizations should take note of the situation and prepare for future skill demand.
9.7.3 Skill Demand: IT Sector
Skill demand in IT sector cannot be projected by linking it to output growth since IT services go as inputs to many sectors. Assessment of output/value addition of this sector is even more difficult to assess than the employment and no reliable estimates of time series of such value addition is available. Therefore the estimates of employment have to be generated directly through data provided by enterprises.
A recent study (Kamaluddin 2010) on IT sector provides good quality data on employment and skill demand. These estimates have been arrived at on the basis of a number of innovative steps. Although a full-fledged survey of enterprises have not been done.
The study provides data for 2009 to 2013 and projections up to 2015. These data have been quoted in Table 15 and 16.
9.7.4 Skill Demand: Leather Sector
Leather sector in Bangladesh has some major components, namely, tannery, footwear and leather goods. These components consist of both unskilled labour using operations as well as skilled labour intensive operations. This is the industrial sector with highest share of unskilled workers. However, the share of skilled labour will vary among the three components of the sector.
Table 15Skill Requirement and Forecast in IT
Main Drivers Activities Employment in the Main Drivers2009 2012 2015 2012
Cyber Cafe and Gaming Centers 24,000 35,000 55,000 90,000ICT Hardware Support 20,000 45,000 85,000 150,000Web Development/ Content Management 2,400 6,000 13,000 54,000DTP and Graphics Design 18,000 30,000 45,000 90,000Computer Applications Training Center 20,000 26,000 35,000 50,000Software Testing 1,500 3,000 10,000 30,000Source: Kamaluddin 2010
Table 16Skilled Employment Projection in IT
Category Present (2010) 5 Years 10 YearsIT Technicians 20000 60000 150000IT sales Executive 20000 40000 60000Graphic Multimedia 20000 30000 40000Web Developer 2000 5000 8000Digital Content Dev 500 5000 10000Animator 1000 4000 8000Audio-Video Editor 2000 6000 8000Call Centre Agent 500 10000 20000Source: Kamaluddin 2010
QUANTITATIVE ASSESSMENT OF SKILL DEM
AND AND SKILL GAP
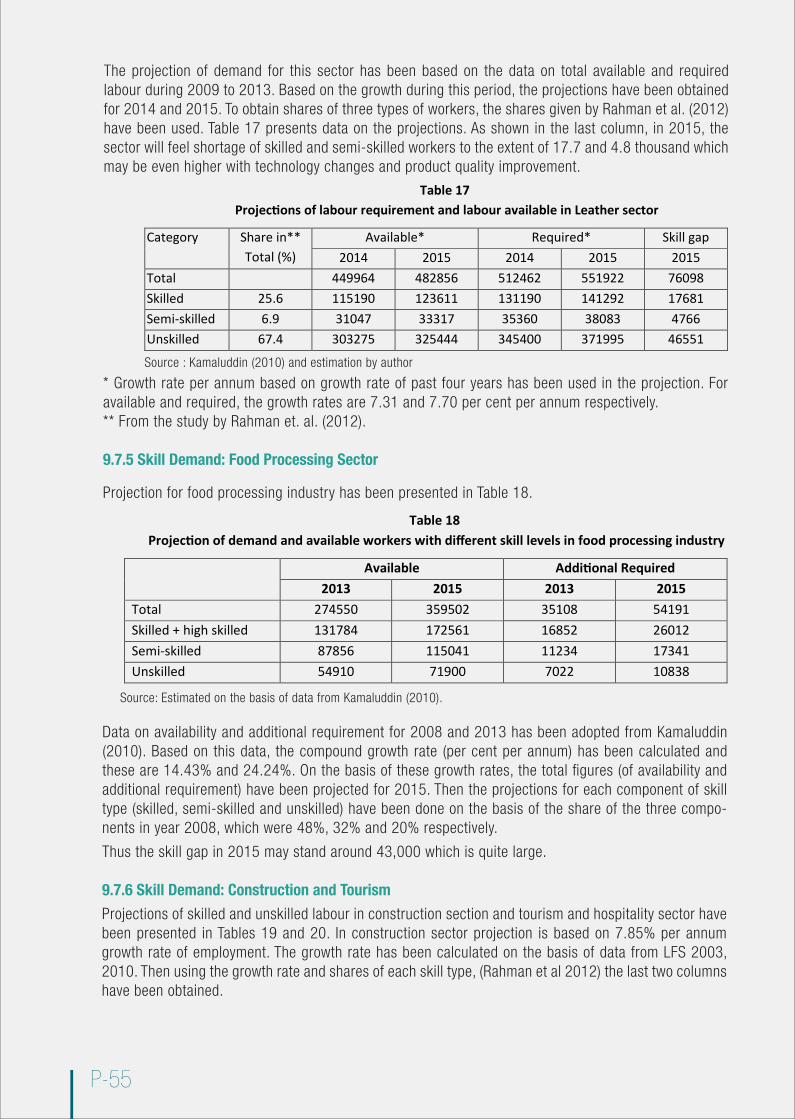
P-55
The projection of demand for this sector has been based on the data on total available and required labour during 2009 to 2013. Based on the growth during this period, the projections have been obtained for 2014 and 2015. To obtain shares of three types of workers, the shares given by Rahman et al. (2012) have been used. Table 17 presents data on the projections. As shown in the last column, in 2015, the sector will feel shortage of skilled and semi-skilled workers to the extent of 17.7 and 4.8 thousand which may be even higher with technology changes and product quality improvement.
* Growth rate per annum based on growth rate of past four years has been used in the projection. For available and required, the growth rates are 7.31 and 7.70 per cent per annum respectively.** From the study by Rahman et. al. (2012).
9.7.5 Skill Demand: Food Processing Sector
Projection for food processing industry has been presented in Table 18.
Source: Estimated on the basis of data from Kamaluddin (2010).
Data on availability and additional requirement for 2008 and 2013 has been adopted from Kamaluddin (2010). Based on this data, the compound growth rate (per cent per annum) has been calculated and these are 14.43% and 24.24%. On the basis of these growth rates, the total figures (of availability and additional requirement) have been projected for 2015. Then the projections for each component of skill type (skilled, semi-skilled and unskilled) have been done on the basis of the share of the three compo-nents in year 2008, which were 48%, 32% and 20% respectively.
Thus the skill gap in 2015 may stand around 43,000 which is quite large.
9.7.6 Skill Demand: Construction and Tourism
Projections of skilled and unskilled labour in construction section and tourism and hospitality sector have been presented in Tables 19 and 20. In construction sector projection is based on 7.85% per annum growth rate of employment. The growth rate has been calculated on the basis of data from LFS 2003, 2010. Then using the growth rate and shares of each skill type, (Rahman et al 2012) the last two columns have been obtained.
Table 17Projections of labour requirement and labour available in Leather sector
Category Share in**Total (%)
Available* Required* Skill gap2014 2015 2014 2015 2015
Total 449964 482856 512462 551922 76098Skilled 25.6 115190 123611 131190 141292 17681Semi-skilled 6.9 31047 33317 35360 38083 4766Unskilled 67.4 303275 325444 345400 371995 46551
Table 18Projection of demand and available workers with different skill levels in food processing industry
Available Additional Required2013 2015 2013 2015
Total 274550 359502 35108 54191Skilled + high skilled 131784 172561 16852 26012Semi-skilled 87856 115041 11234 17341Unskilled 54910 71900 7022 10838
Source : Kamaluddin (2010) and estimation by author
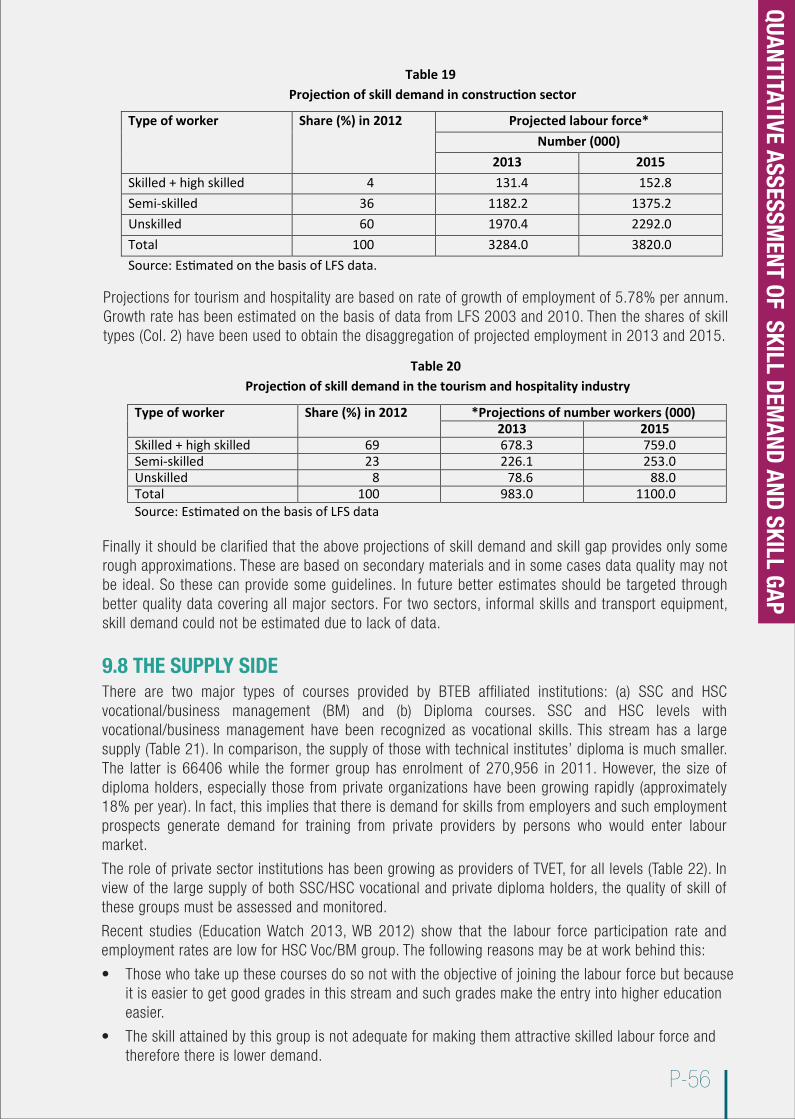
P-56
Projections for tourism and hospitality are based on rate of growth of employment of 5.78% per annum. Growth rate has been estimated on the basis of data from LFS 2003 and 2010. Then the shares of skill types (Col. 2) have been used to obtain the disaggregation of projected employment in 2013 and 2015.
Finally it should be clarified that the above projections of skill demand and skill gap provides only some rough approximations. These are based on secondary materials and in some cases data quality may not be ideal. So these can provide some guidelines. In future better estimates should be targeted through better quality data covering all major sectors. For two sectors, informal skills and transport equipment, skill demand could not be estimated due to lack of data.
9.8 THE SUPPLY SIDEThere are two major types of courses provided by BTEB affiliated institutions: (a) SSC and HSC vocational/business management (BM) and (b) Diploma courses. SSC and HSC levels with vocational/business management have been recognized as vocational skills. This stream has a large supply (Table 21). In comparison, the supply of those with technical institutes’ diploma is much smaller. The latter is 66406 while the former group has enrolment of 270,956 in 2011. However, the size of diploma holders, especially those from private organizations have been growing rapidly (approximately 18% per year). In fact, this implies that there is demand for skills from employers and such employment prospects generate demand for training from private providers by persons who would enter labour market.
The role of private sector institutions has been growing as providers of TVET, for all levels (Table 22). In view of the large supply of both SSC/HSC vocational and private diploma holders, the quality of skill of these groups must be assessed and monitored.
Recent studies (Education Watch 2013, WB 2012) show that the labour force participation rate and employment rates are low for HSC Voc/BM group. The following reasons may be at work behind this:
• Those who take up these courses do so not with the objective of joining the labour force but because it is easier to get good grades in this stream and such grades make the entry into higher education easier.
• The skill attained by this group is not adequate for making them attractive skilled labour force and therefore there is lower demand.
Table 19Projection of skill demand in construction sector
Type of worker Share (%) in 2012 Projected labour force*Number (000)
2013 2015Skilled + high skilled 4 131.4 152.8Semi-skilled 36 1182.2 1375.2Unskilled 60 1970.4 2292.0Total 100 3284.0 3820.0Source: Estimated on the basis of LFS data.
Table 20Projection of skill demand in the tourism and hospitality industry
Type of worker Share (%) in 2012 *Projections of number workers (000)2013 2015
Skilled + high skilled 69 678.3 759.0Semi-skilled 23 226.1 253.0Unskilled 8 78.6 88.0Total 100 983.0 1100.0Source: Estimated on the basis of LFS data
QUANTITATIVE ASSESSMENT OF SKILL DEM
AND AND SKILL GAP
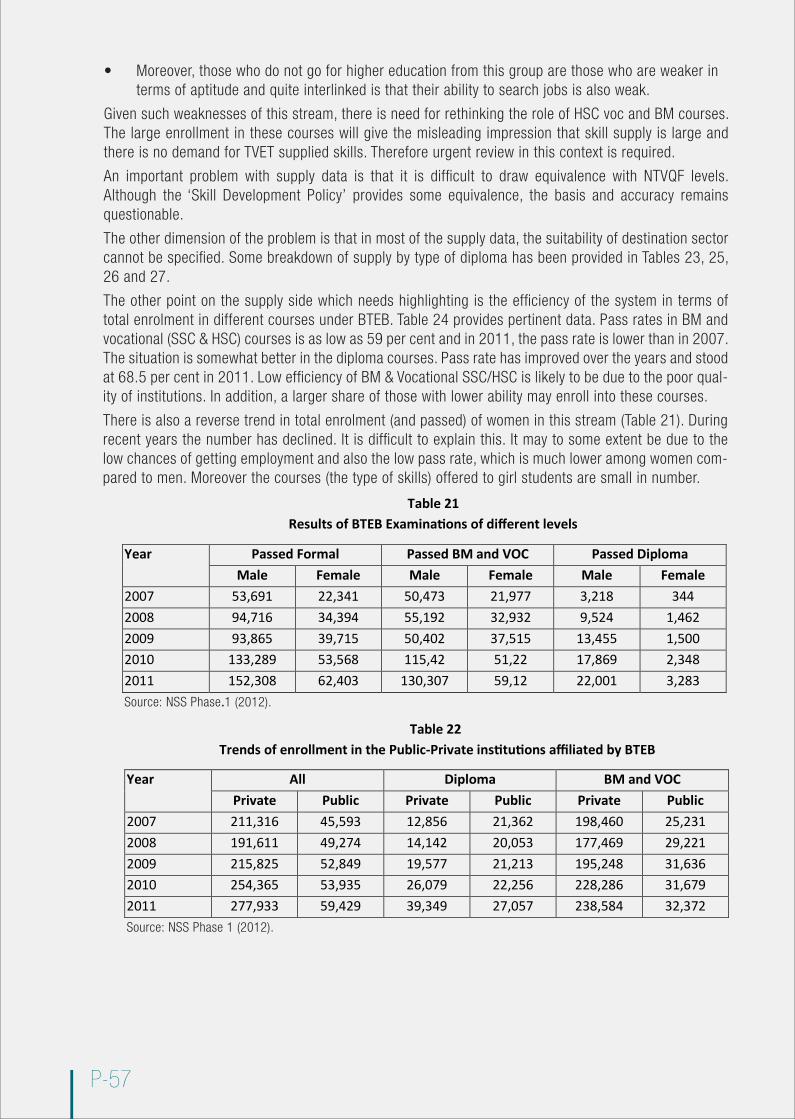
P-57
• Moreover, those who do not go for higher education from this group are those who are weaker in terms of aptitude and quite interlinked is that their ability to search jobs is also weak.
Given such weaknesses of this stream, there is need for rethinking the role of HSC voc and BM courses. The large enrollment in these courses will give the misleading impression that skill supply is large and there is no demand for TVET supplied skills. Therefore urgent review in this context is required.
An important problem with supply data is that it is difficult to draw equivalence with NTVQF levels. Although the ‘Skill Development Policy’ provides some equivalence, the basis and accuracy remains questionable.
The other dimension of the problem is that in most of the supply data, the suitability of destination sector cannot be specified. Some breakdown of supply by type of diploma has been provided in Tables 23, 25, 26 and 27.
The other point on the supply side which needs highlighting is the efficiency of the system in terms of total enrolment in different courses under BTEB. Table 24 provides pertinent data. Pass rates in BM and vocational (SSC & HSC) courses is as low as 59 per cent and in 2011, the pass rate is lower than in 2007. The situation is somewhat better in the diploma courses. Pass rate has improved over the years and stood at 68.5 per cent in 2011. Low efficiency of BM & Vocational SSC/HSC is likely to be due to the poor qual-ity of institutions. In addition, a larger share of those with lower ability may enroll into these courses.
There is also a reverse trend in total enrolment (and passed) of women in this stream (Table 21). During recent years the number has declined. It is difficult to explain this. It may to some extent be due to the low chances of getting employment and also the low pass rate, which is much lower among women com-pared to men. Moreover the courses (the type of skills) offered to girl students are small in number.
Table 21Results of BTEB Examinations of different levels
Year Passed Formal Passed BM and VOC Passed DiplomaMale Female Male Female Male Female
2007 53,691 22,341 50,473 21,977 3,218 3442008 94,716 34,394 55,192 32,932 9,524 1,4622009 93,865 39,715 50,402 37,515 13,455 1,5002010 133,289 53,568 115,42 51,22 17,869 2,3482011 152,308 62,403 130,307 59,12 22,001 3,283Source: NSS Phase 1 (2012). .
Table 22Trends of enrollment in the Public-Private institutions affiliated by BTEB
Year All Diploma BM and VOCPrivate Public Private Public Private Public
2007 211,316 45,593 12,856 21,362 198,460 25,2312008 191,611 49,274 14,142 20,053 177,469 29,2212009 215,825 52,849 19,577 21,213 195,248 31,6362010 254,365 53,935 26,079 22,256 228,286 31,6792011 277,933 59,429 39,349 27,057 238,584 32,372Source: NSS Phase 1 (2012).
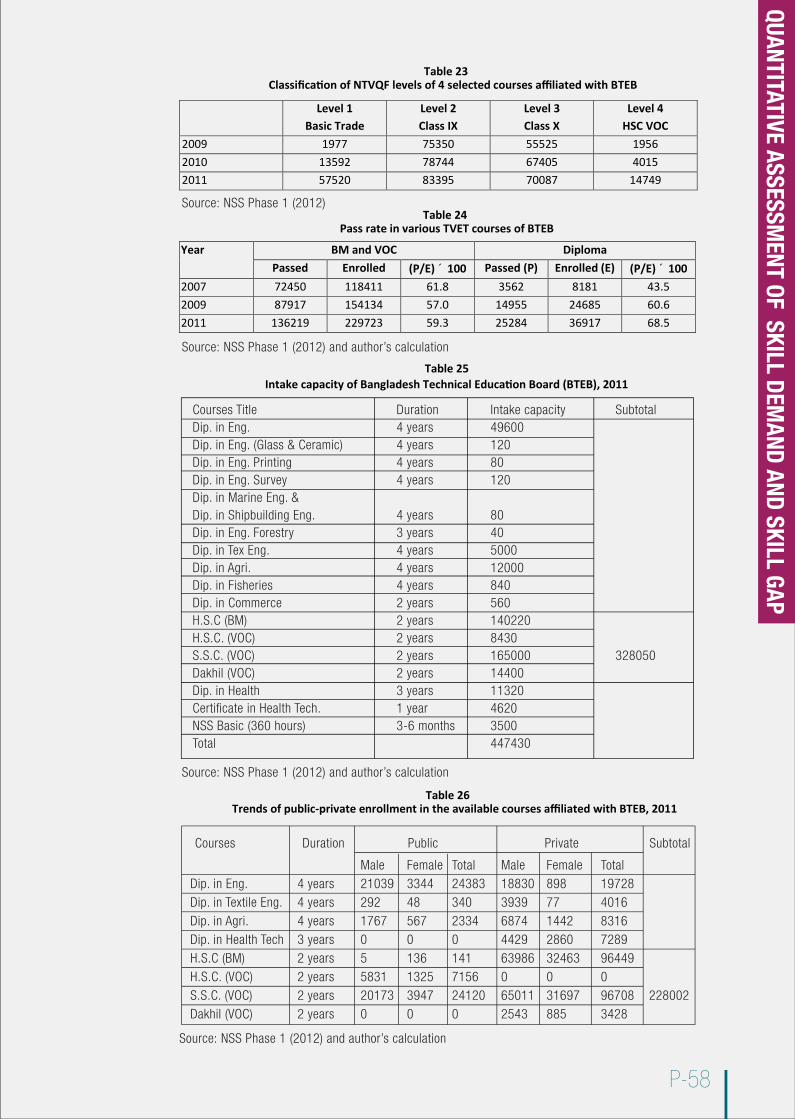
P-58
Table 23Classification of NTVQF levels of 4 selected courses affiliated with BTEB
Level 1Basic Trade
Level 2Class IX
Level 3Class X
Level 4HSC VOC
2009 1977 75350 55525 19562010 13592 78744 67405 40152011 57520 83395 70087 14749
Source: NSS Phase 1 (2012)
Source: NSS Phase 1 (2012) and author’s calculation
Table 24Pass rate in various TVET courses of BTEB
Year BM and VOC DiplomaPassed Enrolled (P/E) ´ 100 Passed (P) Enrolled (E) (P/E) ´ 100
2007 72450 118411 61.8 3562 8181 43.52009 87917 154134 57.0 14955 24685 60.62011 136219 229723 59.3 25284 36917 68.5
Source: NSS Phase 1 (2012) and author’s calculation
Source: NSS Phase 1 (2012) and author’s calculation
Table 25Intake capacity of Bangladesh Technical Education Board (BTEB), 2011
Courses Title Duration Intake capacity SubtotalDip. in Eng. 4 years 49600Dip. in Eng. (Glass & Ceramic) 4 years 120Dip. in Eng. Printing 4 years 80Dip. in Eng. Survey 4 years 120Dip. in Marine Eng. &Dip. in Shipbuilding Eng. 4 years 80Dip. in Eng. Forestry 3 years 40Dip. in Tex Eng. 4 years 5000Dip. in Agri. 4 years 12000Dip. in Fisheries 4 years 840Dip. in Commerce 2 years 560H.S.C (BM) 2 years 140220H.S.C. (VOC) 2 years 8430S.S.C. (VOC) 2 years 165000 328050Dakhil (VOC) 2 years 14400Dip. in Health 3 years 11320Certificate in Health Tech. 1 year 4620NSS Basic (360 hours) 3-6 months 3500Total 447430
Table 26Trends of public-private enrollment in the available courses affiliated with BTEB, 2011
Male Female Total Male Female TotalDip. in Eng. 4 years 21039 3344 24383 18830 898 19728Dip. in Textile Eng. 4 years 292 48 340 3939 77 4016Dip. in Agri. 4 years 1767 567 2334 6874 1442 8316Dip. in Health Tech 3 years 0 0 0 4429 2860 7289H.S.C (BM) 2 years 5 136 141 63986 32463 96449H.S.C. (VOC) 2 years 5831 1325 7156 0 0 0S.S.C. (VOC) 2 years 20173 3947 24120 65011 31697 96708 228002Dakhil (VOC) 2 years 0 0 0 2543 885 3428
Courses Duration Public Private Subtotal
QUANTITATIVE ASSESSMENT OF SKILL DEM
AND AND SKILL GAP
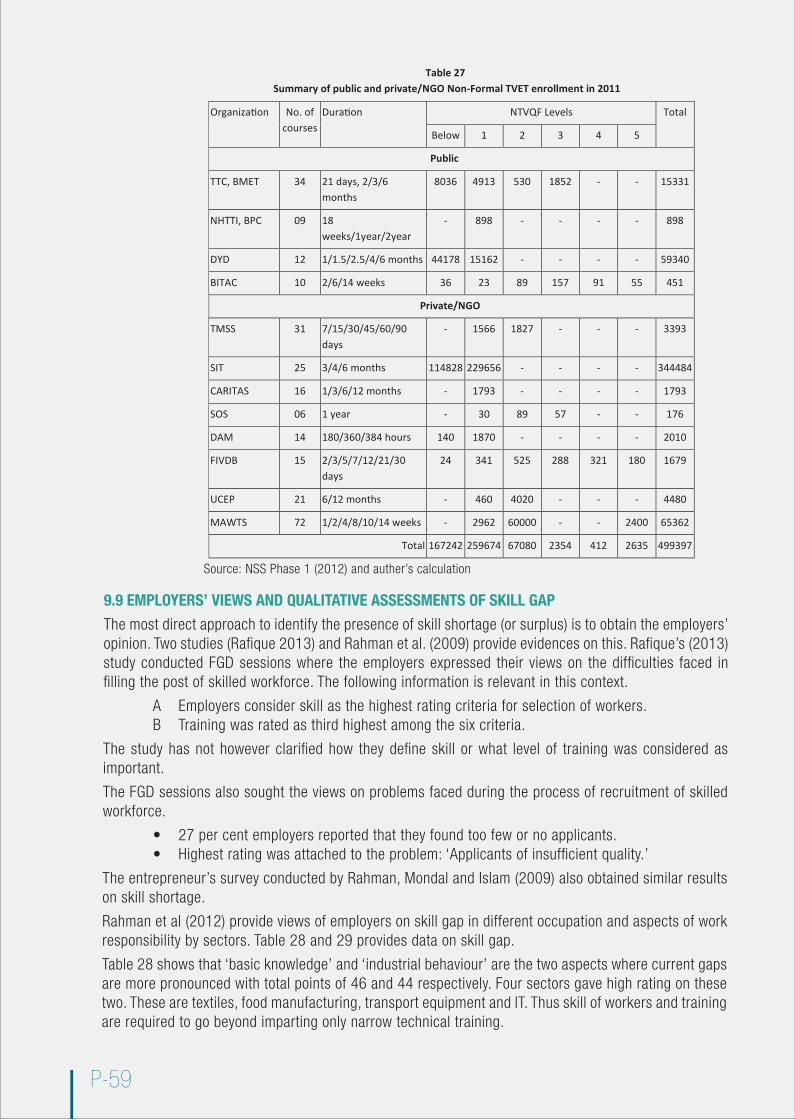
P-59
9.9 EMPLOYERS’ VIEWS AND QUALITATIVE ASSESSMENTS OF SKILL GAP
The most direct approach to identify the presence of skill shortage (or surplus) is to obtain the employers’ opinion. Two studies (Rafique 2013) and Rahman et al. (2009) provide evidences on this. Rafique’s (2013) study conducted FGD sessions where the employers expressed their views on the difficulties faced in filling the post of skilled workforce. The following information is relevant in this context.
A Employers consider skill as the highest rating criteria for selection of workers. B Training was rated as third highest among the six criteria.
The study has not however clarified how they define skill or what level of training was considered as important.
The FGD sessions also sought the views on problems faced during the process of recruitment of skilled workforce.
• 27 per cent employers reported that they found too few or no applicants. • Highest rating was attached to the problem: ‘Applicants of insufficient quality.’
The entrepreneur’s survey conducted by Rahman, Mondal and Islam (2009) also obtained similar results on skill shortage.
Rahman et al (2012) provide views of employers on skill gap in different occupation and aspects of work responsibility by sectors. Table 28 and 29 provides data on skill gap.
Table 28 shows that ‘basic knowledge’ and ‘industrial behaviour’ are the two aspects where current gaps are more pronounced with total points of 46 and 44 respectively. Four sectors gave high rating on these two. These are textiles, food manufacturing, transport equipment and IT. Thus skill of workers and training are required to go beyond imparting only narrow technical training.
Table 27Summary of public and private/NGO Non-Formal TVET enrollment in 2011
Sl. No.
Organization No. of courses
Duration NTVQF Levels Total
Below 1 2 3 4 5
Public
1. TTC, BMET 34 21 days, 2/3/6 months
8036 4913 530 1852 - - 15331
2. NHTTI, BPC 09 18 weeks/1year/2year
- 898 - - - - 898
3. DYD 12 1/1.5/2.5/4/6 months 44178 15162 - - - - 59340
4. BITAC 10 2/6/14 weeks 36 23 89 157 91 55 451
Private/NGO
5. TMSS 31 7/15/30/45/60/90 days
- 1566 1827 - - - 3393
6. SIT 25 3/4/6 months 114828 229656 - - - - 344484
7. CARITAS 16 1/3/6/12 months - 1793 - - - - 1793
8. SOS 06 1 year - 30 89 57 - - 176
9. DAM 14 180/360/384 hours 140 1870 - - - - 2010
10. FIVDB 15 2/3/5/7/12/21/30 days
24 341 525 288 321 180 1679
11. UCEP 21 6/12 months - 460 4020 - - - 4480
12. MAWTS 72 1/2/4/8/10/14 weeks - 2962 60000 - - 2400 65362
Total 167242 259674 67080 2354 412 2635 499397
Source: NSS Phase 1 (2012) and auther’s calculation
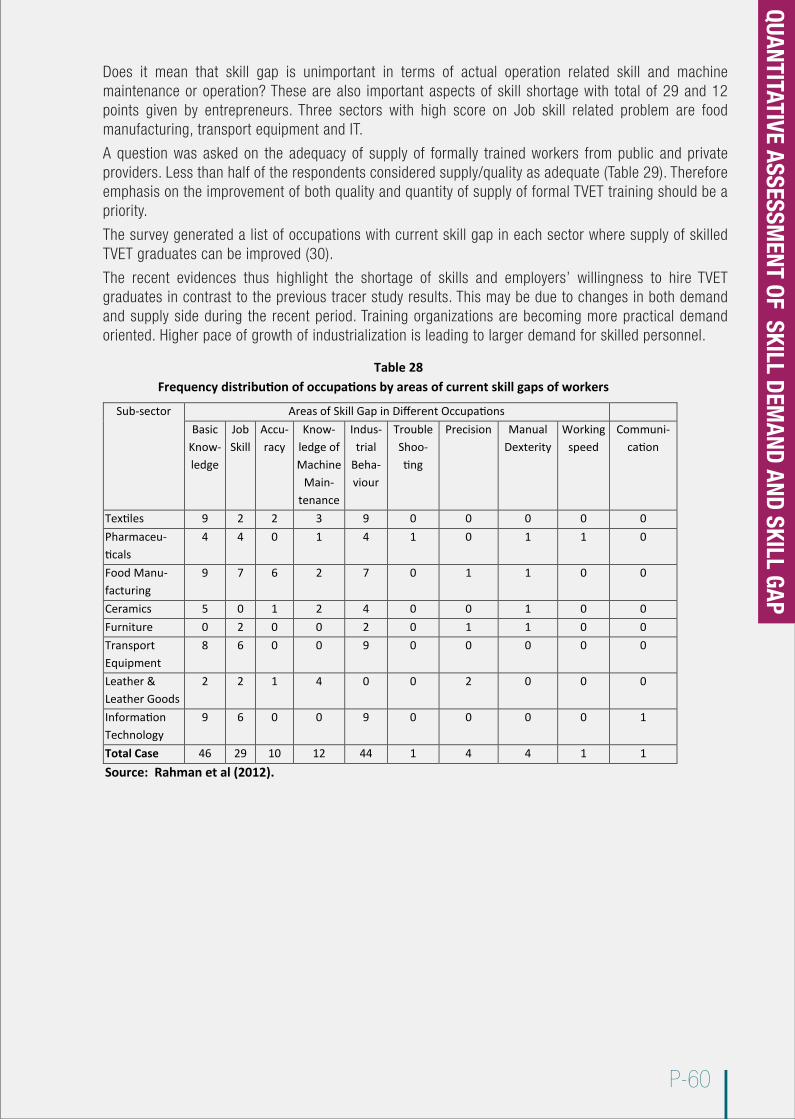
P-60
Does it mean that skill gap is unimportant in terms of actual operation related skill and machine maintenance or operation? These are also important aspects of skill shortage with total of 29 and 12 points given by entrepreneurs. Three sectors with high score on Job skill related problem are food manufacturing, transport equipment and IT.
A question was asked on the adequacy of supply of formally trained workers from public and private providers. Less than half of the respondents considered supply/quality as adequate (Table 29). Therefore emphasis on the improvement of both quality and quantity of supply of formal TVET training should be a priority.
The survey generated a list of occupations with current skill gap in each sector where supply of skilled TVET graduates can be improved (30).
The recent evidences thus highlight the shortage of skills and employers’ willingness to hire TVET graduates in contrast to the previous tracer study results. This may be due to changes in both demand and supply side during the recent period. Training organizations are becoming more practical demand oriented. Higher pace of growth of industrialization is leading to larger demand for skilled personnel.
Table 28Frequency distribution of occupations by areas of current skill gaps of workers
Sub-sector Areas of Skill Gap in Different OccupationsBasic
Know-ledge
JobSkill
Accu-racy
Know-ledge of Machine
Main-tenance
Indus-trial
Beha-viour
Trouble Shoo-ting
Precision Manual Dexterity
Working speed
Communi-cation
Textiles 9 2 2 3 9 0 0 0 0 0Pharmaceu-ticals
4 4 0 1 4 1 0 1 1 0
Food Manu-facturing
9 7 6 2 7 0 1 1 0 0
Ceramics 5 0 1 2 4 0 0 1 0 0Furniture 0 2 0 0 2 0 1 1 0 0Transport Equipment
8 6 0 0 9 0 0 0 0 0
Leather &Leather Goods
2 2 1 4 0 0 2 0 0 0
Information Technology
9 6 0 0 9 0 0 0 0 1
Total Case 46 29 10 12 44 1 4 4 1 1Source: Rahman et al (2012).
QUANTITATIVE ASSESSMENT OF SKILL DEM
AND AND SKILL GAP
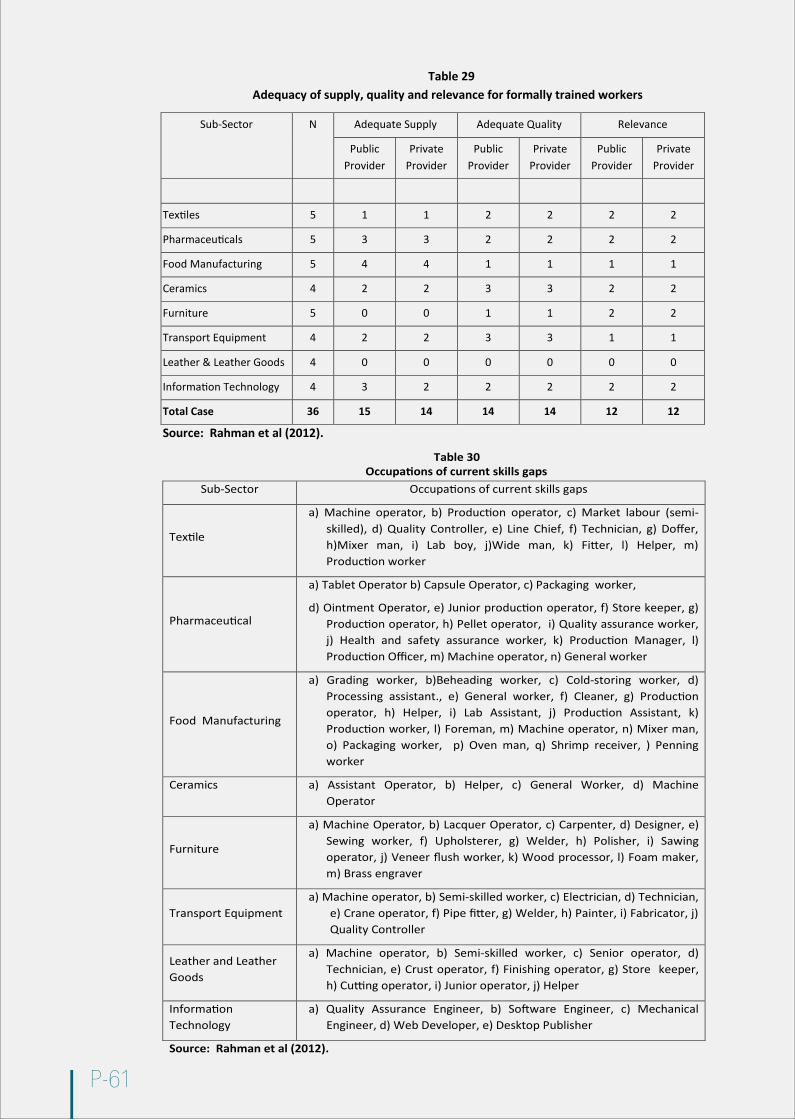
P-61
Table 29Adequacy of supply, quality and relevance for formally trained workers
Sub-Sector N Adequate Supply Adequate Quality Relevance
Public Provider
Private Provider
Public Provider
Private Provider
Public Provider
Private Provider
Textiles 5 1 1 2 2 2 2
Pharmaceuticals 5 3 3 2 2 2 2
Food Manufacturing 5 4 4 1 1 1 1
Ceramics 4 2 2 3 3 2 2
Furniture 5 0 0 1 1 2 2
Transport Equipment 4 2 2 3 3 1 1
Leather & Leather Goods 4 0 0 0 0 0 0
Information Technology 4 3 2 2 2 2 2
Total Case 36 15 14 14 14 12 12
Source: Rahman et al (2012).
Table 30Occupations of current skills gaps
Sub-Sector Occupations of current skills gaps
Textile
a) Machine operator, b) Production operator, c) Market labour (semi-skilled), d) Quality Controller, e) Line Chief, f) Technician, g) Doffer, h)Mixer man, i) Lab boy, j)Wide man, k) Fitter, l) Helper, m) Production worker
Pharmaceutical
a) Tablet Operator b) Capsule Operator, c) Packaging worker,
d) Ointment Operator, e) Junior production operator, f) Store keeper, g) Production operator, h) Pellet operator, i) Quality assurance worker, j) Health and safety assurance worker, k) Production Manager, l) Production Officer, m) Machine operator, n) General worker
Food Manufacturing
a) Grading worker, b)Beheading worker, c) Cold-storing worker, d) Processing assistant., e) General worker, f) Cleaner, g) Production operator, h) Helper, i) Lab Assistant, j) Production Assistant, k) Production worker, l) Foreman, m) Machine operator, n) Mixer man, o) Packaging worker, p) Oven man, q) Shrimp receiver, ) Penning worker
Ceramics a) Assistant Operator, b) Helper, c) General Worker, d) Machine Operator
Furniture
a) Machine Operator, b) Lacquer Operator, c) Carpenter, d) Designer, e) Sewing worker, f) Upholsterer, g) Welder, h) Polisher, i) Sawing operator, j) Veneer flush worker, k) Wood processor, l) Foam maker, m) Brass engraver
Transport Equipmenta) Machine operator, b) Semi-skilled worker, c) Electrician, d) Technician,
e) Crane operator, f) Pipe fitter, g) Welder, h) Painter, i) Fabricator, j) Quality Controller
Leather and Leather Goods
a) Machine operator, b) Semi-skilled worker, c) Senior operator, d) Technician, e) Crust operator, f) Finishing operator, g) Store keeper, h) Cutting operator, i) Junior operator, j) Helper
Information Technology
a) Quality Assurance Engineer, b) Software Engineer, c) Mechanical Engineer, d) Web Developer, e) Desktop Publisher
Source: Rahman et al (2012).

P-62
9.10 NATIONAL SKILLS DATA SYSTEM PLAN
Establishment of National Skill Data System at the NSDC and its use for planning and monitoring can play an extremely useful role for skill based development. In this context, the following plan is aimed at having an effective data system to serve the purpose (although more details about a hub of data and information will actually be needed). Such data system should aim to hold data and information on
A Demand for various levels of skills by sectors B Supply of skills of each level disaggregated as far as possible by probable destination sector/sub-sector C Data on prospective trainees, their pre-training qualification and socio-economic characteristics. However, without a youth job centre/or related centre at work, this may be difficult to obtain. D Data on TVET institutions, and their capacity.
The rationale for the first two types of data is obvious. The third is also important to help policies for moti-vating different groups of future labour force.
While the context of demand and supply data is more or less obvious, the levels of disaggregation must be appropriately chosen.
Moreover, demand data should separately address the two components: the domestic demand and international demand. Methodology of data generation will be different for the two components.
Although the short term target of data base preparation should be modest because of the capacity constraints, a full view of what is entailed in having a quality data base should be in the forefront. Therefore a short list of components of a system has been provided below, while there are other reports specifically focusing on this.
9.10.1 DEMAND SIDE
Components: National/Domestic/International
Undoubtedly the domestic demand component is predominant at present. However, the international component is extremely important in view of the foreign exchange earning potentials of the skilled labour force.
Data sources for domestic component:
a Data generated by Industry Skills Council b Data generated by various national and micro surveys
Data sources for international component:
a Special surveys in countries with larger shares of current overseas employment of Bangladeshi migrant workers b Diplomacy: This approach may be used not only for estimating demand, but also for generating larger demand.
9.10.2 SUPPLY SIDE
Data on The supply side will be generated by a system where the training providers input their data at regular intervals.
Such providers include public and private training institutes and NGOs.
• Data on both enrolment and completion of training should be included so that not • only the supply but also the efficiency of the system can be monitored. • Data must be disaggregated by level of NTVQF (or temporarily by basic/semi-skilled/skilled category). • Gradually a system should be evolved so that for each NSS level, supplies suitable for various sectors can be estimated. • For each level, data should be disaggregated by sex, age, region and if possible by social (income, religion etc.) classes.
QUANTITATIVE ASSESSMENT OF SKILL DEM
AND AND SKILL GAP
P-63
9.10.3 INSTITUTIONAL ISSUES RELATED TO SKILL-DATA BASE CREATION
It is obvious that NSDC will have the overall role of overseeing the creation and maintenance of skill-data base.
A special cell within NSDC would be created to manage the data base. After data is supplied by ISCs and other relevant agencies, NSDC will integrate, analyze and maintain the data sets on supply and demand for skills and other related aspects. NSDC will also help create capacity of relevant agencies with the responsibility of supplying information. The executive committee of NSDC will take up the task of review-ing progress with skills data system.
BMET will be given the charge to coordinate international demand data obtained from various sources. For this purpose BMET data cell may be strengthened with more professionals and resources. Coopera-tion of NGOs, especially large NGOs with large training capacities should be sought.
9.10.4 FUTURE PRIORITY FOR APPLIED RESEARCH ON DEMAND-SUPPLY MATCHING OF SKILLS
Although the regular assessment of demand and supply are expected to be provided by ISC and the train-ing providers respectively, some priority setting for applied research in this context is necessary to provide critical inputs for more effective performance of the system. NSDC may play a coordinating role for such research while the actual research and survey will be performed by research organization and BBS. A list of the priority agenda is as follows:
a Tracer study at regular intervals b Baseline data on socio economic situation of training recipients c Assessment of demand for skills through indirect indicators d (to supplement ISC information) e Improvement of BBS survey data to provide better information on supply and use of skill f training g Role of skill training and TVET for women
The rationale behind choice of each of the above is somewhat obvious. Still a few comments are perti-nent. It is being recommended that both tracer study and indirect indicators (e.g. unemployment rate among the youth labour force with and without training etc.) are assessed to cross examine the presence of demand-supply gap.
The survey of background characteristics of trainees is needed because their willingness to participate in the labour force and reservation wage varies with such characteristics.
An important strategy for obtaining good quality data on industry wise growth of use of skilled labour is to enhance data quality of BBS’s nationally representative sample surveys, especially the Labour Force Survey. In fact, 2010 round of sample survey provides some information on skill level of labour force and training received. The questions used to collect this information and the coding of responses has short-comings which need to be rectified in future rounds of surveys.
BMET’s and private training institution’s capacity should be enhanced to provide suitable data. Such data should be made as per NTVQF categories and as per suitability for sectors. This will help improve the scope of access by employers. Data base should provide scope for employer’s assessment of perfor-mance by trained personnel whom they hired from a particular organization.
9.10.5 USE OF SKILLS DATA
NSDC will take steps for regular dissemination of data through its internet based system. This will enable both suppliers and industry units to prepare their present and future plans for use of skilled workers.
NSDC may also invite feedback on the usefulness of data provided. Assessment of impact of new data system on actual use of skill and reduction of skill gap should be done from time to time.
Conducting regular tracer survey of trainees should also be a part of the skill data system.

P-64
9.11 CONCLUDING OBSERVATIONS AND POLICY RECOMMENDATIONS
Based on the quantitative analysis of skill gap and sectoral skill demand projections of the present study, following conclusions and recommendations have been presented. These recommendations need atten-tion from policy makers and especially NSDC.
CONCLUDING OBSERVATIONS
Present study has examined the skill demand in various manufacturing and other skill intensive sectors. The present skill structure and future demand for skill has been assessed.
The prospect of supply of skill and the possible routes to fulfillment of future demand have been discussed. The major findings emerging from the analysis are:
a Low unemployment rate and high LFPR among those with technical and vocational education indicates absence of excess supply of skill. Views of employers also corroborate this. Econometric results (wage equations) also support this since the coefficients of technical/vocational diploma are higher than the coefficients of SSC/HSC. The result is in line with skill shortage reported for other Asian countries of South and South-East Asia.
b Estimates of skill demand in a few sectors along with available skills have been presented. TVET organizations may take note of this excess demand and draw up plans for training facilities. Large gaps exist in IT sector and in leather and food processing. It should, however be clarified that the projections of skill demand and skill gaps provide only some rough approximations. These are based on secondary materials and in some cases data quality may not be as good as desired. So these can provide some guidelines. In future better projections should be targeted through better quality data and covering all major sectors.
c The skill shortage depicted above stands in contrast with high unemployment rates among TVET graduates and employers’ demand for low skilled workers shown in other studies (WB 2007, WB 2013). The difference is explained by a combination of factors. Tracer study overestimates unem-ployment rates due to problems of survey method. The demand situation may have changed over time and the observed low share of TVET diploma holders in total employment reflects the low supply and is not a demand side phenomenon.
d Supply of skill in Bangladesh is of heterogeneous quality. Skills expected from courses of various duration and diplomas are less than what is expected. Often there is uncertainty about the quality of skill. The fact that many of the HSC-vocational achievers do not seek or find employment reflects that this level of skill is unhelpful for employment.6
e To overcome the problem of discrepancy of skill achieved and skill expected from certain diploma holders, competency based training and uniform and more meaningfully defined skill levels through NTVQF should be introduced and progress has been made in this direction.
f While the assessment of demand and projection of demand for skill can play an important role in planning for skill generation, available data base for such assessment is quite inadequate as has been mentioned above. Generating quality projection should be targeted by NSDC and ISCs can play critical role in this process.
POLICY RECOMMENDATIONS
Recommendations presented here belong to four categories. These are:
a Linking macro policies with skill development strategy
b How to prepare quality projections of demand for skilled labour
c How to improve ISC’s role in assessment of skill demand
d How to match the supply of skills with actual jobs/employment through pro-active measures.
6. As a result they either go for higher studies or seek more training.
QUANTITATIVE ASSESSMENT OF SKILL DEM
AND AND SKILL GAP
P-65
9.11.1 RECOMMENDATION 1: MACRO POLICIES FOR INDUSTRIALIZATION AND LINKING WITH SKILL
The need for linking supply of skill with the demand has by now been widely recognized and has been elaborated in the following recommendations. However, a precondition for the success of such strategy is its coherence with the macro-economic policies which can play pivotal role in accelerating the pace of industrial growth and thereby generate demand for skill. Policies must be adopted to create conducive environment for both domestic investment and for FDI inflow especially in the labour intensive sectors. Sectors with higher labour intensity are likely to employ large number of workers with low to medium levels of competency scales and these sectors should get priority in the short run. Labour productivity can rise with growth of employment of trained workers. Analyses of the present and previous studies (Rahman 2012, Rahman and Islam 2006) shows that RMG, furniture, leather and IT sectors can be the prime movers in this direction and require incentives through suitable macro policies.
9.11.2 RECOMMENDATION 2: POLICIES FOR REGIONALLY DISPERSED INDUSTRIALIZATION AND SKILL TRAINING
Along with macro policies, government policies must also focus on the regional balance of skill based industrialization. This is pertinent because Bangladesh government’s TVET institutions have already adopted a regionally dispersed setup for producing skills. Private training institutions can also cost effec-tively operate in areas distant from central regions. If industrialization takes place in all regions in a balanced manner, the locally trained skilled persons can get employment rather than having to move to Dhaka and neighbouring districts and the region around port city of Chittagong. During the last two decades industrial enterprises have been concentrated in these two regions which poses a disadvantage in hiring skilled labour and information flow about labour availability. The problem affects the job seekers even more seriously and will be mentioned again in the recommendations.
The regional issue should also be taken into account in the demand assessment by ISCs, which can then be followed up by both private and public TVET institutions.
9.11.3 RECOMMENDATION 3: ASSESS-FIND-TRAIN-EMPLOY-RETRAIN (AFTER) SCHEME
The objectives of ASSESSment of demand for skill and identification of skill gap is to move to a more efficient regime of skill provision and skill utilization. This requires matching of job availability and VTET outputs which in turn will be contingent upon creation of capacity for appropriate type of TRAINing. How-ever, the creation of training capacity and existence of potential demand cannot be considered as suffi-cient conditions for success of the system. Such success requires linking steps. The linking steps include FINDing suitable persons for training. Suitability includes not only background qualification but also the willingness of the candidates to complete a specific training. Another aspect can be critical in the choice of the trainees. This is their eagerness to take up employment where the acquired skill can be utilized.
Similarly the other link in the chain is the actual EMPLOYment of those who obtained specific training. Again the employment should be such that the specific skills acquired can be put to practice.
The last step of ‘RETRAINing’ in fact encompasses all aspects of lifelong learning mechanisms and articulation. This approach involves a systematic interface between TVET, subsequent employment, switching to higher education which will open up pathways for vertical job mobility where TVET and higher education qualification can make combined contribution to productivity. This system has to be institution-alized so that those who enter TVET as the first step can visualize career prospects beyond the narrow confines of jobs with TVET certificate only.
In this whole process, the employers’ and TVET organizations cooperation and interaction are essential. These institutional issues therefore deserve adequate attention.
Strengthening skill based growth of the economy requires improvement of skills which can be achieved through policies focusing on both demand and supply side. This implies that assessment of demand must be more correctly done and the supply (both number and quality) must be relevant to market demands. This will require that the training programmes are guided by ‘job-skill-matching’ paradigm.

P-66
For individual labour force participant training is critical for better job with higher wage/salary (as has been demonstrated by econometric analysis). Obtaining skill portability, developing specialization in areas with critical demand, flexible use of skills so that employers derive benefit from the skills will not only ensure access to decent jobs but also career advancement to better jobs. Training thus adds value to ones job market presence.
However, training should not be viewed as a once for all achievement. Skill development is a continuous process and regular updating of skills requires on-the-job training and retraining at various positions in the labour market. Skill does not mean only acquiring certain competencies or application of theory. It requires internalizing the skill concept and its application to realize the enterprise goals or even setting such goals. Demand assessment of skills and reforms of TVET system to address skills gap must proceed with this broader framework of skill development. This can be achieved through the following steps:
a involving private sector in assessment of demand b involving private sector in adopting strategies to gear supply to actual market needs c motivating TVET suppliers to formulate plans in accordance to the demand and to d improve quality of skill training.
For involvement of private sector for achieving (a) and (b) above ISCs must be made functioning effec-tively. Employers’ and workers representatives should participate in formulation of TVET expansion strate-gies, skill standards drafting and curriculum development.
For progress in (c) above, the public sector TVET institutions will require greater autonomy. These institu-tions should try to ensure better linkages with enterprises and industries.
Overall improvement in market relevant and competency based skill certification will require improved assessment practices. This will necessitate an improved learning environment with better physical facili-ties and motivated trainers.
9.11.4 RECOMMENDATION 4: SKILL DEVELOPMENT GEARED TO NTVQF
For all sectors ISCs should be formed, registered and effectively launched so that these bodies can bring together the major industry bodies in a sector to identify skill development issues relevant for the sector. ISCs will be able to assess a sector’s skill demand, and in developing the strategies and policies for improving the capabilities for skill development.
Capacity of the Industry Skill Council and of individual enterprises should be strengthened so that they are encouraged to place demand for training tuned to NTVQF level specifications. As a precondition for capacity raising of ISC and TVET providers, overall awareness should be enhanced on the importance of the NTVQF levels and the importance of its implementation. In this context the current practice is to talk in terms skilled, semi-skilled and unskilled. The problems of such general descriptions or talking in terms of years of training should be highlighted to convince the stakeholders about the critical role NTQVF concept may play. The same should be done for TVET providers so that their trainings are oriented by NTVQF.
Over the years, training is expected to be geared towards CBT which provides advantages over time-based courses and certification. However, before the NTVQF is widely accepted and CBT is implemented, preparations would be required. Preparations include curriculum development and related equipments, training materials as well as teacher training. Such preparations also include increasing public awareness through campaigns and demonstrations. The change may be initiated through introduction of the new system in selected institutions and in high priority skill levels
CBT is expected to include a number of special features which are more or less expected. These include: multiple entry/exit, modular and self paced courses, assessment of skill acquisition on the basis of actual work following industry requirements, giving certificates through recognition of prior learning etc. These flexible components will require improved quality of assessment of trainees’ skill acquisition success. Active involvement of private sector enterprises can ensure the quality of training and valid assessment.
QUANTITATIVE ASSESSMENT OF SKILL DEM
AND AND SKILL GAP
P-67
Private sector involvement may take the form of financial incentives. It may be implemented through the following system:
• Sector association/selected enterprises may commission some skill development through public organizations and pay a significant part of the cost in a few selected public institutions.
• At the end of training, the enterprises will hire them and will get refund of the training expenses they advanced in installments over say 2-3 years.
With enhanced capacity, the ISCs can place demand for the present industrial units and also make projections for the future phases as per NTVQF levels. They will thus be able to provide job description, job specification & personnel specification for skilled workforce required.
National skill survey should be undertaken in phases to cover all sectors of the industries and all other sectors employing skilled workforce. This may be done with a view to operationalising the NTVQF stan-dards for accelerated economic growth the country. The survey respondents’ response must be trans-lated to NTVQF levels on the spot, with inputs from the interviewers and researchers.
9.11.5 RECOMMENDATION 5: INSTITUTIONAL ASPECTS
NSDC should act as the national coordinating authority for the skill development. It has to be established by an Act of the Parliament and staffed by professionals with high level of competencies so that it can effectively perform the key functions and as well as much of the supporting functions as enunciated in the NSDP.
The draft of the Bangladesh Standard Classification of occupations (BSCO) needs to be reviewed and revised pragmatically.
ISCs and NSDC should guide regular updating of training curriculum. BTEB can provide inputs into the process.
BTEB must initiate clear programmes for strengthening its organizational and institutional capacity so that it can provide leadership in the whole process. It should have separate budget for research and capacity creation. Training institutes may be set up through public-private partnership (PPP) which can ensure both quality of training and demand oriented skill generation.
9.11.6 RECOMMENDATION 6: TRAINING FOR OVERSEAS EMPLOYMENT
Overseas employment of skilled workforce should gradually be tuned to the NTVQF level classified work-force who will then act as a motivation for the skill providers to shift to NTVQF classification. In this context there is need for conducting skills demand surveys in the countries where there is potential for exporting skill classified workforce and where sizable number of skilled workforce from Bangladesh are already employed.
Updating and upgrading of training and certification of the overseas employed skilled workforce is needed. Host country cooperation is needed for this.
9.11.7 RECOMMENDATION 7: EQUITY ISSUES
TVET providers should take steps to ensure equity and create conducive environment for the training of the disabled and disadvantaged groups. Employer should also be motivated to hire the disadvantaged groups. TVET institutions, especially the private providers must be responsive and flexible so that they can serve the poorer youth. A high percentage of poorer youth drop out from school before completing class VIII who may be turned into a productive force through proper training.
P-68
9.11.8 RECOMMENDATION 8: GENDER EQUITY IN TVET: CREATION OF SUPPLY AND MATCHING DEMAND
Although gender equality is an announced goal in Bangladesh, gender related differential continues in the labour market. Employers may not wish to employ women for some jobs, wages of women are often lower. Therefore the skill development plans for women should be done through assessment of demand and supply separately. Past research has shown that women from low income groups do not have much pref-erence about jobs and will accept any work with good pay. However, employers usually have strong pref-erences and this should be taken into account in the assessment of demand. Nonetheless, by imparting quality training to women and ensuring same standard as men for each NTVQF level, it will be possible to encourage employers to engage more women.
Moreover, attempt should be made to enroll women from lower income groups in TVET courses because they are more willing to join the labour market and are less likely to have any prejudice against technical stream of education. Provision of special quota and scholarships for female students may help the purpose. Various forms of special financial assistance programmes should be adopted to broaden the scope for training opportunities for low income and disadvantaged groups. Such funds may also be made available for trainers as well. Scholarships should be provided to training of trainers who come from low income families and poorer regions.
Young girls can benefit from training facilities for RMG jobs, light engineering and a number of informal sub-sectors. With proper training, women may engage as sub-contractors of specific operations in RMG, leather sector work. Therefore gender-sensitive pathways to TVET must be developed.
Skill requirement of the informal labour market
Bangladesh, like other South Asian countries is characterized by economic dualism, with a large segment of informal sector and a small formal and organized sector. The present paper has focused mainly on the formal sectors since the scope of the study was limited. However the skill requirements and skill constraints of the informal sectors should also receive proper attention.
QUANTITATIVE ASSESSMENT OF SKILL DEM
AND AND SKILL GAP
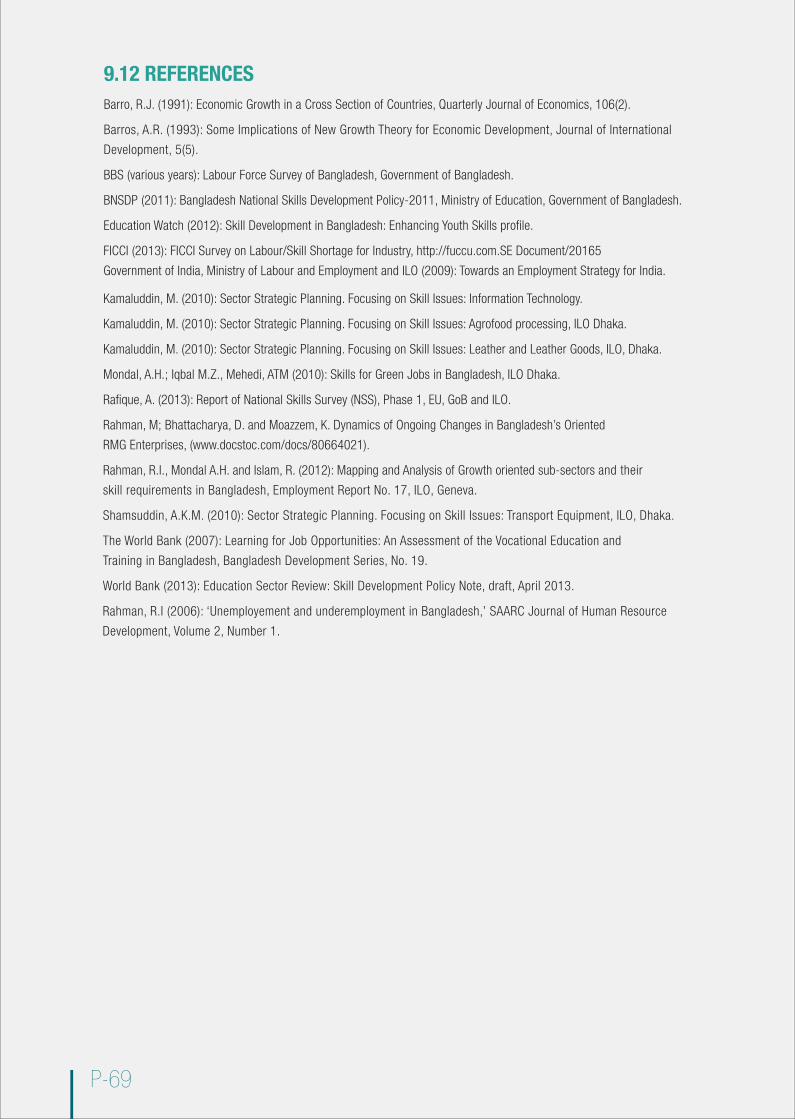
P-69
9.12 REFERENCESBarro, R.J. (1991): Economic Growth in a Cross Section of Countries, Quarterly Journal of Economics, 106(2).
Barros, A.R. (1993): Some Implications of New Growth Theory for Economic Development, Journal of International
Development, 5(5).
BBS (various years): Labour Force Survey of Bangladesh, Government of Bangladesh.
BNSDP (2011): Bangladesh National Skills Development Policy-2011, Ministry of Education, Government of Bangladesh.
Education Watch (2012): Skill Development in Bangladesh: Enhancing Youth Skills profile.
FICCI (2013): FICCI Survey on Labour/Skill Shortage for Industry, http://fuccu.com.SE Document/20165
Government of India, Ministry of Labour and Employment and ILO (2009): Towards an Employment Strategy for India.
Kamaluddin, M. (2010): Sector Strategic Planning. Focusing on Skill Issues: Information Technology.
Kamaluddin, M. (2010): Sector Strategic Planning. Focusing on Skill Issues: Agrofood processing, ILO Dhaka.
Kamaluddin, M. (2010): Sector Strategic Planning. Focusing on Skill Issues: Leather and Leather Goods, ILO, Dhaka.
Mondal, A.H.; Iqbal M.Z., Mehedi, ATM (2010): Skills for Green Jobs in Bangladesh, ILO Dhaka.
Rafique, A. (2013): Report of National Skills Survey (NSS), Phase 1, EU, GoB and ILO.
Rahman, M; Bhattacharya, D. and Moazzem, K. Dynamics of Ongoing Changes in Bangladesh’s Oriented
RMG Enterprises, (www.docstoc.com/docs/80664021).
Rahman, R.I., Mondal A.H. and Islam, R. (2012): Mapping and Analysis of Growth oriented sub-sectors and their
skill requirements in Bangladesh, Employment Report No. 17, ILO, Geneva.
Shamsuddin, A.K.M. (2010): Sector Strategic Planning. Focusing on Skill Issues: Transport Equipment, ILO, Dhaka.
The World Bank (2007): Learning for Job Opportunities: An Assessment of the Vocational Education and
Training in Bangladesh, Bangladesh Development Series, No. 19.
World Bank (2013): Education Sector Review: Skill Development Policy Note, draft, April 2013.
Rahman, R.I (2006): ‘Unemployement and underemployment in Bangladesh,’ SAARC Journal of Human Resource
Development, Volume 2, Number 1.


ANNEXURES
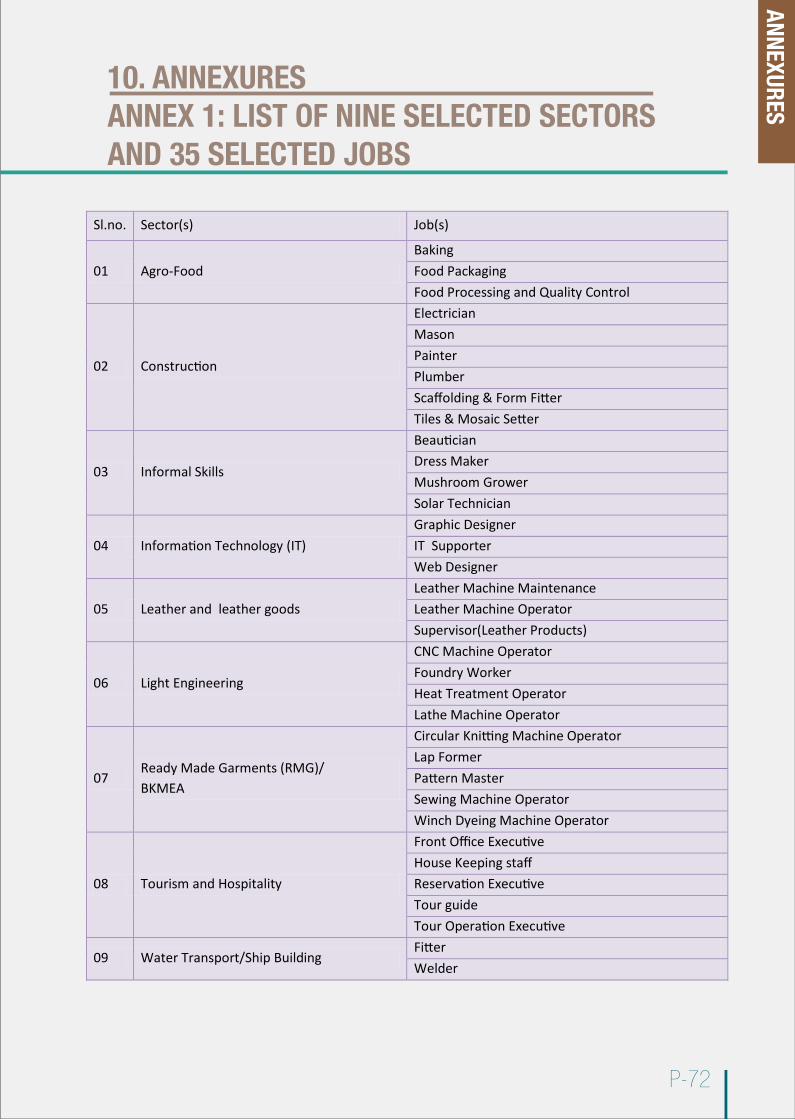
10. ANNEXURESANNEX 1: LIST OF NINE SELECTED SECTORS AND 35 SELECTED JOBS
P-72
Sl.no. Sector(s) Job(s)
01 Agro-FoodBakingFood PackagingFood Processing and Quality Control
02 Construction
ElectricianMasonPainterPlumberScaffolding & Form FitterTiles & Mosaic Setter
03 Informal Skills
BeauticianDress MakerMushroom GrowerSolar Technician
04 Information Technology (IT)Graphic DesignerIT SupporterWeb Designer
05 Leather and leather goods Leather Machine MaintenanceLeather Machine OperatorSupervisor(Leather Products)
06 Light Engineering
CNC Machine OperatorFoundry WorkerHeat Treatment OperatorLathe Machine Operator
07Ready Made Garments (RMG)/BKMEA
Circular Knitting Machine OperatorLap FormerPattern MasterSewing Machine OperatorWinch Dyeing Machine Operator
08 Tourism and Hospitality
Front Office ExecutiveHouse Keeping staffReservation ExecutiveTour guideTour Operation Executive
09 Water Transport/Ship BuildingFitterWelder
ANNEXURES
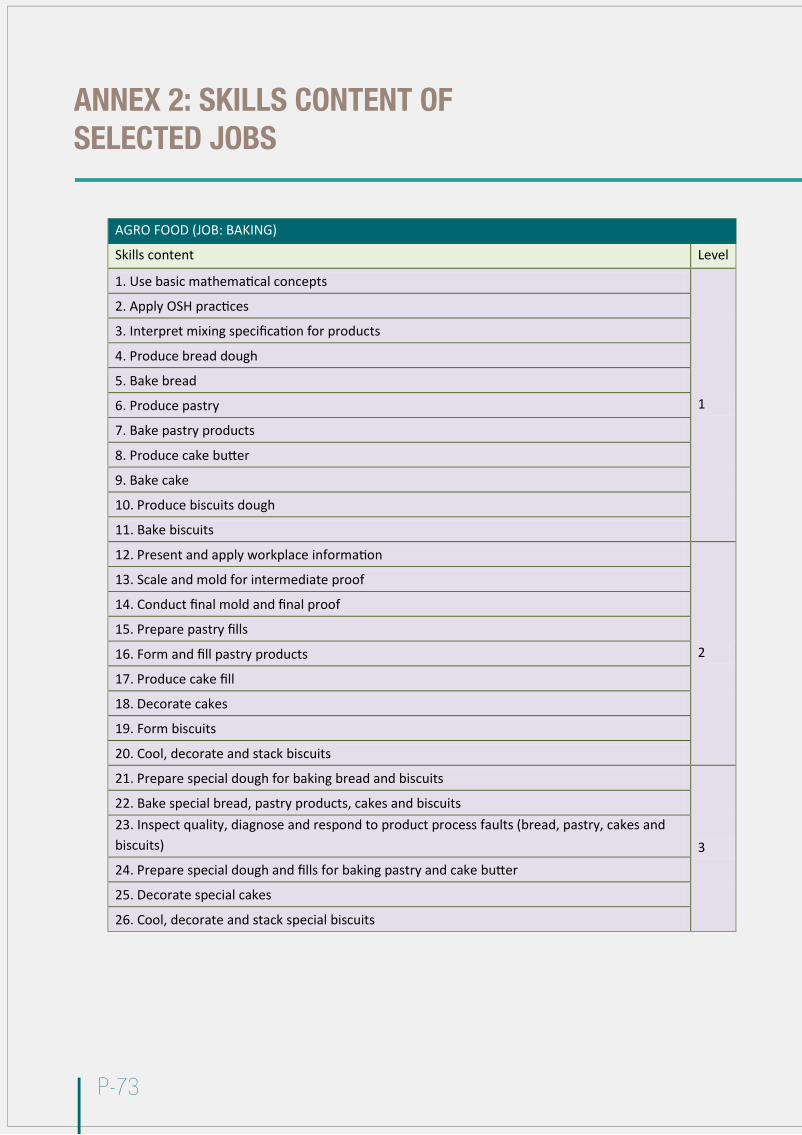
P-73
ANNEX 2: SKILLS CONTENT OF SELECTED JOBS
Skills content Level
1. Use basic mathematical concepts
1
2. Apply OSH practices
3. Interpret mixing specification for products
4. Produce bread dough
5. Bake bread
6. Produce pastry
7. Bake pastry products
8. Produce cake butter
9. Bake cake
10. Produce biscuits dough
11. Bake biscuits
12. Present and apply workplace information
2
13. Scale and mold for intermediate proof
14. Conduct final mold and final proof
15. Prepare pastry fills
16. Form and fill pastry products
17. Produce cake fill
18. Decorate cakes
19. Form biscuits
20. Cool, decorate and stack biscuits
21. Prepare special dough for baking bread and biscuits
3
22. Bake special bread, pastry products, cakes and biscuits23. Inspect quality, diagnose and respond to product process faults (bread, pastry, cakes and biscuits)
24. Prepare special dough and fills for baking pastry and cake butter
25. Decorate special cakes
26. Cool, decorate and stack special biscuits
AGRO FOOD (JOB: BAKING)

P-74
1. Use basic mathematical concept
12. Apply OSH practices
3. Follow quality and food safety programs
4. Operate a sieving, blending and bagging process
5. Present and apply workplace information
26. Operate a form, fill and seal process
7. Operate a form case packing process
8. Operate a thermo-formed blister packaging
9. Operate a twist-warp process
3
10. Operate injection blow molding equipment
11. Operate a high speed warping process
12. Operate a blow molding equipment
13. Fill and close product into bottles
14. Fill and close product into cans
1. Use basic mathematical concept12. Apply osh practices
3. Follow quality and food safety programs
4. Present and apply workplace information25. Apply raw materials /ingredient and process knowledge
6. Operate process in a production system
7. Control food contamination and spoilage
38. Apply principles of food packaging
9. Identify the physical and chemical properties of materials, food and related products
10. Identify and apply food additives
11. Apply engineering principles to a food production process4
12. Participate in a Hazard analysis and critical control points (HACCP) team
Skills content of the job Level
1. Practice work place cleanliness
1
2. Practice Occupational Health & Safety (OHS)
3. Interpret drawings and specifications in the construction (electrical) sector
4. Perform measurement and calculations in the construction (electrical) sector
5. Use hand tools and power tools for the construction (electrical sector)
6. Install channel and cables
7. Install fittings and fixtures
8. perform arthing
9. Connect simple electric circuits
AGRO FOOD (JOB: FOOD PACKAGING)
CONSTRUCTION (JOB: ELECTRICIAN)
Agro food (Job:food processing & quality control)
ANNEXURES
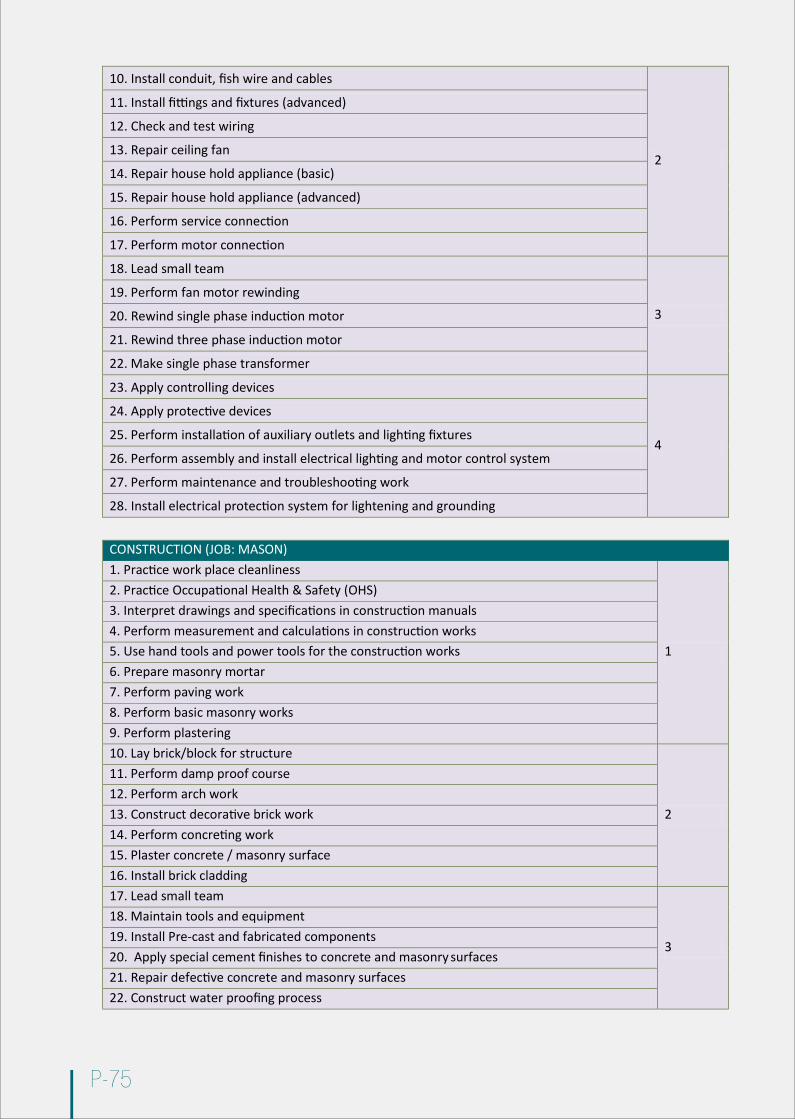
P-75
10. Install conduit, fish wire and cables
2
11. Install fittings and fixtures (advanced)
12. Check and test wiring
13. Repair ceiling fan
14. Repair house hold appliance (basic)
15. Repair house hold appliance (advanced)
16. Perform service connection
17. Perform motor connection
18. Lead small team
319. Perform fan motor rewinding
20. Rewind single phase induction motor
21. Rewind three phase induction motor
22. Make single phase transformer
23. Apply controlling devices
4
24. Apply protective devices
25. Perform installation of auxiliary outlets and lighting fixtures
26. Perform assembly and install electrical lighting and motor control system
27. Perform maintenance and troubleshooting work
28. Install electrical protection system for lightening and grounding
1. Practice work place cleanliness
1
2. Practice Occupational Health & Safety (OHS)3. Interpret drawings and specifications in construction manuals4. Perform measurement and calculations in construction works5. Use hand tools and power tools for the construction works6. Prepare masonry mortar7. Perform paving work8. Perform basic masonry works9. Perform plastering10. Lay brick/block for structure
2
11. Perform damp proof course12. Perform arch work13. Construct decorative brick work14. Perform concreting work15. Plaster concrete / masonry surface16. Install brick cladding17. Lead small team
3
18. Maintain tools and equipment19. Install Pre-cast and fabricated components20. Apply special cement finishes to concrete and masonry surfaces21. Repair defective concrete and masonry surfaces22. Construct water proofing process
CONSTRUCTION (JOB: MASON)
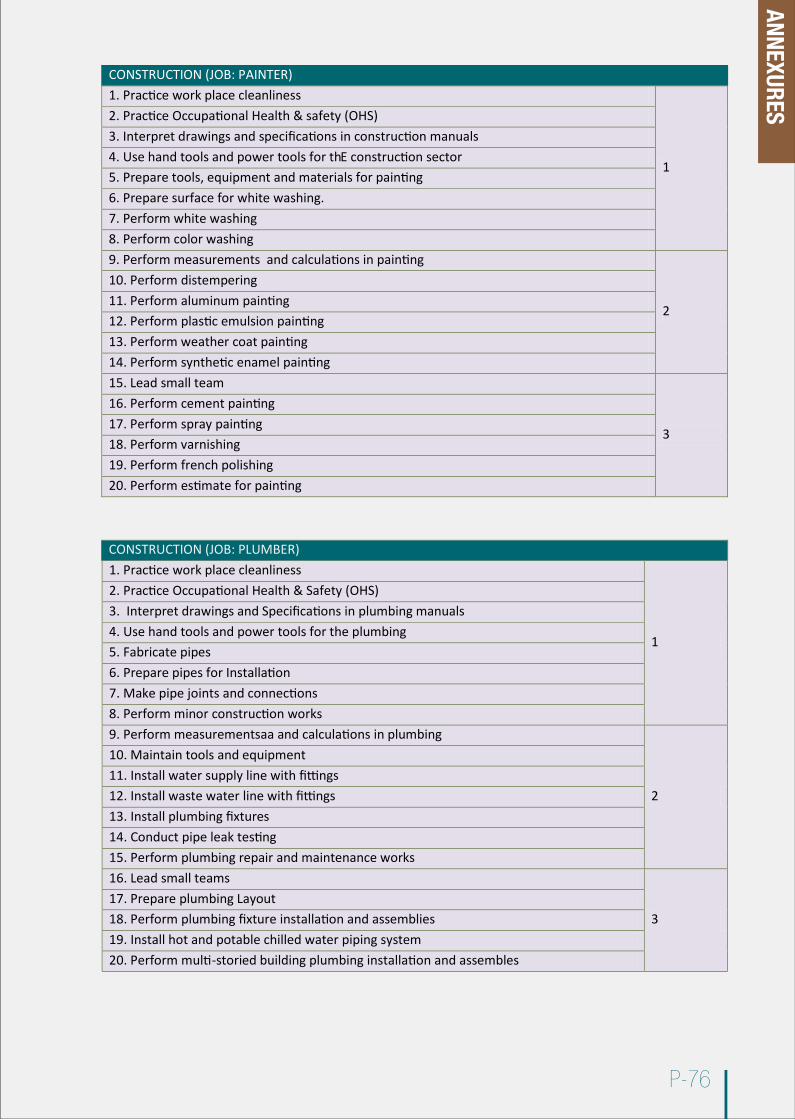
P-76
1. Practice work place cleanliness
1
2. Practice Occupational Health & safety (OHS)3. Interpret drawings and specifications in construction manuals4. Use hand tools and power tools for thE construction sector5. Prepare tools, equipment and materials for painting6. Prepare surface for white washing.7. Perform white washing8. Perform color washing9. Perform measurements and calculations in painting
2
10. Perform distempering11. Perform aluminum painting12. Perform plastic emulsion painting13. Perform weather coat painting14. Perform synthetic enamel painting15. Lead small team
3
16. Perform cement painting17. Perform spray painting18. Perform varnishing19. Perform french polishing20. Perform estimate for painting
1. Practice work place cleanliness
1
2. Practice Occupational Health & Safety (OHS)3. Interpret drawings and Specifications in plumbing manuals4. Use hand tools and power tools for the plumbing5. Fabricate pipes6. Prepare pipes for Installation7. Make pipe joints and connections8. Perform minor construction works9. Perform measurementsaa and calculations in plumbing
2
10. Maintain tools and equipment11. Install water supply line with fittings12. Install waste water line with fittings13. Install plumbing fixtures14. Conduct pipe leak testing15. Perform plumbing repair and maintenance works16. Lead small teams
317. Prepare plumbing Layout18. Perform plumbing fixture installation and assemblies19. Install hot and potable chilled water piping system20. Perform multi-storied building plumbing installation and assembles
CONSTRUCTION (JOB: PAINTER)
CONSTRUCTION (JOB: PLUMBER)
ANNEXURES
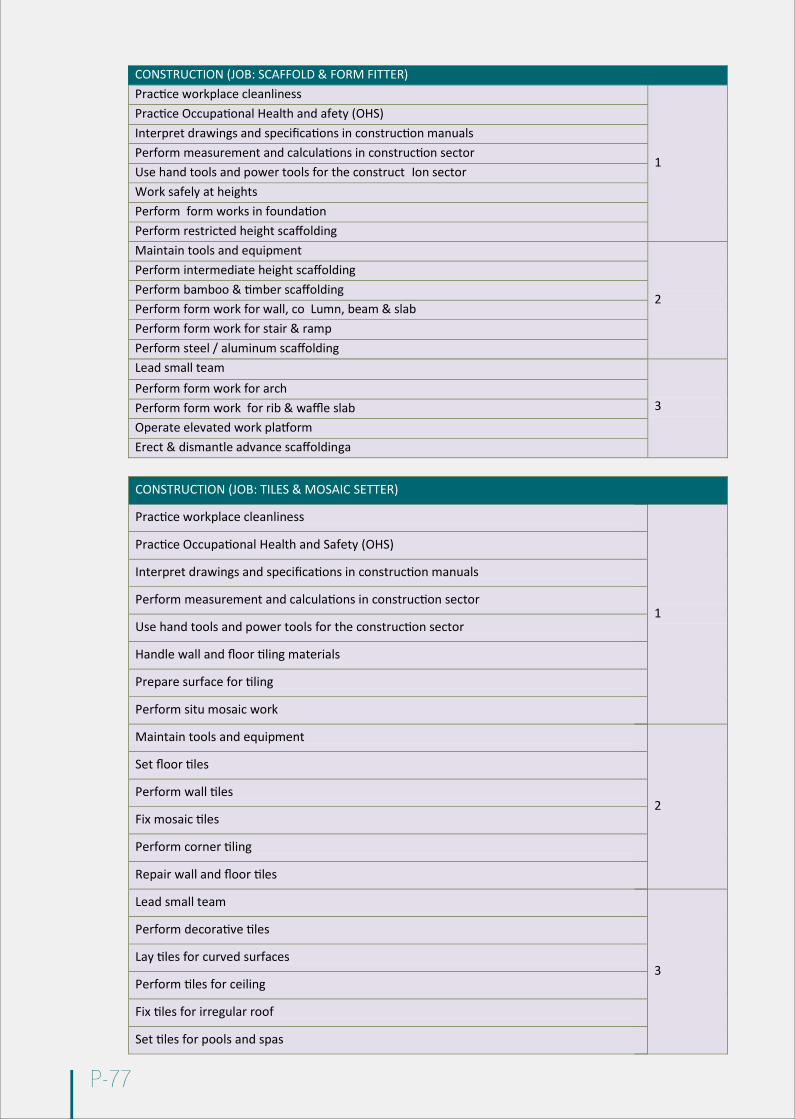
Sl. No. Opinions/recommendations
P-77
Practice workplace cleanliness
1
Practice Occupational Health and afety (OHS)Interpret drawings and specifications in construction manualsPerform measurement and calculations in construction sectorUse hand tools and power tools for the construct Ion sectorWork safely at heightsPerform form works in foundationPerform restricted height scaffoldingMaintain tools and equipment
2
Perform intermediate height scaffoldingPerform bamboo & timber scaffoldingPerform form work for wall, co Lumn, beam & slabPerform form work for stair & rampPerform steel / aluminum scaffoldingLead small team
3Perform form work for archPerform form work for rib & waffle slabOperate elevated work platformErect & dismantle advance scaffoldinga
Practice workplace cleanliness
1
Practice Occupational Health and Safety (OHS)
Interpret drawings and specifications in construction manuals
Perform measurement and calculations in construction sector
Use hand tools and power tools for the construction sector
Handle wall and floor tiling materials
Prepare surface for tiling
Perform situ mosaic work
Maintain tools and equipment
2
Set floor tiles
Perform wall tiles
Fix mosaic tiles
Perform corner tiling
Repair wall and floor tiles
Lead small team
3
Perform decorative tiles
Lay tiles for curved surfaces
Perform tiles for ceiling
Fix tiles for irregular roof
Set tiles for pools and spas
CONSTRUCTION (JOB: SCAFFOLD & FORM FITTER)
CONSTRUCTION (JOB: TILES & MOSAIC SETTER)
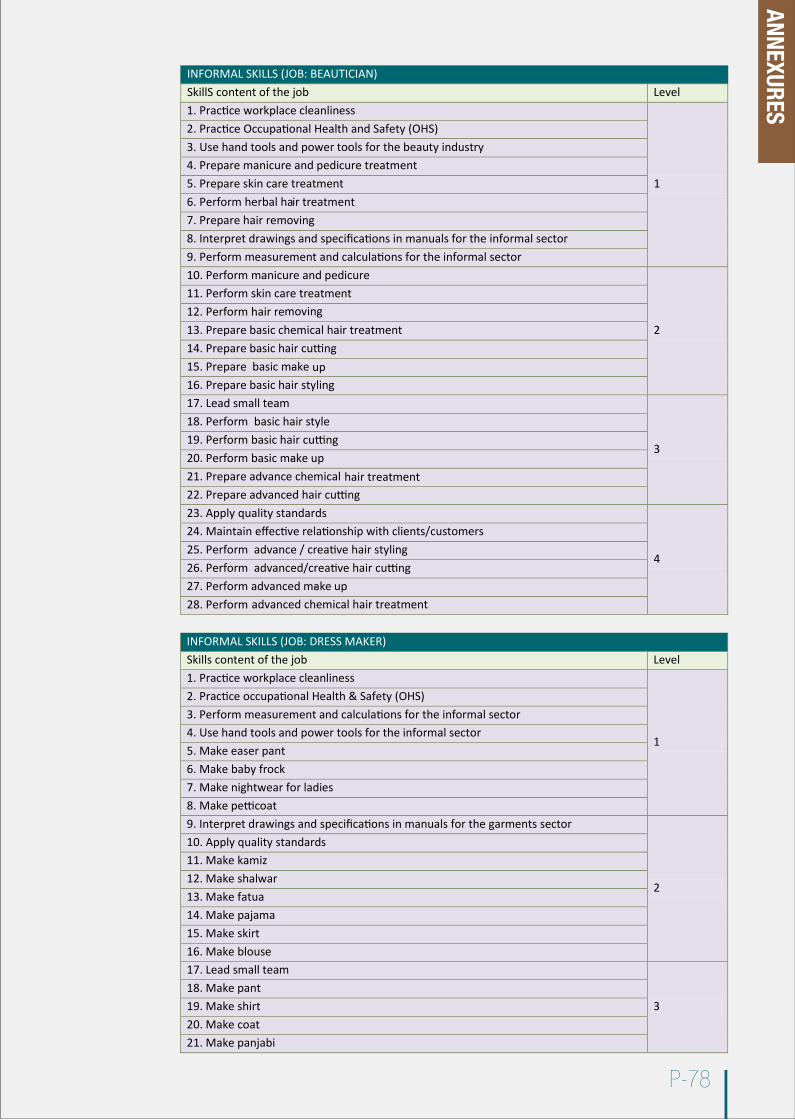
P-78
SkillS content of the job Level1. Practice workplace cleanliness
1
2. Practice Occupational Health and Safety (OHS)3. Use hand tools and power tools for the beauty industry4. Prepare manicure and pedicure treatment5. Prepare skin care treatment6. Perform herbal hair treatment7. Prepare hair removing8. Interpret drawings and specifications in manuals for the informal sector9. Perform measurement and calculations for the informal sector10. Perform manicure and pedicure
2
11. Perform skin care treatment12. Perform hair removing13. Prepare basic chemical hair treatment14. Prepare basic hair cutting15. Prepare basic make- up16. Prepare basic hair styling17. Lead small team
3
18. Perform basic hair style19. Perform basic hair cutting20. Perform basic make- up21. Prepare advance chemical hair treatment22. Prepare advanced hair cutting23. Apply quality standards
4
24. Maintain effective relationship with clients/customers25. Perform advance / creative hair styling26. Perform advanced/creative hair cutting27. Perform advanced make- up28. Perform advanced chemical hair treatment
Skills content of the job Level1. Practice workplace cleanliness
1
2. Practice occupational Health & Safety (OHS)3. Perform measurement and calculations for the informal sector4. Use hand tools and power tools for the informal sector5. Make easer pant6. Make baby frock7. Make nightwear for ladies8. Make petticoat9. Interpret drawings and specifications in manuals for the garments sector
2
10. Apply quality standards11. Make kamiz12. Make shalwar13. Make fatua14. Make pajama15. Make skirt16. Make blouse17. Lead small team
318. Make pant19. Make shirt20. Make coat21. Make panjabi
INFORMAL SKILLS (JOB: BEAUTICIAN)
INFORMAL SKILLS (JOB: DRESS MAKER)
ANNEXURES
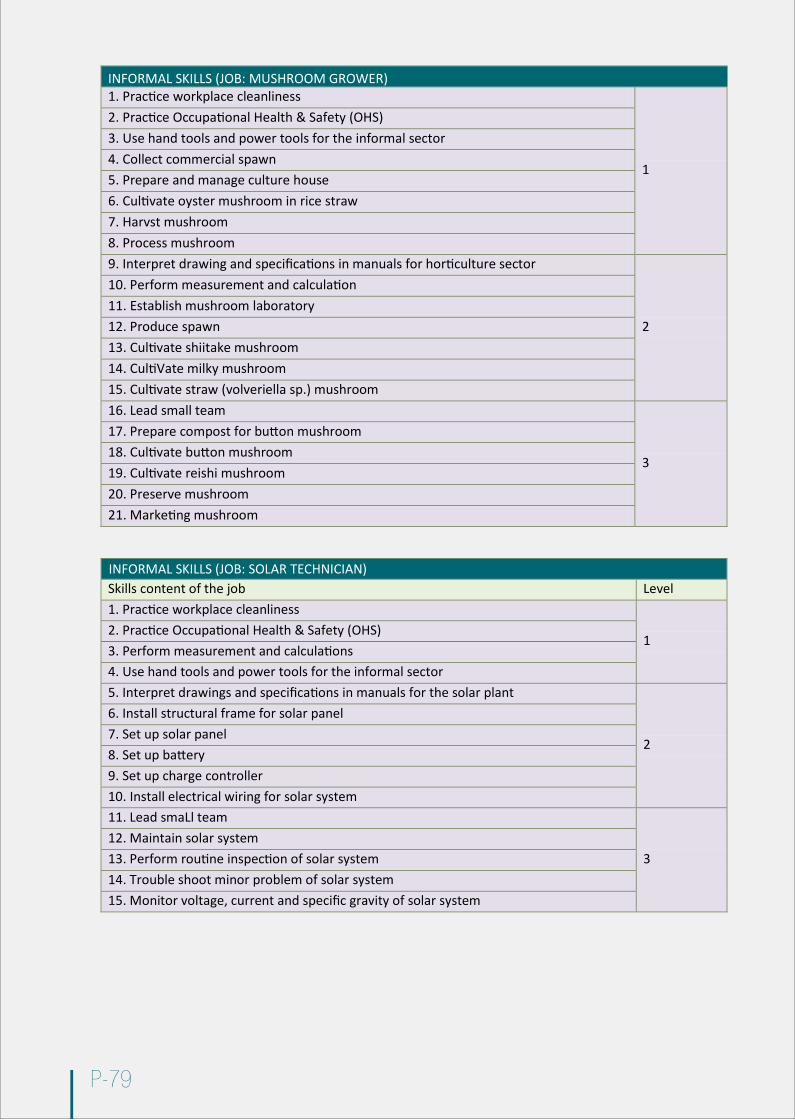
P-79
1. Practice workplace cleanliness
1
2. Practice Occupational Health & Safety (OHS)3. Use hand tools and power tools for the informal sector4. Collect commercial spawn5. Prepare and manage culture house6. Cultivate oyster mushroom in rice straw7. Harvst mushroom8. Process mushroom9. Interpret drawing and specifications in manuals for horticulture sector
2
10. Perform measurement and calculation11. Establish mushroom laboratory12. Produce spawn13. Cultivate shiitake mushroom14. CultiVate milky mushroom15. Cultivate straw (volveriella sp.) mushroom16. Lead small team
3
17. Prepare compost for button mushroom18. Cultivate button mushroom19. Cultivate reishi mushroom20. Preserve mushroom21. Marketing mushroom
Skills content of the job Level1. Practice workplace cleanliness
12. Practice Occupational Health & Safety (OHS)3. Perform measurement and calculations4. Use hand tools and power tools for the informal sector5. Interpret drawings and specifications in manuals for the solar plant
2
6. Install structural frame for solar panel7. Set up solar panel8. Set up battery9. Set up charge controller10. Install electrical wiring for solar system11. Lead smaLl team
312. Maintain solar system13. Perform routine inspection of solar system14. Trouble shoot minor problem of solar system15. Monitor voltage, current and specific gravity of solar system
INFORMAL SKILLS (JOB: MUSHROOM GROWER)
INFORMAL SKILLS (JOB: SOLAR TECHNICIAN)
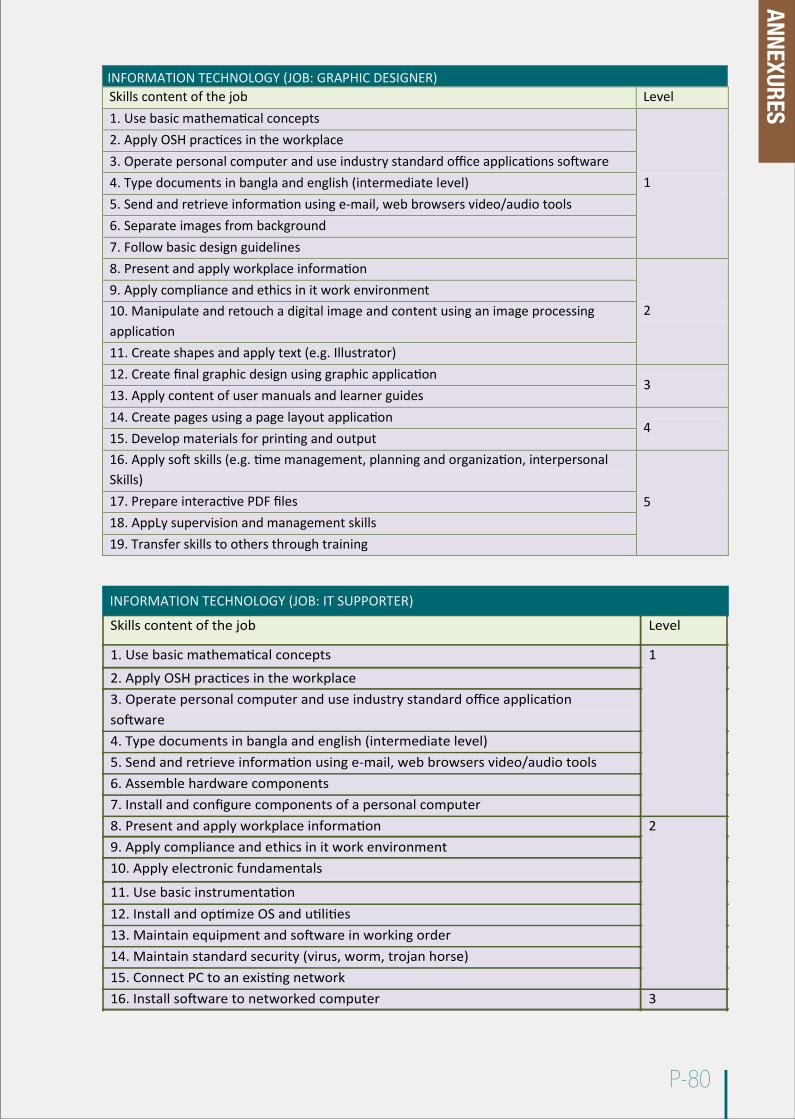
P-80
Skills content of the job Level1. Use basic mathematical concepts
1
2. Apply OSH practices in the workplace3. Operate personal computer and use industry standard office applications software4. Type documents in bangla and english (intermediate l evel)5. Send and retrieve information using e-mail, web browsers video/audio tools6. Separate images from background7. Follow basic design guidelines8. Present and apply workplace information
29. Apply compliance and ethics in it work environment10. Manipulate and retouch a digital image and content using an image processing application11. Create shapes and apply text (e.g. Illustrator)12. Create final graphic design using graphic application
313. Apply content of user manuals and learner guides14. Create pages using a page layout application
415. Develop materials for printing and output16. Apply soft skills (e.g. time management, planning and organization, interpersonal Skills)
517. Prepare interactive PDF files18. AppLy supervision and management skills19. Transfer skills to others through training
INFORMATION TECHNOLOGY (JOB: GRAPHIC DESIGNER)
INFORMATION TECHNOLOGY (JOB: IT SUPPORTER)
Skills content of the job Level
1. Use basic mathematical concepts 1
2. Apply OSH practices in the workplace 3. Operate personal computer and use industry standard office application software 4. Type documents in bangla and english (intermediate level) 5. Send and retrieve information using e-mail, web browsers video/audio tools 6. Assemble hardware components 7. Install and configure components of a personal computer 8. Present and apply workplace information 2 9. Apply compliance and ethics in it work environment 10. Apply electronic fundamentals
11. Use basic instrumentation 12. Install and optimize OS and utilities 13. Maintain equipment and software in working order 14. Maintain standard security (virus, worm, trojan horse) 15. Connect PC to an existing network 16. Install software to networked computer 3
ANNEXURES
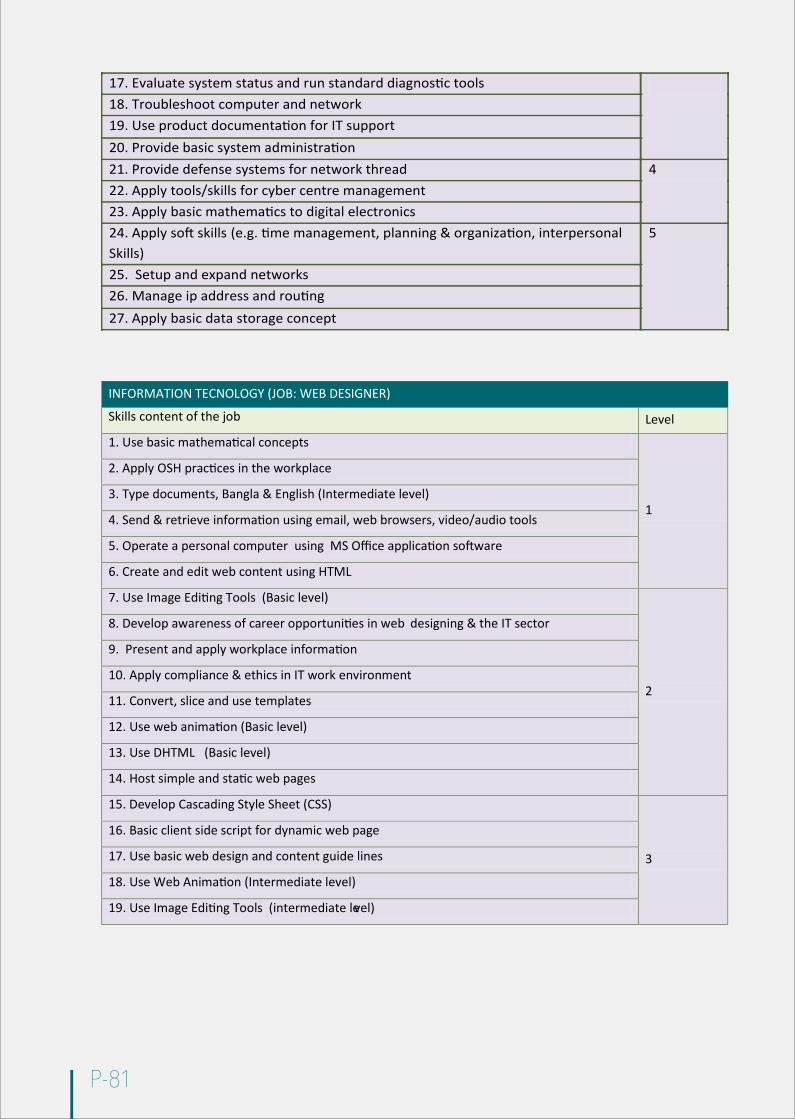
P-81
Skills content of the job Level
1. Use basic mathematical concepts
1
2. Apply OSH practices in the workplace
3. Type documents, Bangla & English (Intermediate level)
4. Send & retrieve information using email, web browsers, video/audio tools
5. Operate a personal computer using MS Office application software
6. Create and edit web content using HTML
7. Use Image Editing Tools (Basic level)
2
8. Develop awareness of career opportunities in web designing & the IT sector
9. Present and apply workplace information
10. Apply compliance & ethics in IT work environment
11. Convert, slice and use templates
12. Use web animation (Basic level)
13. Use DHTML (Basic level)
14. Host simple and static web pages
15. Develop Cascading Style Sheet (CSS)
3
16. Basic client side script for dynamic web page
17. Use basic web design and content guide lines
18. Use Web Animation (Intermediate level)
19. Use Image Editing Tools (intermediate level)
17. Evaluate system status and run standard diagnostic tools 18. Troubleshoot computer and network 19. Use product documentation for IT support 20. Provide basic system administration 21. Provide defense systems for network thread 4 22. Apply tools/skills for cyber centre management 23. Apply basic mathematics to digital electronics 24. Apply soft skills (e.g. time management, planning & organization, interpersonal Skills)
5
25. Setup and expand networks 26. Manage ip address and routing 27. Apply basic data storage concept
INFORMATION TECNOLOGY (JOB: WEB DESIGNER)
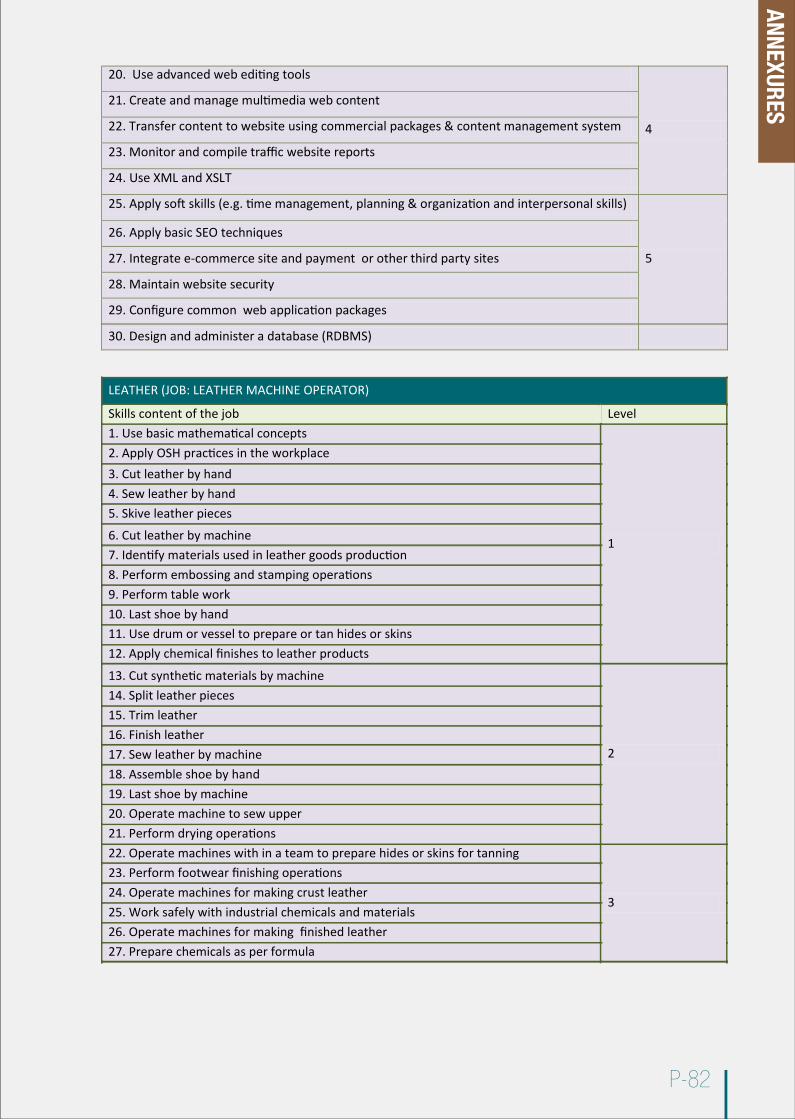
P-82
20. Use advanced web editing tools
4
21. Create and manage multimedia web content
22. Transfer content to website using commercial packages & content management system
23. Monitor and compile traffic website reports
24. Use XML and XSLT
25. Apply soft skills (e.g. time management, planning & organization and interpersonal skills)
5
26. Apply basic SEO techniques
27. Integrate e-commerce site and payment or other third party sites
28. Maintain website security
29. Configure common web application packages
30. Design and administer a database (RDBMS)
LEATHER (JOB: LEATHER MACHINE OPERATOR)
Skills content of the job Level 1. Use basic mathematical concepts
1
2. Apply OSH practices in the workplace 3. Cut leather by hand 4. Sew leather by hand 5. Skive leather pieces
6. Cut leather by machine 7. Identify materials used in leather goods production 8. Perform embossing and stamping operations 9. Perform table work 10. Last shoe by hand 11. Use drum or vessel to prepare or tan hides or skins 12. Apply chemical finishes to leather products
13. Cut synthetic materials by machine
2
14. Split leather pieces 15. Trim leather 16. Finish leather 17. Sew leather by machine 18. Assemble shoe by hand 19. Last shoe by machine 20. Operate machine to sew upper 21. Perform drying operations 22. Operate machines with in a team to prepare hides or skins for tanning
3
23. Perform footwear finishing operations 24. Operate machines for making crust leather 25. Work safely with industrial chemicals and materials 26. Operate machines for making finished leather 27. Prepare chemicals as per formula
ANNEXURES
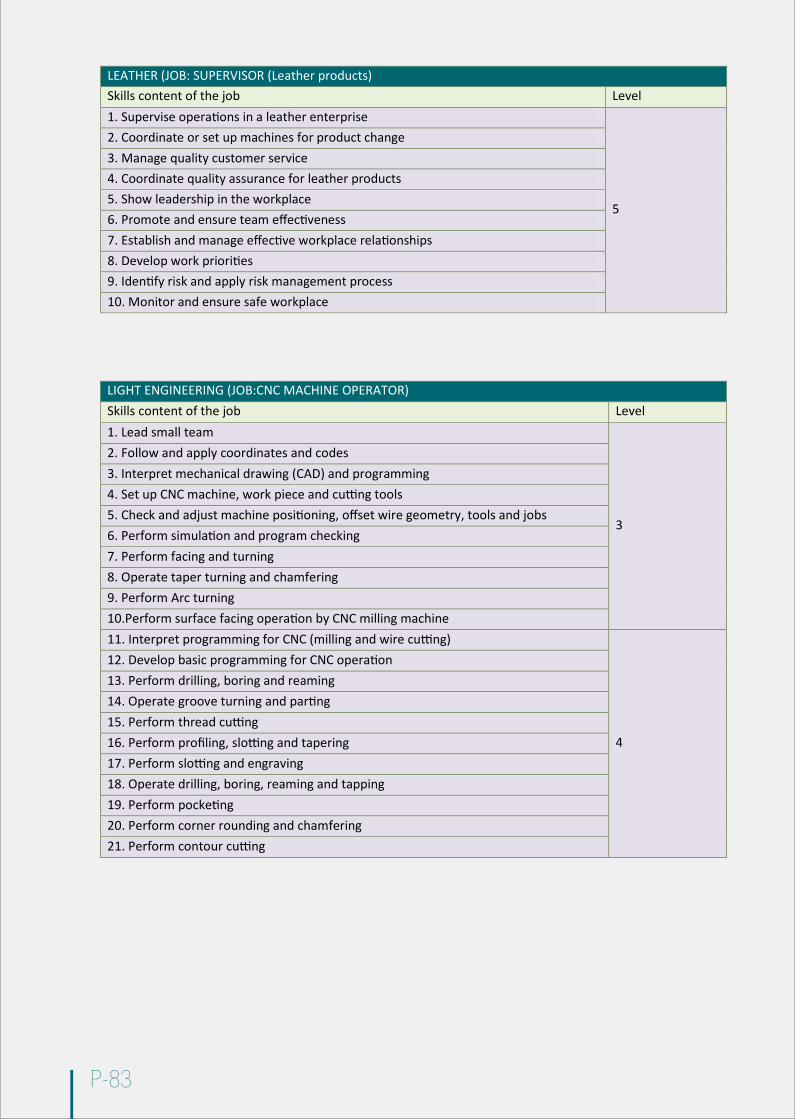
P-83
Skills content of the job Level1. Supervise operations in a leather enterprise
5
2. Coordinate or set up machines for product change3. Manage quality customer service4. Coordinate quality assurance for leather products5. Show leadership in the workplace6. Promote and ensure team effectiveness7. Establish and manage effective workplace relationships8. Develop work priorities9. Identify risk and apply risk management process10. Monitor and ensure safe workplace
LEATHER (JOB: SUPERVISOR (Leather products)
Skills content of the job Level1. Lead small team
3
2. Follow and apply coordinates and codes3. Interpret mechanical drawing (CAD) and programming4. Set up CNC machine, work piece and cutting tools5. Check and adjust machine positioning, offset wire geometry, tools and jobs6. Perform simulation and program checking7. Perform facing and turning8. Operate taper turning and chamfering9. Perform Arc turning10.Perform surface facing operation by CNC milling machine11. Interpret programming for CNC (milling and wire cutting)
4
12. Develop basic programming for CNC operation13. Perform drilling, boring and reaming14. Operate groove turning and parting15. Perform thread cutting16. Perform profiling, slotting and tapering17. Perform slotting and engraving18. Operate drilling, boring, reaming and tapping19. Perform pocketing20. Perform corner rounding and chamfering21. Perform contour cutting
LIGHT ENGINEERING (JOB:CNC MACHINE OPERATOR)
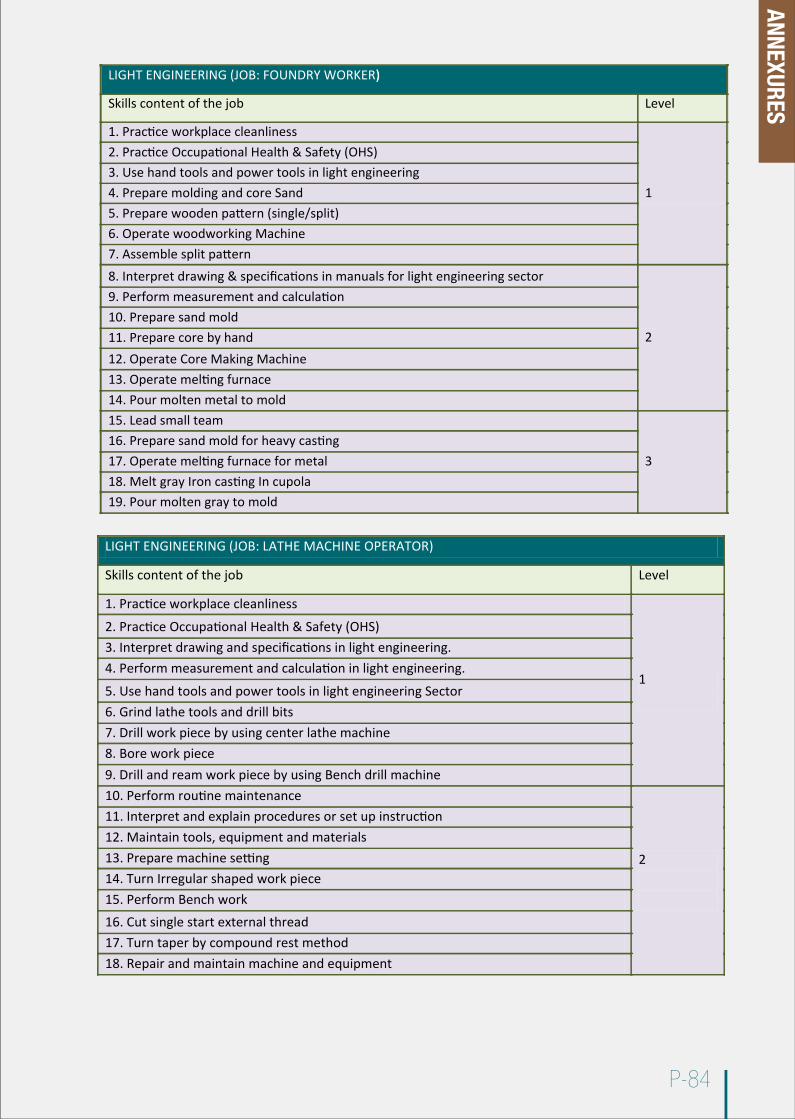
P-84
)LIGHT ENGINEERING (JOB: FOUNDRY WORKER)
Skills content of the job Level
1. Practice workplace cleanliness
1
2. Practice Occupational Health & Safety (OHS) 3. Use hand tools and power tools in light engineering 4. Prepare molding and core Sand 5. Prepare wooden pattern (single/split) 6. Operate woodworking Machine 7. Assemble split pattern 8. Interpret drawing & specifications in manuals for light engineering sector
2
9. Perform measurement and calculation 10. Prepare sand mold 11. Prepare core by hand 12. Operate Core Making Machine 13. Operate melting furnace 14. Pour molten metal to mold 15. Lead small team
3 16. Prepare sand mold for heavy casting 17. Operate melting furnace for metal 18. Melt gray Iron casting In cupola 19. Pour molten gray to mold
LIGHT ENGINEERING (JOB: LATHE MACHINE OPERATOR)
Skills content of the job Level
1. Practice workplace cleanliness
1
2. Practice Occupational Health & Safety (OHS) 3. Interpret drawing and specifications in light engineering. 4. Perform measurement and calculation in light engineering.
5. Use hand tools and power tools in light engineering Sector 6. Grind lathe tools and drill bits 7. Drill work piece by using center lathe machine 8. Bore work piece 9. Drill and ream work piece by using Bench drill machine 10. Perform routine maintenance
2
11. Interpret and explain procedures or set up instruction 12. Maintain tools, equipment and materials 13. Prepare machine setting 14. Turn Irregular shaped work piece 15. Perform Bench work 16. Cut single start external thread 17. Turn taper by compound rest method 18. Repair and maintain machine and equipment
ANNEXURES
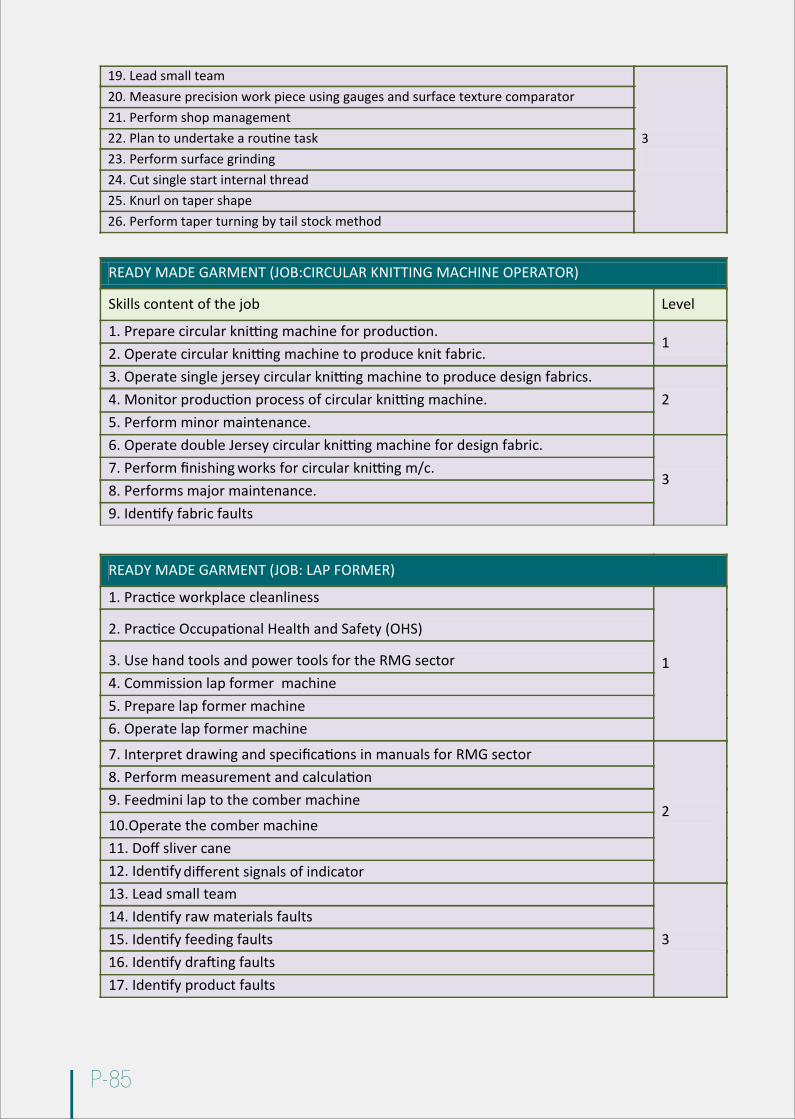
P-85
19. Lead small team
3
20. Measure precision work piece using gauges and surface texture comparator 21. Perform shop management 22. Plan to undertake a routine task 23. Perform surface grinding 24. Cut single start internal thread 25. Knurl on taper shape 26. Perform taper turning by tail stock method
READY MADE GARMENT (JOB: LAP FORMER)
1. Practice workplace cleanliness
1
2. Practice Occupational Health and Safety (OHS)
3. Use hand tools and power tools for the RMG sector 4. Commission lap former machine 5. Prepare lap former machine 6. Operate lap former machine
7. Interpret drawing and specifications in manuals for RMG sector
2
8. Perform measurement and calculation 9. Feed mini lap to the comber machine
10.Operate the comber machine 11. Doff sliver cane 12. Identify different signals of indicator 13. Lead small team
3 14. Identify raw materials faults 15. Identify feeding faults 16. Identify drafting faults 17. Identify product faults
READY MADE GARMENT (JOB:CIRCULAR KNITTING MACHINE OPERATOR)
Skills content of the job Level
1. Prepare circular knitting machine for production. 1
2. Operate circular knitting machine to produce knit fabric. 3. Operate single jersey circular knitting machine to produce design fabrics.
2 4. Monitor production process of circular knitting machine. 5. Perform minor maintenance. 6. Operate double Jersey circular knitting machine for design fabric.
3 7. Perform finishing works for circular knitting m/c. 8. Performs major maintenance. 9. Identify fabric faults
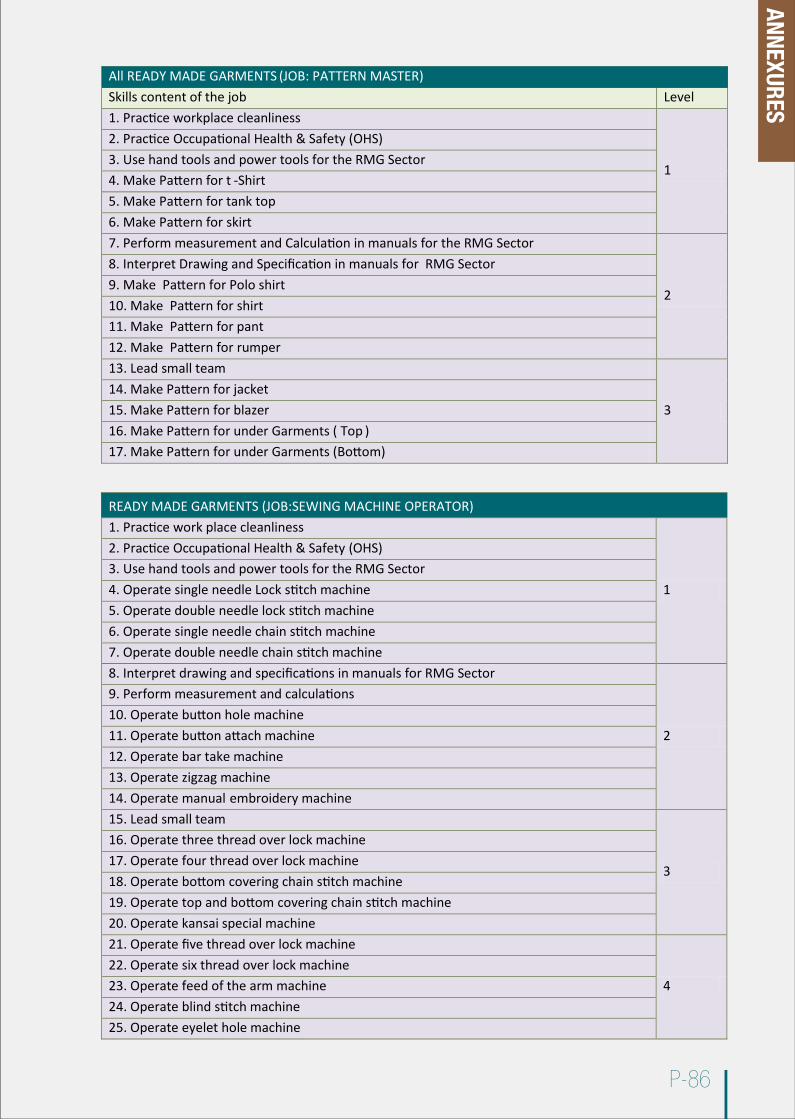
P-86
Skills content of the job Level1. Practice workplace cleanliness
1
2. Practice Occupational Health & Safety (OHS)3. Use hand tools and power tools for the RMG Sector4. Make Pattern for t -Shirt5. Make Pattern for tank top6. Make Pattern for skirt7. Perform measurement and Calculation in manuals for the RMG Sector
2
8. Interpret Drawing and Specification in manuals for RMG Sector9. Make Pattern for Polo shirt10. Make Pattern for shirt11. Make Pattern for pant12. Make Pattern for rumper13. Lead small team
314. Make Pattern for jacket15. Make Pattern for blazer16. Make Pattern for under Garments ( Top )17. Make Pattern for under Garments (Bottom)
All READY MADE GARMENTS (JOB: PATTERN MASTER)
1. Practice work place cleanliness
1
2. Practice Occupational Health & Safety (OHS)3. Use hand tools and power tools for the RMG Sector4. Operate single needle Lock stitch machine5. Operate double needle lock stitch machine6. Operate single needle chain stitch machine7. Operate double needle chain stitch machine8. Interpret drawing and specifications in manuals for RMG Sector
2
9. Perform measurement and calculations10. Operate button hole machine11. Operate button attach machine12. Operate bar take machine13. Operate zigzag machine14. Operate manual embroidery machine15. Lead small team
3
16. Operate three thread over lock machine17. Operate four thread over lock machine18. Operate bottom covering chain stitch machine19. Operate top and bottom covering chain stitch machine20. Operate kansai special machine21. Operate five thread over lock machine
422. Operate six thread over lock machine23. Operate feed of the arm machine24. Operate blind stitch machine25. Operate eyelet hole machine
READY MADE GARMENTS (JOB:SEWING MACHINE OPERATOR)
ANNEXURES
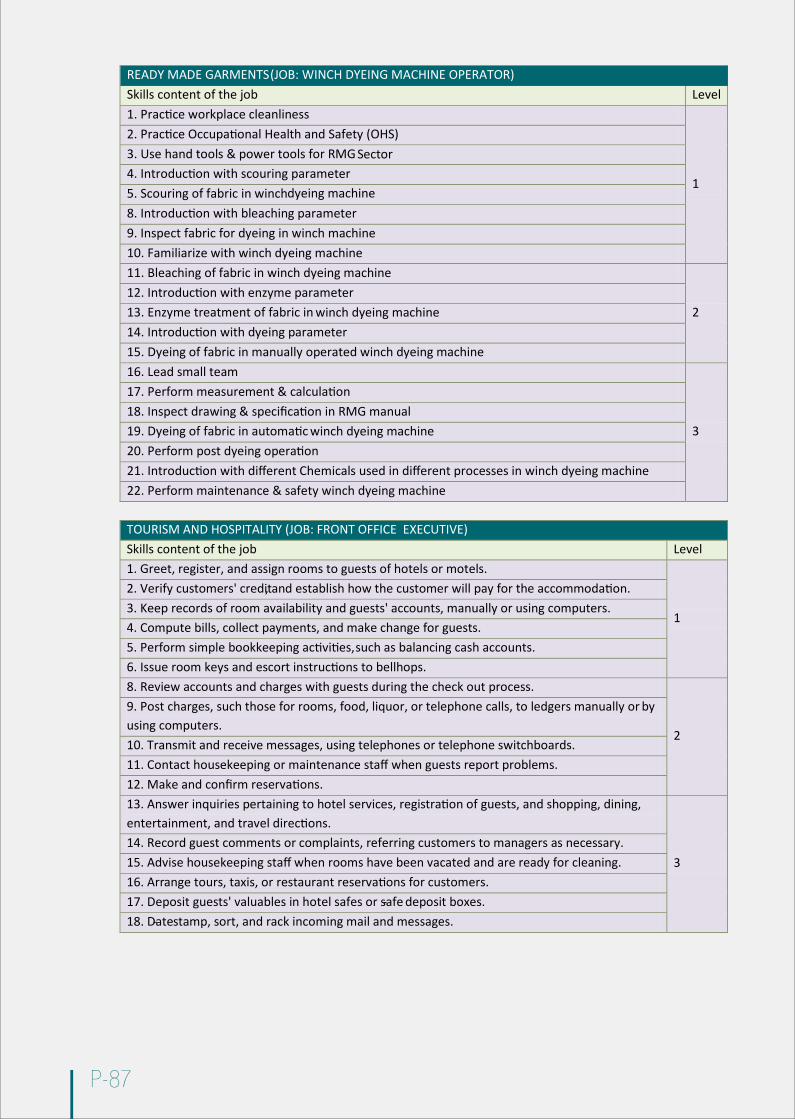
P-87
Skills content of the job Level1. Practice workplace cleanliness
1
2. Practice Occupational Health and Safety (OHS)3. Use hand tools & power tools for RMG Sector4. Introduction with scouring parameter5. Scouring of fabric in winch dyeing machine8. Introduction with bleaching parameter9. Inspect fabric for dyeing in winch machine10. Familiarize with winch dyeing machine11. Bleaching of fabric in winch dyeing machine
212. Introduction with enzyme parameter13. Enzyme treatment of fabric in winch dyeing machine14. Introduction with dyeing parameter15. Dyeing of fabric in manually operated winch dyeing machine16. Lead small team
3
17. Perform measurement & calculation18. Inspect drawing & specification in RMG manual19. Dyeing of fabric in automatic winch dyeing machine20. Perform post dyeing operation21. Introduction with different Chemicals used in different processes in winch dyeing machine22. Perform maintenance & safety winch dyeing machine
READY MADE GARMENTS(JOB: WINCH DYEING MACHINE OPERATOR)
Skills content of the job Level1. Greet, register, and assign rooms to guests of hotels or motels.
1
2. Verify customers' credit, and establish how the customer will pay for the accommodation.3. Keep records of room availability and guests' accounts, manually or using computers.4. Compute bills, collect payments, and make change for guests.5. Perform simple bookkeeping activities, such as balancing cash accounts.6. Issue room keys and escort instructions to bellhops.8. Review accounts and charges with guests during the check out process.
2
9. Post charges, such those for rooms, food, liquor, or telephone calls, to ledgers manually or by using computers.10. Transmit and receive messages, using telephones or telephone switchboards.11. Contact housekeeping or maintenance staff when guests report problems.12. Make and confirm reservations.13. Answer inquiries pertaining to hotel services, registration of guests, and shopping, dining, entertainment, and travel directions.
314. Record guest comments or complaints, referring customers to managers as necessary.15. Advise housekeeping staff when rooms have been vacated and are ready for cleaning.16. Arrange tours, taxis, or restaurant reservations for customers.17. Deposit guests' valuables in hotel safes or safe- deposit boxes.18. Date- stamp, sort, and rack incoming mail and messages.
TOURISM AND HOSPITALITY (JOB: FRONT OFFICE EXECUTIVE)
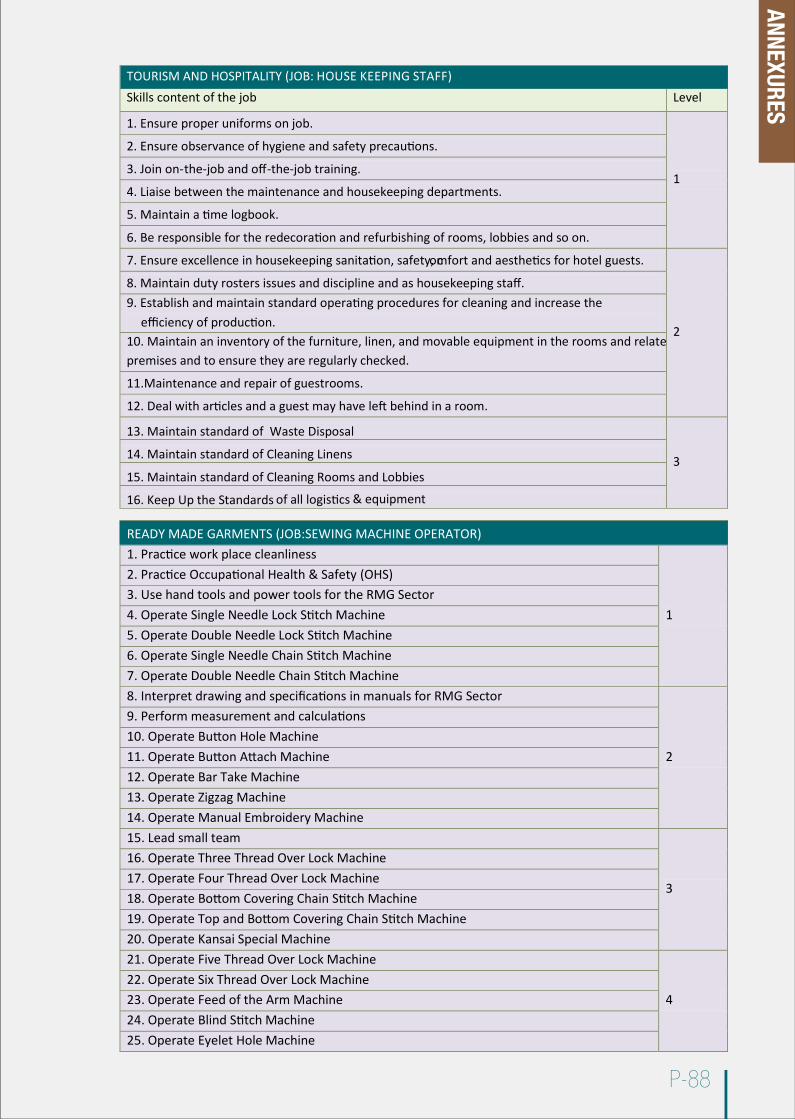
P-88
Skills content of the job Level
1. Ensure proper uniforms on job.
1
2. Ensure observance of hygiene and safety precautions.
3. Join on- the- job and off-the-job training.
4. Liaise between the maintenance and housekeeping departments.
5. Maintain a time logbook.
6. Be responsible for the redecoration and refurbishing of rooms, lobbies and so on.
7. Ensure excellence in housekeeping sanitation, safety, comfort and aesthetics for hotel guests.
2
8. Maintain duty rosters issues and discipline and as housekeeping staff.9. Establish and maintain standard operating procedures for cleaning and increase the
efficiency of production.10. Maintain an inventory of the furniture, linen, and movable equipment in the rooms and related premises and to ensure they are regularly checked.
11.Maintenance and repair of guestrooms.
12. Deal with articles and a guest may have left behind in a room.
13. Maintain standard of Waste Disposal
314. Maintain standard of Cleaning Linens
15. Maintain standard of Cleaning Rooms and Lobbies
16. Keep Up the Standards of all logistics & equipment
TOURISM AND HOSPITALITY (JOB: HOUSE KEEPING STAFF)
1. Practice work place cleanliness
1
2. Practice Occupational Health & Safety (OHS)3. Use hand tools and power tools for the RMG Sector4. Operate Single Needle Lock Stitch Machine5. Operate Double Needle Lock Stitch Machine6. Operate Single Needle Chain Stitch Machine7. Operate Double Needle Chain Stitch Machine8. Interpret drawing and specifications in manuals for RMG Sector
2
9. Perform measurement and calculations10. Operate Button Hole Machine11. Operate Button Attach Machine12. Operate Bar Take Machine13. Operate Zigzag Machine14. Operate Manual Embroidery Machine15. Lead small team
3
16. Operate Three Thread Over Lock Machine17. Operate Four Thread Over Lock Machine18. Operate Bottom Covering Chain Stitch Machine19. Operate Top and Bottom Covering Chain Stitch Machine20. Operate Kansai Special Machine21. Operate Five Thread Over Lock Machine
422. Operate Six Thread Over Lock Machine23. Operate Feed of the Arm Machine24. Operate Blind Stitch Machine25. Operate Eyelet Hole Machine
READY MADE GARMENTS (JOB:SEWING MACHINE OPERATOR)
ANNEXURES
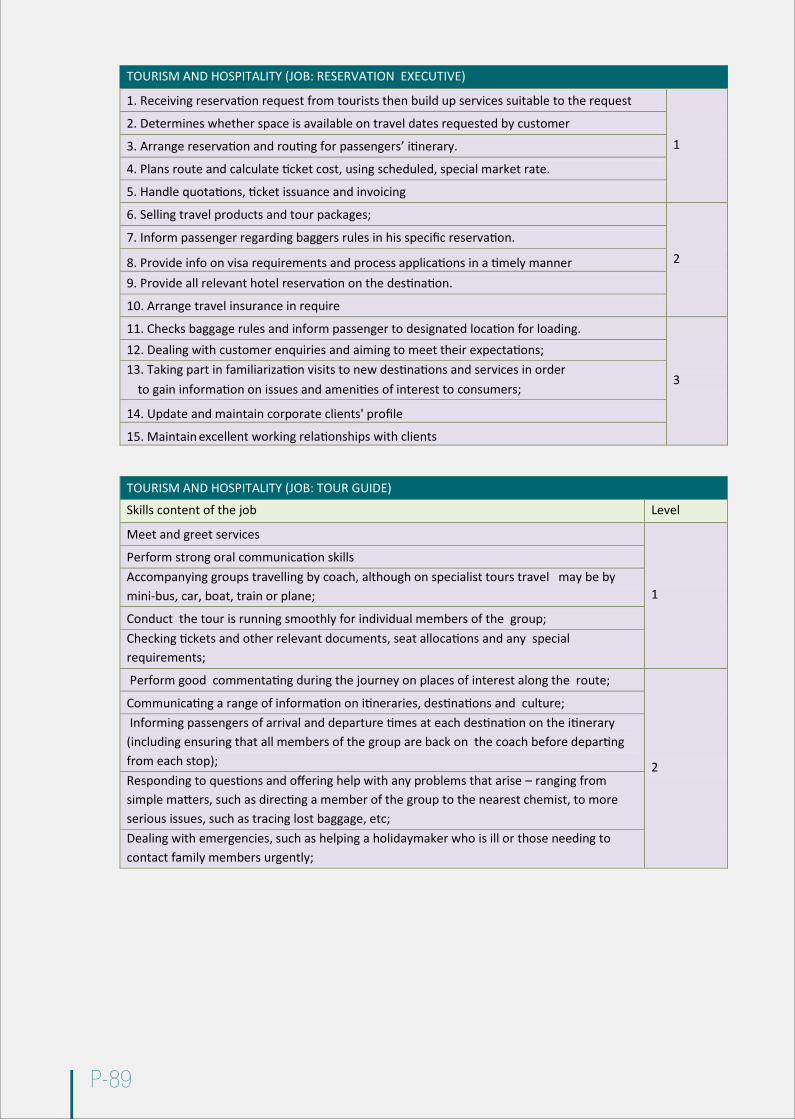
P-89
1. Receiving reservation request from tourists then build up services suitable to the request
12. Determines whether space is available on travel dates requested by customer
3. Arrange reservation and routing for passengers’ itinerary.
4. Plans route and calculate ticket cost, using scheduled, special market rate.
5. Handle quotations, ticket issuance and invoicing
6. Selling travel products and tour packages;
27. Inform passenger regarding baggers rules in his specific reservation.
8. Provide info on visa requirements and process applications in a timely manner9. Provide all relevant hotel reservation on the destination.
10. Arrange travel insurance in require
11. Checks baggage rules and inform passenger to designated location for loading.
3
12. Dealing with customer enquiries and aiming to meet their expectations;13. Taking part in familiarization visits to new destinations and services in order
to gain information on issues and amenities of interest to consumers;
14. Update and maintain corporate clients' profile
15. Maintain excellent working relationships with clients
TOURISM AND HOSPITALITY (JOB: RESERVATION EXECUTIVE)
Skills content of the job Level
Meet and greet services
1
Perform strong oral communication skillsAccompanying groups travelling by coach, although on specialist tours travel may be by mini-bus, car, boat, train or plane;
Conduct the tour is running smoothly for individual members of the group;Checking tickets and other relevant documents, seat allocations and any special requirements;
Perform good commentating during the journey on places of interest along the route;
2
Communicating a range of information on itineraries, destinations and culture;Informing passengers of arrival and departure times at each destination on the itinerary
(including ensuring that all members of the group are back on the coach before departing from each stop);Responding to questions and offering help with any problems that arise – ranging from simple matters, such as directing a member of the group to the nearest chemist, to more serious issues, such as tracing lost baggage, etc;Dealing with emergencies, such as helping a holidaymaker who is ill or those needing to contact family members urgently;
TOURISM AND HOSPITALITY (JOB: TOUR GUIDE)
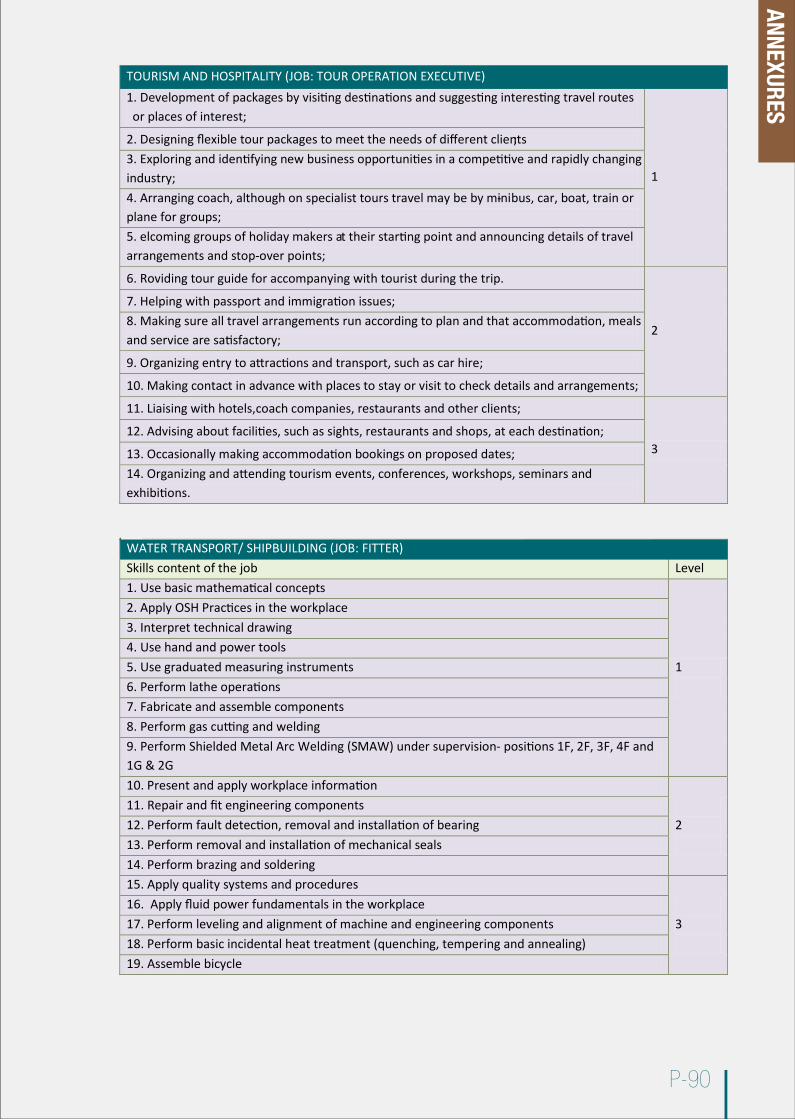
P-90
1. Development of packages by visiting destinations and suggesting interesting travel routes or places of interest;
1
2. Designing flexible tour packages to meet the needs of different clients;3. Exploring and identifying new business opportunities in a competitive and rapidly changing industry;4. Arranging coach, although on specialist tours travel may be by mini- bus, car, boat, train or plane for groups;5. elcoming groups of holiday makers at their starting point and announcing details of travel arrangements and stop-over points;
6. Roviding tour guide for accompanying with tourist during the trip.
2
7. Helping with passport and immigration issues;8. Making sure all travel arrangements run according to plan and that accommodation, meals and service are satisfactory;
9. Organizing entry to attractions and transport, such as car hire;
10. Making contact in advance with places to stay or visit to check details and arrangements;
11. Liaising with hotels,coach companies, restaurants and other clients;
312. Advising about facilities, such as sights, restaurants and shops, at each destination;
13. Occasionally making accommodation bookings on proposed dates;14. Organizing and attending tourism events, conferences, workshops, seminars and exhibitions.
TOURISM AND HOSPITALITY (JOB: TOUR OPERATION EXECUTIVE)
Skills content of the job Level1. Use basic mathematical concepts
1
2. Apply OSH Practices in the workplace3. Interpret technical drawing 4. Use hand and power tools5. Use graduated measuring instruments6. Perform lathe operations7. Fabricate and assemble components8. Perform gas cutting and welding9. Perform Shielded Metal Arc Welding (SMAW) under supervision- positions 1F, 2F, 3F, 4F and 1G & 2G10. Present and apply workplace information
211. Repair and fit engineering components12. Perform fault detection, removal and installation of bearing13. Perform removal and installation of mechanical seals14. Perform brazing and soldering 15. Apply quality systems and procedures
316. Apply fluid power fundamentals in the workplace17. Perform leveling and alignment of machine and engineering components18. Perform basic incidental heat treatment (quenching, tempering and annealing)19. Assemble bicycle
WATER TRANSPORT/ SHIPBUILDING (JOB: FITTER)
ANNEXURES
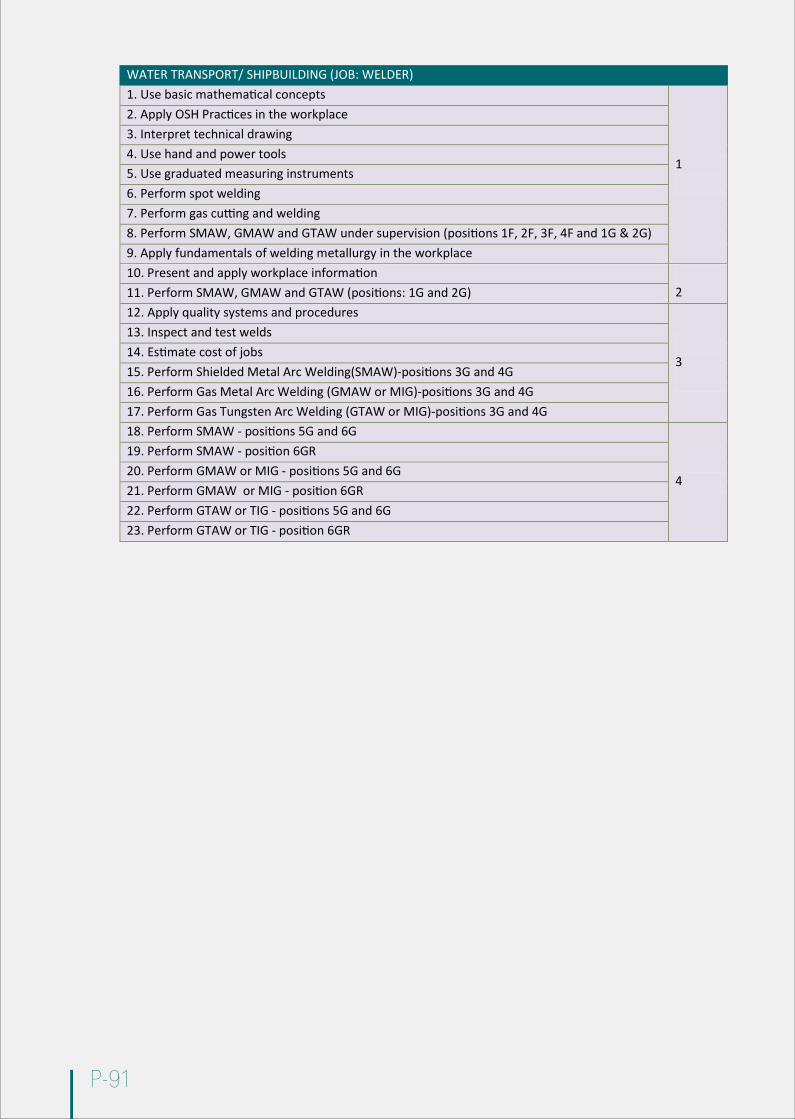
P-91
1. Use basic mathematical concepts
1
2. Apply OSH Practices in the workplace3. Interpret technical drawing 4. Use hand and power tools5. Use graduated measuring instruments6. Perform spot welding 7. Perform gas cutting and welding8. Perform SMAW, GMAW and GTAW under supervision (positions 1F, 2F, 3F, 4F and 1G & 2G)9. Apply fundamentals of welding metallurgy in the workplace10. Present and apply workplace information
211. Perform SMAW, GMAW and GTAW (positions: 1G and 2G)12. Apply quality systems and procedures
3
13. Inspect and test welds14. Estimate cost of jobs15. Perform Shielded Metal Arc Welding(SMAW)-positions 3G and 4G16. Perform Gas Metal Arc Welding (GMAW or MIG)-positions 3G and 4G17. Perform Gas Tungsten Arc Welding (GTAW or MIG)-positions 3G and 4G18. Perform SMAW - positions 5G and 6G
4
19. Perform SMAW - position 6GR20. Perform GMAW or MIG - positions 5G and 6G21. Perform GMAW or MIG - position 6GR22. Perform GTAW or TIG - positions 5G and 6G23. Perform GTAW or TIG - position 6GR
WATER TRANSPORT/ SHIPBUILDING (JOB: WELDER)
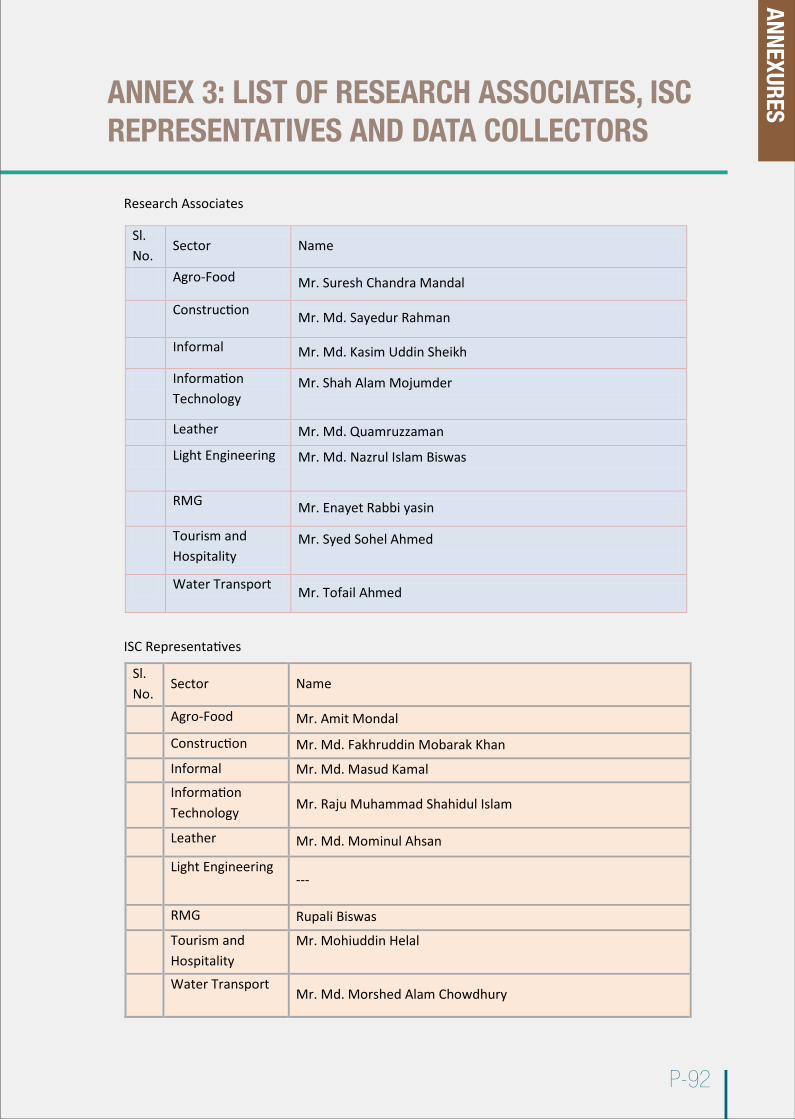
ANNEX 3: LIST OF RESEARCH ASSOCIATES, ISC REPRESENTATIVES AND DATA COLLECTORS
P-92
Research Associates
Sl. No.
Sector Name
Agro-Food Mr. Suresh Chandra Mandal
Construction Mr. Md. Sayedur Rahman
Informal Mr. Md. Kasim Uddin Sheikh
Information Technology
Mr. Shah Alam Mojumder
Leather Mr. Md. Quamruzzaman
Light Engineering Mr. Md. Nazrul Islam Biswas
RMG Mr. Enayet Rabbi yasin
Tourism and Hospitality
Mr. Syed Sohel Ahmed
Water Transport Mr. Tofail Ahmed
ISC Representatives
Sl. No.
Sector Name
Agro-Food Mr. Amit Mondal
Construction Mr. Md. Fakhruddin Mobarak Khan
Informal Mr. Md. Masud Kamal
Information Technology Mr. Raju Muhammad Shahidul Islam
Leather Mr. Md. Mominul Ahsan
Light Engineering---
RMG Rupali Biswas
Tourism and Hospitality
Mr. Mohiuddin Helal
Water TransportMr. Md. Morshed Alam Chowdhury
ANNEXURES
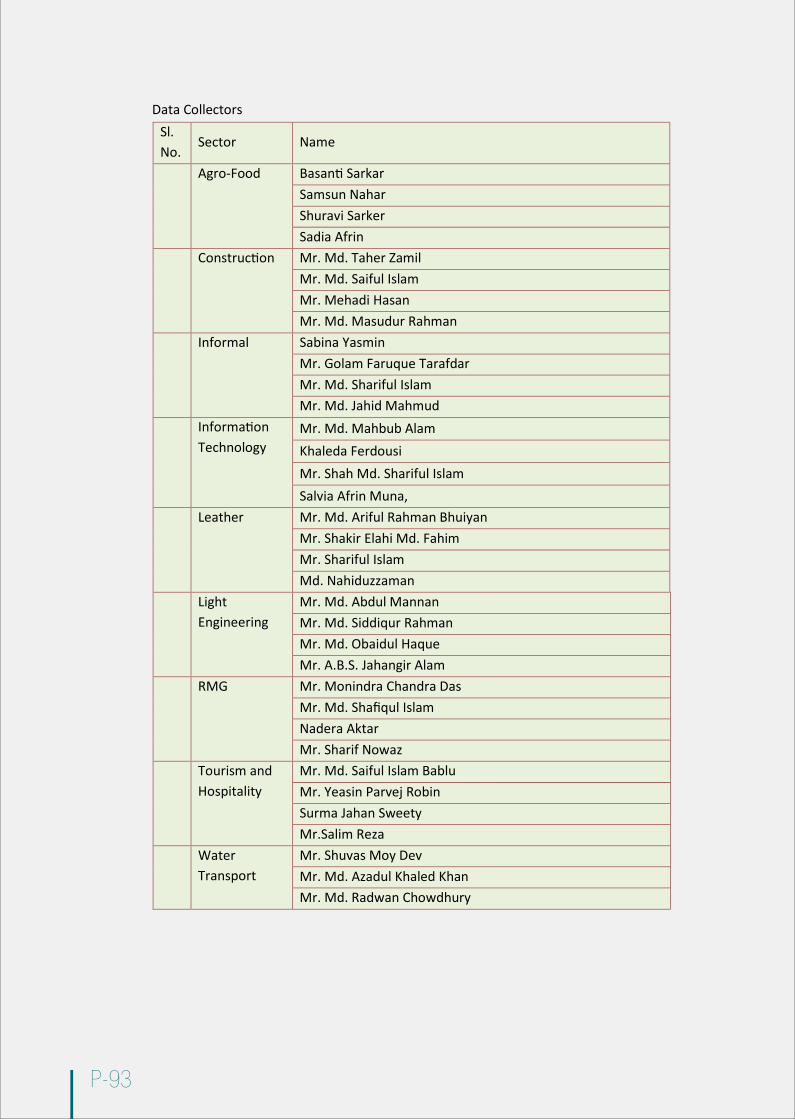
P-93
Data CollectorsSl. No.
Sector Name
Agro-Food Basanti Sarkar Samsun NaharShuravi SarkerSadia Afrin
Construction Mr. Md. Taher ZamilMr. Md. Saiful IslamMr. Mehadi HasanMr. Md. Masudur Rahman
Informal Sabina Yasmin Mr. Golam Faruque Tarafdar Mr. Md. Shariful Islam Mr. Md. Jahid Mahmud
Information Technology
Mr. Md. Mahbub AlamKhaleda FerdousiMr. Shah Md. Shariful Islam Salvia Afrin Muna,
Leather Mr. Md. Ariful Rahman Bhuiyan Mr. Shakir Elahi Md. Fahim Mr. Shariful Islam Md. Nahiduzzaman
Light Engineering
Mr. Md. Abdul MannanMr. Md. Siddiqur RahmanMr. Md. Obaidul HaqueMr. A.B.S. Jahangir Alam
RMG Mr. Monindra Chandra DasMr. Md. Shafiqul IslamNadera AktarMr. Sharif Nowaz
Tourism and Hospitality
Mr. Md. Saiful Islam BabluMr. Yeasin Parvej RobinSurma Jahan SweetyMr.Salim Reza
WaterTransport
Mr. Shuvas Moy DevMr. Md. Azadul Khaled KhanMr. Md. Radwan Chowdhury

ANNEX 4: QUESTIONNAIRE OF INDUSTRY DATA COLLECTION AND NTVQF LEVEL WITH DESCRIPTORS
P-94
Survey Questionnaire
TOP SHEET
Sector:__________________________________________________________________________
Industry/Organization: _____________________________________________________________
Job :Title
Responses received (Nos.)
a.b.c.d.e.f.
Total:
ISC representative Research Associate
Signature SignatureName: Name:Date: Date:
ANNEXURES

P-95
Survey Questionnaire
Industry/Organization: _____________________________________________________________
Part – I
A. General information:1. Date : Time:
2. Sector:
3. Survey code:
B. ISC Representative:1. Name:
2. National ID:
3. Address:
4. Cell/Phone: E-mail :
C. Research Associate:1. Name:
2. National ID:
3. Address:
4. Cell/Phone: E-mail :
D. Respondent:1. Name:
2. National ID:
3. Designation:
4. Cell/Phone:
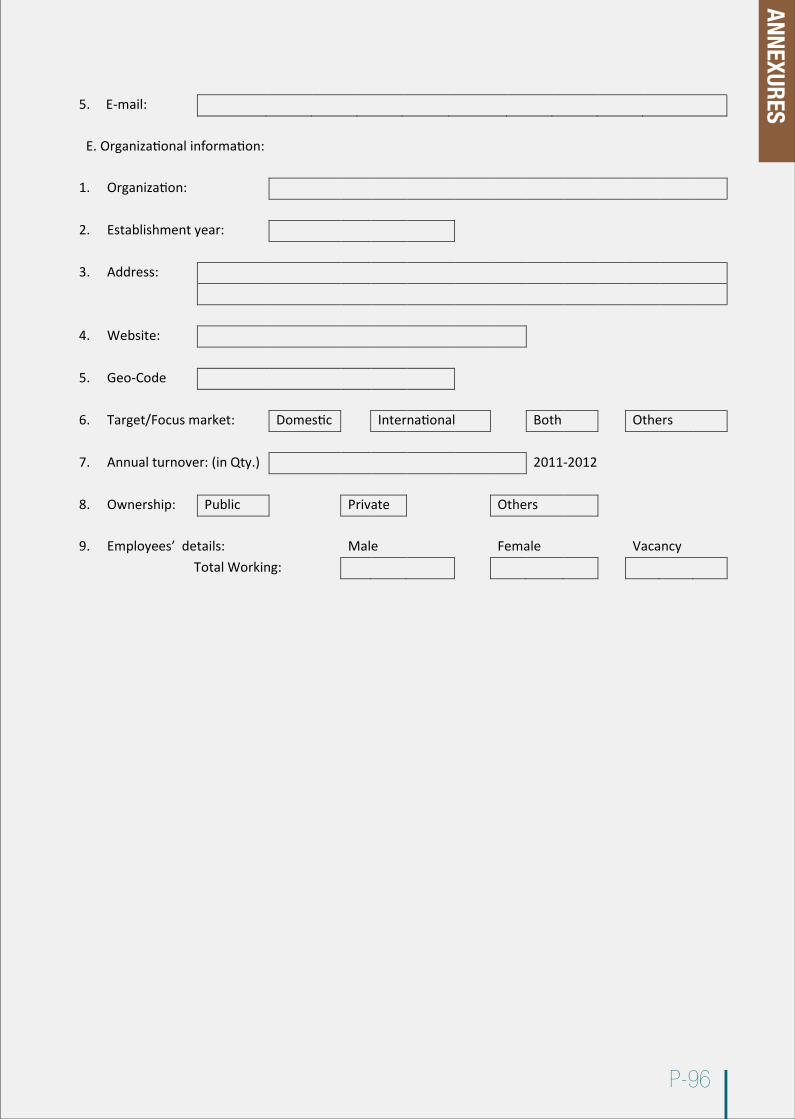
P-96
5. E-mail:
E. Organizational information:
1. Organization:
2. Establishment year:
3. Address:
4. Website:
5. Geo-Code
6. Target/Focus market: Domestic International Both Others
7. Annual turnover: (in Qty.) 2011-2012
8. Ownership: Public Private Others
9. Employees’ details: Male Female VacancyTotal Working:
ANNEXURES

P-97
Surv
ey Q
uesti
onna
ire
F. E
mpl
oyed
wor
kfor
ces’
deta
ils:
Sl.
#Jo
b Ti
tle20
1120
12De
man
dRe
mar
ksW
orki
ngVa
canc
yW
orki
ngVa
canc
y20
1320
1420
15M
ale
Fem
ale
Mal
eFe
mal
eM
ale
Fem
ale
Mal
eFe
mal
eM
ale
Fem
ale
Mal
eFe
mal
eM
ale
Fem
ale
1. 2. 3. 4. 5. 6. 7. 8. 9.
Tota
l:

P-98
SURVEY QUESTIONNAIRESector: __________________________________________________________________________
Industry: ________________________________________________________________________
Part – II
G. Employed workforce skill level:
1. Name :
2. Job title :
3. National ID :
4. Cell/Phone :
5. Date of birth :
6. E-mail (if any):
7. Address (permanent):
9. Highest-education :
10. Experience : Months/Years
11. Working in the present job : Months/Years
12. Training received:
Duration : Months/Years
Certificate obtained from:
13. Skill level acquired:
Below level 1 2 3 4 5
ANNEXURES

P-99
National Technical and Vocational Qualification Framework (NTVQF) levels
NTVQF Level
Education TypeCurrent Qualification Structure
Job ClassificationPre-Voc
Vocational Education
Technical Education
NTVQF 6
Diploma 4-year Diploma Supervisor/Mid level Manager/Sub-Assistant Engineer
NTVQF 5
**NSC-V NSS Master Highly-Skilled Worker/Supervisor
NTVQF 4
**NSC-IV NSS 1/HSC (Voc) Year 11/12
Skilled Worker
NTVQF 3
**NSC-III NSS 2/SSC (Voc) Year 10
Semi-Skilled Worker
NTVQF 2
**NSC-II NSS 3/SSC (Voc)Year 9
Basic Skilled Worker
NTVQF 1
**NSC-I NSS Basic/ Basic Trade Course
Basic Worker
Pre-Voc 2
*NPVC-II None Pre-Vocational Trainee
Pre-Voc 1
*NPVC-I None Pre-Vocational Trainee
*NPVC – National Pre-Vocational Certificate**NSC – National Skill Certificate
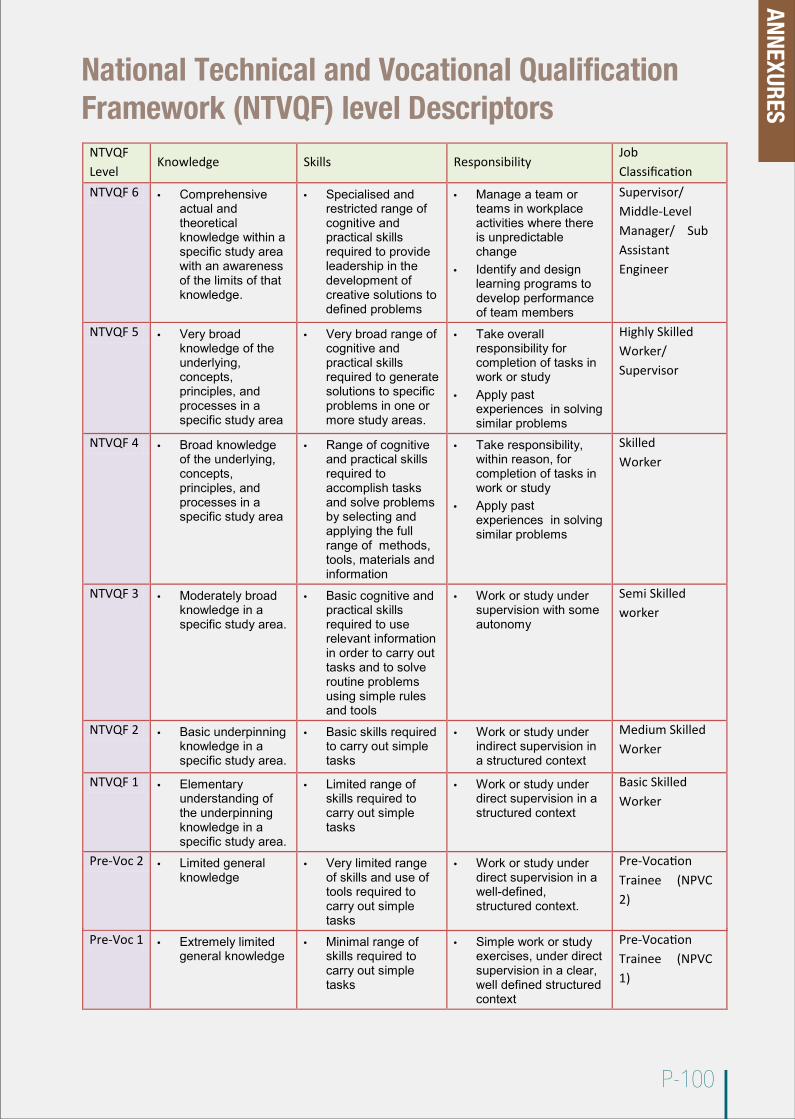
P-100
National Technical and Vocational QualificationFramework (NTVQF) level Descriptors
NTVQF Level
Knowledge Skills ResponsibilityJobClassification
NTVQF 6 • Comprehensive actual and theoretical knowledge within a specific study area with an awareness of the limits of that knowledge.
• Specialised and restricted range of cognitive and practical skills required to provide leadership in the development of creative solutions to defined problems
• Manage a team or teams in workplace activities where there is unpredictable change
• Identify and design learning programs to develop performance of team members
Supervisor/ Middle-Level Manager/ Sub Assistant Engineer
NTVQF 5 • Very broad knowledge of the underlying, concepts, principles, and processes in a specific study area
• Very broad range of cognitive and practical skills required to generate solutions to specific problems in one or more study areas.
• Take overall responsibility for completion of tasks in work or study
• Apply past experiences in solving similar problems
Highly Skilled Worker/ Supervisor
NTVQF 4 • Broad knowledge of the underlying, concepts, principles, and processes in a specific study area
• Range of cognitive and practical skills required to accomplish tasks and solve problems by selecting and applying the full range of methods, tools, materials and information
• Take responsibility, within reason, for completion of tasks in work or study
• Apply past experiences in solving similar problems
SkilledWorker
NTVQF 3 • Moderately broad knowledge in a specific study area.
• Basic cognitive and practical skills required to use relevant information in order to carry out tasks and to solve routine problems using simple rules and tools
• Work or study under supervision with some autonomy
Semi Skilledworker
NTVQF 2 • Basic underpinning knowledge in a specific study area.
• Basic skills required to carry out simple tasks
• Work or study under indirect supervision in a structured context
Medium Skilled Worker
NTVQF 1 • Elementary understanding of the underpinning knowledge in a specific study area.
• Limited range of skills required to carry out simple tasks
• Work or study under direct supervision in a structured context
Basic Skilled Worker
Pre-Voc 2 • Limited general knowledge
• Very limited range of skills and use of tools required to carry out simple tasks
• Work or study under direct supervision in a well-defined, structured context.
Pre-Vocation Trainee (NPVC 2)
Pre-Voc 1 • Extremely limited general knowledge
• Minimal range of skills required to carry out simple tasks
• Simple work or study exercises, under direct supervision in a clear, well defined structured context
Pre-Vocation Trainee (NPVC 1)
ANNEXURES
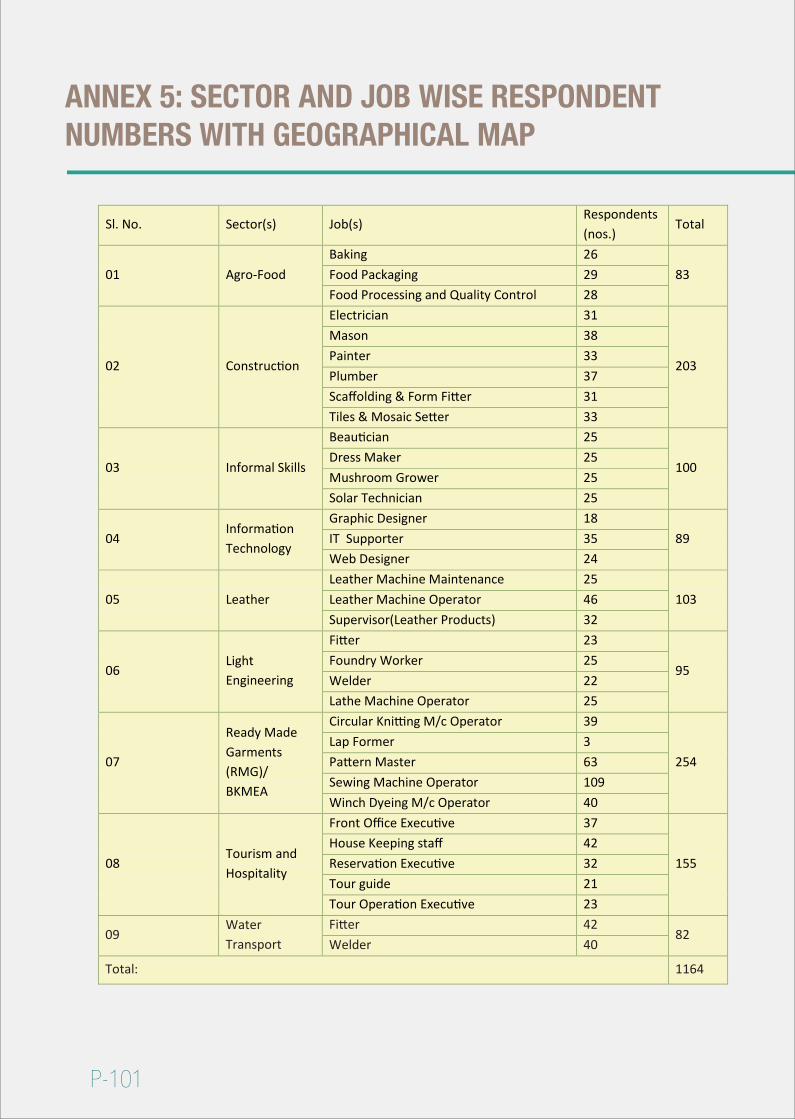
P-101
ANNEX 5: SECTOR AND JOB WISE RESPONDENTNUMBERS WITH GEOGRAPHICAL MAP
Sl. No. Sector(s) Job(s)Respondents(nos.)
Total
01 Agro-FoodBaking 26
83Food Packaging 29Food Processing and Quality Control 28
02 Construction
Electrician 31
203
Mason 38Painter 33Plumber 37Scaffolding & Form Fitter 31Tiles & Mosaic Setter 33
03 Informal Skills
Beautician 25
100Dress Maker 25Mushroom Grower 25Solar Technician 25
04Information Technology
Graphic Designer 1889IT Supporter 35
Web Designer 24
05 Leather Leather Machine Maintenance 25
103Leather Machine Operator 46Supervisor(Leather Products) 32
06Light Engineering
Fitter 23
95Foundry Worker 25Welder 22Lathe Machine Operator 25
07
Ready Made Garments (RMG)/BKMEA
Circular Knitting M/c Operator 39
254Lap Former 3Pattern Master 63Sewing Machine Operator 109Winch Dyeing M/c Operator 40
08Tourism and Hospitality
Front Office Executive 37
155House Keeping staff 42Reservation Executive 32Tour guide 21Tour Operation Executive 23
09Water Transport
Fitter 4282
Welder 40
Total: 1164
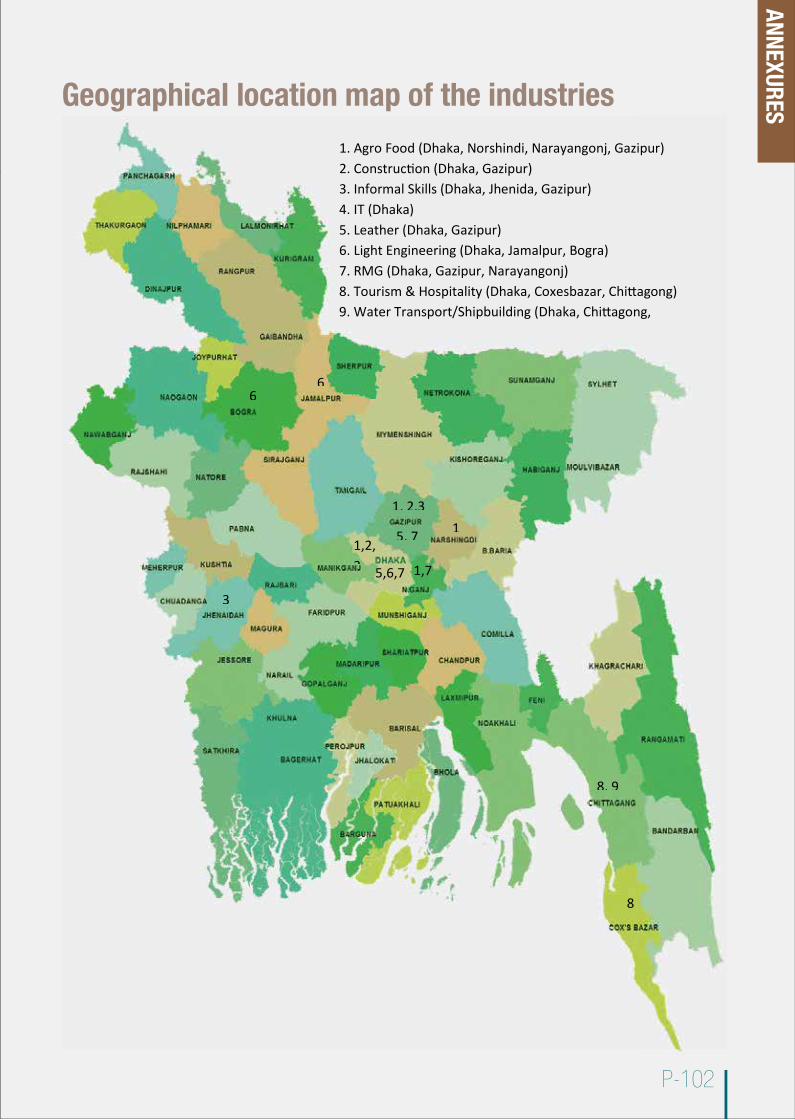
P-102
3
5,6,7,
8,9
11, 2,3
5, 7
66
8, 9
8
1,7, 9
1. Agro Food (Dhaka, Norshindi, Narayangonj, Gazipur)2. Construction (Dhaka, Gazipur)3. Informal Skills (Dhaka, Jhenida, Gazipur)4. IT (Dhaka)5. Leather (Dhaka, Gazipur)6. Light Engineering (Dhaka, Jamalpur, Bogra)7. RMG (Dhaka, Gazipur, Narayangonj)8. Tourism & Hospitality (Dhaka, Coxesbazar, Chittagong)9. Water Transport/Shipbuilding (Dhaka, Chittagong,
Narayangonj)
1,2,3,4
Geographical location map of the industries
ANNEXURES
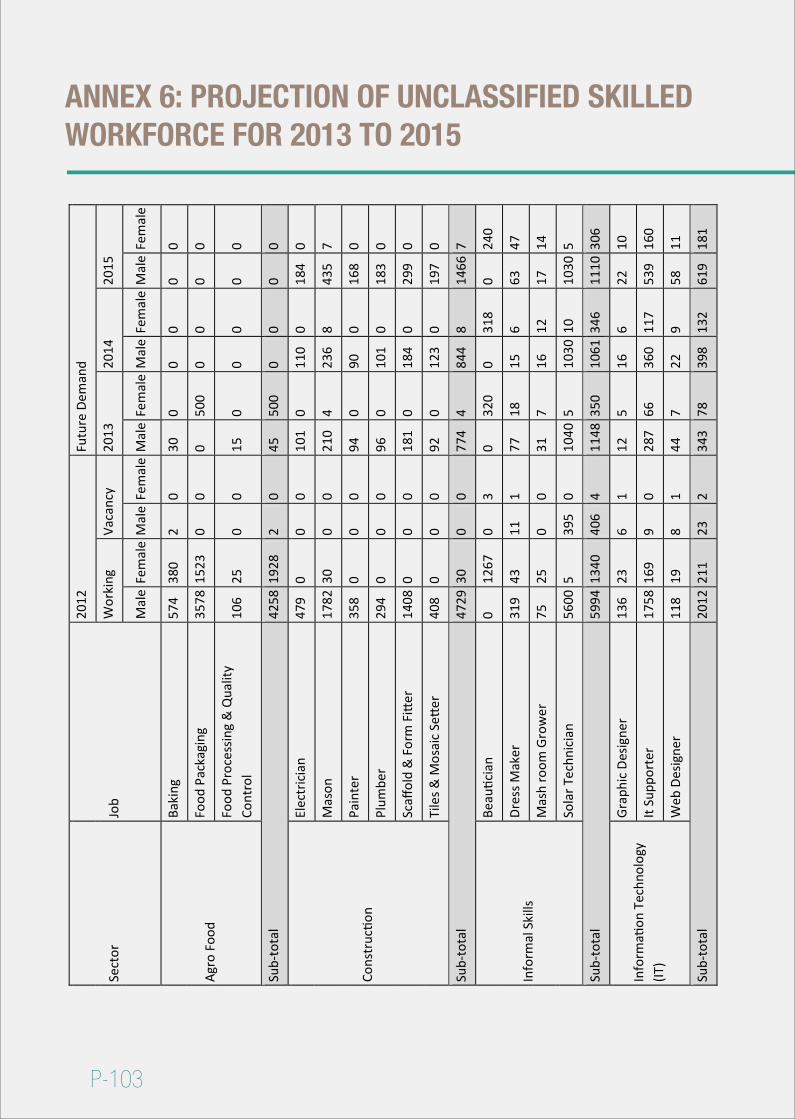
P-103
ANNEX 6: PROJECTION OF UNCLASSIFIED SKILLEDWORKFORCE FOR 2013 TO 2015
Sect
orJo
b
2012
Futu
re D
eman
d
Wor
king
Vaca
ncy
2013
2014
2015
Mal
eFe
mal
eM
ale
Fem
ale
Mal
eFe
mal
eM
ale
Fem
ale
Mal
eFe
mal
e
Agro
Foo
d
Baki
ng57
438
02
030
00
00
0
Food
Pac
kagi
ng35
7815
230
00
500
00
00
Food
Pro
cess
ing
& Q
ualit
y Co
ntro
l10
625
00
150
00
00
Sub-
tota
l 42
5819
282
045
500
00
00
Cons
truc
tion
Elec
tric
ian
479
00
010
10
110
018
40
Mas
on17
8230
00
210
423
68
435
7
Pain
ter
358
00
094
090
016
80
Plum
ber
294
00
096
010
10
183
0
Scaff
old
& F
orm
Fitt
er14
080
00
181
018
40
299
0
Tile
s & M
osai
c Se
tter
408
00
092
012
30
197
0
Sub-
tota
l 47
2930
00
774
484
48
1466
7
Info
rmal
Ski
lls
Beau
ticia
n0
1267
03
032
00
318
024
0
Dres
s Mak
er31
943
111
7718
156
6347
Mas
h ro
om G
row
er75
250
031
716
1217
14
Sola
r Tec
hnic
ian
5600
539
50
1040
510
3010
1030
5
Sub-
tota
l 59
9413
4040
64
1148
350
1061
346
1110
306
Info
rmati
on T
echn
olog
y (IT
)
Gra
phic
Desig
ner
136
236
112
516
622
10
It Su
ppor
ter
1758
169
90
287
6636
011
753
916
0
Web
Des
igne
r11
819
81
447
229
5811
Sub-
tota
l 20
1221
123
234
378
398
132
619
181
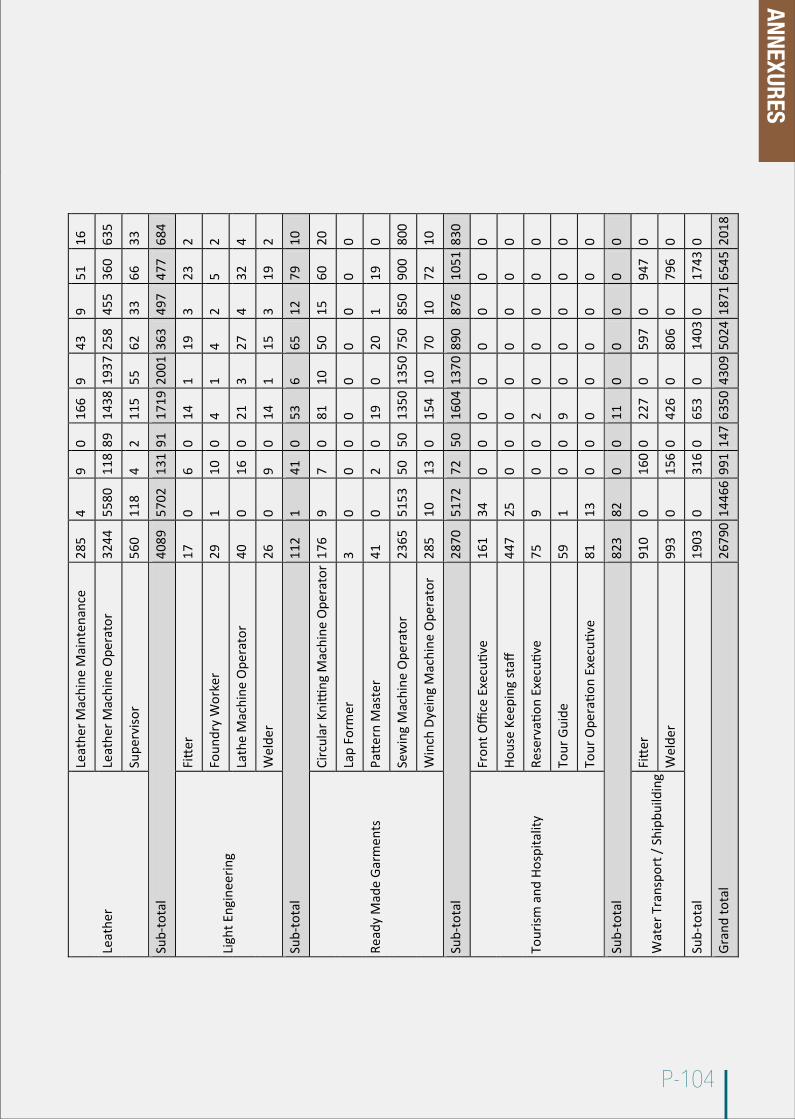
P-104
Leat
her
Leat
her M
achi
ne M
aint
enan
ce28
54
90
166
943
951
16
Leat
her M
achi
ne O
pera
tor
3244
5580
118
8914
3819
3725
845
536
063
5
Supe
rviso
r56
011
84
211
555
6233
6633
Sub-
tota
l 40
8957
0213
191
1719
2001
363
497
477
684
Ligh
t Eng
inee
ring
Fitt
er17
06
014
119
323
2
Foun
dry
Wor
ker
291
100
41
42
52
Lath
e M
achi
ne O
pera
tor
400
160
213
274
324
Wel
der
260
90
141
153
192
Sub-
tota
l 11
21
410
536
6512
7910
Read
y M
ade
Gar
men
ts
Circ
ular
Kni
tting
Mac
hine
Ope
rato
r17
69
70
8110
5015
6020
Lap
Form
er3
00
00
00
00
0
Patt
ern
Mas
ter
410
20
190
201
190
Sew
ing
Mac
hine
Ope
rato
r23
6551
5350
5013
5013
5075
085
090
080
0
Win
ch D
yein
g M
achi
ne O
pera
tor
285
1013
015
410
7010
7210
Sub-
tota
l 28
7051
7272
5016
0413
7089
087
610
5183
0
Tour
ism a
nd H
ospi
talit
y
Fron
t Offi
ce E
xecu
tive
161
340
00
00
00
0
Hous
e Ke
epin
g st
aff44
725
00
00
00
00
Rese
rvati
on E
xecu
tive
759
00
20
00
00
Tour
Gui
de59
10
09
00
00
0
Tour
Ope
ratio
n Ex
ecuti
ve81
130
00
00
00
0
Sub-
tota
l 82
382
00
110
00
00
Wat
er T
rans
port
/ Sh
ipbu
ildin
gFi
tter
910
016
00
227
059
70
947
0
Wel
der
993
015
60
426
080
60
796
0
Sub-
tota
l 19
030
316
065
30
1403
017
430
Gra
nd to
tal
2679
014
466
991
147
6350
4309
5024
1871
6545
2018
ANNEXURES
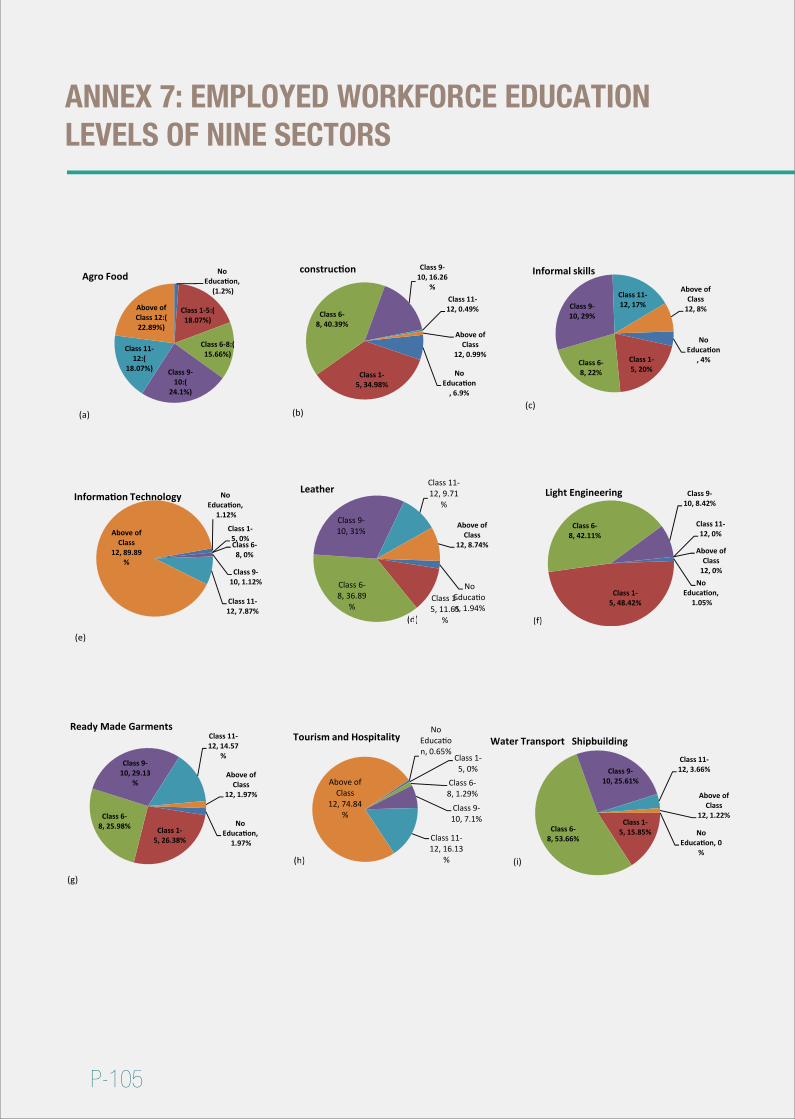
P-105
ANNEX 7: EMPLOYED WORKFORCE EDUCATION LEVELS OF NINE SECTORS
(d)
(a)
No Education,
(1.2%)
Class 1-5:( 18.07%)
Class 6-8:( 15.66%)
Class 9-10:(
24.1%)
Class 11-12:(
18.07%)
Above of Class 12:( 22.89%)
Agro Food
(b)
No Education
, 6.9%
Class 1-5, 34.98%
Class 6-8, 40.39%
Class 9-10, 16.26
%Class 11-12, 0.49%
Above of Class
12, 0.99%
construction
(c)
No Education
, 4%Class 1-5, 20%
Class 6-8, 22%
Class 9-10, 29%
Class 11-12, 17%
Above of Class
12, 8%
Informal skills
No Education,
1.12%
Class 1-5, 0%Class 6-8, 0%
Class 9-10, 1.12%
Class 11-12, 7.87%
Above of Class
12, 89.89%
Information Technology
(e)
(d)
No Education, 1.94%
Class 1-5, 11.65
%
Class 6-8, 36.89
%
Class 9-10, 31%
Class 11-12, 9.71
%
Above of Class
12, 8.74%
Leather
(f)(f)
No Education,
1.05%Class 1-
5, 48.42%
Class 6-8, 42.11%
Class 9-10, 8.42%
Class 11-12, 0%
Above of Class
12, 0%
Light Engineering
(g)
No Education,
1.97%
Class 1-5, 26.38%
Class 6-8, 25.98%
Class 9-10, 29.13
%
Class 11-12, 14.57
%
Above of Class
12, 1.97%
Ready Made Garments
(h)(h)
No Education, 0.65%
Class 1-5, 0%
Class 6-8, 1.29%
Class 9-10, 7.1%
Class 11-12, 16.13
%
Above of Class
12, 74.84%
Tourism and Hospitality
No Education, 0
%
Class 1-5, 15.85%Class 6-
8, 53.66%
Class 9-10, 25.61%
Class 11-12, 3.66%
Above of Class
12, 1.22%
Water Transport Shipbuilding
(i)
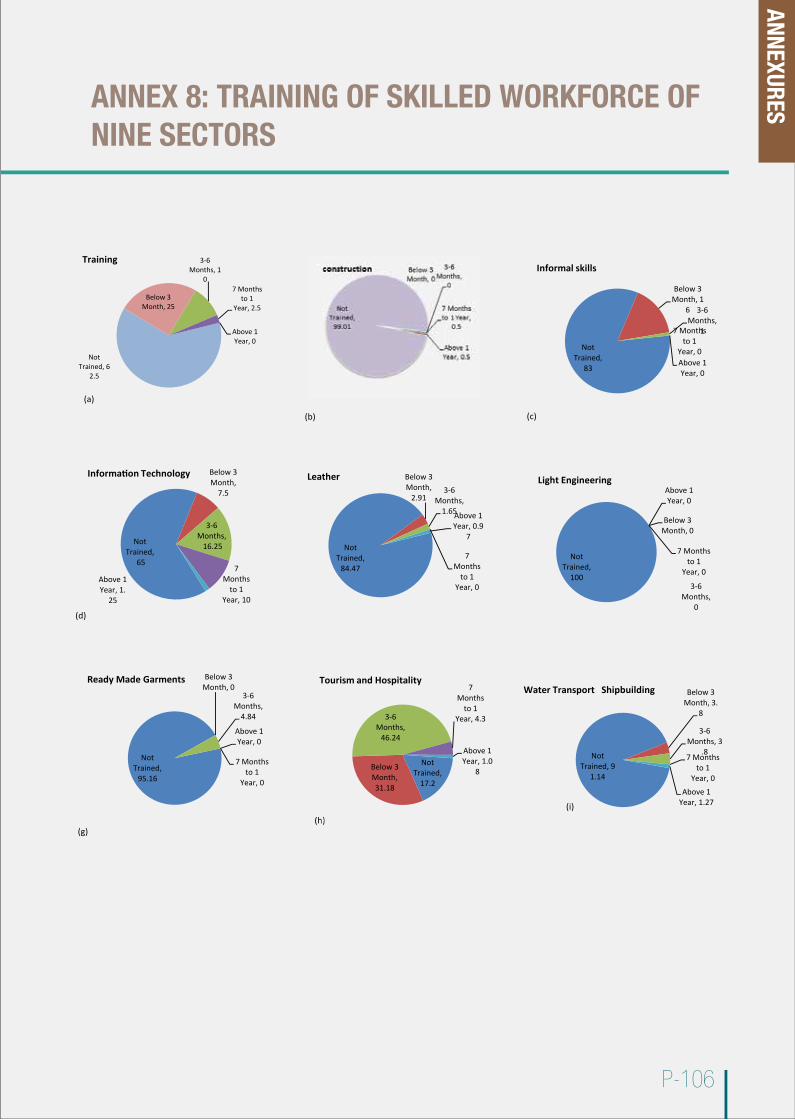
P-106
ANNEX 8: TRAINING OF SKILLED WORKFORCE OFNINE SECTORS
(a)
(b)
Not Trained, 6
2.5
Below 3 Month, 25
3-6 Months, 1
07 Months
to 1 Year, 2.5
Above 1 Year, 0
Training
(c)
Not Trained,
83
Below 3 Month, 1
6 3-6 Months,
17 Months to 1
Year, 0Above 1 Year, 0
Informal skills
(d)
Not Trained,
65
Below 3 Month,
7.5
3-6 Months,
16.25
7 Months
to 1 Year, 10
Above 1 Year, 1.
25
Information Technology
Not Trained,
84.47
Below 3 Month,
2.913-6
Months, 1.65
7 Months
to 1 Year, 0
Above 1 Year, 0.9
7
Leather
Not Trained,
100
Below 3 Month, 0
3-6 Months,
0
7 Months to 1
Year, 0
Above 1 Year, 0
Light Engineering
(g)
Not Trained,
95.16
Below 3 Month, 0
3-6 Months,
4.84
7 Months to 1
Year, 0
Above 1 Year, 0
Ready Made Garments
(h)(h)
Not Trained,
17.2
Below 3 Month, 31.18
3-6 Months,
46.24
7 Months
to 1 Year, 4.3
Above 1 Year, 1.0
8
Tourism and Hospitality
(i)
Not Trained, 9
1.14
Below 3 Month, 3.
8
3-6 Months, 3
.87 Months
to 1 Year, 0
Above 1 Year, 1.27
Water Transport Shipbuilding
ANNEXURES
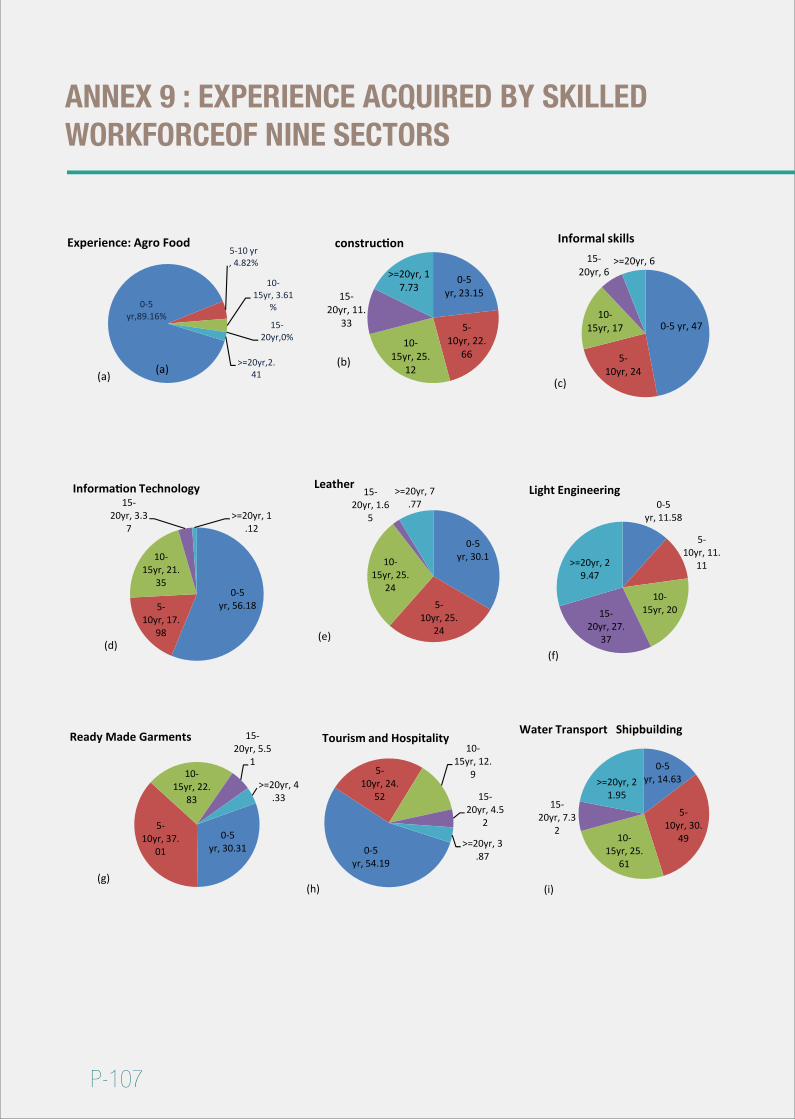
P-107
ANNEX 9 : EXPERIENCE ACQUIRED BY SKILLED WORKFORCEOF NINE SECTORS
(c)
0-5 yr, 47
5-10yr, 24
10-15yr, 17
15-20yr, 6
>=20yr, 6
Informal skills
(e)
0-5 yr, 30.1
5-10yr, 25.
24
10-15yr, 25.
24
15-20yr, 1.6
5
>=20yr, 7.77
Leather
(f)
0-5 yr, 11.58
5-10yr, 11.
11
10-15yr, 2015-
20yr, 27.37
>=20yr, 29.47
Light Engineering
0-5 yr,89.16%
5-10 yr , 4.82%
10-15yr, 3.61
%
15-20yr,0%
>=20yr,2.41
Experience: Agro Food
(a)(a)
0-5 yr, 23.15
5-10yr, 22.
6610-
15yr, 25.12
15-20yr, 11.
33
>=20yr, 17.73
construction
(b)
0-5 yr, 56.185-
10yr, 17.98
10-15yr, 21.
35
15-20yr, 3.3
7>=20yr, 1
.12
Information Technology
(d)
(g)
0-5 yr, 30.31
5-10yr, 37.
01
10-15yr, 22.
83
15-20yr, 5.5
1
>=20yr, 4.33
Ready Made Garments
(h)
0-5 yr, 54.19
5-10yr, 24.
52
10-15yr, 12.
9
15-20yr, 4.5
2
>=20yr, 3.87
Tourism and HospitalityWater Transport Shipbuilding
(i)
0-5 yr, 14.63
5-10yr, 30.
4910-15yr, 25.
61
15-20yr, 7.3
2
>=20yr, 21.95
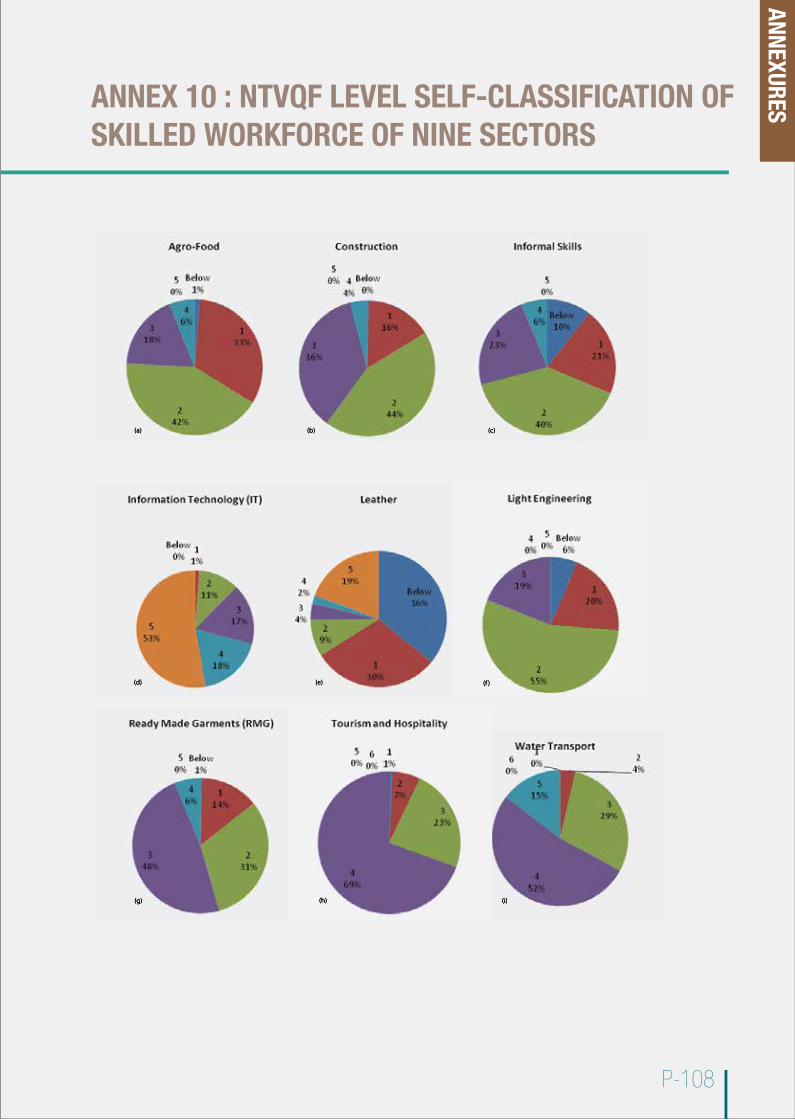
P-108
ANNEX 10 : NTVQF LEVEL SELF-CLASSIFICATION OFSKILLED WORKFORCE OF NINE SECTORS
(a)
(d)
(g) (h) (i)
(e) (f )
(b) (c)
ANNEXURES
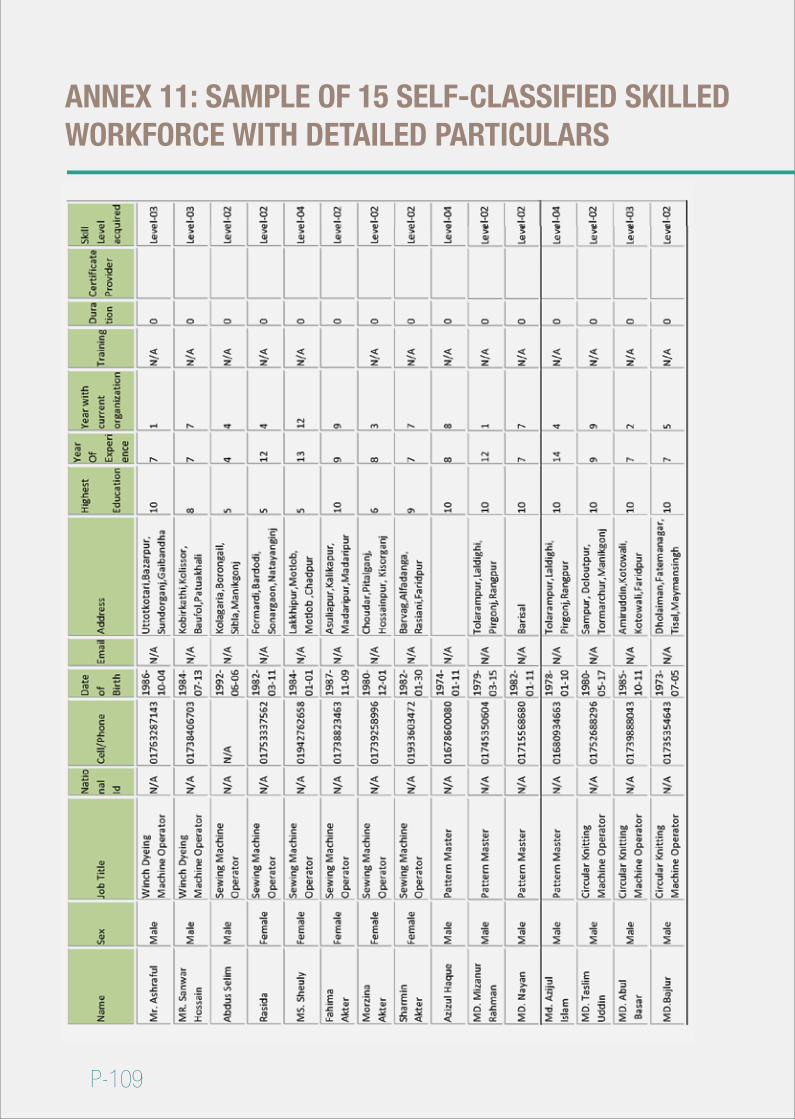
P-109
ANNEX 11: SAMPLE OF 15 SELF-CLASSIFIED SKILLEDWORKFORCE WITH DETAILED PARTICULARS

P-110
ANNEX 12: QUESTIONNAIRE FOR NON-FORMAL PROVIDERS DATA COLLECTION
Non Formal Training Institute/ Organization Survey Format[Please tick marks (√ ) as appropriate]
Institute / Organization: ______________________________________________________________
Address: _______________________________________________________________________
_______________________________________________________________________
Geo code: _______________________________________________________________________
Web site & E-mail: _________________________________________________________________
Phone / cell no.: _________________________________________________________________
Establishment year: _________________________________________________________________
Type of Institute / Organization: a) Public: i) Department: ………………………… ii) Ministry: …………………………
Respondent: Name: ……………………………………………
b) Private: i) Self financed
ii) Supported by: Government Donor Other (Specify)……….…..
c) NGO: i) Self financed
ii) Supported by: Government Donor Other (Specify)……….…..
d) Industry: i) Self financed
ii) Supported by: Government Donor Other (Specify)……….…..
e)Joint venture: Partnership:
ANNEXURES
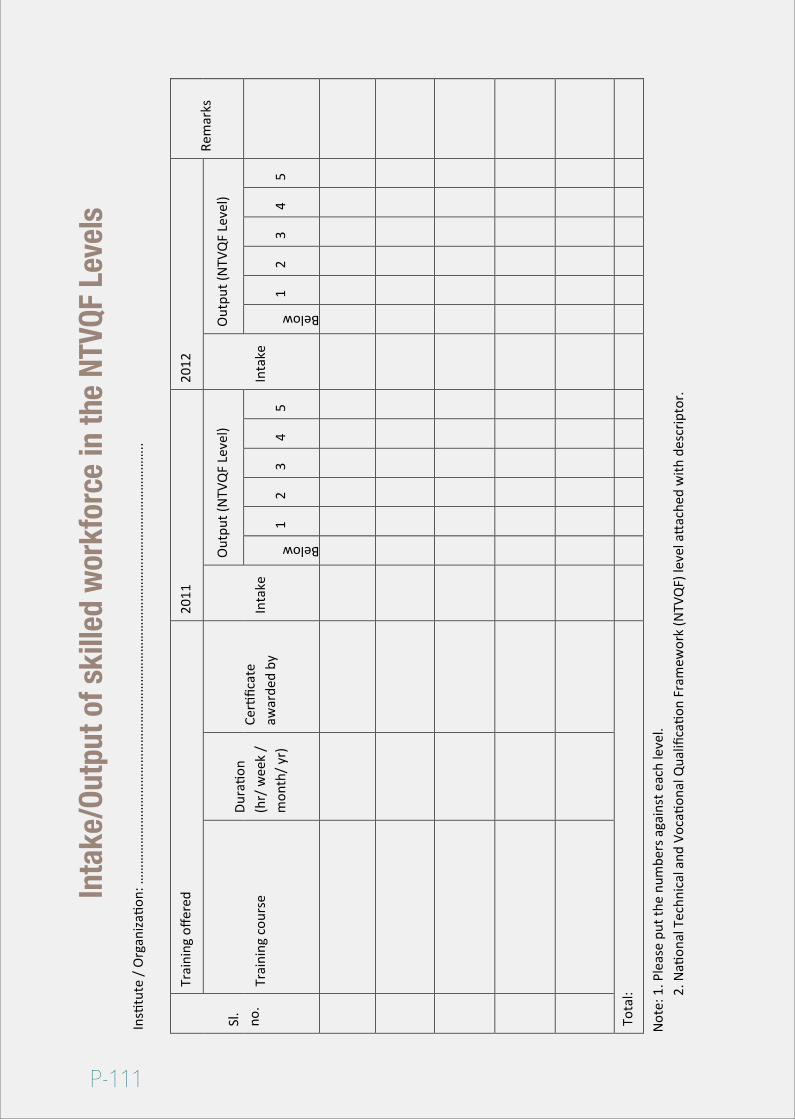
P-111
Inta
ke/O
utpu
t of s
kille
d w
orkf
orce
in th
e NT
VQF
Leve
lsIn
stitu
te /
Org
aniza
tion:
……
……
……
……
……
……
……
……
……
……
……
……
……
……
……
……
……
……
……
……
……
…..
Sl.
no.
Trai
ning
offe
red
2011
2012
Rem
arks
Trai
ning
cou
rse
Dura
tion
(hr/
wee
k /
mon
th/ y
r)
Certi
ficat
e aw
arde
d by
Inta
ke
Out
put (
NTV
QF
Leve
l)
Inta
ke
Out
put (
NTV
QF
Leve
l)
Below
12
34
5
Below
12
34
5
Tota
l:
Not
e: 1
. Ple
ase
put t
he n
umbe
rs a
gain
stea
ch le
vel.
2. N
ation
al T
echn
ical
and
Voc
ation
al Q
ualifi
catio
n Fr
amew
ork
(NTV
QF)
leve
l att
ache
d w
ith d
escr
ipto
r.
P-112
Natio
nal S
kills
Sur
vey
(NSS
), Ph
ase-
1, 2
012
Inta
ke/O
utpu
t of s
kille
d w
orkf
orce
in th
e NT
VQF
Leve
lsIn
stitu
te /
Org
aniza
tion:
……
……
……
……
……
……
……
……
……
……
……
……
……
……
……
……
……
……
……
……
……
…..
Sl.
no.
Trai
ning
offe
red
Futu
re p
lan/
proj
ectio
n of
new
trai
ning
cou
rses
Remarks
Trai
ning
co
urse
Dura
tion
(hr/
w
eek/
m
onth
/ yr
)
Certi
ficat
e aw
arde
d by
2013
2014
2015
Inta
ke
Out
put (
NTV
QF
Leve
l)In
tak
e
Out
put (
NTV
QF
Leve
l)In
tak
e
Out
put (
NTV
QF
Leve
l)
Below
12
34
5
Below
12
34
5
Below
12
34
5
Tota
l:
Not
e: 1
. Ple
ase
put t
he n
umbe
rs a
gain
stea
ch le
vel.
2. N
ation
al T
echn
ical
and
Voc
ation
al Q
ualifi
catio
n Fr
amew
ork
(NTV
QF)
leve
l att
ache
d w
ith d
escr
ipto
r.
ANNEXURES

P-113
Teac
hers
and
Man
agem
ent S
taff
Insti
tute
/ O
rgan
izatio
n:…
……
……
……
……
……
……
……
……
……
……
……
……
……
……
……
……
……
……
……
……
……
..
Sl.
no.
Nam
e an
d de
signa
tion
of
Teac
hers
and
M
anag
emen
t St
aff
Nati
onal
ID
nu
mbe
r
Back
grou
ndTy
pe o
f Sta
ff
Rem
arks
High
est
Qua
lifica
tion
Trai
ning
w
ith
dura
tion
Expe
rienc
e (y
ear)
Regu
lar
Tem
pora
ryPa
rt-ti
me
Oth
ers
(spe
cify
)M
ale
Fem
ale
Mal
eFe
mal
eM
ale
Fem
ale
Mal
eFe
mal
e

P-114
ANNEX 13: SURVEY AND ASSESSMENT TEAM
The Survey Team consisting of the following seven members was entrusted with the responsibility as enunciated in the TOR for planning and conducting the National Skill Survey and for the preparation of the survey report.
Mr. Abdur Rafique NPC, TVET Reform Project, ILO, Dhaka
Team Leader
Mr. Hari Pada DasProgramme Officer, ILO, Dhaka
Member
Mr. Kabir MiaProgramme Officer,Component-1,ILO, [email protected]
Member
Mr. Md. QuamruzzamanDeputy Director, NSDC Secretariat
Member
Mr. Md. Sayedur RahmanAttached Officer,DTE
Member
Mrs. Khaleda FerdousiAttached Officer, DTE
Member
Mr. S. M. ShahjahanDeputy Inspector, BTEB
Member
The Quantitative Assessment of Skill Demand and Skill Gap was authored by
Dr Rushidan Islam RahmanResearch DirectorBangladesh Institute of Development Studies (BIDS)
ANNEXURES

BANGLADESH SKILLS SNAPSHOT 2012