Embed Size (px)
Citation preview
A snapshot of socio-economic development of Bangladesh Looking from multiple perspectives
Jiban R. Majumder, PhD Minister (Economic)
Embassy of Bangladesh Tokyo, Japan
E-mail: [email protected]
1
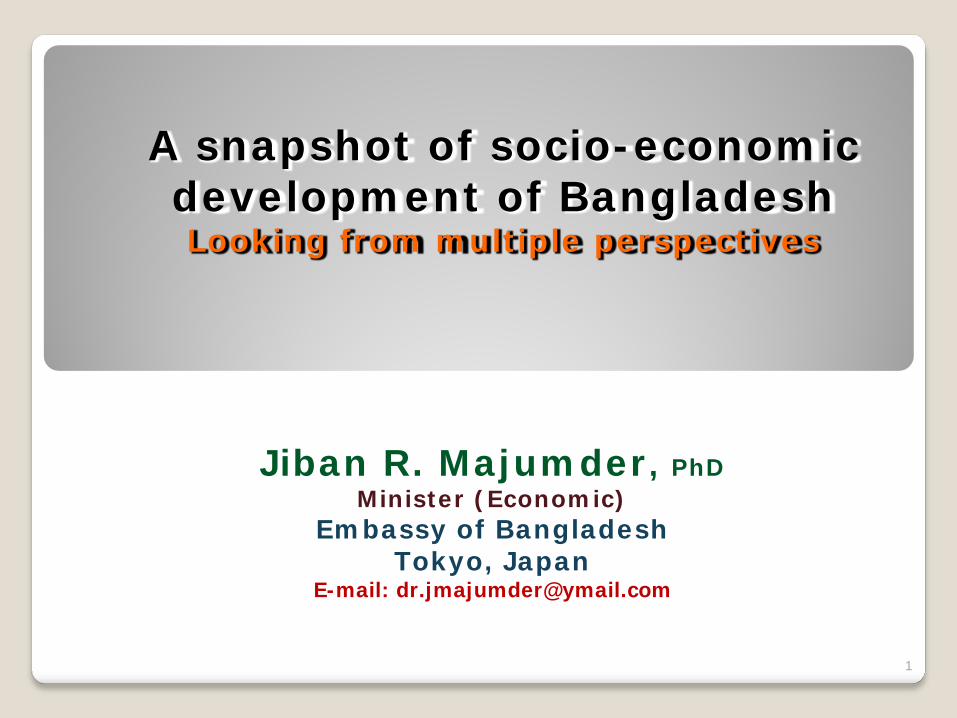
Where the journey started
Bangladesh is a land of impossible attainments: Demographic transition began when women emancipation was nowhere in sight Women employment was barely 10% Literacy rate was about 35% Per capita income was less than US$500
2
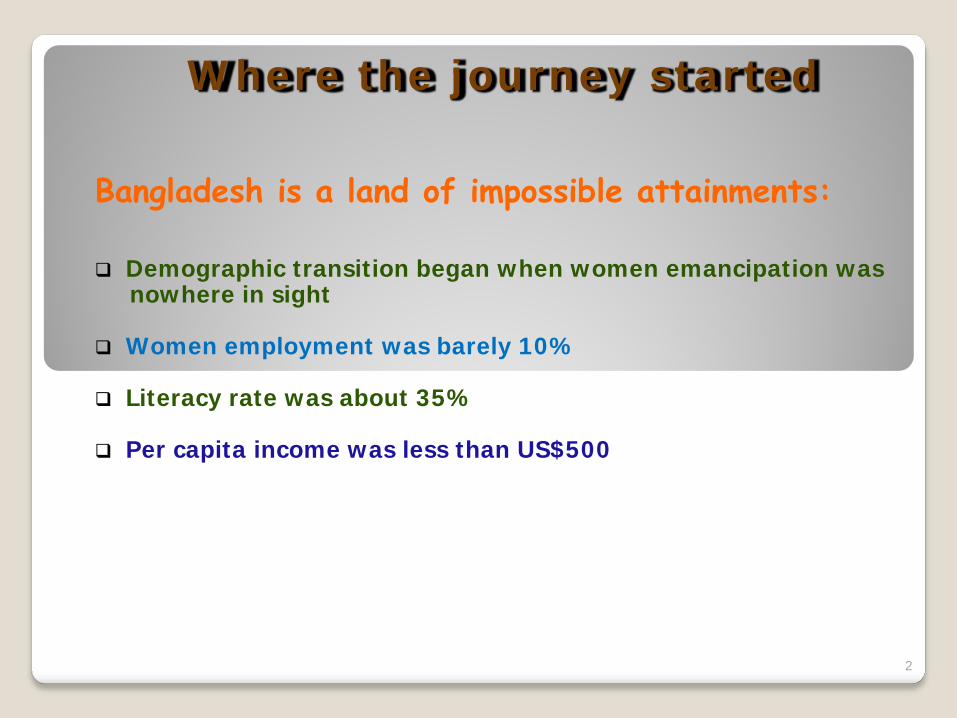
Macro-economic situation A few notable achievements:
Bangladesh is marching toward achieving a middle-income status
Total size of GDP was about US$110 billion in 2011
Steady GDP growth rate (about 6%) despite global economic meltdown
Per capita GDP was US$755 in 2011
External debt has declined to 23% of GDP in 2011, from the peak of 45% in 1994
External debt service in relation to export of goods and services has declined to 3% in 2011, from the highest 30% in 1980
Dependence on foreign aid declined to 2% in 2011, from its historical high of 10% in 1980
Bangladesh in the only country in South Asia enjoying external current account surplus in recent years
Foreign exchange reserve has touched US$12 billion mark this year (2012) for the first time since independence of the country
3
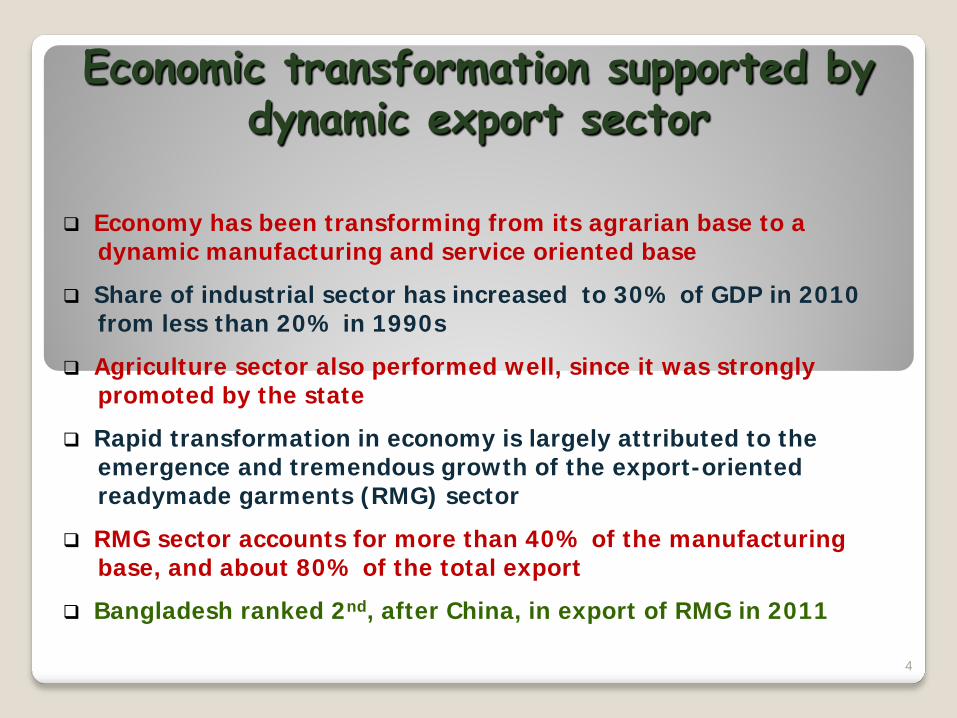
Economic transformation supported by dynamic export sector
Economy has been transforming from its agrarian base to a dynamic manufacturing and service oriented base
Share of industrial sector has increased to 30% of GDP in 2010 from less than 20% in 1990s
Agriculture sector also performed well, since it was strongly promoted by the state
Rapid transformation in economy is largely attributed to the emergence and tremendous growth of the export-oriented readymade garments (RMG) sector
RMG sector accounts for more than 40% of the manufacturing base, and about 80% of the total export
Bangladesh ranked 2nd, after China, in export of RMG in 2011
4
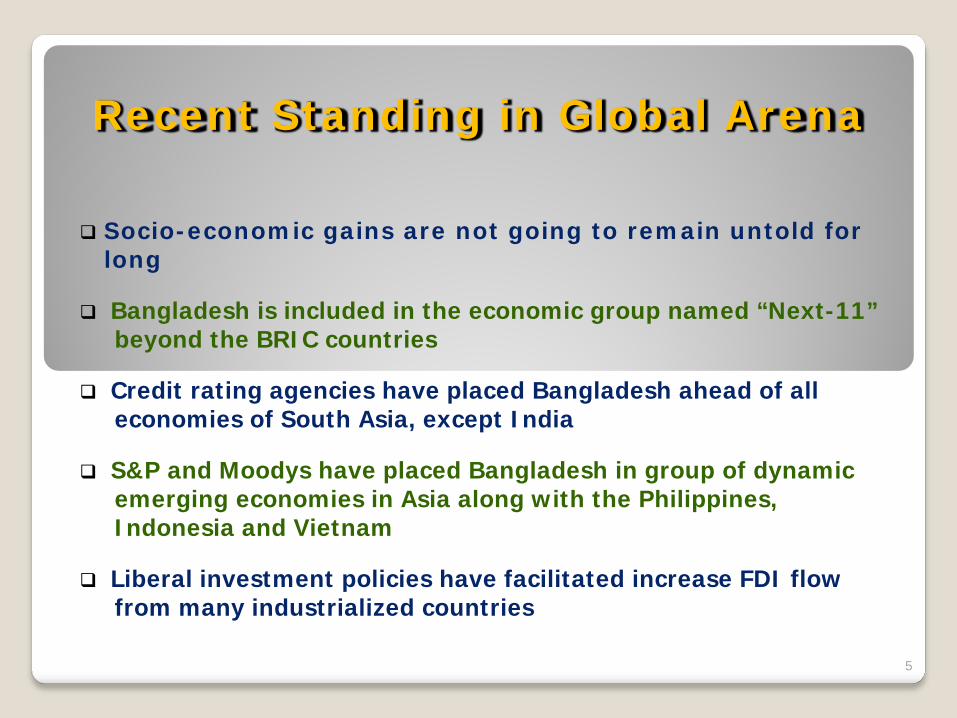
Recent Standing in Global Arena
Socio-economic gains are not going to remain untold for long Bangladesh is included in the economic group named “Next-11” beyond the BRIC countries Credit rating agencies have placed Bangladesh ahead of all economies of South Asia, except India S&P and Moodys have placed Bangladesh in group of dynamic emerging economies in Asia along with the Philippines, Indonesia and Vietnam Liberal investment policies have facilitated increase FDI flow from many industrialized countries
5
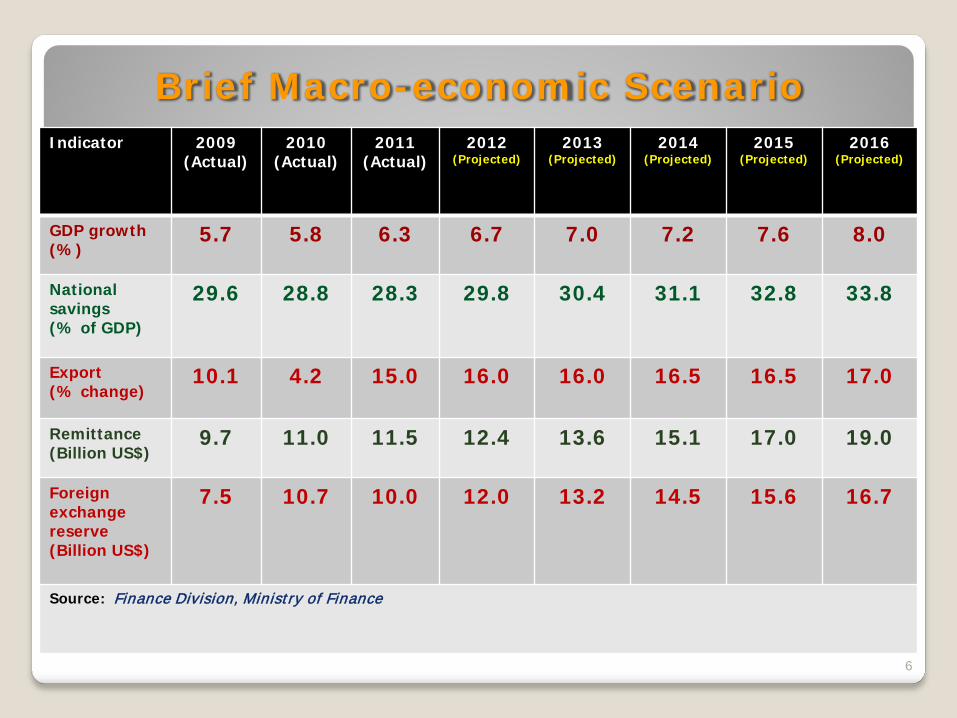
Brief Macro-economic Scenario
6
Indicator 2009 (Actual)
2010 (Actual)
2011 (Actual)
2012 (Projected)
2013 (Projected)
2014 (Projected)
2015 (Projected)
2016 (Projected)
GDP growth (%)
5.7 5.8 6.3 6.7 7.0 7.2 7.6 8.0
National savings (% of GDP)
29.6 28.8 28.3 29.8 30.4 31.1 32.8 33.8
Export (% change)
10.1 4.2 15.0 16.0 16.0 16.5 16.5 17.0
Remittance (Billion US$)
9.7 11.0 11.5 12.4 13.6 15.1 17.0 19.0
Foreign exchange reserve (Billion US$)
7.5 10.7 10.0 12.0 13.2 14.5 15.6 16.7
Source: Finance Division, M inistry of Finance
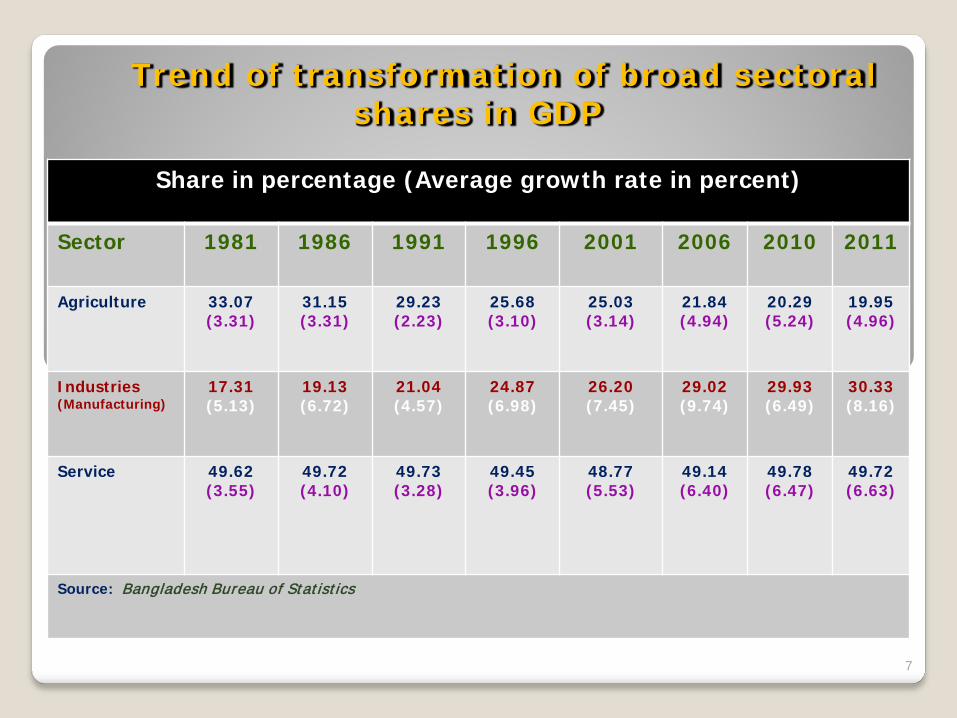
Trend of transformation of broad sectoral shares in GDP
7
Share in percentage (Average growth rate in percent)
Sector 1981 1986 1991 1996 2001 2006 2010 2011
Agriculture 33.07 (3.31)
31.15 (3.31)
29.23 (2.23)
25.68 (3.10)
25.03 (3.14)
21.84 (4.94)
20.29 (5.24)
19.95 (4.96)
Industries (Manufacturing)
17.31 (5.13)
19.13 (6.72)
21.04 (4.57)
24.87 (6.98)
26.20 (7.45)
29.02 (9.74)
29.93 (6.49)
30.33 (8.16)
Service 49.62 (3.55)
49.72 (4.10)
49.73 (3.28)
49.45 (3.96)
48.77 (5.53)
49.14 (6.40)
49.78 (6.47)
49.72 (6.63)
Source: Bangladesh Bureau of Statistics
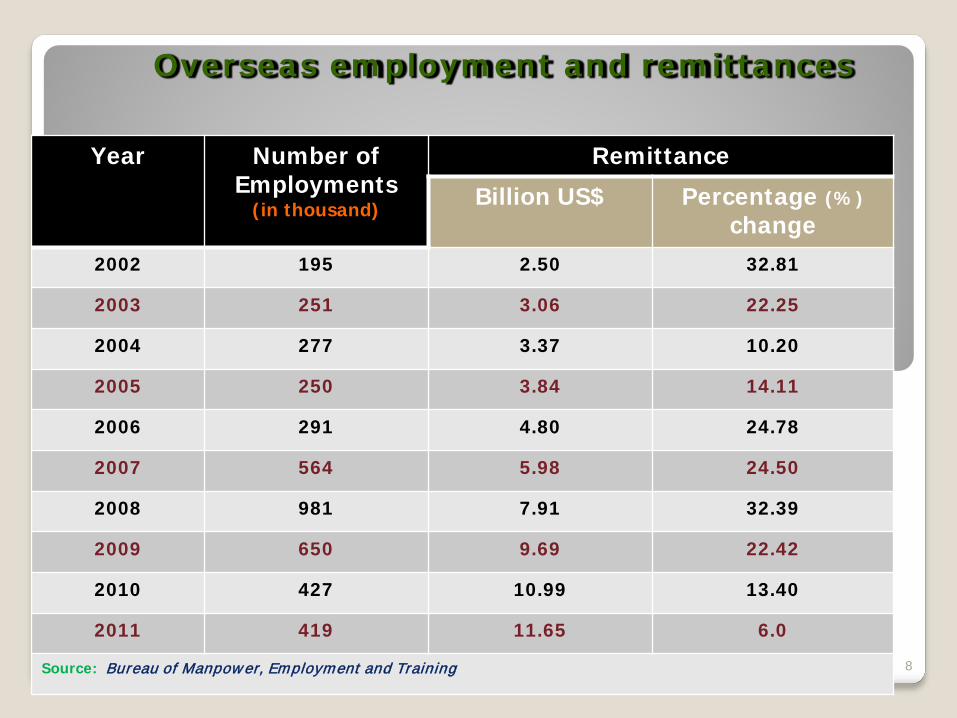
Overseas employment and remittances
8
Year Number of Employments
(in thousand)
Remittance
Billion US$ Percentage (%) change
2002 195 2.50 32.81
2003 251 3.06 22.25
2004 277 3.37 10.20
2005 250 3.84 14.11
2006 291 4.80 24.78
2007 564 5.98 24.50
2008 981 7.91 32.39
2009 650 9.69 22.42
2010 427 10.99 13.40
2011 419 11.65 6.0
Source: Bureau of Manpower, Employment and Training
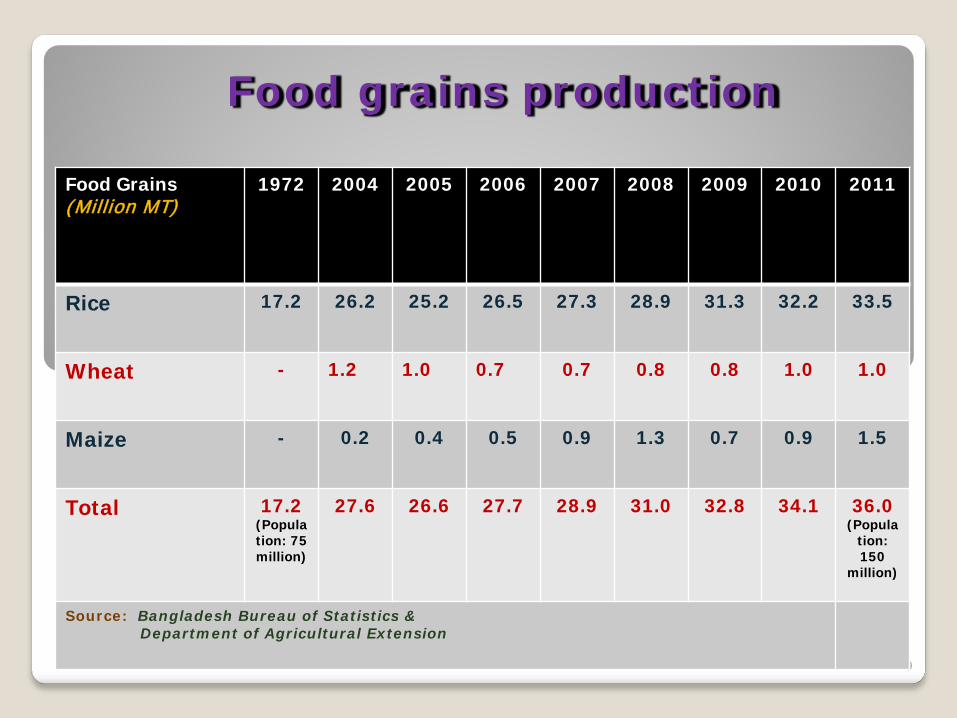
Food grains production
9
Food Grains (Million MT)
1972 2004 2005 2006 2007 2008 2009 2010 2011
Rice 17.2 26.2 25.2 26.5 27.3 28.9 31.3 32.2 33.5
Wheat - 1.2 1.0 0.7 0.7 0.8 0.8 1.0 1.0
Maize - 0.2 0.4 0.5 0.9 1.3 0.7 0.9 1.5
Total 17.2 (Population: 75 million)
27.6 26.6 27.7 28.9 31.0 32.8 34.1 36.0 (Popula
tion: 150
million)
Source: Bangladesh Bureau of Statistics & Department of Agricultural Extension
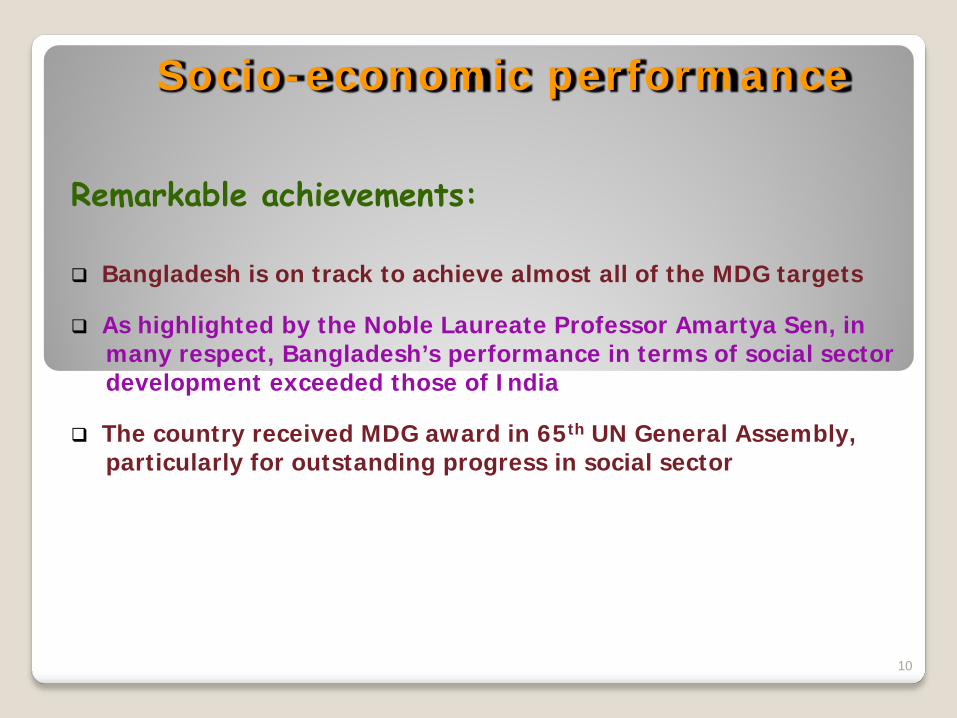
Socio-economic performance
Remarkable achievements: Bangladesh is on track to achieve almost all of the MDG targets As highlighted by the Noble Laureate Professor Amartya Sen, in many respect, Bangladesh’s performance in terms of social sector development exceeded those of India The country received MDG award in 65th UN General Assembly, particularly for outstanding progress in social sector
10
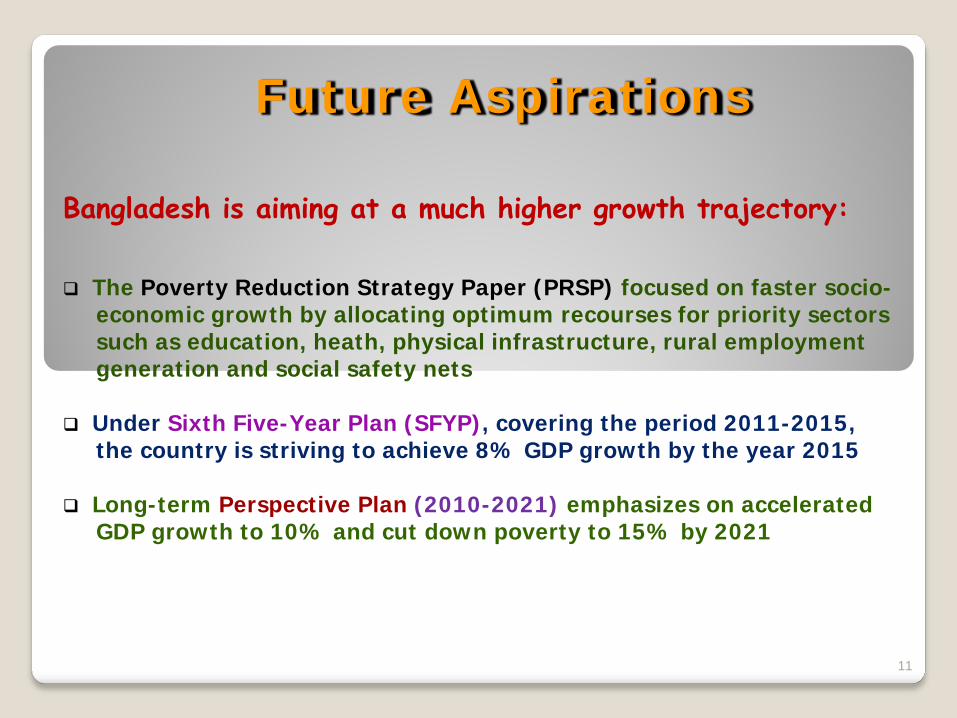
Future Aspirations
Bangladesh is aiming at a much higher growth trajectory: The Poverty Reduction Strategy Paper (PRSP) focused on faster socio- economic growth by allocating optimum recourses for priority sectors such as education, heath, physical infrastructure, rural employment generation and social safety nets Under Sixth Five-Year Plan (SFYP), covering the period 2011-2015, the country is striving to achieve 8% GDP growth by the year 2015 Long-term Perspective Plan (2010-2021) emphasizes on accelerated GDP growth to 10% and cut down poverty to 15% by 2021
11
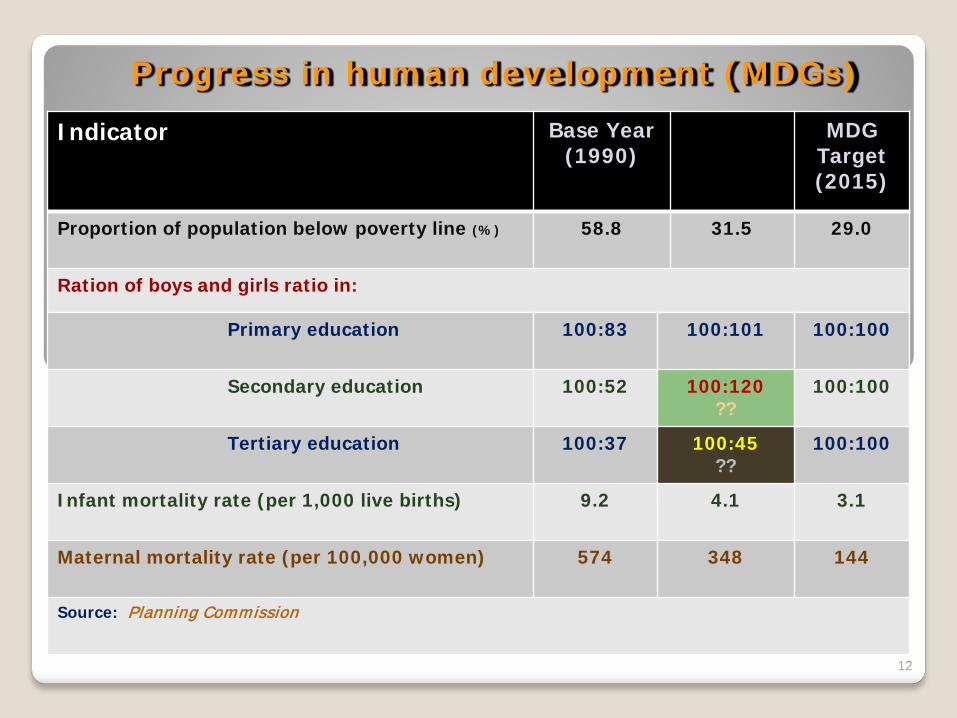
Progress in human development (MDGs)
12
Indicator Base Year (1990)
Actual Progress (2010)
MDG Target (2015)
Proportion of population below poverty line (%) 58.8 31.5 29.0
Ration of boys and girls ratio in:
Primary education 100:83 100:101 100:100
Secondary education 100:52 100:120 ??
100:100
Tertiary education 100:37 100:45 ??
100:100
Infant mortality rate (per 1,000 live births) 9.2 4.1 3.1
Maternal mortality rate (per 100,000 women) 574 348 144
Source: Planning Commission
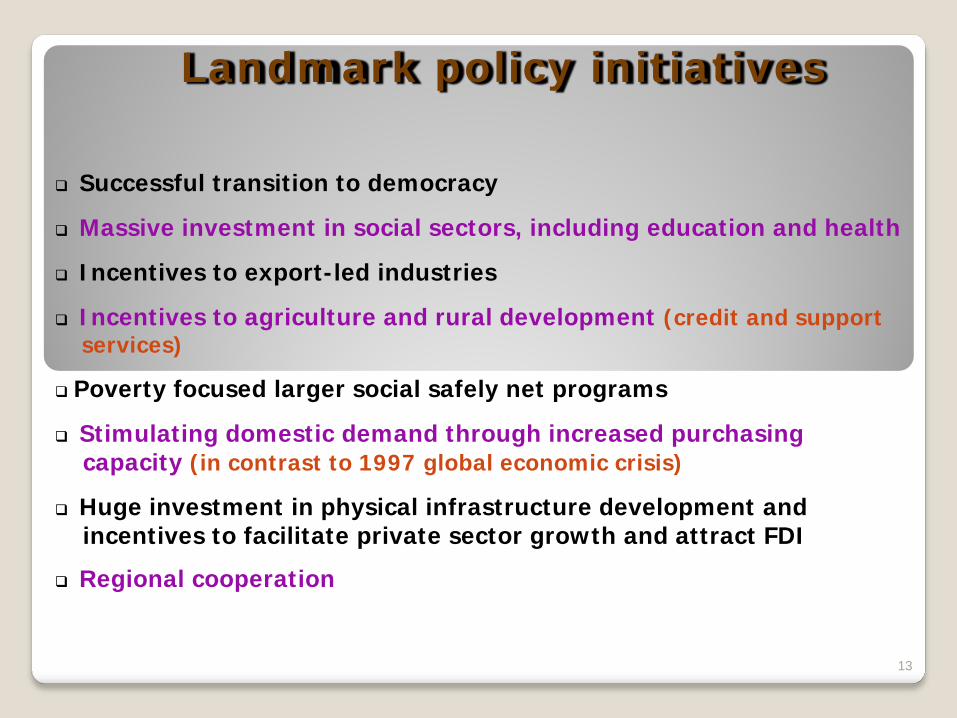
Landmark policy initiatives
Successful transition to democracy
Massive investment in social sectors, including education and health
Incentives to export-led industries
Incentives to agriculture and rural development (credit and support services)
Poverty focused larger social safely net programs
Stimulating domestic demand through increased purchasing capacity (in contrast to 1997 global economic crisis)
Huge investment in physical infrastructure development and incentives to facilitate private sector growth and attract FDI
Regional cooperation
13
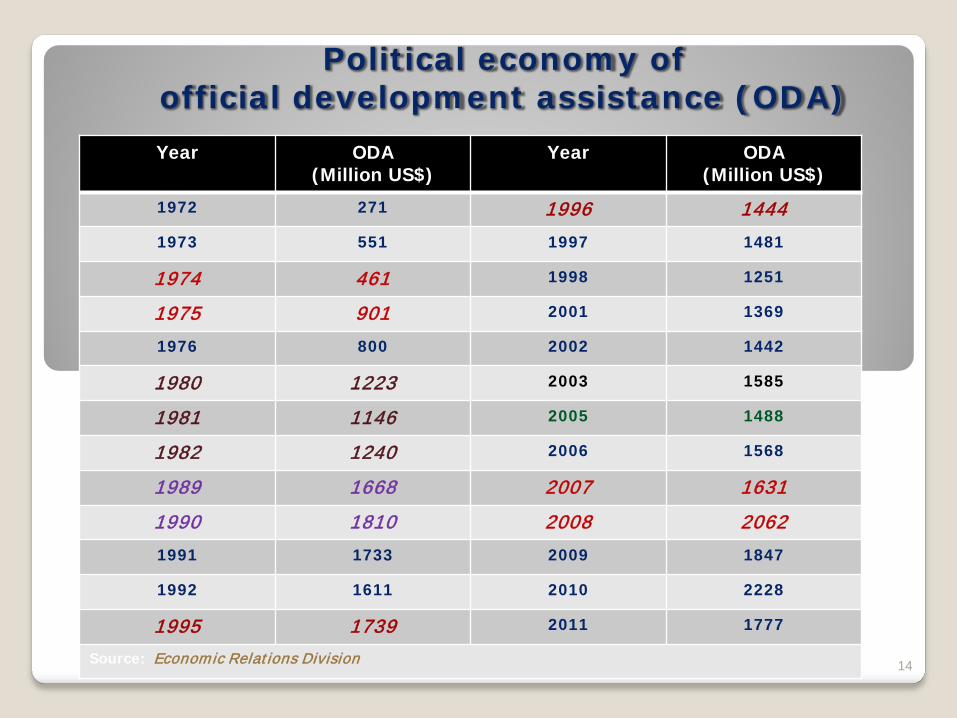
Political economy of official development assistance (ODA)
14
Year ODA (Million US$)
Year ODA (Million US$)
1972 271 1996 1444
1973 551 1997 1481
1974 461 1998 1251
1975 901 2001 1369
1976 800 2002 1442
1980 1223 2003 1585
1981 1146 2005 1488
1982 1240 2006 1568
1989 1668 2007 1631
1990 1810 2008 2062
1991 1733 2009 1847
1992 1611 2010 2228
1995 1739 2011 1777
Source: Economic Relations Division
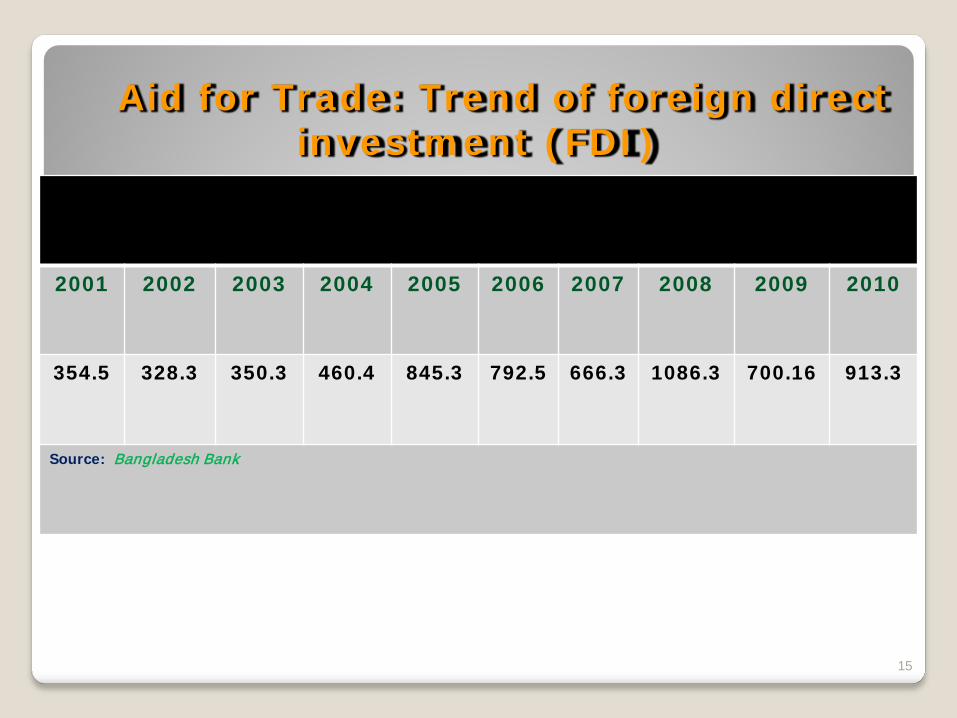
Aid for Trade: Trend of foreign direct investment (FDI)
15
In million US$
2001 2002 2003 2004 2005 2006 2007 2008 2009 2010
354.5 328.3 350.3 460.4 845.3 792.5 666.3 1086.3 700.16 913.3
Source: Bangladesh Bank

THANK YOU
16