Embed Size (px)
Citation preview
BA
NG
LA
DE
SH
JOU
RN
AL O
F R
AD
IOLO
GY
AN
D IM
AG
ING
BANGLADESH JOURNAL OF RADIOLOGY AND IMAGING
Volume 21, Number 1
January 2013
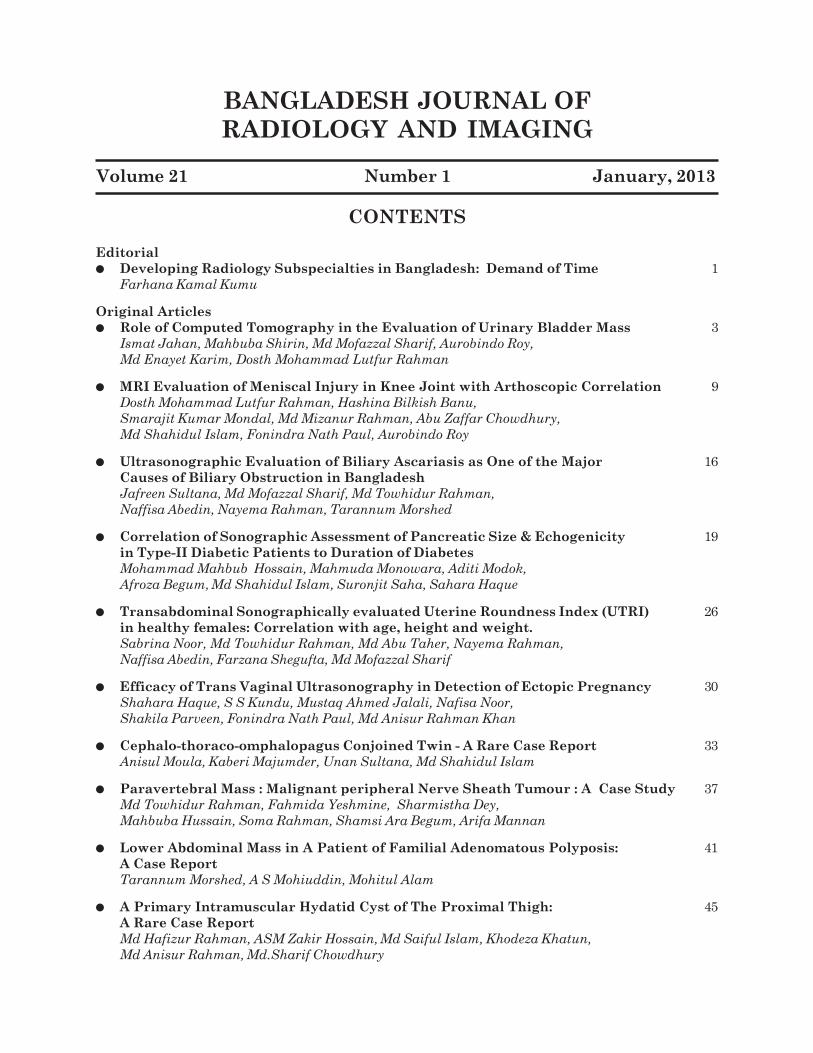
CONTENTS
JOURNAL OF BANGLADESH SOCIETY OF RADIOLOGY AND IMAGING
ISSN : 1726-961
Editorial
l Developing Radiology Subspecialties in Bangladesh: Demand of Time 1
Farhana Kamal Kumu
Original Articles
l Role of Computed Tomography in the Evaluation of Urinary Bladder Mass 3
Ismat Jahan, Mahbuba Shirin, Md Mofazzal Sharif, Aurobindo Roy,
Md Enayet Karim, Dosth Mohammad Lutfur Rahman
l MRI Evaluation of Meniscal Injury in Knee Joint with Arthoscopic Correlation 9
Dosth Mohammad Lutfur Rahman, Hashina Bilkish Banu,
Smarajit Kumar Mondal, Md Mizanur Rahman, Abu Zaffar Chowdhury,
Md Shahidul Islam, Fonindra Nath Paul, Aurobindo Roy
l Ultrasonographic Evaluation of Biliary Ascariasis as One of the Major 16
Causes of Biliary Obstruction in Bangladesh
Jafreen Sultana, Md Mofazzal Sharif, Md Towhidur Rahman,
Naffisa Abedin, Nayema Rahman, Tarannum Morshed
l Correlation of Sonographic Assessment of Pancreatic Size & Echogenicity 19
in Type-II Diabetic Patients to Duration of Diabetes
Mohammad Mahbub Hossain, Mahmuda Monowara, Aditi Modok,
Afroza Begum, Md Shahidul Islam, Suronjit Saha, Sahara Haque
l Transabdominal Sonographically evaluated Uterine Roundness Index (UTRI) 26
in healthy females: Correlation with age, height and weight.
Sabrina Noor, Md Towhidur Rahman, Md Abu Taher, Nayema Rahman,
Naffisa Abedin, Farzana Shegufta, Md Mofazzal Sharif
l Efficacy of Trans Vaginal Ultrasonography in Detection of Ectopic Pregnancy 30
Shahara Haque, S S Kundu, Mustaq Ahmed Jalali, Nafisa Noor,
Shakila Parveen, Fonindra Nath Paul, Md Anisur Rahman Khan
Case Reports
l Cephalo-thoraco-omphalopagus Conjoined Twin - A Rare Case Report 33
Anisul Moula, Kaberi Majumder, Unan Sultana, Md Shahidul Islam
l Paravertebral Mass : Malignant peripheral Nerve Sheath Tumour : A Case Study 37
Md Towhidur Rahman, Fahmida Yeshmine, Sharmistha Dey,
Mahbuba Hussain, Soma Rahman, Shamsi Ara Begum, Arifa Mannan
l Lower Abdominal Mass in A Patient of Familial Adenomatous Polyposis: A Case Report 41
Tarannum Morshed, A S Mohiuddin, Mohitul Alam
l A Primary Intramuscular Hydatid Cyst of The Proximal Thigh: A Rare Case Report 45
Md Hafizur Rahman, ASM Zakir Hossain, Md Saiful Islam, Khodeza Khatun,
Md Anisur Rahman, Md.Sharif Chowdhury
Edited and Published by Prof. Abu Saleh Mohiuddin on behalf of the Bangladesh Society of Radiogy & Imaging
Dhaka-1000, Bangladesh and Printed at Asian Colour Printing, 130 DIT Extension Road, Fakirerpool, Dhaka-1000,
Bangladesh, Phone: 58313186, 9357726, E-mail:[email protected]
Vol. 21, No. 1, January, 2013
(Published in June 2015)
BANGLADESH JOURNAL OF
RADIOLOGY AND IMAGING
Annual Subscription : Tk. 200.00 for local and US$ 20.00 for Overseas Subscribers
Official Publication of Bangladesh Society of Radiology and Imaging33, Topkhana Road, Meherba Plaza, L-5th Floor, Dhaka-1000, Bangladesh
Phone : 8613189, 9126995E-mail: [email protected] Website: www.bsribd.org
EDITORIAL BOARD
Editor in Chief :
Prof Abu Saleh Mohiuddin
Co-Editors:
Dr Shamim Ahmed
Prof Shibendu Mojumder
Col Zoherul Islam
Executive Editor:
Prof Md Mizanur Rahman
Executive Members:
Prof Md Enayet Karim
Prof Mahfuzur Rahman
Prof Farid Ahmed
Dr Delwar Hossain
Dr Mobarak Ali
Dr Sarwar Ramiz
Dr Syed Maksumul Haque
Dr Nilkantha Paul
Dr Mahmud Uz Jahan
EXECUTIVE COMMITTEE
PresidentProf Syed Mizanur Rahman
Vice - PresidentProf Brig Gen (Rtd) Jahangir Alam
Prof Md Enayet KarimProf Abu Saleh Mohiuddin
Secretary GeneralProf Dr Md Mizanur Rahman
TreasurerProf Shibendu Mojumder
Joint SecretaryDr Shahryar Nabi
Organizing SecretaryDr Md Shahidul Islam
Office SecretaryDr Md Khalilur Rahman
Scientific SecretaryDr Shamim Ahmed
Secretary for International AffairsProf Salahuddin Al Azad
Entertainment SecretaryDr Bishwajit Bhowmick
MembersDr Md Mofizullah
Dr Syed Maksumul HaqDr Bibekananda HalderDr Mahmood-Uz-Jahan
Dr Robindranath Sarker (Robin)Dr Fatema Doza
Dr Sushanta Kumar SarkarDr Bidoura TanimDr Asish Sarkar
BANGLADESH SOCIETY OFRADIOLOGY AND IMAGING
Bangladesh Journal of Radiology and Imaging abiannual (January and July) journal, is the officialJournal of Bangladesh Society of Radiology andImaging.
Each issue will include original articles, reviewarticles, case reports and any other articles ofinterest in Radiology and Imaging.
Manuscripts must be in English and should besubmitted to the Editor.
The manuscript should be in accordance withthe modified Vancouver (Ref. Bangladesh J ofRadiol 1993; (Vol. 1(1): 27-34 and be submitted intwo copies with two sets of illustrations.
Manuscripts should be accompanied by acovering letter from the author who will be
BANGLADESH JOURNAL OFRADIOLOGY AND IMAGING
Prof Nazrul Islam
Prof Hashem Ali
Prof Rezaul Mostofa
Prof ASQM Sadeque
Prof MA Bashar
Prof MI Mondol
Prof (Big Gen Rtd) Chowdhury Abdul Gaffar
Prof Abdul Matin Khan
Prof Syed Abdul Matin
Prof Akhter Uddin Ahmed
Prof MA Quddus
Prof M Mahabubur Rahman
Prof Nasiruddin Miah
Prof (Big Gen Rtd) Jahangir Alam
Prof (Big Gen Rtd) Zuberul Islam
Prof Shafiqur Rahman
ADVISORY BOARD
Information for Contributorsresponsible for correspondence regarding
manuscripts.
Papers will be accepted for publication provided
they are submitted solely with Bangladesh
Journal of Radiology and Imaging and are
subject to review and editorial decisions.
Statement and opinion expressed in papers are
those of author(s) and the editor(s) or publisher
bears no responsibility of such matter.
All decisions to accept, revise or refer a paper
will be made by the editorial board.
The paper which will not be accepted for
publication will not be returned back to the
author. No reprint will be provided.
INSTRUCTION TO AUTHORS
Authors are requested to follow Vancouver’sstyle (N Engl J Med 1997; 336: 309-15) of writingas outlined below, while submitting articles forpublication in BSRI Journal.
Preparation of manuscript : Typedmanuscript on white bond paper in quadruplicatewith margins of 2.5 cm is to be submitted.Double spacing should be used throughout.Pages are to be numbered consecutively,beginning with the title page in the right uppercorner of each page.
Title page : The title page should contain thetitle of the article, rank, name of authors withacademic qualification, word count of text andabstract. It should also contain the name andaddress of the author with whomcorrespondence is to be made. The full name withserial order of the authors written in write corneras superscript. e.g., Calvin a Shadaw1, MohammadSelim Newas2 will be the format of placing thename of the authors below be title.
Abstract : The abstract should be unstructuredand should state the purpose of the study orinvestigation, basic procedure, main findings andthe principal conclusion. It should be limited to300 words for a review article. For original andleading article, it should be less than 250 words.For case report and short communication itshould not exceed 150 words.
Text : The text of the article should be dividedinto sections with the following heading;introduction, materials and methods, results,discussion and conclusion.
Size of the article / Text : The size of reviewarticle should be less than 3,000 wordsexcluding the abstracts, tables, illustrations,references and acknowledgment. For originalarticle or leading article it should be within2,000 words. For case report the upper limitshould be 1000 words. For short communicationit should not exceed 600 words.
Tables and Illustrations : Tables andillustrations should be self-explanatory and
supplementary but not duplication of the contentsof the text. Each table / illustration is to be typedon a separate sheet, numbered in Romannumeric and attached at the end of the test.Tables should not have more than 3 horizontallines and no vertical lines. Photographs shouldbe clear, glossy and uncounted, diagrams andgraphs are to be in Indian ink. The number shouldnot exceed 10 for review article, 06 for originalarticle and 03 for a case report.
Acknowledgement : Only those persons whohave made substantial contributions to the articleshould be acknowledged.
Reference: References are to be numberedconsecutively in the order in which they appear inthe text. Number of references for review articleshould be less than 50 and for original article lessthan 25. For case report and short communicationit should be less than 10. The forms of thereferences should be as per examples below :
References from Journal : References shouldbe written according to the following sequence e.g.authors (s) name, subject, name of Journal withyear of publication, volume number, page ‘number. If there are six authors or less, names ofall the authors should be written. When there areseven authors or more the first three names willbe listed and then word “et al” to be added. `Example : Calne L, Swells J D, Somford RD, et al.Further observation on renal transplantation inman from cadaveric donors. BMJ 1996; 218: 1345-1351.
References from books and monograph : Incase of personal authors(s) reference should bewritten in the following sequence : author(s) name,name of the books, number of edition, place bypublication, name of the publisher, year ofpublication, pages, Example : Rhoder AJ. TextBook of Virology. 5th ed. Balgimpore : Wilkins;1968. P 469-465. In case of reference from booksedited by one and chapter written by some one;the reference should be written in the followingsequence : name of author(s) name of chapter, name
of editor, name of books, place of publication, nameof publisher, year of publication, pages.Examination : Insel PA. Analgesics antipyretics,and anti-inflammatory agents. In: Gilman AG, RallTW. Nies AS, Tailor P, Editors, ThePharmacological Basis of Therapeutic Singapore :Pergamon Press; 199. p. 638-661.
Reference from dissertation or thesis : Thereference should be made in the followingsequence : name of author(s), subject, place ofpublication, name of institute, year of study,pages, Example :Tableb NA Bacteriological studyof diarrhoea in Bangladesh Thesis). Dhaka,IPGM&R 1990. 65-90.
Reference of articles of magazines : Thereference should be made in the followingsequence : name of author(s), name of thesubject, name of the magazine, year and date,pages. Example : Touche B. Annals of Medicine :The santa claus culture. The new York 1991;Sep. 4: 66-81.
Number of Authors : the number of authorsshould be limited to 04, 05, and 08 for casereport, review article and original articlesrespectively.
Check List : The authors should deposit thefollowing documents to the editorial board.
a. Letter of submission / forwarding letter.
b. A certificate stating that the contents of thearticles has not been published in any journaland it has not been submitted to any otherjournal for publication.
c. A certificate from the head of the institutionwhere the original work has been done.
d. A specified certificate given by HigherHeadquarters.
e. Title - 05 copies
f. Abstract - 05 copies
g. Text of article - 05 copies
h. Table and illustration duly numbered
i. References
j. Compact Disc (CD) / Pendrive
k. Bio-data of principal authors.
Misc :
a. Preferably from one author there should not bemore than two case reports and one reviewarticle in a single issue of journal
b. Corresponding author’s & other authors ‘ nameand address should be printed in left lower cornerof the first page of the article.
CONTENTS
EditorialDeveloping Radiology Subspecialties in Bangladesh: Demand of Time 1Farhana Kamal Kumu
Original ArticlesRole of Computed Tomography in the Evaluation of Urinary Bladder Mass 3Ismat Jahan, Mahbuba Shirin, Md Mofazzal Sharif, Aurobindo Roy,Md Enayet Karim, Dosth Mohammad Lutfur Rahman
MRI Evaluation of Meniscal Injury in Knee Joint with Arthoscopic Correlation 9Dosth Mohammad Lutfur Rahman, Hashina Bilkish Banu,Smarajit Kumar Mondal, Md Mizanur Rahman, Abu Zaffar Chowdhury,Md Shahidul Islam, Fonindra Nath Paul, Aurobindo Roy
Ultrasonographic Evaluation of Biliary Ascariasis as One of the Major 16Causes of Biliary Obstruction in BangladeshJafreen Sultana, Md Mofazzal Sharif, Md Towhidur Rahman,Naffisa Abedin, Nayema Rahman, Tarannum Morshed
Correlation of Sonographic Assessment of Pancreatic Size & Echogenicity 19in Type-II Diabetic Patients to Duration of DiabetesMohammad Mahbub Hossain, Mahmuda Monowara, Aditi Modok,Afroza Begum, Md Shahidul Islam, Suronjit Saha, Sahara Haque
Transabdominal Sonographically evaluated Uterine Roundness Index (UTRI) 26in healthy females: Correlation with age, height and weight.Sabrina Noor, Md Towhidur Rahman, Md Abu Taher, Nayema Rahman,Naffisa Abedin, Farzana Shegufta, Md Mofazzal Sharif
Efficacy of Trans Vaginal Ultrasonography in Detection of Ectopic Pregnancy 30Shahara Haque, S S Kundu, Mustaq Ahmed Jalali, Nafisa Noor,Shakila Parveen, Fonindra Nath Paul, Md Anisur Rahman Khan
Cephalo-thoraco-omphalopagus Conjoined Twin - A Rare Case Report 33Anisul Moula, Kaberi Majumder, Unan Sultana, Md Shahidul Islam
Paravertebral Mass : Malignant peripheral Nerve Sheath Tumour : A Case Study 37Md Towhidur Rahman, Fahmida Yeshmine, Sharmistha Dey,Mahbuba Hussain, Soma Rahman, Shamsi Ara Begum, Arifa Mannan
Lower Abdominal Mass in A Patient of Familial Adenomatous Polyposis: 41A Case ReportTarannum Morshed, A S Mohiuddin, Mohitul Alam
A Primary Intramuscular Hydatid Cyst of The Proximal Thigh: 45A Rare Case ReportMd Hafizur Rahman, ASM Zakir Hossain, Md Saiful Islam, Khodeza Khatun,Md Anisur Rahman, Md.Sharif Chowdhury
BANGLADESH JOURNAL OFRADIOLOGY AND IMAGING
Volume 21 Number 1 January, 2013
EDITORIAL
Developing Radiology Subspecialties inBangladesh: Demand of Time
The question of whether general radiology is on the path to obsolescence has sparked considerabledebate in recent years, with much of the controversy centered on the contention that subspecialtyradiologists are likely to make fewer errors or blunders than their generalist counterparts. Whetherthis contention is true or not, the trend toward sub specialization is undeniable.
Myriad factors continue to fuel the sub specialization fire worldwide. Demand from hospitals tops thelist. With rapid sophisticated advancement and development of technology, the need for subspecialistservices is becoming more demanding. Sub-specialties like pediatric radiology, nuclear imaging,interventional radiology, neuro-radiology, musculoskeletal imaging, body imaging (CT, MRI andultrasound), women’s imaging, vascular radiology, cardiovascular imaging and PET/CT require specialistin the practice serving them. Despite the arguments in favor or otherwise, the demand and deploymentof sub-specialties is increasing worldwide and possibly now has reached a level beyond debates. Incontrast the scenario in Bangladesh is heart-breaking. This is the moment that we come forward totrain the blooming radiologists in the country and abroad for sub-specialization in respective fields toupgrade themselves and to keep pace with the developing or developed world too.
Dr. Farhana Kamal KumuMedical OfficerDhaka Medical College Hospital
BANGLADESH JOURNAL OF RADIOLOGY AND IMAGING 2013; VOL. 21(1): 1
BANGLADESH JOURNAL OF RADIOLOGY AND IMAGING 2013; VOL. 21(1): 3-8
ORIGINAL ARTICLES
Abstract:Objectives: The study was designed to evaluatethe diagnostic accuracy of computed tomography
in the diagnosis of urinary bladder mass.
Methodology: This cross-sectional study was
conducted in the department of Radiology and
Imaging, Bangabandhu Sheikh Mujib Medical
University (BSMMU) in collaboration with urology
and pathology department enrolling 73 patients of
23 to 76 years of age range who were referred by
Urology department of BSMMU, as clinically
suspected cases of urinary bladder mass for CT
scan of whole abdomen, during the period of July
2010 to May 2012.
Result: In this study, mean age was 56.84 ± 14.67
(mean ± SD) years. Highest incidence of bladder
mass, 41.09% was found in above 60 years age
group. It was observed that 55 were male (75.34%)
and 18 were female (24.66%). The most common
symptom associated with bladder mass was
haematuria which was observed in all study
subjects (100%). Among 73 cases, 69 (94.52%)
masses were neoplastic and rest 4 (5.48%) was
inflammatory as diagnosed by CT scan. Among the
mass, 65 were malignant and 4 were benign lesion.
Commonest CT scan diagnosis was transitional cell
carcinoma (TCC) (75.38%). Squamous cell
carcinoma prevailed in 6.84%, Adenocarcinoma in
6.84% and. Leiomyoma and chronic cystitis were
5.47% and 5.47% respectively. Considering
histopathological diagnosis as gold standard test
sensitivity, specificity, PPV, NPV and accuracy ofCT scan in diagnosis of malignant bladder masswere 95.52%, 83.33%, 98.46%, 62.5% and 94.5%respectively.
Conclusion: In most of the cases, ComputedTomography findings of the present studycorrelated well with histopathological findings . Itcan therefore be concluded that, ComputedTomography is a useful modality in the diagnosisof different type of urinary bladder masses.
Key words: Computed Tomography (CT), Urinarybladder mass.
Introduction:Primary bladder neoplasms account for 2%–6% ofall tumors, with bladder cancer ranked as thefourth common malignancy. Tumors may arisefrom the epithelial surface of the bladder. Bladderneoplasms can arise from any of the bladder walllayers. They are broadly classified as eitherepithelial or nonepithelial (mesenchymal), withover 95% being epithelial. Urothelial tumorsexhibit a spectrum of neoplasia ranging from abenign papilloma through carcinoma in situ (CIS)to invasive carcinoma. Other primary epithelialtumors include squamous cell carcinoma andadenocarcinoma in decreasing order offrequency.1Transitional cell carcinoma (TCC) ofthe bladder is one of the most commonmalignancies affecting the genitourinary tract andis characterized by multifocality and a highincidence of recurrence. Radiologists play animportant role in the staging and surveillance of
Role of Computed Tomography in the Evaluationof Urinary Bladder Mass
ISMAT JAHAN1, MAHBUBA SHIRIN2, MD MOFAZZAL SHARIF3, AUROBINDO ROY4,MD ENAYET KARIM5, DOSTH MOHAMMAD LUTFUR RAHMAN6
1. Department of Radiology & Imaging, BSMMU, 2. Assistant Professor, Department of Radiology & Imaging,BSMMU, 3. Honorary Student, BIRDEM, 4. Radiologist, DMCH, 5. Professor, Department of Radiology & Imaging,BSMMU, 6. Junior Consultant, Department of Radiology & Imaging, 500 Bedded General Hospital, Mugda.
Bangladesh Journal of Radiology and Imaging Vol. 21(1): January 2013
4
this malignancy2. Although clinical staging isaccurate in evaluating superficial tumors, it isprone to both understaging and overstaging ofinvasive lesions. Hence, imaging techniques suchas CT and MRI may play an important role in
accurate disease staging.3
Methodology:
This cross-sectional study was conducted in thedepartment of Radiology and Imaging of BSMMU,
Dhaka to evaluate the diagnostic accuracy ofcomputed tomography in the diagnosis of urinary
bladder mass enrolling 80 patients who werereferred by Urology department of BSMMU, as
clinically suspected cases of urinary bladder massfor CT scan of whole abdomen, of 23 to 76 years
of age range during the period of July 2010 to May2012. CTscan of abdomen was performed in all
patients and after surgery histopathologocaldiagnosis was done. Histopathological reports were
collected and correlated with CT findings. Howeverin 5 cases, histopathological reports were not
available. Two patients refused surgery afterenrolling into the study. Finally histopathology
reports were collected from 73 patients and theywere considerd as study sample. After taking
informed consent, data was collected in a pre-testedquestionnaire by taking history, examining the
patients clinically, the finding and interpretationof the CT scan and histopathological reports.
Histopathological diagnosis was considered as goldstandard of diagnostic criteria. The data was
expressed as frequency, percentage, mean (±SD)and range. For the validity of the study outcome
sensitivity, specificity, positive predictive value(PPV), negative predictive value (NPV) and
accuracy were calculated for CT scan usinghistopathological diagnosis as a gold standard ofdiagnostic criteria.
Result:Demographic characteristics of the studysubject: Among 73 study subjects the age rangedbetween 23 to 76 years. Mean age was 56.84 ± 14.67(mean ± SD) years. Highest incidence of bladdermass, 41.09% was found in above 60 years age
group. It was observed that 55 were male (75.34%)and 18 were female (24.66%).
Clinical presentation of the study subjects:The most common symptom associated withbladder mass was haematuria which was observedin all study subjects (100%). 41 subjects (56.16%)had anemia, 38 subjects (52.05%) had suprapubicpain, 34.24% had urgency, 21.92% had burningmicturation, 17.80% had increased frequency,15.06% had anorexia, 10.95% had flank pain, 5.47%had weight loss, 4.10% had bone pain and 2.73%subjects presented with pelvic mass.
CT scan features of the urinary bladdermasses: Among 73 cases, 69 (94.52%) masses wereneoplastic and rest 4 (5.48%) was inflammatory asdiagnosed by CT scan. Among 69 neoplastic mass,65 were malignant and 4 were benign lesion. Outof 55 cases of Transitional cell carcinoma, 80%involved base and 50% involved lateral bladder wall.90% TCC was isodense & 80% with irregularmargin. Tumour extension into perivesical tissuewas (30%) & adjacent viscera (20% ). Most cases(80%) revealed homogeneous contrastenhancement & 10% revealed distant metastasis.Among 5 cases of squamous cell carcinoma, 80%showed lateral wall involvement and 70% showeddiffuse bladder wall thickening. Irregular marginnoted in 100% cases & hyperdensity in 60% cases.All the cases (100%) revealed invasion to bladderwall, perivesical tissue and neighbouring viscerawith strong homogeneous contrast enhancementin 90% cases. Among 5 cases of adenocarcinoma,bladder base was affected in 60% cases whereasdiffuse wall involvement noted in 80% cases. 90%adenocarcinoma was mixed density mass withcalcification in 80% case. Extension into bladderwall & perivesicular fat noted in all (100%) cases.Most of the adenocarcinoma (90%) enhancedheterogeneously and 40% showed distantmetastasis. Leiomyoma showed regular marginwith lateral bladder wall involvement in 100%cases. Homogenous enhancement seen in (100%)all cases. Chronic cystitis revealed as non-enhancing lesion with diffuse bladder wallinvolvement in (70%) & lateral wall in (20%) caseswith irregular margin in 100 % cases.
Characteristics of different urinary bladdermasses: Among 73 cases, 94.52% masses wereneoplastic and rest (5.48%) was inflammatory. Themost common diagnosis was transitional cellcarcinoma (TCC) 75.38% (55). Squamous cellcarcinoma (SCC) prevailed as 6.84% (5).Adenocarcinoma was seen in 6.84% (5) studysubjects. Leiomyoma and chronic cystitis were5.47% (4) and 5.47% (4) respectively.Histopathological report confirmed TCC in 79.45%cases SCC prevailed as 6.88 %. Adenocarcinomawas seen in 5.47 % study subjects. Leiomyoma andchronic cystitis were both 4.1% each.
Evaluation of CT scan diagnosis on the basisof Histopathology as gold standard test fordiagnosis of malignant bladder mass: Out of
the 73 study subjects, 67 were histopathologicallyconfirmed as malignant mass. Among theconfirmed 67 subjects, 64 (True positive) werediagnosed as malignant mass by CT scanaccurately, while in 03 (False negative) subjects,CT scan failed to clearly diagnose malignant mass.One subject was false positively considered asbladder carcinoma. 05 (True negative) subjects hadother than bladder carcinoma as diagnosed by bothCT scan and Histopathological diagnosis.Considering histopathological diagnosis as goldstandard test sensitivity, specificity, PPV, NPV andaccuracy of CT scan in diagnosis of malignantbladder mass were 95.52%, 83.33%, 98.46%, 62.5%and 94.5% respectively.
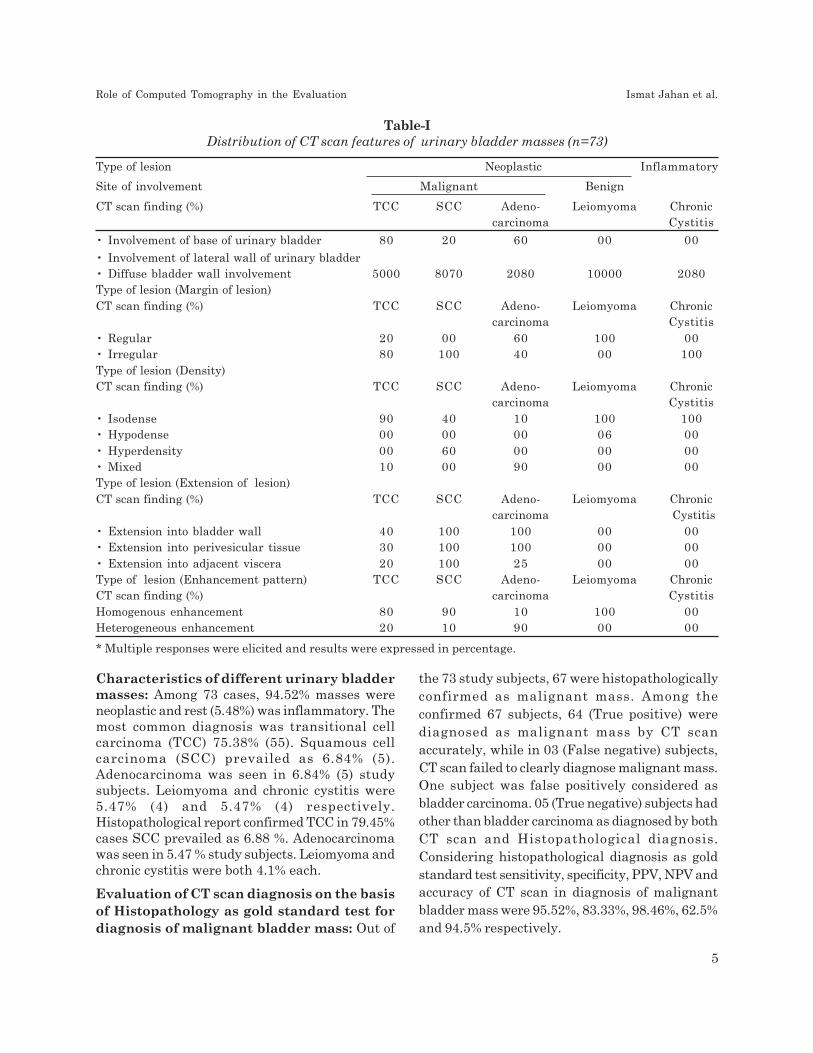
Table-IDistribution of CT scan features of urinary bladder masses (n=73)
Type of lesion Neoplastic Inflammatory
Site of involvement Malignant Benign
CT scan finding (%) TCC SCC Adeno- Leiomyoma Chroniccarcinoma Cystitis
• Involvement of base of urinary bladder 80 20 60 00 00
• Involvement of lateral wall of urinary bladder• Diffuse bladder wall involvement 5000 8070 2080 10000 2080Type of lesion (Margin of lesion)
CT scan finding (%) TCC SCC Adeno- Leiomyoma Chroniccarcinoma Cystitis
• Regular 20 00 60 100 00• Irregular 80 100 40 00 100
Type of lesion (Density)CT scan finding (%) TCC SCC Adeno- Leiomyoma Chronic
carcinoma Cystitis
• Isodense 90 40 10 100 100• Hypodense 00 00 00 06 00
• Hyperdensity 00 60 00 00 00• Mixed 10 00 90 00 00Type of lesion (Extension of lesion)
CT scan finding (%) TCC SCC Adeno- Leiomyoma Chroniccarcinoma Cystitis
• Extension into bladder wall 40 100 100 00 00• Extension into perivesicular tissue 30 100 100 00 00
• Extension into adjacent viscera 20 100 25 00 00Type of lesion (Enhancement pattern) TCC SCC Adeno- Leiomyoma ChronicCT scan finding (%) carcinoma Cystitis
Homogenous enhancement 80 90 10 100 00Heterogeneous enhancement 20 10 90 00 00
* Multiple responses were elicited and results were expressed in percentage.
Role of Computed Tomography in the Evaluation Ismat Jahan et al.
5

Discussion:The most common symptom associated withbladder mass was haematuria which was observedin all study subjects. 41 subjects (56.16%) hadanemia, 38 subjects (52.05%) had suprapubic pain,34.24% had urgency, 21.92% had burningmicturition, 17.80% had increased frequency,15.06% had anorexia, 10.95% had flank pain, 5.47%had weight loss, 4.10% had bone pain and 2.73%subjects presented with pelvic mass. Previous studyresult showed that almost 85% of patients withbladder cancer present with hematuria, which waseither gross or microscopic and was usuallypainless and intermittent.4 Out of the 73 studysubjects, 67 were histopathologically confirmed asmalignant mass. Among the confirmed 67 subjects,64 (True positive) were diagnosed as malignant
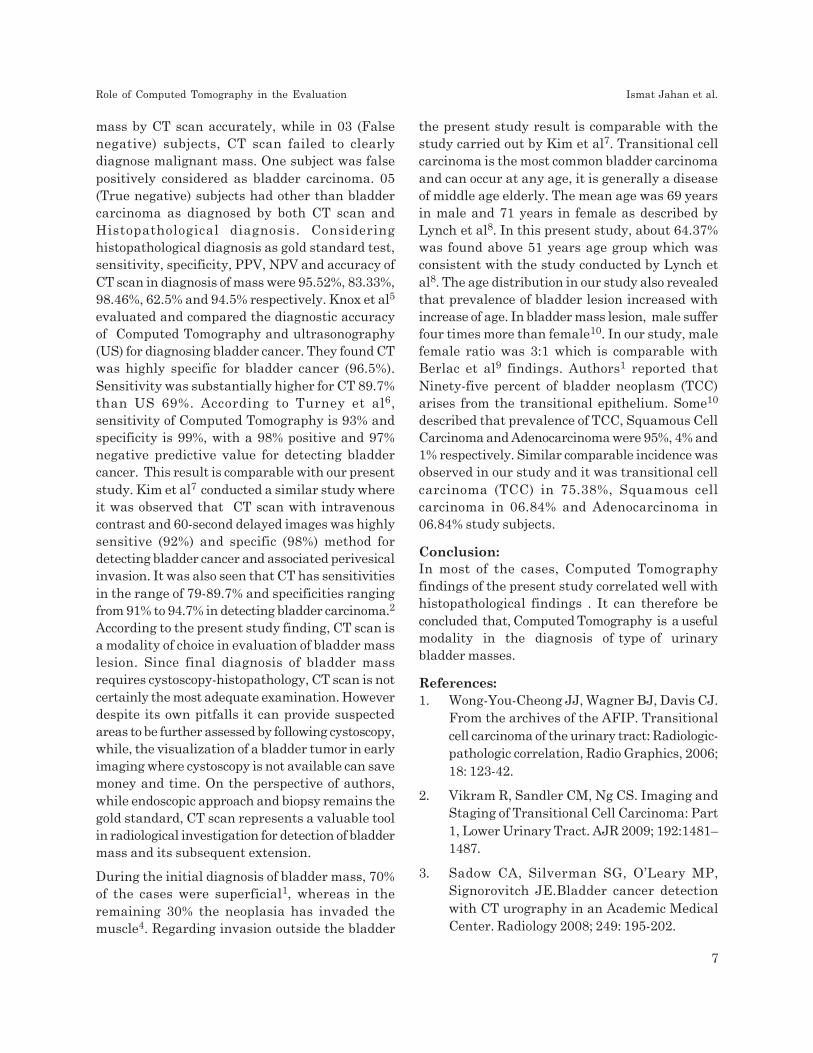
Fig.-1: Bar diagram of CT scan showingSensitivity, Specificity, Positive predictive value,Negative predictive value and accuracy of CT scanfor diagnosis of malignant bladder mass consideringHistopathology as gold standard test.
Fig.-2: CT Scan of urinary bladder showing –Transitional Cell Carcinoma involving the baseof the bladder.
Fig.-3: Axial CTscan showing squamous cellcarcinoma involving base & left lateral bladder wall.
Fig.-5: Leiomyomas arise from postero-lateralbladder wall.
Fig.-4: Axial CT image of urinary bladder showingAdenocarcinoma having solid & cystic componentwith peripheral calcification (source :Internet)
Bangladesh Journal of Radiology and Imaging Vol. 21(1): January 2013
6
mass by CT scan accurately, while in 03 (Falsenegative) subjects, CT scan failed to clearlydiagnose malignant mass. One subject was falsepositively considered as bladder carcinoma. 05(True negative) subjects had other than bladdercarcinoma as diagnosed by both CT scan andHistopathological diagnosis. Consideringhistopathological diagnosis as gold standard test,sensitivity, specificity, PPV, NPV and accuracy ofCT scan in diagnosis of mass were 95.52%, 83.33%,98.46%, 62.5% and 94.5% respectively. Knox et al5
evaluated and compared the diagnostic accuracyof Computed Tomography and ultrasonography(US) for diagnosing bladder cancer. They found CTwas highly specific for bladder cancer (96.5%).Sensitivity was substantially higher for CT 89.7%than US 69%. According to Turney et al6,sensitivity of Computed Tomography is 93% andspecificity is 99%, with a 98% positive and 97%negative predictive value for detecting bladdercancer. This result is comparable with our presentstudy. Kim et al7 conducted a similar study whereit was observed that CT scan with intravenouscontrast and 60-second delayed images was highlysensitive (92%) and specific (98%) method fordetecting bladder cancer and associated perivesicalinvasion. It was also seen that CT has sensitivitiesin the range of 79-89.7% and specificities rangingfrom 91% to 94.7% in detecting bladder carcinoma.2
According to the present study finding, CT scan isa modality of choice in evaluation of bladder masslesion. Since final diagnosis of bladder massrequires cystoscopy-histopathology, CT scan is notcertainly the most adequate examination. Howeverdespite its own pitfalls it can provide suspectedareas to be further assessed by following cystoscopy,while, the visualization of a bladder tumor in earlyimaging where cystoscopy is not available can savemoney and time. On the perspective of authors,while endoscopic approach and biopsy remains thegold standard, CT scan represents a valuable toolin radiological investigation for detection of bladdermass and its subsequent extension.
During the initial diagnosis of bladder mass, 70%of the cases were superficial1, whereas in theremaining 30% the neoplasia has invaded themuscle4. Regarding invasion outside the bladder
the present study result is comparable with thestudy carried out by Kim et al7. Transitional cellcarcinoma is the most common bladder carcinomaand can occur at any age, it is generally a diseaseof middle age elderly. The mean age was 69 yearsin male and 71 years in female as described byLynch et al8. In this present study, about 64.37%was found above 51 years age group which wasconsistent with the study conducted by Lynch etal8. The age distribution in our study also revealedthat prevalence of bladder lesion increased withincrease of age. In bladder mass lesion, male sufferfour times more than female10. In our study, malefemale ratio was 3:1 which is comparable withBerlac et al9 findings. Authors1 reported thatNinety-five percent of bladder neoplasm (TCC)arises from the transitional epithelium. Some10
described that prevalence of TCC, Squamous CellCarcinoma and Adenocarcinoma were 95%, 4% and1% respectively. Similar comparable incidence wasobserved in our study and it was transitional cellcarcinoma (TCC) in 75.38%, Squamous cellcarcinoma in 06.84% and Adenocarcinoma in06.84% study subjects.
Conclusion:In most of the cases, Computed Tomographyfindings of the present study correlated well withhistopathological findings . It can therefore beconcluded that, Computed Tomography is a usefulmodality in the diagnosis of type of urinarybladder masses.
References:1. Wong-You-Cheong JJ, Wagner BJ, Davis CJ.
From the archives of the AFIP. Transitionalcell carcinoma of the urinary tract: Radiologic-pathologic correlation, Radio Graphics, 2006;18: 123-42.
2. Vikram R, Sandler CM, Ng CS. Imaging andStaging of Transitional Cell Carcinoma: Part1, Lower Urinary Tract. AJR 2009; 192:1481–1487.
3. Sadow CA, Silverman SG, O’Leary MP,Signorovitch JE.Bladder cancer detectionwith CT urography in an Academic MedicalCenter. Radiology 2008; 249: 195-202.
Role of Computed Tomography in the Evaluation Ismat Jahan et al.
7
4. Kirkali Z, Chan T, Manoharan M. Bladdercancer: epidemiology, staging and grading,and diagnosis’, Urology 2005; 66(1): 4-34.
5. Knox MK, Cowan NC, Rivers-Bowerman MD,Turney BW. Evaluation of multidetectorcomputed tomography urography andultrasonography for diagnosing bladdercancer. Clin Radiol 2006; 63: 1317–1325.
6. Turney BW, Willatt JM, Nixon D, Crew JP,Cowan NC. Computed tomography urographyfor diagnosing bladder cancer. BJU Int 2006;98: 345-348.
7. Kim JK, Park SY, Ahn HJ, Kim CS, Cho KS.Bladder cancer: analysis of multi-detector
row helical CT enhancement pattern and
accuracy in tumor detection and perivesical
staging. Radiology 2004; 231: 725-731.
8. Lynch CF, Cohen MB. Urinary system,
Cancer 1995; 75: 316.
9. Berlac PA, Holm HH. Bladder tumor:
Abdominal ultrasound and urine cytology,
The J. Urol l; 10: 1510-1520.
10. Kabala EJ, Sibly GN, Jenkins JP. The Bladder
and Prostate. In CT and MR imaging of the
Whole Body, eds Haaga JR, Lanzieri CF &
Gilkeson RC, Mosby USA, 4th edn, 2003; 1:
989-1016.
Bangladesh Journal of Radiology and Imaging Vol. 21(1): January 2013
8
Abstract :This cross sectional study was carried out with anaim to establish the usefulness of MRI in thediagnosis of meniscal tear as a non-invasive method.The study was conducted from January 2012 toDecember 2013 for duration of two years (24 Months)
Patients with clinically suspected meniscal injuryof knee joint referred to Radiology & Imagingdepartment of BSMMU either by OPD or inpatientdept. of orthopadics for imaging investigation wasconsidered as study population. The ages of thepatients included in the study ranged from 18-55years with mean age of 29,94 Years (SD-9.16) Witha medium field close at 1.5 Tesla magnet. MRIFindings 44 (out of 50 patients) showed meniscalinjury with other lesion, and no meniscal injurywas found in 06 patients.
Among this 45 patients were confirmed byarthroscopy as meniscal tear and 01 was found tobe a wrong diagnosis by MRI and among 06patients who were normal by MRI, 2 wereconfirmed as meniscal tear by arthroscopy.Compared to arthroscopic findings MRI diagnosisyielded a sensitivity of 95%, Specificity of 80%,Positive predictive value of 97%, Negative predictivevalue of 66% and accuracy of 94%. The studyconcludes that MRI is a useful non-invasivediagnostic modality for evaluation of meniscalinjury of knee joint.
Key words: Medium field close 1.5T MRI, Menisciin Knee joint, Arthroscopy
Introduction:The menisci provide important structural andfunctional support to the knee. They provide jointstability by promoting congruity between femoraland tibial articular surfaces, absorbing shock tothe articular cartilage during axial loading,lubricating joint structures, and limitinghyperextension and hyper flexion of the joint.
Meniscal injury of knee joint is common, can resultfrom either excessive mechanical load on thenormal meniscus (traumatic tears) or normalmechanical load on the degenerating meniscus(degenerative tears). Acute traumatic tears arefound in the young, athletic population. In thissituation lateral meniscus is most commonly torn,usually from twisting strains on the knee when itis either only slightly flexed or fully extended .Tears found in the older population generally occurat sites of meniscal degeneration and are oftenasymptomatic1,2.
Because of the importance of the menisci instabilizing the knee and minimizing degenerativechanges to the joint, management of meniscaltears has shifted away from total meniscectomyand toward meniscal preservation and repair3. Anaccurate description of the meniscal injury by theinterpreting radiologist is therefore important toaid the referring clinician in surgical planning2.
Arthroscopy is an invasive and expensive but stillconsidered as “the gold standard” for the diagnosisof traumatic intra-articular knee lesions, havingaccuracy as high as 95% to 98% and with a single
MRI Evaluation of Meniscal Injury in Knee Jointwith Arthoscopic Correlation
DOSTH MOHAMMAD LUTFUR RAHMAN1, HASHINA BILKISH BANU2, SMARAJIT KUMARMONDAL3, MD MIZANUR RAHMAN4, ABU ZAFFAR CHOWDHURY5, MD SHAHIDUL ISLAM6
FONINDRA NATH PAUL7, AUROBINDO ROY8
1. Junior Consultant, Department of Radiology & Imaging, 500 Bedded General Hospital, Mugda, 2. AssistantProfessor, Shaheed Suhrawardi Medical College, Dhaka, 3. Assistant Professor (Dept. of Radiology), Sher-E-BanglaMedical College & Hospital, 4. Professor and Head of Dept., Radiology & Imaging, Dhaka Medical College,5. Associate Professor & Head, Arthroscopy & Replacement Surgery Unit, BSMMU, Shahabagh, Dhaka, 6. AssistantProfessor, Dept. of Radiology & Imaging, Dhaka Medical College, 7. Junior Consultant, Department of Radiology& Imaging, TB Hospial, Shyamoli, Dhaka, 8. Radiologist, Dhaka Medical College Hospital.
BANGLADESH JOURNAL OF RADIOLOGY AND IMAGING 2013; VOL. 21(1): 9-15

intervention both diagnosis and repair ofligamentous and meniscal injuries can be done.
The use of arthrography and arthroscopy improvesthe accuracy of the diagnosis, both are invasiveand can cause complications. The reportedaccuracy of arthroscopy has ranged widely from67 to 97%, and the technique requires a personwho is skilled in reporting and interpreting theresults4.
MRI scanning of knee joint has often been regardedas the noninvasive alternative to diagnosticarthroscopy. MRI scan is routinely used to supportthe diagnosis for meniscal or cruciate ligamentinjury prior to recommending arthroscopicexamination and surgery5.
Magnetic Resonance Imaging (MRI) is one of thebest imaging method with high accuracy for non-invasive evaluation of knee pathology6. It candetect intra-articular soft tissue structures suchas meniscus and other ligaments of the knee.Meniscal tears are a common abnormality that ledto knee pain. Arthroscopy is used as a gold standardof diagnosis of meniscal tear. It acts as a referencein assessing other diagnostic tools.
Methods:This cross sectional study was carried out in thedepartment of Radiology & Imaging, BSMMU incollaboration with department of orthopedics of thesame hospital.
The study was conducted from January 2012 toDecember 2013 for duration of 2 years (24 month).
Clinically suspected cases of meniscal injury in kneejoint lesions attended in the Orthopedics andRadiology departments of Bangabandhu SheikhMujib Medical University (BSMMU), Dhaka, wereenrolled in this study.
Purposive sampling technique was followed for datacollection using inclusion & exclusion criterion.Inclusion criteria’s were patients with history ofknee joint injury referred to the Departments ofRadiology and Imaging and Orthopaedic forsuspected internal derangement of knee joint andwho underwent both MRI and Arthroscopy.
Exclusion criteria’s were patients withferromagnetic implants, pacemakers, andaneurysm clips, patients with knee joint neoplasm,inflammatory and infectious conditions of kneejoint, patients who are not willing to undergoarthroscopy examination and patient who are notfit for arthroscopy.
Detailed Clinical history and relevant points inclinical examination were noted. Appropriate datawere collected by using a preformed data sheet.
The patients were then subjected to MRI (1.5T)examination of knee joint in the department ofRadiology & Imaging, BSMMU, Dhaka. At first theMRI films were evaluated by me and againreevaluated by competent radiologists of thedepartment. 44 patients were found to havemeniscal injury out of 50 clinically suspected pts.All the patients were then properly followed toknee arthroscopy. Then MRI findings andarthroscopic findings were compared. Thesensitivity, specificity, PPV, NPV & accuracy ofMR findings compared to arthroscopic findingswere then calculated.
Ethical Consideration:Prior to the commencement of this study, theresearch protocol was approved by the InstitutionalReview Board of BSMMU, Dhaka. The aims andobjectives of the study along with its procedure,risks and benefits of this study were explained tothe patients in easily understandable locallanguage and then informed consent (appendix)was taken from each patient.
Anatomy:The menisci of the knee are two C-shaped fibro-cartilaginous disks with concave superior surfacesthat articulate with the convex femoral condylesand flat inferior surfaces that set on the peripheralmargins of the tibial plateau. They are composedof collagen fibers that are primarily arrangedcircumferentially along the long axis of themeniscus, with fibers extending radially betweenthe circumferential fibers. They are thickperipherally and thin centrally and have sharpinner free edges. Up to one third of the peripheralmeniscus is vascularized and innervated, whereas
Bangladesh Journal of Radiology and Imaging Vol. 21(1): January 2013
10
the remaining inner two thirds or more is strictlyfibro-cartilaginous.
The menisci are arbitrarily divided into three parts:the anterior horn, the body, and the posterior horn.The menisci are connected by inter-meniscalligaments- anterior transverse meniscal ligament,posterior transverse meniscal ligament, andoblique menisco-meniscal ligament.
Procedure:All patients were queried regarding symptoms andthe knee was examined prior to scanning. Patientswere sent to MRI room. Appropriate MRI protocolof the knee joint was used. MR examination of theknee was performed in a medium field closed 1.5Tmagnet. The normal slice thickness was 03 mm.Sagittal T1 weighted, T2 weighted and PD, AxialT2 weighted, Coronal T1 weighted and STIRimages were obtained. The criterion that was usedfor determining the presence of a meniscal injurywas the presence of a high signal that extendedone of the borders of the meniscus and abnormalmeniscal morphology. MR examination of knee jointwas performed before arthroscopy was done.
Diagnostic Criteria:The diagnostic criteria for meniscal tears seen onknee MRIs – alteration of signal intensity (globularsignal, linear signal, regions of intermediate signalintensity with extension to the articular surfaceof the meniscus) and abnormal meniscalmorphology (blunting of tip of inner free edge ofmeniscus, displacement of a portion of themeniscus, interrupted appearance of the meniscus,abnormal size of a segment of meniscus)1.
Arthroscopic Comparison:The findings from clinical and MRI examinationwere available at the time of arthroscopy. Thenarthroscopic findings compared for true positive,true negative, false positive and false negative.
Data Analysis:After informing all the necessary informationregarding the research study, data were collectedin a pre-designed structured data collection sheets.Record of clinical, MRI and arthroscopic findingswere kept and compared. Data was entered into
computer package SPSS version 21 for statisticalanalysis. Sensitivity, specificity, positive predictive,negative predictive values and accuracy wascalculated using the 2×2 table.
Results:This cross sectional study was carried out in thedepartment of Radiology and Imaging incollaboration with department of Orthopaedics,BSMMU. In this study 50 clinically suspectedpatients of meniscal injury in knee joint wereenrolled as study population. All the studypopulations were gone through MRI as well asarthroscopic diagnosis of knee morphology
Out of all patients 68.0% were male and 32.0%were female. Male and female ratio was 2.13:1.
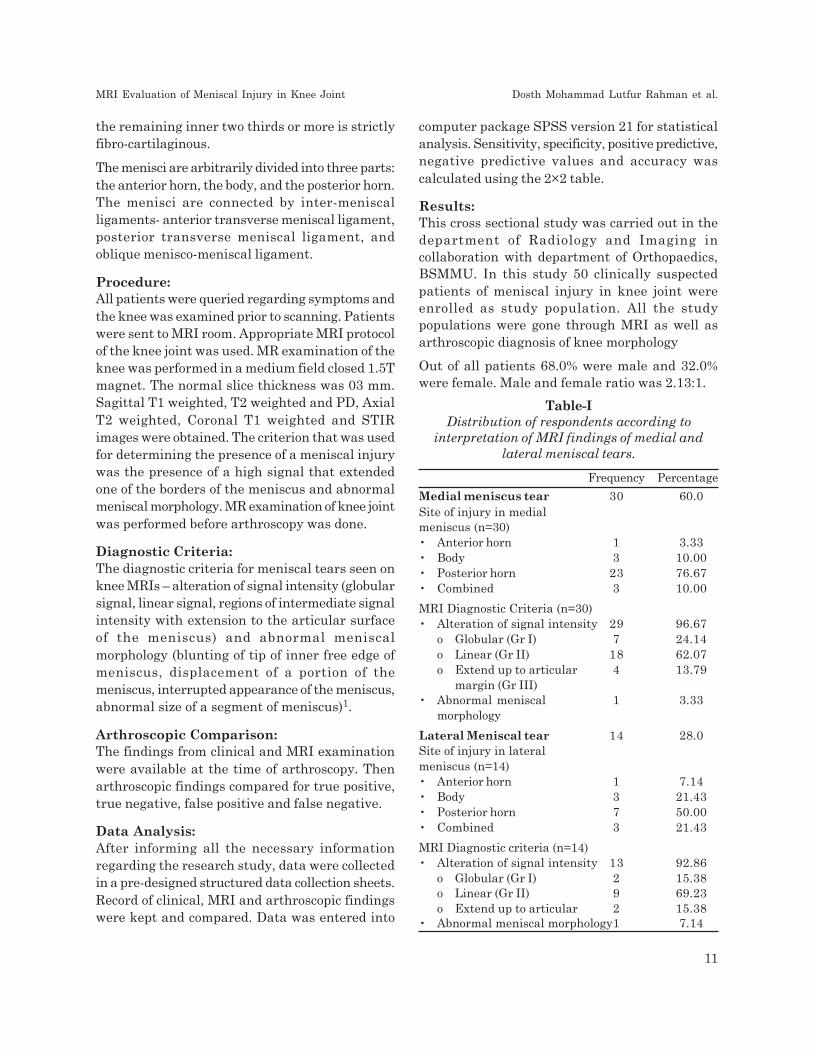
Table-IDistribution of respondents according to
interpretation of MRI findings of medial andlateral meniscal tears.
Frequency Percentage
Medial meniscus tear 30 60.0Site of injury in medialmeniscus (n=30)• Anterior horn 1 3.33• Body 3 10.00• Posterior horn 23 76.67• Combined 3 10.00
MRI Diagnostic Criteria (n=30)• Alteration of signal intensity 29 96.67
o Globular (Gr I) 7 24.14o Linear (Gr II) 18 62.07o Extend up to articular 4 13.79
margin (Gr III)• Abnormal meniscal 1 3.33
morphology
Lateral Meniscal tear 14 28.0Site of injury in lateralmeniscus (n=14)• Anterior horn 1 7.14• Body 3 21.43• Posterior horn 7 50.00• Combined 3 21.43
MRI Diagnostic criteria (n=14)• Alteration of signal intensity 13 92.86
o Globular (Gr I) 2 15.38o Linear (Gr II) 9 69.23o Extend up to articular 2 15.38
• Abnormal meniscal morphology1 7.14
MRI Evaluation of Meniscal Injury in Knee Joint Dosth Mohammad Lutfur Rahman et al.
11
A total of 50 patients were included in the study.They were divided into five groups according totheir age. The mean age was found 29.94 (9.16)years and range were (18-55) years.
Most of the patients were within 20-29 years agegroup which was 52% and followed by in 30- 39years group. The mean (SD) age was 29.94 (9.16)years.
All patients had complaint of pain in knee jointfollowed by 96% had difficulty in walking, 28% hadswelling in knee joint. Among all respondents, 80%had history of trauma in knee joint. Regarding themode of trauma, 44% were due to sports and restof them i,e, 36% were due to other than sportsinjury. Out of all patients, MRI findings of meniscaltear were positive in 44 (88%) patients. Amongthese findings, 48 % had meniscal tear alone and40% had meniscal tear with associated injury.Normal variants were found in 12% cases.
Table-I shows that out of all patients 60% hadmedial meniscal tear and 28% had lateral meniscaltear. Among all injury of medial meniscus 3.33%had in anterior horn, 10% in body, 76.67% had inposterior horn, 10% in combination. Of these 30patients 97.67% had alteration in signal intensity,and 3.33% had abnormal meniscal morphology. Inlateral meniscus 7.14% had injury in anterior horn,21.43% in body, 50% in posterior horn and 21.43%had combined injury.
In lateral meniscus 92.86% had alteration in signalintensity and 7.14% had abnormal meniscalmorphology.
Distribution of respondents according to MRIfindings of associated lesions of meniscal injuryshows joint effusion was found in 40% cases whichwere followed by 20% ACL injury and 15%combined injury.
Distribution of respondents according tointerpretation of arthroscopic findings shows outof all tear 50% had meniscal tear alone, 40% hadmeniscal tear with associated injury and 10% hadnormal variants.
On arthroscopy 62.0% had medial meniscal tearand 28.0 % had lateral meniscal tear. Frequency
of tear in medical meniscus was 6.45% in anteriorhorn, 9.68% in body, 70.97% in posterior horn and12.9% in combination. In lateral meniscus tearwas 7.14% in anterior horn, 21.43% in body, 57.14%in posterior horn and 14.29% in combination.
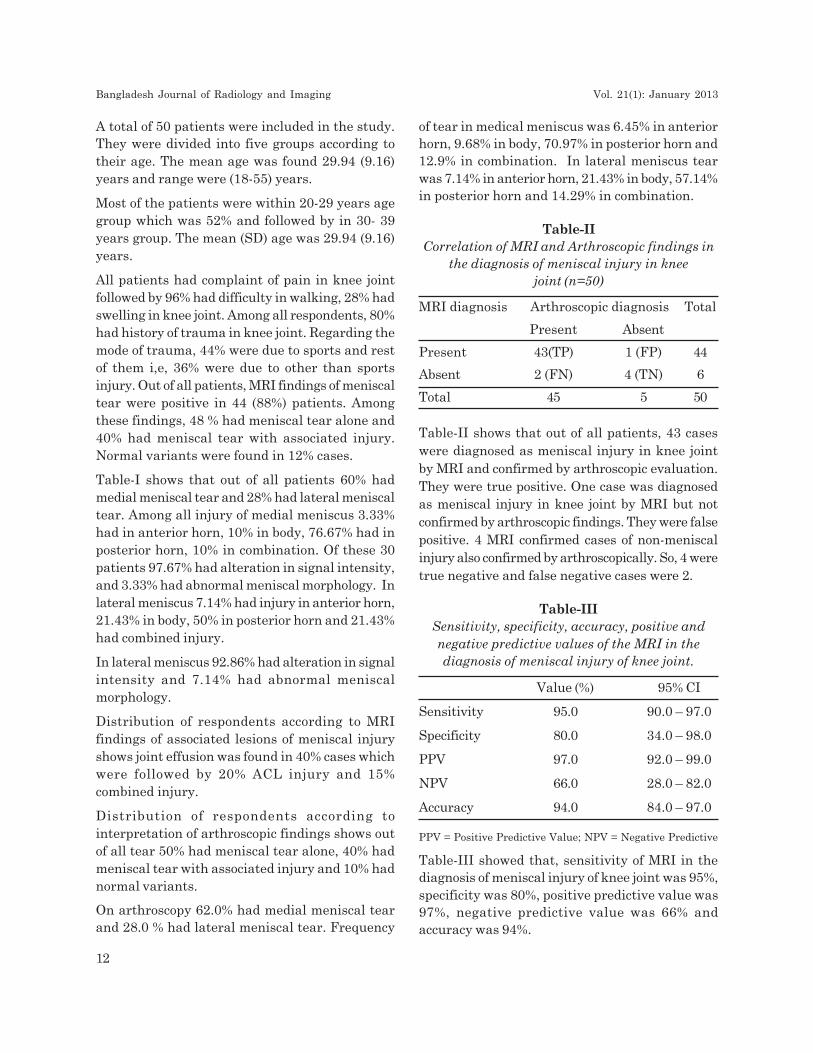
Table-IICorrelation of MRI and Arthroscopic findings in
the diagnosis of meniscal injury in kneejoint (n=50)
MRI diagnosis Arthroscopic diagnosis Total
Present Absent
Present 43(TP) 1 (FP) 44
Absent 2 (FN) 4 (TN) 6
Total 45 5 50
Table-II shows that out of all patients, 43 caseswere diagnosed as meniscal injury in knee jointby MRI and confirmed by arthroscopic evaluation.They were true positive. One case was diagnosedas meniscal injury in knee joint by MRI but notconfirmed by arthroscopic findings. They were falsepositive. 4 MRI confirmed cases of non-meniscalinjury also confirmed by arthroscopically. So, 4 weretrue negative and false negative cases were 2.
Table-IIISensitivity, specificity, accuracy, positive andnegative predictive values of the MRI in thediagnosis of meniscal injury of knee joint.
Value (%) 95% CI
Sensitivity 95.0 90.0 – 97.0
Specificity 80.0 34.0 – 98.0
PPV 97.0 92.0 – 99.0
NPV 66.0 28.0 – 82.0
Accuracy 94.0 84.0 – 97.0
PPV = Positive Predictive Value; NPV = Negative Predictive
Table-III showed that, sensitivity of MRI in thediagnosis of meniscal injury of knee joint was 95%,specificity was 80%, positive predictive value was97%, negative predictive value was 66% andaccuracy was 94%.
Bangladesh Journal of Radiology and Imaging Vol. 21(1): January 2013
12
Discussion:Magnetic Resonance Imaging (MRI) is one of thebest imaging method for non-invasive evaluationof knee pathology. It can detect intra-articular softtissue structures such as meniscus and otherligaments of the knee. Meniscal tears are acommon abnormality that led to knee pain.Arthroscopy is used as a gold standard for thediagnosis of meniscal tear. It acts as a referencein assessing other diagnostic tools. Here, theaccuracy of MRI in the evaluation of meniscal tearwas compared with arthroscopy.
This cross sectional study was carried out with anaim to establish the usefulness of MRI in diagnosisof meniscal tear as a non-invasive method.Clinically suspected patients of meniscal injury inknee joint lesions, who sought healthcare in theDepartment of Orthopedics and Department ofRadiology & Imaging, Bangabandhu Sheikh MujibMedical University (BSMMU), Dhaka, during theperiod from Jan 2011 to Dec 2013, were enrolledin the study.
This study included 50 patients who were clinicallysuspected of having meniscal injury in knee joint.The age ranged from 18 to 55 years and the meanage was 29.94 (SD-9.16) years. Of the total cases,52% patients were in age group of 20 – 29 years.Highest incidence of knee injury was observed inmale (68%) and the male female ratio was foundto be 2.13: 1.
In the present study all patients had complaint ofpain in knee joint followed by 96% had difficulty inwalking, 28% had swelling in knee joint. Amongrespondents, 80% had history of trauma in kneejoint. In the present series MRI revealed 44 (88%)patients had meniscal tear in knee joints. But outof all patients of present study 90% hadarthroscopically diagnosed meniscal tear.Sensitivity of MRI to diagnose meniscal tear ofknee joint was 95%, specificity 80%, positivepredictive value 97%, negative predictive value 66%and accuracy 94%. The overall accuracy for themenisci was found by Mink et al7 was 93% withsensitivity 95% and specificity 91%.Numkarunarunrote et al8 also found thesensitivity, specificity, and accuracy of the MRI as
81.3%, 88%, and 85% for the medial meniscus and80%, 97.2%, and 95.1% for the lateral meniscusand in overall it was 80.65 % sensitivity, 92.6 %specificity and 90.25 % accuracy. All these studiesare consistent with this current study. In someother studies MRI was proven to have an accuracyranging from 72-93.6% in meniscal tear evaluationas compared with arthroscopy9,10,11.
The posterior horn of meniscus was found to bethe most common location of meniscal tears in aprevious review by Canale et al 12. In our study,we also found that the posterior horn of medialmeniscus (23 patients) was the most commonlocation of meniscal tear. The second mostcommon location of meniscal tear was the posteriorhorn of the lateral meniscus (07 cases). The leastcommon location was anterior horn of lateralmeniscus (01 patient). About associated lesions inknee joint, joint effusion was the most commonfinding in MR Image. The other common findingswere anterior cruciate ligament injury, posteriorcruciate ligament injury, medial collateralligament injury, lateral collateral ligament injuryand bony contusion. Joint effusion was also foundby Numkarunarunrote et al8 as a major associatedknee abnormality 70% (19/27) on MRI findings. Theother associated knee abnormalities were alsoreported in several studies by different authorslike Berg et al13, Campbell et al14, Keene et al15,Paletta et al16 , Beall et al17 and Tarhan et al18.
Two false negative tears on MRI findings werefound in this study, one of them at anterior hornof medial meniscus and another at posterior hornof lateral meniscus which were described onarthroscopy as small tears. We supposed that thesetwo false negative tears were caused by limitationof the MRI in the detection of small meniscal tear,similar to Quin and Brown et al19 andNumkarunarunrote et al8. According to Quin andBrown19, MRI can miss small meniscal tears.However, it could be summarized that these weremissed by MRI because their sizes were small.
One false positive tear out of 45 patients in thisstudy was found on the posterior horn of themeniscus. This was similar to Mink et al2. Theyreported 47 false positive results with MRI out of
MRI Evaluation of Meniscal Injury in Knee Joint Dosth Mohammad Lutfur Rahman et al.
13

242 patients, 70% of which were in the posteriorhorn. Previous literature found two possible causesfor these false-positive findings. The first causemay be that some meniscal tears were missed atarthroscopy. After reviewing arthroscopyvideotapes, Quinn and Brown19 noted that thearthroscopists often were unable to visualizedirectly areas of menisci that appeared to be tornon MRI images. These areas of the menisci couldbe evaluated only indirectly with a probe, and thustears that were present and seen on MRI imagesmay not be detected by the arthroscopist. A secondcause for apparent false-positive findings on MRIimages may be that healed tears can havepersistent MRI signal that extends to the meniscalsurface
In this study, one false positive tear was foundthat was characterized as flap tear with mediallydisplaced meniscal fragment, explained cause offalse positive result of this type of tear. Differentauthors19 suggested osteophytes, ligamentfragments, and loose bodies may mimic displacedmeniscal fragment.
In our study sensitivity of MRI to diagnosemeniscal tear of knee joint was 95%, specificitywas 80%, positive predictive value was 97%,negative predictive value was 66% and accuracywas 94%. Winters and Tregonning10 found accuracyof MRI in the diagnosis of medial and lateralmeniscus tear were 90% and 82% respectively,sensitivities were 87% and 46% respectively,specificities were 92%, and 91% respectively whichare almost similar to our results.
High sensitivity, specificity and accuracy of MRIin the diagnosis of meniscal tear in knee jointconfirm that MRI is a useful non-invasivediagnostic modality for meniscal injury.
Conclusion:Now a days Magnetic resonance imaging (MRI) hasbeen recognized as the imaging method for non-invasive evaluation of knee pathology, particularlymeniscus and ligaments. This cross sectional studywas aimed to evaluate MRI in diagnosis of meniscalinjury in knee joint compared with arthroscopy inperspective of Bangladesh. For this, 50 clinically
suspected patients of meniscal lesion of knee jointwere enrolled. This study was carried out in theDepartment of Radiology and Imaging and theDepartment of Orthopaedics, Bangabandhu SheikhMujib Medical University (BSMMU), Dhaka duringthe period from Jan 2011 to Dec 2013.
MRI findings of the present study correlated wellin most of the cases with the arthroscopic results.It can therefore be concluded that MRI is a usefulmodality in the evaluation of meniscal lesion ofknee joint.
References:1. Haaga JR, Vikram S. Dogra VS, Forsting
M, Gilkeson RC, Ha HK, Sundaram M, 2009,CT AND MRI of the whole body, Fifth editionMosby, Inc., Philadelphia, PA 19103-2899
2. Mink JH, Levy T, Creus JV, 1988, ‘Tears ofthe anterior cruciate ligament and menisciof the knee: MRI imaging evaluation’,Radiology, vol. 167; pp. 769-74
3. Rath E, Richmond JC, 2000, ‘The menisci:Basic science and advances in treatment.’, BrJ Sports Med, vol. 34; pp. 252-7
4. Sharma UK , Shrestha BK, Rijal S,Bijukachhe B, Barakoti R, Banskota B,Pradhan I, Banskota AK, 2011, ‘Clinical, MRIand arthroscopic correlation in internalderangement of knee’, Kathmandu Univ MedJ vol. 35, no. 3, pp. 174-8
5. Beaman FD, Peterson JJ, 2007, ‘MR imagingof cysts, ganglia, and bursae about the knee’,Radiol Clin North Am vol. 45, pp. 969–82.
6. Fischer SP, Fox JM, Del PW, Friedman MJ,Snyder SJ, Fenkel RD, 1991, ‘ Accuracy ofdiagnoses from magnetic resonance imagingof the knee’, J Bone Joint Surg, vol.73, pp. 2-10.
7. Munk B, Madsen F, Lundorf E, StaunstrupH, Schmidt SA, Bolvig L et al., 1998, ‘Clinicalmagnetic resonance imaging and arthroscopicfindings in knees: a comparative prospectivestudy of meniscus anterior cruciate ligamentand cartilage lesions.’, Arthroscopy, vol. 14,no. 2, pp.171-5.
Bangladesh Journal of Radiology and Imaging Vol. 21(1): January 2013
14
8. Numkarunarunrote N, Sanpatchayaponga A,Yuktanandanab P, Kuptniratsaikulb S, 2010,‘Magnetic resonance imaging in theevaluation of meniscal tear’, AsianBiomedicine, vol. 4, pp. 215-22.
9. Raunest J, Oberle K, Loehnert J, HoetzingerH, 1991, ‘ The clinical value of magneticresonance imaging in the evaluation ofmeniscal disorders’, J Bone Joint Surg (Am),vol. 73; pp. 11-6.
10. Winters K, Tregonning D, 2005, Reliability ofmagnetic resonance imaging of the traumaticknee as determined by arthroscopy’, N Z MedJ, vol. 118, no 1209, pp. 1301
11. Rappeport ED, Wieslander SB, StephensenS, Lausten GS, Thomsen HS, 1997, ‘MRIpreferable to diagnostic arthroscopy in kneejoint injuries’, Acta Orthop Scand, vol. 68, pp.277-81.
12. Canale ST, Beaty JH, 2008, Campbell’soperative orthopaedics 11th ed. Pensylvania(USA): Mosby & Elsevier. pp. 2421.
13. Berg BV, Melghem J, Poilvache P, MaldagueB, Lecouvet FE, 2005, ‘Meniscal tears withfragments displaced in notch and recesses ofknee: MR imaging with arthroscopiccomparison’, Radiology, vol. 234, pp. 842-5
14. Campbell SE, Sanders TG, Morrison WB,2001, ‘MR imaging of meniscal cyst: incidence,
location, and clinical significance’, Am JRadiology, vol. 177, pp. 409-13.
15. Keene GC, Bikerstaff D, Rae PJ, PatersonRS, 1993, ‘The natural history of meniscaltears in anterior cruciate ligamentinsufficiency’, Am J Sports Med, vol. 21,pp.672-9.
16. Paletta GA, Levine DS, O’Brien SJ,Wickiewicz TL, 1992, ‘Patterns of meniscalinjury associated with acute anterior cruciateligament injury in skiers’, Am J Sports Med,vol. 20; pp.542-7.
17. Beall DP, Googe JD, Moss JT, Ly JQ, Greer
BJ, Stapp AM, Martin HD, 2007, ‘Magneticresonance imaging of the collateral ligamentsand the anatomic quadrants of the knee’,Radiologic Clinics North America, vol. 45; pp.983-1002
18. Tarhan NC, Chung CB, Mohana-Borges AV,Hughes T, ResWangwinyuvirat M, Dirim B,Pastore D, et al., 2009, ‘Prepatellar quadricepscontinuation: MRI of cadavers with grossanatomic and histologic correlation.’, AJR AmJ Roentgenol, vol. 192, pp. 111–6.
19. Quinn SF and Brown TF, 1991, ‘Meniscal tears
diagnosed with MR imaging versusarthroscopy: how reliable a standard isarthroscopy’, Radiology, vol. 181; pp.843.
MRI Evaluation of Meniscal Injury in Knee Joint Dosth Mohammad Lutfur Rahman et al.
15
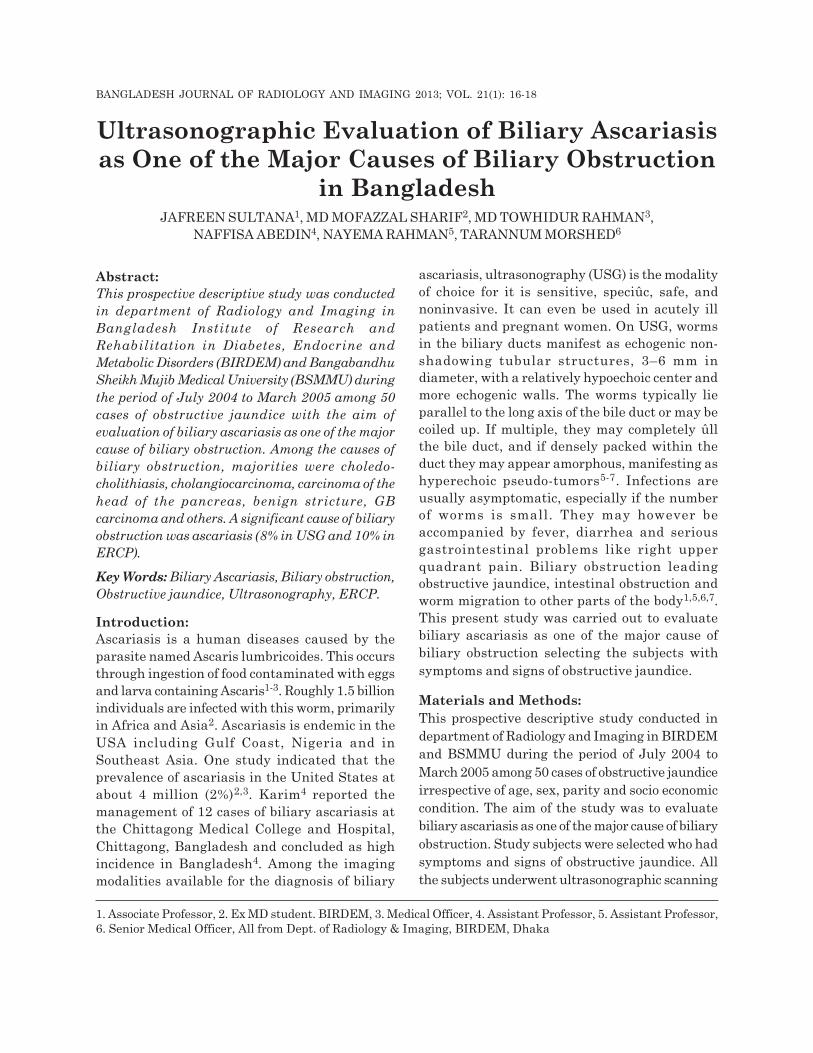
Abstract:This prospective descriptive study was conductedin department of Radiology and Imaging inBangladesh Institute of Research andRehabilitation in Diabetes, Endocrine andMetabolic Disorders (BIRDEM) and BangabandhuSheikh Mujib Medical University (BSMMU) duringthe period of July 2004 to March 2005 among 50cases of obstructive jaundice with the aim ofevaluation of biliary ascariasis as one of the majorcause of biliary obstruction. Among the causes ofbiliary obstruction, majorities were choledo-cholithiasis, cholangiocarcinoma, carcinoma of thehead of the pancreas, benign stricture, GBcarcinoma and others. A significant cause of biliaryobstruction was ascariasis (8% in USG and 10% inERCP).
Key Words: Biliary Ascariasis, Biliary obstruction,Obstructive jaundice, Ultrasonography, ERCP.
Introduction:Ascariasis is a human diseases caused by theparasite named Ascaris lumbricoides. This occursthrough ingestion of food contaminated with eggsand larva containing Ascaris1-3. Roughly 1.5 billionindividuals are infected with this worm, primarilyin Africa and Asia2. Ascariasis is endemic in theUSA including Gulf Coast, Nigeria and inSoutheast Asia. One study indicated that theprevalence of ascariasis in the United States atabout 4 million (2%)2,3. Karim4 reported themanagement of 12 cases of biliary ascariasis atthe Chittagong Medical College and Hospital,Chittagong, Bangladesh and concluded as highincidence in Bangladesh4. Among the imagingmodalities available for the diagnosis of biliary
ascariasis, ultrasonography (USG) is the modalityof choice for it is sensitive, speciûc, safe, andnoninvasive. It can even be used in acutely illpatients and pregnant women. On USG, wormsin the biliary ducts manifest as echogenic non-shadowing tubular structures, 3–6 mm indiameter, with a relatively hypoechoic center andmore echogenic walls. The worms typically lieparallel to the long axis of the bile duct or may becoiled up. If multiple, they may completely ûllthe bile duct, and if densely packed within theduct they may appear amorphous, manifesting ashyperechoic pseudo-tumors5-7. Infections areusually asymptomatic, especially if the numberof worms is small. They may however beaccompanied by fever, diarrhea and seriousgastrointestinal problems like right upperquadrant pain. Biliary obstruction leadingobstructive jaundice, intestinal obstruction andworm migration to other parts of the body1,5,6,7.This present study was carried out to evaluatebiliary ascariasis as one of the major cause ofbiliary obstruction selecting the subjects withsymptoms and signs of obstructive jaundice.
Materials and Methods:This prospective descriptive study conducted indepartment of Radiology and Imaging in BIRDEMand BSMMU during the period of July 2004 toMarch 2005 among 50 cases of obstructive jaundiceirrespective of age, sex, parity and socio economiccondition. The aim of the study was to evaluatebiliary ascariasis as one of the major cause of biliaryobstruction. Study subjects were selected who hadsymptoms and signs of obstructive jaundice. Allthe subjects underwent ultrasonographic scanning
Ultrasonographic Evaluation of Biliary Ascariasisas One of the Major Causes of Biliary Obstruction
in BangladeshJAFREEN SULTANA1, MD MOFAZZAL SHARIF2, MD TOWHIDUR RAHMAN3,
NAFFISA ABEDIN4, NAYEMA RAHMAN5, TARANNUM MORSHED6
1. Associate Professor, 2. Ex MD student. BIRDEM, 3. Medical Officer, 4. Assistant Professor, 5. Assistant Professor,6. Senior Medical Officer, All from Dept. of Radiology & Imaging, BIRDEM, Dhaka
BANGLADESH JOURNAL OF RADIOLOGY AND IMAGING 2013; VOL. 21(1): 16-18

of hepatobiliary system. Also ERCP examinationwas performed in these cases for confirmation.
Results:Among 50 subjects, 56% were male and 44% werefemale. Majority of the subjects were from 50 yearsand above age group (Table 1). Major clinicalfindings were jaundice (100%), upper abdominalpain (96%), nausea and vomiting (86%) and itching(80%). Regarding the causes of biliary obstruction,majorities were choledocholithiasis,cholangiocarcinoma, carcinoma of the head of thepancreas, benign stricture, GB carcinoma andothers (Table 2). A significant cause of biliaryobstruction was ascariasis (8% in USG and 10% inERCP).
Table-IIncidence in different age groups (n=50).
Age in year n %
<30 04 08
31-50 20 40
51 and above 26 52
Table-IICause of biliary obstruction (n=50).
Diseases Ultrasonography ERCP
n % n %
Ascariasis 04 08 05 10
Choledocholithiasis 09 18 11 22
Cholangiocarcinoma 05 10 08 16
Carcinoma of head 10 20 06 12of pancreas
Periampulary 05 10 07 14carcinoma
Benign stricture 04 08 06 12
Gall bladder 03 06 00 00carcinoma
Choledochal cyst 01 02 02 04
Unknown aetiology 09 18 03 06
Papillary stenosis 00 00 02 04
Discussion:Obstructive jaundice is a fairly common conditionin our country and the incidence of the disease isslightly common in males. Considering the benignand malignant disease causing biliary obstruction,the incidence of malignant disease is more commonin males except secondary involvement of the bileduct by GB carcinoma which is more common infemales. The study revealed that high incidenceof biliary ascariasis causing biliary obstructioncompared to previous studies. The smaller
Fig.-1: Biliary obstruction in a 40 years femalepatient with mildly dilated intrahepatic biliarytrees; USG shows worms inside GB and CBD,which was confirmed by ERCP.
Fig.-2: Biliary obstruction in a 60 years femalepatient; Ultrasonography suggested biliaryascariasis with cholelithiasis; It was later confirmedby ERCP.
Ultrasonographic Evaluation of Biliary Ascariasis as One of the Major Causes Jafreen Sultana et al.
17
percentage of biliary ascariasis was reported byKolt et al8 and Ng et al9. In present study thecause of higher incidence was possibly related tomore prevalence of intestinal ascariasis inBangladesh. Ultrasonography detected 4 cases ofbiliary ascariasis, whereas ERCP detected 5 cases.Among the five cases ERCP revealed 3 causes ofobstruction was caused not only due to worm butalso due to associated stricture in bile duct. In twoof these cases worms were seen both in GB andCBD. One case showed cholelithiasis,choledocholithiasis as well as multiple worms inCBD. In other cases worms were observed in rightand left hepatic duct. As the general objective ofthe study was to evaluate biliary ascariasis as amajor cause of biliary obstruction, other causesare not discussed here. It can be concluded thatduring evaluation of a case of obstructive jaundice,biliary ascariasis should be kept in mind and whena case of biliary ascariasis is found, number ofworms, viability, location of the worm within thebiliary tree and other associated biliary pathologyshould be evaluated.
Conclusion:Although Ascariasis a simple medical condition, ifremains untreated may cause significant morbidityto the patient like obstructive jaundice. So, theradiologist, who is performing the sonographymust keep in mind that there is high incidence ofAscariasis in our country and ultrasonography isa reliable method to diagnose Ascariasis.
References:1. Williams-Blangero S, VandeBerg JL, Subedi
J et al. (April 2002). Ascariasis Infection, Proc.Natl. Acad. Sci. U.S.A. 99 (8): 5533–8.
2. Berger SA, Marr JS. Human ParasiticDiseases Sourcebook. Jones and BartlettPublishers: Sudbury, Massachusetts, 2006.
3. Omar J, Showkat A, Irfan R, Biliary Ascariasis:A Review, World J Surg (2006) 30: 1500–1506.
4. Karim MR, Biliary ascariasis, Int Surg, 1991Jan-Mar; 76(1): 27-9.
5. Sannai FM et al, Biliary ascariasis: Report ofa complicated case and literature review,Saudi Journal of Gastroenterology, (2007), Vol13 (1), pp. 25-32.
6. Gabaldon A, Mofid C, Morishta K, MoskovskiS, Sankale M, Standen DD. Control ofascariasis (report of WHO committee). WorldHealth Organ Tech Rep Ser 1967; 379:1-39
7. Crompton DW, Nesheim MC, Pawlowski ZS,editors. Ascariasis and its prevention andcontrol. Taylor and Francis: London; 1989.
8. Colt SD, Wirth PD,Speer AG, Biliaryascariasis—a worm in the duct, Med J Aust1991 May 6;154(9):629-30.
9. Ng KK, Wong HF, Kong MS, Chiu LC, TanCF, Wan YL. Biliary ascariasis: MRCholangiography Findings in Two Cases,Korean J Radiol. 2001 Jul-Sep; 2(3): 175–178.
Bangladesh Journal of Radiology and Imaging Vol. 21(1): January 2013
18
Abstract:This study was performed to observe thesonographically assessed alteration of size &echogenicity of pancreas in type-II diabeticpatients. This cross sectional study wasperformed on type-II diabetic patients in thedepartment of Radiology & Imaging, BIRDEMfrom July’ 2008 to May’2009. Patients werereferred from Department of Medicine OPDBIRDEM for ultrasonogram of abdomen. Total140 consecutive diabetic patients were includedin this study. In all patient Size of pancreas wererecorded by Ultrasonogram. Pearson’s correlationcoefficient test was used to find out the relationshipbetween the variables. This study was carried outin 140 type-II diabetic patients. In all patient sizeof pancreas were recorded by Ultrasonogram. Theduration of diabetes was 1-25 years in Type-IIdiabetes. Duration of diabetes was calculated inyears and size of pancreas was measured in mm.Significant negative correlation was foundbetween duration of diabetes and size of head,body & tail of pancreas in Type-II diabetic patients.In this study it was observed that pancreatic sizewas reduced in Type-II patients in relation toduration of diabetes. Significant negativecorrelation was found between duration of diabetesand size of pancreas in Type-II diabetic patients.So from the findings of the present work, it can besaid that this study may help to find out importantparameters regarding sonographic evaluation ofpancreas in diabetes which can be used in routinepractice. But any definite conclusion, biggerappropriate study should be done.
Introduction:Type-II diabetes mellitus (DM) is characterized byhyperglycemia, insulin resistance, and relativeimpairment in insulin secretion. It is a commondisorder with a prevalence that rises markedly withincreasing degrees of obesity 1.The prevalence oftype-II diabetes has risen alarmingly in the pastdecade 2 .In large parts it is linked to the trends inobesity and sedentary lifestyle 3.
The prevalence of diabetes mellitus continues toincrease worldwide, especially in Asia 4. In 2010,an estimated 140 million people living in Asia hadDM and globally 60% of the people with DM wereof Asian descent 5 .In addition, to a possible geneticpredisposition, other environmental factors, havebeen identified as contributing to the DM epidemicin Asia. These includes rapid socioeconomic change,urbanization, sedentary lifestyle, and changes indietary patterns. Recent epidemiological studieshave shown an increased prevalence of DM in India(12.1%), Pakistan (11.1%), and China (6.1%) 6-8.
In recent years, Bangladesh has experienced rapidurbanization 9-10. A number of population basedstudies conducted in Bangladesh have revealed anincreasing prevalence of DM in both rural andurban populations 11-13.
Diabetes occurs world- wide and the incidence ofboth type 1 and type-II diabetes are rising: It isestimated that in the year 2000,171 million peoplehad diabetes and this is expected to double by 2030.This global pandemic principally involves type-IIdiabetes, to which several factors contributeincluding greater longevity, obesity, unsatisfactory
Correlation of Sonographic Assessment ofPancreatic Size & Echogenicity in Type-IIDiabetic Patients to Duration of DiabetesMOHAMMAD MAHBUB HOSSAIN1, MAHMUDA MONOWARA2, ADITI MODOK3,
AFROZA BEGUM4, MD SHAHIDUL ISLAM5, SURONJIT SAHA6, SAHARA HAQUE7
1 & 2. Assistant Professor, Dept. of Radiology & Imaging, Dhaka Shishu Hospital. 3. Consultant, Dept. of Radiology& Imaging, Green Life Medical College & Hospital. 4. Radiologist, Dept. of Radiology & Imaging, Dhaka MedicalCollege. 5. Assistant Professor, Dept. of Radiology & Imaging, Dhaka Medical College. 6. Consultant, Dhaka PoliceHospital, Dhaka. 7. Associate Professor, Dept. of Radiology & Imaging, Dhaka Medical College.
BANGLADESH JOURNAL OF RADIOLOGY AND IMAGING 2013; VOL. 21(1): 19-25
diet, sedentary life style and increasingurbanization 14 .
The prevalence of both type of diabetes variesconsiderably around the world. The prevalence ofknown diabetes in Britain around 2-3%, but ishigher in the Middle and Far East (e.g, 12% inIndian subcontinent) 14. In Europe and NorthAmerica the ratio of type-II to type I isapproximately 7:3 14.
Type-II diabetes is now a global health problem15.The recent World Health Organization (WHO)report on the prevalence of diabetes mellitus haspresented an alarming picture of a global epidemicof type-II diabetes (1997). It is posing a seriousthreat to entire population of the world irrespectiveof stages of industrialization and development. Theincreasing prevalence of diabetes mellitus forSouth East Asian Region (SEAR), was estimatedfrom the observed prevalence in 1995 that projectedto 2000 and 2025. This trend observed two foldsincrease in the developed and almost three foldsin the developing nations 16. It is said that thedeveloping countries will bear the brunt of diabetesepidemics in 21 century (WHO 1997) 17.
The non communicable diseases like diabetes,hypertension is emerging as a major healthproblem in Bangladesh. Among these, theprevalence of diabetes is increasing rapidly. Inrecent time, there is no study on prevalence ofthese diseases in our country. Some population-based studies conducted in Bangladesh in differenttime and have revealed the increasing trends ofdiabetes prevalence ranging from 1.5 to 3.8% inrural communities 18-19.
In Bangladesh, these non communicable diseasesare emerging as a major health problems and thegovernment has given them high researchpriority20. It must be mentioned that a vastmajority (77.6%) of the national population livesin rural area 10. The prevalence of diabetes in theurban population has increased alarmingly inrecent years. Older age, obesity, higher income,family history of diabetes and reduced physicalactivity were proved to be the significant riskfactors for diabetes12.
It is already reported that increasing prevalenceof diabetes and its complications in the developingcommunities would pose a real threat in respectto their existing health care service. As with theincreasing number of diabetic patients more andmore will need specialized diabetic care, and failureto provide the care they will develop morecomplications like CHD, diabetic foot, chronic renalfailure and blindness21.
Type-II diabetes mellitus which is characterizedby disturbance of insulin secretion, peripheralresistance to insulin and overproduction of glucoseby liver 22.
The main methods for evaluation of diabetesmellitus are different laboratory tests and radiologyto study the complications of disease in otherorgans. Ultrasonography is a non invasive imagingmodality which is used for the evaluation of normalpancreas and different disorders of this gland. Asit is cost effective and lack of side effect, it is usedas the primary method of assessment of probablepancreatic disease.
Changes of pancreas in different types of diabetesmellitus can be assessed by ultrasonography.Evaluation of alterations of pancreas in diabetes
mellitus during imaging may be helpful in theassessment of disease progression which can behelp in further management.
Diabetes mellitus is an important health problemin our country and ultrasonography is widely usedpopular imaging modality. Thus radiologist canplay important role by evaluating different aspectof pancreatic morphological alterations indiabetics.
Materials and Methods:This cross sectional study was performed on type-
II diabetic patients in the department of Radiology& Imaging, BIRDEM from July’ 2008 to May’2009.Patients were referred from Department ofMedicine OPD BIRDEM for ultrasonogram ofabdomen. Total 140 consecutive diabetic wereincluded in this study. In all patient Size of pancreaswere recorded by Ultrasonogram.
Bangladesh Journal of Radiology and Imaging Vol. 21(1): January 2013
20
Selection of the patientsInclusion criteria –
Known cases of Type-II diabetes mellitus.
Exclusion criteria1) Subjects with other chronic disease including
cirrosis, pancreatitis, pancreatic tumor orFatty change in Liver.
2) Diabetic subjects who had no diabeticguidebook.
3) Very obese persons.
Data Collection and measurementBefore ultrasonogram examination, propercounseling and reassurance to the patientregarding the examination procedure was done toreduce the apprehension and to get full co-operation. Then each subject was placed supine.Gray scale image was performed to obtain the Sizeof head, body, tail of pancreas. Echogenicity of thepancreas is also be recorded.
Statistical Analysis of DataStatistical analysis of the results were done bycomputer software devised as the statisticalpackage for social scientist (SPSS). The results werepresented in Tables, Figures, and Diagrams etc.For significance of differences were done usingpearsons correlation test. A ‘p’ value <0.05 wasconsidered as significant.
Result:This study was carried out in 140 subjects. In allpatient size of pancreas were recorded byUltrasonogram. All these subjects were divided intodifferent age group. The age was ranged from 29to 78 years in type-II diabetes mellitus. Theduration of diabetes was 1-25 years in Type-IIdiabetics. Duration of diabetes was calculated inyears and size of pancreas was measured in mm.Significant negative correlation was found betweenduration of diabetes and size of head, body & tailof pancreas in Type-II diabetic patients.Echogenicity of the pancreas is increased with theduration of the diabetes which maintained apositive correlation.
Table-IMean distribution of sonographically measured
head, body and tail of pancreas of the studyPatients (n=140)
Type-II (n=140)Mean±SD
Head of pancreas (mm) 17.9±3.4
Range (7-25)Body of pancreas (mm) 10.5±2.4
Range (7-15)Tail of pancreas (mm) 15.4±2.5
Range (8-20)
Table-IIDuration diabetes of the study Patient (n=140)
Duration of DM Type-II (n=140)
n %
<10 years 68 48.6
>10 years 72 51.4Mean± SD 10.4±6.6Range (1-25)
Table-IIICorrelation of pancreatic echogenicity in Type-II
diabetes with duration of Diabetes (n=140)
Echogenicity Type-II (n=140)Mean ±SD(yrs)
Normal 3.1±1.6
Range (1-6)Increased 11.4±5.3
Range (2-25)Increased heterogeneous 16.9±3.6
Range (13-25)
In Type-II diabetes normal echogenicity ofpancreas was observed with mean deviation ofdiabetes of 3.1 ±1.6 years, ranged from 1 to 6 years.The mean duration of diabetes of increasedechogenicity was 11.4 ±5.3 years, ranged from 2 to25 years in Type-II diabetes. The mean durationof diabetes of increased echogenicity withheterogeneous texture was 16.9 ±3.6 years, rangedfrom 13 to 25 years in Type-II diabetes
Correlation of Sonographic Assessment of Pancreatic Size Mohammad Mahbub Hossain et al.
21
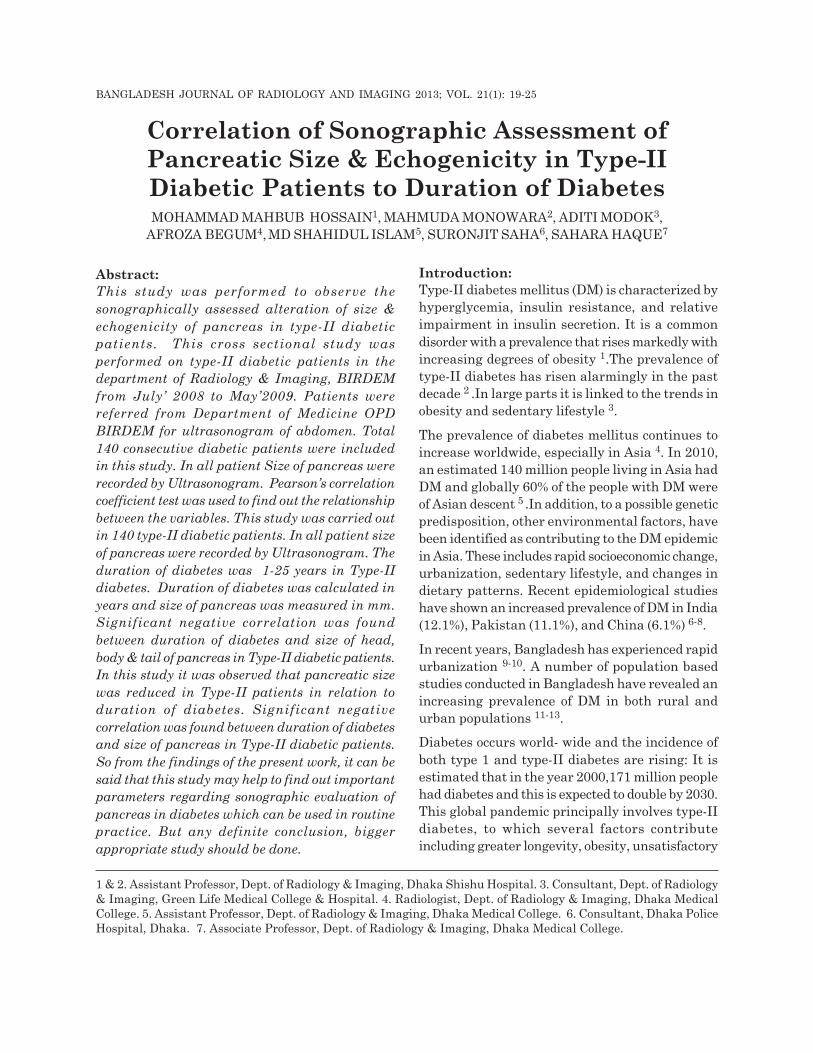
Figure 2 shows the correlation between durationof diabetes and size of body of pancreas in Type-IIdiabetic patients (n=140). Duration of diabetes wascalculated in years and size of body of pancreaswas measured in mm. Significant negativecorrelation was found between duration of diabetesand size of body of pancreas in Type-II diabeticpatients. The value of Pearson’s correlationcoefficient was r=-0.7512 which is highly significant(p<0.001). Therefore, there was linear negativecorrelation between duration of diabetes and sizeof body of pancreas in Type-II diabetic patients(Figure 2).
Figure 3 shows correlation between duration ofdiabetes and size of tail of pancreas in Type-IIdiabetic patients (n=140). Duration of diabetes wascalculated in years and size of tail of pancreas wasmeasured in mm. Significant negative correlationwas found between duration of diabetes and sizeof tail of pancreas in Type-II diabetic patients. Thevalue of Pearson’s correlation coefficient was r=-0.4780 which is significant (p<0.001). Therefore,there was linear negative correlation betweenduration of diabetes and size of tail of pancreas inType-II diabetic patients (Figure 3).
Figure 1 shows the correlation between durationof diabetes and size of head of pancreas in Type-IIdiabetic patients (n=140). Duration of diabetes wascalculated in years and size of head of pancreaswas measured in mm. Significant negativecorrelation was found between duration of diabetesand size of head of pancreas in Type-II diabeticpatients. The value of Pearson’s correlationcoefficient was r=-0.6091 which is highly significant(p<0.001). Therefore, there was linear negativecorrelation between duration of diabetes and sizeof head of pancreas in Type-II diabetic patients(Figure 1).
Fig.-1: The scatter diagram shows significantrelationship (r=-0.6091) between duration ofdiabetes and size of head of pancreas in Type-IIdiabetic patients.
Fig.-2: The scatter diagram shows significantrelationship (r=-0.7512) between duration ofdiabetes and size of body of pancreas in Type-IIdiabetic patients.
Fig.-3: The scatter diagram shows significantrelationship (r=-0.4780) between duration ofdiabetes and size of tail of pancreas in Type-IIpatient
Bangladesh Journal of Radiology and Imaging Vol. 21(1): January 2013
22
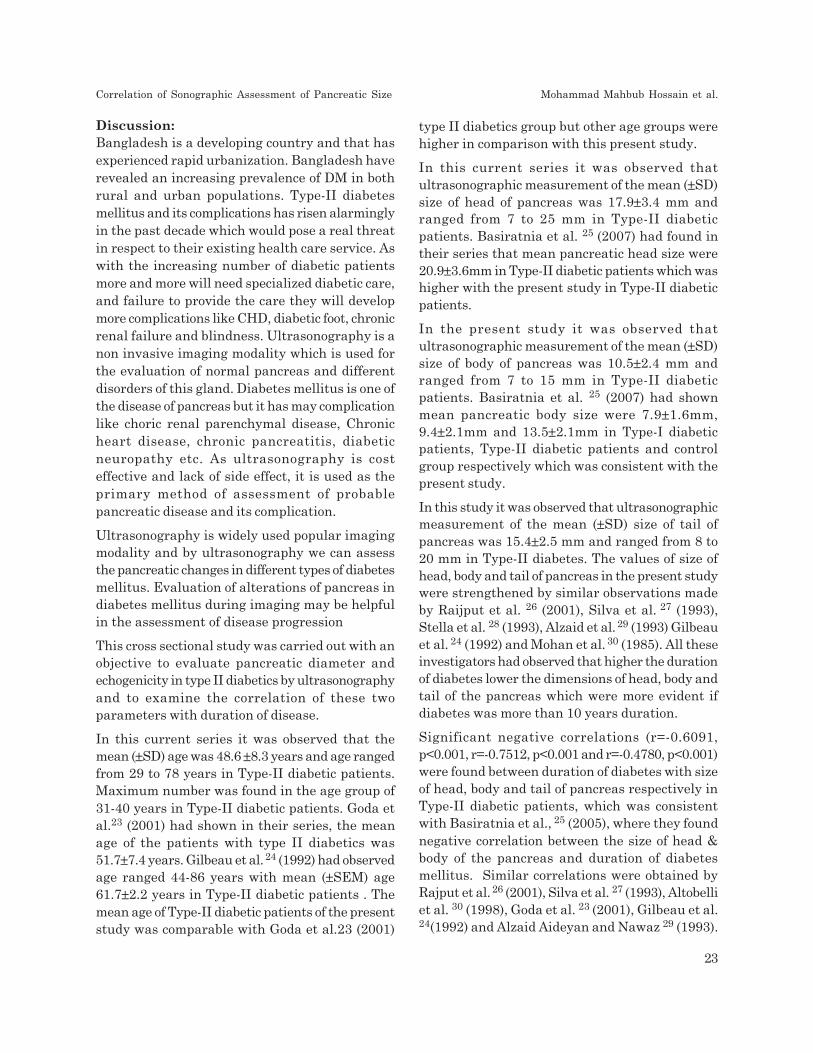
Discussion:Bangladesh is a developing country and that hasexperienced rapid urbanization. Bangladesh haverevealed an increasing prevalence of DM in bothrural and urban populations. Type-II diabetesmellitus and its complications has risen alarminglyin the past decade which would pose a real threatin respect to their existing health care service. Aswith the increasing number of diabetic patientsmore and more will need specialized diabetic care,and failure to provide the care they will developmore complications like CHD, diabetic foot, chronicrenal failure and blindness. Ultrasonography is anon invasive imaging modality which is used forthe evaluation of normal pancreas and differentdisorders of this gland. Diabetes mellitus is one ofthe disease of pancreas but it has may complicationlike choric renal parenchymal disease, Chronicheart disease, chronic pancreatitis, diabeticneuropathy etc. As ultrasonography is costeffective and lack of side effect, it is used as theprimary method of assessment of probablepancreatic disease and its complication.
Ultrasonography is widely used popular imagingmodality and by ultrasonography we can assessthe pancreatic changes in different types of diabetesmellitus. Evaluation of alterations of pancreas indiabetes mellitus during imaging may be helpfulin the assessment of disease progression
This cross sectional study was carried out with anobjective to evaluate pancreatic diameter andechogenicity in type II diabetics by ultrasonographyand to examine the correlation of these twoparameters with duration of disease.
In this current series it was observed that themean (±SD) age was 48.6 ±8.3 years and age rangedfrom 29 to 78 years in Type-II diabetic patients.Maximum number was found in the age group of31-40 years in Type-II diabetic patients. Goda etal.23 (2001) had shown in their series, the meanage of the patients with type II diabetics was51.7±7.4 years. Gilbeau et al. 24 (1992) had observedage ranged 44-86 years with mean (±SEM) age61.7±2.2 years in Type-II diabetic patients . Themean age of Type-II diabetic patients of the presentstudy was comparable with Goda et al.23 (2001)
type II diabetics group but other age groups werehigher in comparison with this present study.
In this current series it was observed thatultrasonographic measurement of the mean (±SD)size of head of pancreas was 17.9±3.4 mm andranged from 7 to 25 mm in Type-II diabeticpatients. Basiratnia et al. 25 (2007) had found intheir series that mean pancreatic head size were20.9±3.6mm in Type-II diabetic patients which washigher with the present study in Type-II diabeticpatients.
In the present study it was observed thatultrasonographic measurement of the mean (±SD)size of body of pancreas was 10.5±2.4 mm andranged from 7 to 15 mm in Type-II diabeticpatients. Basiratnia et al. 25 (2007) had shownmean pancreatic body size were 7.9±1.6mm,9.4±2.1mm and 13.5±2.1mm in Type-I diabeticpatients, Type-II diabetic patients and controlgroup respectively which was consistent with thepresent study.
In this study it was observed that ultrasonographicmeasurement of the mean (±SD) size of tail ofpancreas was 15.4±2.5 mm and ranged from 8 to20 mm in Type-II diabetes. The values of size ofhead, body and tail of pancreas in the present studywere strengthened by similar observations madeby Raijput et al. 26 (2001), Silva et al. 27 (1993),Stella et al. 28 (1993), Alzaid et al. 29 (1993) Gilbeauet al. 24 (1992) and Mohan et al. 30 (1985). All theseinvestigators had observed that higher the durationof diabetes lower the dimensions of head, body andtail of the pancreas which were more evident ifdiabetes was more than 10 years duration.
Significant negative correlations (r=-0.6091,p<0.001, r=-0.7512, p<0.001 and r=-0.4780, p<0.001)were found between duration of diabetes with sizeof head, body and tail of pancreas respectively inType-II diabetic patients, which was consistentwith Basiratnia et al., 25 (2005), where they foundnegative correlation between the size of head &body of the pancreas and duration of diabetesmellitus. Similar correlations were obtained byRajput et al. 26 (2001), Silva et al. 27 (1993), Altobelliet al. 30 (1998), Goda et al. 23 (2001), Gilbeau et al.24(1992) and Alzaid Aideyan and Nawaz 29 (1993).
Correlation of Sonographic Assessment of Pancreatic Size Mohammad Mahbub Hossain et al.
23
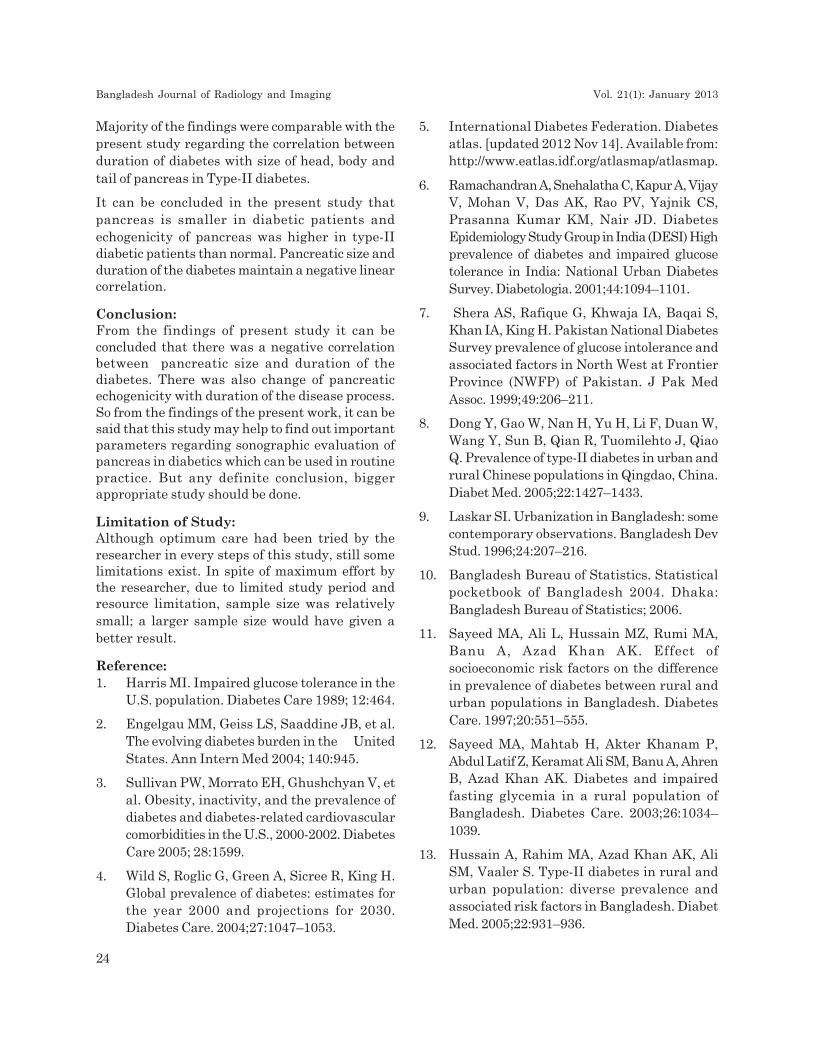
Majority of the findings were comparable with thepresent study regarding the correlation betweenduration of diabetes with size of head, body andtail of pancreas in Type-II diabetes.
It can be concluded in the present study thatpancreas is smaller in diabetic patients andechogenicity of pancreas was higher in type-IIdiabetic patients than normal. Pancreatic size andduration of the diabetes maintain a negative linearcorrelation.
Conclusion:From the findings of present study it can beconcluded that there was a negative correlationbetween pancreatic size and duration of thediabetes. There was also change of pancreaticechogenicity with duration of the disease process.So from the findings of the present work, it can besaid that this study may help to find out importantparameters regarding sonographic evaluation ofpancreas in diabetics which can be used in routinepractice. But any definite conclusion, biggerappropriate study should be done.
Limitation of Study:Although optimum care had been tried by theresearcher in every steps of this study, still somelimitations exist. In spite of maximum effort bythe researcher, due to limited study period andresource limitation, sample size was relativelysmall; a larger sample size would have given abetter result.
Reference:1. Harris MI. Impaired glucose tolerance in the
U.S. population. Diabetes Care 1989; 12:464.
2. Engelgau MM, Geiss LS, Saaddine JB, et al.The evolving diabetes burden in the UnitedStates. Ann Intern Med 2004; 140:945.
3. Sullivan PW, Morrato EH, Ghushchyan V, etal. Obesity, inactivity, and the prevalence ofdiabetes and diabetes-related cardiovascularcomorbidities in the U.S., 2000-2002. DiabetesCare 2005; 28:1599.
4. Wild S, Roglic G, Green A, Sicree R, King H.Global prevalence of diabetes: estimates forthe year 2000 and projections for 2030.Diabetes Care. 2004;27:1047–1053.
5. International Diabetes Federation. Diabetesatlas. [updated 2012 Nov 14]. Available from:http://www.eatlas.idf.org/atlasmap/atlasmap.
6. Ramachandran A, Snehalatha C, Kapur A, VijayV, Mohan V, Das AK, Rao PV, Yajnik CS,Prasanna Kumar KM, Nair JD. DiabetesEpidemiology Study Group in India (DESI) Highprevalence of diabetes and impaired glucosetolerance in India: National Urban DiabetesSurvey. Diabetologia. 2001;44:1094–1101.
7. Shera AS, Rafique G, Khwaja IA, Baqai S,Khan IA, King H. Pakistan National DiabetesSurvey prevalence of glucose intolerance andassociated factors in North West at FrontierProvince (NWFP) of Pakistan. J Pak MedAssoc. 1999;49:206–211.
8. Dong Y, Gao W, Nan H, Yu H, Li F, Duan W,Wang Y, Sun B, Qian R, Tuomilehto J, QiaoQ. Prevalence of type-II diabetes in urban andrural Chinese populations in Qingdao, China.Diabet Med. 2005;22:1427–1433.
9. Laskar SI. Urbanization in Bangladesh: somecontemporary observations. Bangladesh DevStud. 1996;24:207–216.
10. Bangladesh Bureau of Statistics. Statisticalpocketbook of Bangladesh 2004. Dhaka:Bangladesh Bureau of Statistics; 2006.
11. Sayeed MA, Ali L, Hussain MZ, Rumi MA,Banu A, Azad Khan AK. Effect ofsocioeconomic risk factors on the differencein prevalence of diabetes between rural andurban populations in Bangladesh. DiabetesCare. 1997;20:551–555.
12. Sayeed MA, Mahtab H, Akter Khanam P,Abdul Latif Z, Keramat Ali SM, Banu A, AhrenB, Azad Khan AK. Diabetes and impairedfasting glycemia in a rural population ofBangladesh. Diabetes Care. 2003;26:1034–1039.
13. Hussain A, Rahim MA, Azad Khan AK, AliSM, Vaaler S. Type-II diabetes in rural andurban population: diverse prevalence andassociated risk factors in Bangladesh. DiabetMed. 2005;22:931–936.
Bangladesh Journal of Radiology and Imaging Vol. 21(1): January 2013
24

14. Frier, BM & Fisher, M 2006, “Diabetesmellitus”, in NA Boon, NR Colledge, BRWalker and JAA Hunter (eds.),Davidson’sPrinciples and Practice of Medicine, 20th edn,Churchil Livingston, London, PP.808.
15. King, H & Rewers, M 1993,”Global estimatesfor prevalence of diabetes mellitus andimpaired glucose tolerance in adults”, DiabetesCare, vol. 16, pp. 157-177. 16. Report of a WHOConsultation Definition, Diagnosis andclassification of Diabetes Mellitus and itscomplication. World Health Organization 1999.
17. World Health Organization 1998, WorldDiabetes, A Newsletter, September 1997,pp. 3-6
18. West, KM & Kalbfleisch, JM 1966, “Glucosetolerance, nutrition and diabetes in Uruguay,Venezuela, Malaya and East Pakistan”,Diabetes, vol. 15, pp.9-18
19. Sayeed, MA, Hussain, MZ, Banu, A, Ali, L,Rumi, MAK & Azad Khan AK 1997, “ Effectof socioeconomic risk factor on differencebetween rural and urban in the prevalenceof diabetes in Bangladesh”, Diabetes Care,vol. 20, pp. 551–555)
20. National Institute of Population Research andTraining, Mitra and Associates (MA), and ORCMacro (ORCM): Bangladesh Demographic andHealth Survey 1999-2000. Dhaka, Bangladesh,and Calverton, MD, 2001
21. Sayeed, MA, Khan, AR, Banu, A & Hussain,MZ 1995, “Prevalence of diabetes andhypertension in a rural population ofBangladesh”Diabetes Care, Vol. 18, pp. 555–558)
22. Chessler, SD and Lernmark, A 2006, “Type-Idiabetes mellitus”, In: John KD, editor.Clinical diabetes mellitus: a problem orientedapproach, New York: Thieme, pp. 37-57.
23. Goda, K, Sasaki, E, Nagata, K, Fukai, M,Ohsawa, N, Hahafusa, T 2001, “Pancreatic
volume in type –I and type-II diabetesmellitus”, Acta Diabetol, vol.38(3), pp. 145-149.
24. Gilbeau, JP, Poncelet, V, Libon, E, Derue, Gand Heller, FR 2008, “The density, contourand thickness of the pancreas in diabetics.”CT findings in 57 patietns”, AJR, vol. 159,pp. 527-531.
25. Basiratnia, R, Hekmatnia, A and Kolahnz, MR2007, “Ultrasonographic alterations ofpancreas in diabetic patients”, Journal ofResearch in Medical Sciences, vol. 12(1),pp. 21-23.
26. Rajput, R, Ram, M, Maheshwari, S, Goyal,RK and Verma, GL 2001, “Pancreaticimaging by ultrasonography in type 1diabetes mellitus”, Clinical Forum, vol. 9(3),pp. 1606-1608.
27. Silva, ME, Vezozzo, DP, Ursich, MJ, Rocha,DM, Cerri, GG and Wajchenberg, BL 2005,“Ultrasonographic abnormalities of thepancreas in IDDM and NIDDM patients”,Diabetes Care,. vol. 16, pp. 1296-1297.
28. Stella, SM, Giunta, S, Di-Cianni, G, Benzi, L,Galetta, F, Cini, G and Giusti, C 1993, “Thepancreas in diabetes mellitus, the echographicaspects”, Radiol Med, vol. 85(1-2), pp. 70-4.
29. Alzaid, A, Aideyan, O and Nawaz, S 1993, “Thesize of the pancreas in diabetes mellitus”,Diabet Med, vol. 10(8), pp. 759-63.
30. Mohan, V, Sreeram, D, Ramachandran, A,Viswanathan, M and Iyer Doraiswamy, KR1985, “Ultrasonographic evaluation of thepancreas in tropical pancreatic diabetes”, ActaDiabetol, vol. 22(2), pp. 143-8.
31. Altobelli, E, Blasetti, A, Verrotti, A, Di G,Bonomo, L, and Chiarelli, F 1998, “Size ofpancreas in children and adolescents withtype-I (insulin dependent) diabetes”, J ClinUltrasound, vol. 26(8), pp. 391-395.
Correlation of Sonographic Assessment of Pancreatic Size Mohammad Mahbub Hossain et al.
25

Abstract: This cross-sectional study was carriedout in the department of Radiology and Imaging ,BIRDEM selecting 158 non-pregnant Bangladeshifemales in the premenarche, nulliparous ,multiparous and postmenopausal groups havingnormal uteri with the aim to find out thenormogram of uterine roundness index (UTRI) forBangladeshi female population and correlation oftransabdominal sonographically measured uterineroundness index (UTRI) in healthy females withtheir age, height, weight and parity. The length,anteroposterior and transverse diameters of theuterus were measured by pelvic ultrasound andthe UTRI calculated as the ratio of anteroposteriordiameter to the length. The age, height, weight andparity of the subject were recorded. It was observedthat significant correlation between UTRI with age,height and weight in premenarche group andweight in the nulliparous, multiparous and postmenopausal group (p<0.05). There was significantnegative correlation between UTRI and age in thepost menopausal group (p<0.05). The correlationbetween UTRI and age and height was notsignificant in the nulliparous and multiparousgroups (p>0.05). The correlation of UTRI withheight was not significant in the postmenopausalgroup (p> 0.05). There was significant correlationbetween UTRI with parity were observed inmultiparous group.
Key Words: Uterine roundness index; Uterus;Ultrasound; Bangladeshi women; Nomogram.
Introduction:Determination of uterine shape is an importantaspect in the evaluation of uterus in case ofinfertility as well as in other disease processes .The uterus, stimulated continually by hormones,denuded monthly of its endometrial mucosa andinhabited periodically by fetuses, is subject to a
variety of disorders, the most common of whichresult from endocrine imbalances, complication ofpregnancy and neoplastic. Proliferation1 . The sizeand shape of the normal uterus vary throughoutlife and are related to age, hormonal status, andparity2. Uterine roundness index (UTRI) ,the ratioof anteroposterior diameter to the length, is anovel idea and objective method of assessing thenormality of uterine shape3.
There is a progressive increase in size of internalfemale genitalia in relation to age, height, weight,and puberty. Uterine volume and body lengthpresented the best correlation with age and stageof puberty4.
Growth of the prepubertal uterus is minimal frominfancy until approximately 8 years of age, whenthe uterus gradually increases in size untilpuberty5. At this time, there is a more dramaticincrease in size with more pronounced growth inthe body until it reaches the eventual adult, pear-shaped appearance, with the diameter and lengthof the body about double that of the cervix6. Themaximal dimensions of the nulliparous uterus areapproximately 8 cm in length, 5 cm in width, and4 cm in AP diameter.
The uterus hypertrophies during pregnancy andinvolutes afterwards but never returns completelyto its former state. The body of the uterus remainssomewhat larger and its structure is slightlymodified in that elastic tissue, deposited in andaround blood vessels during pregnancy, is notreabsorbed. The amount of elastic tissue found inany myometrium is therefore proportional to thenumber of pregnancies previously housed7. Parity(pregnancy) increases the normal size by morethan 1 cm in each dimension2. Normal uterinecavity width varies with gravidity and parity8.
Transabdominal Sonographically evaluatedUterine Roundness Index (UTRI) in healthy
females: Correlation with age, height and weight.SABRINA NOOR1, MD TOWHIDUR RAHMAN2, MD ABU TAHER3, NAYEMA RAHMAN4,
NAFFISA ABEDIN5, FARZANA SHEGUFTA6, MD MOFAZZAL SHARIF7
1. Ex M Phil student, 2. Medical officer, 3. Associate Professor, 4. Junior Consultant, 5. Assistant professor,6. Junior Consultant & 7. Ex MD student, All from the department of Radiology and Imaging, BIRDEM, Dhaka.
BANGLADESH JOURNAL OF RADIOLOGY AND IMAGING 2013; VOL. 21(1): 26-29
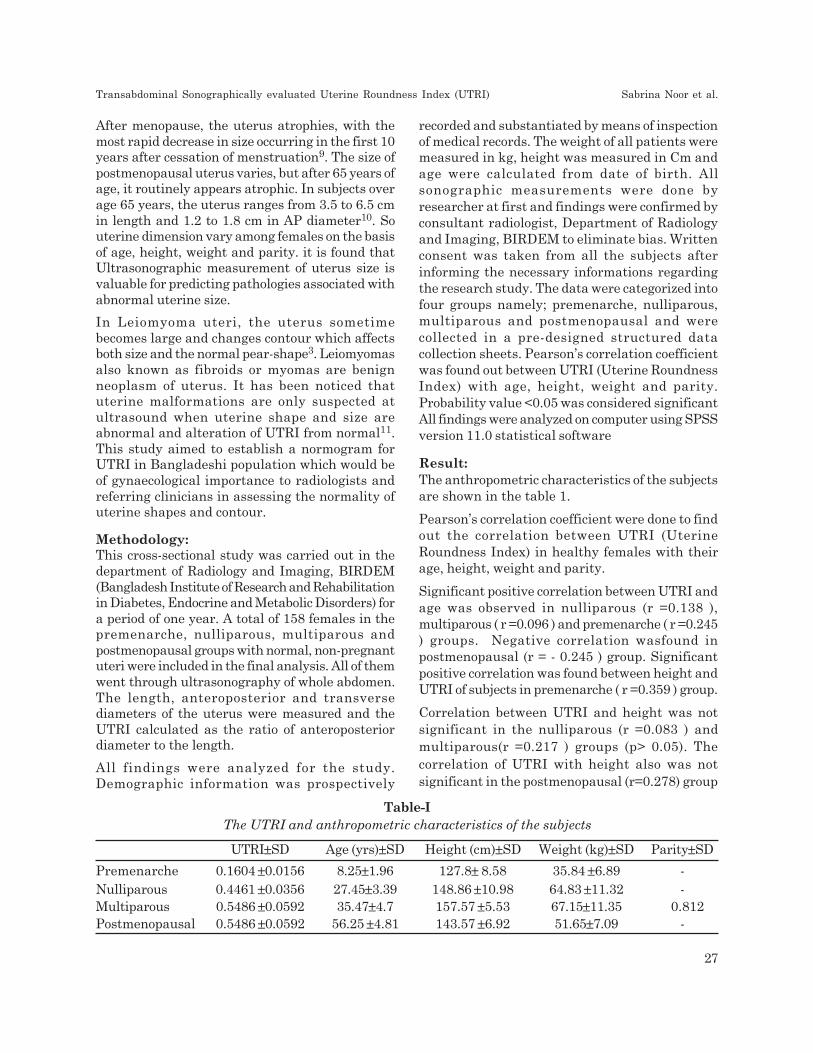
After menopause, the uterus atrophies, with themost rapid decrease in size occurring in the first 10years after cessation of menstruation9. The size ofpostmenopausal uterus varies, but after 65 years ofage, it routinely appears atrophic. In subjects overage 65 years, the uterus ranges from 3.5 to 6.5 cmin length and 1.2 to 1.8 cm in AP diameter10. Souterine dimension vary among females on the basisof age, height, weight and parity. it is found thatUltrasonographic measurement of uterus size isvaluable for predicting pathologies associated withabnormal uterine size.
In Leiomyoma uteri, the uterus sometimebecomes large and changes contour which affectsboth size and the normal pear-shape3. Leiomyomasalso known as fibroids or myomas are benignneoplasm of uterus. It has been noticed thatuterine malformations are only suspected atultrasound when uterine shape and size areabnormal and alteration of UTRI from normal11.This study aimed to establish a normogram forUTRI in Bangladeshi population which would beof gynaecological importance to radiologists andreferring clinicians in assessing the normality ofuterine shapes and contour.
Methodology:This cross-sectional study was carried out in thedepartment of Radiology and Imaging, BIRDEM(Bangladesh Institute of Research and Rehabilitationin Diabetes, Endocrine and Metabolic Disorders) fora period of one year. A total of 158 females in thepremenarche, nulliparous, multiparous andpostmenopausal groups with normal, non-pregnantuteri were included in the final analysis. All of themwent through ultrasonography of whole abdomen.The length, anteroposterior and transversediameters of the uterus were measured and theUTRI calculated as the ratio of anteroposteriordiameter to the length.
All findings were analyzed for the study.Demographic information was prospectively
recorded and substantiated by means of inspectionof medical records. The weight of all patients weremeasured in kg, height was measured in Cm andage were calculated from date of birth. Allsonographic measurements were done byresearcher at first and findings were confirmed byconsultant radiologist, Department of Radiologyand Imaging, BIRDEM to eliminate bias. Writtenconsent was taken from all the subjects afterinforming the necessary informations regardingthe research study. The data were categorized intofour groups namely; premenarche, nulliparous,multiparous and postmenopausal and werecollected in a pre-designed structured datacollection sheets. Pearson’s correlation coefficientwas found out between UTRI (Uterine RoundnessIndex) with age, height, weight and parity.Probability value <0.05 was considered significantAll findings were analyzed on computer using SPSSversion 11.0 statistical software
Result:The anthropometric characteristics of the subjectsare shown in the table 1.
Pearson’s correlation coefficient were done to findout the correlation between UTRI (UterineRoundness Index) in healthy females with theirage, height, weight and parity.
Significant positive correlation between UTRI andage was observed in nulliparous (r =0.138 ),multiparous ( r =0.096 ) and premenarche ( r =0.245) groups. Negative correlation wasfound inpostmenopausal (r = - 0.245 ) group. Significantpositive correlation was found between height andUTRI of subjects in premenarche ( r =0.359 ) group.
Correlation between UTRI and height was notsignificant in the nulliparous (r =0.083 ) andmultiparous(r =0.217 ) groups (p> 0.05). Thecorrelation of UTRI with height also was notsignificant in the postmenopausal (r=0.278) group
Table-IThe UTRI and anthropometric characteristics of the subjects
UTRI±SD Age (yrs)±SD Height (cm)±SD Weight (kg)±SD Parity±SD
Premenarche 0.1604 ±0.0156 8.25±1.96 127.8± 8.58 35.84 ±6.89 -
Nulliparous 0.4461 ±0.0356 27.45±3.39 148.86 ±10.98 64.83 ±11.32 -Multiparous 0.5486 ±0.0592 35.47±4.7 157.57 ±5.53 67.15±11.35 0.812Postmenopausal 0.5486 ±0.0592 56.25 ±4.81 143.57 ±6.92 51.65±7.09 -
Transabdominal Sonographically evaluated Uterine Roundness Index (UTRI) Sabrina Noor et al.
27
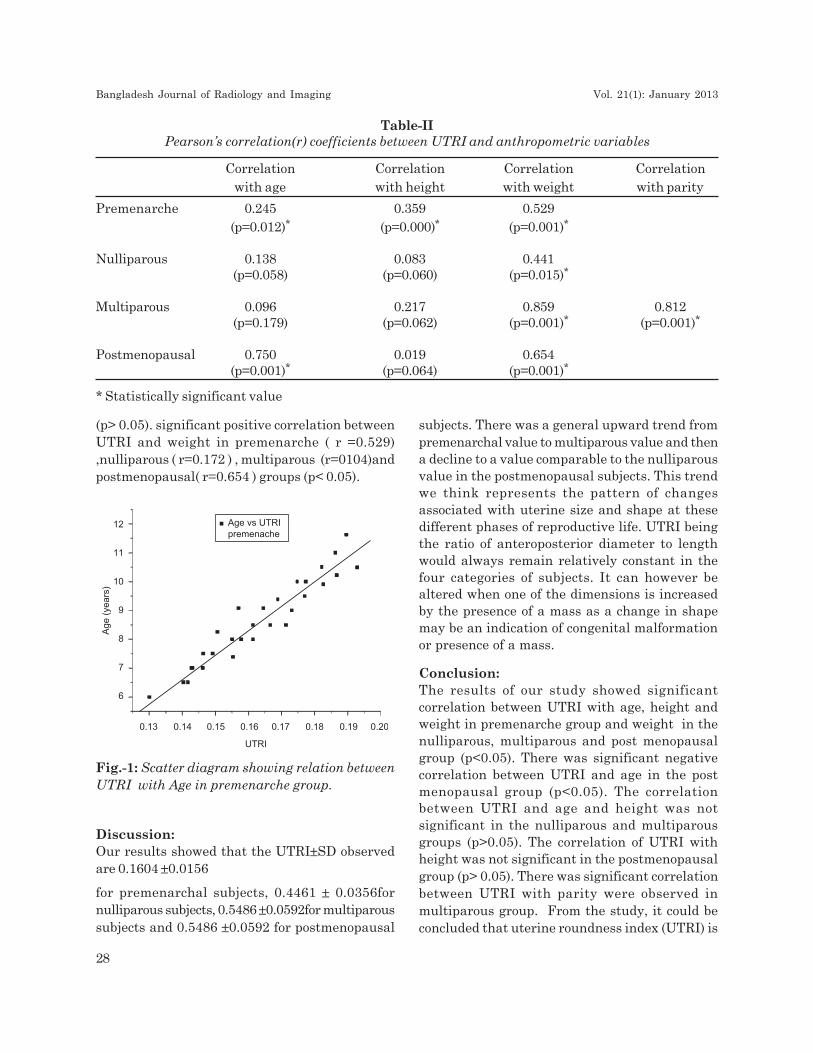
(p> 0.05). significant positive correlation betweenUTRI and weight in premenarche ( r =0.529),nulliparous ( r=0.172 ) , multiparous (r=0104)andpostmenopausal( r=0.654 ) groups (p< 0.05).
subjects. There was a general upward trend frompremenarchal value to multiparous value and thena decline to a value comparable to the nulliparousvalue in the postmenopausal subjects. This trendwe think represents the pattern of changesassociated with uterine size and shape at thesedifferent phases of reproductive life. UTRI beingthe ratio of anteroposterior diameter to lengthwould always remain relatively constant in thefour categories of subjects. It can however bealtered when one of the dimensions is increasedby the presence of a mass as a change in shapemay be an indication of congenital malformationor presence of a mass.
Conclusion:The results of our study showed significantcorrelation between UTRI with age, height andweight in premenarche group and weight in thenulliparous, multiparous and post menopausalgroup (p<0.05). There was significant negativecorrelation between UTRI and age in the postmenopausal group (p<0.05). The correlationbetween UTRI and age and height was notsignificant in the nulliparous and multiparousgroups (p>0.05). The correlation of UTRI withheight was not significant in the postmenopausalgroup (p> 0.05). There was significant correlationbetween UTRI with parity were observed inmultiparous group. From the study, it could beconcluded that uterine roundness index (UTRI) is
Table-IIPearson’s correlation(r) coefficients between UTRI and anthropometric variables
Correlation Correlation Correlation Correlation
with age with height with weight with parity
Premenarche 0.245 0.359 0.529
(p=0.012)* (p=0.000)* (p=0.001)*
Nulliparous 0.138 0.083 0.441(p=0.058) (p=0.060) (p=0.015)*
Multiparous 0.096 0.217 0.859 0.812(p=0.179) (p=0.062) (p=0.001)* (p=0.001)*
Postmenopausal 0.750 0.019 0.654(p=0.001)* (p=0.064) (p=0.001)*
* Statistically significant value
Discussion:Our results showed that the UTRI±SD observedare 0.1604 ±0.0156
for premenarchal subjects, 0.4461 ± 0.0356fornulliparous subjects, 0.5486 ±0.0592for multiparoussubjects and 0.5486 ±0.0592 for postmenopausal
Fig.-1: Scatter diagram showing relation betweenUTRI with Age in premenarche group.
Bangladesh Journal of Radiology and Imaging Vol. 21(1): January 2013
28
simple index which could easily be calculated bymanually or by preset ultrasonography machinesoftware and calculated value could be comparedwhen there is doubt about normal anatomy ofuterus, minor congenital anomaly , adenomyosisor small fibroid in uterine wall. It was also observedfrom this study that dimension of uterus increasedfrom puberty up to adulthood. These increases indimensions were significantly related with age,height, weight and parity. After menopause, sizeof uterus decreased due to lack of hormone. Thestudy findings could be used as nomogram forBangladeshi women. However ,further study canbe carried out with large number of Bangladeshifemales.
References:1. Crum CP, Cotran RS, Kumar V and Collins T
.Body of Uterus and Endometrium in : RobbinsPathologic Basis of Disease. 6th edn. Singapore:Harcourt Company. 1974; 1054-64.
2. Salem S & Wilson SR.GynacologicalUltrasound In:Rumak CM, Wilson SR,Charboneau JW (eds.)Diagnostic 2005
3. Ultrasound,3rd edn. Mosby, ST Louis,Missouri, 538-40.
4. Ohagwu CC, Ugwu CA and Idigo FU. Uterineroundness index: model formulation andnomogram for a Nigerian population. InternetJournal of Medical Update, 2009;4(1):25-28.
5. Razzaghy-Azar M ,Ghasemi F, Hallaji F,Ghasemi A, Ghasemi M. SonographicMeasurement of Uterus and Ovaries inPremenarcheal Healthy Girls Between 6 and13 Years Old: Correlation with Age andPubertal Status. Journal of ClinicalUltrasound 2010; 39( 2) , 64-73.
6. Holm K, Laursen EM, Brocks V, Muller J.pubertal maturation of the internal genitalia:an ultrasound evaluation of 166 healthy girls.Ultrasound Obstet Gynecol1995; 6:175-181.
7. Orsini LF, Salardi S, Pilu G. Pelvic organsin premenarcheal girls: real- timeultrasonography, Radiology 1984; 153:113-16.
8. Nussbaum AR , Sanders RC, Jones MD.Neonatal uterine morphology as seen on real-time ultrasound. Radiology, 1986;160:641-43.
9. Beryl RB, Thomas DS, Jennifer GL andBryann B. Width of the Normal UterineCavity in Premenopausal Women and Effectof Parity. Obstetrics & Gynecology. . 2010;116(2): 305-10.
10. Platt JF, Bree RL, Davidson D. Ultrasoundof the normal nongravid uterus: correlationwith gross and histopathology. J ClinUltrasound 1990;18:15-19.
11. Miller EI, Thomas RH, Lines P. The atrophicpostmenopausal uterus. J Clin Ultrasound,1977. 5:261-263.
Transabdominal Sonographically evaluated Uterine Roundness Index (UTRI) Sabrina Noor et al.
29
AbstractThis study was done to evaluate the accuracy of
transvaginal ultrasonography for the detection of
ectopic pregnancy. A prospective observational
study was carried out in DMCH among the
women’s of child bearing age by using TVS and
the results were compared with histopathologic
findings. A total of 130 patients were referred to
the department of Radiology and Imaging, DMCH
with the clinical suspicion of ectopic pregnancy
based on short period of amenorrhoea, and lower
abdominal mass. The sensitivity of TVS for
detection of ectopic pregnancy was 92.64%
specificity 74.47% NPV 90.90%and PPV is 84%.
Accuracy is 86.92%. So transvaginal sonography
was proved to be and important and accurate
modality in evaluation of suspected ectopic
pregnancy.
Key words: Ectopic pregnancy, Transvagainal
ultrasonography
Introduction:
Ectopic pregnancy is a significant source of
morbidity for women of childbearing age and
represents one of the most common conditions
presenting as an emergency in young women.[1]
An ectopic pregnancy is the implantation of a
fertilized ovum outside the endometrial cavity &
occurs in approximately 1.5 to 2.0% of pregnancies
and is potentially life threatening.2,3 Most common
site of misplantation is one of the fallopian tubes
(95-97%). Approximately 80% ectopic pregnancy
occur in the ampullary portion of the fallopian tube,
10% are fimbrial in location, 2-4% are corneal.
Ovarian, cervical and abdominal pregnancies are
rare. The incidence of ectopic pregnancy is up to
1% of all pregnancies. The incidence of ectopic
pregnancy increased but associate mortality is
decreased mainly due to early diagnosis and
treatment before rupture.4,5 Diagnosis is difficult
because the disease is relatively asymptomatic in
the early weeks of pregnancy. Early diagnosis,
aggressive surgical management and adequate
blood and fluid replacement could save 75% of the
ectopic pregnancy related mortalities. This study
was done to evaluate the efficacy of transvaginal
ultrasound in establishing the diagnosis of ectopic
pregnancy [7, 8].
Materials and Methods:
This prospective observational study was carried
out of all women attending Radiology & Imaging
Dept of Dhaka medical college hospital between
December 2012 to March 2014 referred by out
patient department and Indoor of
Gynae and Obstetrics. High resolution ultra sound
was performed using a 7.5MHz transvaginal probe.
The diagnosis of ectopic pregnancy was based on
following four types of appearance: a)
inhomogeneous mass adjacent to ovary and moving
separately. b) mass with hyperechoic ring around
the gestational sac. c) extra uterine pregnancy with
fetal pole & cardiac activity d) non available extra
uterine pregnancy with fetal pole but without
cardiac activity: 130 cases of Ectopic pregnancy
were visualized at laparotomy/laparoscopy and
confirmed on histological examinations was used
as gold standard.
Efficacy of Trans Vaginal Ultrasonography inDetection of Ectopic Pregnancy
SHAHARA HAQUE1, S S KUNDU2, MUSTAQ AHMED JALALI3, NAFISA NOOR4,SHAKILA PARVEEN5, FONINDRA NATH PAUL6, MD ANISUR RAHMAN KHAN7
1. Associate Professor, Radiology and Imaging, Dhaka Medical College, Dhaka, 2. Associate Professor, 3. AssistantProfessor, NICRH, 4. Assistant Professor, NICRH. 5. Consultant, United Hospital, 6. Junior consultant, TBHospital, Shyamoli, Dhaka, 7. Assistant Professor, Department of Radiology & Imaging, Dhaka Medical College.
BANGLADESH JOURNAL OF RADIOLOGY AND IMAGING 2013; VOL. 21(1): 30-32
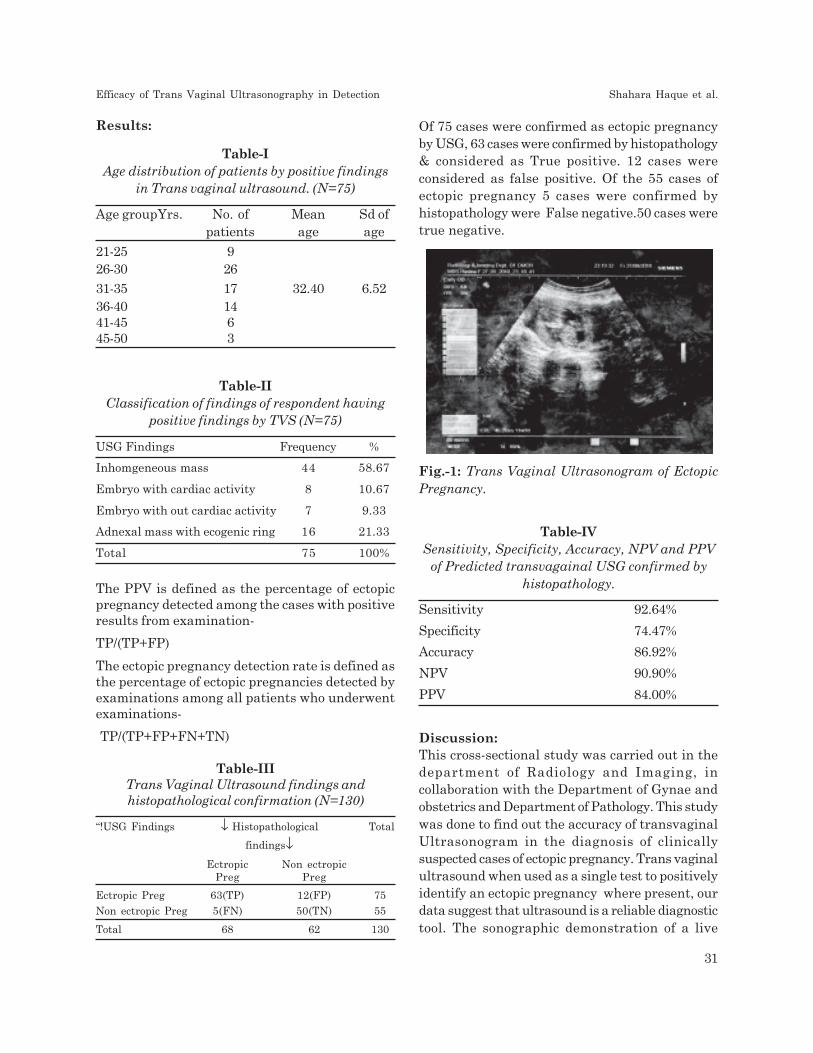
Results:
Table-IAge distribution of patients by positive findings
in Trans vaginal ultrasound. (N=75)
Age groupYrs. No. of Mean Sd ofpatients age age
21-25 926-30 26
31-35 17 32.40 6.5236-40 1441-45 645-50 3
Table-IIClassification of findings of respondent having
positive findings by TVS (N=75)
USG Findings Frequency %
Inhomgeneous mass 44 58.67
Embryo with cardiac activity 8 10.67
Embryo with out cardiac activity 7 9.33
Adnexal mass with ecogenic ring 16 21.33
Total 75 100%
The PPV is defined as the percentage of ectopicpregnancy detected among the cases with positiveresults from examination-
TP/(TP+FP)
The ectopic pregnancy detection rate is defined asthe percentage of ectopic pregnancies detected byexaminations among all patients who underwentexaminations-
TP/(TP+FP+FN+TN)
Table-IIITrans Vaginal Ultrasound findings andhistopathological confirmation (N=130)
“!USG Findings ↓ Histopathological Total
findings↓Ectropic Non ectropic
Preg Preg
Ectropic Preg 63(TP) 12(FP) 75
Non ectropic Preg 5(FN) 50(TN) 55
Total 68 62 130
Table-IVSensitivity, Specificity, Accuracy, NPV and PPV
of Predicted transvagainal USG confirmed byhistopathology.
Sensitivity 92.64%
Specificity 74.47%
Accuracy 86.92%
NPV 90.90%
PPV 84.00%
Discussion:This cross-sectional study was carried out in thedepartment of Radiology and Imaging, incollaboration with the Department of Gynae andobstetrics and Department of Pathology. This studywas done to find out the accuracy of transvaginalUltrasonogram in the diagnosis of clinicallysuspected cases of ectopic pregnancy. Trans vaginalultrasound when used as a single test to positivelyidentify an ectopic pregnancy where present, ourdata suggest that ultrasound is a reliable diagnostictool. The sonographic demonstration of a live
Of 75 cases were confirmed as ectopic pregnancyby USG, 63 cases were confirmed by histopathology& considered as True positive. 12 cases wereconsidered as false positive. Of the 55 cases ofectopic pregnancy 5 cases were confirmed byhistopathology were False negative.50 cases weretrue negative.
Fig.-1: Trans Vaginal Ultrasonogram of EctopicPregnancy.
Efficacy of Trans Vaginal Ultrasonography in Detection Shahara Haque et al.
31
embryo in the adnexa is specific for the diagnosisof ectopic pregnancy9. More advanced ectopicpregnancies tend to be larger at presentation thusmore reliable. Overall mean age of the patientwas 32.40 years with standard deviation 6.52 years.By TVS inhomogeneous mass were found in 44cases, embryo with cardiac activity is found in 8cases .Embryo without cardiac activity were foundin 7 cases. Adnexal mass with echogenic ring werefound in 16 cases. Of 75 cases were confirmed asEctopic pregnancy by USG 63 cases were confirmedby histopathology considered as True positive .12cases were considered as false positive. Of the 55cases of Ectopic pregnancy 5 cases were confirmedby histopathology were False negative.50 caseswere true negative.
Ectopic pregnancy should not be diagnosed on thebasis of an absent intra uterine gestational sacbut rather by the positive visualization of anadnexal mass. The high predictive value of TVS asa diagnostic tool in the management of ectopicpregnancies should reduce the number ofunnecessary laparoscopies without significantcompromising the womens well being.The earlydetection and classification of an unrupturedectopic pregnancy allows conservativemanagement options to be considered.Thesensitivity of TVS for detection of ectopic pregnancywas 92.64% specificity 74.47% NPV 90.90%and PPV84%, accuracy is 86.92%.
Laparoscopy and histopathology were consideredas the gold standards for the diagnosis of ectopicpregnancy.
Conclusiuon:Early detection can prevent the morbidity andmortality in women with ectopic pregnancy. Theadvances in transvaginal sonography has enableddetection of ectopic pregnancy in an earlier stage.However ultrasonography is a skill dependantmodality .In addition a good knowledge of the Betahuman chorionic gonadotrophin level is alsocritical for diagnosis of ectopic pregnancies. TVSdetected more cases before rupture has occurred.This ability is useful in assessing tubal status andplanning less invasive methods in treatment.
92.64% of ectopic pregnancies in this studypopulation can be accurately diagnosed using TVSprior to surgery.
So, TVS should be performed in all suspected casesof ectopic pregnancy.
References:1. K. T. Barnhart, July 23,2009, ‘Ectopic
Pregnancy’, N. Engl. J. Med., Vol.361, No.4,pp.379-387.
2. E. Kirk, A. T. Papageorghiou G. Condous, L.Tan, S.Bora, & R. Bourne November 1, 2007,‘The diagnostic effectiveness of an initialtransvaginal scan in detecting ectopicpregnancy’, Hum.Reprod. Vol.22, No.11,pp.2824-2828.
3. Brown DL, and Doubilet PM1994, ‘Trans-vaginal sonography for dignosing ectopicpregnancy positivity criteria and performancecharacteristics’, J Ultrasound Med, Vol.13,pp.259-266.
4. Conduas G, Okaro E and Bourne T 2003, ‘Theconservative management of early pregnancycomplications: a review of the literature’,Ultrasound Obstetrics and Gynecol,Vol. 22,pp.420-430.
5. Shalev E, Yarom I, Bustan M, Weiner E andBen-Shlomo I, 1998, ‘Transvaginal sonographyas the ultimate diagnostic tool for themanagement of ectopic pregnancy: experiencewith 840 cases’, Fertil Steril , Vol. 69, pp. 62-65
6. Dutta, DC 2001, Text book of Obstetrics andGynaecology, 6th edn, Hindal Konar, Central,India.
7. Fleischer, AC, Pennell, RG & Mckee MS 1990,‘Ectopic pregnancy: features of transvaginalsonography’, Radiology, Vol. 174, pp. 375-378
8. Kupesic, S 2005, Donald School Text book ofTransvaginal sonography, 1st edition, Jaypee,New Delhi.
9. Hopp, H, Schaar, P, Entezami, M,Hundertmark, S, Volert, W& weitzel, H 1995,‘Diagonostic reliability of vaginal ultrasoundin ectopic pregnancy, GeburtshilfeFraunheoikd, Vol.55, pp.666-70.
Bangladesh Journal of Radiology and Imaging Vol. 21(1): January 2013
32
Abstract:Conjoined twin is a rare occurrence. In the presentcase study, we are reporting one case ofcraniothoracoomphalopagus conjointed twins. A 22yrs. old lady gravida 4th, para 1+2 (1missedabortion, 1 anencephaly) reported to Radiology andImaging dept. of CMSOGH for pregnancy profilescan.
Obstetric scan was done which revealed twinpregnancy, monochorionic, monoamniotic,conjoined twin of 29+weeks of gestation.
The separation of conjoined twins is associated withincreased chance of perinatal mortality. Thereforemaking an early diagnosis with ultrasonographicexamination provides the parents a chance to electpregnancy termination.
Key words: Conjoined twins, Craniothoracoom-phalopagus.
Introduction:
Twins is not an uncommon phenomenon, butconjoined twins are indeed a rarity, since the event
occurs only 1 in 50,000 to 60,000 births1. Femalespredominate over males and approximately 40%-
60 % are still born and 45% survive only 1 day.Because the situation carries high risk, early
diagnosis and management of delivery is extremelyimportant. We report a case of conjoined twinsbecause of rarity.
Case Report:A 22 yrs. old lady gravida 4th, para 1+2 (1missedabortion, 1 anencephaly) reported to Radiology and
Imaging dept. of CMSOGH for pregnancy profilescan as a part of antenatal checkup. Her LMP was26.03.2014 and her period of gestation was29+weeks.
She had no personal and family history of twins.Her first child was full term normally deliveredfemale baby of 5 yrs old, alive and healthy.Second pregnancy was a missed abortion. 3rd
pregnancy was an anencephalic male child. Herhusband is physically handicapped. On herexamination, she was average built and wellnourished. Her general physical and systemic
examination was normal. On investigation, herblood group B+ve, routine blood and urineexaminations were normal. Obstetric scan wasdone which revealed twin pregnancy,monochorionic, monoamniotic conjoined twin of29 weeks 3 days of gestation. Presentation wascephalic, anterior single placenta. Amniotic fluidwas more than normal. Fetal head was singleand smaller in size. Single heart, two thorax andabdomen and four lower limbs were seen onUSG. For confirmation, X-ray abdomen both AP& lateral view was done, which revealed singlefetal head, two spines & multiple limbs. The
patient and her relatives were counseled aboutthe incompatibility of life. She had caesareansection and delivered a female baby with fourarms, four legs, single head. Chest and abdomenwere fused together ( Fig. 3 a,b). The placentawas single. Post operative recovery wasuneventful.
CASE REPORTS
Cephalo-thoraco-omphalopagus Conjoined Twin -A Rare Case Report
ANISUL MOULA¹, KABERI MAJUMDER², UNAN SULTANA³,MD SHAHIDUL ISLAM4
1. Professor & Head, Dept of Radiology & Imaging, Chattagram Maa-O-Shisu Hospital Medical College, Chittagong,Bangladesh, 2. Assistant Professor, Dept of Radiology & Imaging, Chattagram Maa-O-Shisu Hospital MedicalCollege, Chittagong, Bangladesh, 3. Lecturer, Dept of Radiology & Imaging, Chattagram Maa-O-Shisu HospitalMedical College, Chittagong, Bangladesh, 4. Assistant Professor, Dhaka Medical College, Dhaka.
BANGLADESH JOURNAL OF RADIOLOGY AND IMAGING 2013; VOL. 21(1): 33-36

Fig.-1: Ultrasound findings (a) Single head, (b) Single Heart, (c) 3D Images of fetuses . Two spinalcolumn, (d) Two trunks and abdomens
Fig.-2: (a) X-ray abdomen AP view.: Single head, two spines , multiple limbs, (b) X-ray abdomen lateralvie.: Single head, two spines , multiple limbs, X-ray abdomen lateral view.: Single head, two spines ,multiple limbs
Bangladesh Journal of Radiology and Imaging Vol. 21(1): January 2013
34
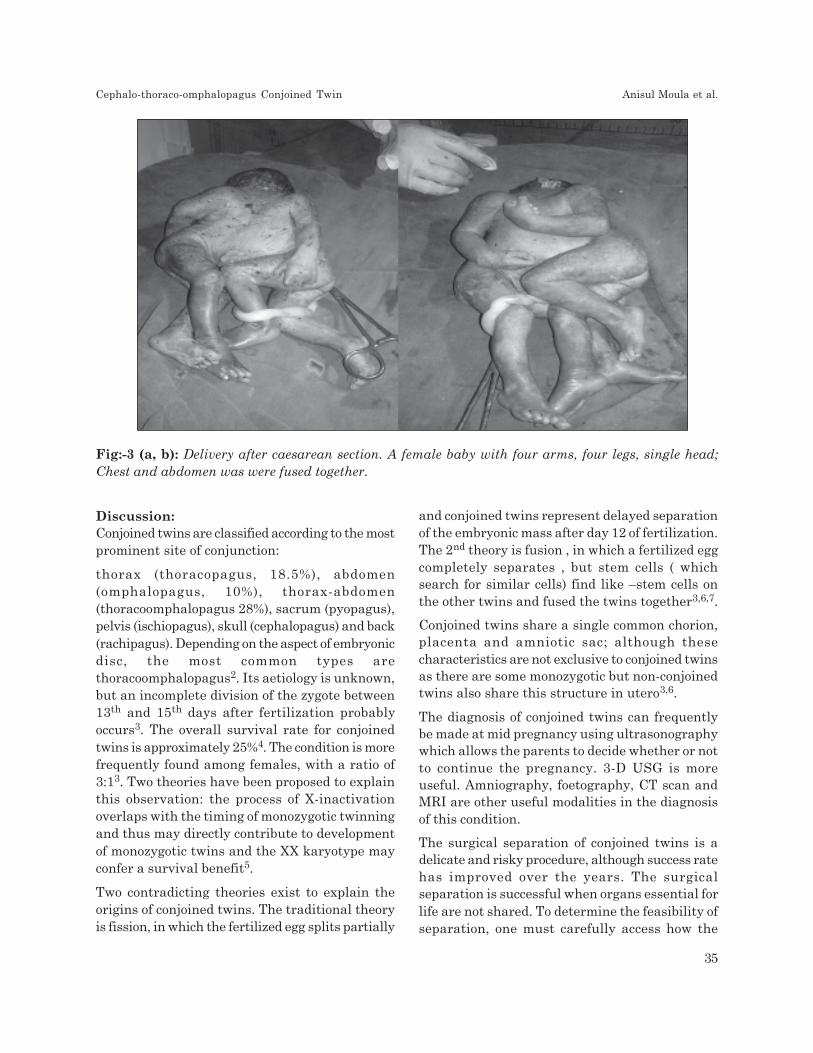
Discussion:Conjoined twins are classified according to the mostprominent site of conjunction:
thorax (thoracopagus, 18.5%), abdomen(omphalopagus, 10%), thorax-abdomen(thoracoomphalopagus 28%), sacrum (pyopagus),pelvis (ischiopagus), skull (cephalopagus) and back(rachipagus). Depending on the aspect of embryonicdisc, the most common types arethoracoomphalopagus2. Its aetiology is unknown,but an incomplete division of the zygote between13th and 15th days after fertilization probablyoccurs3. The overall survival rate for conjoinedtwins is approximately 25%4. The condition is morefrequently found among females, with a ratio of3:13. Two theories have been proposed to explainthis observation: the process of X-inactivationoverlaps with the timing of monozygotic twinningand thus may directly contribute to developmentof monozygotic twins and the XX karyotype mayconfer a survival benefit5.
Two contradicting theories exist to explain theorigins of conjoined twins. The traditional theoryis fission, in which the fertilized egg splits partially
Fig:-3 (a, b): Delivery after caesarean section. A female baby with four arms, four legs, single head;Chest and abdomen was were fused together.
and conjoined twins represent delayed separationof the embryonic mass after day 12 of fertilization.The 2nd theory is fusion , in which a fertilized eggcompletely separates , but stem cells ( whichsearch for similar cells) find like –stem cells onthe other twins and fused the twins together3,6,7.
Conjoined twins share a single common chorion,placenta and amniotic sac; although thesecharacteristics are not exclusive to conjoined twinsas there are some monozygotic but non-conjoinedtwins also share this structure in utero3,6.
The diagnosis of conjoined twins can frequentlybe made at mid pregnancy using ultrasonographywhich allows the parents to decide whether or notto continue the pregnancy. 3-D USG is moreuseful. Amniography, foetography, CT scan andMRI are other useful modalities in the diagnosisof this condition.
The surgical separation of conjoined twins is adelicate and risky procedure, although success ratehas improved over the years. The surgicalseparation is successful when organs essential forlife are not shared. To determine the feasibility ofseparation, one must carefully access how the
Cephalo-thoraco-omphalopagus Conjoined Twin Anisul Moula et al.
35
twins share organ function. The importance ofmultidiscipline team with rehearsal of all aspects(surgical, anaesthetic and nursing) of the operativeprocedure cannot be overemphasized8.
Caesarean delivery near term is the preferredmethod of delivery to minimize maternal and foetalinjury. If the twins are thought to have a poorchance of surviving and are small enough to passthrough the birth canal without damaging themother, vaginal delivery might be considered.
Conclusion:Conjoined twins are associated to a high perinatalmortality; therefore, making an early diagnosiswith ultrasonographic examination of conjoinedtwins gives the parents a chance to elect pregnancytermination.
References:1. Tan, K.L., Goon, S. M., Salmon, Y., Wee, J.
H., Acta Obstet gynecol Scand, 1971, 50 :373- 380.
2. L.Schnaufer, “Conjoined twins”, in Swenson’sPediatric surgery, J.G. Raffenspenger, Ed.,.Appleton Century-Crofts, New York, NY,USA, 4th edition, 1980, 910-920.
3. T. Abossolo, P. Dancoisne, J. Tuaillon, E.Orvain, J.C. Sommer, and J.P. Riviere, “ Earlyprenatal diagnosis of asymmetric cephalopagustwins”, Journal de gynaecologie obstetrique etbiologie de la reproduction, 1994, 23(1) : 79-84.
4. J. L. stone and J.T. Goodrich, “ Thecraniopagus malformation: classification andimplications for surgical separation”, Brain,2006, 129(5) : 1084-1095.
5. S. chitins, C. Derom, J. Monteiro and P. K.Gregersen, “X chromosome-inactivationpatterns confirm the late timing ofmonoamniotic-MZ twinning”, American Journalof Human Genetics, 1999, 65(2) : 570-571.
6. R. Spencer, “ Theoretical and analyticembryology of conjoined twins: part I:embryogenesis”, Clinical Anatomy, 2000, 13(1) :36-53.
7. R. Spencer, “ Theoretical and analyticembryology of conjoined twins: part II:adjustments to union”, Clinical Anatomy,2000, 13(2) : 97-120.
8. Miller, D., Colobani, P., Buck, J.R., Dudgeon,D.L., Haller, J.A., J Ped Surg, 1983(18) :373-376.
Bangladesh Journal of Radiology and Imaging Vol. 21(1): January 2013
36
Abstract :Malignant peripheral nerve sheath tumour(MPNST) comprise approximately 5-10% of all softtissue sarcomas. This may characterized by theirability to occasionally reproduce mimicking theclinical and morphological appearance of Pott’sdisease, making diagnosis difficult. We reported thiscase in 27 year old male who underwent forbiochemical & radiological examinations. Here weconcluded that all clinical, radiological, serological& histopathological findings give better result todiagnosis the rare malignant peripheral nervesheath tumour.
Key Words: Malignant peripheral nerve sheathtumour (MPNST), neurofibromatosis-1 (NF1),Pott’s disease .
Introduction :Malignant peripheral nerve sheath tumor(MPNST) is a rare variety of soft tissue sarcomaof ectomesenchymal origin and can occur eitherspontaneously or in association withneurofibromatosis-1 (NF1)1,2. World Healthorganization (WHO) coined the term MPNSTreplacing previous heterogeneous and oftenconfusing terminology, such as malignantschwannoma, malignant neurilemmoma, andneurofibrosarcoma, for tumors of neurogenic originand similar biological behavior3. They arise froma major or minor peripheral nerve branches orsheath of peripheral nerve fibers. These tumorsmay arise spontaneously in adult patients,although 5% to 42% of MPNST have an associationwith multiple neurofibromatosis Type-I. Surgeryis the main stay of treatment of this tumor thoughthey are biologically aggressive in nature4.
A sarcoma is defined as a MPNST when at leastone of the following criteria is met:
1. It arises from a peripheral nerve
2. It arises from a preexisting benign nervesheath tumor (neurofibroma)
3. It demonstrates Schwann cell differentiationon histologic examination
The etiology is unknown but there is a higherincidence in patients with a history of radiationexposure5.
Case Report :A 27 year old male suffering from low back painradiating to left lower limb for about 02 months.Patient had no H/O fever or cough. On clinicalexamination patient is mildly anaemic andtenderness present over lumbar region. There isno palpable lump over spine. Heart & lungexamination revealed no definite abnormality. Xray lumbo sacral spine shows lordosis isstraightened, may be due to muscle spasm. CBCrevealed Hb% - 11.2 mg/dl, TC of WBC – 11,000 /cmm, ESR – 12 mm Hg. MRI lumbosacral spineshowed irregular thickened pre & leftparavertebral soft tissue (8.4x6.4x5.6) cm which ispredominantly hypointense in T1w & hyperintensein T2w images at L4- L5 level involving left psoasmajor muscle suggesting cold abscess with alteredsignal intensity at L5 vertebral body. No alteredsignal intensity is evident in the disc.
Chest X ray showed no significant abnormality.Considering spinal TB with cold abscess in MRI,anti TB was started . No definite improvement ofclinical sign, symptoms was observed aftercontinuing anti TB for 3 months. CT guided FNACshows necrotic tissue debris with scattereddistribution of neutrophils , macrophages &lymphocytes. No malignant cell is seen. ZN stain– No AFB found.
Paravertebral Mass : Malignant peripheral NerveSheath Tumour : A Case Study
MD TOWHIDUR RAHMAN1, FAHMIDA YESHMINE2, SHARMISTHA DEY3, MAHBUBAHUSSAIN4, SOMA RAHMAN5, SHAMSI ARA BEGUM6, ARIFA MANNAN7
1. Medical Officer, 2. Assistant Professor, 3. Registrar, 4. Registrar, 5. Junior Consultant, 6. Assistant Professor, 7.Medical Officer, All from the Dept. of Radiology & Imaging, BIRDEM, Dhaka
BANGLADESH JOURNAL OF RADIOLOGY AND IMAGING 2013; VOL. 21(1): 37-40
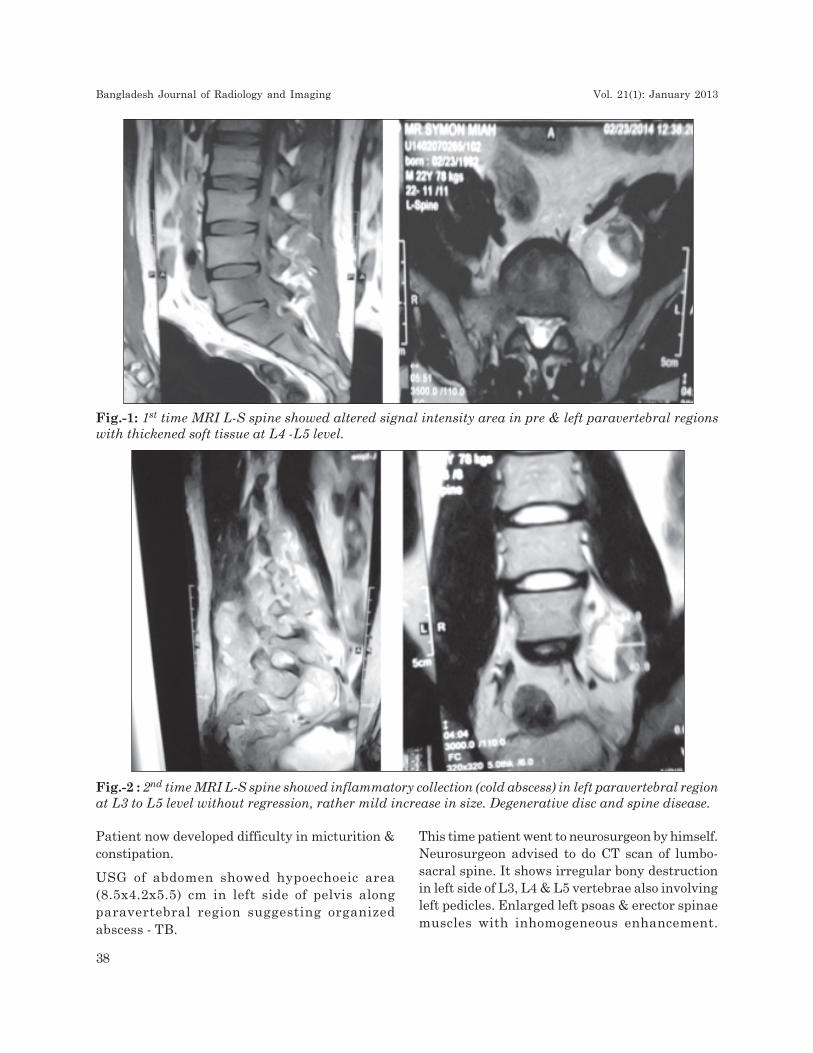
Fig.-1: 1st time MRI L-S spine showed altered signal intensity area in pre & left paravertebral regionswith thickened soft tissue at L4 -L5 level.
Fig.-2 : 2nd time MRI L-S spine showed inflammatory collection (cold abscess) in left paravertebral regionat L3 to L5 level without regression, rather mild increase in size. Degenerative disc and spine disease.
Patient now developed difficulty in micturition &constipation.
USG of abdomen showed hypoechoeic area(8.5x4.2x5.5) cm in left side of pelvis alongparavertebral region suggesting organizedabscess - TB.
This time patient went to neurosurgeon by himself.Neurosurgeon advised to do CT scan of lumbo-sacral spine. It shows irregular bony destructionin left side of L3, L4 & L5 vertebrae also involvingleft pedicles. Enlarged left psoas & erector spinaemuscles with inhomogeneous enhancement.
Bangladesh Journal of Radiology and Imaging Vol. 21(1): January 2013
38
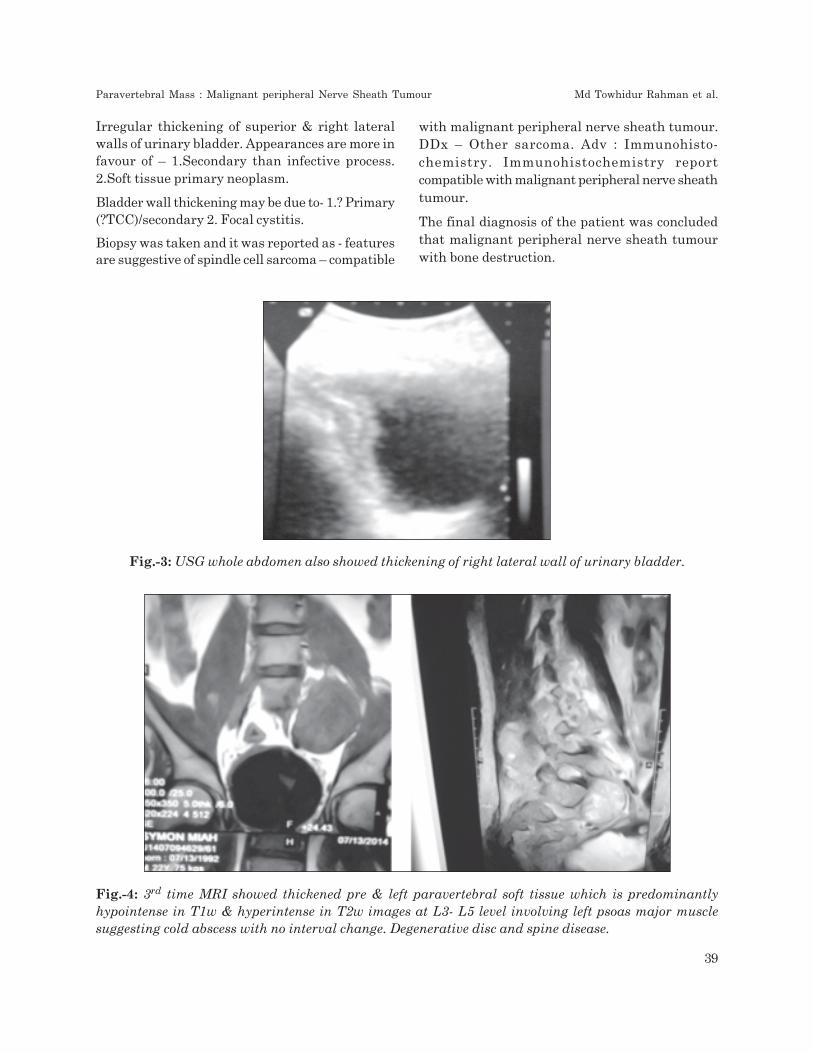
Irregular thickening of superior & right lateralwalls of urinary bladder. Appearances are more infavour of – 1.Secondary than infective process.2.Soft tissue primary neoplasm.
Bladder wall thickening may be due to- 1.? Primary(?TCC)/secondary 2. Focal cystitis.
Biopsy was taken and it was reported as - featuresare suggestive of spindle cell sarcoma – compatible
with malignant peripheral nerve sheath tumour.DDx – Other sarcoma. Adv : Immunohisto-chemistry. Immunohistochemistry reportcompatible with malignant peripheral nerve sheathtumour.
The final diagnosis of the patient was concludedthat malignant peripheral nerve sheath tumourwith bone destruction.
Fig.-3: USG whole abdomen also showed thickening of right lateral wall of urinary bladder.
Fig.-4: 3rd time MRI showed thickened pre & left paravertebral soft tissue which is predominantlyhypointense in T1w & hyperintense in T2w images at L3- L5 level involving left psoas major musclesuggesting cold abscess with no interval change. Degenerative disc and spine disease.
Paravertebral Mass : Malignant peripheral Nerve Sheath Tumour Md Towhidur Rahman et al.
39
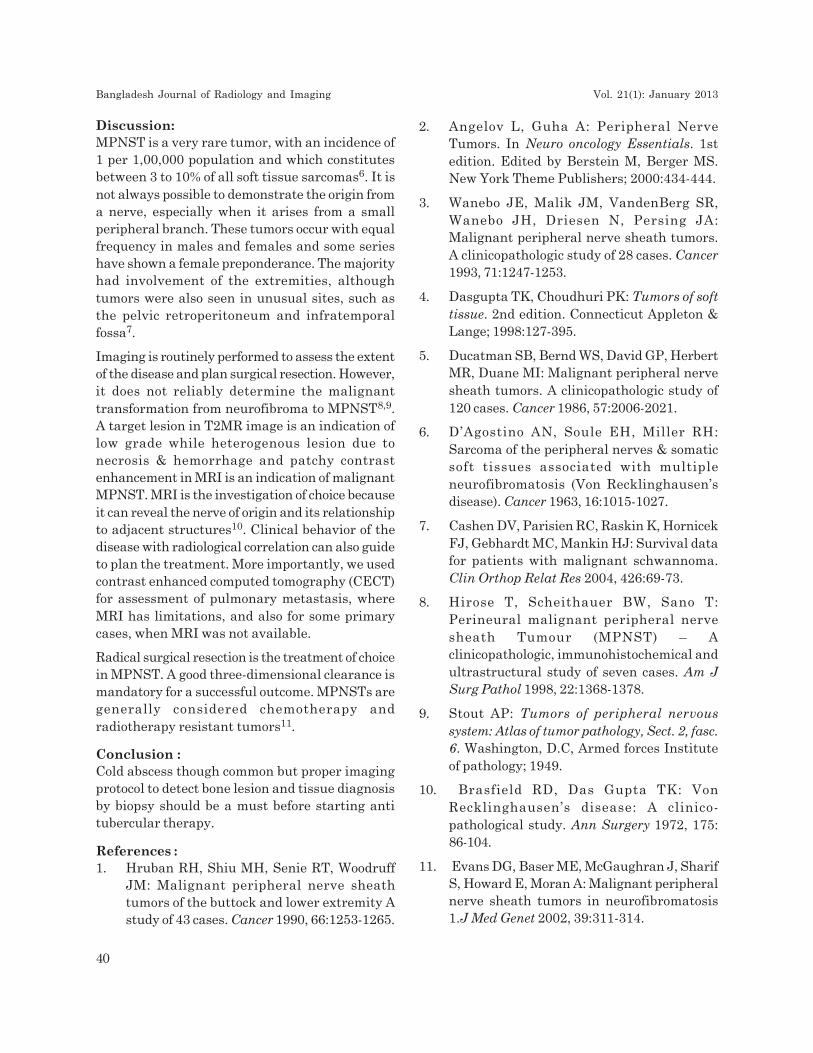
Discussion:MPNST is a very rare tumor, with an incidence of1 per 1,00,000 population and which constitutesbetween 3 to 10% of all soft tissue sarcomas6. It isnot always possible to demonstrate the origin froma nerve, especially when it arises from a smallperipheral branch. These tumors occur with equalfrequency in males and females and some serieshave shown a female preponderance. The majorityhad involvement of the extremities, althoughtumors were also seen in unusual sites, such asthe pelvic retroperitoneum and infratemporalfossa7.
Imaging is routinely performed to assess the extentof the disease and plan surgical resection. However,it does not reliably determine the malignanttransformation from neurofibroma to MPNST8,9.A target lesion in T2MR image is an indication oflow grade while heterogenous lesion due tonecrosis & hemorrhage and patchy contrastenhancement in MRI is an indication of malignantMPNST. MRI is the investigation of choice becauseit can reveal the nerve of origin and its relationshipto adjacent structures10. Clinical behavior of thedisease with radiological correlation can also guideto plan the treatment. More importantly, we usedcontrast enhanced computed tomography (CECT)for assessment of pulmonary metastasis, whereMRI has limitations, and also for some primarycases, when MRI was not available.
Radical surgical resection is the treatment of choicein MPNST. A good three-dimensional clearance ismandatory for a successful outcome. MPNSTs aregenerally considered chemotherapy andradiotherapy resistant tumors11.
Conclusion :Cold abscess though common but proper imagingprotocol to detect bone lesion and tissue diagnosisby biopsy should be a must before starting antitubercular therapy.
References :1. Hruban RH, Shiu MH, Senie RT, Woodruff
JM: Malignant peripheral nerve sheathtumors of the buttock and lower extremity Astudy of 43 cases. Cancer 1990, 66:1253-1265.
2. Angelov L, Guha A: Peripheral NerveTumors. In Neuro oncology Essentials. 1stedition. Edited by Berstein M, Berger MS.New York Theme Publishers; 2000:434-444.
3. Wanebo JE, Malik JM, VandenBerg SR,Wanebo JH, Driesen N, Persing JA:Malignant peripheral nerve sheath tumors.A clinicopathologic study of 28 cases. Cancer1993, 71:1247-1253.
4. Dasgupta TK, Choudhuri PK: Tumors of softtissue. 2nd edition. Connecticut Appleton &Lange; 1998:127-395.
5. Ducatman SB, Bernd WS, David GP, HerbertMR, Duane MI: Malignant peripheral nervesheath tumors. A clinicopathologic study of120 cases. Cancer 1986, 57:2006-2021.
6. D’Agostino AN, Soule EH, Miller RH:Sarcoma of the peripheral nerves & somaticsoft tissues associated with multipleneurofibromatosis (Von Recklinghausen’sdisease). Cancer 1963, 16:1015-1027.
7. Cashen DV, Parisien RC, Raskin K, HornicekFJ, Gebhardt MC, Mankin HJ: Survival datafor patients with malignant schwannoma.Clin Orthop Relat Res 2004, 426:69-73.
8. Hirose T, Scheithauer BW, Sano T:Perineural malignant peripheral nervesheath Tumour (MPNST) – Aclinicopathologic, immunohistochemical andultrastructural study of seven cases. Am JSurg Pathol 1998, 22:1368-1378.
9. Stout AP: Tumors of peripheral nervoussystem: Atlas of tumor pathology, Sect. 2, fasc.6. Washington, D.C, Armed forces Instituteof pathology; 1949.
10. Brasfield RD, Das Gupta TK: VonRecklinghausen’s disease: A clinico-pathological study. Ann Surgery 1972, 175:86-104.
11. Evans DG, Baser ME, McGaughran J, SharifS, Howard E, Moran A: Malignant peripheralnerve sheath tumors in neurofibromatosis1.J Med Genet 2002, 39:311-314.
Bangladesh Journal of Radiology and Imaging Vol. 21(1): January 2013
40

Abstract:Desmoid tumours are histologically benign fibrousneoplasms that arise from musculo-aponeuroticstructures throughout the body. The cause ofdesmoid tumors is uncertain, but may be related totrauma or hormonal factors, or may have a geneticassociation. It can arise in patients with familialadenomatous polyposis (FAP), a disorder caused bygermline adenomatous polyposis coli (APC) genemutation. Here we discuss about a case of desmoidtumor on the inner aspect of the abdominal wallthat mimicked a large subserosal uterine leiomyomain a 16 year old girl who was a known case of familialadenomatous polyposis. Initial clinical examinationof the patient suggested a large intra abdominaltumor, while the transabdominal ultrasoundsuggested a large subserosal uterine leiomyoma asthe initial diagnosis. This case emphasizes theimportance of proper radiological and clinicalinvestigation during the diagnostic process.
Keywords: desmoid, fibroid, ultrasound,FAP.
Introduction:FAP is an autosomal dominant disease caused bygermline abnormality of the adenomatous polyposiscoli (APC) gene on the long arm of chromosome 51
. Familial adenomatous polyposis (FAP) is ahereditary condition transmitted in an autosomaldominant fashion, which is characterized by theappearance of numerous adenomatous polyps inthe colon. This condition results from mutation ofthe APC gene and accounts for 1% of cases ofcolorectal cancer2. FAP is frequently associatedwith extracolonic manifestations: desmoid tumors,osteomas, pigmented lesions of the retina,adenomas of the upper gastrointestinal tract, andepidermoid cysts, as well as gastric, thyroid,suprarenal, and central nervous system cancer2.
The desmoid tumor (DT) is a benign neoplasm thatoccurs in 10%–20% of the patients with FAP. Itoriginates from fascial or muscle-aponeurotic
structures that foster fibroblast proliferation. DTsoccur more frequently in the intra-abdominal regionor the abdominal wall, although they can also bedetected in extra-abdominal areas. It is a rare type oftumor, representing 0.03% of neoplasms. Comparedwith the general population, a patient with FAP is atan 852-fold increased risk of developing a DT.
Case Report:A 16-year-old girl went to a doctor with thecomplaints of altered bowel habit and per rectalbleeding two years back. Colonoscopy of the patientrevealed whole of her colon except the caecum wasstudded with numerous polyps of variable sizes andsuggested that it was a case of adenomatouspolyposis, biopsies were taken from multiple sites.All the specimens were consistent withadenomatous polyps. With this she underwentrestorative pan- procto- cololectomy with ilealpouch and ileoanal staple anastomosis. She wasreasonably well for the next one and half years.Then she developed swelling in her lower abdomenwhich was gradually enlarging in size. She reportedthis to the attending physician. On examinationthe swelling was located in the pelvis as a firmmass measuring around 9 × 9 cm with limitedmobility. She was advised for a ultrasonogrphy ofabdomen. Abdominal USG showed a well definedmixed echogenic mass measuring about 10x09 cmin lower abdomen which was closely related to theanterior abdominal wall and separated from thefundus of uterus. Both adnexal regions werenormal and pouch of douglus was free of anycollection. A CT scan with oral and IV contrastwas also performed and was reported as - largewell defined solid mass lesion measuring about13x9,6x12 cm in the anterior aspect of lowerabdomen which causes buldging of the abdominalwall and compressed the adjacent structures (bowelloops, right psoas muscle), extending medially andposteriorly, and reaching the right side of thefundus of the uterus. possibilities are: a) Desmoid
Lower Abdominal Mass in A Patient of FamilialAdenomatous Polyposis: A Case Report
TARANNUM MORSHED1, A S MOHIUDDIN2, MOHITUL ALAM3
1. Senior Medical Officer, Dept. of Radiology and Imaging, BIRDEM, 2. Professor and Head, Dept. of Radiology andImaging, BIRDEM, 3. Senior Medical Officer, Dept. of Radiology and Imaging, BIRDEM
BANGLADESH JOURNAL OF RADIOLOGY AND IMAGING 2013; VOL. 21(1): 41-44
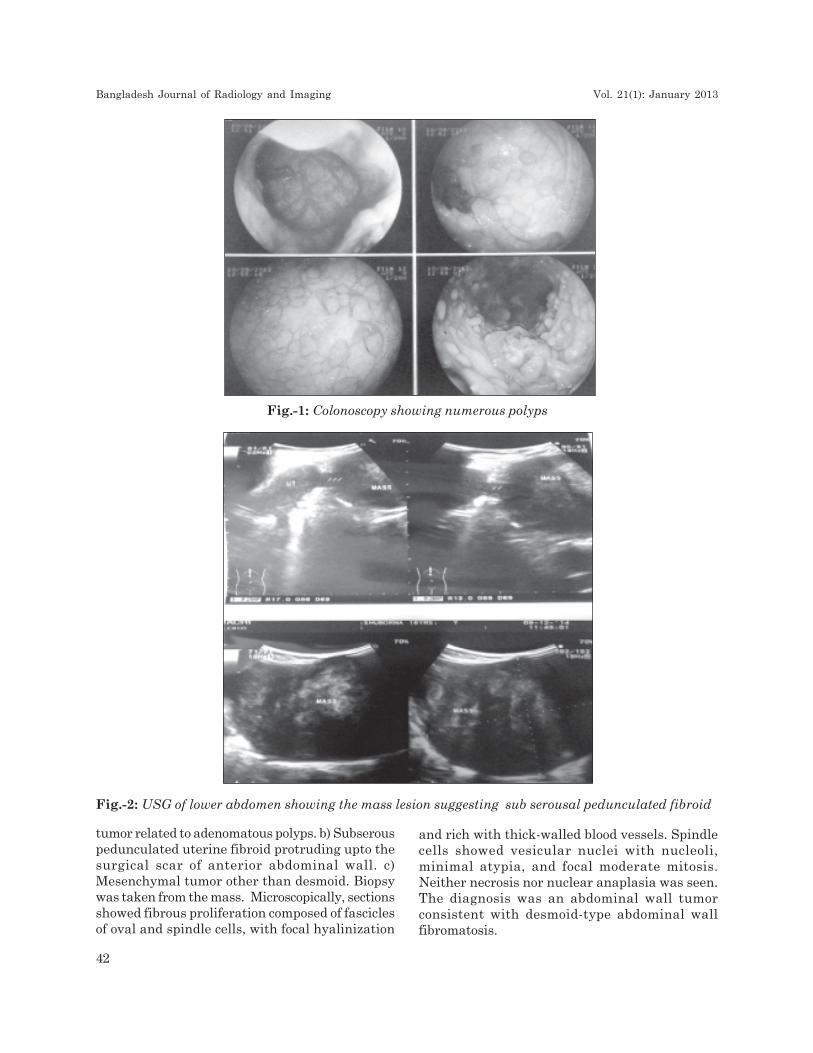
Fig.-1: Colonoscopy showing numerous polyps
Fig.-2: USG of lower abdomen showing the mass lesion suggesting sub serousal pedunculated fibroid
tumor related to adenomatous polyps. b) Subserouspedunculated uterine fibroid protruding upto thesurgical scar of anterior abdominal wall. c)Mesenchymal tumor other than desmoid. Biopsywas taken from the mass. Microscopically, sectionsshowed fibrous proliferation composed of fasciclesof oval and spindle cells, with focal hyalinization
and rich with thick-walled blood vessels. Spindlecells showed vesicular nuclei with nucleoli,minimal atypia, and focal moderate mitosis.Neither necrosis nor nuclear anaplasia was seen.The diagnosis was an abdominal wall tumorconsistent with desmoid-type abdominal wallfibromatosis.
Bangladesh Journal of Radiology and Imaging Vol. 21(1): January 2013
42
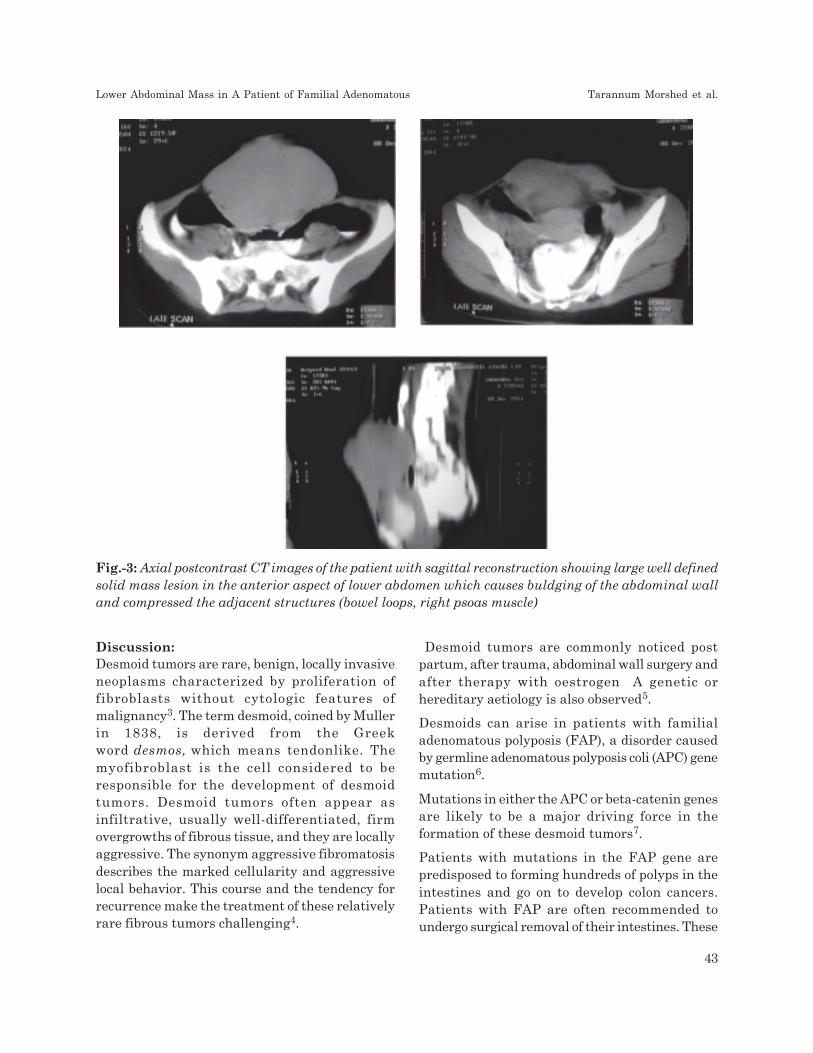
Discussion:Desmoid tumors are rare, benign, locally invasiveneoplasms characterized by proliferation offibroblasts without cytologic features ofmalignancy3. The term desmoid, coined by Mullerin 1838, is derived from the Greekword desmos, which means tendonlike. Themyofibroblast is the cell considered to beresponsible for the development of desmoidtumors. Desmoid tumors often appear asinfiltrative, usually well-differentiated, firmovergrowths of fibrous tissue, and they are locallyaggressive. The synonym aggressive fibromatosisdescribes the marked cellularity and aggressivelocal behavior. This course and the tendency forrecurrence make the treatment of these relativelyrare fibrous tumors challenging4.
Fig.-3: Axial postcontrast CT images of the patient with sagittal reconstruction showing large well definedsolid mass lesion in the anterior aspect of lower abdomen which causes buldging of the abdominal walland compressed the adjacent structures (bowel loops, right psoas muscle)
Desmoid tumors are commonly noticed postpartum, after trauma, abdominal wall surgery andafter therapy with oestrogen A genetic orhereditary aetiology is also observed5.
Desmoids can arise in patients with familialadenomatous polyposis (FAP), a disorder causedby germline adenomatous polyposis coli (APC) genemutation6.
Mutations in either the APC or beta-catenin genesare likely to be a major driving force in theformation of these desmoid tumors7.
Patients with mutations in the FAP gene arepredisposed to forming hundreds of polyps in theintestines and go on to develop colon cancers.Patients with FAP are often recommended toundergo surgical removal of their intestines. These
Lower Abdominal Mass in A Patient of Familial Adenomatous Tarannum Morshed et al.
43
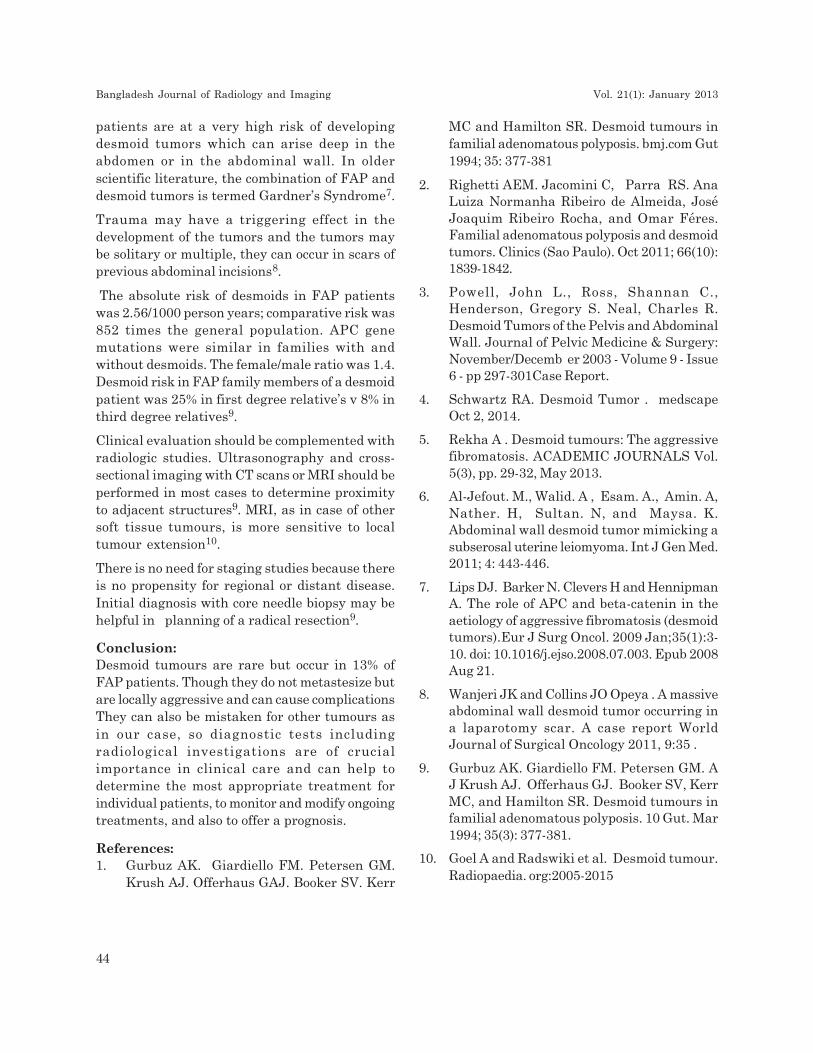
patients are at a very high risk of developingdesmoid tumors which can arise deep in theabdomen or in the abdominal wall. In olderscientific literature, the combination of FAP anddesmoid tumors is termed Gardner’s Syndrome7.
Trauma may have a triggering effect in thedevelopment of the tumors and the tumors maybe solitary or multiple, they can occur in scars ofprevious abdominal incisions8.
The absolute risk of desmoids in FAP patientswas 2.56/1000 person years; comparative risk was852 times the general population. APC genemutations were similar in families with andwithout desmoids. The female/male ratio was 1.4.Desmoid risk in FAP family members of a desmoidpatient was 25% in first degree relative’s v 8% inthird degree relatives9.
Clinical evaluation should be complemented withradiologic studies. Ultrasonography and cross-sectional imaging with CT scans or MRI should beperformed in most cases to determine proximityto adjacent structures9. MRI, as in case of othersoft tissue tumours, is more sensitive to localtumour extension10.
There is no need for staging studies because thereis no propensity for regional or distant disease.Initial diagnosis with core needle biopsy may behelpful in planning of a radical resection9.
Conclusion:Desmoid tumours are rare but occur in 13% ofFAP patients. Though they do not metastesize butare locally aggressive and can cause complicationsThey can also be mistaken for other tumours asin our case, so diagnostic tests includingradiological investigations are of crucialimportance in clinical care and can help todetermine the most appropriate treatment forindividual patients, to monitor and modify ongoingtreatments, and also to offer a prognosis.
References:1. Gurbuz AK. Giardiello FM. Petersen GM.
Krush AJ. Offerhaus GAJ. Booker SV. Kerr
MC and Hamilton SR. Desmoid tumours infamilial adenomatous polyposis. bmj.com Gut1994; 35: 377-381
2. Righetti AEM. Jacomini C, Parra RS. AnaLuiza Normanha Ribeiro de Almeida, JoséJoaquim Ribeiro Rocha, and Omar Féres.Familial adenomatous polyposis and desmoidtumors. Clinics (Sao Paulo). Oct 2011; 66(10):1839-1842.
3. Powell, John L., Ross, Shannan C.,Henderson, Gregory S. Neal, Charles R.Desmoid Tumors of the Pelvis and AbdominalWall. Journal of Pelvic Medicine & Surgery:November/Decemb er 2003 - Volume 9 - Issue6 - pp 297-301Case Report.
4. Schwartz RA. Desmoid Tumor . medscapeOct 2, 2014.
5. Rekha A . Desmoid tumours: The aggressivefibromatosis. ACADEMIC JOURNALS Vol.5(3), pp. 29-32, May 2013.
6. Al-Jefout. M., Walid. A , Esam. A., Amin. A,Nather. H, Sultan. N, and Maysa. K.Abdominal wall desmoid tumor mimicking asubserosal uterine leiomyoma. Int J Gen Med.2011; 4: 443-446.
7. Lips DJ. Barker N. Clevers H and HennipmanA. The role of APC and beta-catenin in theaetiology of aggressive fibromatosis (desmoidtumors).Eur J Surg Oncol. 2009 Jan;35(1):3-10. doi: 10.1016/j.ejso.2008.07.003. Epub 2008Aug 21.
8. Wanjeri JK and Collins JO Opeya . A massiveabdominal wall desmoid tumor occurring ina laparotomy scar. A case report WorldJournal of Surgical Oncology 2011, 9:35 .
9. Gurbuz AK. Giardiello FM. Petersen GM. AJ Krush AJ. Offerhaus GJ. Booker SV, KerrMC, and Hamilton SR. Desmoid tumours infamilial adenomatous polyposis. 10 Gut. Mar1994; 35(3): 377-381.
10. Goel A and Radswiki et al. Desmoid tumour.Radiopaedia. org:2005-2015
Bangladesh Journal of Radiology and Imaging Vol. 21(1): January 2013
44
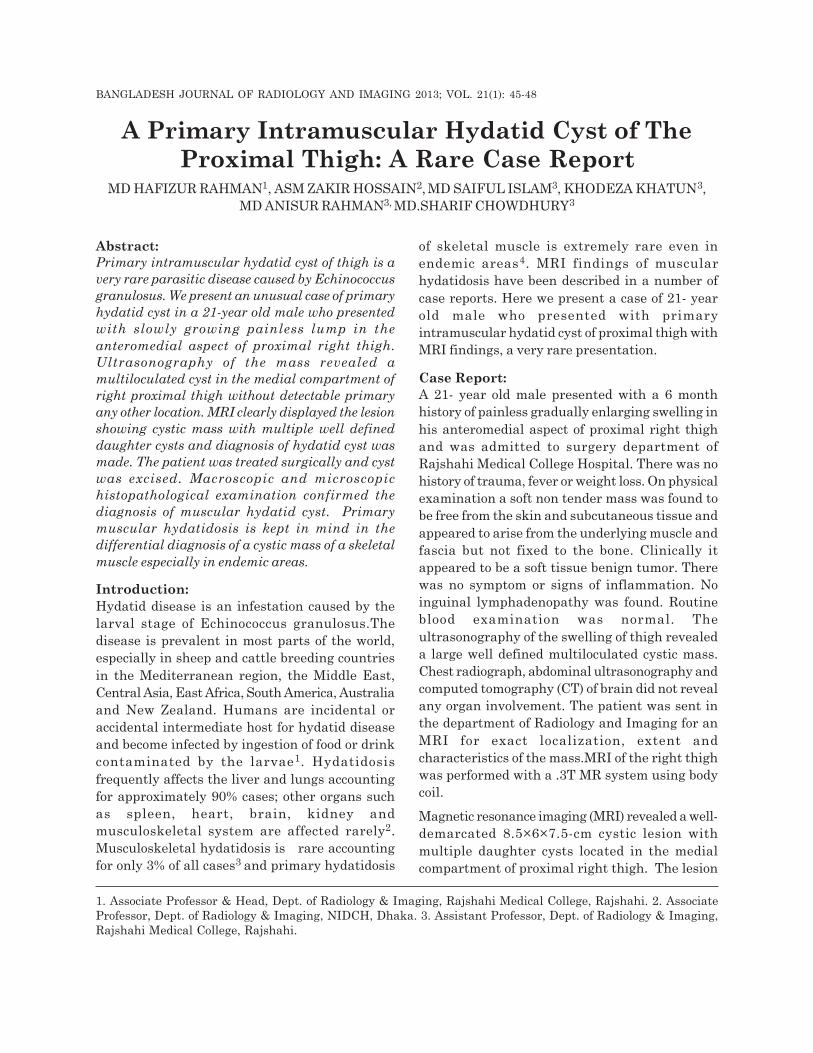
Abstract:Primary intramuscular hydatid cyst of thigh is avery rare parasitic disease caused by Echinococcusgranulosus. We present an unusual case of primaryhydatid cyst in a 21-year old male who presentedwith slowly growing painless lump in theanteromedial aspect of proximal right thigh.Ultrasonography of the mass revealed amultiloculated cyst in the medial compartment ofright proximal thigh without detectable primaryany other location. MRI clearly displayed the lesionshowing cystic mass with multiple well defineddaughter cysts and diagnosis of hydatid cyst wasmade. The patient was treated surgically and cystwas excised. Macroscopic and microscopichistopathological examination confirmed thediagnosis of muscular hydatid cyst. Primarymuscular hydatidosis is kept in mind in thedifferential diagnosis of a cystic mass of a skeletalmuscle especially in endemic areas.
Introduction:Hydatid disease is an infestation caused by thelarval stage of Echinococcus granulosus.Thedisease is prevalent in most parts of the world,especially in sheep and cattle breeding countriesin the Mediterranean region, the Middle East,Central Asia, East Africa, South America, Australiaand New Zealand. Humans are incidental oraccidental intermediate host for hydatid diseaseand become infected by ingestion of food or drinkcontaminated by the larvae1. Hydatidosisfrequently affects the liver and lungs accountingfor approximately 90% cases; other organs suchas spleen, heart, brain, kidney andmusculoskeletal system are affected rarely2.Musculoskeletal hydatidosis is rare accountingfor only 3% of all cases3 and primary hydatidosis
of skeletal muscle is extremely rare even inendemic areas4. MRI findings of muscularhydatidosis have been described in a number ofcase reports. Here we present a case of 21- yearold male who presented with primaryintramuscular hydatid cyst of proximal thigh withMRI findings, a very rare presentation.
Case Report:A 21- year old male presented with a 6 monthhistory of painless gradually enlarging swelling inhis anteromedial aspect of proximal right thighand was admitted to surgery department ofRajshahi Medical College Hospital. There was nohistory of trauma, fever or weight loss. On physicalexamination a soft non tender mass was found tobe free from the skin and subcutaneous tissue andappeared to arise from the underlying muscle andfascia but not fixed to the bone. Clinically itappeared to be a soft tissue benign tumor. Therewas no symptom or signs of inflammation. Noinguinal lymphadenopathy was found. Routineblood examination was normal. Theultrasonography of the swelling of thigh revealeda large well defined multiloculated cystic mass.Chest radiograph, abdominal ultrasonography andcomputed tomography (CT) of brain did not revealany organ involvement. The patient was sent inthe department of Radiology and Imaging for anMRI for exact localization, extent andcharacteristics of the mass.MRI of the right thighwas performed with a .3T MR system using bodycoil.
Magnetic resonance imaging (MRI) revealed a well-demarcated 8.5×6×7.5-cm cystic lesion withmultiple daughter cysts located in the medialcompartment of proximal right thigh. The lesion
A Primary Intramuscular Hydatid Cyst of TheProximal Thigh: A Rare Case Report
MD HAFIZUR RAHMAN1, ASM ZAKIR HOSSAIN2, MD SAIFUL ISLAM3, KHODEZA KHATUN3,MD ANISUR RAHMAN3, MD.SHARIF CHOWDHURY3
1. Associate Professor & Head, Dept. of Radiology & Imaging, Rajshahi Medical College, Rajshahi. 2. AssociateProfessor, Dept. of Radiology & Imaging, NIDCH, Dhaka. 3. Assistant Professor, Dept. of Radiology & Imaging,Rajshahi Medical College, Rajshahi.
BANGLADESH JOURNAL OF RADIOLOGY AND IMAGING 2013; VOL. 21(1): 45-48
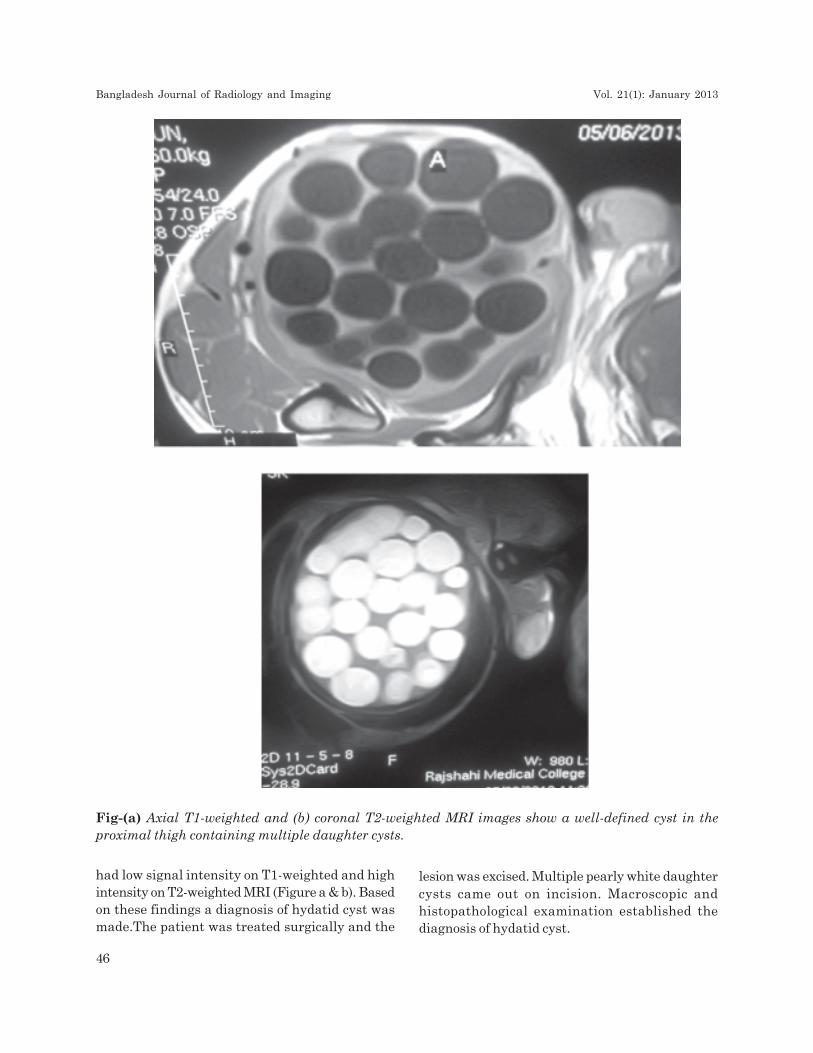
Fig-(a) Axial T1-weighted and (b) coronal T2-weighted MRI images show a well-defined cyst in theproximal thigh containing multiple daughter cysts.
had low signal intensity on T1-weighted and highintensity on T2-weighted MRI (Figure a & b). Basedon these findings a diagnosis of hydatid cyst wasmade.The patient was treated surgically and the
lesion was excised. Multiple pearly white daughtercysts came out on incision. Macroscopic andhistopathological examination established thediagnosis of hydatid cyst.
Bangladesh Journal of Radiology and Imaging Vol. 21(1): January 2013
46
Discussion:Hydatid cyst is an acquired zoonotic disease causedby larval stage of the tapeworm genusEchinococcus granulosus, E.multilocularis and E.oligarthus. More than 90% of hydatid cysts occurin the liver, lungs or both5. The liver acts as afirst line of defense and mostly involved (75%)followed by involvement of the lungs (15%) whichact as the second infiltration of the hydatid cyst.Haematogeneous dissemination may lead tosecondary involvement of almost any anatomicallocation6. The Muscular hydatid cyst is usuallyinvolved as a part of dissemination from other area,either spontaneously or after previous operationsfor hydatidosis in other region of the body7. Primaryhydatid disease of skeletal muscle is extremelyrare and present in approximately 3% of the patient.Theoretically the muscle is unfavorable forechinococcal infection because of its contractilityand high lactic acid2. The tropism to the musclesof the neck, trunk and root of the limbs can beexplained with the increased vascularization andthe decreased muscular activity7.
Muscular hydatid cyst usually presents with a longhistory of slowly growing lump and may mimic asoft tissue tumor producing symptoms related topressure on the surrounding tissue8.Eosinophiliafound in about 50% cases. The serological andimmunological tests are not pathognomic forhydatid disease. The diagnosis of muscular hydatidcyst can be made by clinical history and by advancedradiological techniques like USG, CT scan and MRIimaging by the characteristics appearance ofunilocular or multilocular cyst multiple daughtercysts as it was seen in our case in USG and MRI9.
Ultrasonography is a noninvasive and cheap widelyused primary imaging modality for soft tissuehydatid cyst. The CT appearance of hydatid cyst issometimes not diagnostic as it may mimicmalignant and benign conditions such as congenitalcyst, pseudocyst or hematoma. However, thepresence of daughter cysts, detached membranesand calcifications may confirm the diagnosis. Theextent and characteristics of the mass were detailedwith MRI. The classic MRI findings include amultivesicular cyst, a low intensity rim “rim sign”on T2-weighted images, a detached membrane or
collapse membrane in the dependent part ofmother cyst “Water-lily sign”10. The mostpathognomic sign is that of daughter cysts.According to Dies et al. the presence of viabledaughter cyst MRI conveyed high signal intensityon T2-weighted images. Hypointensity of daughtercysts compared with the matrix of mother cyst onT2-weighted images is clue for the death of theparasites11.
Conclusion:Primary intramuscular hydatid cyst is extremelyrare disease. The hydatid cyst can affect any partof the body and no site is immune. The purpose ofthis case report is to create a awareness thathydatid cyst should be considered in the differentialdiagnosis of every cystic mass in any anatomiclocation especially when they occur in areas wherethe disease is endemic.Ultrasonography is theprimary imaging modality for the diagnosis ofintramuscular hydatid cyst which is more clearlydisplayed in the MRI scan. In localization anddetecting the characterization of the cyst MRI isuseful in diagnosis and treatment planning. MRImay possibly also be useful in evaluating thevitality of the cyst.
References:1. Goel MC, Agarwal MR, MisraA. Percutaneous
drainage of renal hydatid cyst: early resultand follow-up. Br J urol 1995;75:724-728.
2. Garcia Diez, Ros Mendoza LH, VillacampaVM, Cozar M, Fuertes ML. MRI evaluationof soft tissue hydatid disease. EurRadiol 2000;10(3): 462-466.
3. Rask MR, Latting GJ. Primary intramuscularhydatidosis of the sartorius. Report of a case.Am J Bone joint Surg 1970 Apr;52(3): 582-584.
4. Guthrie JA, Lawto Jo, Chalmers AG. Casereport; MR appearance of primaryintramuscular hydatid disease. Clin Radiol1996 May; 51(5): 377-379).
5. V. Arora, I S Nijjar, K S Gill, Sing G.Primaryhydatid cyst of muscle- A rare site. Indian JRadiol Imaging 2006;16:239-41.
A Primary Intramuscular Hydatid Cyst of The Proximal Thigh Md Hafizur Rahman et al.
47

6. CJ Kazakos, VG Galanis, D-AJ Verettas, APolychronnidis, C Simopoulos. Primaryhydatid disease in femoral muscle. Thejournal of internal Medical Reserch2000;10(3):462-66.
7. Mehmet Haydar Atalar, Levent Cankorhmaz,Gokhan Koyluoglu, Ismail Salk. Imagingcharacteristics of three primary muscularhydatid cyst cases with various pattern.Kafkas J Med Sci 2012;2(2):74-77
8. Sankappa P, Sinhasan, A Palanchandra.Primary intramuscular hydatid cyst: A rarecase report. Ann Trop Med Public heath2012;5:546-8.
9. A Gupta, RP Singal, S Gupta, R Singal. Hydatid
cyst of thigh diagnosed on Ultrasonography-
a rare case report. J Med Life. 2012
June12;5(2):196-197.
10. H. Rokni Yazdi, H. Sotoudeh, H. Sharesh,
A.Yazdebadi. A case of primary adductor
muscle hydatidosis: Water-Lily sign on
Magnetic Resonance Imaging. Iran J Radiol.
Summer 2007;4(4):223-6
11. Martin J, Marco V, Zidan A, Marco C. Hydatid
disease of soft tissue of the lower limb:
findings in three cases. Skeletal Radiol
1993;22(7):511-514.
Bangladesh Journal of Radiology and Imaging Vol. 21(1): January 2013
48

Edited and Published by Prof. Abu Saleh Mohiuddin on behalf of the Bangladesh Society of Radiogy & Imaging
Dhaka-1000, Bangladesh and Printed at Asian Colour Printing, 130 DIT Extension Road, Fakirerpool, Dhaka-1000,
Bangladesh, Phone: 58313186, 9357726, E-mail:[email protected]

![European Journal of Radiology · Journal of Radiology 87 (2017) 76–82 Contents lists available at ScienceDirect European Journal of Radiology j ... [MRI]) [2,4] have reported that](https://img.pdfslide.us/doc/110x75/5cb0677988c993767e8c67df/european-journal-of-radiology-journal-of-radiology-87-2017-7682-contents.jpg)