Embed Size (px)
Citation preview

Bangalore Mobility Indicators (2010 – 2011) Study – Draft Final Report
i Directorate of Urban Land Transport
Draft Final Report
Submitted to
Directorate of Urban Land Transport (DULT)
By
Urban Mass Transit Company Limited
BANGALORE
MOBILITY
INDICATORS 2010-11
Bangalore Mobility Indicators (2010 – 2011) Study – Draft Final Report
ii Directorate of Urban Land Transport
Contents
List of Contents Page No
Chapter 1 – Introduction 1
1.1 Preamble 1
1.2 Need for the Study 2
1.3 Study Area Profile 4
1.4 Scope of Work 5
1.5 Limitations of Study Initiative 5
1.6 Service Level Benchmarks – Concept & Necessity 5
1.7 Objectives of the study 6
1.8 Report Layout
Chapter 2 – Performance Measures 7
2.1 Mobility Indicators 7
2.2 Service Level Benchmarks 7
2.3 Output from the study 9
Chapter 3 – Bangalore Today 10
3.1 Back Ground 10
3.2 Road Network 10
3.3 Demographics 11
3.4 Land use Distribution 14
3.5 Transport Trends 14
Chapter 4 – Data Collection & Results 16
4.1 Primary Data Collection 16
4.2 Household Interview Survey 16
4.3 Road Network Inventory 18
4.4 Light Meter Survey 22
4.5 Speed and Delay Survey 23
4.6 Bus Passenger Count & Waiting Time Survey 25
4.7 Secondary Data Collection 28
Chapter 5 – Computation of Benchmarks & Indices 34
5.1 Introduction 34
5.2 Service Level Benchmarks 34
5.3 Mobility Indicators 56
5.4 Data Reliability 66
Chapter 6 – Conclusions 69

Bangalore Mobility Indicators (2010 – 2011) Study – Draft Final Report
iii Directorate of Urban Land Transport
Annexures
Annexure Service Level Benchmark for Urban Transport
Annexure Urban Bus Specifications
Annexure HHI Survey Format
Annexure Road Network Inventory Details
Annexure Speeds on various corridors
Annexure Pollution Data
Annexure Level of Service and data reliable measures

Bangalore Mobility Indicators (2010 – 2011) Study – Draft Final Report
1 Directorate of Urban Land Transport
Chapter – 1
Introduction
1.1 Preamble
In any urban area, mobility forms one
of the key functionalities in the field
of transportation. Attempts to
improve mobility appears to be
negligent of pedestrians, non-
motorized and local area travel.
Improvements are generally supply-
driven; overly accommodating to
individual motor vehicles;
conservative in public transport regulations; non-protective of street based
public transport modes; and overly focused on large-scale investments like
widening roads and building elevated corridors, in apparent belief that these
visible structures will increase the image of competitiveness of the city. This
has been due to a lack of comprehensive information on the issue of the
different facets of mobility in the City. In this regard, the Directorate of
Urban Land Transport (DULT) in the year 2008 initiated a study to identify a
set of transportation indicators towards assessing mobility in Bangalore. These
indicators will help in policy decision making.
The indicators can serve many purposes. They will provide trend information
from which implications for transportation can be drawn or from which
transportation policy and investment decisions are made. They can provide a
basis for comparisons among metropolitan sub-areas. They can provide the
public with a sense of whether system performance is improving or getting
worse over time.
This study is an effort in this direction in making a comparative statement of
present and past indicator levels.
1.2 Need for the Study
The Bangalore Mobility Indicators 2008 study was the first study initiated in
Bangalore to identify a series of indicators that are essential to track the

Bangalore Mobility Indicators (2010 – 2011) Study – Draft Final Report
2 Directorate of Urban Land Transport
progress of various interventions towards addressing mobility. The study
showcased several issues like congestion and accessibility at different
locations of the city. The results had necessitated the need to take up
development measures from concerned agencies in the next couple of years.
Hence, it is now the time to assess the performance of these developmental
measures undertaken during the last two years. Consequently, DULT has
awarded this project to Urban Mass Transit Company Limited (UMTC) to re-
establish the earlier indicators and do a comparison over the years.
1.3 Study Area Profile
The study area for the proposed work includes the limits of Bruhat Bangalore
Mahanagara Palike (BBMP) and Bangalore International Airport Area Planning
Authority (BIAAPA). The earlier study was limited to BBMP area alone. This
study includes the BIAAP area in addition to the 8 zones of BBMP. Hence, the
entire study area is divided in to 11 zones. The area is shown in Figure 1.1.
The total area of the study area is 1831.23 sq. km.
The zone map is presented in Figure 1.2
Figure 1.1: Study Area

Bangalore Mobility Indicators (2010 – 2011) Study – Draft Final Report
3 Directorate of Urban Land Transport
The zone details are as follows:
Zone 1 : Bangalore West
Zone 2 : Bangalore East
Zone 3 : Bangalore South
Zone 4 : Byatarayanapura
Zone 5 : Mahadevapura
Zone 6 : Bommanahalli
Zone 7 : Rajarajeshwari Nagara
Zone 8 : Dasarahalli
Zone 9 : Bangalore North Taluk
Zone 10: Devanahalli Taluk
Zone 11: Doddaballapura Taluk
1.2: Zone map

Bangalore Mobility Indicators (2010 – 2011) Study – Draft Final Report
4 Directorate of Urban Land Transport
1.4 Scope of work
The current study would be a comprehensive study establishing Service Level
Benchmarks initiated by the MoUD and also recompiling the Mobility Indicators
for 2010-11 (comparison with earlier study) for Bangalore City.
The Consultant, would establish the specified SLBs for the assessment of
overall level of service in the following areas:
Quality and financial sustainability of public transport
Pedestrian and NMT safety and infrastructure facilities
ITS facilities in Bangalore
Land use and transport integration
Parking system
Pollution levels
Road safety
Typically, four levels of service (LoS) have been specified (LoS 1, LoS 2, LoS 3
and LoS 4) with LoS 1 being the highest and LoS 4 being the lowest to measure
each identified performance benchmark. The goal is to attain the service level
1.
The other part of the study would involve updating the mobility indicators
developed in the 2008 study. The updated indicators would provide the public
with a sense of whether system performance is improving or getting worse.
The following indicators grouped under congestion, mobility and accessibility
measures will be updated:

Bangalore Mobility Indicators (2010 – 2011) Study – Draft Final Report
5 Directorate of Urban Land Transport
1.5 Limitations of Earlier Study (Bangalore Mobility Indicators 2008)
It is recognized that the initiative of the 2008 study has a number of
limitations. The performance indicators to be truly meaningful need extensive
data collection. This would include large number of primary surveys,
secondary information in usable format and in a timely manner. The 2008
study established the mobility indicators on the backdrop of a major transport
study and hence had the resource of a huge house hold study data (about
50,000 samples) and a calibrated model. While this provided a very good
source for computing indicators, the challenges of recompilation of the indices
in the future years without the aid of such intensive database is real. The
performance indicators determined in the earlier study can be further refined
in the future years provided such exhaustive required data (primary and
secondary data) is available.
It is important that the basic minimum standard set of performance
benchmarks are commonly understood and used by all stakeholders. Also,
indicators based on public opinion may have fluctuating results and hence not
very reliable while these need to be reviewed.
1.6 Service Level Benchmarks – Concept and Necessity
The Ministry of Urban Development (MoUD) in the mean time has recognized
the kinds of issues and challenges in developing mobility indices and hence,
has come up with the development of a set of service level benchmarks (See
Annexure 1 Service Level Benchmark Guidelines). DULT hence have (through
this TOR aimed at establishing Service Level Benchmarks. The MoUD
Benchmarks are easy to apply and are non-subjective.
1.7 Objective of the Study
The main objective of the present study as defined in the Terms of Reference
(TOR) is to update the indicators from the previous study. It should analyze
the consequences of the activities taken place following the earlier study.
The study should identify the impact of the developmental activities such as
widening of roads, construction of grade separators, foot paths, bus stands and
bus bays. The analysis of the impacts should lead to guiding further mobility
improvements

Bangalore Mobility Indicators (2010 – 2011) Study – Draft Final Report
6 Directorate of Urban Land Transport
1.8 Report Layout
This report considers the significance of service level benchmarks for the
Bangalore city in this introduction Chapter.
Clear understanding of what is a performance indicator, its definition & usage;
its components are represented in the Chapter 2.
Chapter 3 describes abour the city profile of bangalore.
Chapter 4 describes various surveys that have been conducted and their
results. These surveys provide insight in the social, economic and
transportation dimensions of the entire Bangalore City.
The computation of indices procedure is described in Chapter 5 along with a
comparison table of 2008 study with 2011 study
Chapter 6 ends with a conclusion on performance of the city.

Bangalore Mobility Indicators (2010 – 2011) Study – Draft Final Report
7 Directorate of Urban Land Transport
Chapter – 2
Performance Measures
2.1 Mobility Indicators
The Mobility Indicators formulated to measure the performance of the
transportation system are listed below
Road Safety Index
Congestion Index
Travel Time Index
Slow Moving Vehicle Index
City Bus Supply Index
Para transit Index
Cycling Index
Walkability Index
On-street parking interference Index
Vehicle kilometers Traveled
Passenger kilometers Traveled
Total Delay (vehicle-hours and person-hours)
Public Transport Accesibility Index
Service Accessibilty Index
2.2 Service Level Benchmarks
Service level performance indicators have been identified for the following
areas by the Ministry of Urban Development (MoUD), they include:
1. Public transport facilities
Presence of organized public transport system in urban area (%)
Extent of supply availability of public transport
Service coverage of public transport in the city
Average waiting time for public transport users (mins)
Level of comfort in public transport
% of fleet as per urban bus specification
2. Pedestrian infrastructure facilities

Bangalore Mobility Indicators (2010 – 2011) Study – Draft Final Report
8 Directorate of Urban Land Transport
Signalized intersection delay (%)
Street Lighting (Lux)
% of city covered
3. Non Motorized Transport (NMT)facilities
% of network covered
Encroachment on NMT roads by vehicle parking (%)
NMT parking facilities at interchanges (%)
4. Level of usage of Intelligent Transport System (ITS) facilities
Availability of traffic surveillance (%)
Passenger Information System (PIS) (%)
Global Positioning System (GPS)/ General Pocket Radio Service
(GPRS) (%)
Signal Synchronization (%)
Integrated ticketing System (%)
5. Travel speed (Motorized and Mass Transit) along major corridors
Average travel speed of personal vehicles (Kmph)
Average travel speed of public transport (Kmph)
6. Availability of parking spaces
Availability of on street paid public parking spaces (%)
Ratio of maximum and minimum parking fee in the city
7. Road safety
Fatality rate per lakhs population
Fatality rate for pedestrian and NMT (%)
8. Pollution levels
SO2
Oxides of Nitrogen
SPM
RSPM (Size less than 10 microns)
9. Integrated land use transport system
Financial Population Density – Gross (Persons/Developed area in
hectare)
Mixed Land-use on Major Transit Corridors / Network (% area under
non residential use)

Bangalore Mobility Indicators (2010 – 2011) Study – Draft Final Report
9 Directorate of Urban Land Transport
Intensity of Development – City wide (FSI)
Intensity of development along transit corridor (FSI transit
corridor/FSI)
Clear Pattern and Completeness of the network
% of area under Roads
%age network having exclusive ROW for Transit network
10. sustainability of public transport
Extent of Non fare Revenue (%)
Staff /bus ratio
Operating Ratio
2.3 Output from the Study
The key outputs from the study are
1. Service level benchmarks which define the Level of service for
different areas of transportation system for the study area
2. Performance indicators

Bangalore Mobility Indicators (2010 – 2011) Study – Draft Final Report
10 Directorate of Urban Land Transport
Chapter – 3
Bangalore Today
3.1 Background
Bangalore, the Capital of
Karnataka, is the fifth largest
metropolitan city in the country.
It is well known nationally and
internationally as a destination of
choice for high-technology
industries, particularly in the
IT/ITES and Biotechnology
sectors. The high-tech industries
such as Aerospace, Electronics
and Computers have made Bangalore their home due to easy access to a vast
pool of scientists and engineers in the city. It is a city that has transformed
itself from a “pensioners‟ paradise” to a modern thriving cosmopolitan
metropolis. Situated at about 960 meters above sea level, Bangalore is known
for its salubrious climate where temperatures remain moderate throughout the
year with temperatures ranging between 33°C and 16°C, with an average of
24°C. Bangalore receives adequate rainfall of about 860 mm from the
Northeast Monsoon as well as the Southwest Monsoon.
3.2 Road Network
NH7 and NH4 (part of North South Corridor and Golden Quadrilateral,
respectively) and NH209 pass through Bangalore forming five important radial
roads within the Bangalore Metropolitan Area. State Highways linking
Bangalore with Mysore, Bangalore with Bannerghatta, and Bangalore with
Magadi form other major radial corridors. Developed as a radial town,
Bangalore does not have a strong circumferential road system, except for the
Outer Ring Road, despite the intervening space between the corridors
developed. The main highways include:
NH4 (National Highway 4) running from Mumbai to Chennai;
NH7 from Varanasi to Kanyakumari;
NH209 connecting Kanakapura and Kerala; and
SH17 connecting Bangalore to Mysore.

Bangalore Mobility Indicators (2010 – 2011) Study – Draft Final Report
11 Directorate of Urban Land Transport
3.3 Demographics
A. Population Trends
The City experienced rapid growth in the last decades and is the sixth
largest city in India. Employment opportunities - initially in the public
sector, and then in textile and information technology resulted in
migration of people to Bangalore. The 2001 census population of Bangalore
was 65.37 lakh, the new provisional population shows the population in
2011 was about 95.88 lakhs which includes the surrounding villages. The
Annual exponential growth rate in 2001 was about 3.01 whereas, the
growth rate in 2011 is about 3.91 which is more than the 10% decadal
growth.
B. Decadal Growth
For the year 1991-2001, the
decadal growth of population
(absolute) in Bangalore Urban
was about 16,97,962 Lakhs
with a decadel growth rate of
21.57%, whereas, in 2001-2011,
the decadal growth of
population has been 30,51,786
Lakhs which is about 36.86%.
This has made Bangalore one
of the fastest-growing Indian metropolises, after New Delhi. The decadal
growth of Bangalore rural is shown in the Figure 3.1
C. Zone-wise population
Growth rate was taken as
per the provisional results
compiled from the Census
of India 2011 for the
outer zones 9, 10 and 11.
The inner zones are
growing at a lower rate.
The zone wise projected
population for the year
2001 and 2011 is
presented in Table 3.1 and shown in Figure 3.2.
Figure 3.1: Decadal growth of Bangalore
Figure 3.2: Zone-wise Population

Bangalore Mobility Indicators (2010 – 2011) Study – Draft Final Report
12 Directorate of Urban Land Transport
The zone map is shown in Figure 1.2 in Chapter 1.
In order to get the whole city- wise indicator the current population for
the year 2011 was derived by considering the past census figures and the
present provisional annual growth rate for Bangalore.
Table 3.1: Population
Population census for the year 2001 for the study area was around 61
lakhs. After applying an annual growth rate of 3.91% for the ten years
the current population is around 88 Lakhs.
D. Population Densities (2011)
It is observed that the highest
density is in zones 1 and 2,
followed by 3. Zone 1
includes areas like
Malleshwaram, Rajajinagar,
Peenya, Yeshwantpur, etc.
Most of the areas in Zone 2
fall under the CBD. It is the
most important commercial,
educational and business area
in the city. Zone 3 includes
well developed areas like Jayanagar, JP Nagar, BTM Layout, HSR Layout
etc. Majority of the IT working population reside in these areas. The Zone-
wise population density is presented in Table 3.2 and shown in Figure 3.3
Table 3.2: Population Density
ZONES Population Year 2001
Population Year 2011
1 1245548 1465613
2 1364197 1695183
3 1584552 1877024
4 369679 578773
5 351732 534797
6 303126 473205
7 231891 404924
8 180523 273622
9 133818 193058
10 185326 256787
11 151611 193915
Figure 3.3: Zone-wise Population Density

Bangalore Mobility Indicators (2010 – 2011) Study – Draft Final Report
13 Directorate of Urban Land Transport
The average density of Bangalore in 2001 was about 2985 which has
increased to 4378 in 2011. It means on an average 1300 more people have
inhabited every square Kilometer area in the city.
E. Employment Trends
The average employment density(zone-wise) for the year 2011 is compared
with the values in 2008, and the same is presented in Table 3.3.
Table 3.3: Employment Projection
ZONES 2008 Study Average Density
2011 Average Density
Zone 1 26479 41905
Zone 2 15974 22541
Zone 3 26580 36801
Zone 4 3738 6379
Zone 5 4221 7039
Zone 6 6404 5895
Zone 7 709 4928
Zone 8 5816 4765
Zone 9 --- 613
Zone 10 --- 7167
Zone 11 --- 10985
ZONES Area (in Sq. Kms)
2011 Average Employment density
2008 Average Employment density
Zone 1 52 14917 10468
Zone 2 101 6035 4503
Zone 3 65 9380 7209
Zone 4 151 1182 1239
Zone 5 132 2391 2227
Zone 6 141 1784 2727
Zone 7 126 986 377
Zone 8 61 565 1347
Zone 9 296 351 ---
Zone 10 457 274 ---
Zone 11 249 269 ---

Bangalore Mobility Indicators (2010 – 2011) Study – Draft Final Report
14 Directorate of Urban Land Transport
3.4 Land Use Distribution
Bangalore City had developed spatially in a concentric manner. Five major
zones can be distinguished in the existing land occupation.
1. The core area consists of the traditional business areas, the
administrative centre, and the Central Business District.
2. The Peri-central area has older, planned residential areas, surrounding
the core area.
3. The Recent extensions of the City on both sides of the Outer Ring Road
were termed as a shadow area.
4. The new layouts have developed in the peripheries of the city.
5. The zone is the green belt zone which is the agricultural area on the
outskirts of the city.
Table 3.4: Land Distribution
(Source: Land use details in CDP)
3.5 Transportation Trends
A. Vehicular growth
The number of registered vehicles in Bangalore has increased rapidly from
4 lakh (1987) to 37 lakh (2010). Two wheelers contributes about 69% of
total vehicle population and cars/jeeps contributes about 19% of total
vehicle population.
Category Area (in Sq. Kms) % use
Residential
16,042 14.95
Commercial 1,708 1.59
Industrial 5,746 5.36
Park and open spaces 1,635 1.52
Public semi-public 4,641 4.33
Transportation
9,014 8.40
Public utility 192 0.18
Water sheet 4,066 3.79
Agricultural 64,243 59.88
Total 107,287 100%

Bangalore Mobility Indicators (2010 – 2011) Study – Draft Final Report
15 Directorate of Urban Land Transport
B. Composition of mode share
About 35% of the daily trips are Non Motorised Transport (NMT) trips, 27%
of the trips are caaried by Public transport, 31% of the trips by private
vehicles and 7% of the daily trips by Intermediate Public Transport(IPT).
C. Public Transport
The public transport in bangalore is operated by Bangalore Metropolitan
Transport Corporation(BMTC). At present BMTC is operating 2400 bus
routes with a fleet size of 6,111 buses. About 43 lakh daily passengers
trips are carried by BMTC.
Apart from the bus operations, Two cooridors of Metro rail is under
construction. One is North-south corridor and the other is second is East-
West corridor. The North-south corridor starts at Nagasandra and ends at
Puttenahalli. The East-west corridor starts at Baiyappanahalli and ends at
Mysore road. The total length of the Metro rail network is 42.30 km.
D. NMT Initiatives
In the recent past years Directorate of Urban Land Transport(DULT) has
taken initiatives to improve the NMT facilities in Bangalore. As part of this,
A Datailed Project Report and Feasibility study report has been prepared
for different areas in Bangalore are listed below
Details Project Report
1. Madiwala
2. MG Road and visinity
Feasibility study for
1. Indira Nagar
2. Koramangala/BTM
3. R.T Nagar
4. Jayamahal II stage

Bangalore Mobility Indicators (2010 – 2011) Study – Draft Final Report
16 Directorate of Urban Land Transport
Chapter – 4
Data Collection and Results
4.1 Primary Data Collection
The present study involves both primary and secondary data collection.
Primary survey includes,
Household survey
Road Network Inventory
Speed & Delay
Bus Passenger Occupancy Survey
Bus Stop Waiting Time Survey
Light Meter Survey
The survey locations were same as the Bangalore Mobility Indicators 2008
study with some additional roads & locations on the BIAPP area. The following
sections will explain the surveys conducted, analysis and the output for the
same.
4.2 Household Interview Survey
A. Introduction
Household interview (HHI) survey is considered as one of the most reliable
type of surveys for collection of data on travel pattern of the residents of
the household and other general characteristics. The minimum sample
needed for such a survey is normally 2% which amounts to 40,000 samples.
Since the study will be repeated every year, a sample size of around 2000
is felt to be adequate.
B. Survey Methodology
The Household interview survey is concerned with the collection of basic
facts relating to the socio-economic characteristics of the population and
trip movements that are made on a typical day within the study area
through a questionnaire format. The survey questionnaire comprises three
sections, a) Socio-economic datasheet, b) Household member
characteristic datasheet, and c) the travel diary of each individual member

Bangalore Mobility Indicators (2010 – 2011) Study – Draft Final Report
17 Directorate of Urban Land Transport
of the household. Experienced enumerators are sent to the individual
households for collecting information by asking different questions. For this
study around 200 samples were collected from each zone making a total of
2200 samples for 11 zones. The survey format is given in the Annexure.
C. Socio-Economic Characteristics
The data from the HHI survey revealed the size of household in terms of
total members which would have a significant influence on the quantum of
trip made by the household. The average household size in the Bangalore
city is about 3.5 and the average income level of the people is about Rs
7400/- month. The zone wise details are presented in the Figure 4.1 and
4.2.
Figure 4.1 Average HH Size
Figure 4.2 Average Income Level

Bangalore Mobility Indicators (2010 – 2011) Study – Draft Final Report
18 Directorate of Urban Land Transport
D. Travel Characteristics
The data obtained from HHI was analyzed to establish criteria of variation
in trip purposes, trip length, mode and other travel characteristics.
Analysis of travel characteristics are presented in Tables 4.1 to 4.3
Table 4.1: Zone Wise Mode share
Mode Zone
1
Zone
2
Zone
3
Zone
4
Zone
5
Zone
6
Zone
7
Zone
8
Zone
9
Zone
10
Zone
11
Average
Walk 18% 21% 21% 25% 29% 35% 36% 37% 43% 45% 47% 32%
Bicycle 2% 2% 2% 1% 3% 1% 2% 3% 4% 5% 4% 3%
Taxi/Maxi
Cab 0.2% 1% 1% 0% 0% 1% 0% 0% 0% 0% 0% 0%
Auto 12% 13% 11% 10% 7% 5% 6% 4% 2% 1% 1% 7%
Two
wheeler 25% 23% 24% 26% 25% 26% 27% 25% 25% 26% 28% 25%
Car/Van 11% 10% 11% 7% 6% 5% 3% 3% 2% 3% 1% 6%
Public
Transport 32% 30% 30% 31% 30% 27% 26% 28% 23% 20% 19% 27%
Table 4.2: Zone Wise Per Capita Trip Rate
Zone No Zone1 Zone 2 Zone3 Zone4 Zone5 Zone6 Zone7 Zone8 Zone 9 Zone 10 Zone
11
PCTR 1.52 1.19 1.52 1.48 1.35 1.51 1.27 1.48 1.09 1.06 1.04
Table 4.3 Zone Wise Average Trip Length
Zone No Zone1 Zone 2 Zone3 Zone4 Zone5 Zone6 Zone7 Zone8 Zone
9
Zone
10
Zone
11
Average trip
length
( All Modes )
7.59 6.92 6.47 6.64 6.14 5.77 6.50 6.33 7.13 7.03 4.75
4.3 Road Network Inventory
The characteristics of the road network include the width of the roadway,
divided or undivided, existence of on street parking, any traffic management
system like one way etc. All the arterial, sub arterial roads and major roads of
about 700 Km have been covered in the study. The road details are given in
the ANNEXURE

Bangalore Mobility Indicators (2010 – 2011) Study – Draft Final Report
19 Directorate of Urban Land Transport
A. Carriageway Type
Of the total roads covered in the inventory, nearly 50% roads are
combination of two lane two way divided and four lane two way divided.
Six lane roads account to only 7% of the total road network. The
carriageway width details are given in figure 4.3 and Table 4.4.
Figure 4.3: Carriageway Width Details
Table 4.4: Carriageway Width Details
Sl. No lane Configuration %
1 1L-2W-UD 13%
2 1L-2W-D 1%
3 1.5L-2W-UD 3%
4 1.5L-2W-D 5%
5 2L-2W-D 28%
6 2L-2W-UD 5%
7 2L-1W-UD 2%
8 3L-2W-D 4%
10 4L-2W-D 28%
12 4L-2W-UD 3%
13 5L-2W-D 1%
14 6L-2W-D 7%
15 8L-2W-D 2%

Bangalore Mobility Indicators (2010 – 2011) Study – Draft Final Report
20 Directorate of Urban Land Transport
B. Availability of Median
Majority of roads in the study area have medians. Details of the same is
shown in Figure 4.4.
Figure 4.4 Median Availability
C. Availability of Footpath
The road inventory study also revealed the presence/absence of the
footpaths along with the type, if existed. From the analysis, it is identified
that in Bangalore City around 60% of footpath is paved and around 18% of
footpath is unpaved despite its present conditions of usage. See Table 4.5.
Table 4.5: Footpath Details
Footpath availability LHS % RHS %
Paved 61% 59%
Unpaved 18% 19%
Not present 20% 22%
100% 100%
D. Presence of On-street Parking
Out of the total road network, On-street parking is present in about 41% of
roads in the study area limits. The same is presented in Figure 4.5.
Figure 4.5 Parking Availability

Bangalore Mobility Indicators (2010 – 2011) Study – Draft Final Report
21 Directorate of Urban Land Transport
Figure 4.6: Encroachment
E. Encroachment
The extent of encroachment in
Bangalore roads has been identified
as heavy in some 16% of the roads
shown in Figure 4.6
F. Road Markings and Signages
Availability and quality of markings has been classified into three
categories such as good, fair and poor. Out of to total road network, good
quality marking is available for 60% of roads in Bangalore city. Observed
road marking details are presented in Figure 4.7. Similarly data on the
availability of proper signage board is presented below in Figure 4.8
Figure 4.7 Road Markings Figure 4.8 Signages
G. Street Lights
Street light facilities have been classified into central, road side and not
present based on its availability and location of poles. Details are
presented Figure 4.9
Figure 4.9: Street light facility

Bangalore Mobility Indicators (2010 – 2011) Study – Draft Final Report
22 Directorate of Urban Land Transport
4.4 Light Meter Survey
A light meter is a device used to measure the amount of light. This survey
attempts to analyse the quality of road lightings in the entire Bangalore city by
measuring the lighting levels using an illuminance (lux) meter. Illuminance is
the amount of light falling on a surface. The unit of measurement is lux (or
lumens per square metre = 10.76 foot candles, fc). Readings are taken from
several angles and positions from the street light.
A. Method of conducting survey
The light sensor was placed on the surface of the road and illuminance
(lux) was read off the attached meter. The methodology adopted was
Divide the section between two light poles into 4 quadrants of
equal size
Measure the lux levels at four corners of each quadrant
Take the average of each quadrant
Find the average of all the four quadrants
Care was taken to ensure that the accuracy of reading is not affected by
stray shadows. Since pedestrian intrusion (residential access, pedestrian
crossing, park/vehicular access etc) and vehicle intrusion (Head Light from
vehicles) are the factors affecting the lux meter. The assessment of road
lighting adequacy utilizing illuminance measurement is therefore not an
accurate indicator
Despite the technical impediment of the measurements, the following
conclusion can be drawn from the survey:
Figure 4.10: Lux Meter Survey

Bangalore Mobility Indicators (2010 – 2011) Study – Draft Final Report
23 Directorate of Urban Land Transport
As per the MoUD guidelines lines 10 samples were taken per km along the
selected arterial/sub arterial roads. Frequency distribution of all the lux
levels was observed for the LOS categories as mentioned in the indicators.
The cumulative frequency crosses 50% at a lux range of 16-20 as shown in
Figure 4.10.
4.5 Speed and Delay Survey
Speed and delay survey on road network in Bangalore metropolis is used to
evaluate the travel speed and the travel delays. The overall travel speed is
referred to as journey speed while the running speed is the speed maintained
by the vehicle over the stretch while in motion and not including delays.
The journey speed and the variation between running speed and journey speed
is indicative of level of service and a measure of congestion. Most of the roads
in the road network inventory have been taken for speed and delay survey
which is about 500 Km each by public transport and private vehicles.
A. Method of conducting survey
For this study, speed and delay by both private and public transport
vehicles were conducted using the floating car technique. The enumerator
travels along the traffic stream by noting down stop and start time of the
vehicle in bus stops and intersections which includes mainly signal delays
and traffic delays. Also time of delays caused by other reasons is also
noted happened during the survey if it did occur. The same procedure is
followed by the enumerator by sitting inside a bus to identify speed and
delay by public transport.
Two runs are made on either direction during peak periods (8.00 AM to
11.00 AM & 4.30 PM to 7.30 PM) and off-peak period (11 AM -4PM) and
average journey speeds are worked out.
B. Analysis Output
The abstract of overall analysis of journey speed and travel time both by
private vehicles and public transport is shown in the Figure 4.11 to figure
4.14. About 42% of the public transport journey speed is in the range of 15
– 20 Kmph.

Bangalore Mobility Indicators (2010 – 2011) Study – Draft Final Report
24 Directorate of Urban Land Transport
Figure 4.11 Journey Speed – Public Transport
Figure 4.12 Travel Time – Public Transport
Similarly, the average journey speed of the private vehicles lies between
15 – 25 Kmph.
Figure 4.13 Journey Speed – Private Vehicles

Bangalore Mobility Indicators (2010 – 2011) Study – Draft Final Report
25 Directorate of Urban Land Transport
Figure 4.13 Journey Speed – Private Vehicles
Comparison is made on the percentage difference between the public
transport and private vehicle travel time and presented in Table 4.6. Thus
for a distance of 9 Km the travel time by Public transport is about 1.5
times that of the private vehicle.
Table 4.6: Comparison between Public Transport & private Vehicles
Bangalore City Average Distance (in Km)
Average Journey Speed (in Kmph)
Average Travel Time (in min)
Public Transport 9 14 35
Private Vehicle 9 23 22
For the major roads, the overall data in respect of major roads furnishing
the name of road, length surveyed, overall travel time, journey speed and
running speed is furnished in the ANNEXURE
4.6 Bus Passenger Count & Waiting Time Survey
The occupancy count and waiting time is used to evaluate the extent of public
transport usage and their comfort levels are. This survey is as per the MoUD
guide lines on service levels. A number of bus stops for the entire Bangalore
city for this survey were selected on a random basis.
A. Method of conducting survey
For waiting time survey, the enumerators were asked to sit at the selected
bus stops both in the peak and off peak hour (8.00 AM to 11.00 AM & 5.00
PM to 8.00 PM and off-peak period 11 AM - 4PM) to note down the arrival
and departure time of the buses at the specified stops.

Bangalore Mobility Indicators (2010 – 2011) Study – Draft Final Report
26 Directorate of Urban Land Transport
For Bus passenger occupancy count for the same time period, the
enumerators were asked to note down the number of people present in the
bus on a percentage manner (100% sitting and 25% standing) and the seat
availability for that bus type (Volvo, Big10 etc).
B. Analysis Output
From the waiting time survey, the headway/frequency of buses at selected
stops was tabulated on an hourly basis. The waiting time is taken as half
that of the frequency of arrivals. The frequency of buses at stops for both
morning and evening peak hour is shown in Table 4.7. Nearly, 70% of the
passengers felt that they will stay only for about five minutes in the bus
stop during peak hours (refer Figure 4.15).
Table 4.7: Frequencies of Buses
Figure 4.15: Average Waiting Time Distributions
Frequency of buses at bus stops
Percentage
Morning (per hour)
Evening (per Hour)
< 5 min 40% 36%
5 - 10 min 38% 44%
10 - 20 min 12% 8%
20 - 30 min 8% 6%
> 30 min 2% 6%

Bangalore Mobility Indicators (2010 – 2011) Study – Draft Final Report
27 Directorate of Urban Land Transport
C. Results
From the passenger occupancy count survey, the load factor was
calculated which is the main indication for the comfort level of passengers
inside the bus. The load factor was calculated as a ratio of bus occupancy
divided by the no of seats available in the same bus. Table 4.8 shows the
load factor of buses observed at stops for both morning and evening peak
hour. The average load factor for all is 0.93.
Table 4.8: Load Factor
Load Factor Percentage
<0.5 8%
0.5-0.6 2%
0.6-0.7 4%
0.7-0.8 19%
0.8-0.9 9%
0.9-1.0 15%
1.0-1.1 12%
1.1-1.2 7%
1.2-1.3 10%
1.3-1.4 4%
1.4-1.5 7%
>1.5 4%
Figure 4.15 Load factor Distribution

Bangalore Mobility Indicators (2010 – 2011) Study – Draft Final Report
28 Directorate of Urban Land Transport
4.7 Secondary Data Collection
The secondary data required for the development of the Mobility Indicators
was collected from various sources primarily from the Government/planning
organizations. The secondary data includes information regarding the
population and employment distribution, land use information, vehicle
registration details, pollution details, public transport operation and
maintenance details, Bus route & bus stop details, City ITS facility details,
Traffic regulation details accident data etc.
For the computation of indicators the secondary data collected are described
in sections 2.1 to 2.5.
A. City Bus Details from BMTC
Since, BMTC is the only operator of the city bus service in the entire
Bangalore city, for the computation of indices regarding the public
transport facility in the city, variety of details were collected from them.
The consolidated details of all the information regarding the bus schedules,
routes operated, effective Kms, daily trips, types of service, earnings per
day, revenue per day, vehicle utilization, are listed down in the Table 4.9.
The operative and financial performance of the bus operator BMTC details
is necessary for the computation of indices.
Table 4.9: Consolidated BMTC Details
BMTC Details (2010 -2011)
Area of operation 5130 Sq. Kms
Vehicles own 6111 buses
Schedules operated 5865 bus schedules
No of bus stops 2198
Effective Kms per day 12.80 lakh service Kms
Daily Bus Trips 8000 bus trips
Existing Routes 2400 routes
Earnings per day Rs 3.50 Crores
Carry over 43.50 lakh passengers
Bus Depots 35
Bus Stations 47
Bus Staff ratio 5.7
Traffic revenue per day 339.78 lakhs
Vehicle utilization 222.1

Bangalore Mobility Indicators (2010 – 2011) Study – Draft Final Report
29 Directorate of Urban Land Transport
BMTC Details (2010 -2011)
Fleet utilization 92.3
K.M.P.L (HSD) 4.01
No of accidents 556
Breakdowns/10,000 Kms 0.04
The fleet strength increased from 4000 vehicles in 2006 to 6111 vehicles in
2011 as shown in the Figure 4.17. This shows the huge growth of public
transport facility in Bangalore City. The staff members also increased
considerably in the years (refer Figure 4.18) arriving a bus staff ratio of
about 5.7.
Figure 4.16 Fleet Strength Figure 4.17: Staff (in Nos.)
The traffic revenue of the BMTC bus operations per day is approximately
about 3.5 Crores and it shows a steady increase over the years. The other
revenues like Government reimbursement. Revenue depends over the years
as shown in the Figure 4.19 and Figure 4.20.
Figure 4.19: Traffic Revenue

Bangalore Mobility Indicators (2010 – 2011) Study – Draft Final Report
30 Directorate of Urban Land Transport
Figure 4.20: Other Revenue
The cost of operation per kilometer (in paise) shows a growth of about 15.8
when compared with the previous years as shown in the Figure 4.21.
Figure 4.21: Cost of Operation
B. Emission Levels from Pollution Board
Karnataka State
Pollution Control
Board is monitoring
Ambient Air Quality.
They are monitored
at Graphite India
Limited, KHB Indl
Area, Peenya
Industrial area,
Victoria Hospital,
Amco batteries and Yeshwanthpur Police Station using „Respirable Dust
Sampler‟ (RDS) by Conventional method. Four air pollutants viz., Sulphur

Bangalore Mobility Indicators (2010 – 2011) Study – Draft Final Report
31 Directorate of Urban Land Transport
Dioxide (SO2), Oxides of Nitrogen as NO2 and Suspended Particulate Matter
(SPM) and Respirable Suspended Particulate Matter (RSPM/PM10), have
been identified for regular monitoring at all the locations. The monitoring
of pollutants is carried out for 24 hours (4-hourly sampling for gaseous
pollutants and 8-hourly sampling for particulate matter) with a frequency
of twice a week, to have 104 observations in a year. The split up data is
given in the Annexure
The consolidated data for the year (2010 – 2011) is given in the following
Table 4.10
Table 4.10: Pollutants in Bangalore City
Locations in Bangalore City
SO2 NOx RSPM SPM
Concentration in µg/m3
Graphite India 16.1 30.4 122 264
KHB Indl Area 14.8 29.8 72 313
Peenya Indl Area 15.4 30 92 210
Amco Batteries 13.9 29 80 158
Yeshwanthpur 16.5 30.4 100 222
Victoria Hospital 12.7 27.2 64 131
C. Accidents in Bangalore City 2010-2011
With increasing road traffic growth, Bangalore city faces raised level of
injuries and fatalities. Level of fatality is an indication of road safety which
should be monitored. Figure 4.22 and Table 4.11 show the fatal and
injured type of accidents for the year 2010-2011.
Figure 4.22: Accidents in Bangalore

Bangalore Mobility Indicators (2010 – 2011) Study – Draft Final Report
32 Directorate of Urban Land Transport
Table 4.11: Accidents in Bangalore City
FATAL AND NON-FATAL CASES REPORTED PERSONS KILLED & INJURED FROM THE YEAR 2001 TO 2011 (up to June) IN BANGALORE CITY
YEAR
Fatal Cases Non-Fatal
Total
Cases Kil led Cases Injured
2001 668 703 8358 6929 9026
2002 783 820 9073 7577 9856
2003 843 883 9662 7980 10505
2004 875 903 8226 6921 9101
2005 796 836 6782 5899 7578
2006 880 915 6681 6048 7561
2007 957 981 7469 6591 8426
2008 864 892 6908 6150 7772
2009 737 761 6138 5668 6875
2010 816 858 5667 5343 6483
2011(up to May) 340 360 2532 2449 2872
D. Vehicle Registration in Bangalore City 2010-2011
The number of registration vehicles showed a study increase with a growth
rate of about 8.62% in the last year. The growth of vehicles is responsible
for the traffic congestion in the city. Figure 4.23 shows the growth trend of
vehicles and Table 4.12 represents the number of vehicles registered in the
current year.
Figure 4.23 Non-Transport Vehicles

Bangalore Mobility Indicators (2010 – 2011) Study – Draft Final Report
33 Directorate of Urban Land Transport
Table 4.12: Registered Vehicles for the Year 2010-2011
Category of Vehicles Registered 2010-2011
Transport
Trucks/MAV 71983
LMV (goods) 69758
Buses 28261
Taxis 41190
LMV (passengers) 121241
Others 36520
Total Transport 368953
Non-Transport
Two Wheelers 2624707
Cars/Jeeps 718106
Omni buses 46344
Others 33208
Total Non-Transport 3422365
Total 3791318
E. Intelligent Transport System in Bangalore City 2010-2011
Intelligent Transportation System (ITS) refers to the application of
information technology in the field of traffic to manage factors like traffic
management, safety, vehicle wear, fuel consumption etc. Table 4.13
shows the ITS system operating in Bangalore.
Table 4.13: ITS in Bangalore
Sl. No Bangalore City - Traffic Details
1 No of Intersections 40,000 Intersections
2 Signalized Intersections 330 Locations
3 Surveillance Cameras 175 Intersections
4 Enforcement Cameras 5 Locations
5 Variable Message Signs 20 Locations
6 Passenger Information System 14 Bus shelters
7 E-GPS online vehicle tracking 699 vehicles
8 E - Ticketing 1689 electronic machines

Bangalore Mobility Indicators (2010 – 2011) Study – Draft Final Report
34 Directorate of Urban Land Transport
Chapter - 5
Computation of Benchmarks and Indices
5.1 Introduction
Transportation systems provide access, mobility and other benefits, while at
the same time putting pressures on the human and natural environment.
Making progress towards more sustainable transportation systems and mobility
patterns, while at the same time increasing the economic prosperity and
quality of life, are policy aims shared by the country. The county‟s
transportation system is inextricably linked to its growth and development.
This linkage means that growth trends may be evaluated through
transportation system performance.
The tools or indicators describe the levels of transport performance in the
cities, its safety and access, air pollution, accidents, congestion and also
economic aspects of transportation division in the city. Finally, a group of
indicators describe the state of governance. Above all, these indicators allow
stakeholders to quantify the past and present changes in transport and its
sustainability.
All the indices and their derivative methods are discussed below. The level of
service table for all of the indicators and data reliable measures for all the
indicators are given in the ANNEXURE.
5.2 Service level Benchmarks
Service level performance indicators have been identified for the following
areas by the Ministry of Urban Development (MoUD), they are discussed in
detail in the following sections.
5.2.1 Public transport facilities –
The parameters include:
1. Presence of organized public transport system in urban area (%)
2. Extent of supply availability of public transport
3. Service coverage of public transport in the city
4. Average waiting time for public transport users (mins)

Bangalore Mobility Indicators (2010 – 2011) Study – Draft Final Report
35 Directorate of Urban Land Transport
5. Level of comfort in public transport
6. % of fleet as per urban bus specification
Presence of organized public transport system in urban area (%)
In Bangalore city, 6111 vehicles are
operated by the Bangalore
Metropolitan Transport Corporation
(BMTC) on 5849 schedules.
A = Total Number of Buses in the
City – 6111 buses (till May 2011)
B = Total Number if Buses under the ownership of STU/SPV - 6111 buses
Presence of Public Transport System in Urban Area (%)
= (B/A)*100
=100%, Therefore LOS 1 = 1
Extent of Supply Availability of Public Transport
In Bangalore the sub urban train
facility is absent. The train service
is for interstate and intercity only.
Hence only the buses operating
inside the city are taken into
consideration.
The 2011 population of Bangalore has an average annual growth rate of
3.91 when compared to the 2001 population. For Bangalore, the rural
growth rate is about 1.50%. The population of Bangalore is taken as 89,
54,594 Lakhs.
A = Total Number of Buses in the City – 6111 buses (till May 2011)
B = Total Population of the city (2011 Census) - 89, 54,594 Lakhs.
Availability of Public Transport / 1000 Population
= A/ (B/1000)
= 0.68255, Therefore LOS 2 = 1
Los 1 Presence of Organized Public Transport System
1 >= 60
2 40 - 60
3 20 - 40
4 < 20
Los 2 Extent of Supply Availability of Public Transport
1 >= 0.6
2 0.4 – 0.6
3 0.2 – 0.4
4 < 0.2

Bangalore Mobility Indicators (2010 – 2011) Study – Draft Final Report
36 Directorate of Urban Land Transport
Service coverage of public
transport in the city
In Bangalore city, as per the road
inventory survey the public
transport corridors are present for
about 1321 Kilometers with nearly
525 city routes and 1866 sub urban
routes.
A = Total length of road Kms of the corridors on which the PT systems
ply in the city = 1321 (in Road Kilometers)
B = Area of the Urban Limits of the City = 1831.23 (in Square
Kilometers)
Service Coverage = (A/B) = 0.721373, Therefore LOS 3 = 2
Average waiting time for public transport users (mins)
From the bus stop survey as per the
MoUD guidelines (Given in
Annexure) the average headway
was calculated for each bus stop
both at the morning and evening
peak hour. The waiting time is
taken as half of the average
headway for that particular route.
A = Identify bus stops for survey within the city = 2198 (in Road
Kilometers)
B = Average headway of buses / route
Average waiting time for public transport users is identified from the
frequency distribution curve and corresponding LOS from the table
Figure 5.1: Average waiting time
Los 3 Service coverage of public transport in the city
1 >= 1
2 0.7 - 1.0
3 0.3 – 0.7
4 < 0.3
Los 4 Average waiting time for public transport users (mins)
1 <=4
2 4 - 6
3 6 - 10
4 > 10

Bangalore Mobility Indicators (2010 – 2011) Study – Draft Final Report
37 Directorate of Urban Land Transport
According to the MoUD Service Level Benchmarks the median of the
frequency distribution defines the average waiting time which lies in
between 4 – 6 minutes. Therefore LOS 4 = 2
Level of comfort in public transport
A = Key public transport corridors are identified through the Google
map and Bus passenger occupancy survey were done at that selected
bus stops.
B = Passenger count on bus at key identified routes.
C = Seats available in the bus is taken based on its type. The different
type of buses available in BMTC was shown in the figure.
Passenger comfort – Load factor (passengers per seat) = B/C
Figure 5.2: Load Factor Distribution
Load factor was calculated for different routes. From the calculated
load factor distribution table was prepared. The average value
obtained from the distribution is 0.94. Therefore LOS 5 = 1
Los 5 Level of Comfort of public transport in the city
1 <=1.5
2 1.5 – 2.0
3 2.0 – 2.5
4 >2.5

Bangalore Mobility Indicators (2010 – 2011) Study – Draft Final Report
38 Directorate of Urban Land Transport
Percentage of Fleet as per Urban Bus Specification
In Bangalore, it has become
mandatory that all buses have
sliding doors, sliding windows,
emergency exists, destination
boards etc. Mostly the newly
introduced buses like Volvo,
Vajira, Pushpak, Jnnurm,
Marcopolo satisfies the specification. The long time buses like old work
horse, vestibule, Big 10 are missing some requirements specified by
MoUD.
A = Total Number of Buses in the City – 6111 buses (till May 2011)
B = Total number of buses as per the Urban Bus specifications in the
city – 2800 buses
% of fleet as per urban bus specification lies between 25% - 49%,
Therefore LOS 6 = 3
Overall Level of Service of Public Transport facilities city wide = LOS 1+ LOS 2 + LOS 3 + LOS 4 + LOS 5 + LOS 6 = 1+1 +2 +2 +1 +3 = 10
Bench mark LOS calculated
LOS range suggested by MOUD
Comments
Public Transport Facilities
10 <12 The City has a good public transport system which is
wide spread and easily available to the citizens. The System provided is
comfortable.
Regulatory Mechanism for Periodic Revision of Fares
There would be periodic revision of fares based on changes in the
prices of indices. Such periodic revision is proposed to be carried out,
every year. For this study since there is no previous study existing for
all these below mentioned parameters, the value of the parameters for
this year alone was given useful for next year reference.
FN = 0.4 [FPN - FPO] + 0.3 [CPIN - CPIO] + 0.3 [AMCN - AMCO] + FO
Where,
Los 6 % of fleet as per urban bus specification
1 75 - 100
2 50 - 74
3 25 - 49
4 <=25

Bangalore Mobility Indicators (2010 – 2011) Study – Draft Final Report
39 Directorate of Urban Land Transport
FN - New Fare & FO - Old Fare, FPN - New Fuel Price & FPO - Old Fuel
Price , CPIN - New Consumer Price Index & CPIO - Old Consumer Price
Index and AMCN - AMC Rate/km & AMCO - Old AMC Rate/km
The exiting bus fare minimum is Rs 4. The Public Transport High Speed
fuel rate ranges from Rs. 85 – 50. The average Consumer Price Index for
Karnataka Urban ranges from 100 -120 (given in Annexure). The Annual
Maintenance Cost for Public Transport vehicles for 2010-2011 was
127899.53 (Rs in Lakhs).
5.2.2 Pedestrian infrastructure facilities
a. Signalized intersection delay (%)
b. Street Lighting (Lux)
c. % of city covered
Signalized Intersection Delay (%)
A = Total Number of signalized
intersections in the city = 324
B = No of intersections having
average waiting time of pedestrian
more than 45 seconds = 176
(Desired average waiting time for a pedestrian is not more than 45
seconds)
Signalized intersections delay (%) = (B/A)
= 54.32% Therefore LOS 1 =3
Street Lighting (%)
A = Total length of the road
network in the study area = 1321
Kms
B = Lux level in % (taken sample
wise using lux meter in the entire
arterial and sub arterial routes of
the city)
The lux range was noted at the point where the cumulative frequency
distribution crosses 50% mark. From the figure it crosses 50% at a range
of 16 – 20 lux which lies at the Level of service 1.
Los 1 Signalized intersection delay (%)
1 < 25
2 25 – 50
3 50 - 75
4 >= 75
Los 2 Street Lighting (Lux)
1 >= 8
2 6 - 8
3 4 - 6
4 < 4

Bangalore Mobility Indicators (2010 – 2011) Study – Draft Final Report
40 Directorate of Urban Land Transport
Figure 5.3: Light meter survey results
Street Lighting = 16 – 20 Lux, Therefore LOS 2 =1
Percentage of City Covered (%)
A = Total length of road network
in the city and multiplied by 2.
= 5900 kilometers (referred in
CDP)
B = Total length of the footpath
having minimum width of 1.2 m and available on both sides = 3553 in
Kilometers
Percentage of the city covered = (B/A)*100
= (3553/5900)*100
= 60 %, Therefore LOS 3 =2
Overall Level of Service of pedestrian Infrastructure facilities city wide
= LOS 1+ LOS 2 + LOS 3
= 3+2+1
= 6
Los 3 % of city covered
1 >= 75
2 50 - 75
3 25 - 50
4 < 25
Bench mark LOS calculated
LOS range suggested by MOUD
Comments
Pedestrian infrastructure facilities
6 6-8 The city has pedestrian facilities which may need some improvements in terms of
improvements in intersections, footpaths and street lighting as some parts of the city are
not served by it. The footpath available need improvements. The system provided is
comfortable and sustainable.

Bangalore Mobility Indicators (2010 – 2011) Study – Draft Final Report
41 Directorate of Urban Land Transport
5.2.3 Non Motorized Transport (NMT) Facilities
a. % of network covered
b. Encroachment on NMT roads by vehicle parking (%)
c. NMT parking facilities at interchanges (%)
Jnnurm recommends that cities should have NMT tracks on all major
roads within a year. In view of the above this indicator reflects the
availability of dedicated cycle track along all the arterial, sub arterial
roads and public transport corridors, its encroachment and parking
facilities.
In Bangalore, feasibility studies for dedicated NMT tracks are in
progress. In future construction of roads, cycle tracks / lanes become
mandatory. UMTC have also done a feasibility study for cycle track in
and around Madiwala Lake Bangalore which is now in DPR stage.
In Bangalore, the NMT parking facility is absent but for a few places
such as railway stations. As an overall percentage this value is
negligible and is taken as zero.
Overall Level of Service of NMT facilities city wide = LOS 1+ LOS 2 + LOS
3
= 4+4+4
= 12
Bench mark LOS calculated
LOS range suggested by MOUD
Comments
Non Motorised Transport Facilities
12 11-12 The city lacks adequate NMT facilities.
Los % of network covered
Encroachment on NMV roads by vehicle parking (%)
NMT parking facilities at Interchanges (%)
1 >= 50 <= 10 >= 75
2 50 - 25 10 – 20 50 - 75
3 25 - 15 20 – 30 25 - 50
4 < 15 >30 < 25

Bangalore Mobility Indicators (2010 – 2011) Study – Draft Final Report
42 Directorate of Urban Land Transport
5.2.4 Level of usage of Intelligent Transport System (ITS) facilities
a. Availability of Traffic Surveillance (%)
b. Passenger Information System (%)
c. Global Positioning System (GPS)/ General Pocket Radio Service
(GPRS) (%)
d. Signal Synchronization (%)
e. Integrated ticketing System (%)
Availability of Traffic Surveillance (%)
A = Total no of bus stations on
BRTS, major bus stops,
terminals, metro stations and
signalized intersection having
CCTVs = 175 (in No)
B = Total no of bus stations on
BRTS, major bus stops,
terminals, metro stations and signalized intersections = 2569(in No)
(Total no. of bus stops – 2198, Terminals – 47, Signalised intersection -
324)
Availability of traffic surveillance (%) = (A/B)*100
= (175/2569)*100
=7%, Therefore LOS 1 = 4
Passenger Information System (%)
A = Total no of bus stops, terminals,
metro stations having Passenger
Information System facility = 61 (in
No) (Bus stops-14, Terminals-47)
B = Total no of bus stops, terminals,
metro stations = 2245 (in No)
Passenger Information System =(A/B)*100
=(61/2245)*100
= 3 %, Therefore LOS 2 = 4
Los 1 Availability of Traffic Surveillance (%)
1 >= 75
2 50 - 75
3 25 - 50
4 < 25
Los 2 Passenger Information System (PIS)
1 >= 75
2 50 - 75
3 25 - 50
4 < 25

Bangalore Mobility Indicators (2010 – 2011) Study – Draft Final Report
43 Directorate of Urban Land Transport
Global Positioning System (GPS)/ General Pocket Radio Service
(GPRS) (%)
A = No of public transport
vehicles and IPT with functional
on board GPS/GPRS and
connected to common control
center = 699 (in No)
B = Total no of public transport
vehicles and IPT = 168542 (in
No)( Three/Four seaters -1212242, taxi and Cabs – 41190, Bus – 6111)
Global Positioning System = (A/B)*100
= (699/16842)*100
=0.41 %, Therefore LOS 3 = 4
Signal Synchronization (%)
In Bangalore city, so far no
signals have been synchronized.
A = No of signals synchronized =
0 (in No.)
B = Total number of signalized
intersections = 324 (in No.)
Signal Synchronization (%) = (A/B)*100
= (0/324)*100
=0 %, Therefore LOS 4 = 4
Integrated ticketing System (%)
Integrated Ticketing System is absent in Bangalore. The level of
service for this benchmark is 4.
Overall Level of Service of ITS facilities city wide = LOS 1+ LOS 2 + LOS
3 + LOS 4 + LOS 5
= 4+4+4+4+4
= 20
Bench mark LOS calculated
LOS range suggested by
MOUD
Comments
Level of usage of Intelligent Transport System(ITS) Facilities
20 16-20 The city lacks
adequate ITS
facilities.
Los 3 Global Positioning System / GPRS
1 >= 75
2 50 - 75
3 25 - 50
4 < 25
Los 4 Signal Synchronization (%)
1 >= 75
2 50 - 75
3 25 - 50
4 < 25

Bangalore Mobility Indicators (2010 – 2011) Study – Draft Final Report
44 Directorate of Urban Land Transport
5.2.5 Travel speed (Motorized and Mass Transit) along major corridors
a. Average travel speed of personal vehicles (Kmph)
b. Average travel speed of public transport (Kmph)
Average travel speed of personal vehicles (Kmph)
Los 1 Average travel Speed of personal vehicles (Kmph)
1 >=30
2 25 - 30
3 15 - 25
4 <15
A = Delineate the key corridors of the road traffic (personal vehicle) in
the city
B = Compute average speed on the key corridors
From the speed and delay survey for private vehicles, the average
journey speed for private vehicles = 22 Kmph.
C= Level of service for personal vehicle along each corridor.
Figure 5.4: Journey speed - Private vehicles
For each corridor, based on its journey speed the level of service is
noted down. For example for the corridor 1, suppose its journey speed
is 40 kmph then that corridor will fall under LOS 1.
Similarly, the percentage of LOS on corridors based on travel speeds
with private vehicles for the Bangalore city is given in the table

Bangalore Mobility Indicators (2010 – 2011) Study – Draft Final Report
45 Directorate of Urban Land Transport
Level of Service with Percentage (personal vehicles) of LOS on Corridors
1 (>=30 Kmph) 12 %
2 (25 – 30 Kmph) 18 %
3 (15 -25 Kmph) 53 %
4 (<15 Kmph) 18 %
Around 53 % of the corridors in the city have a journey speed of about
15 – 25 Kmph.
D = Weights of each corridor based on volume of personal traffic
Based on the above, the weightages of all the corridors as a share of
total length has been calculated for both the directions.
City-wide Level of Service of motorized vehicles = (W1*LOS1) + (W2 *
LOS2) + (W3 * LOS3) +…. (Wn * LOSn)
= 2.337
=3 (Rounded off to the next whole number)
Average travel speed of Public Transport vehicles (Kmph)
A = Delineate the key corridors of the road traffic (personal vehicle) in
the city
B = Compute average speed on the
key corridors
Los 2 Average travel Speed of Public Transport vehicles (Kmph)
1 >=20
2 15 – 20
3 10 – 15
4 <10
Weight age of the nth corridor (Wn) = Length for nth corridor /
Total length

Bangalore Mobility Indicators (2010 – 2011) Study – Draft Final Report
46 Directorate of Urban Land Transport
Figure 5.5: Journey speed –Public Transport
From the speed and delay survey for private vehicles, the average
journey speed for the private vehicles = 15 Kmph
C= Level of service for personal vehicle along each corridor.
The percentage of LOS on corridors based on its travel speed with
public transport vehicles for Bangalore is given in the table below:
Around 37 % of the corridors in the city have a journey speed of about
15 – 20 Kmph and around 38 % of the corridors have a journey speed of
about 10 – 15 Kmph.
D = Weights of each corridor based on volume of personal traffic
Based on the above said formula, the weightages of all the corridors as
share of total length will get calculated for both the directions. The
minimum distance taken in the speed & delay survey is about 2 Km to
the maximum distance of about 18 Km.
City-wide Level of Service of motorized vehicles = (W1*LOS1) + (W2 *
LOS2) + (W3 * LOS3) +…. (Wn * LOSn)
= 2.168
Level of Service with Percentage (personal vehicles) of LOS on Corridors
1 (>=20 Kmph) 15%
2 (15 – 20 Kmph) 37%
3 (10 -15 Kmph) 38%
4 (<10 Kmph) 10%

Bangalore Mobility Indicators (2010 – 2011) Study – Draft Final Report
47 Directorate of Urban Land Transport
=3 (Rounded off to the next whole number)
Overall Level of Service of Travel Speed facilities city wide = LOS 1+
LOS 2 = 3+3
= 6
5.2.6 Availability of parking spaces
a. Availability of on street paid public parking spaces (%)
b. Ratio of maximum and minimum parking fee in the city
This indicator represents the availability of free parking spaces for all
the vehicles in the entire Bangalore city. Free on-street parking is
available on about 60% of the roads- which is a significant number.
The paid parking facility is introduced only at two places in Bangalore
by BBMP one is at Brigade road and the other one is at Commercial
Street. In the remaining places like Malls, Markets, etc. parking is
maintained by private people.
Bench mark LOS calculated LOS range suggested by MOUD
Comments
Travel speed (Motorized and Mass transit)
6 5-6 Significant approach delays and
average travel speed of 1/3 of
free flow speed or lower. Such
operations are caused by some
combination or adverse
progression, high signal density,
extensive queuing at critical
intersections and inappropriate
signal timing
Los Availability of on street public parking spaces (%)
Ratio of Maximum and Minimum parking Fee in the City
1 >= 75 >4
2 50 – 75 2 – 4
3 25 – 50 1 – 2
4 < 25 1

Bangalore Mobility Indicators (2010 – 2011) Study – Draft Final Report
48 Directorate of Urban Land Transport
The fee collected by BBMP is also very limited with a range of 5 rupees
to 10 rupees per hour. Hence, the ratio of maximum and minimum
parking fees lies in the range of 1-2 with a level of service 3.
Hence, overall Level of Service of Parking Facilities city wide = LOS 1+ LOS 2
= 4+3
= 7
5.2.7 Road safety
a. Fatality rate per lakhs population
b. Fatality rate for pedestrian and NMT (%)
Fatality Rate per Lakh of Population (%)
Accident Data for the entire city was collected from Traffic police and
BMTC for the year 2010. Calculation is done on 2010 data using the
2010 population.
A = Total number of fatalities
recorded in road accidents within
city limits in the given calendar
year = 858 (in nos.)
B = Population of the urban
agglomeration 2010 year – 8617644
(in Lakhs)
Fatality rate per 100000 Population (ratio)
= (A * 100000)/B
= 9.95
Approximately 10 persons, Therefore LOS 1 = 4
Bench mark LOS calculated LOS range suggested by MOUD
Comments
Availability of Parking places
7 7-8 The city authorities need to
initiate immediate actions
with respect of providing
paid parking spaces and
demand management for
parking
Los 1 Fatality rate Per Lakh of Population
1 <=2 persons
2 2 – 4 persons
3 4 – 6 persons
4 >6 persons

Bangalore Mobility Indicators (2010 – 2011) Study – Draft Final Report
49 Directorate of Urban Land Transport
Fatality Rate for Pedestrian and NMT
A = Total number of fatalities
recorded of persons who were
pedestrians /cyclists in road
accidents for the year 2010 = 420
(in nos.)
B = Total no of fatalities recorded
in road accidents within city limits
in the given year = 858 (in nos.)
Fatality rate for pedestrian and NMT (%)
= (A/B)*100
= 48.95%, Therefore LOS 2 = 3
Overall Level of Service of Road Safety = LOS 1+ LOS 2
= 4+3
= 7
5.2.8 Pollution levels
a. SO2
b. Oxides of Nitrogen
c. SPM
d. RSPM (Size less than 10 microns)
In Bangalore, Ambient Air Quality is monitored at six locations. Four
air pollutants viz., Sulphur Dioxide (SO2), Oxides of Nitrogen as NO2
and Suspended Particulate Matter (SPM) and Respirable Suspended
Particulate Matter (RSPM/PM10), have been identified for regular
monitoring. As per Central Pollution Control Board (CPCB) guidelines,
the monitoring of pollutants has been measured as the Annual
Arithmetic Mean of minimum 104 measurements in a year taken twice a
week 24 – hourly at uniform interval. (Data source by Pollution Control
Board Bangalore, Karnataka)
Los 2 Fatality rate Per Lakh of Population
1 <=20
2 20 - 40
3 40 - 60
4 >60
Bench mark LOS calculated LOS range suggested by MOUD
Comments
Road safety 7 7-8 Level of Fatality rate in the city is very high

Bangalore Mobility Indicators (2010 – 2011) Study – Draft Final Report
50 Directorate of Urban Land Transport
Location
SO2 NOx RSPM SPM
( Unit – Concentration range in µg/m3)
Graphite India 16.1 30.4 122 264
KHB Indl Area 14.8 29.8 72 313
Peenya Indl Area 15.4 30 92 210
Amco Batteries 13.9 29 80 158
Yeshwanthpur 16.5 30.4 100 222
Victoria Hospital 12.7 27.2 64 131
Average 14.90 29.47 88.33 216.33
The level of service for the pollutants is divided into four categories
low, moderate, high and critical. From the available data for the year
2010 to 2011the LOS pollutants are given below in the table.
Sl. No Level of Service SO2 NOx RSPM SPM
1 Low 14.9 29.47
2 Moderate 216.33
3 High 88.33
4 Critical
Overall Level of Service of Pollution city wide = LOS 1+ LOS 2 + LOS 3+
LOS 4 = 1+1+3+2
= 7
5.2.9 Integrated land use transport system
a. Financial Population Density – Gross (Persons/Developed area in
hectare)
b. Mixed Land-use on Major Transit Corridors / Network (% area under
non residential use)
c. Intensity of Development – City wide (FSI)
d. Intensity of development along transit corridor (FSI transit
corridor/FSI)
e. Clear Pattern and Completeness of the network
f. % of area under Roads
g. %age network having exclusive ROW for Transit network
Bench mark LOS calculated LOS range suggested by MOUD
Comments
Pollution levels 7 6-9 Need some improvements in emission standards, checking
pollution etc.

Bangalore Mobility Indicators (2010 – 2011) Study – Draft Final Report
51 Directorate of Urban Land Transport
Financial Population Density – Gross (Persons/Developed area in
hectare)
A = Developed area (in Hectare)
computed from the satelite image
and City Development Plan CDP =
38978
B = Population of the current year
for which data is available =
8954594
Population density (No.) =
B/A
= 229.73, Therefore LOS 1 = 1
Mixed Land Use Zoning (Proportion of non residential area)
Metro work construction (phase 1)
for about 42.3 Km covering the
entire city in East-West and
North-South directions is in
progress. So, the zoning will be
determined actually once transit
corridor starts operating. For this
study, the mixed land use is taken
as 0. Thus the level of service for the inventory of land use along major
transit corridors is very least taken as <5%. Therefore LOS 2 = 4
Intensity of Development
Citywide - FSI
As per the Development plan
Floor Space Index (FSI) as
applicable to the developed area
lies in the range of 1.00 - 3.25.
Normally, FSI varies due to plot
size, ground coverage and road
width.
Floor Space Index (Applicable to most part of the city as per master
plan /CDP is around 2.5 (> 2), Therefore LOS 3 = 1
Los 1 Population density / Gross
1 >= 175
2 150 – 175
3 125 – 150
4 < 125
Los 2 Mixed Land Use Zoning
1 >= 30
2 15 - 30
3 5 – 15
4 <5
Los 3 Intensity of development citywide FSI
1 >= 2
2 1.5 – 2.0
3 1.0 – 1.5
4 <1

Bangalore Mobility Indicators (2010 – 2011) Study – Draft Final Report
52 Directorate of Urban Land Transport
Intensity of Development
Citywide - FSI
A = Floor Space Index (Applicable
to most part of the city as per
master plan /CDP is around 2.
B = FSI for the proposed transit
(Metro) corridor has been
mentioned as 4 for a distance of
150 m around transit corridor (Information given by BMRCL). These
areas have yet to be developed.
Intensity of development along transit corridor = B/A
= 2/2 = 1, Therefore LOS 4 = 3
Clear pattern and completeness of network
The entire Local Planning Area of Bangalore city is conceptually
organized into three main Rings for consideration of zoning and
regulations.
a. Areas coming within the Core Ring Road: Ring I
b. Areas coming between the Core Ring road and the Outer Ring Road:
Ring II
c. Areas coming beyond the Outer Ring Road and within the LPA: Ring
III
The above rings are equivalent to Zone-A, Zone-B and Zone-C for TDR
Purposes
A = Based on existing and proposed network the identified major roads
pattern is Ring and Radial Pattern mainly of 3 rings as mentioned
above.
Los 4 Intensity of development along transit corridor
1 >= 2
2 1.5 – 2.0
3 1.0 – 1.5
4 <1
Los 5 Clear pattern and completeness of network
1 Clear pattern (ring radial or grid iron)and complete network
2 Somewhat clear pattern (ring radial or grid iron) but somewhat in complete network
3 Somewhat un clear pattern and in complete network
4 No clear pattern incomplete / sparse network

Bangalore Mobility Indicators (2010 – 2011) Study – Draft Final Report
53 Directorate of Urban Land Transport
B = Extent of clarity and completion – Medium clarity (qualitative from
high to low)
Road network pattern and completeness = somewhat clear pattern
(ring radial pattern) but somewhat incomplete network, Therefore
LOS 5 = 2
% of area under roads (%)
A = Developed area (in Hectare)
and City Development Plan CDP
including agriculture area = 103221
B = Overall area under road
network = 9014
Deisity of Roads (No.) = (B/A)*100
= 8.73%,
Therefore LOS 6 = 4
% network having exclusive ROW
for transit network
In Bangalore, till date there are no
exclusive BRT/Metro/LRT/Monorail
corridors actually plying. For this
indicator, the length of network is
taken as 0. Therefore, the level of
service for this indicator is the
least < 10% and mentioned as 4.
Overall Level of Service of Integrated Land use system
= LOS 1+ LOS 2 + LOS 3 + LOS 4 + LOS 5 +
LOS 6 + LOS 7
= 1+ 4 +1 +3 +2 +4 +4
For a population >= 1 million the calculated level of service = 19
Los 6 % of area under roads
1 >=15
2 12 – 15
3 10 – 12
4 < 10
Los 7 % network having exclusive ROW for transit
network
1 >=30
2 20 - 30
3 10 – 20
4 < 10
Bench mark LOS calculated
LOS range suggested by MOUD
Comments
Integrated landuse Transport system
19 15-22 Faint coherence between city structure and public
transport system.
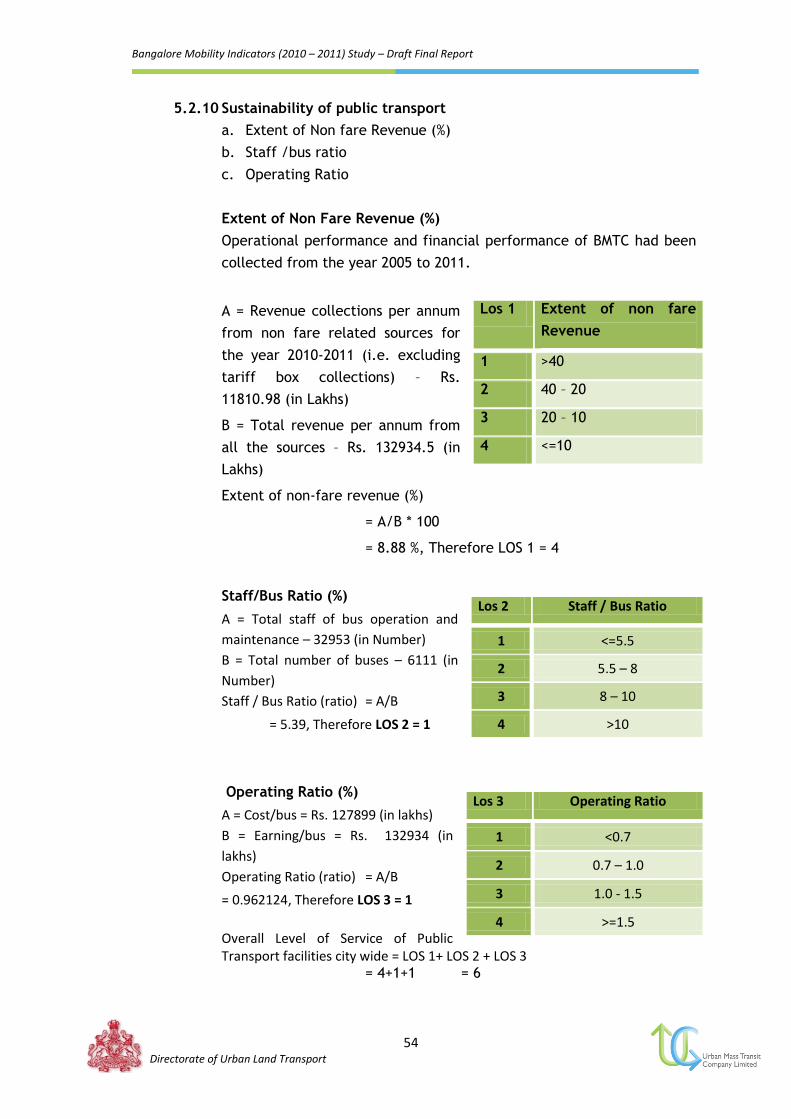
Bangalore Mobility Indicators (2010 – 2011) Study – Draft Final Report
54 Directorate of Urban Land Transport
5.2.10 Sustainability of public transport
a. Extent of Non fare Revenue (%)
b. Staff /bus ratio
c. Operating Ratio
Extent of Non Fare Revenue (%)
Operational performance and financial performance of BMTC had been
collected from the year 2005 to 2011.
A = Revenue collections per annum
from non fare related sources for
the year 2010-2011 (i.e. excluding
tariff box collections) – Rs.
11810.98 (in Lakhs)
B = Total revenue per annum from
all the sources – Rs. 132934.5 (in
Lakhs)
Extent of non-fare revenue (%)
= A/B * 100
= 8.88 %, Therefore LOS 1 = 4
Staff/Bus Ratio (%)
A = Total staff of bus operation and
maintenance – 32953 (in Number)
B = Total number of buses – 6111 (in
Number)
Staff / Bus Ratio (ratio) = A/B
= 5.39, Therefore LOS 2 = 1
Operating Ratio (%)
A = Cost/bus = Rs. 127899 (in lakhs)
B = Earning/bus = Rs. 132934 (in
lakhs)
Operating Ratio (ratio) = A/B
= 0.962124, Therefore LOS 3 = 1
Overall Level of Service of Public Transport facilities city wide = LOS 1+ LOS 2 + LOS 3
= 4+1+1 = 6
Los 1 Extent of non fare
Revenue
1 >40
2 40 – 20
3 20 – 10
4 <=10
Los 2 Staff / Bus Ratio
1 <=5.5
2 5.5 – 8
3 8 – 10
4 >10
Los 3 Operating Ratio
1 <0.7
2 0.7 – 1.0
3 1.0 - 1.5
4 >=1.5

Bangalore Mobility Indicators (2010 – 2011) Study – Draft Final Report
55 Directorate of Urban Land Transport
5.2.1 Summary of Benchmarks
Sl. No
Bench mark LOS calculated
LOS range suggested by MOUD
Comments
1 Public Transport Facilities
10 <12 The City has a good public transport system which is wide
spread and easily available to the citizens. The System provided is
comfortable.
2 Pedestrian infrastructure facilities
6 6-8 The city has pedestrian facilities which may need some
improvements in terms of improvements in intersections, footpaths and street lighting as some parts of the city are not
served by it. The footpath available need improvements.
The system provided is comfortable and sustainable.
3 Non Motorised Transport Facilities
12 11-12 The city lacks adequate NMT facilities.
4 Level of usage of Intelligent Transport System(ITS) Facilities
20 16-20 The city lacks adequate ITS facilities.
5 Travel speed (Motorized and Mass transit)
6 5-6 Significant approach delays and average travel speed of 1/3 of free flow speed or lower. Such operations are caused by some
combination or adverse progression, high signal density,
extensive queuing at critical intersections and inappropriate
signal timing
6 Availability of Parking places
7 7-8 The city authorities need to initiate immediate actions with
respect of providing paid parking spaces and demand management
for parking
Bench mark LOS calculated
LOS range suggested by MOUD
Comments
Sustainability of public transport
6 5-7 The Public Transport of a city is financial sustainable but needs
some improvements.

Bangalore Mobility Indicators (2010 – 2011) Study – Draft Final Report
56 Directorate of Urban Land Transport
Sl. No
Bench mark LOS calculated
LOS range suggested by MOUD
Comments
7 Road safety 7 7-8 Level of Fatality rate in the city is very high
8 Pollution levels 7 6-9 Need some improvements in emission standards, checking
pollution etc.
9 Integrated landuse Transport system
19 15-22 Faint coherence between city structure and public transport
system.
10 Sustainability of public transport
6 5-7 The Public Transport of a city is financial sustainable but needs
some improvements.
5.3 Mobility Indicators
In the 2008 Bangalore Mobility indicators study, performance of the
transportation system was measured based on measures like Congestion,
Mobility and Accessibility. The various aspects considered in congestion
measures were travel speed, travel time and its index, vehicle kilometers
travelled, passenger kilometers travelled, congestion index, congestion burden
index, percentage of speeds, accident fatality index, accident injury index and
road safety index. Similarly, in Mobility measures slow moving vehicle index,
city bus supply index, parking interference index, walk ability index and para
transit index were formulated. In Accessibility measures features like Public
transport accessibility, service accessibility were computed.
5.3.1 Road Safety Index
Safety Index
Accident Fatality Index: The accident fatality index is defined as the
number of road accident deaths per lakh of population. For this
computation, the accidents in the year 2010 are taken into
consideration for deriving the indicators as whole accident data for
2010 is what can be available at this point in time.

Bangalore Mobility Indicators (2010 – 2011) Study – Draft Final Report
57 Directorate of Urban Land Transport
Accident Injury Index: The accident injury index is defined as the
number of road injury accidents per lakh of population.
Bangalore city Population in 2010 (as per the 2001 census) 8617644
Per lakh population 86.17
Number Road accident deaths 858
Accident Fatality Index 9.95
Number Road accident injuries 5343
Accident Injury Index 62.0007
Source: (Traffic Police Data, Bangalore)
Road Safety Index: The accident safety index is defined as sum
product of reciprocal of AFI (Accident fatality index) times W1
(Weightage) and reciprocal of AII (Accident Injury Index) times W2
(Weightage)
Road Safety Index = W1*(1/AFI) +W2*(1/AII), where W1=0.75,
W2=0.25
= 0.75 * (1/9.95) + 0.25 * (1/62.0007)
=
0
.
079
5.3.2 Congestion Index
The Roadway Congestion Index (RCI) is a measure of vehicle travel
density on major roadways in an urban area. Congestion levels are
assessed by using the prevailing measurable average journey speed
observed on major corridors. Journey speeds are easily understood by
public and are applicable from both user and a roadway perspective.
The congestion index is formulated as follows:
Congestion index = 1 – (A / M)
Where,
Road Safety Index = 0.079. In 2008 study Road Safety Index = 0.047

Bangalore Mobility Indicators (2010 – 2011) Study – Draft Final Report
58 Directorate of Urban Land Transport
M: Desirable ideal average journey speed on major road networks of a
city during peak hour, which is assumed as 40 KMPH, and
A: Average journey speed observed on major corridors of the city
during peak period.
Average journey observed on major corridors (A) 22 Kmph
Desirable average journey speed on major corridors (M) 40 Kmph
A/M 0.55
1-(A/M) 0.45
In ideal condition congestion index is zero. The index is formulated
such that lower the index, better the performance. Lower the speed
higher the congestion index. In this study, desirable speed is considered
as 40 kmph, and not higher keeping in view safety issues in an urban
area. The Congestion index for the City is about 0.45, indicating during
peak periods, the journey speed is reduced by 45 percent of the
desired speed limit.
5.3.3 Travel Time Index
The Travel Time Index is the ratio of peak period travel time to free
flow travel time. Ideal travel speed is assumed to be 40 kmph during
peak hour. This indicator expresses the average amount of extra time it
takes to travel in the peak relative to free-flow travel. The travel time
index for both public transport vehicles and private vehicles have been
calculated. Table shows the travel time index for the City.
Travel Time Index = Actual Travel Time/Ideal (free flow) Travel Time
Average ideal travel time for a ideal speed of 40 Kmph 13.22 minutes
Average travel time along the corridors (private vehicles) 22 minutes
Travel time index (private vehicles) 1.69
Average travel time along the corridors (Public transport) 35 minutes
Travel time index (Public transport) 2.38 Source: (Speed and delay survey)
Congestion Index = 0.45. In 2008 study congestion Index = 0.33
Travel time Index = 1.69. In 2008 study travel time Index = 1.57
Bangalore Mobility Indicators (2010 – 2011) Study – Draft Final Report
59 Directorate of Urban Land Transport

Bangalore Mobility Indicators (2010 – 2011) Study – Draft Final Report
60 Directorate of Urban Land Transport
5.3.4 Slow Moving Vehicle Index
Slow moving vehicle transport includes bi-cycles and cycle rickshaws.
In India, dedicated bi cycle lanes were absent in most of the cities.
Bicycle a sustainable urban transport mode in India, is gradually
diminished due to motor vehicles. Now due to the government policies
on improving NMV, separate lanes for NMV are being included in their
future proposals.
SMV Index = SMV share in trips (percentage)
This indicator just reflects the NMV percentage share to all other
modes obtained from the HHI survy analysis. The zone wise percentage
of NMV trips are given in the table.
Figure 5.6: SMV Index
The average slow moving vehicles (SMV) index = 2% for the total
Bangalore city which is similar to the previous study. The outlying
Zone SMV Share (%)
1 2%
2 2%
3 2%
4 1%
5 3%
6 1%
7 2%
8 3%
9 4%
10 5%
11 4%

Bangalore Mobility Indicators (2010 – 2011) Study – Draft Final Report
61 Directorate of Urban Land Transport
zones show a higher share than the city zones. The outer zones show a
higher share than the city zones.
5.3.5 City Bus Supply Index
City Bus Supply index represents the extent of availability of bus
service for the public in the city. This index is generally expressed as
the ratio of City bus fleet availability to the per lakh population.
Total number of buses held in BMTC 6112
Population in lakhs 89.545
City Bus Supply Index 69 Source: (BMTC data as on 31/3/2011)
The extent of supply of buses in Bangalore city is far above the India‟s
average. Since, the demand is more due to the effective increase in
urban population the index decreased from 80 in 2008 study to 69 in
the current study.
5.3.6 Para Transit Index
In most of the metropolitan cities, informal public transport or Para
transit or Intermediate Public Transport (IPT) is an important
component of their overall transport services.
Para transit index is number of vehicles available per 10,000 Population
Bangalore city Population in 2011 (as per the
2001 census)
8954594
Per 10,000 population 895.45
Three wheeler (Auto rickshaw) 31793
Taxis & Cabs 41190
Three Seaters 98025
Para Transit Index 190
Source: (RTO data in Bangalore Metropolitan City as on 31/3/2011)
Para Transit Index = 190. In 2008 study Para Transit Index = 185
City Bus Supply Index = 69. In 2008 study City Bus Supply Index = 80
Slow moving vehicle Index = 2 %. In 2008 study slow moving vehicle Index = 2 %
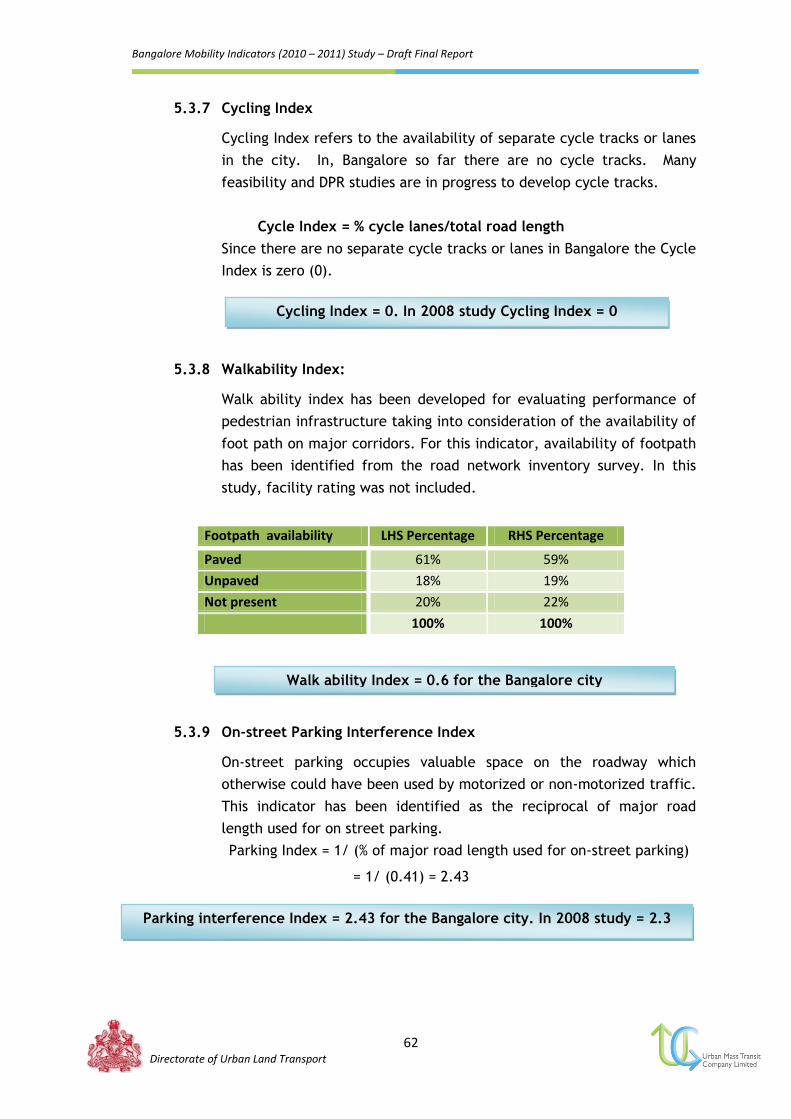
Bangalore Mobility Indicators (2010 – 2011) Study – Draft Final Report
62 Directorate of Urban Land Transport
5.3.7 Cycling Index
Cycling Index refers to the availability of separate cycle tracks or lanes
in the city. In, Bangalore so far there are no cycle tracks. Many
feasibility and DPR studies are in progress to develop cycle tracks.
Cycle Index = % cycle lanes/total road length
Since there are no separate cycle tracks or lanes in Bangalore the Cycle
Index is zero (0).
5.3.8 Walkability Index:
Walk ability index has been developed for evaluating performance of
pedestrian infrastructure taking into consideration of the availability of
foot path on major corridors. For this indicator, availability of footpath
has been identified from the road network inventory survey. In this
study, facility rating was not included.
Footpath availability LHS Percentage RHS Percentage
Paved 61% 59%
Unpaved 18% 19%
Not present 20% 22%
100% 100%
5.3.9 On-street Parking Interference Index
On-street parking occupies valuable space on the roadway which
otherwise could have been used by motorized or non-motorized traffic.
This indicator has been identified as the reciprocal of major road
length used for on street parking.
Parking Index = 1/ (% of major road length used for on-street parking)
= 1/ (0.41) = 2.43
Cycling Index = 0. In 2008 study Cycling Index = 0
Walk ability Index = 0.6 for the Bangalore city
Parking interference Index = 2.43 for the Bangalore city. In 2008 study = 2.3

Bangalore Mobility Indicators (2010 – 2011) Study – Draft Final Report
63 Directorate of Urban Land Transport
5.3.10 Vehicle Kilometers Traveled
Vehicle Kilometers Traveled (VKT) is the key data for transportation
planning and management, and a common measure of roadway use. It
is the total kilometers traveled by private motor vehicles on the
highway system. This has been derived from the HHI survey. It is
dependent on the trip lengths and the number of trips made of the
passengers in each zone. The average trip length for Bangalore
obtained from this study is about 7.79 Km. The vehicle kilometers
traveled is about 24.9 Million.
5.3.11 Passenger Kilometers Traveled
Passenger Kilometers traveled (PKT) are calculated by multiplying
vehicle-kilometers of travel by the average number of occupants for
each vehicle type. Average vehicle occupancy rate is as follows based
on the primary and secondary data collection.
Two wheeler – 1.5
Car/van/taxi/maxi cab - 2
Auto – 2.5
The passenger kilometers travelled for the public transport has been
taken from the BMTC Operational performance data from the year 2005
to 2011.
Figure 5.7: Effective Kms(per day) by Public Transport
For, the 2011 year it was given as 1225000 Km/day. The passenger
kilometers traveled is about 63.3 Million.
Vehicle Kilometers Travelled in the city = 24.9 Million

Bangalore Mobility Indicators (2010 – 2011) Study – Draft Final Report
64 Directorate of Urban Land Transport
5.3.12 Total Delay (vehicle-hours and person-hours)
Delay is the number of hours spent in traffic beyond what would
normally occur if travel could be done at the ideal speed. For
Bangalore, vehicle hours of delay measure the amount of time it takes
to travel a distance in the City during the peak hour compared to the
time it takes to travel the same distance at 40 km per hour. This
measurement provides a general indication of traffic congestion. Daily
person hours of delay is calculated by determining the difference
between the estimated travel time under actual (peak hour) conditions
and under uncongested (at 40 km per hour) conditions.
Total delay (Vehicle – hours) – 21,47,909
Total delay (Person – hours) – 45,30,872
Delay per vehicle (in hours) – 0.6 (30 minutes)
5.3.13 Public Transport Accessibility Index
It is the inverse of the average distance (in km) to the nearest bus
stop/railway station (suburban/metro). The desirable PT Accessibility
Index is at least 2 (500 m access to nearest bus stop / railway station).
In Bangalore mostly, zones 1-4 being the centre of the city have good
accessibility whereas zones 5-11 lying somewhat outside have less PT
accessibility. Figure shows the comparison of previous 2008 study with
the present study.
Zone PT Accessibility Index
1 2.1
2 2.0
3 2.2
4 2.2
5 1.6
6 1.1
7 1.18
8 1.25
9 1.1
10 1.0
11 1.1
Passenger Kilometers Travelled in the city = 63.3 Million

Bangalore Mobility Indicators (2010 – 2011) Study – Draft Final Report
65 Directorate of Urban Land Transport
Figure 5.8: Public Transport Availability Index
5.3.14 Service Accessibility Index
Service accessibility index is defined as the percentage of work trips
accessible within 15 minute time and 30 minute time for a zone. This
index indicates that around 40% of the people travel about 30 minutes
to their work by public transport. Figure shows the comparison of 2008
study with the present study.
Percentage of people travelling less than 15 minutes or less than 30
minutes
Zones
Present Study
<15 min <30 min
1 14% 24%
2 13% 32%
3 9% 24%
4 11% 17%
5 15% 22%
6 13% 20%
7 18% 33%
8 13% 22%
9 11% 20%
10 14% 26%
11 13% 23%
Average 13% 24%

Bangalore Mobility Indicators (2010 – 2011) Study – Draft Final Report
66 Directorate of Urban Land Transport
Figure 5.9: Service Accessibility Index(work trips travel time <15 min)
Figure 5.9: Service Accessibility Index( work trips travel time<30 min)
Comparison of present Indicators with 2008 study is presented in Table
below:
Sl. No Indicator 2008 Study 2011 Study Comments
1. Road Safety Index 0.047 0.079 Improvement seen in Fatal accidents
2. Congestion Index 0.33 0.45 Journey speeds have dropped
3. Travel Time Index 1.57 1.69 Travel time has increased
4. Slow Moving Index 2% 2% Remains unchanged
5. City Bus Supply Index 80 69 Due to the increase area the bus per lakh population has decreased
6. Para transit Index 185 190 Marginal increase seen
7. Cycling Index 0 0 Remains unchanged
8. On street parking interference Index
2.3 2.43 Parking space marginally reduced
9. Public Transport Accessibility
1.7 1.7 The average distance to bus stops remains same
10. Service accessibility Index
26% 24% Work trips travelling <30 min marginally reduced

Bangalore Mobility Indicators (2010 – 2011) Study – Draft Final Report
67 Directorate of Urban Land Transport
5.4 Data Reliability
All the performance indicators data for this study have been provided with
certain reliability scale suggested by MoUD. The description of the reliability
information collected ranked from lowest, intermediate to highest level. The
ranking for each performance indicator is given in the following table.
Indicator Description Data Source Overall Data
reliability
Indicator 1 Public Transport Facilities A
LOS 1 Presence of Organized public
transport in Urban Area
Secondary Data
LOS 2 Availability of Public Transport Secondary Data
LOS 3 Service Coverage of Public
Transport Facility
Secondary Data
Los 4 Average waiting time for Public
Transport Users
Primary Survey
LOS 5 Level of comfort in Public
Transport
Primary Survey
LOS 6 % of Fleet as per Urban Bus
Specifications
Primary Survey
Indicator 2 Pedestrian Infrastructure Facilities A
Signalized Intersection Delay Primary Survey
Street Lighting Primary Survey
% of City Covered Secondary
Data/Primary Survey
Indicator 3 Non Motorized Transport Facilities A
% Network Covered Secondary Data
Encroachments on NMV Roads Secondary Data
NMT Parking facilities at
Interchanges
Primary
Survey/Secondary
data
Indicator 4 Level of Usage of Intelligent Transport System (ITS) facilities C
Availability of Traffic surveillance
system
Secondary Data
Passenger Information System Secondary Data
Global Positioning System Secondary Data

Bangalore Mobility Indicators (2010 – 2011) Study – Draft Final Report
68 Directorate of Urban Land Transport
Indicator Description Data Source Overall Data
reliability
Signal Synchronization Secondary Data
Integrated Ticketing System Secondary Data
Indicator 5 Travel speed along major corridor C
Travel speed of personal vehicle
along key corridor
Primary Survey
Travel speed of public transport
vehicle along key corridor
Primary Survey
Indicator 6 Availability of Parking space C
Availability of paid parking spaces Secondary
Data/Primary Survey
Ratio of Maximum and minimum
parking fee in the city
Secondary Data
Indicator 7 Road safety A
Fatality rate per lakh population Secondary Data
Fatality rate for pedestrian and
NMT
Secondary Data
Indicator 8 Pollution Level C
Indicator 9 Integrated land use transport system A
Population Density Secondary Data as
per SLB
Mixed land use zoning Secondary Data as
per SLB
Intensity of development citywide Secondary Data as
per SLB
Intensity of development along
transit corridors
Secondary Data as
per SLB
Road network pattern and
completeness
Secondary Data as
per SLB
% area under roads Secondary Data as
per SLB
Network with exclusive ROW for
Transit
Secondary Data as
per SLB
Indicator 10 Financial sustainability of Public Transport by bus A
Extent of Non fare Revenue Secondary Data as
per SLB

Bangalore Mobility Indicators (2010 – 2011) Study – Draft Final Report
69 Directorate of Urban Land Transport
Indicator Description Data Source Overall Data
reliability
Staff per bus Ratio Secondary Data as
per SLB
Operating Ratio Secondary Data as
per SLB

Bangalore Mobility Indicators (2010 – 2011) Study – Draft Final Report
70 Directorate of Urban Land Transport
Chapter - 6
Conclusions
Policy analysis and planning require accurate information for guidance. This is
particularly important for transportation planning, which takes into account diverse,
indirect and long-term impacts. Transportation indicators are an important tool for
better transportation planning.
There is currently no standard set of transportation indicators. A variety of indicators
are used, some of which are particularly appropriate and useful for planning and
policy analysis. It would be highly desirable for transportation professional
organizations to develop standardized, “baseline” indicator sets, with consistent
definitions and collection methods, suitable for comparing impacts and trends
between different organizations, jurisdictions and times. This can include some
indicators suitable for all situations, and others for specific needs and conditions.
The Ministry of Urban Development, therefore, has recommended standardized sets of
Service Level Benchmarks. This should build on existing efforts to improve the
collection of transportation statistics, expanding these efforts to reflect key
economic, social and environmental impacts.
As far as the benchmarks for Bangalore are concerned, a considerable amount of
interventions are required by the authorities to improve the quality of urban
transport. Except the public transport facilities, all other components of
transportation have been performing at disappointing levels. The current
performance measures (as per the MoUD guidelines) are summarized as follows:
The public transport in Bangalore is good with wider coverage and easy access
Existing public transport is financially sustainable
Pedestrian facilities need improvements in terms of footpaths, intersections and
street lighting
NMT facilities are lacking and need major improvements
ITS facilities are inadequate in terms of ticketing system, signal synchronization,
GPS / GPRS etc.
Significant delays and queuing of vehicles are common on major corridors
Parking facilities are inadequate; immediate actions needed towards parking
management
Bangalore city roads are unsafe – considerable improvements needed in road
design; fatality index is very high
Bangalore Mobility Indicators (2010 – 2011) Study – Draft Final Report
71 Directorate of Urban Land Transport
Needs improvement in emission standards and checking pollution
There exists a faint coherence between land use and transport planning efforts
These trends are quite disappointing despite the fact that a number of infrastructure
building activities are happening in and around Bangalore city. This shows the lack of
visioning in our exercises. We have to focus less on „supply oriented‟ improvements
and focus more on „mobility management‟ remedies to improve the quality of urban
transport in Bangalore. There is also a greater need of institutional integration to
achieve higher efficiency in our transportation efforts.
The 2008 study was compared on a number of indicators and in the past two years,
the change has not been too drastic. It would be interesting to study the change once
the Metro is fully implemented.

Bangalore Mobility Indicators (2010 – 2011) Study – Draft Final Report
72 Directorate of Urban Land Transport
Annexures

Bangalore Mobility Indicators (2010 – 2011) Study – Draft Final Report
73 Directorate of Urban Land Transport