Embed Size (px)
DESCRIPTION
bangalore master plan by atelier
Citation preview
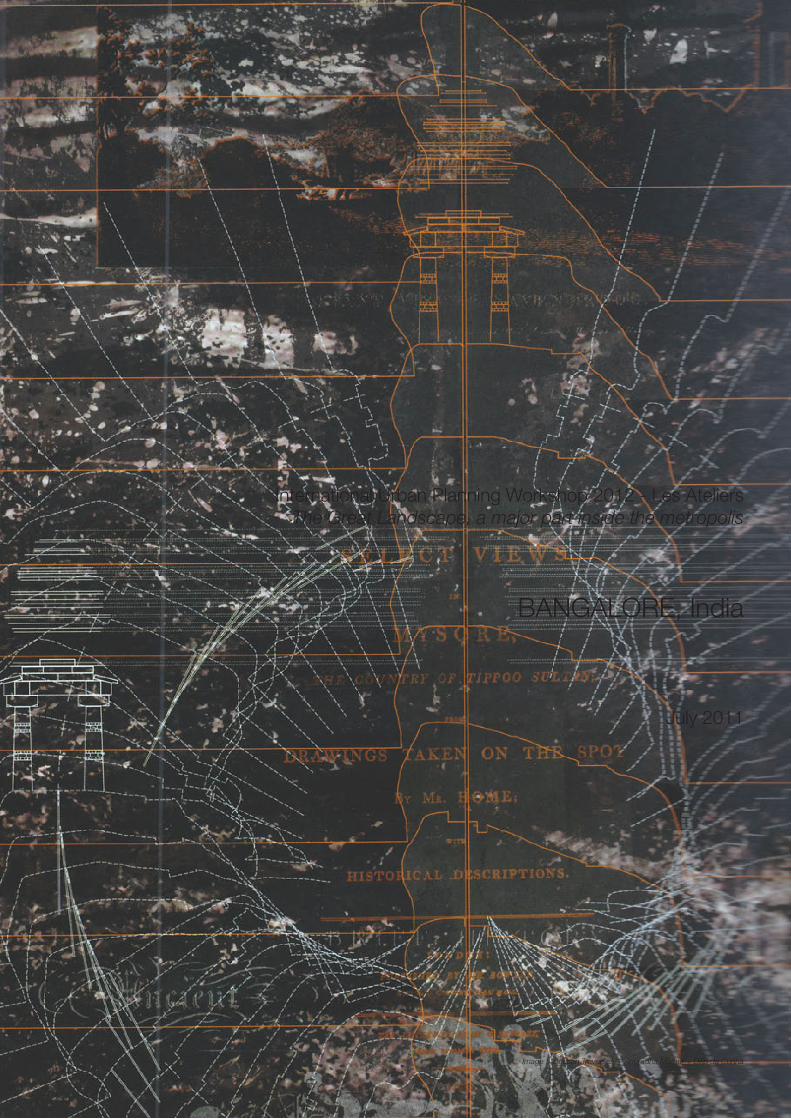
BANGALORE, India
International Urban Planning Workshop 2012 - Les Ateliers The Great Landscape, a major part inside the metropolis
July 2011
Image : “Deccan Traverses” - Anuradha Mathur + Dilip da Cunha
International Urban Planning Workshop 2012 - les Ateliers 2
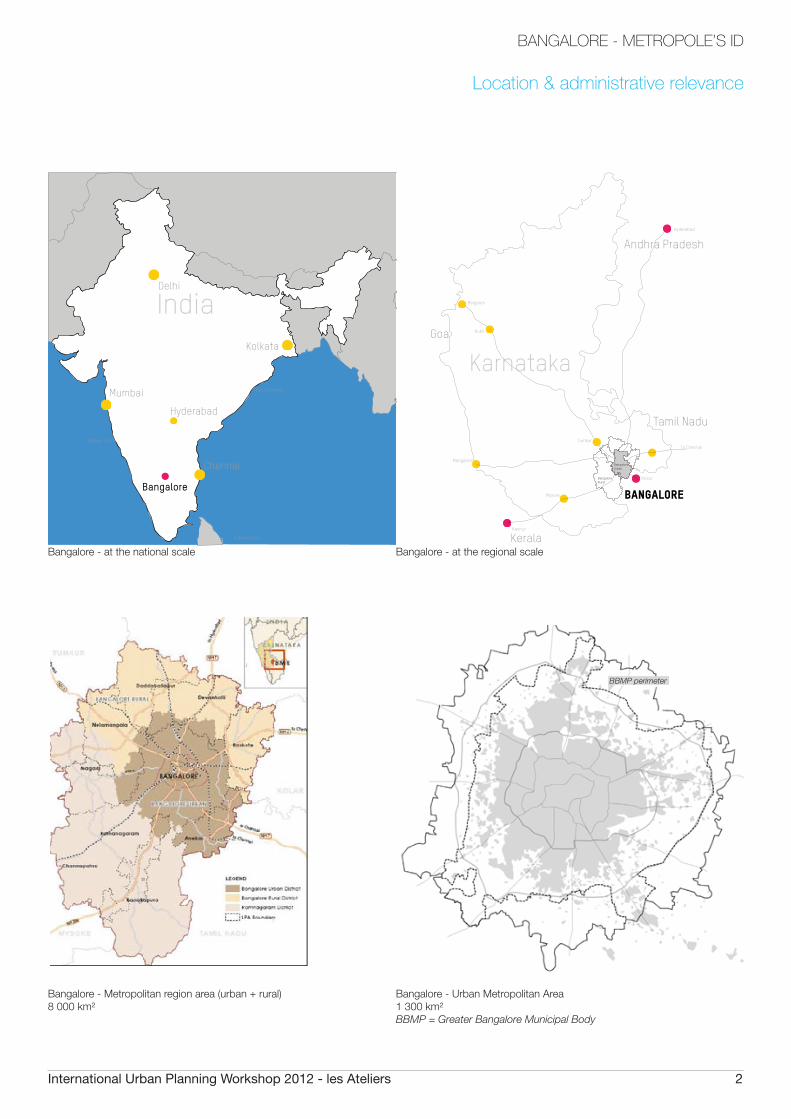
BANGALORE - METROPOLE’S ID
India
Pakistan
China
Nepal Bhutan
BangladeshMyanmarBurma
Bay of Bengal
Arabian Sea
Sri Lanka Indian Ocean
Delhi
Mumbai
Kolkata
Chennai
Hyderabad
BangaloreHosur
Bangalore Urban
BANGALORE
Bangalore Rural
Mysore
Mangalore
Kannur
Kerala
Tamil Nadu
Andhra Pradesh
Goa
Karnataka
Tumkurto Chennai
Hyderabad
Hubli
Belgaum
Bangalore - at the national scale
Bangalore - Metropolitan region area (urban + rural) 8 000 km²
Bangalore - at the regional scale
Bangalore - Urban Metropolitan Area1 300 km²BBMP = Greater Bangalore Municipal Body
Location & administrative relevance
BBMP perimeter
International Urban Planning Workshop 2012 - les Ateliers 3
BANGALORE - METROPOLE’S ID
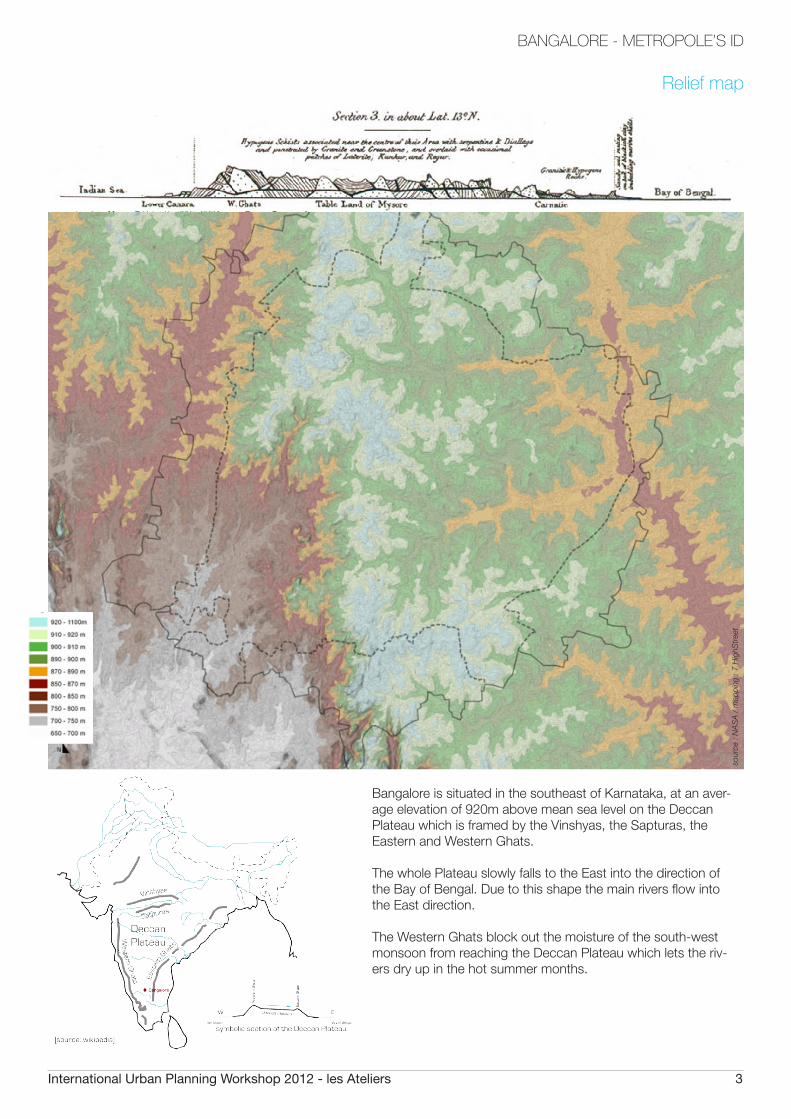
Relief map
Bangalore is situated in the southeast of Karnataka, at an aver-age elevation of 920m above mean sea level on the Deccan Plateau which is framed by the Vinshyas, the Sapturas, the Eastern and Western Ghats.
The whole Plateau slowly falls to the East into the direction of the Bay of Bengal. Due to this shape the main rivers flow into the East direction.
The Western Ghats block out the moisture of the south-west monsoon from reaching the Deccan Plateau which lets the riv-ers dry up in the hot summer months.
sour
ce :
NA
SA
/ m
appi
ng :
7 H
ighS
tree
t
International Urban Planning Workshop 2012 - les Ateliers 4
BANGALORE - METROPOLE’S ID
Ulsoor Lake
Belandur Lake
Golf course
International airport
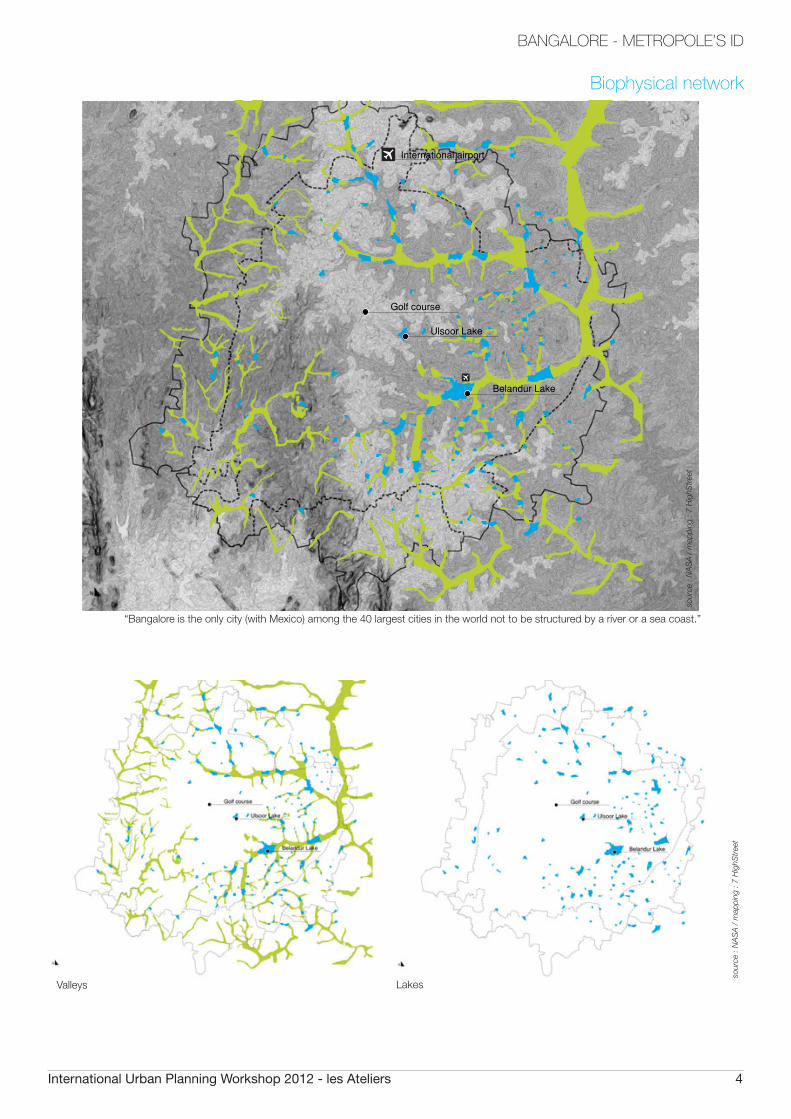
“Bangalore is the only city (with Mexico) among the 40 largest cities in the world not to be structured by a river or a sea coast.”
Valleys Lakes
Biophysical network
sour
ce :
NA
SA
/ m
appi
ng :
7 H
ighS
tree
t
sour
ce :
NA
SA
/ m
appi
ng :
7 H
ighS
tree
t
International Urban Planning Workshop 2012 - les Ateliers 5
BANGALORE - METROPOLE’S ID
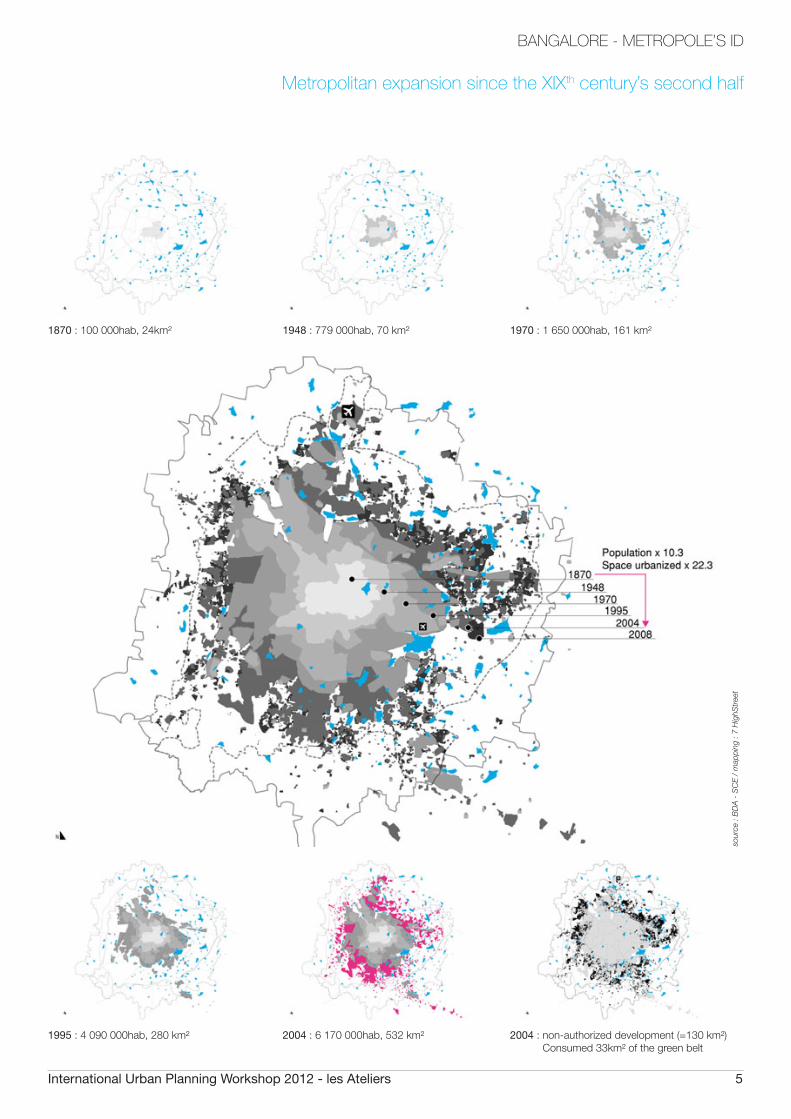
Metropolitan expansion since the XIXth century’s second half
1870 : 100 000hab, 24km²
1995 : 4 090 000hab, 280 km²
1948 : 779 000hab, 70 km²
2004 : 6 170 000hab, 532 km²
1970 : 1 650 000hab, 161 km²
2004 : non-authorized development (=130 km²) Consumed 33km² of the green belt
sour
ce :
BD
A -
SC
E /
map
ping
: 7
Hig
hStr
eet
International Urban Planning Workshop 2012 - les Ateliers 6
BANGALORE - METROPOLE’S ID
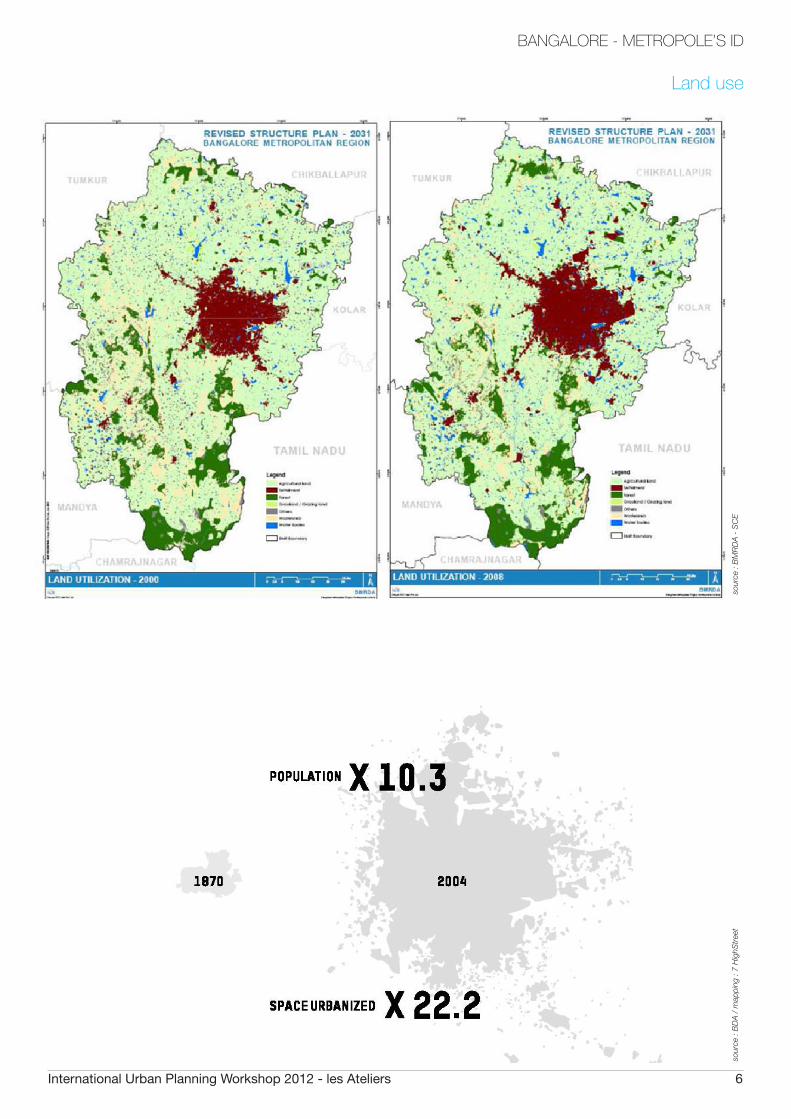
Land use
sour
ce :
BM
RD
A -
SC
E so
urce
: B
DA
/ m
appi
ng :
7 H
ighS
tree
t
International Urban Planning Workshop 2012 - les Ateliers 7
BANGALORE - METROPOLE’S ID
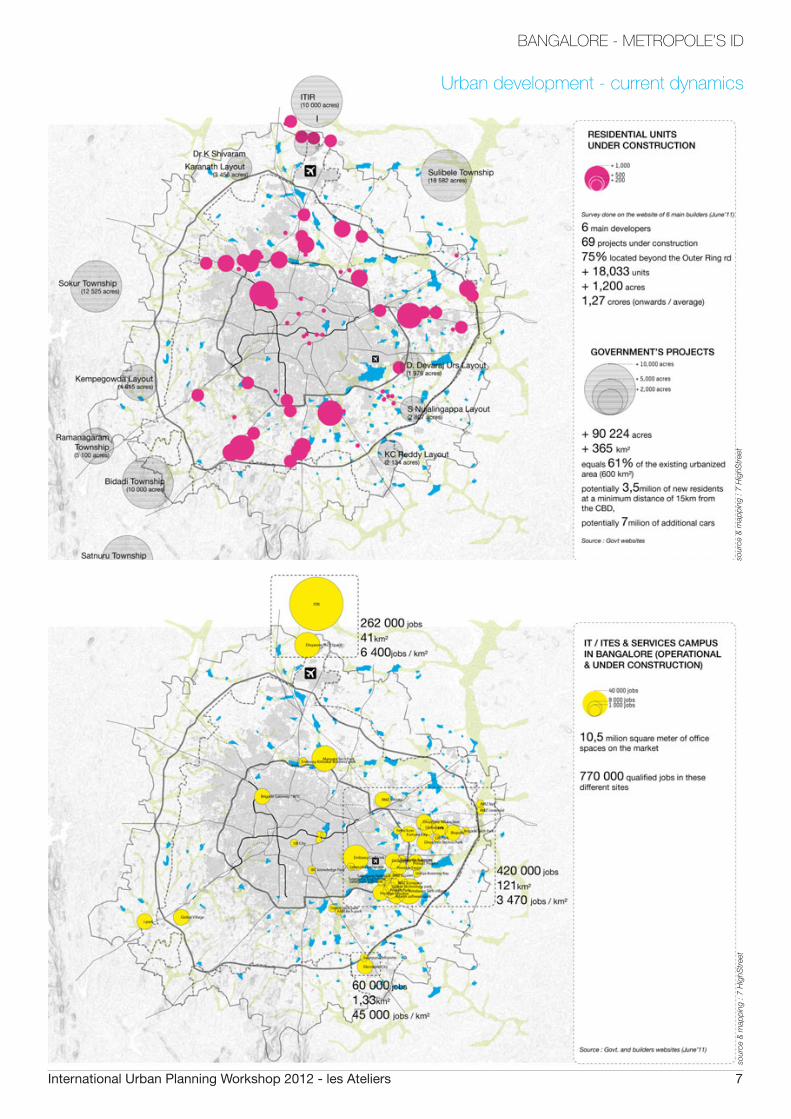
Urban development - current dynamics
sour
ce &
map
ping
: 7
Hig
hStr
eet
sour
ce &
map
ping
: 7
Hig
hStr
eet
International Urban Planning Workshop 2012 - les Ateliers 8
BANGALORE - METROPOLE’S ID
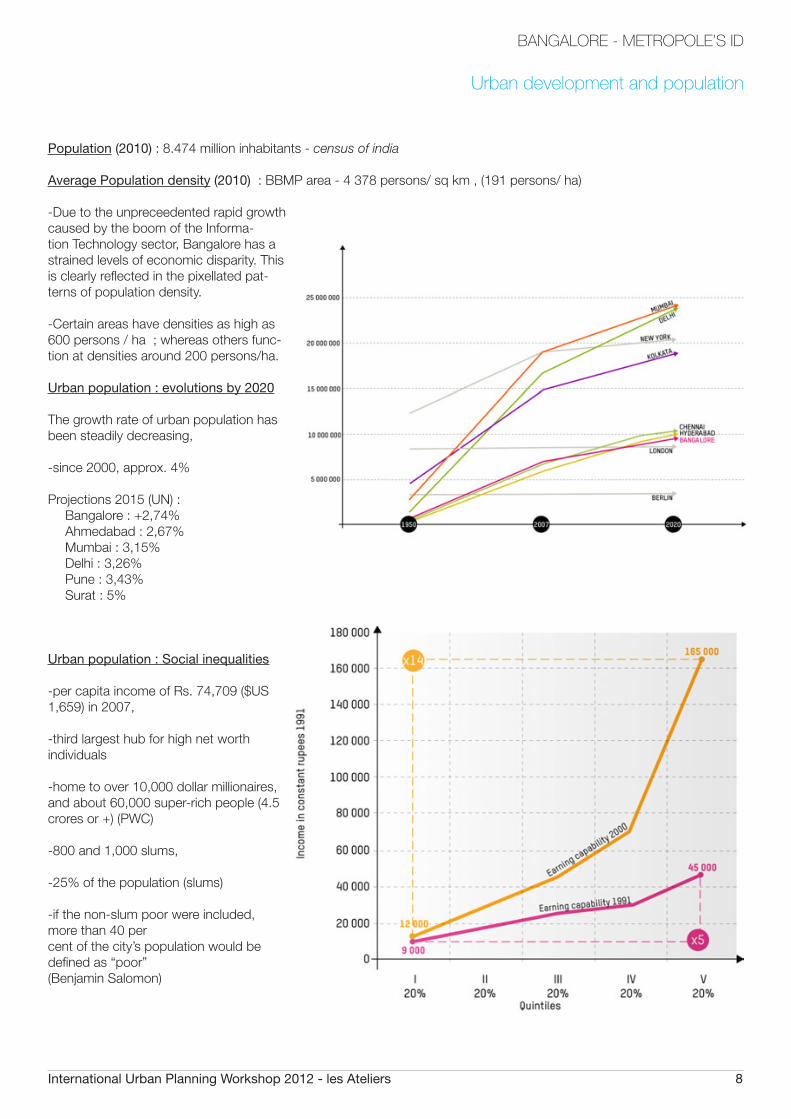
Population (2010) : 8.474 million inhabitants - census of india
Average Population density (2010) : BBMP area - 4 378 persons/ sq km , (191 persons/ ha)
-Due to the unpreceedented rapid growth caused by the boom of the Informa-tion Technology sector, Bangalore has a strained levels of economic disparity. This is clearly reflected in the pixellated pat-terns of population density.
-Certain areas have densities as high as 600 persons / ha ; whereas others func-tion at densities around 200 persons/ha.
Urban population : evolutions by 2020
The growth rate of urban population has been steadily decreasing,
-since 2000, approx. 4%
Projections 2015 (UN) :Bangalore : +2,74%Ahmedabad : 2,67%Mumbai : 3,15%Delhi : 3,26%Pune : 3,43%Surat : 5%
Urban population : Social inequalities
-per capita income of Rs. 74,709 ($US 1,659) in 2007,
-third largest hub for high net worth individuals
-home to over 10,000 dollar millionaires, and about 60,000 super-rich people (4.5 crores or +) (PWC)
-800 and 1,000 slums,
-25% of the population (slums)
-if the non-slum poor were included, more than 40 percent of the city’s population would be defined as “poor”(Benjamin Salomon)
Urban development and population
International Urban Planning Workshop 2012 - les Ateliers 9
BANGALORE - METROPOLE’S ID
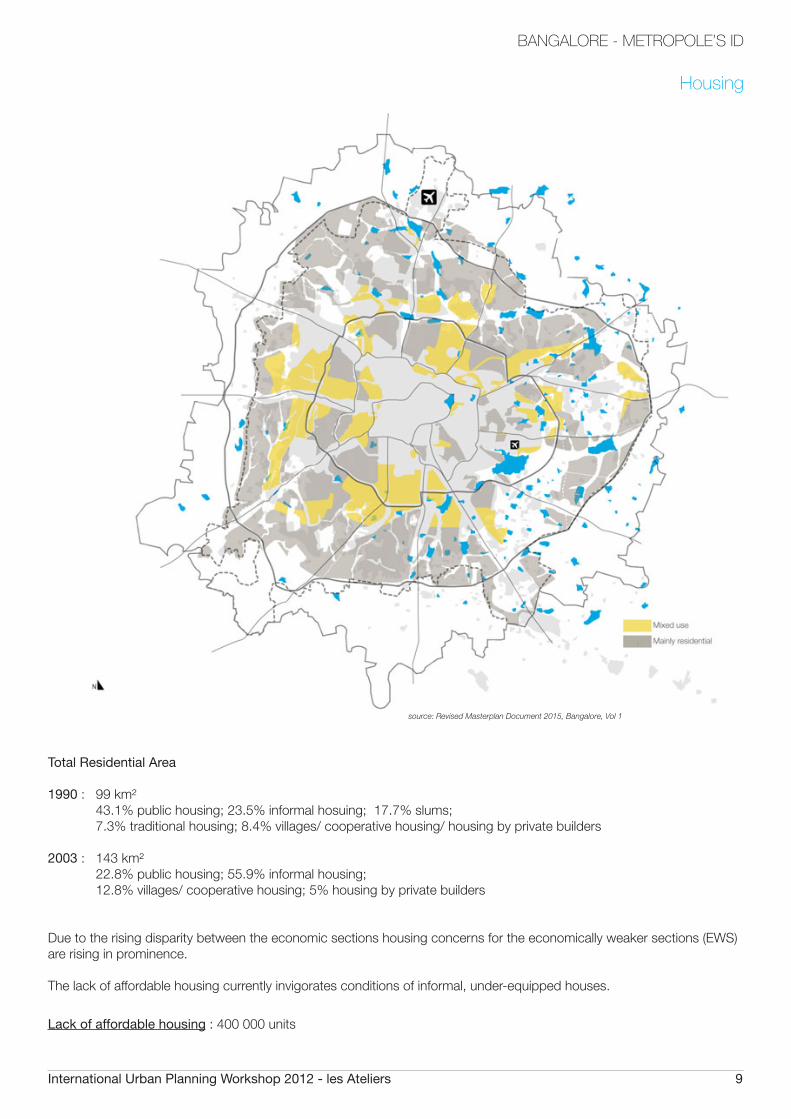
Total Residential Area 1990 : 99 km² 43.1% public housing; 23.5% informal hosuing; 17.7% slums; 7.3% traditional housing; 8.4% villages/ cooperative housing/ housing by private builders
2003 : 143 km² 22.8% public housing; 55.9% informal housing; 12.8% villages/ cooperative housing; 5% housing by private builders
Due to the rising disparity between the economic sections housing concerns for the economically weaker sections (EWS) are rising in prominence. The lack of affordable housing currently invigorates conditions of informal, under-equipped houses.
Lack of affordable housing : 400 000 units
source: Revised Masterplan Document 2015, Bangalore, Vol 1
Housing
International Urban Planning Workshop 2012 - les Ateliers 10
BANGALORE - METROPOLE’S ID
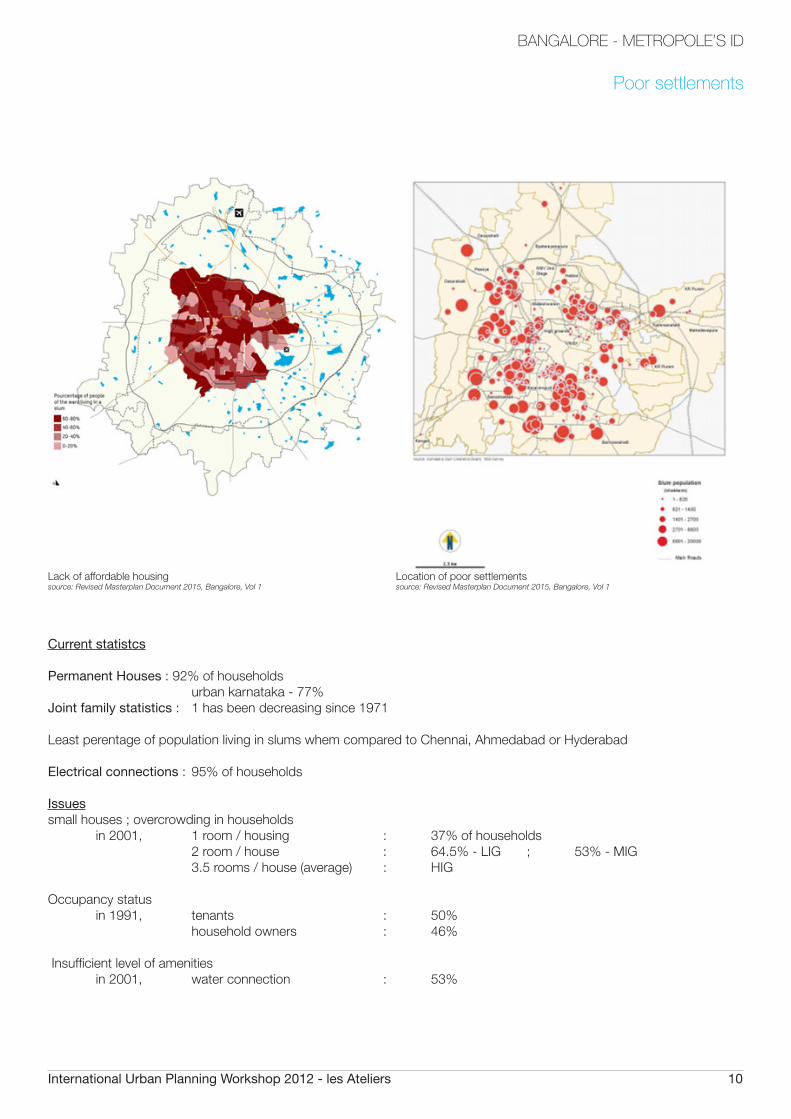
Current statistcs
Permanent Houses : 92% of households urban karnataka - 77%Joint family statistics : 1 has been decreasing since 1971
Least perentage of population living in slums whem compared to Chennai, Ahmedabad or Hyderabad
Electrical connections : 95% of households
Issuessmall houses ; overcrowding in households in 2001, 1 room / housing : 37% of households 2 room / house : 64.5% - LIG ; 53% - MIG 3.5 rooms / house (average) : HIG
Occupancy status in 1991, tenants : 50% household owners : 46%
Insufficient level of amenities in 2001, water connection : 53%
Location of poor settlementssource: Revised Masterplan Document 2015, Bangalore, Vol 1
Lack of affordable housingsource: Revised Masterplan Document 2015, Bangalore, Vol 1
Poor settlements
International Urban Planning Workshop 2012 - les Ateliers 11
BANGALORE - METROPOLE’S ID
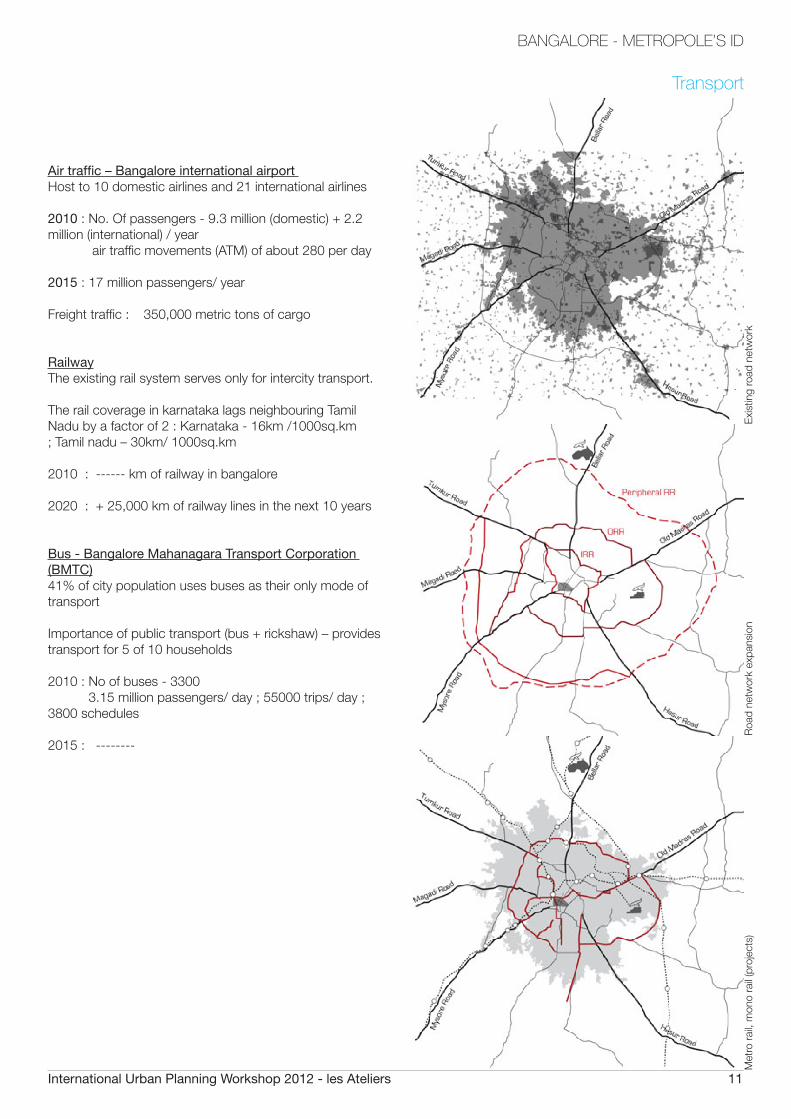
Air traffic – Bangalore international airport Host to 10 domestic airlines and 21 international airlines
2010 : No. Of passengers - 9.3 million (domestic) + 2.2 million (international) / year air traffic movements (ATM) of about 280 per day
2015 : 17 million passengers/ year
Freight traffic : 350,000 metric tons of cargo
RailwayThe existing rail system serves only for intercity transport.
The rail coverage in karnataka lags neighbouring Tamil Nadu by a factor of 2 : Karnataka - 16km /1000sq.km ; Tamil nadu – 30km/ 1000sq.km
2010 : ------ km of railway in bangalore
2020 : + 25,000 km of railway lines in the next 10 years
Bus - Bangalore Mahanagara Transport Corporation (BMTC)41% of city population uses buses as their only mode of transport
Importance of public transport (bus + rickshaw) – provides transport for 5 of 10 households
2010 : No of buses - 3300 3.15 million passengers/ day ; 55000 trips/ day ; 3800 schedules
2015 : --------
Transport
Exi
stin
g ro
ad n
etw
ork
Roa
d ne
twor
k ex
pans
ion
Met
ro r
ail,
mon
o ra
il (p
roje
cts)
International Urban Planning Workshop 2012 - les Ateliers 12
BANGALORE - METROPOLE’S ID
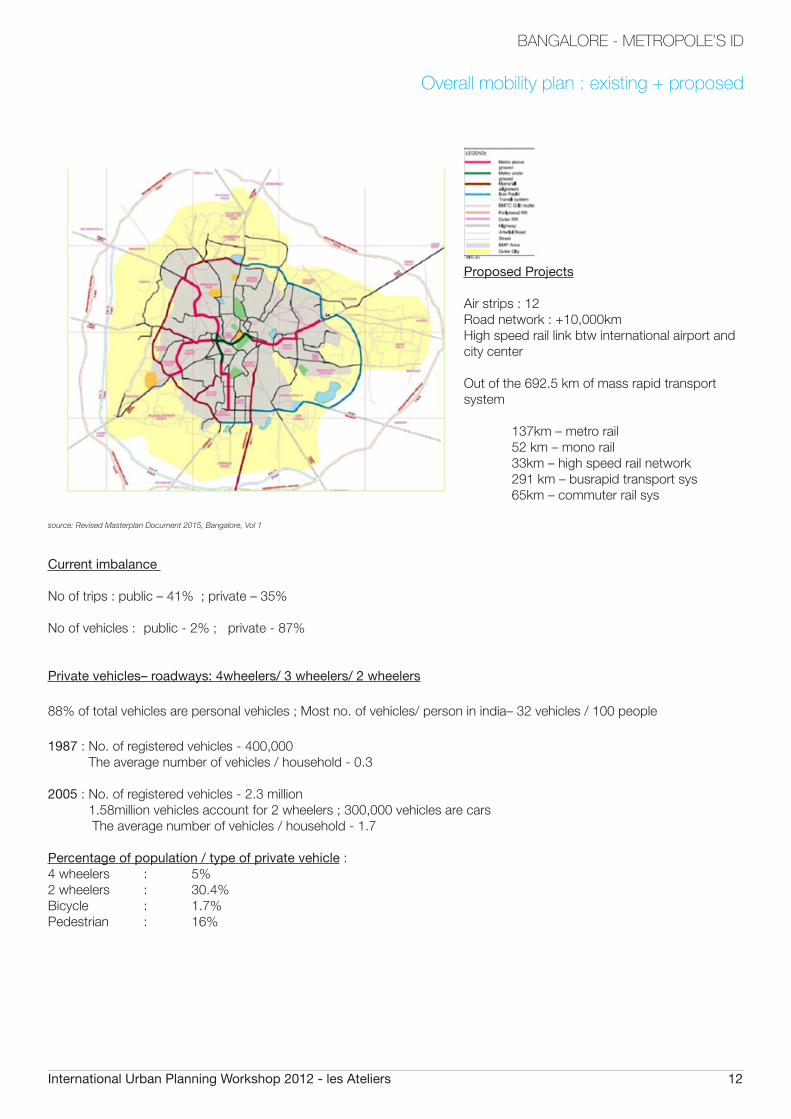
source: Revised Masterplan Document 2015, Bangalore, Vol 1
Proposed Projects
Air strips : 12Road network : +10,000kmHigh speed rail link btw international airport and city center
Out of the 692.5 km of mass rapid transport system
137km – metro rail 52 km – mono rail 33km – high speed rail network 291 km – busrapid transport sys 65km – commuter rail sys
Current imbalance
No of trips : public – 41% ; private – 35%
No of vehicles : public - 2% ; private - 87%
Private vehicles– roadways: 4wheelers/ 3 wheelers/ 2 wheelers
88% of total vehicles are personal vehicles ; Most no. of vehicles/ person in india– 32 vehicles / 100 people
1987 : No. of registered vehicles - 400,000 The average number of vehicles / household - 0.3
2005 : No. of registered vehicles - 2.3 million 1.58million vehicles account for 2 wheelers ; 300,000 vehicles are cars The average number of vehicles / household - 1.7
Percentage of population / type of private vehicle :4 wheelers : 5% 2 wheelers : 30.4% Bicycle : 1.7%Pedestrian : 16%
Overall mobility plan : existing + proposed
International Urban Planning Workshop 2012 - les Ateliers 13
BANGALORE - METROPOLE’S ID
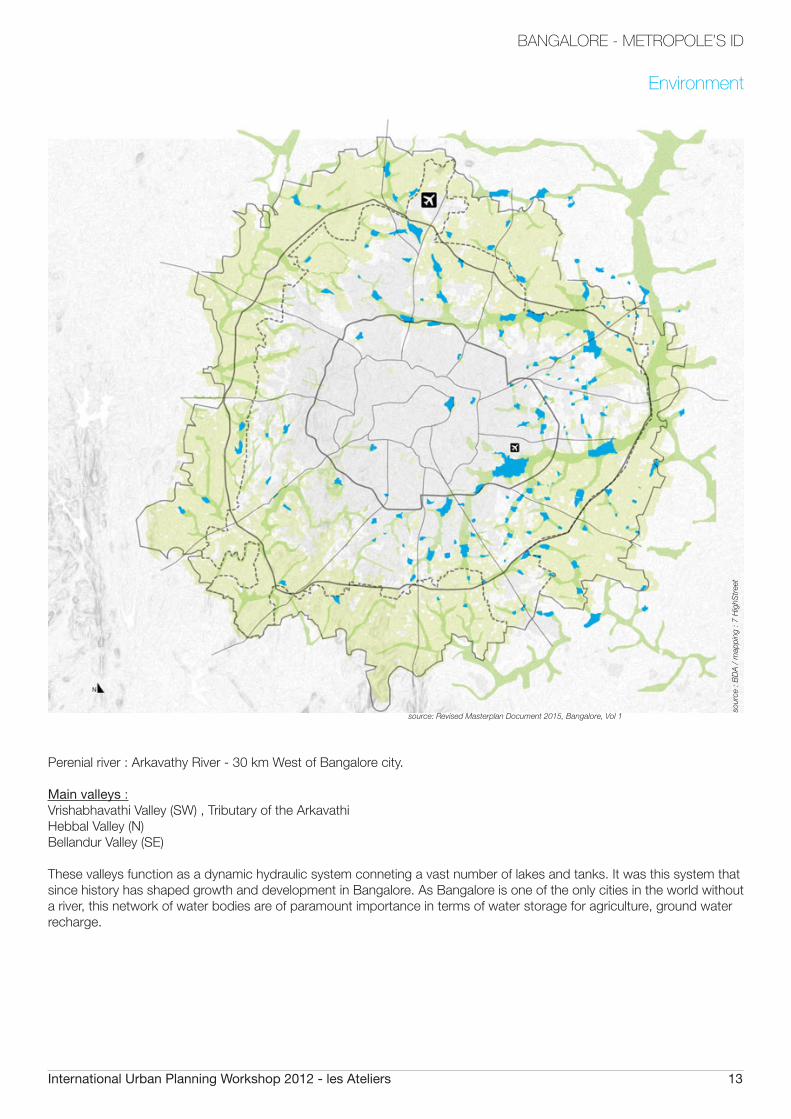
Perenial river : Arkavathy River - 30 km West of Bangalore city.
Main valleys :Vrishabhavathi Valley (SW) , Tributary of the Arkavathi Hebbal Valley (N)Bellandur Valley (SE)
These valleys function as a dynamic hydraulic system conneting a vast number of lakes and tanks. It was this system that since history has shaped growth and development in Bangalore. As Bangalore is one of the only cities in the world without a river, this network of water bodies are of paramount importance in terms of water storage for agriculture, ground water recharge.
source: Revised Masterplan Document 2015, Bangalore, Vol 1
Environment
sour
ce :
BD
A /
map
ping
: 7
Hig
hStr
eet
International Urban Planning Workshop 2012 - les Ateliers 14
BANGALORE - METROPOLE’S ID
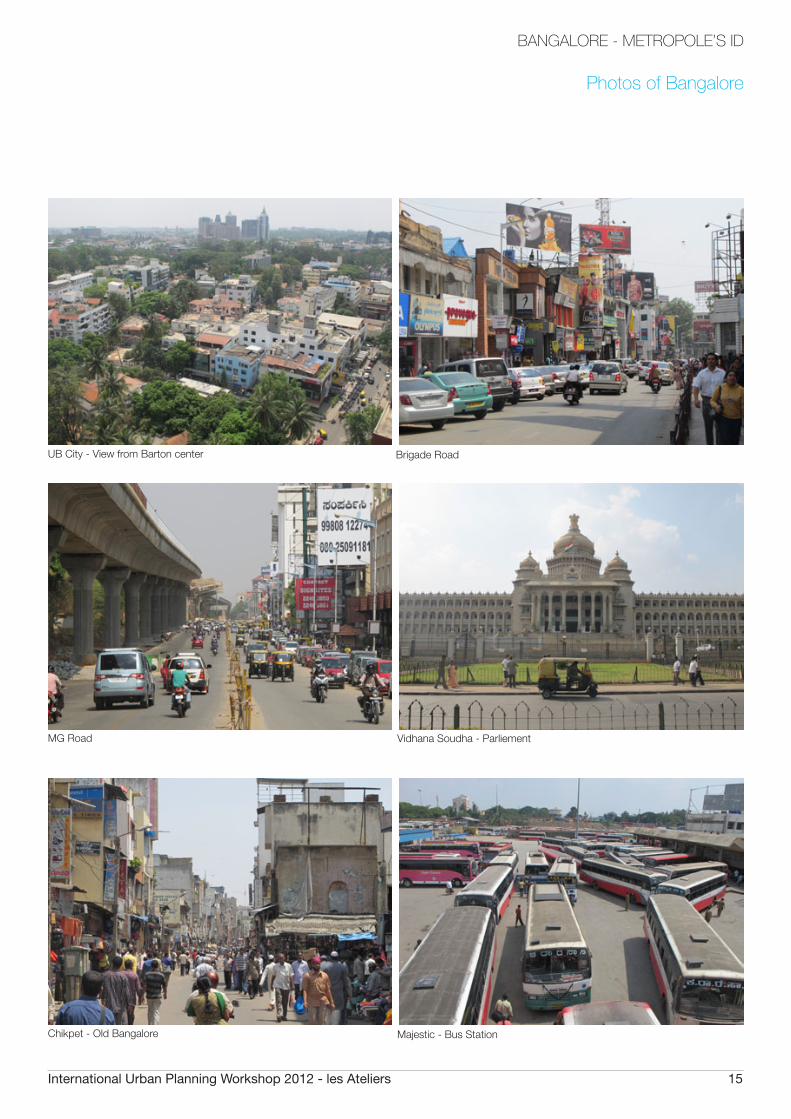
Photos of Bangalore
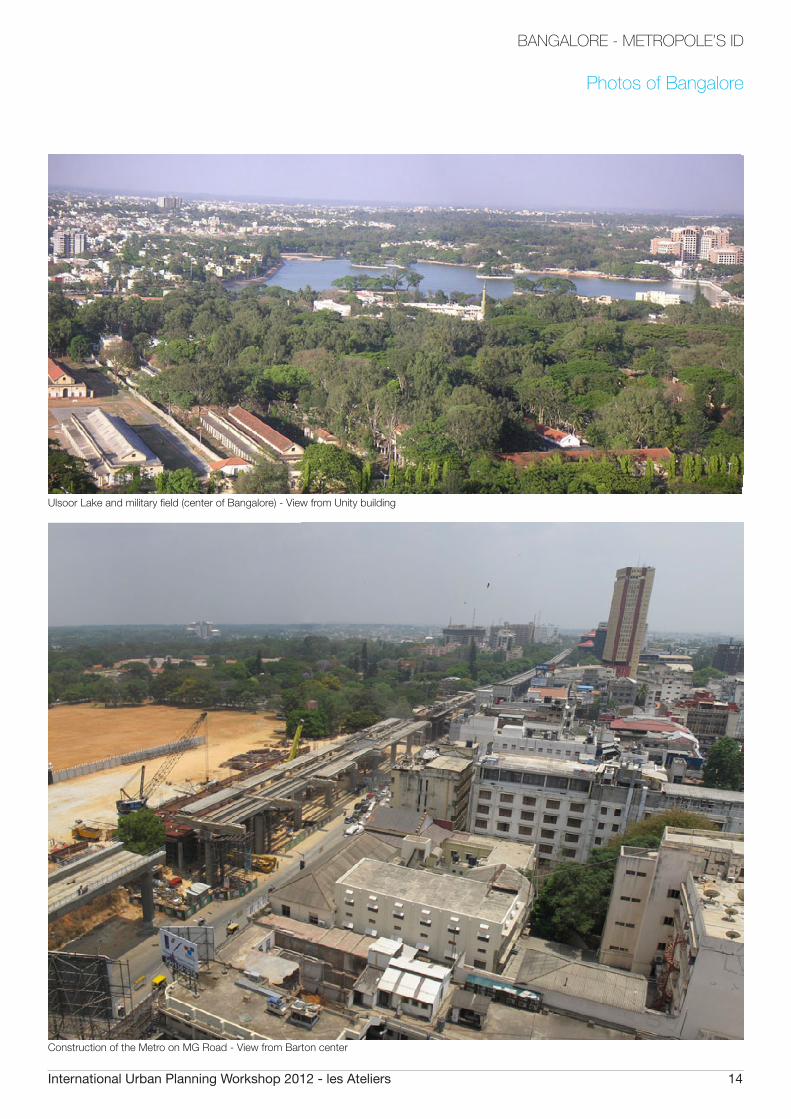
Construction of the Metro on MG Road - View from Barton center
Ulsoor Lake and military field (center of Bangalore) - View from Unity building
International Urban Planning Workshop 2012 - les Ateliers 15
BANGALORE - METROPOLE’S ID
Photos of Bangalore
UB City - View from Barton center Brigade Road
MG Road Vidhana Soudha - Parliement
Chikpet - Old Bangalore Majestic - Bus Station
International Urban Planning Workshop 2012 - les Ateliers 16
BANGALORE - METROPOLE’S ID
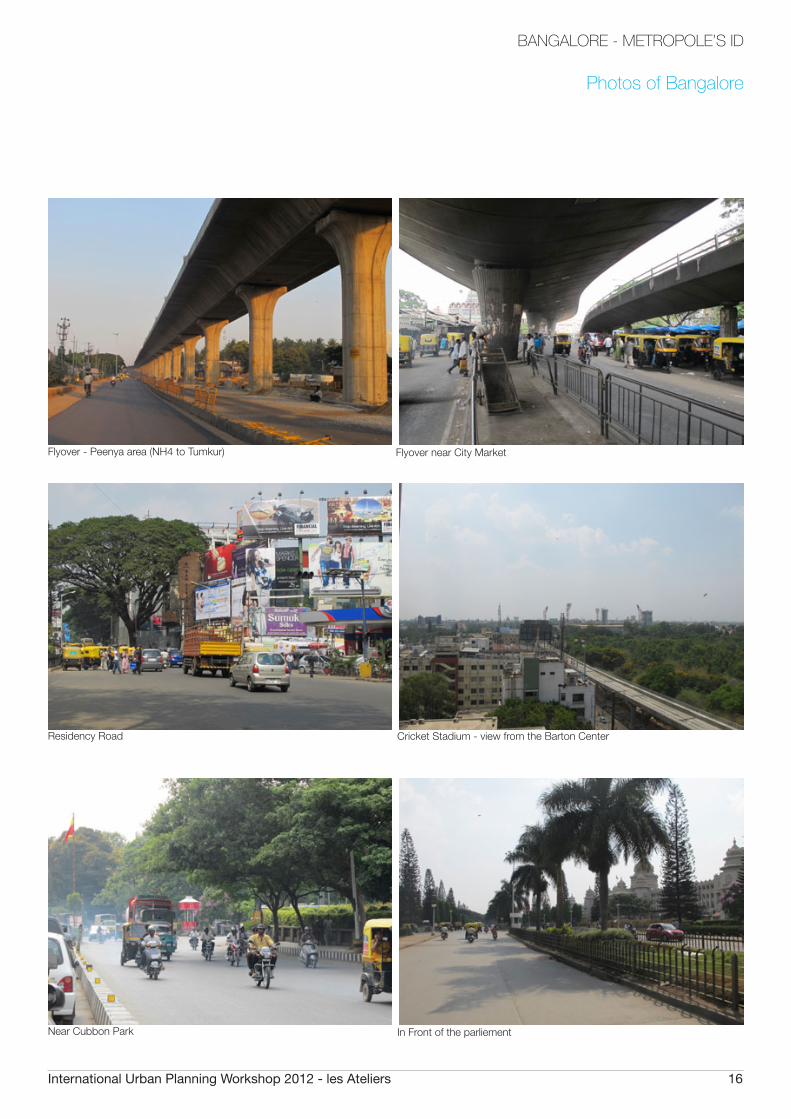
Photos of Bangalore
Flyover - Peenya area (NH4 to Tumkur) Flyover near City Market
Residency Road Cricket Stadium - view from the Barton Center
Near Cubbon Park In Front of the parliement
International Urban Planning Workshop 2012 - les Ateliers 17
BANGALORE - METROPOLE’S ID
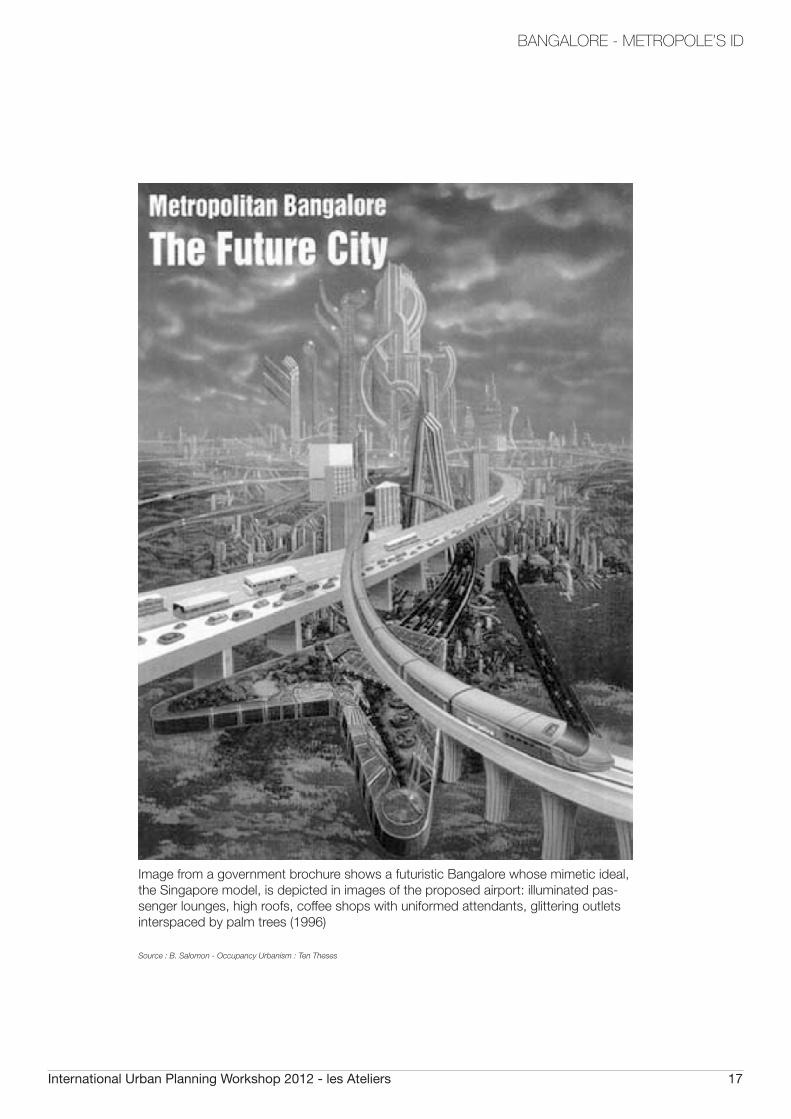
Image from a government brochure shows a futuristic Bangalore whose mimetic ideal, the Singapore model, is depicted in images of the proposed airport: illuminated pas-senger lounges, high roofs, coffee shops with uniformed attendants, glittering outlets interspaced by palm trees (1996)
Source : B. Salomon - Occupancy Urbanism : Ten Theses