Embed Size (px)
Citation preview
Banco Central de Chile Documentos de Trabajo
Central Bank of Chile Working Papers
N° 426
Agosto 2007
ON THE SOURCES OF CHINA’S EXPORT GROWTH
Roberto Álvarez Sebastián Claro
La serie de Documentos de Trabajo en versión PDF puede obtenerse gratis en la dirección electrónica: http://www.bcentral.cl/esp/estpub/estudios/dtbc. Existe la posibilidad de solicitar una copia impresa con un costo de $500 si es dentro de Chile y US$12 si es para fuera de Chile. Las solicitudes se pueden hacer por fax: (56-2) 6702231 o a través de correo electrónico: [email protected]. Working Papers in PDF format can be downloaded free of charge from: http://www.bcentral.cl/eng/stdpub/studies/workingpaper. Printed versions can be ordered individually for US$12 per copy (for orders inside Chile the charge is Ch$500.) Orders can be placed by fax: (56-2) 6702231 or e-mail: [email protected].
BANCO CENTRAL DE CHILE
CENTRAL BANK OF CHILE
La serie Documentos de Trabajo es una publicación del Banco Central de Chile que divulga los trabajos de investigación económica realizados por profesionales de esta institución o encargados por ella a terceros. El objetivo de la serie es aportar al debate temas relevantes y presentar nuevos enfoques en el análisis de los mismos. La difusión de los Documentos de Trabajo sólo intenta facilitar el intercambio de ideas y dar a conocer investigaciones, con carácter preliminar, para su discusión y comentarios. La publicación de los Documentos de Trabajo no está sujeta a la aprobación previa de los miembros del Consejo del Banco Central de Chile. Tanto el contenido de los Documentos de Trabajo como también los análisis y conclusiones que de ellos se deriven, son de exclusiva responsabilidad de su o sus autores y no reflejan necesariamente la opinión del Banco Central de Chile o de sus Consejeros. The Working Papers series of the Central Bank of Chile disseminates economic research conducted by Central Bank staff or third parties under the sponsorship of the Bank. The purpose of the series is to contribute to the discussion of relevant issues and develop new analytical or empirical approaches in their analyses. The only aim of the Working Papers is to disseminate preliminary research for its discussion and comments. Publication of Working Papers is not subject to previous approval by the members of the Board of the Central Bank. The views and conclusions presented in the papers are exclusively those of the author(s) and do not necessarily reflect the position of the Central Bank of Chile or of the Board members.
Documentos de Trabajo del Banco Central de Chile Working Papers of the Central Bank of Chile
Agustinas 1180 Teléfono: (56-2) 6702475; Fax: (56-2) 6702231
Documento de Trabajo Working Paper N° 426 N° 426
ON THE SOURCES OF CHINA’S EXPORT GROWTH
Roberto Álvarez Sebastián Claro Banco Central de Chile Pontificia Universidad Católica de Chile
Resumen En este trabajo se utiliza detallada información de exportaciones de China a Chile durante el período 1990-2005 para analizar las fuentes del crecimiento exportador de esta economía. China exporta una gran variedad de productos. Sin embargo, el crecimiento de sus exportaciones es explicado principalmente por un aumento de los productos que exporta en común con el resto del mundo (margen intensivo), y no por un aumento de las variedades de productos exportados (margen extensivo). Sorprendentemente, se encuentra que el crecimiento en el margen intensivo es explicado por un aumento en cantidades exportadas, sin que ello haya significado una caída significativa en el precio relativo de las variedades exportadas por China. Esta aparente paradoja sugiere que un aumento en el número no observado de variedades o un aumento en la disposición a pagar por productos chinos es la principal causa de su crecimiento exportador. Este trabajo presenta evidencia respecto al comportamiento de los precios de los bienes exportados por China, la similitud de sus exportaciones con países desarrollados y la evolución de la calidad relativa de sus productos para concluir que la mejora en la calidad de los productos chinos es una dimensión importante de su crecimiento exportador. Abstract We use detailed data on Chilean imports between 1990 and 2005 to analyze the causes of China’s import penetration relative to other countries. China exports a wide variety of products. The growth in China’s exports, however, is mainly driven by an increase in import penetration within common product categories with the rest of the world—the intensive margin—rather than by an increase in the number of product varieties exported—the extensive margin. Surprisingly, the growth in the intensive margin is explained by an increase in exported quantities without a significant fall in the relative price of Chinese varieties. This apparent paradox suggests that an increase in either the number of unobserved varieties or the willingness to pay for Chinese products—an increase in the relative quality of Chinese products—is the driving force behind China’s export performance. We present evidence regarding China’s export prices, the similarity of China’s export bundle to that of developed countries, and the relative quality of Chinese products, to conclude that improvements in the quality of Chinese products is an important dimension of Chinese export growth. _______________ We thank Álvaro García for assistance and Consuelo Edwards for editing this article. Sebastián Claro acknowledges the financial support from Fundación Andes through grant 14-060-9. E-mail: [email protected] ; [email protected].

1. Introduction
After several decades of autarky, Chinese exports have grown vigorously—especially
since the 1990s—to become one of the most important trading partners in the world. This
phenomenon has generated growing literature to analyze the potential impact of Chinese
competition on third countries, especially in labor-intensive industries where China’s
exports are dominant. Although there are some descriptive and illustrative works
discussing the potential impact of China (Devlin et Al., 2006; Blásquez-Lidoy et al.,
2006), only few papers have studied this phenomenon in detail. Some papers have
focused on the impact on other Asian countries’ exports (Eichengreen et al., 2004) while
others have analyzed the effects on Latin American exports in a third market (López
Córdova et al., 2005 and 2006). There is also some recent works on the potential effects
of Chinese imports’ competition on domestic industries. Alvarez and Claro (2007) study
whether Chilean manufacturing plants have been negatively affected by Chinese
competition or they have been able to adjust through changes in product mix and
exports.1 Contrary to the evidence of Bernard et al. (2006), who show that US
manufacturing firms have escaped from import competition of low-wage countries
through quality upgrading, the evidence for Chile suggests that room for upgrading is
much smaller, meaning that domestic firms have shrunk in response to low-wage import
competition.
However, a detailed study of the impact of Chinese competition on other economies
requires an analysis of the characteristics of Chinese products. In other words, we do not
have a complete and broad view of the characteristics of China’s exports, which is crucial
1 See also Castro et al. (2007), for an empirical study of the impact of Chinese and Indian imports on manufacturing employment in Argentina.
to have a good understanding of the potential effects of Chinese exports on world
markets. There is evidence that China’s exports are higher in labor-intensive sectors,
which is consistent with traditional endowment-based trade theory (see Leamer, 1995).
There is, however, much less information regarding product heterogeneity within
industries, like price and quality differences. Recently, the trade literature has emphasized
that factor endowment differences can lead not only to cross-industry specialization but
also to within-product specialization. For example, using imports data from the United
States, Rodrik (2006) and Schott (2006) have shown that China’s exports may be
relatively more and less sophisticated compared to exports of other countries with similar
factor endowments, depending on the metric used to compare exports sophistication.
Branstetter and Lardy (2006) argue that the evidence of relatively high sophistication of
Chinese exports, like in Rodrik (2006), does not take into account that China imports
high-value-added parts and components, suggesting that after controlling for the structure
of intermediate inputs, China’s export structure reflects low costs of labor-intensive
assembly. Our paper is an effort to analyze the characteristics of Chinese competition in
developing countries, using highly-disaggregated data of Chilean imports between 1990
and 2005. We focus on within-industry heterogeneity in order to distinguish the
characteristics of Chinese products vis-à-vis the rest of the world.
This paper is structured as follows. In section 2, we use the methodology developed
by Hummels and Klenow (2005) to decompose import growth into two different margins:
imports in common product categories from China and the rest of the world (intensive
margin), and imports in different product categories (extensive margin). This distinction
allows us to study the extent to which China’s import penetration in Chile relative to the
2
rest of the world is due to an increase in the set of products produced and exported from
China or rather to higher penetration in common product categories. We also decompose
the intensive margin into price and quantity margins to distinguish whether within-
industry import differences are due to price differences and/or quantity differences. In
section 3, we analyze the relative sophistication of Chinese exports by comparing cross-
country differences in export prices. Following the idea that prices may reflect—albeit
imperfectly—the quality of goods, we estimate price differentials between China and the
rest of the world, and analyze whether there are systematic differences in export prices. In
section 4, we analyze quality differences more deeply. We compare China’s export
basket to Chile with that of other exporters—especially OECD countries—and we report
some results regarding quality differentials between Chinese varieties and those from the
rest of the world. In section 5 we summarize our findings and conclude.
2. The Intensive and Extensive Margins of Chinese Exports
2.1 Data Source
The data is obtained from Chile’s Customs office, and it comprises all import entries
at the 8-digit HS level (4815 categories in 1990 and 6702 in 2005).2 For each product, we
have data for China and all other exporting countries on the CIF dollar value of imports
and the quantity imported. We denote China with the subscript c , and the rest of the
world by subscript r . Therefore, unitary import prices from country c in product ,
defined at the 8-digit level, are computed )cjt
j
as /( cjtcjt XMP = , wh cjtM is the CIF
value of imports (in current US dollars) from country c in product j in year t d cjtX
ere
an
,
2 Throughout this paper, we refer to a product as an 8-digit level category.
3
is the quantity imported (i.e., pairs of shoes, pounds of folic acid, meters of carpets, etc.)
Table 1 reports a summary of the data.
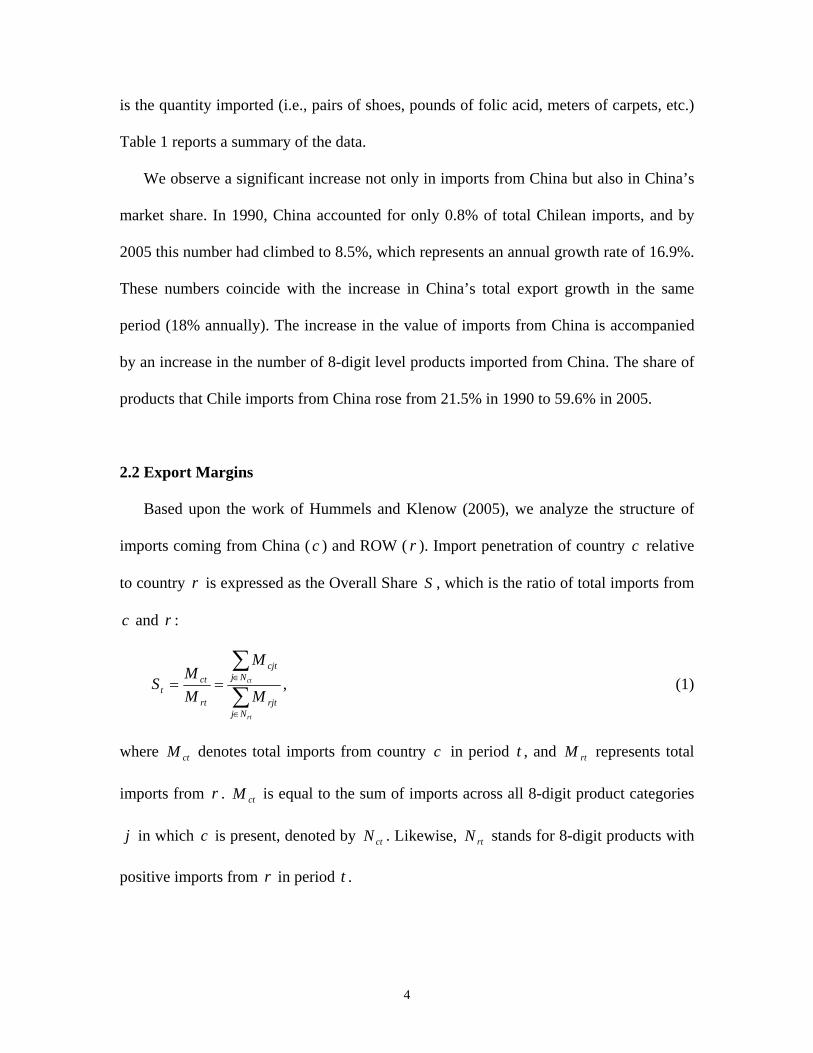
We observe a significant increase not only in imports from China but also in China’s
market share. In 1990, China accounted for only 0.8% of total Chilean imports, and by
2005 this number had climbed to 8.5%, which represents an annual growth rate of 16.9%.
These numbers coincide with the increase in China’s total export growth in the same
period (18% annually). The increase in the value of imports from China is accompanied
by an increase in the number of 8-digit level products imported from China. The share of
products that Chile imports from China rose from 21.5% in 1990 to 59.6% in 2005.
2.2 Export Margins
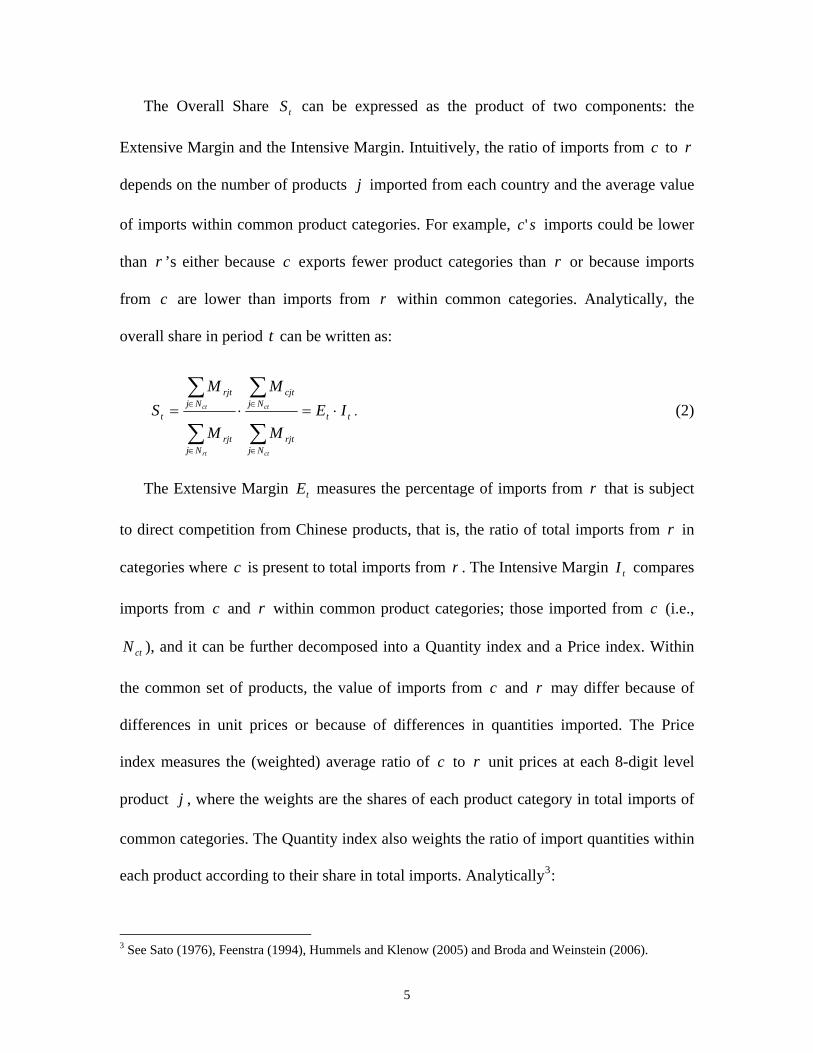
Based upon the work of Hummels and Klenow (2005), we analyze the structure of
imports coming from China ( c ) and ROW ( r ). Import penetration of country relative
to country
c
r is expressed as the Overall Share , which is the ratio of total imports from
and
S
c r :
∑∑
∈
∈==
rt
ct
Njrjt
Njcjt
rt
ctt M
M
MM
S , (1)
where denotes total imports from country in period t , and represents total
imports from
ctM c rtM
r . is equal to the sum of imports across all 8-digit product categories
in which c is present, denoted by . Likewise, stands for 8-digit products with
positive imports from
ctM
j ctN rtN
r in period . t
4
The Overall Share can be expressed as the product of two components: the
Extensive Margin and the Intensive Margin. Intuitively, the ratio of imports from to
tS
c r
depends on the number of products imported from each country and the average value
of imports within common product categories. For example, imports could be lower
than
j
sc'
r ’s either because c exports fewer product categories than r or because imports
from are lower than imports from c r within common categories. Analytically, the
overall share in period can be written as: t
tt
Njrjt
Njcjt
Njrjt
Njrjt
t IEM
M
M
MS
ct
ct
rt
ct ⋅=⋅=
∑
∑
∑
∑
∈
∈
∈
∈. (2)
The Extensive Margin measures the percentage of imports from tE r that is subject
to direct competition from Chinese products, that is, the ratio of total imports from r in
categories where c is present to total imports from r . The Intensive Margin compares
imports from c and
tI
r within common product categories; those imported from c (i.e.,
), and it can be further decomposed into a Quantity index and a Price index. Within
the common set of products, the value of imports from and
ctN
c r may differ because of
differences in unit prices or because of differences in quantities imported. The Price
index measures the (weighted) average ratio of c to r unit prices at each 8-digit level
product , where the weights are the shares of each product category in total imports of
common categories. The Quantity index also weights the ratio of import quantities within
each product according to their share in total imports. Analytically
j
3:
3 See Sato (1976), Feenstra (1994), Hummels and Klenow (2005) and Broda and Weinstein (2006).
5
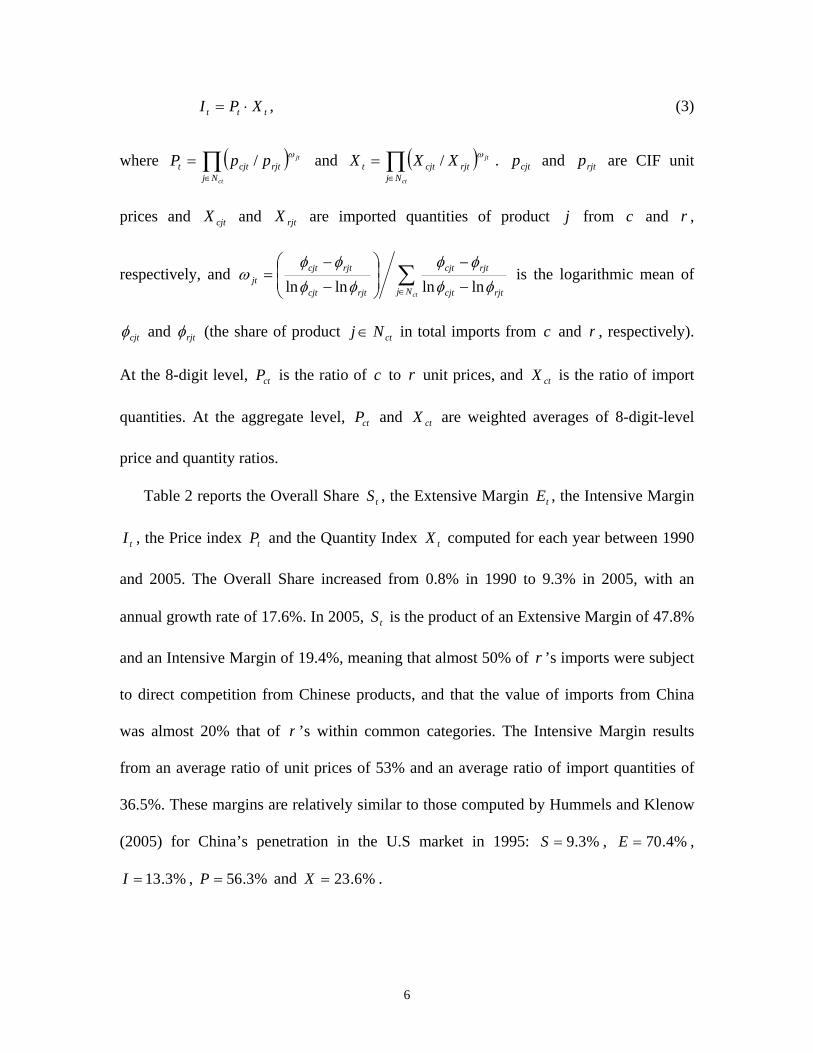
ttt XPI ⋅= , (3)
where and . and are CIF unit
prices and and are imported quantities of product from and
(∏∈
=ct
jt
Njrjtcjtt ppP ω/ ) ∏
∈
=ct
jt
Njrjtcjtt XXX ω/ cjtp( ) rjtp
cjtX rjtX j c r ,
respectively, and ∑∈ −
−⎟⎟⎠
⎞⎜⎜⎝
⎛
−
−=
ctNj rjtcjt
rjtcjt
rjtcjt
rjtcjtjt φφ
φφφφ
φφω
lnlnlnln is the logarithmic mean of
cjtφ and rjtφ (the share of product ctNj∈ in total imports from and c r , respectively).
At the 8-digit level, is the ratio of to ctP c r unit prices, and is the ratio of import
quantities. At the aggregate level, and are weighted averages of 8-digit-level
price and quantity ratios.
ctX
ctP ctX
Table 2 reports the Overall Share , the Extensive Margin , the Intensive Margin
, the Price index and the Quantity Index computed for each year between 1990
and 2005. The Overall Share increased from 0.8% in 1990 to 9.3% in 2005, with an
annual growth rate of 17.6%. In 2005, is the product of an Extensive Margin of 47.8%
and an Intensive Margin of 19.4%, meaning that almost 50% of
tS tE
tI tP tX
tS
r ’s imports were subject
to direct competition from Chinese products, and that the value of imports from China
was almost 20% that of r ’s within common categories. The Intensive Margin results
from an average ratio of unit prices of 53% and an average ratio of import quantities of
36.5%. These margins are relatively similar to those computed by Hummels and Klenow
(2005) for China’s penetration in the U.S market in 1995: %3.9=S , ,
, and .
%4.70=E
%3.13=I %3.56=P %6.23=X
6
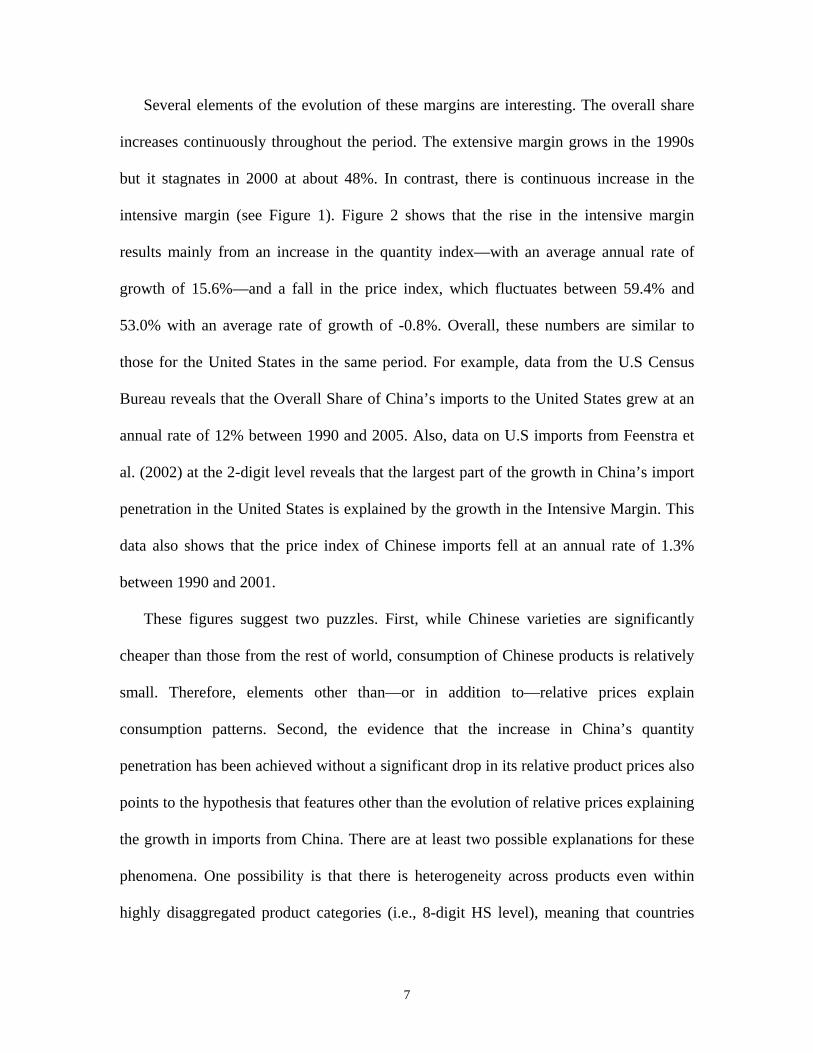
Several elements of the evolution of these margins are interesting. The overall share
increases continuously throughout the period. The extensive margin grows in the 1990s
but it stagnates in 2000 at about 48%. In contrast, there is continuous increase in the
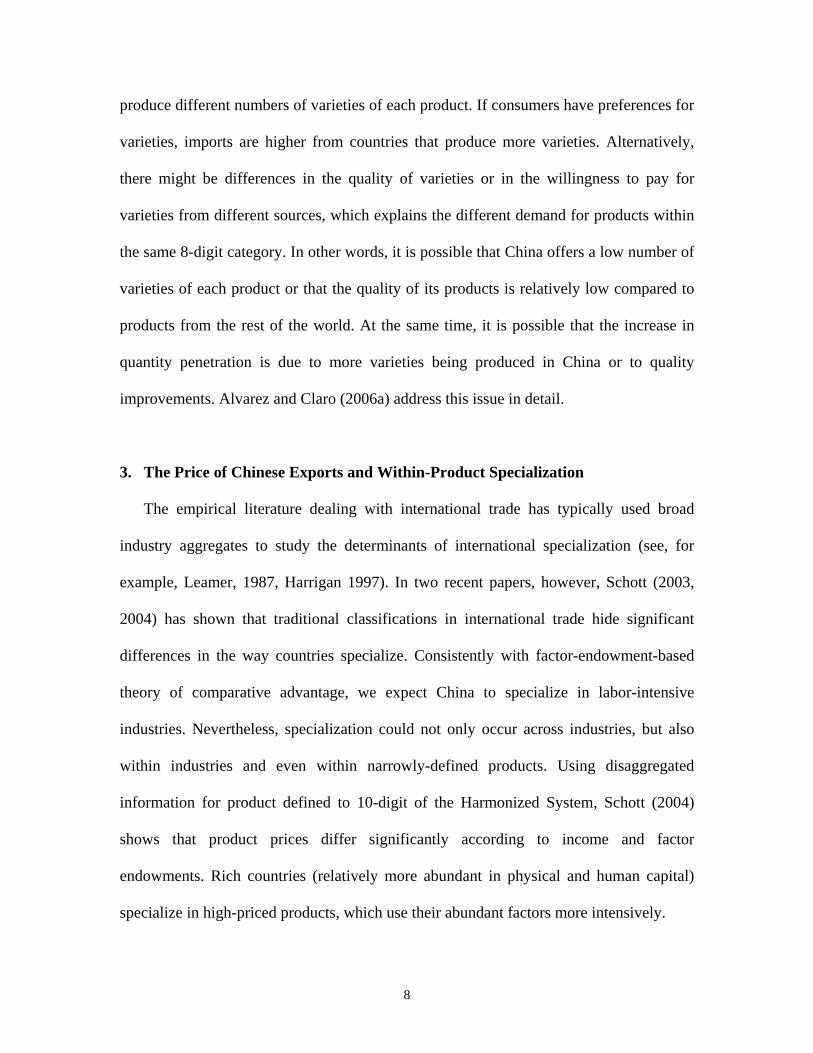
intensive margin (see Figure 1). Figure 2 shows that the rise in the intensive margin
results mainly from an increase in the quantity index—with an average annual rate of
growth of 15.6%—and a fall in the price index, which fluctuates between 59.4% and
53.0% with an average rate of growth of -0.8%. Overall, these numbers are similar to
those for the United States in the same period. For example, data from the U.S Census
Bureau reveals that the Overall Share of China’s imports to the United States grew at an
annual rate of 12% between 1990 and 2005. Also, data on U.S imports from Feenstra et
al. (2002) at the 2-digit level reveals that the largest part of the growth in China’s import
penetration in the United States is explained by the growth in the Intensive Margin. This
data also shows that the price index of Chinese imports fell at an annual rate of 1.3%
between 1990 and 2001.
These figures suggest two puzzles. First, while Chinese varieties are significantly
cheaper than those from the rest of world, consumption of Chinese products is relatively
small. Therefore, elements other than—or in addition to—relative prices explain
consumption patterns. Second, the evidence that the increase in China’s quantity
penetration has been achieved without a significant drop in its relative product prices also
points to the hypothesis that features other than the evolution of relative prices explaining
the growth in imports from China. There are at least two possible explanations for these
phenomena. One possibility is that there is heterogeneity across products even within
highly disaggregated product categories (i.e., 8-digit HS level), meaning that countries
7
produce different numbers of varieties of each product. If consumers have preferences for
varieties, imports are higher from countries that produce more varieties. Alternatively,
there might be differences in the quality of varieties or in the willingness to pay for
varieties from different sources, which explains the different demand for products within
the same 8-digit category. In other words, it is possible that China offers a low number of
varieties of each product or that the quality of its products is relatively low compared to
products from the rest of the world. At the same time, it is possible that the increase in
quantity penetration is due to more varieties being produced in China or to quality
improvements. Alvarez and Claro (2006a) address this issue in detail.
3. The Price of Chinese Exports and Within-Product Specialization
The empirical literature dealing with international trade has typically used broad
industry aggregates to study the determinants of international specialization (see, for
example, Leamer, 1987, Harrigan 1997). In two recent papers, however, Schott (2003,
2004) has shown that traditional classifications in international trade hide significant
differences in the way countries specialize. Consistently with factor-endowment-based
theory of comparative advantage, we expect China to specialize in labor-intensive
industries. Nevertheless, specialization could not only occur across industries, but also
within industries and even within narrowly-defined products. Using disaggregated
information for product defined to 10-digit of the Harmonized System, Schott (2004)
shows that product prices differ significantly according to income and factor
endowments. Rich countries (relatively more abundant in physical and human capital)
specialize in high-priced products, which use their abundant factors more intensively.
8
We test this hypothesis using Chilean imports data. In particular, we first show
evidence of systematic relationship between import prices and exporter’s income, and
analyze how Chinese product prices compare to those of countries with similar income
per capita. We use highly-disaggregated 8-digit Harmonized System (HS) import data
from all importing countries during the period 1990-2005 from Chilean Customs. We
compute the price for each product as unit value: imports in dollars over imported
quantity.
We first estimate the following equation4:
jititjtjit LogILogP εδα +⋅+= (1)
where is unit value (in dollars) of imports from country in 8-digit product in
year and is per capita GDP in PPP for the exporter country . Product-year fixed
effects are denoted by
jitP i j
itI i
jtα . The parameter δ of interest is expected to be positive, which is
consistent with the idea that richer countries specialize in high-priced goods. The results
confirm the hypothesis of within-product specialization (Table 3). The parameter δ in
column (1) is estimated to be 0.24, meaning that a 10 percent increase in per capita
income is associated with a 2.4 percent increase in product prices. In column (2) we get a
similar result using a restricted sample of product imported from both low and high
income countries5.
In Alvarez and Claro (2006b), using a sample of 44 exporting countries for the period
1990-2003, we estimate equation (1) for each of 80 manufacturing industries at 4-digit
4 We also include year-fixed effects for controlling for shocks that are common across products imported form different countries. 5 Low-income countries are those with income per capita lower than that of 30% of countries in the sample, and high-income countries are those with income per capita higher than that of 70% of countries in the sample. Per capita GDP in PPP is taken from World Development Indicators.
9

ISIC to check whether the estimated coefficient varies across industries. The results are
fairly consistent with the idea that richer countries receive higher prices for their exports
across all sectors. In 65 out of 80 industries (81.3% of the manufacturing industries) the
estimated parameter is positive and significant (at 5%), and only for one industry the
parameter is negative but not significant.
We estimate a different version of equation (1) to analyze whether Chinese import
prices differ from those of other countries after controlling for income per capita. The
specification used is:
jititjtjit ICHNLogP εδβα +⋅+⋅+= log (2)
In equation (2), CHN is a dummy variable for products imported from China. We are
particularly interested in testing if β is negative or positive. In the case that β is negative
we conclude that China’s products are cheaper than those of countries with similar per
capita income. The results are shown in the third and fourth columns of Table 3. We find
that imports from China receive a price that is—on average—28.6 and 31.9 percent lower
than that of countries at similar development stages. The evidence that Chinese products
are relatively cheap, even compared to countries with similar income is consistent with
that from Schott (2006), who shows that, during the 1990s, Chinese products on average
sold for a discount relative to products of countries with similar GDP per capita in the
United States.6
We also analyze how the China coefficient has changed over time. Columns (5) and
(6) report the evidence of estimating equation (2) including an interaction term between
6 He also provides evidence that the number of product categories exported from China to the United States is significantly larger than those of countries at similar stages of development. This explains why he argues that China’s exports are relatively sophisticated compared to those of countries with similar income.
10
the dummy for China and period-specific dummy variables for the period 1990-1995,
1996-2000 and 2001-2005. Our results show no evidence of a statistical price difference,
after controlling for income, for the period 1990-1995, and weak evidence for the period
1996-2000. However, there is significant evidence that Chinese prices have declined
relative to countries with similar income per capita in the period 2001-2005. This
evidence is robust if we restrict the sample to include only products imported from low-
and high-income economies.7
In sum, we have found evidence of within-product specialization, in the sense that
income per capita differences are associated with differences in product prices within
highly-disaggregated product categories, which presumably reflect cross-country
differences in the types of varieties produced in response to differences in technology and
factor abundance. In particular, price differences are highly correlated with income per
capita of the exporter’s country, and products imported from China are low priced
compared to those of countries with similar income per capita. Finally, we also find that
the prices of Chinese products have declined relative to those from the rest of the world
since the mid 1990s. However, this decline is relatively small, suggesting that elements
other than relative prices explain China’s export growth.
4. Quality Dimensions of Chinese Exports
In this section, we analyze the relative sophistication (or quality) of Chinese exports
in two dimensions. First, we look at China’s export basket compared to that of developed
economies. Second, we present some evidence regarding quality differences between
7 For both specifications, the null hypothesis that China’s coefficient is the same in 1995-2000 and 2001-2005 is rejected at 1% of significance.
11

varieties of China and the rest of the world. The idea is to search for direct or indirect
evidence supporting the hypothesis that there has been an increase in quality or
willingness to pay for Chinese products relative to the rest of the world.
4.1 Similarity of Export Baskets
A first measure of an increase in the quality of Chinese products is obtained by
comparing China’s export basket to that of other countries, especially developed
economies. Following Rodrik (2006) and Schott (2006), we conjecture that China’s
export mix has become more sophisticated over time if it has become more similar to that
of developed countries. We measure the similarity of export baskets using an index
developed by Finger and Kreinin (1979). For any two exporters, say China ( ) and other
country ( ), the export similarity index in Chile is given by:
c
i
∑=j
jitjct ss ),min(SIMcit , (3)
where is an 8-digit level product category, is the share of product in total
Chinese exports to Chile in year , and is the share of product in total exports of
country to Chile in year t . This bilateral measure is bounded by zero (if there are no
common product categories between China and country i ) and one (if the share of each
product in total exports is identical in both countries). To illustrate how Chinese exports
perform relative to countries at different development stages, we compare export
similarity of China with three groups of countries: Asia, Latin America, and OECD.
j jcts j
t jits j
i
8
8 While grouping countries, we sum exports over countries in the group and then use group-level rather than individual export shares for computing the similarity index.
12
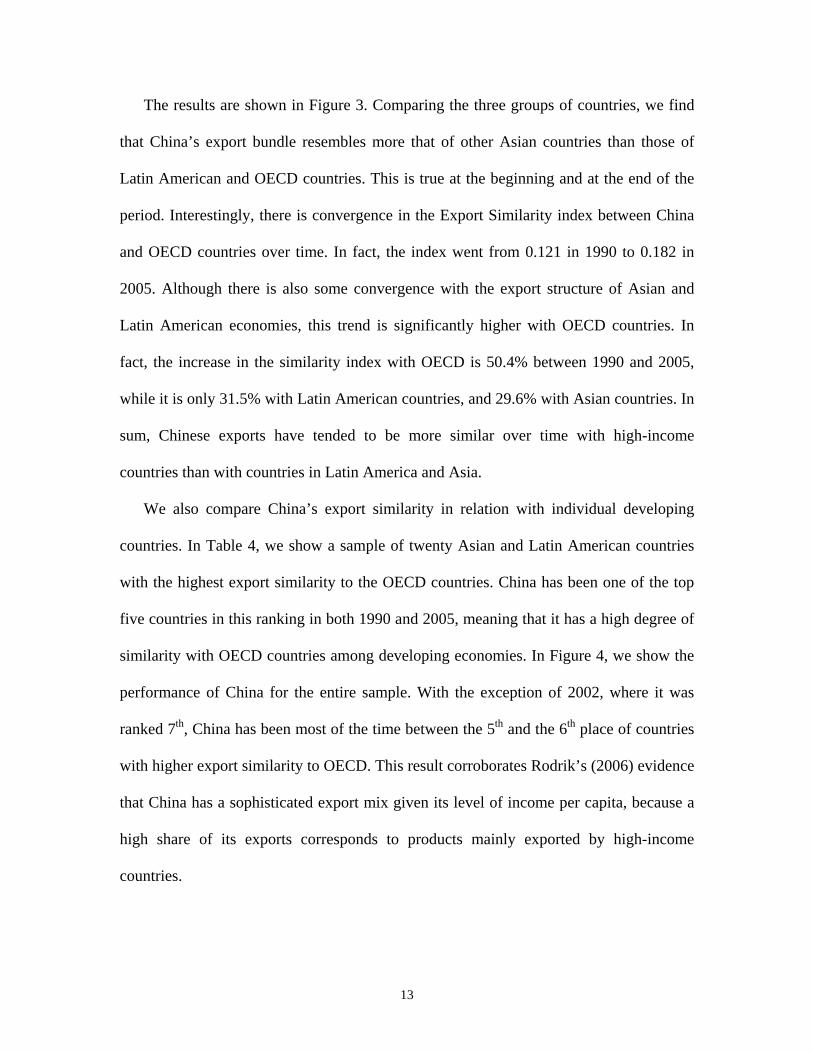
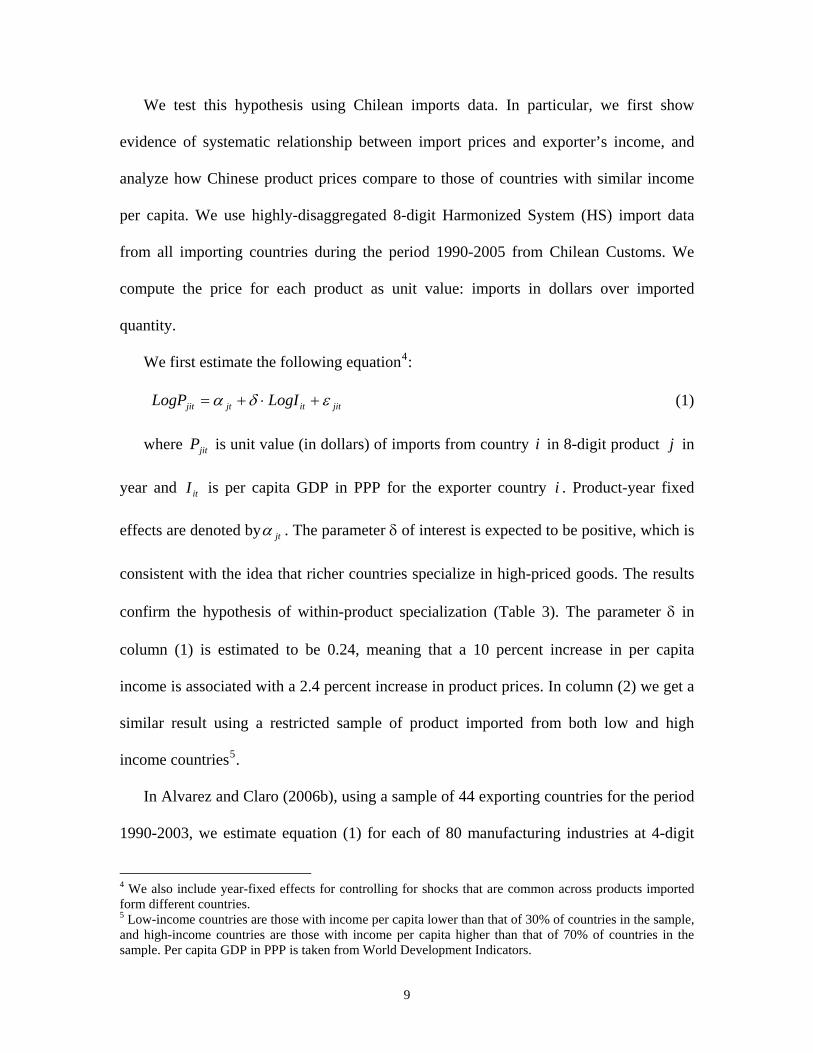
The results are shown in Figure 3. Comparing the three groups of countries, we find
that China’s export bundle resembles more that of other Asian countries than those of
Latin American and OECD countries. This is true at the beginning and at the end of the
period. Interestingly, there is convergence in the Export Similarity index between China
and OECD countries over time. In fact, the index went from 0.121 in 1990 to 0.182 in
2005. Although there is also some convergence with the export structure of Asian and
Latin American economies, this trend is significantly higher with OECD countries. In
fact, the increase in the similarity index with OECD is 50.4% between 1990 and 2005,
while it is only 31.5% with Latin American countries, and 29.6% with Asian countries. In
sum, Chinese exports have tended to be more similar over time with high-income
countries than with countries in Latin America and Asia.
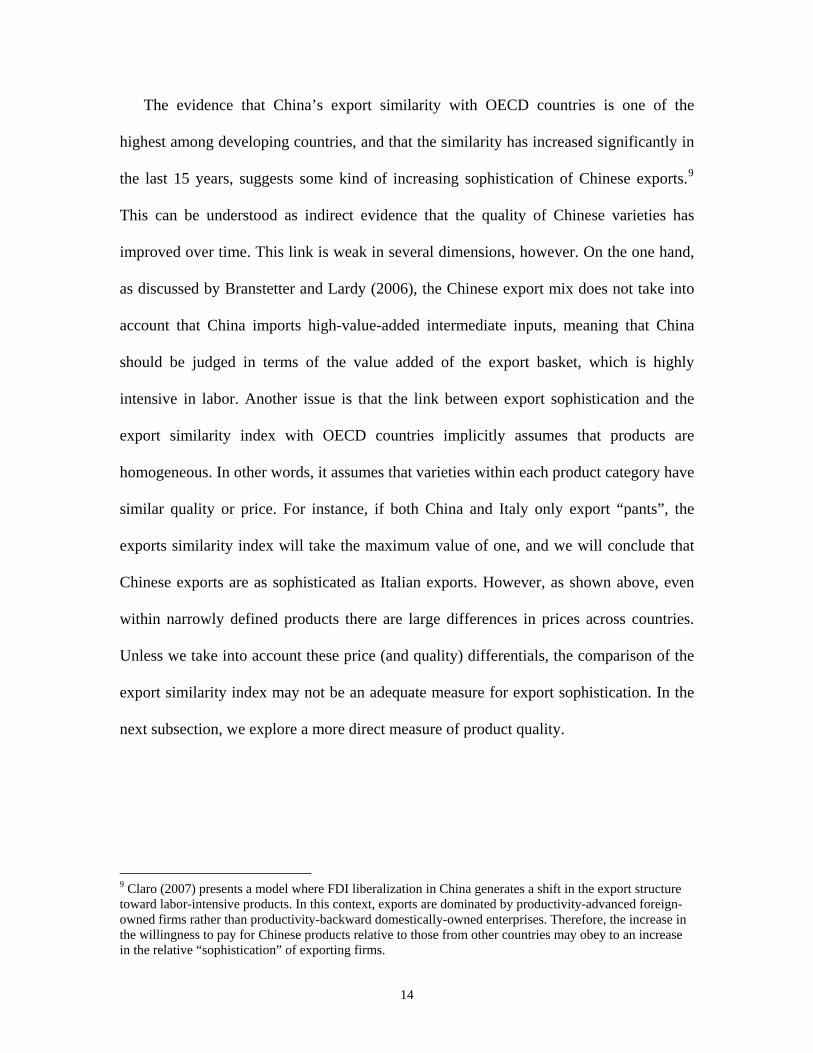
We also compare China’s export similarity in relation with individual developing
countries. In Table 4, we show a sample of twenty Asian and Latin American countries
with the highest export similarity to the OECD countries. China has been one of the top
five countries in this ranking in both 1990 and 2005, meaning that it has a high degree of
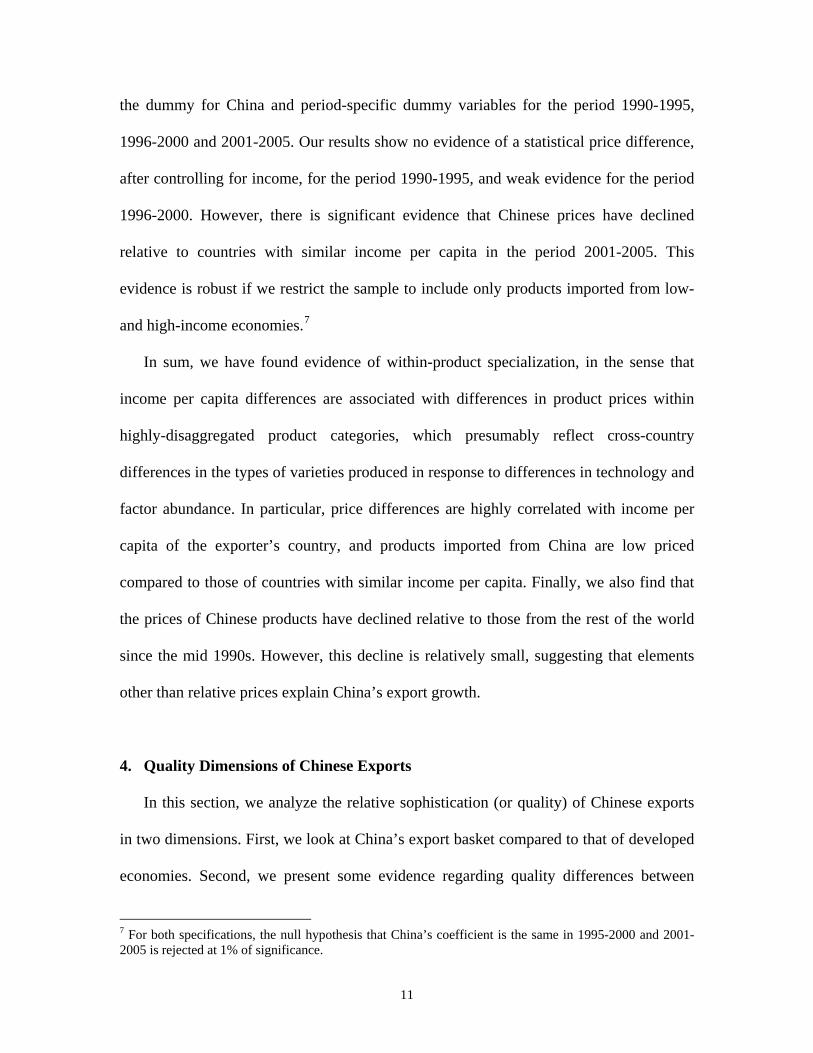
similarity with OECD countries among developing economies. In Figure 4, we show the
performance of China for the entire sample. With the exception of 2002, where it was
ranked 7th, China has been most of the time between the 5th and the 6th place of countries
with higher export similarity to OECD. This result corroborates Rodrik’s (2006) evidence
that China has a sophisticated export mix given its level of income per capita, because a
high share of its exports corresponds to products mainly exported by high-income
countries.
13
The evidence that China’s export similarity with OECD countries is one of the
highest among developing countries, and that the similarity has increased significantly in
the last 15 years, suggests some kind of increasing sophistication of Chinese exports.9
This can be understood as indirect evidence that the quality of Chinese varieties has
improved over time. This link is weak in several dimensions, however. On the one hand,
as discussed by Branstetter and Lardy (2006), the Chinese export mix does not take into
account that China imports high-value-added intermediate inputs, meaning that China
should be judged in terms of the value added of the export basket, which is highly
intensive in labor. Another issue is that the link between export sophistication and the
export similarity index with OECD countries implicitly assumes that products are
homogeneous. In other words, it assumes that varieties within each product category have
similar quality or price. For instance, if both China and Italy only export “pants”, the
exports similarity index will take the maximum value of one, and we will conclude that
Chinese exports are as sophisticated as Italian exports. However, as shown above, even
within narrowly defined products there are large differences in prices across countries.
Unless we take into account these price (and quality) differentials, the comparison of the
export similarity index may not be an adequate measure for export sophistication. In the
next subsection, we explore a more direct measure of product quality.
9 Claro (2007) presents a model where FDI liberalization in China generates a shift in the export structure toward labor-intensive products. In this context, exports are dominated by productivity-advanced foreign-owned firms rather than productivity-backward domestically-owned enterprises. Therefore, the increase in the willingness to pay for Chinese products relative to those from other countries may obey to an increase in the relative “sophistication” of exporting firms.
14
4.2 Estimation of Quality Differences
The results in last section illustrate how Chinese exports tend to be relatively
sophisticated in comparison with other developing countries’. This comes out from
comparing its export similarity to that of OECD countries. However, more specific
measures of sophistication are required to strengthen the hypothesis that elements other
than relative product prices explain China’s export growth. Yet it can be assumed that
product prices reflect product quality, and price differences also reflect several other
features.10 Product quality is unobservable, and we need some methodology for inferring
quality measures from trade statistics. Alvarez and Claro (2006a) develop a theoretical
model to distinguish the impact of prices and unobserved variety and quality on import
penetration. Under traditional assumptions of monopolistic competition in a three-region
setup (Chile, China and the rest of the world), they show that the ratio of consumption in
z (Chile) of some product variety imported from countries (China) and j c r (rest of
the world) can be expressed as:
jtjtzjtcjtjtzjtj
zjt ptX υταωαωαφαααα ++++⋅+⋅+⋅+= lnlnlnlnlnln 6543210 , (4)
where is the China/ROW ratio of imported quantities of product , is the
China/ROW relative price of product ,
jtX j jtp
j jtφ is relative size of China and the rest of the
world, cjtω and zjtω are relative factor prices between China and the rest of the world and
Chile and the rest of the world11, respectively, and jtτ are trade costs measured as
10 See Hallak and Schott (2005) for a discussion on how prices are an imperfect measure of product quality. 11 Relative size is measured as the PPP-adjusted GDP ratio and relative productivities as the PPP-adjusted per capita GDP ratio. Both variables are obtained from the World Development Indicators of the World Bank.
15
average nominal tariffs in Chile. The variable t is time trend resulting from the
assumption that relative exports quality is given by:
tjt
jojeq 1δδ += ,
where is the China/ROW quality ratio in product . The annual growth in the quality
ratio between imports from China and the rest of the world is recovered, after estimating
equation (4), as
jtq j
)1/( 4211 ++−= αααδ .
Table 5 reports results for the exports quality growth obtained by Alvarez and Claro
(2006a). Under different specifications, they find that relative export quality growth of
Chinese products is positive and statistically significant. Moreover, the point estimate is
very similar for each specification. In Panel A, results refer to GDP and income variables
measured for all importers at 8-digit products and Panel B corresponds to these variables
measured for all importers at 2-digit products.12 For both cases, the model is estimated
with and without tariffs. The results show that the annualized rate of growth of the quality
ratio is between 9.8 and 11.5 percent.
Alvarez and Claro (2006a) explore the causes of cross-product differences in quantity
penetration, estimating differences in the rate of growth of the quality ratio across
products depending on their degree of differentiation. If quality growth matters for the
growing importance of China, we should observe that an increase in quality is more
relevant for products in which product differentiation is more important. In the case of
homogeneous products, we should not expect significant differences in price and quality
12 This is, the relevant rest of the world may be assumed to be all exporters of the same product (8-digit HS) or to some lower level of aggregation (2-digit HS).
16
at very detailed product classifications. In such a case, perfect competition would imply
that a country imports only from the cheapest source.
We show here the estimates of quality growth for different product groups according
to the classification provided by Rauch (1999). Table 6 presents the average rate of
quality growth for differentiated goods, reference priced goods and homogeneous goods.
There is strong evidence that quality growth is much higher for differentiated products
than for reference priced and homogeneous products. Note, for example, in column (1),
that the annual rate of growth of the quality of Chinese varieties relative to the rest of the
world is 11.2% (12.9%) for differentiated products, and only 4.8% (4.8%) and 2.8%
(4.3%) for reference priced and homogeneous products, respectively.13
The bottom part of Table 6 reports tests for the equality of quality growth across these
three groups of products. In general, the null hypotheses that quality growth is the same
for differentiated and reference priced products can be rejected for all the cases analyzed.
The same is true for the test of equality of growth between differentiated and
homogenous products. In sum, the evidence seems to favor the idea that the quality of
Chinese exports has grown more rapidly in more differentiated products. Interestingly,
these products are those with a deepest fall in the relative price of Chinese varieties (see
Alvarez and Claro, 2006a), revealing that the fall in prices is associated with an increase
in quality. The first culprit for this association is productivity growth: a high rate of
growth of productivity in differentiated products may explain an increase in their quality
together with a fall in their price. This process coincides with the increasing dominant
position of productivity-advanced foreign firms in China’s exports. A formal test of this
13 The results are similar, albeit somewhat weaker, when products are differentiated according to the elasticity of substitution across varieties within each product computed by Broda and Weinstein (2006).
17
link is far beyond the scope of this paper, but we think it constitutes a very important
avenue for future research.
5. Conclusions
The impact of Chinese competition is commonly thought to be transmitted through
prices. In particular, based upon traditional endowment-based trade theory, the main
impact of China’s competition is expected to be associated with a fall in the relative price
of labor-intensive products and high penetration in labor-intensive sectors. Although
there is some evidence supporting this view, we find that a large part of the action takes
place within sectors. The literature has provided strong evidence that there is also
differentiation within products, which presumably reflects factor endowment and
technological differences. As expected, rich countries export high-priced products while
poor countries export low-priced products.
In this context, this paper analyzes the sources of China’s export growth. Using
highly-disaggregated data on Chilean imports between 1990 and 2005, we first show that
China’s strong export penetration relative to other countries is mainly explained by an
increase in the intensive margin, that is, an increase in the volume of exports in product
categories that are also exported by other countries. Surprisingly, the main source of
growth in the intensive margin is explained by an increase in exported quantities, without
a significant fall in the relative price of Chinese products. One explanation for this
apparent paradox is an increase in the willingness to pay for—quality of—Chinese
products relative to the rest of the world. The paper provides detailed evidence showing
that the fall in Chinese prices is relatively small to explain the huge increase in export
18
quantities. We also show direct and indirect evidence of growing sophistication of
China’s export mix. In particular, we show that exports from China have increased their
similarity with exports from rich countries, and we also show that the quality of Chinese
exports has improved over time. This is consistent with the idea that product quality is an
important dimension of Chinese export growth.
19
References
Álvarez, R. and S. Claro (2007) “David versus Goliath: The Impact of Chinese
Competition of Developing Countries,” manuscript, Central Bank of Chile and
Pontificia Universidad Católica de Chile.
______________________ (2006a) “The China Phenomenon: Price, Quality or
Variety?” Working Paper No. 411, Central Bank of Chile
____________________ (2006b) “The China Price: Evidence and Some
Implications,” Estudios de Economía 33(2):117-39.
Bernard, A.B., Jensen, J.B. and P.K. Schott (2006) “Survival of the Best Fit:
Exposure to Low-Wage Countries and the (Uneven) Growth of U.S.
Manufacturing Plants,” Journal of International Economics, 68(1): 219-37.
Blázquez-Lidoy, J., Rodríguez, J. and J. Santiso (2006). “Angel or Devil? China’s
Trade Impact on Latin American Emerging Markets,” OECD Development
Centre Working Paper No. 252, June.
Branstetter, L. and N. Lardy (2006) “China’s Embrace of Globalization,” NBER
Working Paper 12373.
Broda, C. and D. Weinstein (2006) “Globalization and the Gains from Varieties,”
Quarterly Journal of Economics 121(2):541-85.
Castro, L., Olarreaga, M. and D. Saslavsky (2007) “The Impact of Trade with China
and India on Argentina's Manufacturing Employment,” World Bank Policy
Research Working Paper No. 4153.
20
Claro, S. (2007) “FDI Liberalization as a Source of Comparative Advantage in
China,” manuscript, Instituto de Economía, Pontificia Universidad Católica de
Chile.
Devlin, R., Estevadeordal, A. and A. Rodríguez (2006) The Emergence of China:
Opportunities and Challenges for Latin America and the Caribbean. David
Rockefeller Center for Latin American Studies and Inter-American Development
Bank.
Eichengreen, B., Rhee, Y. and H. Tong (2004) “The Impact of China on the Exports
of Other Asian Countries,” NBER Working Paper No. 10768, September.
Feenstra, R. (1994) “New Product Varieties and the Measurement of International
Prices,” American Economic Review 84(1):157-77.
Finger, J.M. and M.E. Kreinin (1979) “A Measure of ‘Export Similarity’ and Its
Possible Uses,” Economic Journal 89:905-912.
Hallak, J.C. and P.K. Schott (2005) “Estimating Cross-country Differences in Product
Quality,” manuscript, Yale School of Management.
Harrigan, J. (1997) “Technology, Factor Supplies, and International Specialization:
Estimating the Neoclassical Model,” American Economic Review 87(4): 475–94.
Hummels, D. and P. Klenow (2005) “The Variety and Quality of a Nation’s Exports,”
American Economic Review 95:704-23.
Leamer, E.E. (1987) “Paths of Development in the Three- Factor, n-Good General
Equilibrium Model,” Journal of Political Economy 95(5): 961–99.
____________(1995). The Heckscher-Ohlin Model in Theory and Practice. Princeton
Studies in International Finance 77.
21
López Córdova, E., Micco, A. and D. Molina. (2006) “Competing with the Dragon:
Latin America and Chinese Exports to the U.S. Market,” manuscript, Inter-
American Development Bank.
________________ (2005) “How Sensitive are Latin American Exports to Chinese
Competition in the U.S. Markets,” manuscript, Inter-American Development
Bank.
Nicita, A. and M. Olarreaga. (2006) “Trade, Production and Protection 1976-2004,”
World Bank Economic Review 21(1): 165-71.
Rauch, J. (1999) “Networks versus Markets in International Trade,” Journal of
International Economics 48(1): 7-35.
Rodrik, D. (2006) “What’s So Special about China’s Exports?,” Working Paper 06-
001, John Kennedy School of Government, Harvard University.
Schott, P.K. (2006) “The Relative Sophistication of Chinese Exports,” NBER
Working Paper No. 12173, August.
__________ (2004) “Across-Product versus Within-Product Specialization in
International Trade,” Quarterly Journal of Economics 119(2): 647-78.
__________ (2003) “One Size Fits All? Heckscher-Ohlin Specialization in Global
Production,” American Economic Review, XCII: 686-708.
22
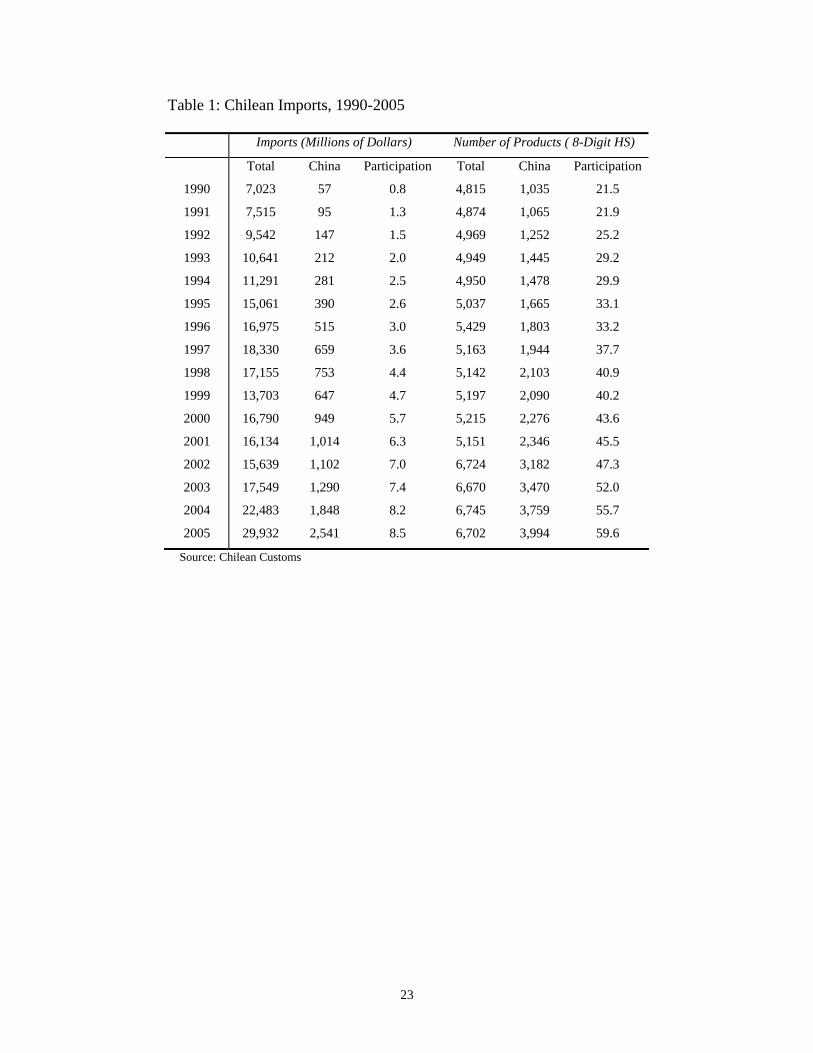
Table 1: Chilean Imports, 1990-2005
Imports (Millions of Dollars) Number of Products ( 8-Digit HS)
Total China Participation Total China Participation
1990 7,023 57 0.8 4,815 1,035 21.5
1991 7,515 95 1.3 4,874 1,065 21.9
1992 9,542 147 1.5 4,969 1,252 25.2
1993 10,641 212 2.0 4,949 1,445 29.2
1994 11,291 281 2.5 4,950 1,478 29.9
1995 15,061 390 2.6 5,037 1,665 33.1
1996 16,975 515 3.0 5,429 1,803 33.2
1997 18,330 659 3.6 5,163 1,944 37.7
1998 17,155 753 4.4 5,142 2,103 40.9
1999 13,703 647 4.7 5,197 2,090 40.2
2000 16,790 949 5.7 5,215 2,276 43.6
2001 16,134 1,014 6.3 5,151 2,346 45.5
2002 15,639 1,102 7.0 6,724 3,182 47.3
2003 17,549 1,290 7.4 6,670 3,470 52.0
2004 22,483 1,848 8.2 6,745 3,759 55.7
2005 29,932 2,541 8.5 6,702 3,994 59.6
Source: Chilean Customs
23
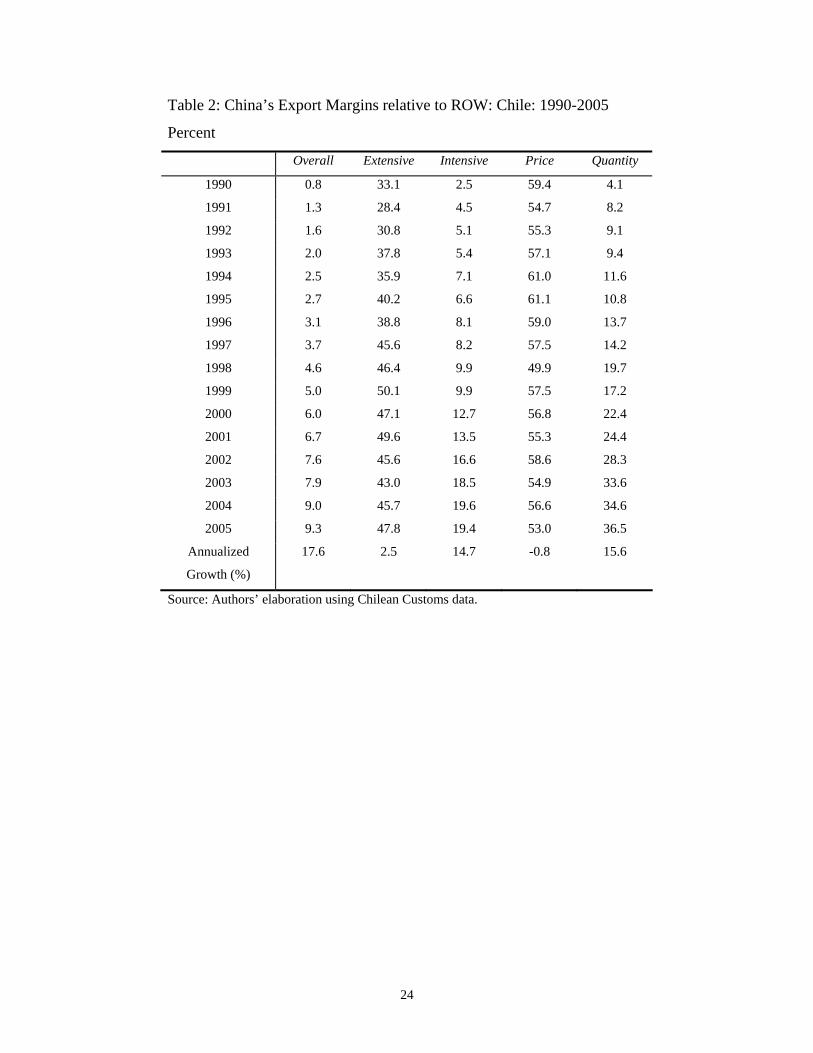
Table 2: China’s Export Margins relative to ROW: Chile: 1990-2005
Percent
Overall Extensive Intensive Price Quantity
1990 0.8 33.1 2.5 59.4 4.1
1991 1.3 28.4 4.5 54.7 8.2
1992 1.6 30.8 5.1 55.3 9.1
1993 2.0 37.8 5.4 57.1 9.4
1994 2.5 35.9 7.1 61.0 11.6
1995 2.7 40.2 6.6 61.1 10.8
1996 3.1 38.8 8.1 59.0 13.7
1997 3.7 45.6 8.2 57.5 14.2
1998 4.6 46.4 9.9 49.9 19.7
1999 5.0 50.1 9.9 57.5 17.2
2000 6.0 47.1 12.7 56.8 22.4
2001 6.7 49.6 13.5 55.3 24.4
2002 7.6 45.6 16.6 58.6 28.3
2003 7.9 43.0 18.5 54.9 33.6
2004 9.0 45.7 19.6 56.6 34.6
2005 9.3 47.8 19.4 53.0 36.5
Annualized
Growth (%)
17.6 2.5 14.7 -0.8 15.6
Source: Authors’ elaboration using Chilean Customs data.
24
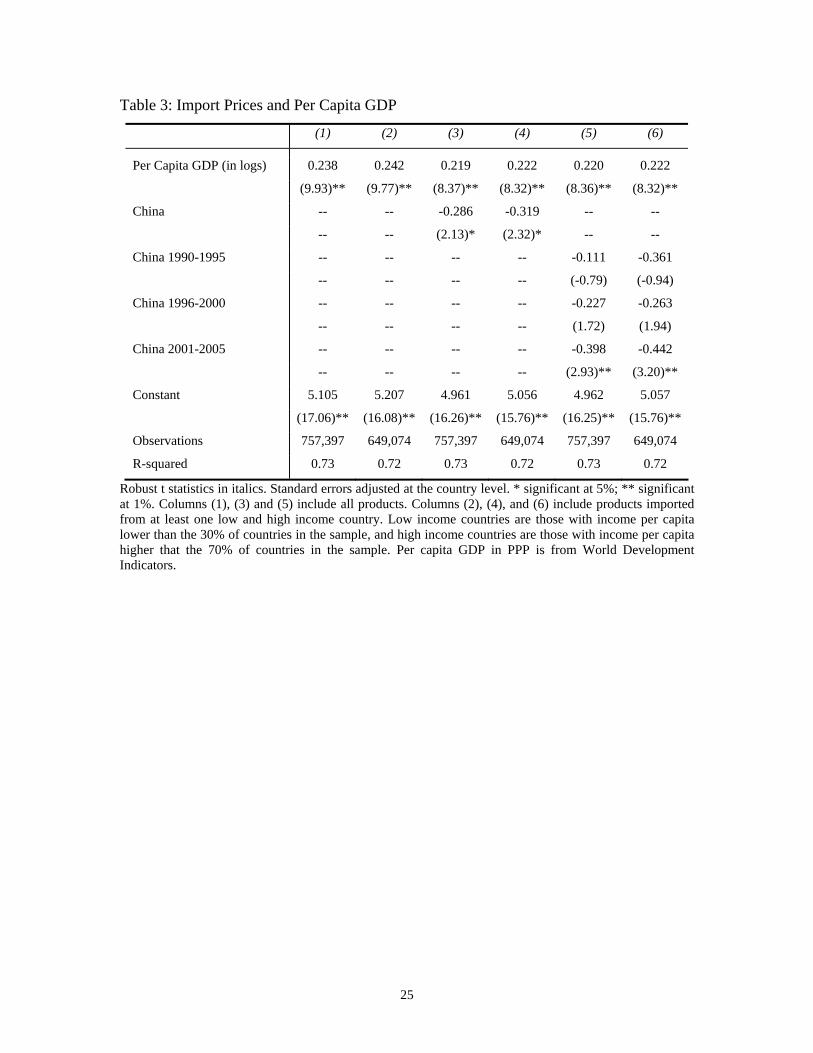
Table 3: Import Prices and Per Capita GDP
(1) (2) (3) (4) (5) (6)
Per Capita GDP (in logs) 0.238 0.242 0.219 0.222 0.220 0.222
(9.93)** (9.77)** (8.37)** (8.32)** (8.36)** (8.32)**
China -- -- -0.286 -0.319 -- --
-- -- (2.13)* (2.32)* -- --
China 1990-1995 -- -- -- -- -0.111 -0.361
-- -- -- -- (-0.79) (-0.94)
China 1996-2000 -- -- -- -- -0.227 -0.263
-- -- -- -- (1.72) (1.94)
China 2001-2005 -- -- -- -- -0.398 -0.442
-- -- -- -- (2.93)** (3.20)**
Constant 5.105 5.207 4.961 5.056 4.962 5.057
(17.06)** (16.08)** (16.26)** (15.76)** (16.25)** (15.76)**
Observations 757,397 649,074 757,397 649,074 757,397 649,074
R-squared 0.73 0.72 0.73 0.72 0.73 0.72
Robust t statistics in italics. Standard errors adjusted at the country level. * significant at 5%; ** significant at 1%. Columns (1), (3) and (5) include all products. Columns (2), (4), and (6) include products imported from at least one low and high income country. Low income countries are those with income per capita lower than the 30% of countries in the sample, and high income countries are those with income per capita higher that the 70% of countries in the sample. Per capita GDP in PPP is from World Development Indicators.
25

Table 4: Countries with the Highest Export Similarity to OECD Exports in Chile
Country 1990 Country 2005
Brazil 0.602 South Korea 0.700
Taiwan 0.540 Brazil 0.568
Mexico 0.467 Taiwan 0.544
Argentina 0.398 Mexico 0.484
China 0.388 China 0.434
South Korea 0.370 Colombia 0.384
Indonesia 0.368 Uruguay 0.382
Panama 0.240 India 0.360
Peru 0.224 Singapore 0.353
Colombia 0.215 Thailand 0.343
Uruguay 0.176 Argentina 0.276
Singapore 0.162 Panama 0.242
Thailand 0.151 Malaysia 0.230
India 0.118 Indonesia 0.227
Venezuela 0.118 Venezuela 0.225
Malaysia 0.114 Costa Rica 0.216
Trinidad and Tobago 0.109 Philippines 0.199
Philippines 0.095 Peru 0.078
Guatemala 0.084 Vietnam 0.070
Jamaica 0.073 Bolivia 0.062
Source: Authors’ elaboration using Chilean Customs data.
26
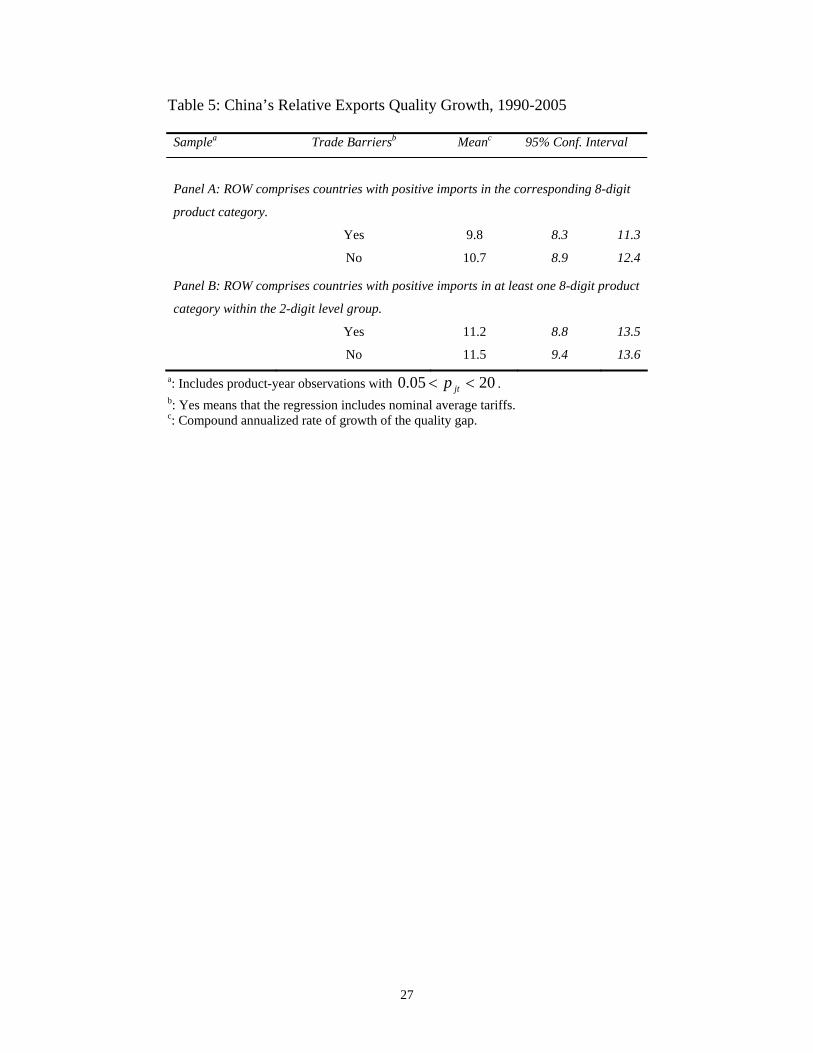
Table 5: China’s Relative Exports Quality Growth, 1990-2005
Samplea Trade Barriersb Meanc 95% Conf. Interval
Panel A: ROW comprises countries with positive imports in the corresponding 8-digit
product category.
Yes 9.8 8.3 11.3
No 10.7 8.9 12.4
Panel B: ROW comprises countries with positive imports in at least one 8-digit product
category within the 2-digit level group.
Yes 11.2 8.8 13.5
No 11.5 9.4 13.6
a: Includes product-year observations with 2005.0 <jtp . <b: Yes means that the regression includes nominal average tariffs. c: Compound annualized rate of growth of the quality gap.
27
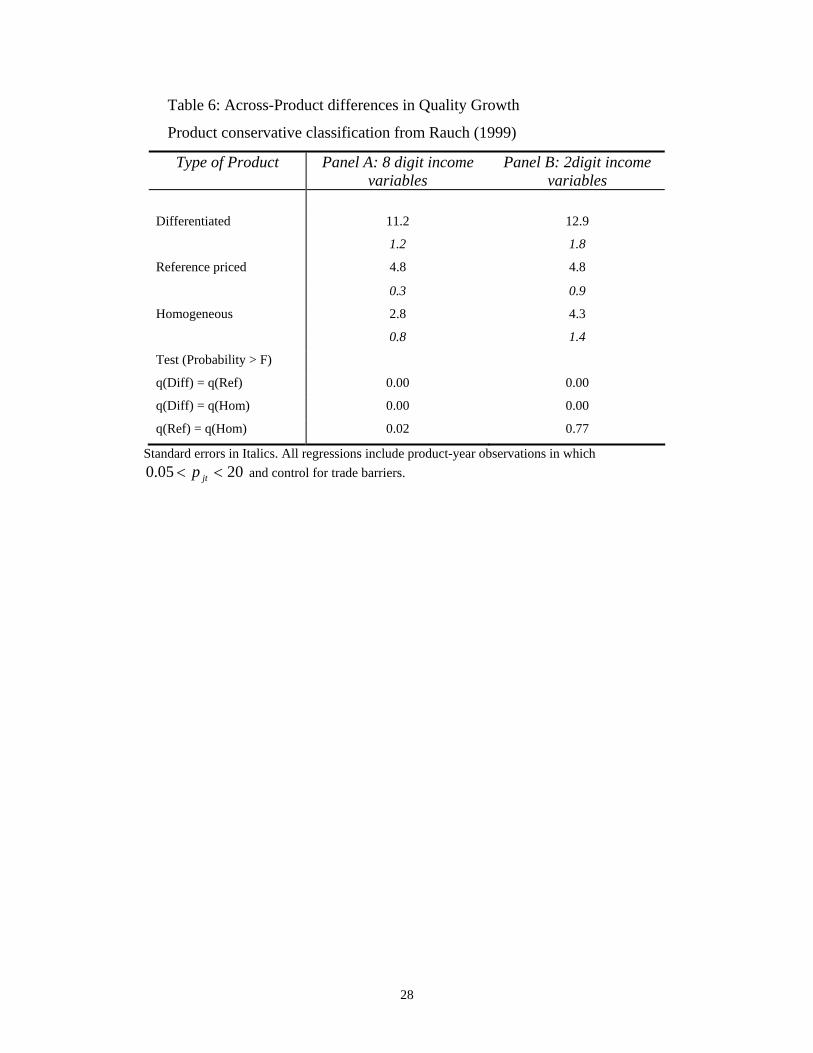
Table 6: Across-Product differences in Quality Growth
Product conservative classification from Rauch (1999)
Type of Product Panel A: 8 digit income variables
Panel B: 2digit income variables
Differentiated 11.2 12.9 1.2 1.8
Reference priced 4.8 4.8 0.3 0.9
Homogeneous 2.8 4.3 0.8 1.4
Test (Probability > F)
q(Diff) = q(Ref) 0.00 0.00
q(Diff) = q(Hom) 0.00 0.00
q(Ref) = q(Hom) 0.02 0.77
Standard errors in Italics. All regressions include product-year observations in which and control for trade barriers. 2005.0 << jtp
28
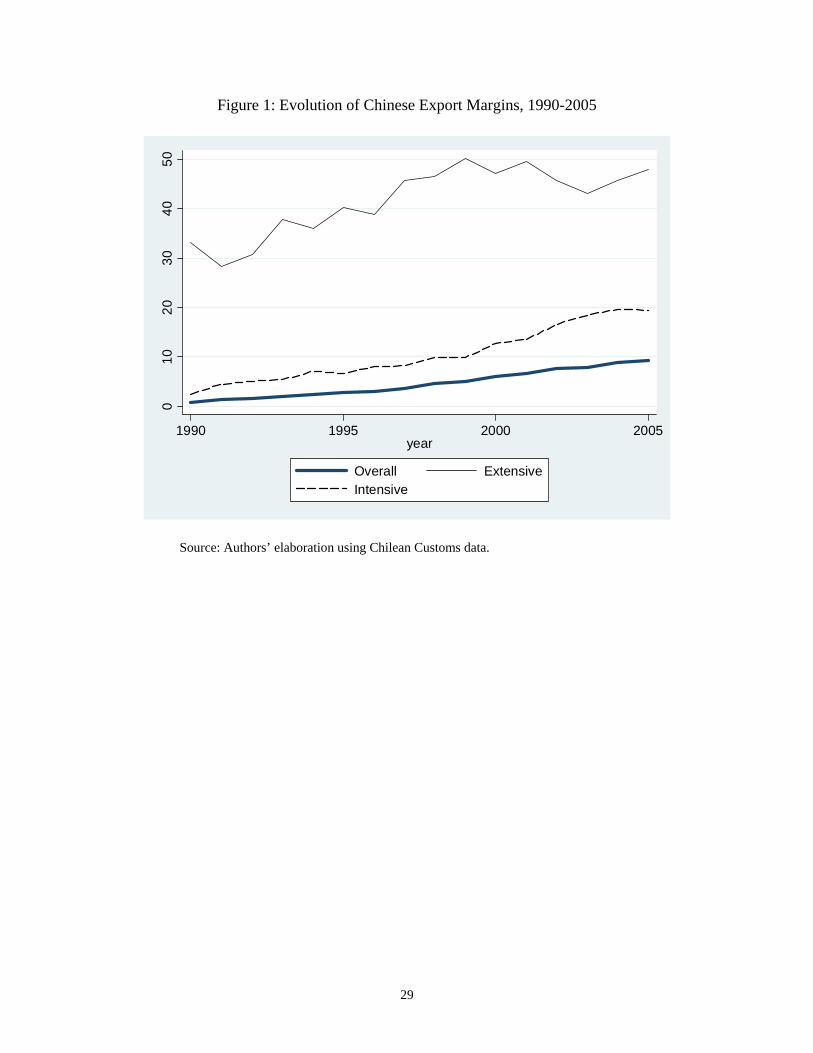
Figure 1: Evolution of Chinese Export Margins, 1990-2005
010
2030
4050
1990 1995 2000 2005year
Overall ExtensiveIntensive
Source: Authors’ elaboration using Chilean Customs data.
29
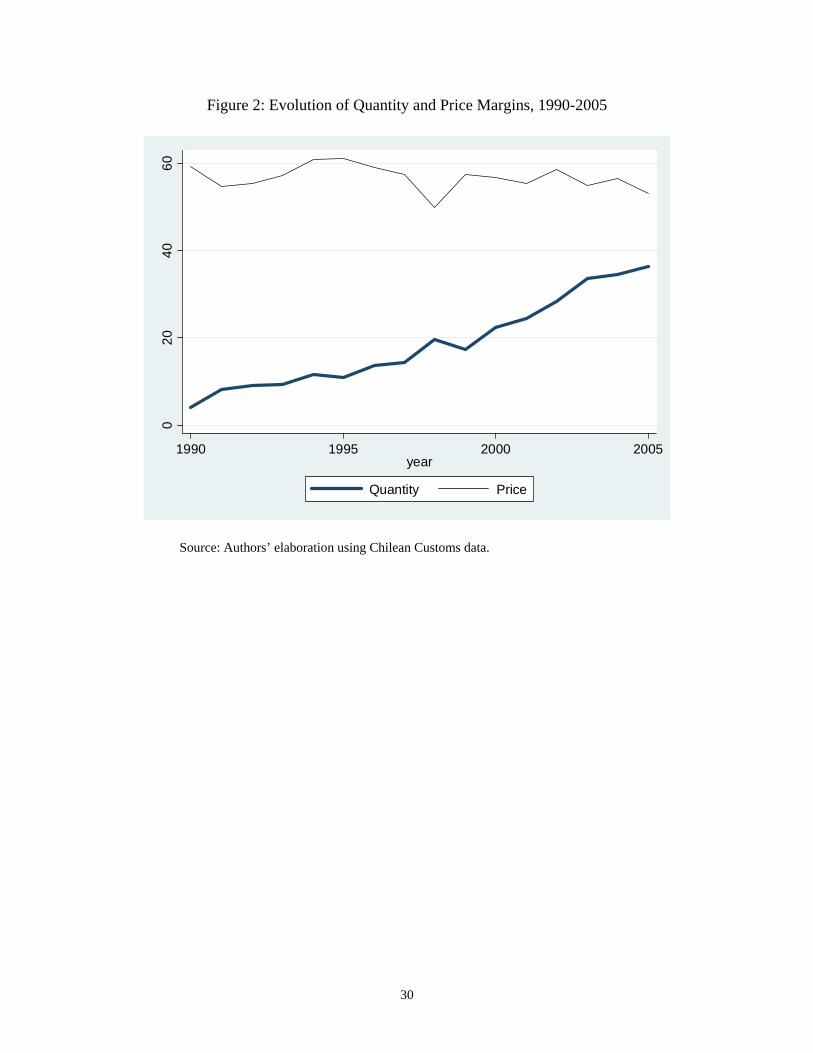
Figure 2: Evolution of Quantity and Price Margins, 1990-2005
020
4060
1990 1995 2000 2005year
Quantity Price
Source: Authors’ elaboration using Chilean Customs data.
30
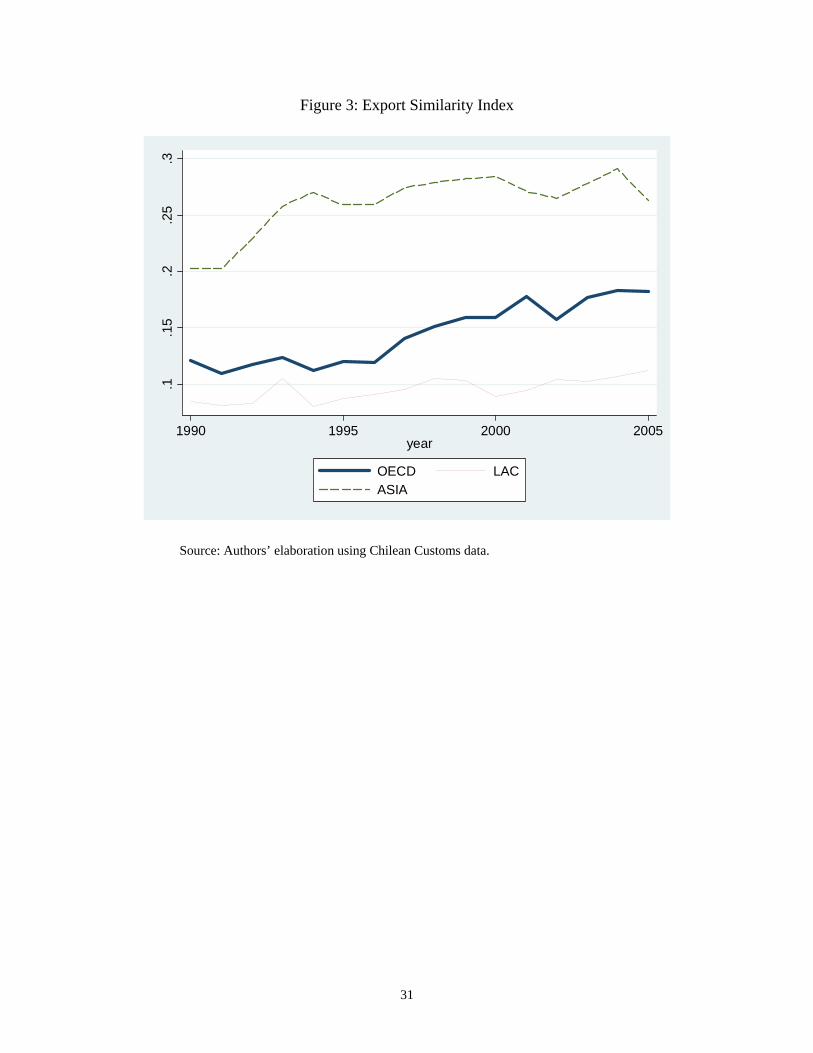
Figure 3: Export Similarity Index
.1.1
5.2
.25
.3
1990 1995 2000 2005year
OECD LACASIA
Source: Authors’ elaboration using Chilean Customs data.
31
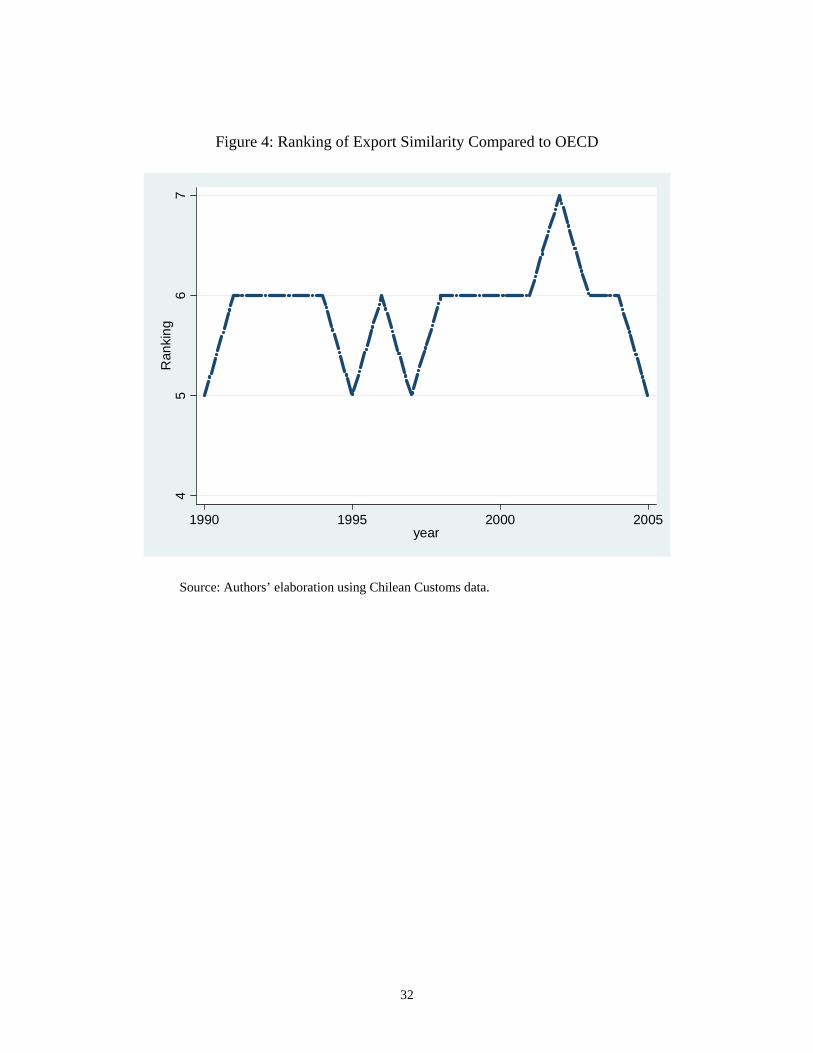
Figure 4: Ranking of Export Similarity Compared to OECD
45
67
Ran
king
1990 1995 2000 2005year
Source: Authors’ elaboration using Chilean Customs data.
32
Documentos de Trabajo Banco Central de Chile
Working Papers Central Bank of Chile
NÚMEROS ANTERIORES PAST ISSUES
La serie de Documentos de Trabajo en versión PDF puede obtenerse gratis en la dirección electrónica: www.bcentral.cl/esp/estpub/estudios/dtbc. Existe la posibilidad de solicitar una copia impresa con un costo de $500 si es dentro de Chile y US$12 si es para fuera de Chile. Las solicitudes se pueden hacer por fax: (56-2) 6702231 o a través de correo electrónico: [email protected].
Working Papers in PDF format can be downloaded free of charge from: www.bcentral.cl/eng/stdpub/studies/workingpaper. Printed versions can be ordered individually for US$12 per copy (for orders inside Chile the charge is Ch$500.) Orders can be placed by fax: (56-2) 6702231 or e-mail: [email protected]. DTBC-425 Tipo de Cambio Nominal Chileno: Predicción en Base a Análisis Técnico Ana María Abarca, Felipe Alarcón, Pablo Pincheira y Jorge Selaive
Agosto 2007
DTBC-424 China, Precios de Commodities y Desempeño de América Latina: Algunos Hechos Estilizados Sergio Lehmann, David Moreno y Patricio Jaramillo
Agosto 2007
DTBC-423 Financial Diversification, Sudden Stops And Sudden Starts Kevin Cowan, José De Gregorio, Alejandro Micco y Christopher Neilson
Julio 2007
DTBC-422 Welfare Implications of a Second Lender in the International Markets Luis Opazo
Julio 2007
DTBC-421 Inflation Compensation and Inflation Expectations in Chile Mauricio Larraín
Junio 2007
DTBC-420 Intermediate Goods, Institutions and Output Per Worker Kevin Cowan y Alejandro Neut
Junio 2007
DTBC-419 Measuring TFP: A Latent Variable Approach Rodrigo Fuentes y Marco Morales
Junio 2007
DTBC-418 Export Transitions Roberto Álvarez
Mayo 2007
DTBC-417 Another Pass-Through Bites the Dust? Oil Prices and Inflation José De Gregorio, Oscar Landerretche y Christopher Neilson
Mayo 2007
DTBC-416 Capital Regulation and Bank Risk Taking: Completing Blum’s Picture Nancy Silva
Marzo 2007
DTBC-415 Defining Inflation Targets, the Policy Horizon and the Output-Inflation Tradeoff José De Gregorio
Marzo 2007
DTBC-414 Índices Podados como Medidas de Tendencia para el Imacec Fabián Gredig
Marzo 2007
DTBC-413 Impacto Inflacionario de un Shock de Precios del Petróleo: Análisis Comparativo entre Chile y Países Industriales Pablo Pincheira y Álvaro García
Marzo 2007
DTBC-412 Multinationals as Stabilizers?: Economic Crisis and Plant Employment Growth Roberto Álvarez y Holger Görg
Marzo 2007
DTBC-411 The China Phenomenon: Price, Quality or Variety? Roberto Álvarez y Sebastián Claro
Diciembre 2006
DTBC-410 Optimal Inflation Stabilization in a Medium-Scale Macroeconomic Model Stephanie Schmitt-Grohé y Martín Uribe
Diciembre 2006