Embed Size (px)
Citation preview
Financial Stability Report
Nov
emb
er 2
014
2 2014
Financial Stability Report
Number 2 / 2014 November
© Banca d’Italia, 2014For the hard copy version: registration with the Court of Rome No. 209, 13 May 2010For the electronic version: registration with the Court of Rome No. 212, 13 May 2010
DirectorEugenio Gaiotti
Editorial committeeGiorgio Gobbi (coordinator), Giorgio Albareto, Martina Bignami, Paolo Bisio, Alessio De Vincenzo, Antonio Di Cesare, Giovanni di Iasio, Paolo Finaldi Russo, Roberta Fiori, Antonella Foglia, Andrea Generale, Igino Guida, Aviram Levy, Gaetano Marseglia, Giancarlo Mazzoni, Stefano Neri, Fausto Parente (Ivass), Marcello Pericoli, Matteo Piazza, Mario Pietrunti, Massimo Sbracia, Silvia Vori, Francesco Zollino
BoxesPiergiorgio Alessandri, Emilia Bonaccorsi di Patti, Marianna Caccavaio, Laura Cerami, Alberto Coco, Giuseppe Della Corte, Alessio D’Ignazio, Marzia Gentili, Silvana Stefania Grande, Giovanni Guazzarotti, Eleonora Iachini, Sergio Longoni, Francesco Marino, Valentina Michelangeli, Giacinto Micucci, Valentina Nigro, Stefano Pasqualini (Ivass), Alessandro Picone, Luigi Russo
Rita Anselmi, Valentina Memoli and Silvia Mussolin (editorial assistants for the Italian version) Giuseppe Casubolo and Roberto Marano (charts and figures)
The English edition has been translated from the Italian by the Secretariat to the Governing Board.
AddressVia Nazionale 91, 00184 Rome - Italy
Telephone+39 0647921
Websitehttp://www.bancaditalia.it
All rights reserved. Reproduction for scholarly and non-commercial use permitted, on condition that the source is cited.
ISSN 2280-7616 (stampa) ISSN 2280-7624 (online)
Based on data available on 31 October 2014, unless otherwise indicated.Printed by the Printing and Publishing Division of the Bank of Italy, Rome, November 2014.
Other economic publications of the Bank of Italy:
Annual ReportAccount of the main developments in the Italian and world economy during the year
Economic BulletinA quarterly report on developments in the Italian and world economy
Economic developments in the Italian regionsA series of reports on the regional economies
Temi di discussione (Working Papers)A series of empirical and theoretical papers
Questioni di economia e finanza (Occasional Papers) Miscellaneous studies of issues of special relevance to the Bank of Italy
New research at the Bank of ItalyA newsletter on recent research work and conferences
Quaderni di Storia Economica (Economic History Working Papers) A series of papers on Italian economic history
These publications are available online at www.bancaditalia.it and in hard copy from the Bank of Italy’s library (Biblioteca, Via Nazionale 91, 00184 Rome, Italy) and at the branches of the Bank.

CONTENTS
OVERVIEW 5
1 MACROECONOMIC RISKS AND INTERNATIONAL MARKETS 7
1.1 The macroeconomic and financial context 7
1.2 The main risks for financial stability 11
1.3 The real estate markets 14
2 THE FINANCIAL CONDITION OF HOUSEHOLDS AND FIRMS 17
2.1 Households 17
2.2 Firms 19
3 THE BANKING AND FINANCIAL SYSTEM 24
3.1 The ECB’s comprehensive assessment of the leading euro-area banks’ balance sheets 24
3.2 Credit 32
3.3 Refinancing risk and liquidity risk 37
3.4 Interest rate risk and market risk 39
3.5 Banks’ capital and profitability 41
3.6 Insurance companies 42
4 THE MARKETS AND EUROSYSTEM REFINANCING 46
4.1 The liquidity market 46
4.2 Eurosystem refinancing 48
4.3 The government securities market 52
SYMBOLS AND CONVENTIONS
Unless indicated otherwise, figures have been computed by the Bank of Italy.
In the following tables:
– the phenomenon in question does not occur
.... the phenomenon occurs but its value is not known
.. the value is known but is nil or less than half the final digit shown
:: the value is not statistically significant
() provisional
BOXES
The risks of low inflation for financial stability in the euro area 12
The effects of the stagnation of income on the vulnerability of indebted households 18
New issuers of bonds, 2002-13 21
Leverage and bad debts of firms 22
The valutation of real estate collateral in the AQR 28
The initial impact of the stress tests on banks’ shares and CDS spreads 31
Interest rate risk and net interest income in the comprehensive assessment 40
The new rules on lending to firms by non-bank intermediaries 44
Liquidity developments following the monetary policy decisions of June 2014 49
The measures to promote the use of bank loans as collateral for eurosystem credit operations 51
Developments in market making and the resilience of the MTS market 54
BANCA D’ITALIA Financial Stability Report No. 2 / 2014 5
In the euro area the risks for financial stability that stem from slackening growth and persistently low inflation are increasing. Continuing
stagnation would have repercussions on the financial system and on the public finances. Excessively low inflation makes reducing the weight of public and private debt more difficult and implies a tightening of monetary conditions, with adverse effects on consumption and investment.
The growth prospects for the euro area are rendered more uncertain by the fragility and unevenness of
the world economic recovery. The financial markets appear to be exposed to spikes in volatility, like that in the middle of October due to the exacerbation of fears about the political and financial situation in Greece.
The sharp rise in property prices in some European countries has led their macroprudential autho- rities to activate or an-
nounce measures to curb the potential risks for financial stability. In Italy the property market remains weak, in line with conditions in the economy as a whole.
The cyclical deterioration and the need to avoid undercutting the modest
recovery in domestic demand have led the Italian Government to make the adjustment of the public finances more gradual. The sustainability of the debt will be fostered by the performance of the main expenditure items, whose growth will continue to be modest. The speed of the reduction in the ratio of public debt to GDP will depend above all on the pace of nominal GDP growth.
In the first seven months of the year foreign investment in Italian financial assets
continued to be substantial. The Bank of Italy’s debtor position in TARGET2 improved; it subsequently increased, in part for technical reasons, such as the issuance policy of the Treasury, which elected not to roll over all its maturing securities in view of its already ample liquidity.
With growth in incomes weak, the modest upturn in household consumption corresponded to a decline
in saving. Households’ financial wealth increased as a result of a rise in the prices of the securities held. Low interest rates helped to limit the vulnerability of indebted households. According to our estimates, the share of financially vulnerable households would increase only marginally even in the case of severe macroeconomic shocks and interest rate increases.
The main risk factor for firms is a protraction of weak economic activity. A gradual financial restruc-
turing is under way, with a reduction in debt and increased recourse to the bond and equity markets. Leverage is diminishing. In addition, signs of strengthening economic conditions have emerged among larger and more export-oriented firms. Small firms, which on average are less capitalized, remain more exposed to cyclical risks and problems in accessing credit.
The results of the compre- hensive assessment of the balance sheets of the main euro-area banks were pub- lished on 26 October, in preparation for the launch of the Single Supervisory Mechanism. For Banca
Increasing risks for financial stability stem from weak growth and low inflation …
… and there have been increases in market volatility
In Italy the property market remains weak, in line with economic conditions
The timetable for fiscal adjustment is revised
Inflows of private capital continue
The financial conditions of households are sound
The heterogeneity of firms’ financial conditions increases
The comprehensive assessment of banks’ balance sheets finds capital shortfalls at Banca Monte dei Paschi di Siena and Banca Carige …
OVERVIEW
Financial Stability Report No. 2 / 2014 BANCA D’ITALIA6
Monte dei Paschi di Siena and Banca Carige, the stress test found the need for additional capital amounting to €2.9 billion, equal to 0.2 per cent of Italy’s GDP. The two banks have already announced capital increases and have submitted recapitalization plans to the supervisory authorities.
The results demonstrate the fundamental resilience of banks’ balance sheets, not- withstanding the severe strains of recent years.
Over the summer, Italian banks’ liquidity conditions strengthened further, bene-
fiting from the improvement in the financial markets and the growth in deposits. In the wholesale funding markets, net bond issues remained positive, including those of medium-sized banks. The volume of immediately available eligible assets is increasing, despite the reduction in government-guaranteed bank bonds. The Bank of Italy has adopted new measures extending the range of bank loans eligible as collateral with the Eurosystem.
Lending has continued to diminish, if more slowly, reflecting the weakness of economic activity. Ac- cording to our projec-
tions, lending to non-financial corporations will continue to contract in 2015, although at a progressively decreasing rate, while the reduction in mortgage lending to households should come to a halt in the first quarter.
In the first half of 2014 the flow of new non-performing loans in rela- tion to performing loans
declined again. The decrease also involved new bad debts, above all those of firms. According to preliminary data, in recent months the flow of new bad debts has been stable.
The coverage ratio on non-performing exposures (loan loss provisions over gross non-performing exposures)
has risen. This could help banks to dispose of these loans and eliminate bad debts from their balance sheets. Some of the major banking groups have begun operations that should lead to the liquidation of substantial amounts of non-performing loans. The stock of these loans nevertheless remains large by international standards.
For Italian insurance companies, both risks engendered by the low level
of interest rates and liquidity risk are modest. The leading insurance groups intend to diversify their portfolios further by increasing their investment in private sector securities. The ongoing decline in policy surrenders, particularly of traditional life insurance products, has led insurers to reduce the most liquid asset components.
Liquidity conditions on the Italian financial mar- kets have remained good, notwithstanding the spike
in the volatility of the stock market and, to a lesser extent, the government securities market in the second half of October. Trading volumes have stayed high; the systemic indicator of liquidity risk remains low. The introduction of negative interest rates on Eurosystem deposits has not affected the orderly functioning of the money markets.
… but confirms the overall soundness of the Italian banking system
Banks’ liquidity strengthens
Economic uncertainty still impedes the recovery in credit to firms
The deterioration in credit quality slows further…
…and the coverage ratio on non-performing exposures improves
Risks for the insurance sector are limited
Italian markets remain liquid despite volatility
BANCA D’ITALIA Financial Stability Report No. 2 / 2014 7
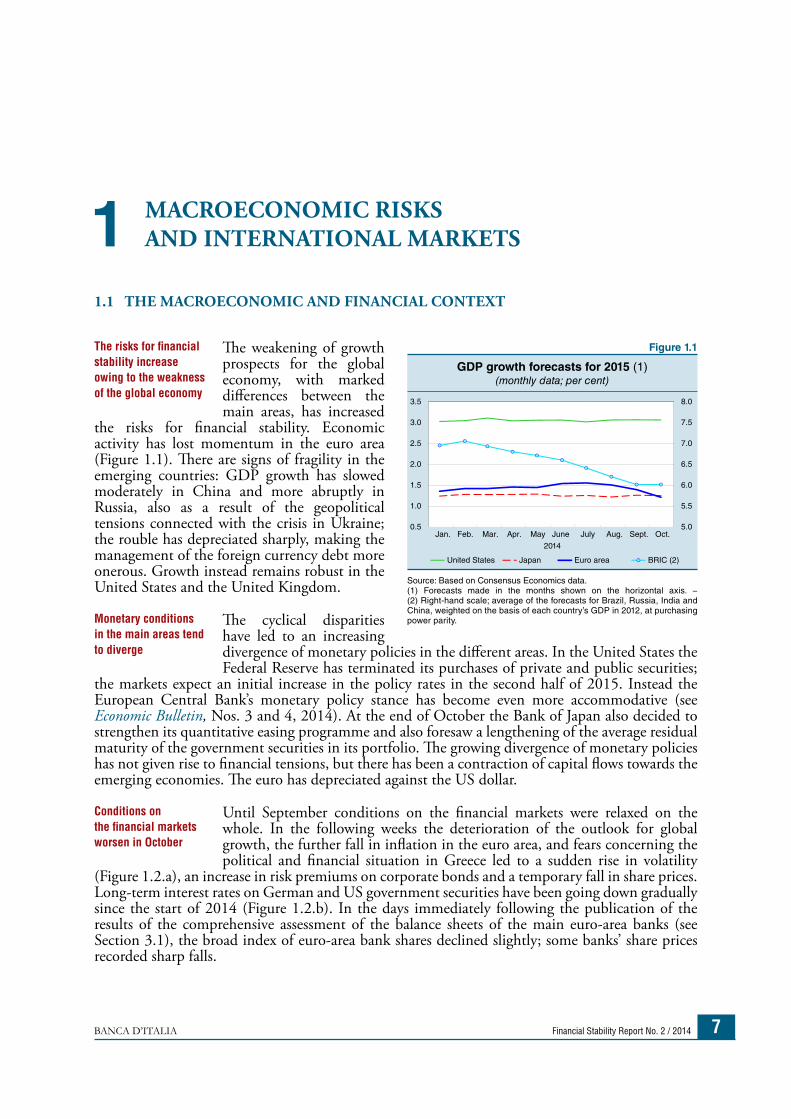
1.1 THE MACROECONOMIC AND FINANCIAL CONTEXT
The weakening of growth prospects for the global economy, with marked differences between the main areas, has increased
the risks for financial stability. Economic activity has lost momentum in the euro area (Figure 1.1). There are signs of fragility in the emerging countries: GDP growth has slowed moderately in China and more abruptly in Russia, also as a result of the geopolitical tensions connected with the crisis in Ukraine; the rouble has depreciated sharply, making the management of the foreign currency debt more onerous. Growth instead remains robust in the United States and the United Kingdom.
The cyclical disparities have led to an increasing divergence of monetary policies in the different areas. In the United States the Federal Reserve has terminated its purchases of private and public securities;
the markets expect an initial increase in the policy rates in the second half of 2015. Instead the European Central Bank’s monetary policy stance has become even more accommodative (see Economic Bulletin, Nos. 3 and 4, 2014). At the end of October the Bank of Japan also decided to strengthen its quantitative easing programme and also foresaw a lengthening of the average residual maturity of the government securities in its portfolio. The growing divergence of monetary policies has not given rise to financial tensions, but there has been a contraction of capital flows towards the emerging economies. The euro has depreciated against the US dollar.
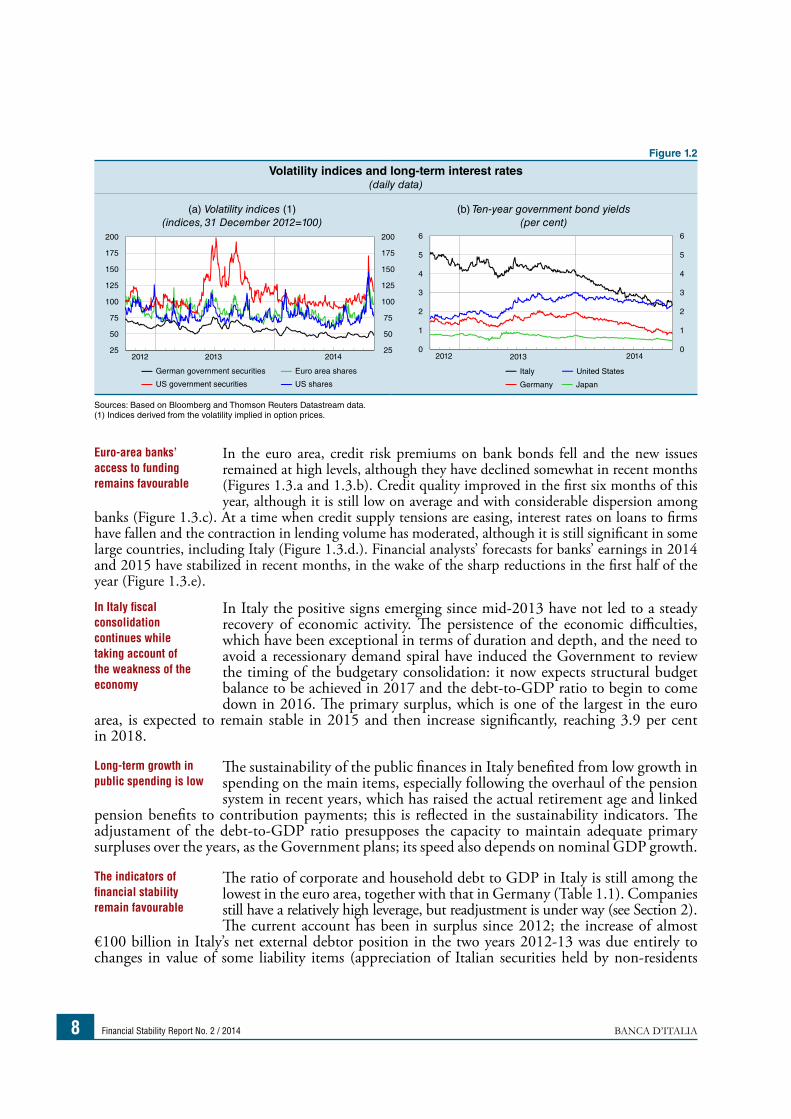
Until September conditions on the financial markets were relaxed on the whole. In the following weeks the deterioration of the outlook for global growth, the further fall in inflation in the euro area, and fears concerning the political and financial situation in Greece led to a sudden rise in volatility
(Figure 1.2.a), an increase in risk premiums on corporate bonds and a temporary fall in share prices. Long-term interest rates on German and US government securities have been going down gradually since the start of 2014 (Figure 1.2.b). In the days immediately following the publication of the results of the comprehensive assessment of the balance sheets of the main euro-area banks (see Section 3.1), the broad index of euro-area bank shares declined slightly; some banks’ share prices recorded sharp falls.
The risks for financial stability increase owing to the weakness of the global economy
Monetary conditions in the main areas tend to diverge
Conditions on the financial markets worsen in October
MACROECONOMIC RISKSAND INTERNATIONAL MARKETS1
Figure 1.1
GDP growth forecasts for 2015 (1)(monthly data; per cent)
Jan. Feb. Mar. Apr. May June July Aug. Sept. Oct.
2014
5.0
5.5
6.0
6.5
7.0
7.5
8.0
0.5
1.0
1.5
2.0
2.5
3.0
3.5
United States Japan Euro area BRIC (2)
Source: Based on Consensus Economics data.(1) Forecasts made in the months shown on the horizontal axis. − (2) Right-hand scale; average of the forecasts for Brazil, Russia, India and China, weighted on the basis of each country’s GDP in 2012, at purchasing power parity.
Financial Stability Report No. 2 / 2014 BANCA D’ITALIA8
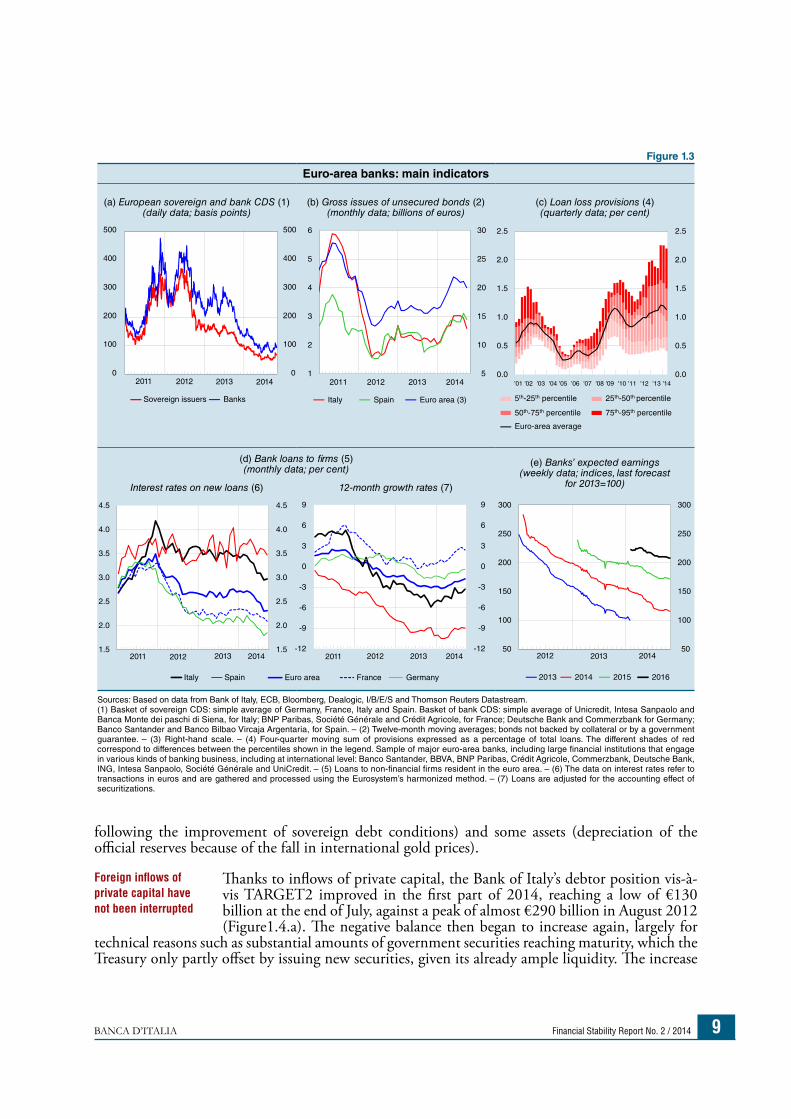
In the euro area, credit risk premiums on bank bonds fell and the new issues remained at high levels, although they have declined somewhat in recent months (Figures 1.3.a and 1.3.b). Credit quality improved in the first six months of this year, although it is still low on average and with considerable dispersion among
banks (Figure 1.3.c). At a time when credit supply tensions are easing, interest rates on loans to firms have fallen and the contraction in lending volume has moderated, although it is still significant in some large countries, including Italy (Figure 1.3.d.). Financial analysts’ forecasts for banks’ earnings in 2014 and 2015 have stabilized in recent months, in the wake of the sharp reductions in the first half of the year (Figure 1.3.e).
In Italy the positive signs emerging since mid-2013 have not led to a steady recovery of economic activity. The persistence of the economic difficulties, which have been exceptional in terms of duration and depth, and the need to avoid a recessionary demand spiral have induced the Government to review the timing of the budgetary consolidation: it now expects structural budget balance to be achieved in 2017 and the debt-to-GDP ratio to begin to come down in 2016. The primary surplus, which is one of the largest in the euro
area, is expected to remain stable in 2015 and then increase significantly, reaching 3.9 per cent in 2018.
The sustainability of the public finances in Italy benefited from low growth in spending on the main items, especially following the overhaul of the pension system in recent years, which has raised the actual retirement age and linked
pension benefits to contribution payments; this is reflected in the sustainability indicators. The adjustament of the debt-to-GDP ratio presupposes the capacity to maintain adequate primary surpluses over the years, as the Government plans; its speed also depends on nominal GDP growth.
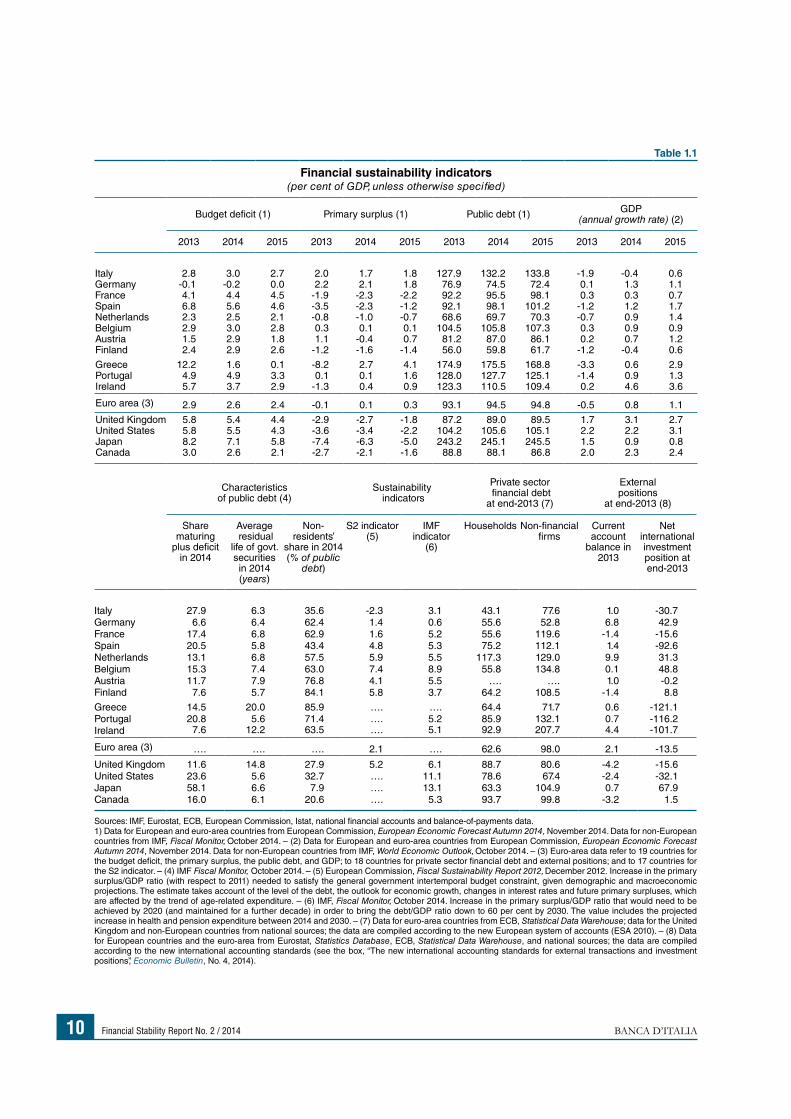
The ratio of corporate and household debt to GDP in Italy is still among the lowest in the euro area, together with that in Germany (Table 1.1). Companies still have a relatively high leverage, but readjustment is under way (see Section 2). The current account has been in surplus since 2012; the increase of almost
€100 billion in Italy’s net external debtor position in the two years 2012-13 was due entirely to changes in value of some liability items (appreciation of Italian securities held by non-residents
Euro-area banks’ access to funding remains favourable
In Italy fiscal consolidation continues while taking account of the weakness of the economy
Long-term growth in public spending is low
The indicators of financial stability remain favourable
Figure 1.2
Volatility indices and long-term interest rates(daily data)
(a) Volatility indices (1)(indices, 31 December 2012=100)
(b) Ten-year government bond yields(per cent)
Italy United States
Germany Japan
German government securities Euro area shares
US government securities US shares
2012 2013 20140
1
2
3
4
5
6
0
1
2
3
4
5
6
2012 2013 2014 25
50
75
100
125
150
175
200
25
50
75
100
125
150
175
200
Sources: Based on Bloomberg and Thomson Reuters Datastream data.(1) Indices derived from the volatility implied in option prices.
BANCA D’ITALIA Financial Stability Report No. 2 / 2014 9
following the improvement of sovereign debt conditions) and some assets (depreciation of the official reserves because of the fall in international gold prices).
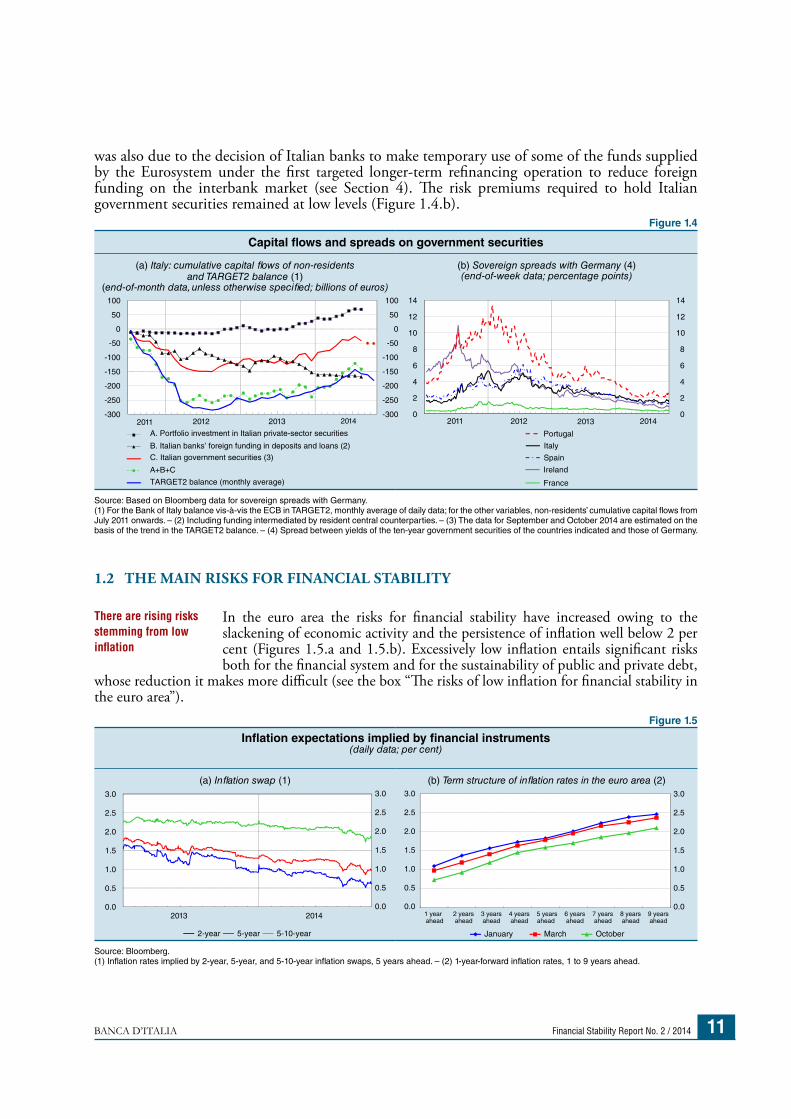
Thanks to inflows of private capital, the Bank of Italy’s debtor position vis-à-vis TARGET2 improved in the first part of 2014, reaching a low of €130 billion at the end of July, against a peak of almost €290 billion in August 2012 (Figure1.4.a). The negative balance then began to increase again, largely for
technical reasons such as substantial amounts of government securities reaching maturity, which the Treasury only partly offset by issuing new securities, given its already ample liquidity. The increase
Foreign inflows of private capital have not been interrupted
Figure 1.3
Euro-area banks: main indicators
(a) European sovereign and bank CDS (1)(daily data; basis points)
(b) Gross issues of unsecured bonds (2)(monthly data; billions of euros)
(c) Loan loss provisions (4)(quarterly data; per cent)
0.0
0.5
1.0
1.5
2.0
2.5
0.0
0.5
1.0
1.5
2.0
2.5
5
10
15
20
25
30
1
2
3
4
5
6
0
100
200
300
400
500
0
100
200
300
400
500
2011 2012 2013 20142012 2013 20142011 '01 '02 '03 '04 '05 '06 '07 '08 '09 '10 '11 '12 '13 '14
Sovereign issuers Banks 5th-25th percentile 25th-50th percentile
50th-75th percentile 75th-95th percentile
Euro-area average
Italy Spain Euro area (3)
(d) Bank loans to firms (5)(monthly data; per cent)
(e) Banks’ expected earnings(weekly data; indices, last forecast
for 2013=100)Interest rates on new loans (6) 12-month growth rates (7)
20142012 2013 50
100
150
200
250
300
50
100
150
200
250
300
2013 20142011 2012201320122011 2014
2013 2014 2015 2016Euro area France GermanyItaly Spain
-12
-9
-6
-3
0
3
6
9
1.5
2.0
2.5
3.0
3.5
4.0
4.5
1.5
2.0
2.5
3.0
3.5
4.0
4.5
-12
-9
-6
-3
0
3
6
9
Sources: Based on data from Bank of Italy, ECB, Bloomberg, Dealogic, I/B/E/S and Thomson Reuters Datastream.(1) Basket of sovereign CDS: simple average of Germany, France, Italy and Spain. Basket of bank CDS: simple average of Unicredit, Intesa Sanpaolo and Banca Monte dei paschi di Siena, for Italy; BNP Paribas, Société Générale and Crédit Agricole, for France; Deutsche Bank and Commerzbank for Germany; Banco Santander and Banco Bilbao Vircaja Argentaria, for Spain. – (2) Twelve-month moving averages; bonds not backed by collateral or by a government guarantee. – (3) Right-hand scale. – (4) Four-quarter moving sum of provisions expressed as a percentage of total loans. The different shades of red correspond to differences between the percentiles shown in the legend. Sample of major euro-area banks, including large financial institutions that engage in various kinds of banking business, including at international level: Banco Santander, BBVA, BNP Paribas, Crédit Agricole, Commerzbank, Deutsche Bank, ING, Intesa Sanpaolo, Société Générale and UniCredit. – (5) Loans to non-financial firms resident in the euro area. – (6) The data on interest rates refer to transactions in euros and are gathered and processed using the Eurosystem’s harmonized method. – (7) Loans are adjusted for the accounting effect of securitizations.
Financial Stability Report No. 2 / 2014 BANCA D’ITALIA10
Table 1.1
Financial sustainability indicators (per cent of GDP, unless otherwise specified)
Budget deficit (1) Primary surplus (1) Public debt (1) GDP(annual growth rate) (2)
2013 2014 2015 2013 2014 2015 2013 2014 2015 2013 2014 2015
Italy 2.8 3.0 2.7 2.0 1.7 1.8 127.9 132.2 133.8 -1.9 -0.4 0.6Germany -0.1 -0.2 0.0 2.2 2.1 1.8 76.9 74.5 72.4 0.1 1.3 1.1France 4.1 4.4 4.5 -1.9 -2.3 -2.2 92.2 95.5 98.1 0.3 0.3 0.7Spain 6.8 5.6 4.6 -3.5 -2.3 -1.2 92.1 98.1 101.2 -1.2 1.2 1.7Netherlands 2.3 2.5 2.1 -0.8 -1.0 -0.7 68.6 69.7 70.3 -0.7 0.9 1.4Belgium 2.9 3.0 2.8 0.3 0.1 0.1 104.5 105.8 107.3 0.3 0.9 0.9Austria 1.5 2.9 1.8 1.1 -0.4 0.7 81.2 87.0 86.1 0.2 0.7 1.2Finland 2.4 2.9 2.6 -1.2 -1.6 -1.4 56.0 59.8 61.7 -1.2 -0.4 0.6
Greece 12.2 1.6 0.1 -8.2 2.7 4.1 174.9 175.5 168.8 -3.3 0.6 2.9Portugal 4.9 4.9 3.3 0.1 0.1 1.6 128.0 127.7 125.1 -1.4 0.9 1.3Ireland 5.7 3.7 2.9 -1.3 0.4 0.9 123.3 110.5 109.4 0.2 4.6 3.6
Euro area (3) 2.9 2.6 2.4 -0.1 0.1 0.3 93.1 94.5 94.8 -0.5 0.8 1.1
United Kingdom 5.8 5.4 4.4 -2.9 -2.7 -1.8 87.2 89.0 89.5 1.7 3.1 2.7United States 5.8 5.5 4.3 -3.6 -3.4 -2.2 104.2 105.6 105.1 2.2 2.2 3.1Japan 8.2 7.1 5.8 -7.4 -6.3 -5.0 243.2 245.1 245.5 1.5 0.9 0.8Canada 3.0 2.6 2.1 -2.7 -2.1 -1.6 88.8 88.1 86.8 2.0 2.3 2.4
Characteristics of public debt (4)
Sustainability indicators
Private sector financial debt at end-2013 (7)
External positions
at end-2013 (8)
Share maturing
plus deficit in 2014
Average residual
life of govt. securities in 2014 (years)
Non-residents’
share in 2014 (% of public
debt)
S2 indicator (5)
IMF indicator
(6)
Households Non-financial firms
Current account
balance in 2013
Net international investment position at end-2013
Italy 27.9 6.3 35.6 -2.3 3.1 43.1 77.6 1.0 -30.7Germany 6.6 6.4 62.4 1.4 0.6 55.6 52.8 6.8 42.9France 17.4 6.8 62.9 1.6 5.2 55.6 119.6 -1.4 -15.6Spain 20.5 5.8 43.4 4.8 5.3 75.2 112.1 1.4 -92.6Netherlands 13.1 6.8 57.5 5.9 5.5 117.3 129.0 9.9 31.3Belgium 15.3 7.4 63.0 7.4 8.9 55.8 134.8 0.1 48.8Austria 11.7 7.9 76.8 4.1 5.5 …. …. 1.0 -0.2Finland 7.6 5.7 84.1 5.8 3.7 64.2 108.5 -1.4 8.8
Greece 14.5 20.0 85.9 …. …. 64.4 71.7 0.6 -121.1Portugal 20.8 5.6 71.4 …. 5.2 85.9 132.1 0.7 -116.2Ireland 7.6 12.2 63.5 …. 5.1 92.9 207.7 4.4 -101.7
Euro area (3) …. …. …. 2.1 …. 62.6 98.0 2.1 -13.5
United Kingdom 11.6 14.8 27.9 5.2 6.1 88.7 80.6 -4.2 -15.6United States 23.6 5.6 32.7 …. 11.1 78.6 67.4 -2.4 -32.1Japan 58.1 6.6 7.9 …. 13.1 63.3 104.9 0.7 67.9Canada 16.0 6.1 20.6 …. 5.3 93.7 99.8 -3.2 1.5
Sources: IMF, Eurostat, ECB, European Commission, Istat, national financial accounts and balance-of-payments data.1) Data for European and euro-area countries from European Commission, European Economic Forecast Autumn 2014, November 2014. Data for non-European countries from IMF, Fiscal Monitor, October 2014. – (2) Data for European and euro-area countries from European Commission, European Economic Forecast Autumn 2014, November 2014. Data for non-European countries from IMF, World Economic Outlook, October 2014. – (3) Euro-area data refer to 19 countries for the budget deficit, the primary surplus, the public debt, and GDP; to 18 countries for private sector financial debt and external positions; and to 17 countries for the S2 indicator. – (4) IMF Fiscal Monitor, October 2014. – (5) European Commission, Fiscal Sustainability Report 2012, December 2012. Increase in the primary surplus/GDP ratio (with respect to 2011) needed to satisfy the general government intertemporal budget constraint, given demographic and macroeconomic projections. The estimate takes account of the level of the debt, the outlook for economic growth, changes in interest rates and future primary surpluses, which are affected by the trend of age-related expenditure. – (6) IMF, Fiscal Monitor, October 2014. Increase in the primary surplus/GDP ratio that would need to be achieved by 2020 (and maintained for a further decade) in order to bring the debt/GDP ratio down to 60 per cent by 2030. The value includes the projected increase in health and pension expenditure between 2014 and 2030. – (7) Data for euro-area countries from ECB, Statistical Data Warehouse; data for the United Kingdom and non-European countries from national sources; the data are compiled according to the new European system of accounts (ESA 2010). – (8) Data for European countries and the euro-area from Eurostat, Statistics Database, ECB, Statistical Data Warehouse, and national sources; the data are compiled according to the new international accounting standards (see the box, “The new international accounting standards for external transactions and investment positions”, Economic Bulletin, No. 4, 2014).
BANCA D’ITALIA Financial Stability Report No. 2 / 2014 11
was also due to the decision of Italian banks to make temporary use of some of the funds supplied by the Eurosystem under the first targeted longer-term refinancing operation to reduce foreign funding on the interbank market (see Section 4). The risk premiums required to hold Italian government securities remained at low levels (Figure 1.4.b).
1.2 THE MAIN RISKS FOR FINANCIAL STABILITY
In the euro area the risks for financial stability have increased owing to the slackening of economic activity and the persistence of inflation well below 2 per cent (Figures 1.5.a and 1.5.b). Excessively low inflation entails significant risks both for the financial system and for the sustainability of public and private debt,
whose reduction it makes more difficult (see the box “The risks of low inflation for financial stability in the euro area”).
There are rising risks stemming from low inflation
Figure 1.4
Capital flows and spreads on government securities
(a) Italy: cumulative capital flows of non-residents and TARGET2 balance (1)
(end-of-month data, unless otherwise specified; billions of euros)
(b) Sovereign spreads with Germany (4)(end-of-week data; percentage points)
2012 2013 201420110
2
4
6
8
10
12
14
0
2
4
6
8
10
12
14
Ireland
Italy
Spain
Portugal
France
A. Portfolio investment in Italian private-sector securities
B. Italian banks’ foreign funding in deposits and loans (2)
C. Italian government securities (3)
A+B+C
TARGET2 balance (monthly average)
2013 201420122011-300
-250
-200
-150
-100
-50
0
50
100
-300
-250
-200
-150
-100
-50
0
50
100
Source: Based on Bloomberg data for sovereign spreads with Germany.(1) For the Bank of Italy balance vis-à-vis the ECB in TARGET2, monthly average of daily data; for the other variables, non-residents’ cumulative capital flows from July 2011 onwards. – (2) Including funding intermediated by resident central counterparties. – (3) The data for September and October 2014 are estimated on the basis of the trend in the TARGET2 balance. – (4) Spread between yields of the ten-year government securities of the countries indicated and those of Germany.
Figure 1.5
Inflation expectations implied by financial instruments(daily data; per cent)
(a) Inflation swap (1) (b) Term structure of inflation rates in the euro area (2)
1 year ahead
2 years ahead
3 years ahead
4 years ahead
5 years ahead
6 years ahead
7 years ahead
8 years ahead
9 years ahead
2013 20140.0
0.5
1.0
1.5
2.0
2.5
3.0
January March October2-year 5-year 5-10-year
0.0
0.5
1.0
1.5
2.0
2.5
3.0
0.0
0.5
1.0
1.5
2.0
2.5
3.0
0.0
0.5
1.0
1.5
2.0
2.5
3.0
Source: Bloomberg.(1) Inflation rates implied by 2-year, 5-year, and 5-10-year inflation swaps, 5 years ahead. – (2) 1-year-forward inflation rates, 1 to 9 years ahead.
Financial Stability Report No. 2 / 2014 BANCA D’ITALIA12
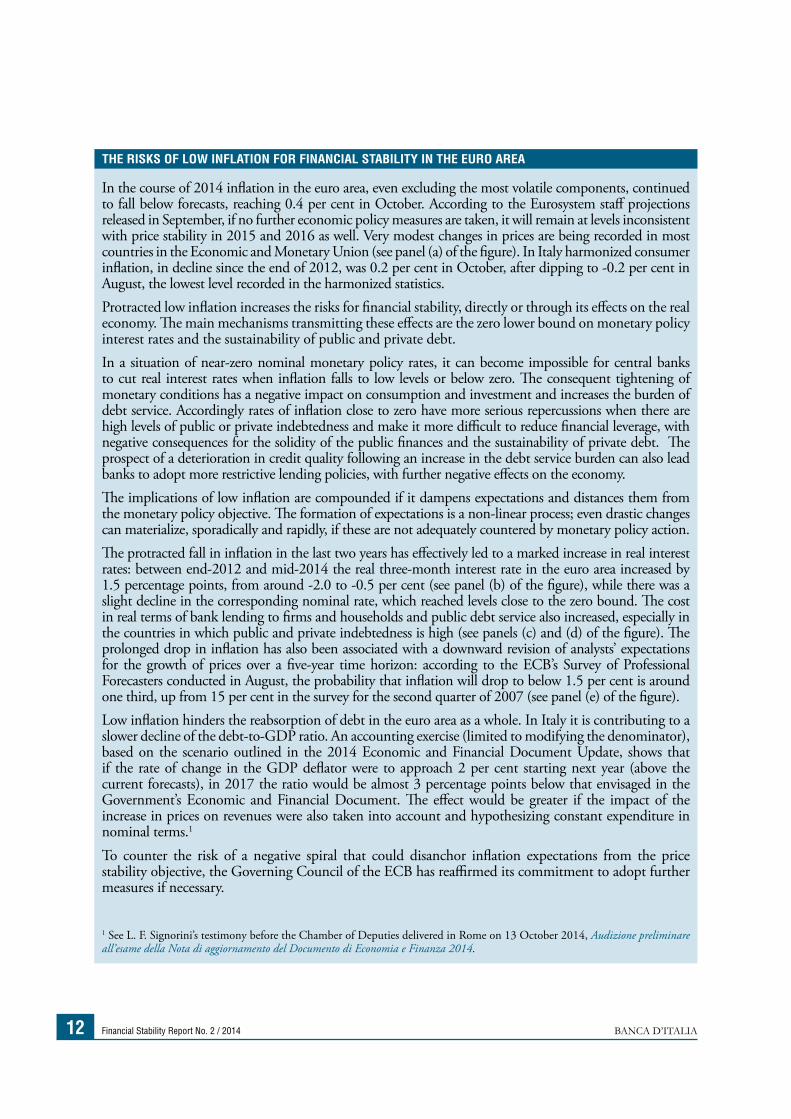
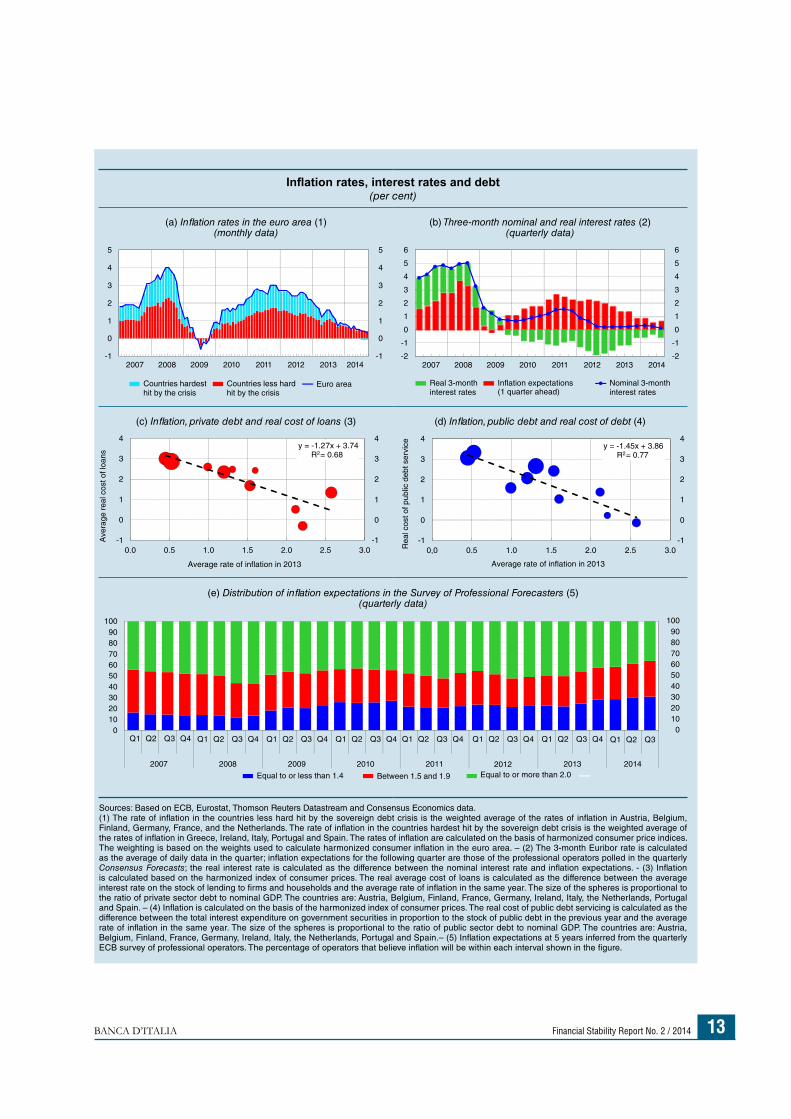
THE RISKS OF LOW INFLATION FOR FINANCIAL STABILITY IN THE EURO AREA
In the course of 2014 inflation in the euro area, even excluding the most volatile components, continued to fall below forecasts, reaching 0.4 per cent in October. According to the Eurosystem staff projections released in September, if no further economic policy measures are taken, it will remain at levels inconsistent with price stability in 2015 and 2016 as well. Very modest changes in prices are being recorded in most countries in the Economic and Monetary Union (see panel (a) of the figure). In Italy harmonized consumer inflation, in decline since the end of 2012, was 0.2 per cent in October, after dipping to -0.2 per cent in August, the lowest level recorded in the harmonized statistics. Protracted low inflation increases the risks for financial stability, directly or through its effects on the real economy. The main mechanisms transmitting these effects are the zero lower bound on monetary policy interest rates and the sustainability of public and private debt. In a situation of near-zero nominal monetary policy rates, it can become impossible for central banks to cut real interest rates when inflation falls to low levels or below zero. The consequent tightening of monetary conditions has a negative impact on consumption and investment and increases the burden of debt service. Accordingly rates of inflation close to zero have more serious repercussions when there are high levels of public or private indebtedness and make it more difficult to reduce financial leverage, with negative consequences for the solidity of the public finances and the sustainability of private debt. The prospect of a deterioration in credit quality following an increase in the debt service burden can also lead banks to adopt more restrictive lending policies, with further negative effects on the economy. The implications of low inflation are compounded if it dampens expectations and distances them from the monetary policy objective. The formation of expectations is a non-linear process; even drastic changes can materialize, sporadically and rapidly, if these are not adequately countered by monetary policy action. The protracted fall in inflation in the last two years has effectively led to a marked increase in real interest rates: between end-2012 and mid-2014 the real three-month interest rate in the euro area increased by 1.5 percentage points, from around -2.0 to -0.5 per cent (see panel (b) of the figure), while there was a slight decline in the corresponding nominal rate, which reached levels close to the zero bound. The cost in real terms of bank lending to firms and households and public debt service also increased, especially in the countries in which public and private indebtedness is high (see panels (c) and (d) of the figure). The prolonged drop in inflation has also been associated with a downward revision of analysts’ expectations for the growth of prices over a five-year time horizon: according to the ECB’s Survey of Professional Forecasters conducted in August, the probability that inflation will drop to below 1.5 per cent is around one third, up from 15 per cent in the survey for the second quarter of 2007 (see panel (e) of the figure). Low inflation hinders the reabsorption of debt in the euro area as a whole. In Italy it is contributing to a slower decline of the debt-to-GDP ratio. An accounting exercise (limited to modifying the denominator), based on the scenario outlined in the 2014 Economic and Financial Document Update, shows that if the rate of change in the GDP deflator were to approach 2 per cent starting next year (above the current forecasts), in 2017 the ratio would be almost 3 percentage points below that envisaged in the Government’s Economic and Financial Document. The effect would be greater if the impact of the increase in prices on revenues were also taken into account and hypothesizing constant expenditure in nominal terms.1
To counter the risk of a negative spiral that could disanchor inflation expectations from the price stability objective, the Governing Council of the ECB has reaffirmed its commitment to adopt further measures if necessary.
1 See L. F. Signorini’s testimony before the Chamber of Deputies delivered in Rome on 13 October 2014, Audizione preliminare all’esame della Nota di aggiornamento del Documento di Economia e Finanza 2014.
BANCA D’ITALIA Financial Stability Report No. 2 / 2014 13
Inflation rates, interest rates and debt(per cent)
(a) Inflation rates in the euro area (1) (monthly data)
(b) Three-month nominal and real interest rates (2)(quarterly data)
2007 2008 2009 2010 2011 2012 2013 2014-2
-1
0
1
2
3
4
5
6
-2
-1
0
1
2
3
4
5
6
Real 3-month interest rates
Inflation expectations (1 quarter ahead)
Nominal 3-month interest rates
2007 2008 2009 2010 2011 2012 2013 2014-1
0
1
2
3
4
5
-1
0
1
2
3
4
5
Countries less hard hit by the crisis
Countries hardest hit by the crisis
Euro area
(c) Inflation, private debt and real cost of loans (3) (d) Inflation, public debt and real cost of debt (4)
y = -1.45x + 3.86R2 = 0.77
-1
0
1
2
3
4
-1
0
1
2
3
4
0,0 0.5 1.0 1.5 2.0 2.5 3.0Rea
l cos
t of p
ublic
deb
t ser
vice
Average rate of inflation in 2013
y = -1.2 7x + 3.74R2 = 0.68
-1
0
1
2
3
4
-1
0
1
2
3
4
0.0 0.5 1.0 1.5 2.0 2.5 3.0
Ave
rage
rea
l cos
t of l
oans
Average rate of inflation in 2013
(e) Distribution of inflation expectations in the Survey of Professional Forecasters (5)(quarterly data)
0102030405060708090
100
2007 2008 2010 2011 2013 20142009
Equal to or less than 1.4 Between 1.5 and 1.9
2012
0102030405060708090
100
Q1 Q2 Q3 Q4 Q1 Q2 Q3 Q4 Q1 Q2 Q3 Q4 Q1 Q2 Q3 Q4 Q1 Q2 Q3 Q4 Q1 Q2 Q3 Q4 Q1 Q2 Q3 Q4 Q1 Q2 Q3
Equal to or more than 2.0
Sources: Based on ECB, Eurostat, Thomson Reuters Datastream and Consensus Economics data.(1) The rate of inflation in the countries less hard hit by the sovereign debt crisis is the weighted average of the rates of inflation in Austria, Belgium, Finland, Germany, France, and the Netherlands. The rate of inflation in the countries hardest hit by the sovereign debt crisis is the weighted average of the rates of inflation in Greece, Ireland, Italy, Portugal and Spain. The rates of inflation are calculated on the basis of harmonized consumer price indices. The weighting is based on the weights used to calculate harmonized consumer inflation in the euro area. – (2) The 3-month Euribor rate is calculated as the average of daily data in the quarter; inflation expectations for the following quarter are those of the professional operators polled in the quarterly Consensus Forecasts; the real interest rate is calculated as the difference between the nominal interest rate and inflation expectations. - (3) Inflation is calculated based on the harmonized index of consumer prices. The real average cost of loans is calculated as the difference between the average interest rate on the stock of lending to firms and households and the average rate of inflation in the same year. The size of the spheres is proportional to the ratio of private sector debt to nominal GDP. The countries are: Austria, Belgium, Finland, France, Germany, Ireland, Italy, the Netherlands, Portugal and Spain. – (4) Inflation is calculated on the basis of the harmonized index of consumer prices. The real cost of public debt servicing is calculated as the difference between the total interest expenditure on government securities in proportion to the stock of public debt in the previous year and the average rate of inflation in the same year. The size of the spheres is proportional to the ratio of public sector debt to nominal GDP. The countries are: Austria, Belgium, Finland, France, Germany, Ireland, Italy, the Netherlands, Portugal and Spain.– (5) Inflation expectations at 5 years inferred from the quarterly ECB survey of professional operators. The percentage of operators that believe inflation will be within each interval shown in the figure.
Financial Stability Report No. 2 / 2014 BANCA D’ITALIA14
The euro area’s prospects are made more uncertain by the risks to which global economic activity is exposed. The weakness of world growth and the repeated downward revisions of output forecasts could be the harbingers of a prolonged period of economic stagnation,
with repercussions on the financial system and the public finances. The risk is more pronounced for the euro area, where output and employment are still below their 2008 levels.
The persistent fragility of world economic growth has made markets highly sensitive to political and economic news, as was demonstrated by the sudden increase in volatility in the middle of October in connection with the heightened fears about the political and financial situation in Greece. The prospect of low growth is also the main source of risk for banks in the euro area. However, the results of the
Comprehensive Assessment have demonstrated that the large European banks would remain solvent even in severely adverse cyclical conditions. Additional risks stem from geopolitical tensions and the slowdown in the emerging economies, which could produce new pressures on some large international banks.
The adoption of unconventional monetary policy measures by the ECB has helped to attenuate the risk that the removal of expansive monetary conditions in the United States might lead to a rise in medium- and long-term interest rates in the euro area. Until last spring there was evidence that long-term US interest rates influenced those
of the euro area (see the box “The transmission of US interest rate rises to euro-area interest rates”, Financial Stability Report, No. 1, 2014). But since May the measures taken by the ECB have fostered a further decline in long-term euro rates that has been reflected in dollar rates as well. There remains the risk that a future widening of interest rate differentials could trigger an expansion of the carry trade, which would increase the volatility of exchange rates.
Sovereign risk premiums in the euro area have stayed low, benefiting from the expansive measures of the ECB and investors’ search
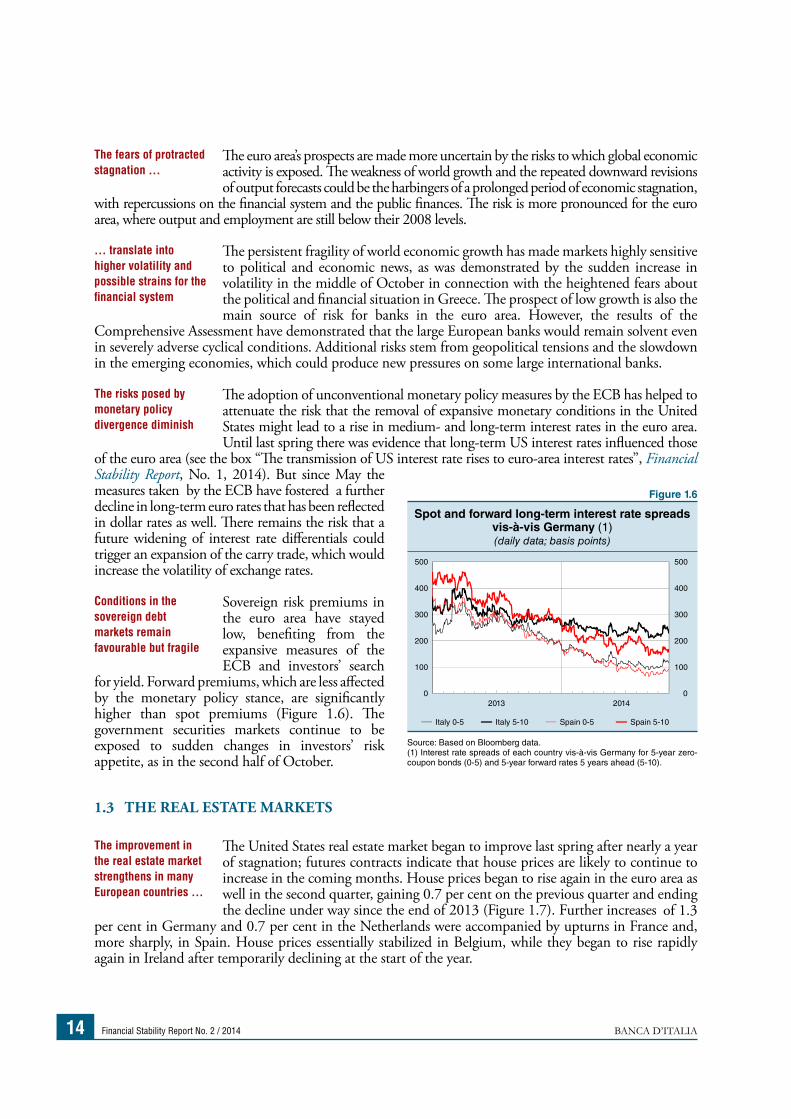
for yield. Forward premiums, which are less affected by the monetary policy stance, are significantly higher than spot premiums (Figure 1.6). The government securities markets continue to be exposed to sudden changes in investors’ risk appetite, as in the second half of October.
1.3 THE REAL ESTATE MARKETS
The United States real estate market began to improve last spring after nearly a year of stagnation; futures contracts indicate that house prices are likely to continue to increase in the coming months. House prices began to rise again in the euro area as well in the second quarter, gaining 0.7 per cent on the previous quarter and ending the decline under way since the end of 2013 (Figure 1.7). Further increases of 1.3
per cent in Germany and 0.7 per cent in the Netherlands were accompanied by upturns in France and, more sharply, in Spain. House prices essentially stabilized in Belgium, while they began to rise rapidly again in Ireland after temporarily declining at the start of the year.
The fears of protracted stagnation ...
… translate into higher volatility and possible strains for the financial system
The risks posed by monetary policy divergence diminish
Conditions in the sovereign debt markets remain favourable but fragile
The improvement in the real estate market strengthens in many European countries …
Figure 1.6
Spot and forward long-term interest rate spreads vis-à-vis Germany (1)(daily data; basis points)
Italy 0-5 Italy 5-10 Spain 0-5 Spain 5-10
2013 2014 0
100
200
300
400
500
0
100
200
300
400
500
Source: Based on Bloomberg data.(1) Interest rate spreads of each country vis-à-vis Germany for 5-year zero-coupon bonds (0-5) and 5-year forward rates 5 years ahead (5-10).
BANCA D’ITALIA Financial Stability Report No. 2 / 2014 15
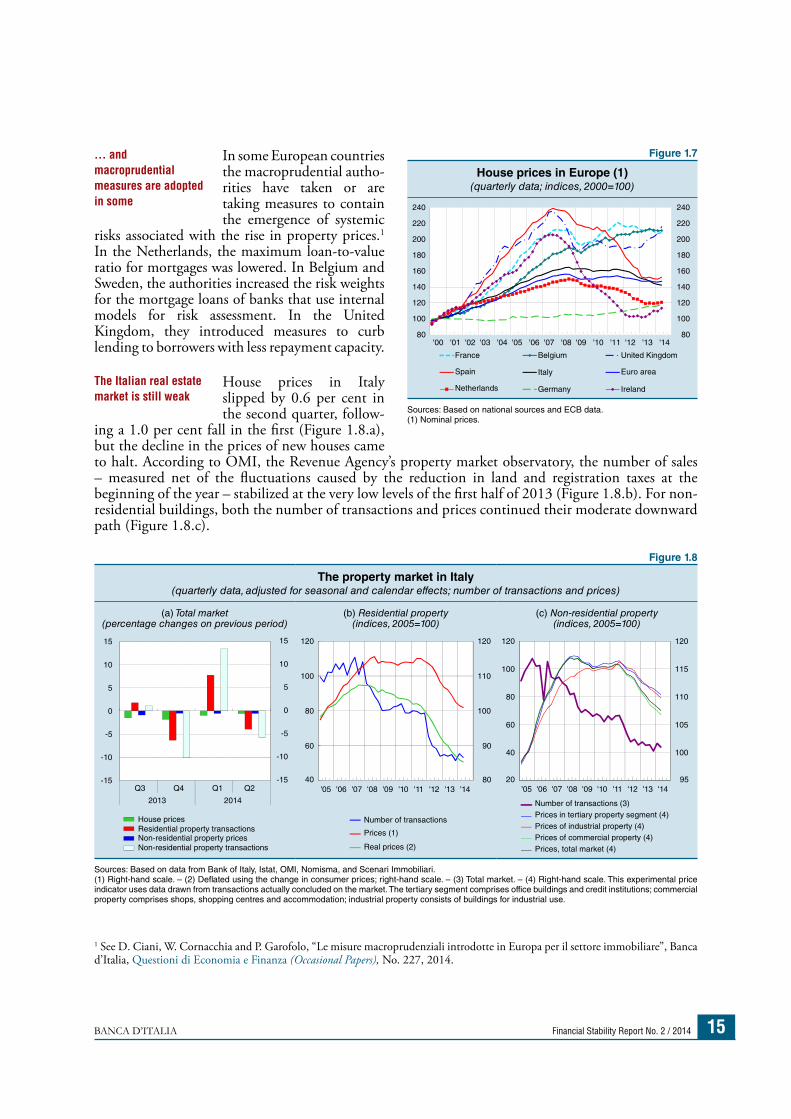
In some European countries the macroprudential autho- rities have taken or are taking measures to contain the emergence of systemic
risks associated with the rise in property prices.1 In the Netherlands, the maximum loan-to-value ratio for mortgages was lowered. In Belgium and Sweden, the authorities increased the risk weights for the mortgage loans of banks that use internal models for risk assessment. In the United Kingdom, they introduced measures to curb lending to borrowers with less repayment capacity.
House prices in Italy slipped by 0.6 per cent in the second quarter, follow-
ing a 1.0 per cent fall in the first (Figure 1.8.a), but the decline in the prices of new houses came to halt. According to OMI, the Revenue Agency’s property market observatory, the number of sales – measured net of the fluctuations caused by the reduction in land and registration taxes at the beginning of the year – stabilized at the very low levels of the first half of 2013 (Figure 1.8.b). For non-residential buildings, both the number of transactions and prices continued their moderate downward path (Figure 1.8.c).
1 See D. Ciani, W. Cornacchia and P. Garofolo, “Le misure macroprudenziali introdotte in Europa per il settore immobiliare”, Banca d’Italia, Questioni di Economia e Finanza (Occasional Papers), No. 227, 2014.
... and macroprudential measures are adopted in some
The Italian real estate market is still weak
Figure 1.7
House prices in Europe (1)(quarterly data; indices, 2000=100)
France Belgium United Kingdom
Italy Euro areaSpain
Netherlands Germany Ireland
80
100
120
140
160
180
200
220
240
80
100
120
140
160
180
200
220
240
'00 '01 '02 '03 '04 '05 '06 '07 '08 '09 '10 '11 '12 '13 '14
Sources: Based on national sources and ECB data.(1) Nominal prices.
Figure 1.8
The property market in Italy(quarterly data, adjusted for seasonal and calendar effects; number of transactions and prices)
(a) Total market(percentage changes on previous period)
(b) Residential property(indices, 2005=100)
(c) Non-residential property(indices, 2005=100)
'05 '06 '07 '08 '09 '10 '11 '12 '13 '14 95
100
105
110
115
120
20
40
60
80
100
120
'05 '06 '07 '08 '09 '10 '11 '12 '13 '14 80
90
100
110
120
40
60
80
100
120
-15
-10
-5
0
5
10
15
Q3 Q4 Q1 Q2
2013 2014
-15
-10
-5
0
5
10
15
Number of transactions (3) Prices in tertiary property segment (4) Prices of industrial property (4) Prices of commercial property (4) Prices, total market (4)
Number of transactions
Prices (1)
Real prices (2)
House pricesResidential property transactionsNon-residential property prices Non-residential property transactions
Sources: Based on data from Bank of Italy, Istat, OMI, Nomisma, and Scenari Immobiliari.(1) Right-hand scale. – (2) Deflated using the change in consumer prices; right-hand scale. – (3) Total market. – (4) Right-hand scale. This experimental price indicator uses data drawn from transactions actually concluded on the market. The tertiary segment comprises office buildings and credit institutions; commercial property comprises shops, shopping centres and accommodation; industrial property consists of buildings for industrial use.
Financial Stability Report No. 2 / 2014 BANCA D’ITALIA16
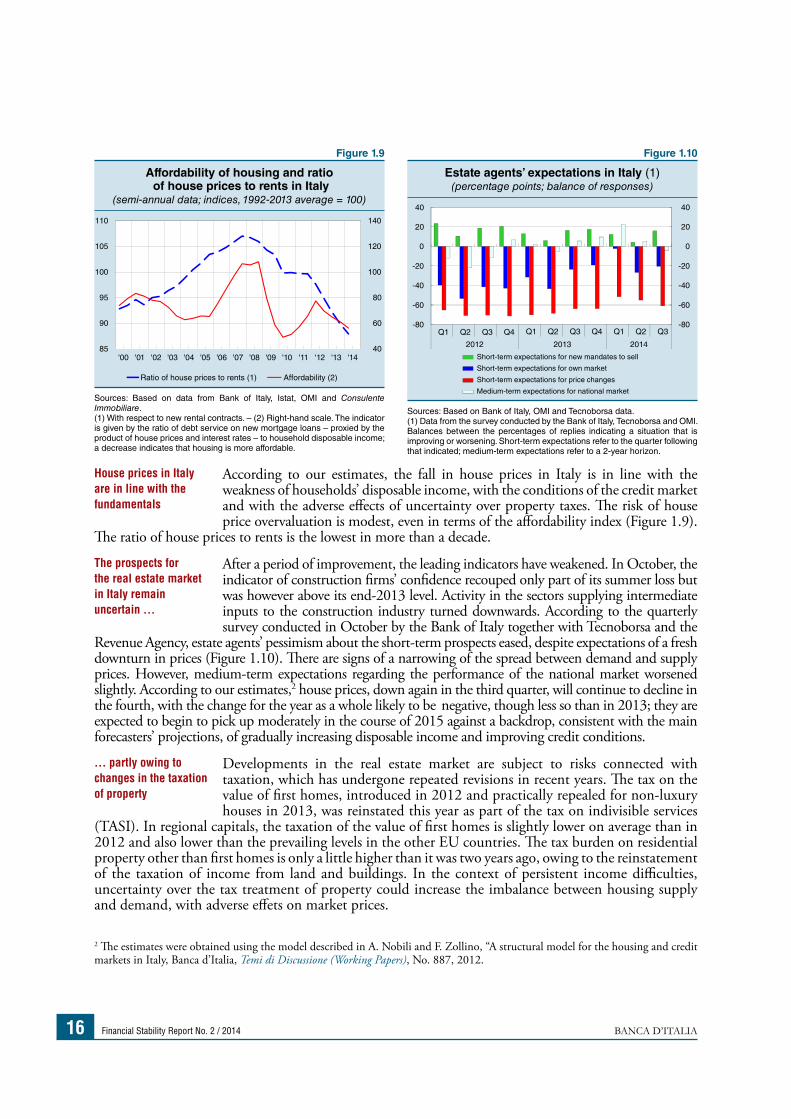
According to our estimates, the fall in house prices in Italy is in line with the weakness of households’ disposable income, with the conditions of the credit market and with the adverse effects of uncertainty over property taxes. The risk of house price overvaluation is modest, even in terms of the affordability index (Figure 1.9).
The ratio of house prices to rents is the lowest in more than a decade.
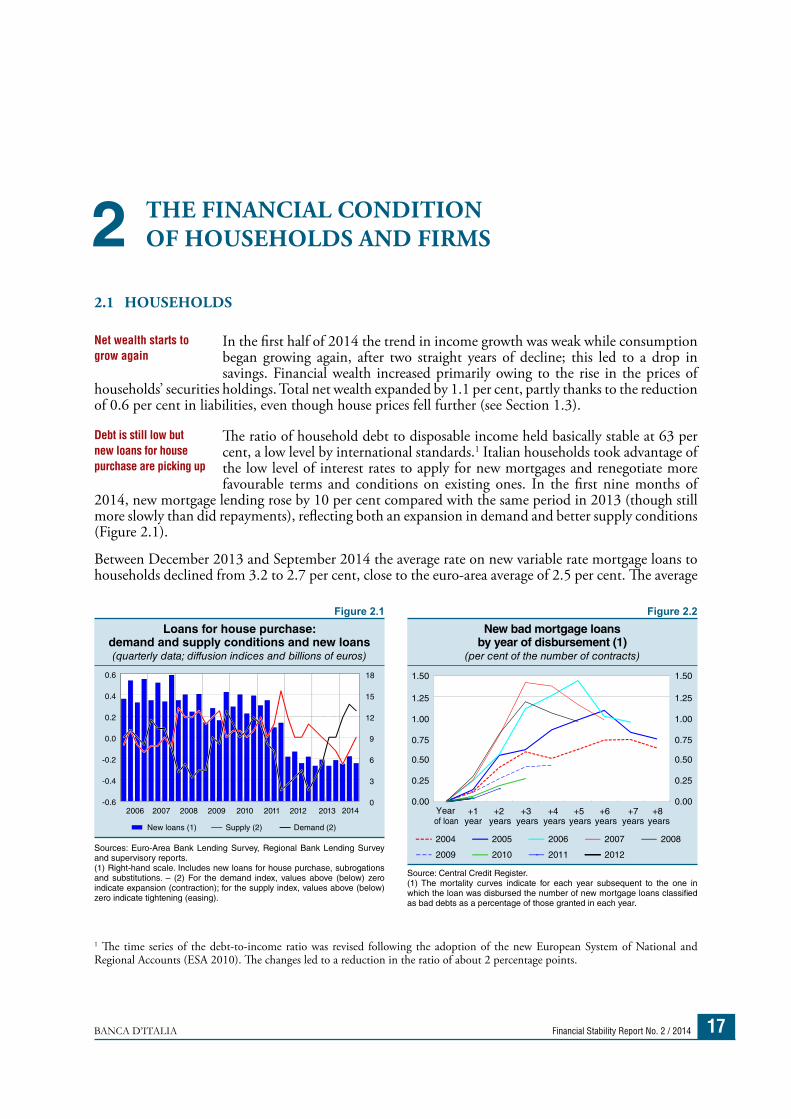
After a period of improvement, the leading indicators have weakened. In October, the indicator of construction firms’ confidence recouped only part of its summer loss but was however above its end-2013 level. Activity in the sectors supplying intermediate inputs to the construction industry turned downwards. According to the quarterly survey conducted in October by the Bank of Italy together with Tecnoborsa and the
Revenue Agency, estate agents’ pessimism about the short-term prospects eased, despite expectations of a fresh downturn in prices (Figure 1.10). There are signs of a narrowing of the spread between demand and supply prices. However, medium-term expectations regarding the performance of the national market worsened slightly. According to our estimates,2 house prices, down again in the third quarter, will continue to decline in the fourth, with the change for the year as a whole likely to be negative, though less so than in 2013; they are expected to begin to pick up moderately in the course of 2015 against a backdrop, consistent with the main forecasters’ projections, of gradually increasing disposable income and improving credit conditions.
Developments in the real estate market are subject to risks connected with taxation, which has undergone repeated revisions in recent years. The tax on the value of first homes, introduced in 2012 and practically repealed for non-luxury houses in 2013, was reinstated this year as part of the tax on indivisible services
(TASI). In regional capitals, the taxation of the value of first homes is slightly lower on average than in 2012 and also lower than the prevailing levels in the other EU countries. The tax burden on residential property other than first homes is only a little higher than it was two years ago, owing to the reinstatement of the taxation of income from land and buildings. In the context of persistent income difficulties, uncertainty over the tax treatment of property could increase the imbalance between housing supply and demand, with adverse effets on market prices.
2 The estimates were obtained using the model described in A. Nobili and F. Zollino, “A structural model for the housing and credit markets in Italy, Banca d’Italia, Temi di Discussione (Working Papers), No. 887, 2012.
House prices in Italy are in line with the fundamentals
The prospects for the real estate market in Italy remain uncertain …
… partly owing to changes in the taxation of property
Figure 1.9
Affordability of housing and ratio of house prices to rents in Italy
(semi-annual data; indices, 1992-2013 average = 100)
'00 '01 '02 '03 '04 '05 '06 '07 '08 '09 '10 '11 '12 '13 '14 40
60
80
100
120
140
85
90
95
100
105
110
Ratio of house prices to rents (1) Affordability (2)
Sources: Based on data from Bank of Italy, Istat, OMI and Consulente Immobiliare.(1) With respect to new rental contracts. – (2) Right-hand scale. The indicator is given by the ratio of debt service on new mortgage loans – proxied by the product of house prices and interest rates – to household disposable income; a decrease indicates that housing is more affordable.
Figure 1.10
Estate agents’ expectations in Italy (1)(percentage points; balance of responses)
-80
-60
-40
-20
0
20
40
Q1 Q2 Q3 Q4
2012 2013 2014
Short-term expectations for new mandates to sell
Short-term expectations for own market
Short-term expectations for price changes
Medium-term expectations for national market
-80
-60
-40
-20
0
20
40
Q1 Q2 Q3 Q4 Q1 Q2 Q3
Sources: Based on Bank of Italy, OMI and Tecnoborsa data.(1) Data from the survey conducted by the Bank of Italy, Tecnoborsa and OMI. Balances between the percentages of replies indicating a situation that is improving or worsening. Short-term expectations refer to the quarter following that indicated; medium-term expectations refer to a 2-year horizon.
BANCA D’ITALIA Financial Stability Report No. 2 / 2014 17
2.1 HOUSEHOLDS
In the first half of 2014 the trend in income growth was weak while consumption began growing again, after two straight years of decline; this led to a drop in savings. Financial wealth increased primarily owing to the rise in the prices of
households’ securities holdings. Total net wealth expanded by 1.1 per cent, partly thanks to the reduction of 0.6 per cent in liabilities, even though house prices fell further (see Section 1.3).
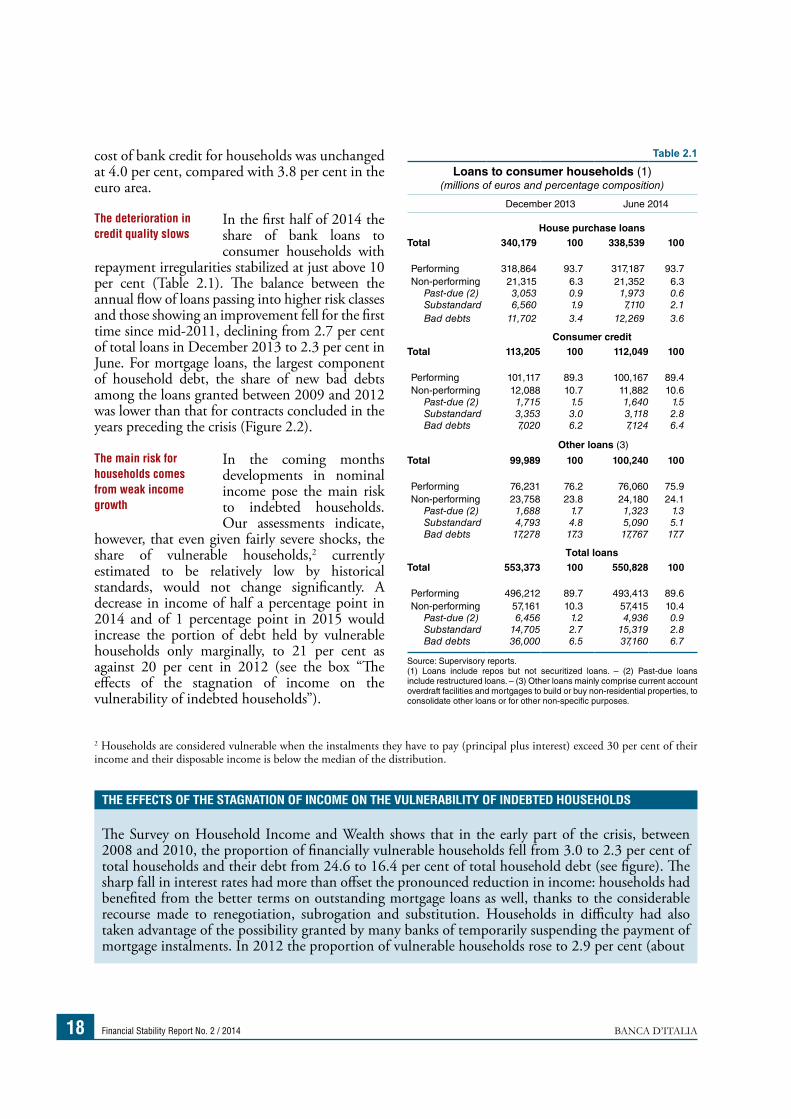
The ratio of household debt to disposable income held basically stable at 63 per cent, a low level by international standards.1 Italian households took advantage of the low level of interest rates to apply for new mortgages and renegotiate more favourable terms and conditions on existing ones. In the first nine months of
2014, new mortgage lending rose by 10 per cent compared with the same period in 2013 (though still more slowly than did repayments), reflecting both an expansion in demand and better supply conditions (Figure 2.1).
Between December 2013 and September 2014 the average rate on new variable rate mortgage loans to households declined from 3.2 to 2.7 per cent, close to the euro-area average of 2.5 per cent. The average
1 The time series of the debt-to-income ratio was revised following the adoption of the new European System of National and Regional Accounts (ESA 2010). The changes led to a reduction in the ratio of about 2 percentage points.
Net wealth starts to grow again
Debt is still low but new loans for house purchase are picking up
THE FINANCIAL CONDITION OF HOUSEHOLDS AND FIRMS2
Figure 2.1Loans for house purchase:
demand and supply conditions and new loans(quarterly data; diffusion indices and billions of euros)
-0.6
-0.4
-0.2
0.0
0.2
0.4
0.6
New loans (1) Supply (2) Demand (2)
0
3
6
9
12
15
18
2006 2007 2008 2009 2010 2011 2012 2013 2014
Sources: Euro-Area Bank Lending Survey, Regional Bank Lending Survey and supervisory reports. (1) Right-hand scale. Includes new loans for house purchase, subrogations and substitutions. – (2) For the demand index, values above (below) zero indicate expansion (contraction); for the supply index, values above (below) zero indicate tightening (easing).
Figure 2.2New bad mortgage loans
by year of disbursement (1) (per cent of the number of contracts)
Year of loan
+1year
+2years
+3years
+4years
+5years
+6years
+7years
+8years
2004 2005 2006 2007 2008
2009 2010 2011 2012
0.00
0.25
0.50
0.75
1.00
1.25
1.50
0.00
0.25
0.50
0.75
1.00
1.25
1.50
Source: Central Credit Register.(1) The mortality curves indicate for each year subsequent to the one in which the loan was disbursed the number of new mortgage loans classified as bad debts as a percentage of those granted in each year.
Financial Stability Report No. 2 / 2014 BANCA D’ITALIA18
cost of bank credit for households was unchanged at 4.0 per cent, compared with 3.8 per cent in the euro area.
In the first half of 2014 the share of bank loans to consumer households with
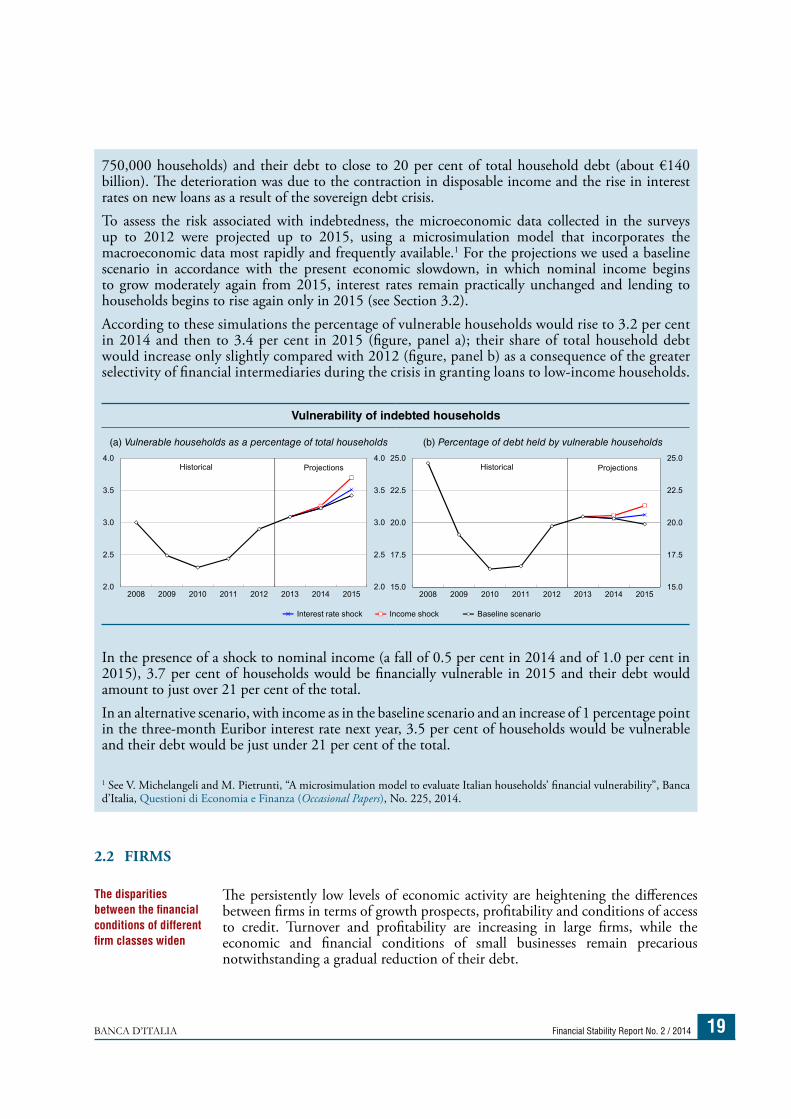
repayment irregularities stabilized at just above 10 per cent (Table 2.1). The balance between the annual flow of loans passing into higher risk classes and those showing an improvement fell for the first time since mid-2011, declining from 2.7 per cent of total loans in December 2013 to 2.3 per cent in June. For mortgage loans, the largest component of household debt, the share of new bad debts among the loans granted between 2009 and 2012 was lower than that for contracts concluded in the years preceding the crisis (Figure 2.2).
In the coming months developments in nominal income pose the main risk to indebted households. Our assessments indicate,
however, that even given fairly severe shocks, the share of vulnerable households,2 currently estimated to be relatively low by historical standards, would not change significantly. A decrease in income of half a percentage point in 2014 and of 1 percentage point in 2015 would increase the portion of debt held by vulnerable households only marginally, to 21 per cent as against 20 per cent in 2012 (see the box “The effects of the stagnation of income on the vulnerability of indebted households”).
2 Households are considered vulnerable when the instalments they have to pay (principal plus interest) exceed 30 per cent of their income and their disposable income is below the median of the distribution.
The deterioration in credit quality slows
The main risk for households comes from weak income growth
Table 2.1
Loans to consumer households (1)(millions of euros and percentage composition)
December 2013 June 2014
House purchase loansTotal 340,179 100 338,539 100
Performing 318,864 93.7 317,187 93.7Non-performing 21,315 6.3 21,352 6.3
Past-due (2) 3,053 0.9 1,973 0.6 Substandard 6,560 1.9 7,110 2.1 Bad debts 11,702 3.4 12,269 3.6
Consumer creditTotal 113,205 100 112,049 100
Performing 101,117 89.3 100,167 89.4Non-performing 12,088 10.7 11,882 10.6
Past-due (2) 1,715 1.5 1,640 1.5 Substandard 3,353 3.0 3,118 2.8 Bad debts 7,020 6.2 7,124 6.4
Other loans (3)
Total 99,989 100 100,240 100
Performing 76,231 76.2 76,060 75.9Non-performing 23,758 23.8 24,180 24.1
Past-due (2) 1,688 1.7 1,323 1.3 Substandard 4,793 4.8 5,090 5.1 Bad debts 17,278 17.3 17,767 17.7
Total loansTotal 553,373 100 550,828 100
Performing 496,212 89.7 493,413 89.6Non-performing 57,161 10.3 57,415 10.4
Past-due (2) 6,456 1.2 4,936 0.9 Substandard 14,705 2.7 15,319 2.8 Bad debts 36,000 6.5 37,160 6.7
Source: Supervisory reports.(1) Loans include repos but not securitized loans. – (2) Past-due loans include restructured loans. – (3) Other loans mainly comprise current account overdraft facilities and mortgages to build or buy non-residential properties, to consolidate other loans or for other non-specific purposes.
THE EFFECTS OF THE STAGNATION OF INCOME ON THE VULNERABILITY OF INDEBTED HOUSEHOLDS
The Survey on Household Income and Wealth shows that in the early part of the crisis, between 2008 and 2010, the proportion of financially vulnerable households fell from 3.0 to 2.3 per cent of total households and their debt from 24.6 to 16.4 per cent of total household debt (see figure). The sharp fall in interest rates had more than offset the pronounced reduction in income: households had benefited from the better terms on outstanding mortgage loans as well, thanks to the considerable recourse made to renegotiation, subrogation and substitution. Households in difficulty had also taken advantage of the possibility granted by many banks of temporarily suspending the payment of mortgage instalments. In 2012 the proportion of vulnerable households rose to 2.9 per cent (about
BANCA D’ITALIA Financial Stability Report No. 2 / 2014 19
2.2 FIRMS
The persistently low levels of economic activity are heightening the differences between firms in terms of growth prospects, profitability and conditions of access to credit. Turnover and profitability are increasing in large firms, while the economic and financial conditions of small businesses remain precarious notwithstanding a gradual reduction of their debt.
The disparities between the financial conditions of different firm classes widen
750,000 households) and their debt to close to 20 per cent of total household debt (about €140 billion). The deterioration was due to the contraction in disposable income and the rise in interest rates on new loans as a result of the sovereign debt crisis.To assess the risk associated with indebtedness, the microeconomic data collected in the surveys up to 2012 were projected up to 2015, using a microsimulation model that incorporates the macroeconomic data most rapidly and frequently available.1 For the projections we used a baseline scenario in accordance with the present economic slowdown, in which nominal income begins to grow moderately again from 2015, interest rates remain practically unchanged and lending to households begins to rise again only in 2015 (see Section 3.2).According to these simulations the percentage of vulnerable households would rise to 3.2 per cent in 2014 and then to 3.4 per cent in 2015 (figure, panel a); their share of total household debt would increase only slightly compared with 2012 (figure, panel b) as a consequence of the greater selectivity of financial intermediaries during the crisis in granting loans to low-income households.
In the presence of a shock to nominal income (a fall of 0.5 per cent in 2014 and of 1.0 per cent in 2015), 3.7 per cent of households would be financially vulnerable in 2015 and their debt would amount to just over 21 per cent of the total.In an alternative scenario, with income as in the baseline scenario and an increase of 1 percentage point in the three-month Euribor interest rate next year, 3.5 per cent of households would be vulnerable and their debt would be just under 21 per cent of the total.
1 See V. Michelangeli and M. Pietrunti, “A microsimulation model to evaluate Italian households’ financial vulnerability”, Banca d’Italia, Questioni di Economia e Finanza (Occasional Papers), No. 225, 2014.
Vulnerability of indebted households
(a) Vulnerable households as a percentage of total households (b) Percentage of debt held by vulnerable households
15.0
17.5
20.0
22.5
25.0
15.0
17.5
20.0
22.5
25.0
2008 2009 2010 2011 2012 2013 2014 2015
Historical Projections
2.0
2.5
3.0
3.5
4.0
2.0
2.5
3.0
3.5
4.0
2008 2009 2010 2011 2012 2013 2014 2015
Historical Projections
Income shock Baseline scenarioInterest rate shock
Financial Stability Report No. 2 / 2014 BANCA D’ITALIA20
According to the national accounts, the gross operating profit of non-financial firms has held stable over the year. The business survey conducted by the Bank of Italy in October on a sample of more than 4,000 industrial and service firms indicates that in the first nine months of 2014 the balance between firms reporting an increase in sales and those reporting a decrease remained negative; it was positive for exporting firms and firms with over 200 employees.
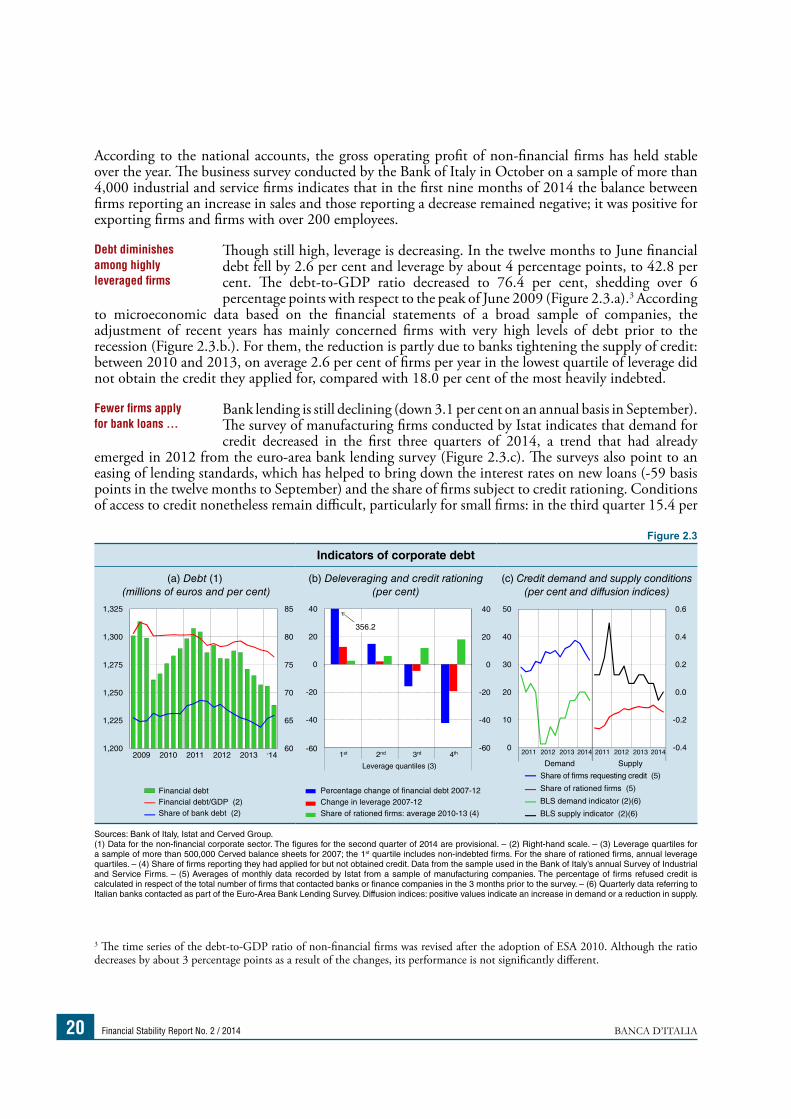
Though still high, leverage is decreasing. In the twelve months to June financial debt fell by 2.6 per cent and leverage by about 4 percentage points, to 42.8 per cent. The debt-to-GDP ratio decreased to 76.4 per cent, shedding over 6 percentage points with respect to the peak of June 2009 (Figure 2.3.a).3 According
to microeconomic data based on the financial statements of a broad sample of companies, the adjustment of recent years has mainly concerned firms with very high levels of debt prior to the recession (Figure 2.3.b.). For them, the reduction is partly due to banks tightening the supply of credit: between 2010 and 2013, on average 2.6 per cent of firms per year in the lowest quartile of leverage did not obtain the credit they applied for, compared with 18.0 per cent of the most heavily indebted.
Bank lending is still declining (down 3.1 per cent on an annual basis in September). The survey of manufacturing firms conducted by Istat indicates that demand for credit decreased in the first three quarters of 2014, a trend that had already
emerged in 2012 from the euro-area bank lending survey (Figure 2.3.c). The surveys also point to an easing of lending standards, which has helped to bring down the interest rates on new loans (-59 basis points in the twelve months to September) and the share of firms subject to credit rationing. Conditions of access to credit nonetheless remain difficult, particularly for small firms: in the third quarter 15.4 per
3 The time series of the debt-to-GDP ratio of non-financial firms was revised after the adoption of ESA 2010. Although the ratio decreases by about 3 percentage points as a result of the changes, its performance is not significantly different.
Debt diminishes among highly leveraged firms
Fewer firms apply for bank loans …
Figure 2.3
Indicators of corporate debt
(a) Debt (1) (millions of euros and per cent)
(b) Deleveraging and credit rationing(per cent)
(c) Credit demand and supply conditions(per cent and diffusion indices)
-60
-40
-20
0
20
40
1st 2nd 3rd 4th
Leverage quantiles (3)
60
65
70
75
80
85
1,200
1,225
1,250
1,275
1,300
1,325
2009 2010 2011 2012 2013 '14
356.2
Share of firms requesting credit (5)
Share of rationed firms (5)
BLS demand indicator (2)(6)
BLS supply indicator (2)(6)
Percentage change of financial debt 2007-12 Change in leverage 2007-12Share of rationed firms: average 2010-13 (4)
Financial debtFinancial debt/GDP (2) Share of bank debt (2)
-60
-40
-20
0
20
40
-0.4
-0.2
0.0
0.2
0.4
0.6
0
10
20
30
40
50
2011 2012 2013 2014 2011 2012 2013 2014
Demand Supply
Sources: Bank of Italy, Istat and Cerved Group.(1) Data for the non-financial corporate sector. The figures for the second quarter of 2014 are provisional. – (2) Right-hand scale. – (3) Leverage quartiles for a sample of more than 500,000 Cerved balance sheets for 2007; the 1st quartile includes non-indebted firms. For the share of rationed firms, annual leverage quartiles. – (4) Share of firms reporting they had applied for but not obtained credit. Data from the sample used in the Bank of Italy’s annual Survey of Industrial and Service Firms. – (5) Averages of monthly data recorded by Istat from a sample of manufacturing companies. The percentage of firms refused credit is calculated in respect of the total number of firms that contacted banks or finance companies in the 3 months prior to the survey. – (6) Quarterly data referring to Italian banks contacted as part of the Euro-Area Bank Lending Survey. Diffusion indices: positive values indicate an increase in demand or a reduction in supply.
BANCA D’ITALIA Financial Stability Report No. 2 / 2014 21
cent of firms with fewer than 50 employees were rationed, over one third higher than the percentage of large firms.
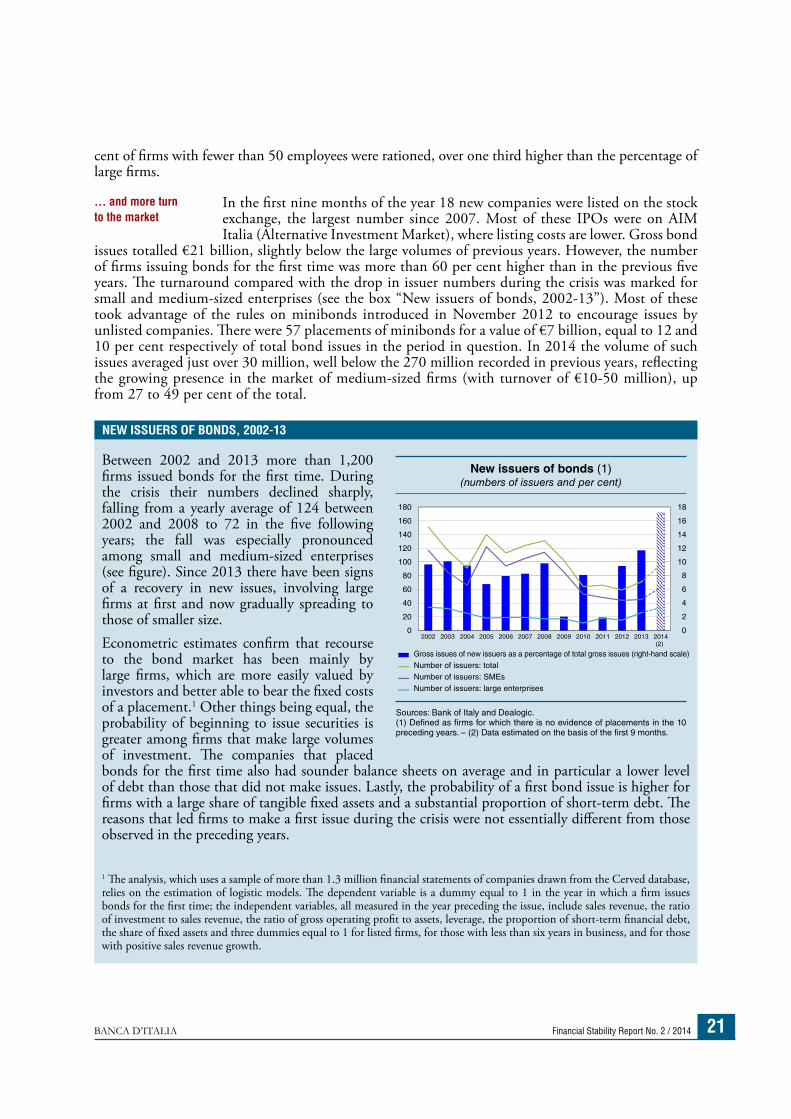
In the first nine months of the year 18 new companies were listed on the stock exchange, the largest number since 2007. Most of these IPOs were on AIM Italia (Alternative Investment Market), where listing costs are lower. Gross bond
issues totalled €21 billion, slightly below the large volumes of previous years. However, the number of firms issuing bonds for the first time was more than 60 per cent higher than in the previous five years. The turnaround compared with the drop in issuer numbers during the crisis was marked for small and medium-sized enterprises (see the box “New issuers of bonds, 2002-13”). Most of these took advantage of the rules on minibonds introduced in November 2012 to encourage issues by unlisted companies. There were 57 placements of minibonds for a value of €7 billion, equal to 12 and 10 per cent respectively of total bond issues in the period in question. In 2014 the volume of such issues averaged just over 30 million, well below the 270 million recorded in previous years, reflecting the growing presence in the market of medium-sized firms (with turnover of €10-50 million), up from 27 to 49 per cent of the total.
… and more turn to the market
NEW ISSUERS OF BONDS, 2002-13
Between 2002 and 2013 more than 1,200 firms issued bonds for the first time. During the crisis their numbers declined sharply, falling from a yearly average of 124 between 2002 and 2008 to 72 in the five following years; the fall was especially pronounced among small and medium-sized enterprises (see figure). Since 2013 there have been signs of a recovery in new issues, involving large firms at first and now gradually spreading to those of smaller size.Econometric estimates confirm that recourse to the bond market has been mainly by large firms, which are more easily valued by investors and better able to bear the fixed costs of a placement.1 Other things being equal, the probability of beginning to issue securities is greater among firms that make large volumes of investment. The companies that placed bonds for the first time also had sounder balance sheets on average and in particular a lower level of debt than those that did not make issues. Lastly, the probability of a first bond issue is higher for firms with a large share of tangible fixed assets and a substantial proportion of short-term debt. The reasons that led firms to make a first issue during the crisis were not essentially different from those observed in the preceding years.
1 The analysis, which uses a sample of more than 1.3 million financial statements of companies drawn from the Cerved database, relies on the estimation of logistic models. The dependent variable is a dummy equal to 1 in the year in which a firm issues bonds for the first time; the independent variables, all measured in the year preceding the issue, include sales revenue, the ratio of investment to sales revenue, the ratio of gross operating profit to assets, leverage, the proportion of short-term financial debt, the share of fixed assets and three dummies equal to 1 for listed firms, for those with less than six years in business, and for those with positive sales revenue growth.
New issuers of bonds (1)(numbers of issuers and per cent)
0
2
4
6
8
10
12
14
16
18
0
20
40
60
80
100
120
140
160
180
2002 2003 2004 2005 2006 2007 2008 2009 2010 2011 2012 2013 2014(2)
Gross issues of new issuers as a percentage of total gross issues (right-hand scale) Number of issuers: totalNumber of issuers: SMEs Number of issuers: large enterprises
Sources: Bank of Italy and Dealogic.(1) Defined as firms for which there is no evidence of placements in the 10 preceding years. – (2) Data estimated on the basis of the first 9 months.
Financial Stability Report No. 2 / 2014 BANCA D’ITALIA22
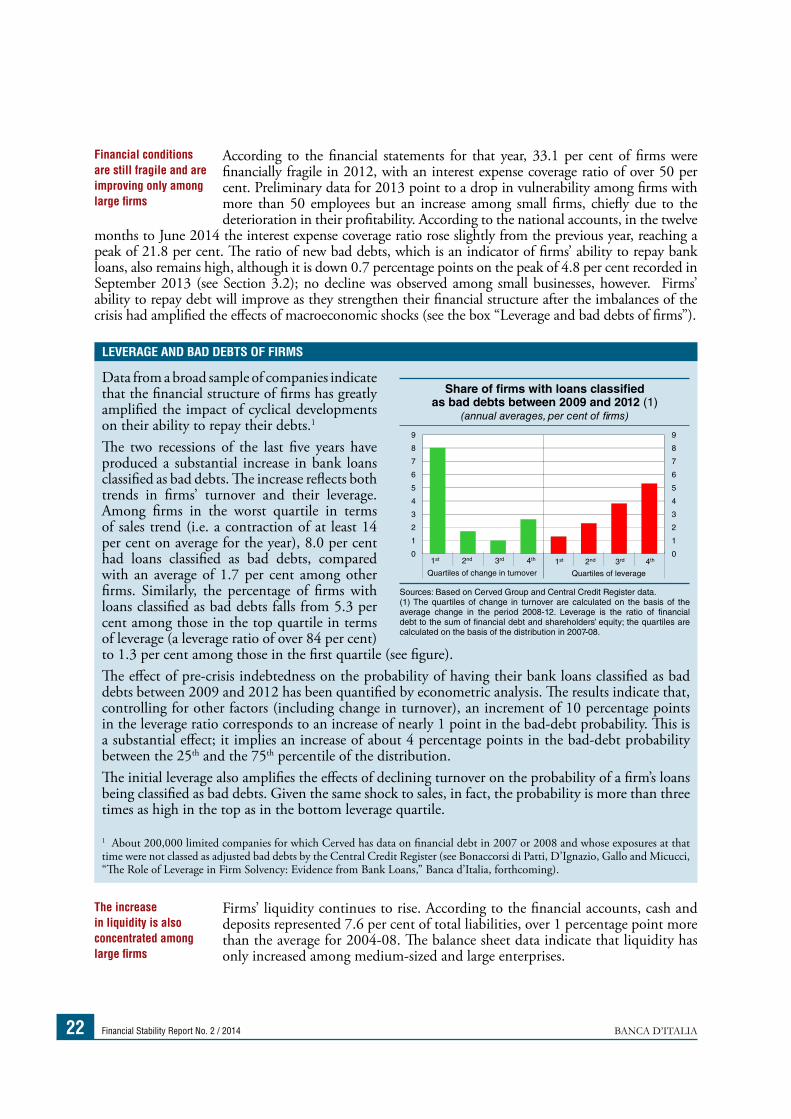
According to the financial statements for that year, 33.1 per cent of firms were financially fragile in 2012, with an interest expense coverage ratio of over 50 per cent. Preliminary data for 2013 point to a drop in vulnerability among firms with more than 50 employees but an increase among small firms, chiefly due to the deterioration in their profitability. According to the national accounts, in the twelve
months to June 2014 the interest expense coverage ratio rose slightly from the previous year, reaching a peak of 21.8 per cent. The ratio of new bad debts, which is an indicator of firms’ ability to repay bank loans, also remains high, although it is down 0.7 percentage points on the peak of 4.8 per cent recorded in September 2013 (see Section 3.2); no decline was observed among small businesses, however. Firms’ ability to repay debt will improve as they strengthen their financial structure after the imbalances of the crisis had amplified the effects of macroeconomic shocks (see the box “Leverage and bad debts of firms”).
Firms’ liquidity continues to rise. According to the financial accounts, cash and deposits represented 7.6 per cent of total liabilities, over 1 percentage point more than the average for 2004-08. The balance sheet data indicate that liquidity has only increased among medium-sized and large enterprises.
Financial conditions are still fragile and are improving only among large firms
The increase in liquidity is also concentrated among large firms
LEVERAGE AND BAD DEBTS OF FIRMS
Data from a broad sample of companies indicate that the financial structure of firms has greatly amplified the impact of cyclical developments on their ability to repay their debts.1
The two recessions of the last five years have produced a substantial increase in bank loans classified as bad debts. The increase reflects both trends in firms’ turnover and their leverage. Among firms in the worst quartile in terms of sales trend (i.e. a contraction of at least 14 per cent on average for the year), 8.0 per cent had loans classified as bad debts, compared with an average of 1.7 per cent among other firms. Similarly, the percentage of firms with loans classified as bad debts falls from 5.3 per cent among those in the top quartile in terms of leverage (a leverage ratio of over 84 per cent) to 1.3 per cent among those in the first quartile (see figure).The effect of pre-crisis indebtedness on the probability of having their bank loans classified as bad debts between 2009 and 2012 has been quantified by econometric analysis. The results indicate that, controlling for other factors (including change in turnover), an increment of 10 percentage points in the leverage ratio corresponds to an increase of nearly 1 point in the bad-debt probability. This is a substantial effect; it implies an increase of about 4 percentage points in the bad-debt probability between the 25th and the 75th percentile of the distribution.The initial leverage also amplifies the effects of declining turnover on the probability of a firm’s loans being classified as bad debts. Given the same shock to sales, in fact, the probability is more than three times as high in the top as in the bottom leverage quartile.
1 About 200,000 limited companies for which Cerved has data on financial debt in 2007 or 2008 and whose exposures at that time were not classed as adjusted bad debts by the Central Credit Register (see Bonaccorsi di Patti, D’Ignazio, Gallo and Micucci, “The Role of Leverage in Firm Solvency: Evidence from Bank Loans,” Banca d’Italia, forthcoming).
Share of firms with loans classified as bad debts between 2009 and 2012 (1)
(annual averages, per cent of firms)
0
1
2
3
4
5
6
7
8
9
0
1
2
3
4
5
6
7
8
9
1st 2nd 3rd 4th 1st 2nd 3rd 4th
Quartiles of change in turnover Quartiles of leverage
Sources: Based on Cerved Group and Central Credit Register data.(1) The quartiles of change in turnover are calculated on the basis of the average change in the period 2008-12. Leverage is the ratio of financial debt to the sum of financial debt and shareholders’ equity; the quartiles are calculated on the basis of the distribution in 2007-08.
BANCA D’ITALIA Financial Stability Report No. 2 / 2014 23
Several measures continue to support the access to credit and liquidity of small firms. In the first seven months of the year, the Central Guarantee Fund provided guarantees for loans amounting to €7.6 billion, equal to about 14 per cent of loans to non-financial companies for amounts up to €250,000 (a proxy for
lending to small enterprises). In September repayments of general government arrears under way since the summer of 2013 reached €31.3 billion, a little over half the amount set aside for 2013-14. The third moratorium signed by the Italian Banking Association and the main business associations allowing SMEs to request the suspension or extension of loan repayments will remain in force until December this year. The exclusion of firms with repayment irregularities from the last two moratoriums has greatly diminished the impact of the measure: in the ten months to July only €1.4 billion of capital repayments were suspended, equal to about one fifth and one half of the amounts recorded in the first and second moratoriums.
The continuing weakness of the economy is the main factor of risk for firms in the months to come. Unless a recovery gets under way, there seems little likelihood that financial conditions will improve significantly, especially for small firms and those producing for the home market. Firms are gradually returning to a balanced
financial structure, however, partly owing to the reduction in their debt and partly to increased recourse to the market by medium-sized and large enterprises. These tendencies make firms less financially vulnerable and place them in a better position to take advantage of future investment opportunities. Difficulties accessing credit are still a serious obstacle, above all for small and less capitalized firms.
Several measures are adopted to support SMEs’ access to credit
The main risk for firms is the weakness of the economy
Financial Stability Report No. 2 / 2014 BANCA D’ITALIA24
THE BANKING AND FINANCIAL SYSTEM33.1 THE ECB’S COMPREHENSIVE ASSESSMENT OF THE LEADING EURO-AREA BANKS’ BALANCE SHEETS
Methodology
The results of the comprehensive assessment of the balance sheets of the main euro-area banks (including Lithuania) were published on 26 October, in preparation for the launch of the Single Supervisory Mechanism (SSM) on 4 November. The exercise had three aims: to evaluate the actual health of the banks on the basis of common criteria; to quantify, if necessary, the capital strengthening
measures to be taken; and to release clear and comparable information to restore confidence in the European banking system.
The comprehensive assessment consisted in an asset quality review (AQR) and a stress test, conducted with reference to a baseline and an adverse macroeconomic scenario.1 The AQR applied common definitions to check the quality of the assets
held at the end of 2013. The analysis of credit portfolios verified the accuracy of loans’ classification in the performing and non-performing categories and the adequacy of the related provisions, taking account of the valuations of the collateral covering the exposures. In order to complete the exercise on schedule only a subset of assets was considered for each bank, selected from the riskiest portfolios. Sample performing and non-performing exposures were examined individually by the teams of inspectors. Overall value adjustments for each portfolio were then obtained using inferential techniques. Lastly, the adequacy of valuation adjustments on performing loans and exposures to retail customers (collective provisioning analysis) were analysed using a quantitative challenger model.
The stress test was severe compared with similar exercises conducted in the past. The value adjustments that emerged from the AQR were deducted from the value of the starting capital used as an input in the stress test; if large, they also led to a
worsening of the loss estimates provided by the banks for the stress test’s time horizon (2014-16), representing an innovative approach to supervisory practices.
The minimum amount of common equity tier 1 (CET1) capital required for all banks was set at 8.0 per cent of risk-weighted assets for both the AQR and the stress test’s baseline scenario. This requirement is higher than both the regulatory minimum (4.5 per cent) and the minimum augmented by the capital conservation buffer (7.0 per cent). Under the stress test’s adverse scenario the threshold was set
at 5.5 per cent, also higher than the regulatory minimum. Banks have six months from the publication of the results to cover any shortfalls resulting from the AQR or the baseline scenario of the stress test and nine months to cover shortfalls from the adverse scenario.
1 For a detailed description of the methodology see the Bank of Italy’s Technical note on the procedures for conducting the Comprehensive Assessment.
The ECB publishes the results of the comprehensive assessment …
… consisting in an asset quality review …
… and a severe stress test
The reference capital threshold varies according to the exercise
BANCA D’ITALIA Financial Stability Report No. 2 / 2014 25
The comprehensive assessment was essentially a prudential, not an accounting, exercise. In fact the reclassifications and value adjustments following the AQR were also partly based on financial indicators of possible difficulties of corporate borrowers; current accounting regulations instead prescribe that loan valuation adjustments be made following objective indications of a loss. Furthermore,
ample recourse was made to statistical methodologies not contemplated by accounting criteria. In their dealings with the supervisory authorities, the banks will evaluate the need to make any adjustments to their balance sheets on a case-by-case basis.
The main results for Italian banks
Fifteen Italian banks took part in the comprehensive assessment.2 Following the exercise, nine recorded capital shortfalls at the end of 2013 (Table 3.1, column D). Taking account of the capital increases made between January and September
2014, all the banks passed the AQR. The stress test, instead, showed potential capital needs for four banks totalling €3.3 billion.
2 Of these, 13 now fall directly within the perimeter of the SSM; Credito Valtellinese and Credito Emiliano, which according to the latest available data hold assets of under €30 billion, were classified among the less significant banks.
The comprehensive assessment is essentially a prudential exercise
All the Italian banks pass the AQR …
Table 3.1
Results of the Comprehensive Assessment for Italian banks(millions of euros and numbers of banks)
Results published by the ECB Excess/shortfall after
the AQR, including
main capital strengthening
measures (6)
Results including other capital strengthening measures
Excess/shortfall after the AQR (1)
Excess/shortfall
after the ST
baseline (2)
Excess/ shortfall
after the ST adverse
(3)
Min excess/
max shortfall
(4)
Main capital strengthening
measures (5)
Excess/shortfall, including
main capital strengthening
measures
Other capital strengthening
measures (7)
Final excess/ shortfall, including all capital
strengthening measures
A B C D = min(A,B,C) E F = D+E G = A+E H I = D+E+H
Banco Popolare -34 -693 -427 -693 1,756 1,063 1,722 120 1,183Banca Popolare dell'Emilia Romagna 162 149 -128 -128 759 631 921 0 631Banca Popolare di Milano -482 -647 -684 -684 518 -166 36 879 713Banca Popolare di Sondrio -148 -183 -318 -318 343 26 195 0 26Banca Popolare di Vicenza -119 -158 -682 -682 459 -223 340 253 30Carige -952 -1,321 -1,835 -1,835 1,021 -814 69 0 -814Credito Emiliano 463 480 599 463 0 463 463 0 463Credito Valtellinese -88 -197 -377 -377 415 38 327 12 50Iccrea 356 385 256 256 0 256 356 0 256Intesa Sanpaolo 10,548 9,419 8,724 8,724 1,756 10,480 12,304 417 10,897Mediobanca 205 600 445 205 0 205 205 560 765Monte dei Paschi di Siena -845 -1,516 -4,250 -4,250 2,139 -2,111 1,294 0 -2,111Unione di Banche Italiane 2,432 1,848 1,743 1,743 18 1,761 2,450 0 1,761UniCredit 6,451 6,167 5,580 5,580 1,235 6,815 7,686 1,932 8,747Veneto Banca -583 -574 -714 -714 738 24 155 0 24
Total:shortfalls (8) -3,251 -5,290 -9,413 -9,679 8,148 -3,313 0 1,132 -2,924excesses (8) 20,617 19,049 17,347 16,971 3,009 21,762 28,523 3,041 25,546Number of banks with shortfalls 9 4 0 2
Sources: Bank of Italy and the ECB’s Aggregate Report on the Comprehensive Assessment, October 2014.(1) Capital excess/shortfall with respect to the threshold of 8% for the CET1 ratio at 31/12/2013 (B8 in the template published by the ECB for banks with shortfalls). – (2) Excess/shortfall with respect to the threshold of 8% for the CET1 ratio at 31/12/2013 (B9 in the ECB template). – (3) Excess/shortfall with respect to the threshold of 5.5% for the CET1 ratio at 31/12/2013 (B10 in the ECB template). – (4) Minimum excess or maximum shortfall (between those resulting from the AQR, the baseline stress test scenario and the adverse stress test scenario) at 31/12/2013 (B11 in the ECB template). – (5) Main capital strengthening measures taken between January and September 2014 (sum of C1-C6 in the ECB template). – (6) Data taken directly from the results published by the ECB. – (7) Other capital strengthening measures decided in 2014, in addition to those outlined in Column E. – (8) The totals shown in Columns D, F, G and I cannot be obtained by applying the formulas indicated at the top of each column, which are valid only for the data on the individual banks.
Financial Stability Report No. 2 / 2014 BANCA D’ITALIA26
Taking account of other capital strengthening measures decided in the course of 2014 (mainly extraordinary asset divestments, the completion of the ongoing authorization procedures to use internal models, and the elimination of specific capital requirements), the potential shortfalls are reduced to €2.9 billion (0.2
per cent of Italy’s GDP) and concern two banks: Banca Carige and Banca Monte dei Paschi di Siena. For 13 banks there are capital surpluses of €25.5 billion. The two banks concerned have already submitted plans to the supervisory authorities to cover the shortfalls.
The data confirm the overall resilience of the Italian banking system, despite the severe strains of recent years: the global financial crisis, the sovereign debt tensions, and the prolonged recession in Italy.
The asset quality review
For the Italian banks the AQR resulted in asset value adjustments totalling €12.0 billion, against €47.5 billion
for European banks as a whole (Figure 3.1). Relative to the starting risk weighted assets, the adjustments come to 102 basis points, compared with an average of 56 basis points for the SSM banks (Table 3.2).
The difference is partly ascribable to the gaps in growth between the various countries: the value adjustments were on average higher for banks
… but the stress test called for two banks to strengthen capital
The aggregate results confirm the solidity of Italy’s banking system despite severe tensions
The amount of the value adjustments is relatively large …
Figure 3.1
Gross adjustments after the AQR (1)(billions of euros and per cent)
0.5
1.0
1.5
2.0
2.5
3.0
3.5
4.0
0
2
4
6
8
10
12
14
16
EL CY SI PT AT LV IT EE MT SK FI BE NL LT IE DE LU FR ES0.0
Billions As a percentage of starting RWA (2)
Source: ECB, Aggregate Report on the Comprehensive Assessment, October 2014.(1) Gross of tax effects. – (2) Right-hand scale
Table 3.2
Value adjustments after the AQR (1) (billions of euros and basis points)
Italian banks SSM banks
billions of euros
basis points (RWA)
billions of euros
basis points (RWA)
Value adjustments calculated with reference to:
Individually assessed positions (a) -4.4 -37 -16.4 -19
Projection of findings (b) -3.8 -33 -10.3 -12
Challenger model (c) -3.6 -30 -16.2 -19
Total adjustments calculated using statistical methods (b)+(c) -7.4 -63 -26.5 -31
Total adjustments on credit portfolios (d)=(a)+(b)+(c) -11.8 -100 -43.0 -51
Adjustments owing to the review of level 3 assets and CVA (e) 0 -2 -4.6 -5
Gross impact on capital (f)=(d)+(e) -12.0 -102 -47.5 -56
Tax and risk offset (g) 3.8 33 13.7 16
Net impact on capital (h)=(f)+(g) -8.2 -69 -33.8 -41
(1) The figures in basis points are calculated by relating the corresponding figures in billions to the risk weighted assets at the end of 2013. The credit valuation adjustments (CVA) are adjustments to the balance sheet values of the derivatives to take account of the possible default of the counterparties.
BANCA D’ITALIA Financial Stability Report No. 2 / 2014 27
in the countries that have recorded the worst economic performance since the outbreak of the economic crisis.3
The bulk of the value adjustment stems from the application of inferential methodologies (63 basis points for the Italian banks; 31 for all the SSM banks) (Table 3.2). For example, the challenger model, which was used to assess the
adequacy of collective provisioning on performing exposures, determined significantly higher value adjustments than those normally used under international accounting standards (IAS-IFRS), which do not allow the recognition of merely prudential items. For the Italian banks the share of value adjustments that emerges from the inspection of individual positions is comparable to that for SSM banks as a whole (37 basis points in terms of risk weighted assets out of a total of 102, against 19 basis points out of a total of 56 for all the SSM banks).
A portion of the value adjustments derives from the reclassification of performing to non-performing exposures.4 For the Italian banks these reclassifications came to 198 basis points in terms of risk weighted assets, against 201 basis points for all SSM banks (Table 3.3). For these, 120 basis points are ascribable to the outcome of the analysis of the banks’ positions, conducted both on an individual and a statistical basis, while the remaining 81 basis points were due to the adoption of
the new harmonized definition of non-performing exposures. For the Italian banks the reclassifications are instead almost entirely due to the first component. This partly reflects the use, for loan reclassification, of stricter balance sheet indicators for corporate borrowers than the accounting ones. The application of these criteria has influenced above all the assessment of exposures to Italian SMEs, whose balance sheets reveal on average low profitability and high indebtedness. By contrast, the adoption of the new harmonized definition of non-performing exposures did not affect the Italian banks.5 Overall, the stock of non-performing exposures according to the criteria adopted by the AQR rises by 18.3 per cent for the SSM banks, against 9.6 per cent for the Italian banks.
3 In numerous instances, positions classified as performing based on the data at 31 December 2013 were reclassified by the banks themselves during the summer months when the assets were inspected. 4 It is not possible to reconstruct this amount based on the data published by the ECB; in Table 3.2 it is distributed among the items “individually assessed positions” and “projection of findings.”5 See the box “Definition of non-performing exposures and forbearance in the EBA rules and the asset quality review”, Financial Stability Report, No. 1, 2014.
… and mostly reflects statistical valuations
Reclassifications to non-performing exposures are in line with those in the euro area
Table 3.3
Prudential reclassifications of positions from performing to non-performing exposures (billions of euros and basis points in terms of RWA)
Stock of non-
performing exposures
(end-2013 nat. definition)
New non-performing exposures Stock of non-performing exposures
(based on the AQR)Portion owing to new harmonized
definition
Portion owing to asset analysis
Total
billions billions basis points billions basis points billions basis points billions percentage change on 2013
SSM banks 743 55 81 81 120 136 201 879 18.3
Italian banks 198 0.4 4 18.6 194 19 198 217 9.6
Source: ECB, Aggregate Report on the Comprehensive Assessment, October 2014.
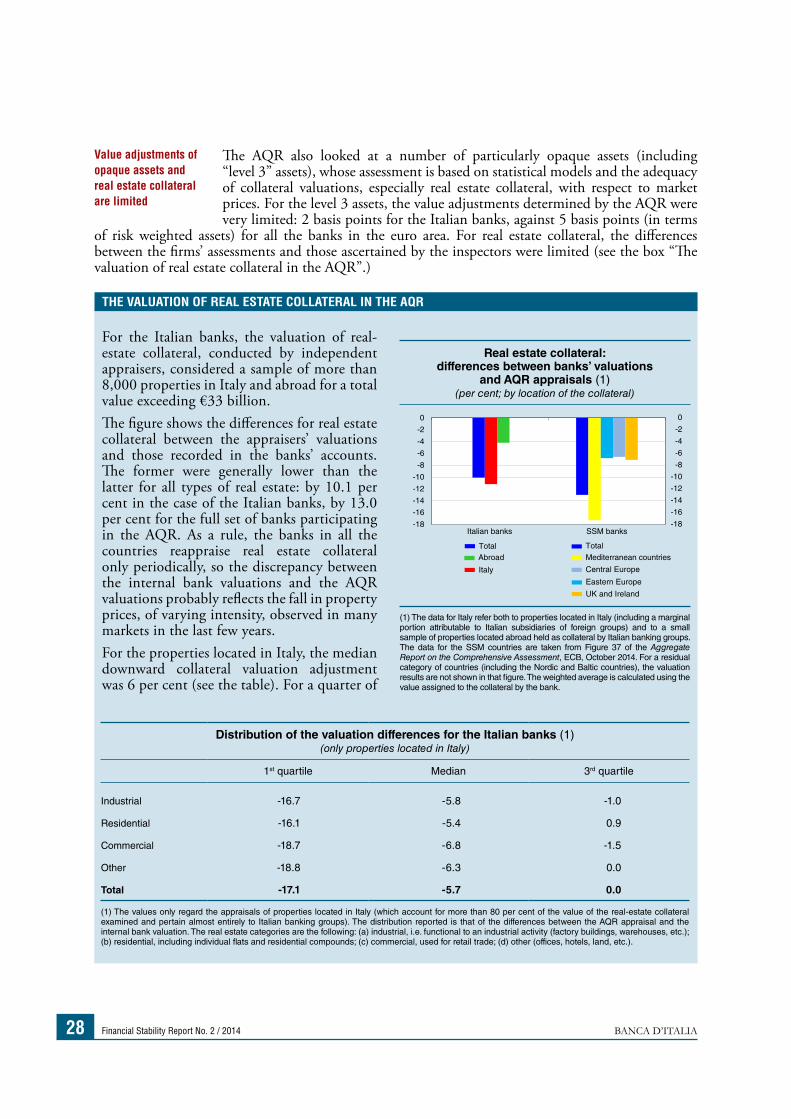
Financial Stability Report No. 2 / 2014 BANCA D’ITALIA28
The AQR also looked at a number of particularly opaque assets (including “level 3” assets), whose assessment is based on statistical models and the adequacy of collateral valuations, especially real estate collateral, with respect to market prices. For the level 3 assets, the value adjustments determined by the AQR were very limited: 2 basis points for the Italian banks, against 5 basis points (in terms
of risk weighted assets) for all the banks in the euro area. For real estate collateral, the differences between the firms’ assessments and those ascertained by the inspectors were limited (see the box “The valuation of real estate collateral in the AQR”.)
Value adjustments of opaque assets and real estate collateral are limited
For the Italian banks, the valuation of real-estate collateral, conducted by independent appraisers, considered a sample of more than 8,000 properties in Italy and abroad for a total value exceeding €33 billion.The figure shows the differences for real estate collateral between the appraisers’ valuations and those recorded in the banks’ accounts. The former were generally lower than the latter for all types of real estate: by 10.1 per cent in the case of the Italian banks, by 13.0 per cent for the full set of banks participating in the AQR. As a rule, the banks in all the countries reappraise real estate collateral only periodically, so the discrepancy between the internal bank valuations and the AQR valuations probably reflects the fall in property prices, of varying intensity, observed in many markets in the last few years.For the properties located in Italy, the median downward collateral valuation adjustment was 6 per cent (see the table). For a quarter of
THE VALUATION OF REAL ESTATE COLLATERAL IN THE AQR
Distribution of the valuation differences for the Italian banks (1)(only properties located in Italy)
1st quartile Median 3rd quartile
Industrial -16.7 -5.8 -1.0
Residential -16.1 -5.4 0.9
Commercial -18.7 -6.8 -1.5
Other -18.8 -6.3 0.0
Total -17.1 -5.7 0.0
(1) The values only regard the appraisals of properties located in Italy (which account for more than 80 per cent of the value of the real-estate collateral examined and pertain almost entirely to Italian banking groups). The distribution reported is that of the differences between the AQR appraisal and the internal bank valuation. The real estate categories are the following: (a) industrial, i.e. functional to an industrial activity (factory buildings, warehouses, etc.); (b) residential, including individual flats and residential compounds; (c) commercial, used for retail trade; (d) other (offices, hotels, land, etc.).
Real estate collateral: differences between banks’ valuations
and AQR appraisals (1)(per cent; by location of the collateral)
-18
-16
-14
-12
-10
-8
-6
-4
-2
0
Italian banks SSM banks
Total
Italy
Abroad Mediterranean countries
Eastern Europe
Central Europe
UK and Ireland
-18
-16
-14
-12
-10
-8
-6
-4
-2
0
Total
(1) The data for Italy refer both to properties located in Italy (including a marginal portion attributable to Italian subsidiaries of foreign groups) and to a small sample of properties located abroad held as collateral by Italian banking groups. The data for the SSM countries are taken from Figure 37 of the Aggregate Report on the Comprehensive Assessment, ECB, October 2014. For a residual category of countries (including the Nordic and Baltic countries), the valuation results are not shown in that figure. The weighted average is calculated using the value assigned to the collateral by the bank.
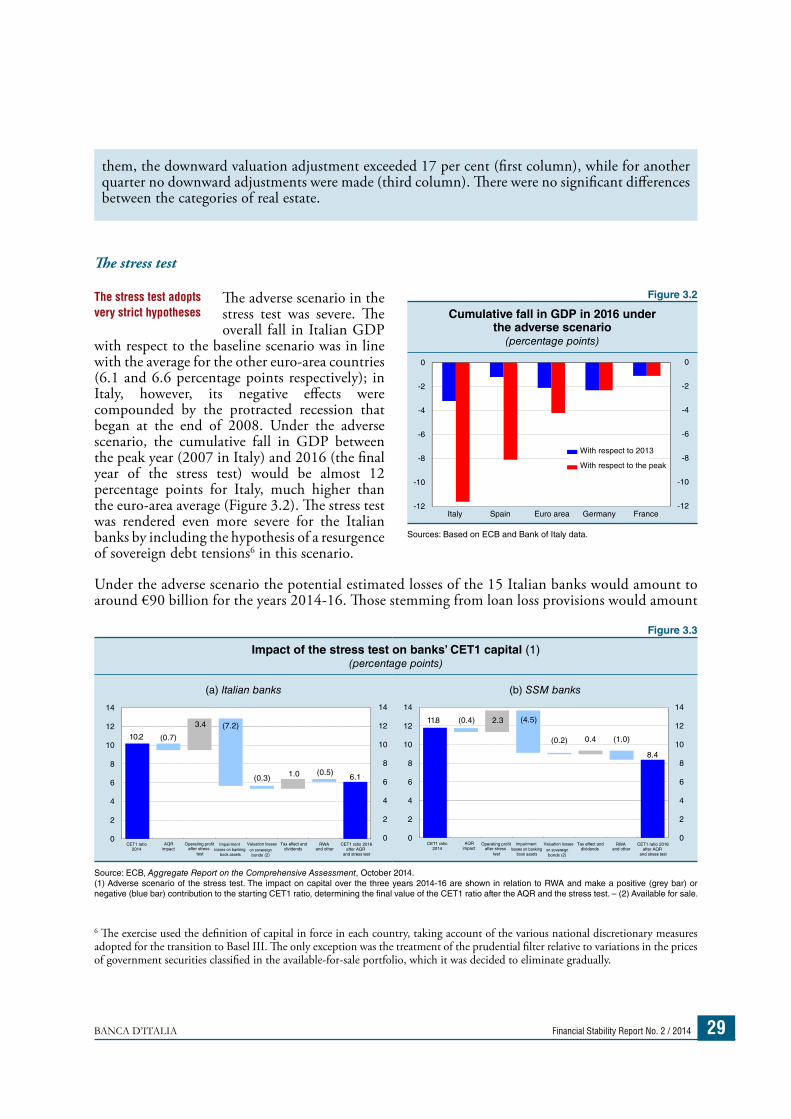
BANCA D’ITALIA Financial Stability Report No. 2 / 2014 29
The stress test
The adverse scenario in the stress test was severe. The overall fall in Italian GDP
with respect to the baseline scenario was in line with the average for the other euro-area countries (6.1 and 6.6 percentage points respectively); in Italy, however, its negative effects were compounded by the protracted recession that began at the end of 2008. Under the adverse scenario, the cumulative fall in GDP between the peak year (2007 in Italy) and 2016 (the final year of the stress test) would be almost 12 percentage points for Italy, much higher than the euro-area average (Figure 3.2). The stress test was rendered even more severe for the Italian banks by including the hypothesis of a resurgence of sovereign debt tensions6 in this scenario.
Under the adverse scenario the potential estimated losses of the 15 Italian banks would amount to around €90 billion for the years 2014-16. Those stemming from loan loss provisions would amount
6 The exercise used the definition of capital in force in each country, taking account of the various national discretionary measures adopted for the transition to Basel III. The only exception was the treatment of the prudential filter relative to variations in the prices of government securities classified in the available-for-sale portfolio, which it was decided to eliminate gradually.
The stress test adopts very strict hypotheses
Figure 3.2
Cumulative fall in GDP in 2016 under the adverse scenario
(percentage points)
-12
-10
-8
-6
-4
-2
0
Italy Spain Euro area Germany France
With respect to 2013
With respect to the peak
-12
-10
-8
-6
-4
-2
0
Sources: Based on ECB and Bank of Italy data.
Figure 3.3
Impact of the stress test on banks’ CET1 capital (1)(percentage points)
(a) Italian banks (b) SSM banks
11.8 (0.4) 2.3 (4.5)
(0.2) 0.4 (1.0)
8.4
0
2
4
6
8
10
12
14
10.2 (0.7)
3.4 (7.2)
(0.3) 1.0 (0.5)6.1
0
2
4
6
8
10
12
14
CET1 ratio2014
AQRimpact
Operating profitafter stress
test
Valuation losseson sovereign bonds (2)
Tax effect anddividends
RWAand other
CET1 ratio 2016after AQR
and stress test
0
2
4
6
8
10
12
14
0
2
4
6
8
10
12
14
CET1 ratio2014
AQRimpact
Operating profitafter stress
test
Impairment losses on banking
book assets
Valuation losseson sovereign bonds (2)
Tax effect anddividends
RWAand other
CET1 ratio 2016after AQR
and stress test
Impairment losses on banking
book assets
Source: ECB, Aggregate Report on the Comprehensive Assessment, October 2014.(1) Adverse scenario of the stress test. The impact on capital over the three years 2014-16 are shown in relation to RWA and make a positive (grey bar) or negative (blue bar) contribution to the starting CET1 ratio, determining the final value of the CET1 ratio after the AQR and the stress test. – (2) Available for sale.
them, the downward valuation adjustment exceeded 17 per cent (first column), while for another quarter no downward adjustments were made (third column). There were no significant differences between the categories of real estate.
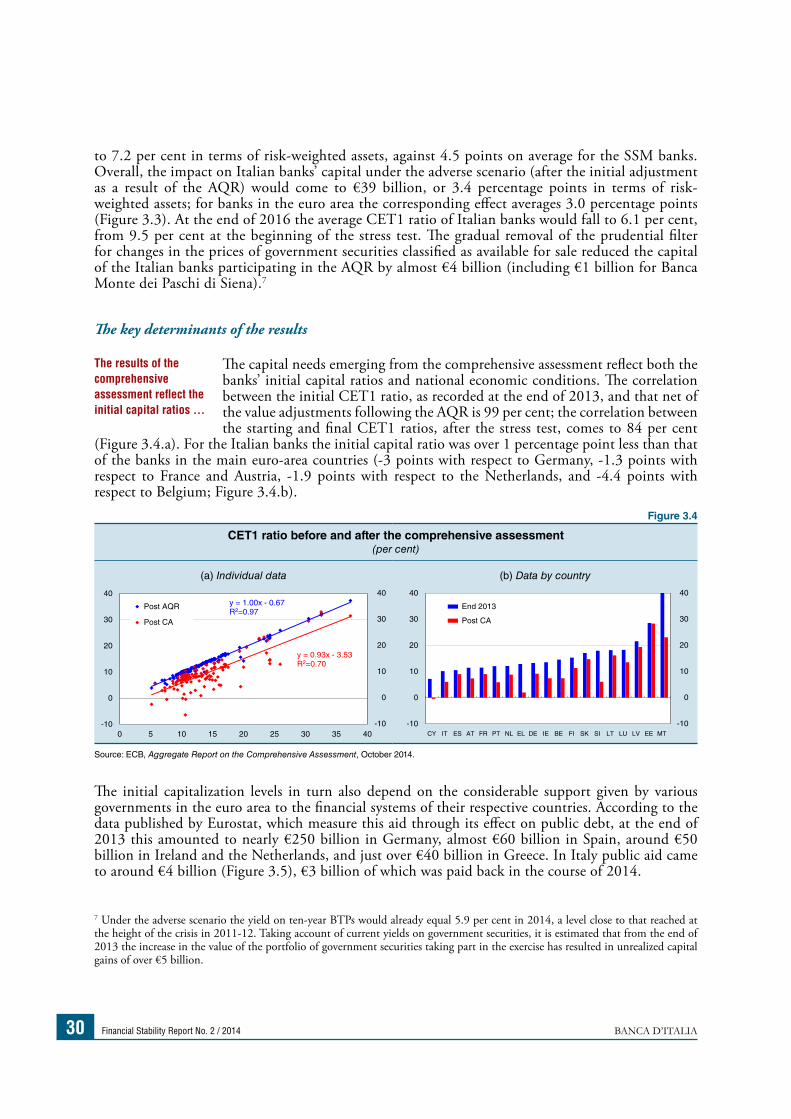
Financial Stability Report No. 2 / 2014 BANCA D’ITALIA30
to 7.2 per cent in terms of risk-weighted assets, against 4.5 points on average for the SSM banks. Overall, the impact on Italian banks’ capital under the adverse scenario (after the initial adjustment as a result of the AQR) would come to €39 billion, or 3.4 percentage points in terms of risk-weighted assets; for banks in the euro area the corresponding effect averages 3.0 percentage points (Figure 3.3). At the end of 2016 the average CET1 ratio of Italian banks would fall to 6.1 per cent, from 9.5 per cent at the beginning of the stress test. The gradual removal of the prudential filter for changes in the prices of government securities classified as available for sale reduced the capital of the Italian banks participating in the AQR by almost €4 billion (including €1 billion for Banca Monte dei Paschi di Siena).7
The key determinants of the results
The capital needs emerging from the comprehensive assessment reflect both the banks’ initial capital ratios and national economic conditions. The correlation between the initial CET1 ratio, as recorded at the end of 2013, and that net of the value adjustments following the AQR is 99 per cent; the correlation between the starting and final CET1 ratios, after the stress test, comes to 84 per cent
(Figure 3.4.a). For the Italian banks the initial capital ratio was over 1 percentage point less than that of the banks in the main euro-area countries (-3 points with respect to Germany, -1.3 points with respect to France and Austria, -1.9 points with respect to the Netherlands, and -4.4 points with respect to Belgium; Figure 3.4.b).
The initial capitalization levels in turn also depend on the considerable support given by various governments in the euro area to the financial systems of their respective countries. According to the data published by Eurostat, which measure this aid through its effect on public debt, at the end of 2013 this amounted to nearly €250 billion in Germany, almost €60 billion in Spain, around €50 billion in Ireland and the Netherlands, and just over €40 billion in Greece. In Italy public aid came to around €4 billion (Figure 3.5), €3 billion of which was paid back in the course of 2014.
7 Under the adverse scenario the yield on ten-year BTPs would already equal 5.9 per cent in 2014, a level close to that reached at the height of the crisis in 2011-12. Taking account of current yields on government securities, it is estimated that from the end of 2013 the increase in the value of the portfolio of government securities taking part in the exercise has resulted in unrealized capital gains of over €5 billion.
The results of the comprehensive assessment reflect the initial capital ratios …
Figure 3.4
CET1 ratio before and after the comprehensive assessment(per cent)
(a) Individual data (b) Data by country
-10
0
10
20
30
40
CY IT ES AT FR PT NL EL DE IE BE FI SK SI LT LU LV EE MT
End 2013
Post CA
y = 1.00x - 0.67R2=0.97
y = 0.93x - 3.53R2=0.70
-10
0
10
20
30
40
0 5 10 15 20 25 30 35 40
Post AQR
Post CA
-10
0
10
20
30
40
-10
0
10
20
30
40
Source: ECB, Aggregate Report on the Comprehensive Assessment, October 2014.
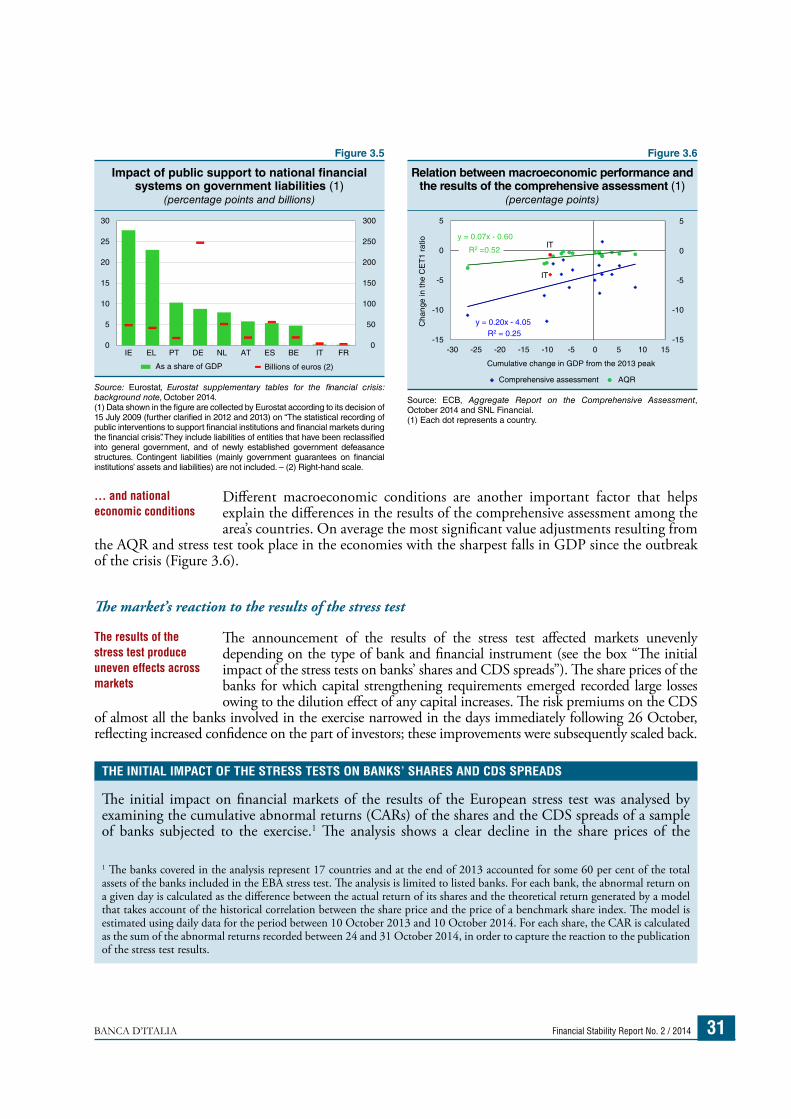
BANCA D’ITALIA Financial Stability Report No. 2 / 2014 31
Different macroeconomic conditions are another important factor that helps explain the differences in the results of the comprehensive assessment among the area’s countries. On average the most significant value adjustments resulting from
the AQR and stress test took place in the economies with the sharpest falls in GDP since the outbreak of the crisis (Figure 3.6).
The market’s reaction to the results of the stress test
The announcement of the results of the stress test affected markets unevenly depending on the type of bank and financial instrument (see the box “The initial impact of the stress tests on banks’ shares and CDS spreads”). The share prices of the banks for which capital strengthening requirements emerged recorded large losses owing to the dilution effect of any capital increases. The risk premiums on the CDS
of almost all the banks involved in the exercise narrowed in the days immediately following 26 October, reflecting increased confidence on the part of investors; these improvements were subsequently scaled back.
… and national economic conditions
The results of the stress test produce uneven effects across markets
Figure 3.5
Impact of public support to national financial systems on government liabilities (1)
(percentage points and billions)
0
50
100
150
200
250
300
0
5
10
15
20
25
30
IE EL PT DE NL AT ES BE IT FR
As a share of GDP Billions of euros (2)
Source: Eurostat, Eurostat supplementary tables for the financial crisis: background note, October 2014.(1) Data shown in the figure are collected by Eurostat according to its decision of 15 July 2009 (further clarified in 2012 and 2013) on “The statistical recording of public interventions to support financial institutions and financial markets during the financial crisis”. They include liabilities of entities that have been reclassified into general government, and of newly established government defeasance structures. Contingent liabilities (mainly government guarantees on financial institutions’ assets and liabilities) are not included. – (2) Right-hand scale.
Figure 3.6
Relation between macroeconomic performance and the results of the comprehensive assessment (1)
(percentage points)
IT
IT
-15
-10
-5
0
5
-15
-10
-5
0
5
15-30 -25 -20 -15 -10 -5 0 5 10
Comprehensive assessment AQR
Cha
nge
in th
e C
ET
1 ra
tio
y = 0.07x - 0.60
R2 =0.52
y = 0.20x - 4.05R2 = 0.25
Cumulative change in GDP from the 2013 peak
Source: ECB, Aggregate Report on the Comprehensive Assessment, October 2014 and SNL Financial. (1) Each dot represents a country.
The initial impact on financial markets of the results of the European stress test was analysed by examining the cumulative abnormal returns (CARs) of the shares and the CDS spreads of a sample of banks subjected to the exercise.1 The analysis shows a clear decline in the share prices of the
1 The banks covered in the analysis represent 17 countries and at the end of 2013 accounted for some 60 per cent of the total assets of the banks included in the EBA stress test. The analysis is limited to listed banks. For each bank, the abnormal return on a given day is calculated as the difference between the actual return of its shares and the theoretical return generated by a model that takes account of the historical correlation between the share price and the price of a benchmark share index. The model is estimated using daily data for the period between 10 October 2013 and 10 October 2014. For each share, the CAR is calculated as the sum of the abnormal returns recorded between 24 and 31 October 2014, in order to capture the reaction to the publication of the stress test results.
THE INITIAL IMPACT OF THE STRESS TESTS ON BANKS’ SHARES AND CDS SPREADS
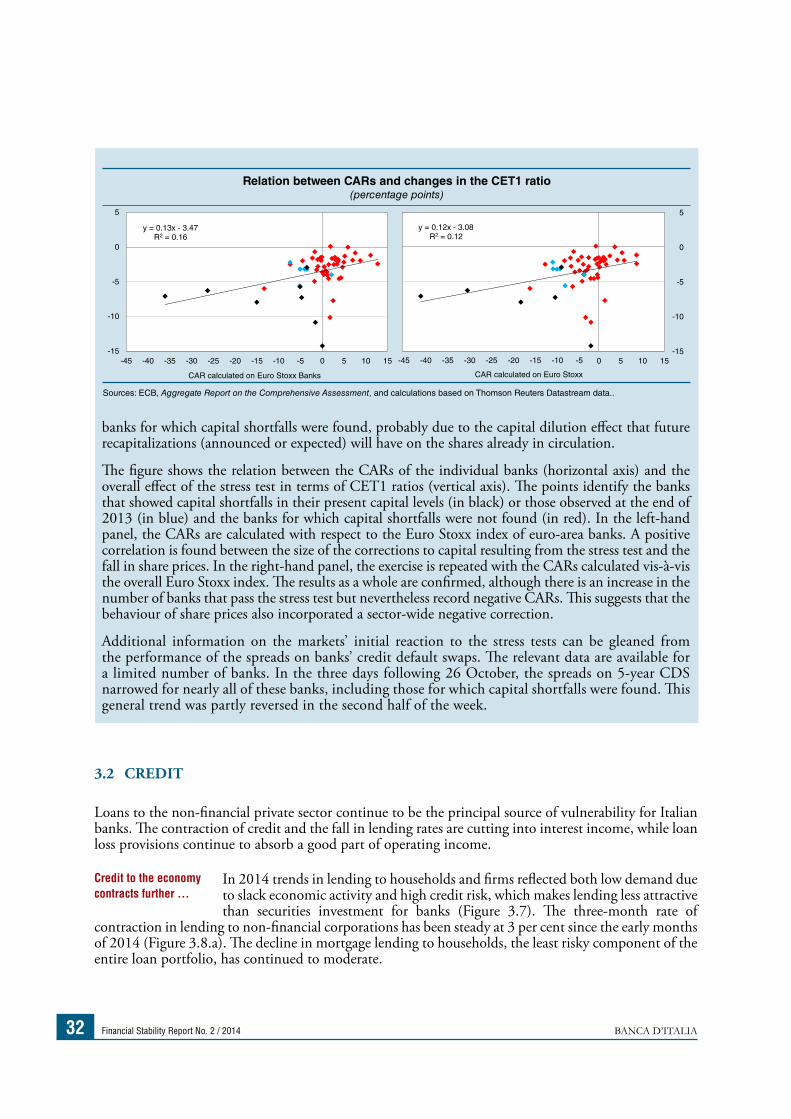
Financial Stability Report No. 2 / 2014 BANCA D’ITALIA32
3.2 CREDIT
Loans to the non-financial private sector continue to be the principal source of vulnerability for Italian banks. The contraction of credit and the fall in lending rates are cutting into interest income, while loan loss provisions continue to absorb a good part of operating income.
In 2014 trends in lending to households and firms reflected both low demand due to slack economic activity and high credit risk, which makes lending less attractive than securities investment for banks (Figure 3.7). The three-month rate of
contraction in lending to non-financial corporations has been steady at 3 per cent since the early months of 2014 (Figure 3.8.a). The decline in mortgage lending to households, the least risky component of the entire loan portfolio, has continued to moderate.
Credit to the economy contracts further …
Relation between CARs and changes in the CET1 ratio(percentage points)
y = 0.12x - 3.08R2 = 0.12
0 5 10 15-45 -40 -35 -30 -25 -20 -15 -10 -5
CAR calculated on Euro Stoxx
y = 0.13x - 3.47R2 = 0.16
-15
-10
-5
0
5
-45 -40 -35 -30 -25 -20 -15 -10 -5 0 5 10 15
CAR calculated on Euro Stoxx Banks
-15
-10
-5
0
5
Sources: ECB, Aggregate Report on the Comprehensive Assessment, and calculations based on Thomson Reuters Datastream data..
banks for which capital shortfalls were found, probably due to the capital dilution effect that future recapitalizations (announced or expected) will have on the shares already in circulation.
The figure shows the relation between the CARs of the individual banks (horizontal axis) and the overall effect of the stress test in terms of CET1 ratios (vertical axis). The points identify the banks that showed capital shortfalls in their present capital levels (in black) or those observed at the end of 2013 (in blue) and the banks for which capital shortfalls were not found (in red). In the left-hand panel, the CARs are calculated with respect to the Euro Stoxx index of euro-area banks. A positive correlation is found between the size of the corrections to capital resulting from the stress test and the fall in share prices. In the right-hand panel, the exercise is repeated with the CARs calculated vis-à-vis the overall Euro Stoxx index. The results as a whole are confirmed, although there is an increase in the number of banks that pass the stress test but nevertheless record negative CARs. This suggests that the behaviour of share prices also incorporated a sector-wide negative correction.
Additional information on the markets’ initial reaction to the stress tests can be gleaned from the performance of the spreads on banks’ credit default swaps. The relevant data are available for a limited number of banks. In the three days following 26 October, the spreads on 5-year CDS narrowed for nearly all of these banks, including those for which capital shortfalls were found. This general trend was partly reversed in the second half of the week.
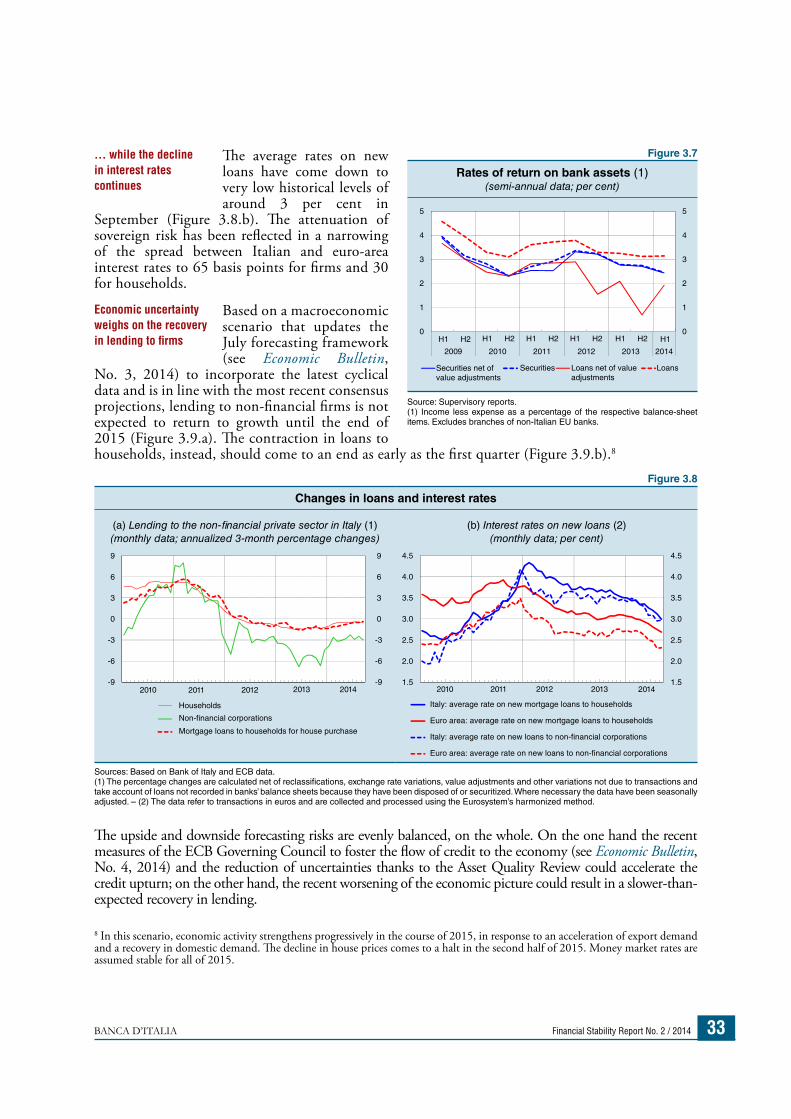
BANCA D’ITALIA Financial Stability Report No. 2 / 2014 33
The average rates on new loans have come down to very low historical levels of around 3 per cent in
September (Figure 3.8.b). The attenuation of sovereign risk has been reflected in a narrowing of the spread between Italian and euro-area interest rates to 65 basis points for firms and 30 for households.
Based on a macroeconomic scenario that updates the July forecasting framework (see Economic Bulletin,
No. 3, 2014) to incorporate the latest cyclical data and is in line with the most recent consensus projections, lending to non-financial firms is not expected to return to growth until the end of 2015 (Figure 3.9.a). The contraction in loans to households, instead, should come to an end as early as the first quarter (Figure 3.9.b).8
The upside and downside forecasting risks are evenly balanced, on the whole. On the one hand the recent measures of the ECB Governing Council to foster the flow of credit to the economy (see Economic Bulletin, No. 4, 2014) and the reduction of uncertainties thanks to the Asset Quality Review could accelerate the credit upturn; on the other hand, the recent worsening of the economic picture could result in a slower-than-expected recovery in lending.
8 In this scenario, economic activity strengthens progressively in the course of 2015, in response to an acceleration of export demand and a recovery in domestic demand. The decline in house prices comes to a halt in the second half of 2015. Money market rates are assumed stable for all of 2015.
… while the decline in interest rates continues
Economic uncertainty weighs on the recovery in lending to firms
Figure 3.8
Changes in loans and interest rates
(a) Lending to the non-financial private sector in Italy (1) (monthly data; annualized 3-month percentage changes)
(b) Interest rates on new loans (2) (monthly data; per cent)
2010 2011 2012 2013 20141.5
2.0
2.5
3.0
3.5
4.0
4.5
1.5
2.0
2.5
3.0
3.5
4.0
4.5
2010 2011 2012 2013 2014
0
3
6
9
-9
-6
-3
0
3
6
9
Italy: average rate on new mortgage loans to households
Euro area: average rate on new mortgage loans to households
Italy: average rate on new loans to non-financial corporations
Euro area: average rate on new loans to non-financial corporations
Households
Non-financial corporations
Mortgage loans to households for house purchase
-9
-6
-3
Sources: Based on Bank of Italy and ECB data.(1) The percentage changes are calculated net of reclassifications, exchange rate variations, value adjustments and other variations not due to transactions and take account of loans not recorded in banks’ balance sheets because they have been disposed of or securitized. Where necessary the data have been seasonally adjusted. – (2) The data refer to transactions in euros and are collected and processed using the Eurosystem’s harmonized method.
Figure 3.7
Rates of return on bank assets (1)(semi-annual data; per cent)
0
1
2
3
4
5
H1 H2 H1
2009 2010 2011 2012 2013 2014
0
1
2
3
4
5
Securities net of value adjustments
Securities Loans net of value adjustments
Loans
H1 H2 H1 H2 H1 H2 H1 H2
Source: Supervisory reports.(1) Income less expense as a percentage of the respective balance-sheet items. Excludes branches of non-Italian EU banks.
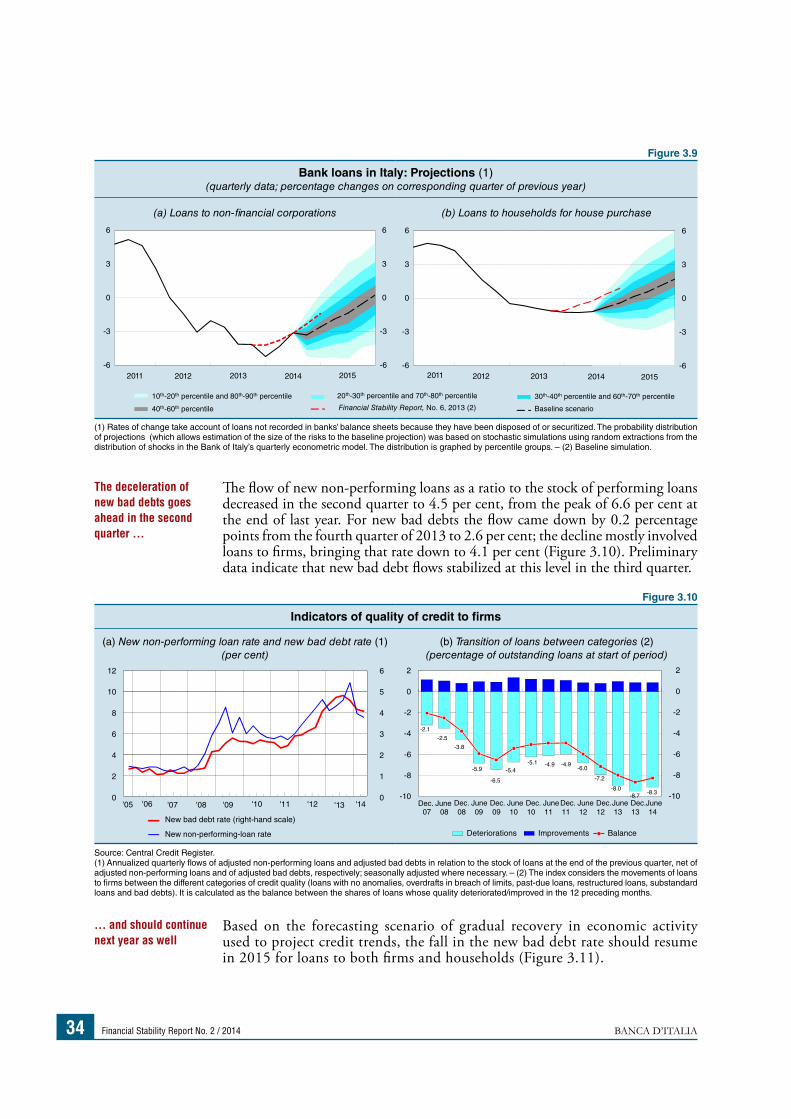
Financial Stability Report No. 2 / 2014 BANCA D’ITALIA34
The flow of new non-performing loans as a ratio to the stock of performing loans decreased in the second quarter to 4.5 per cent, from the peak of 6.6 per cent at the end of last year. For new bad debts the flow came down by 0.2 percentage points from the fourth quarter of 2013 to 2.6 per cent; the decline mostly involved loans to firms, bringing that rate down to 4.1 per cent (Figure 3.10). Preliminary data indicate that new bad debt flows stabilized at this level in the third quarter.
Based on the forecasting scenario of gradual recovery in economic activity used to project credit trends, the fall in the new bad debt rate should resume in 2015 for loans to both firms and households (Figure 3.11).
The deceleration of new bad debts goes ahead in the second quarter …
… and should continue next year as well
Figure 3.9
Bank loans in Italy: Projections (1)(quarterly data; percentage changes on corresponding quarter of previous year)
(a) Loans to non-financial corporations (b) Loans to households for house purchase
2011 20152012 2013 2014-6
-3
0
3
6
2011 20152012 2013 2014-6
-3
0
3
6
-6
-3
0
3
6
10th-20th percentile and 80th-90th percentile
40th-60th percentile
20th-30th percentile and 70th-80th percentile
Financial Stability Report, No. 6, 2013 (2)
30th-40th percentile and 60th-70th percentile
Baseline scenario
-6
-3
0
3
6
(1) Rates of change take account of loans not recorded in banks’ balance sheets because they have been disposed of or securitized. The probability distribution of projections (which allows estimation of the size of the risks to the baseline projection) was based on stochastic simulations using random extractions from the distribution of shocks in the Bank of Italy’s quarterly econometric model. The distribution is graphed by percentile groups. – (2) Baseline simulation.
Figure 3.10
Indicators of quality of credit to firms
(a) New non-performing loan rate and new bad debt rate (1)(per cent)
(b) Transition of loans between categories (2) (percentage of outstanding loans at start of period)
'05 '06 '13 '140
2
4
6
8
10
12
0
1
2
3
4
5
6
'07 '08 '09 '10 '11 '12
New bad debt rate (right-hand scale)
New non-performing-loan rate
-2.1
-2.5
-3.8
-5.9
-6.5
-5.4-4.9 -4.9
-6.0
-7.2
-8.0
-10
-8
-6
-4
-2
0
2
Dec.07
June08 08 09 09 10 10 11 11 12 12 13 13 14
Deteriorations Improvements Balance
-10
-8
-6
-4
-2
0
2
-5.1
-8.7 -8.3
Dec. June Dec. June Dec. June Dec. June Dec. June Dec.June
Source: Central Credit Register.(1) Annualized quarterly flows of adjusted non-performing loans and adjusted bad debts in relation to the stock of loans at the end of the previous quarter, net of adjusted non-performing loans and of adjusted bad debts, respectively; seasonally adjusted where necessary. – (2) The index considers the movements of loans to firms between the different categories of credit quality (loans with no anomalies, overdrafts in breach of limits, past-due loans, restructured loans, substandard loans and bad debts). It is calculated as the balance between the shares of loans whose quality deteriorated/improved in the 12 preceding months.
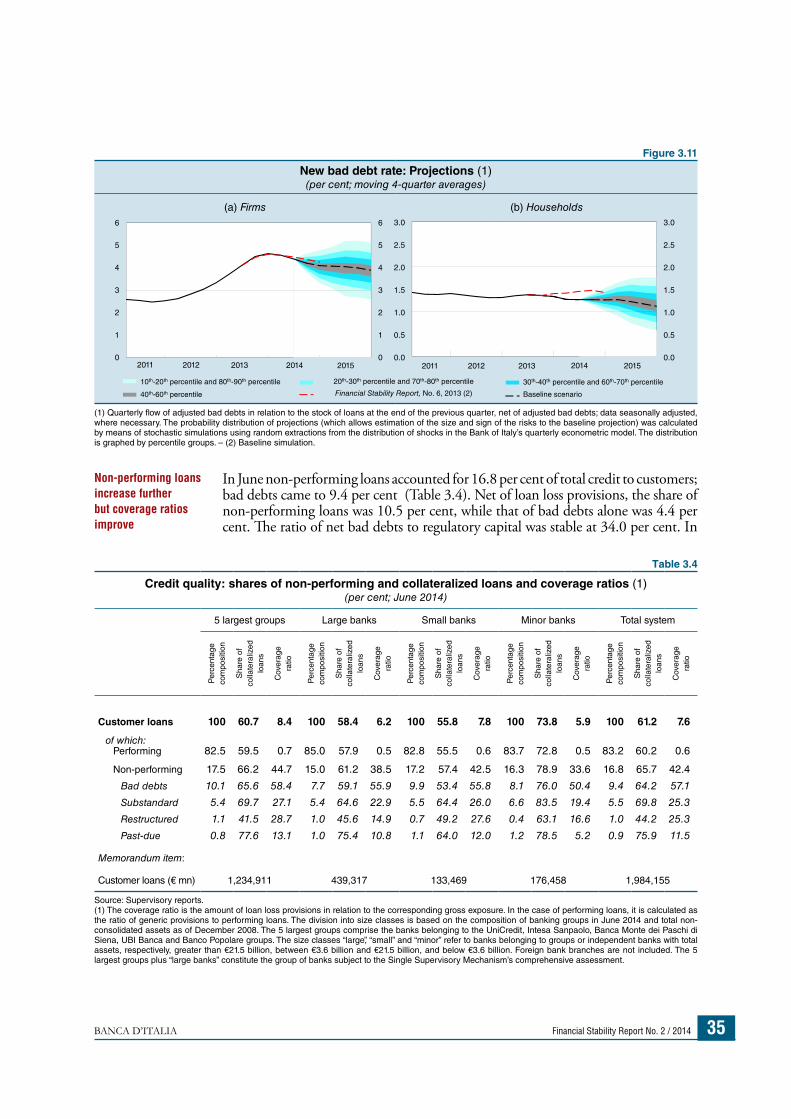
BANCA D’ITALIA Financial Stability Report No. 2 / 2014 35
Figure 3.11
New bad debt rate: Projections (1)(per cent; moving 4-quarter averages)
(a) Firms (b) Households
10th-20th percentile and 80th-90th percentile
40th-60th percentile
20th-30th percentile and 70th-80th percentile
Financial Stability Report, No. 6, 2013 (2)
30th-40th percentile and 60th-70th percentile
Baseline scenario
2011 2012 2013 2014 20150.0
0.5
1.0
1.5
2.0
2.5
3.0
0.0
0.5
1.0
1.5
2.0
2.5
3.0
2012 2013 20140
1
2
3
4
5
6
0
1
2
3
4
5
6
2011 2015
(1) Quarterly flow of adjusted bad debts in relation to the stock of loans at the end of the previous quarter, net of adjusted bad debts; data seasonally adjusted, where necessary. The probability distribution of projections (which allows estimation of the size and sign of the risks to the baseline projection) was calculated by means of stochastic simulations using random extractions from the distribution of shocks in the Bank of Italy’s quarterly econometric model. The distribution is graphed by percentile groups. – (2) Baseline simulation.
Table 3.4
Credit quality: shares of non-performing and collateralized loans and coverage ratios (1)(per cent; June 2014)
5 largest groups Large banks Small banks Minor banks Total system
Per
cent
age
com
posi
tion
Sha
re o
f co
llate
raliz
ed
loan
s
Cov
erag
e ra
tio
Per
cent
age
com
posi
tion
Sha
re o
f co
llate
raliz
ed
loan
s
Cov
erag
e ra
tio
Per
cent
age
com
posi
tion
Sha
re o
f co
llate
raliz
ed
loan
s
Cov
erag
e ra
tio
Per
cent
age
com
posi
tion
Sha
re o
f co
llate
raliz
ed
loan
s
Cov
erag
e ra
tio
Per
cent
age
com
posi
tion
Sha
re o
f co
llate
raliz
ed
loan
s
Cov
erag
e ra
tio
Customer loans 100 60.7 8.4 100 58.4 6.2 100 55.8 7.8 100 73.8 5.9 100 61.2 7.6
of which:Performing 82.5 59.5 0.7 85.0 57.9 0.5 82.8 55.5 0.6 83.7 72.8 0.5 83.2 60.2 0.6
Non-performing 17.5 66.2 44.7 15.0 61.2 38.5 17.2 57.4 42.5 16.3 78.9 33.6 16.8 65.7 42.4
Bad debts 10.1 65.6 58.4 7.7 59.1 55.9 9.9 53.4 55.8 8.1 76.0 50.4 9.4 64.2 57.1
Substandard 5.4 69.7 27.1 5.4 64.6 22.9 5.5 64.4 26.0 6.6 83.5 19.4 5.5 69.8 25.3
Restructured 1.1 41.5 28.7 1.0 45.6 14.9 0.7 49.2 27.6 0.4 63.1 16.6 1.0 44.2 25.3
Past-due 0.8 77.6 13.1 1.0 75.4 10.8 1.1 64.0 12.0 1.2 78.5 5.2 0.9 75.9 11.5
Memorandum item:
Customer loans (€ mn) 1,234,911 439,317 133,469 176,458 1,984,155
Source: Supervisory reports.(1) The coverage ratio is the amount of loan loss provisions in relation to the corresponding gross exposure. In the case of performing loans, it is calculated as the ratio of generic provisions to performing loans. The division into size classes is based on the composition of banking groups in June 2014 and total non-consolidated assets as of December 2008. The 5 largest groups comprise the banks belonging to the UniCredit, Intesa Sanpaolo, Banca Monte dei Paschi di Siena, UBI Banca and Banco Popolare groups. The size classes “large”, “small” and “minor” refer to banks belonging to groups or independent banks with total assets, respectively, greater than €21.5 billion, between €3.6 billion and €21.5 billion, and below €3.6 billion. Foreign bank branches are not included. The 5 largest groups plus “large banks” constitute the group of banks subject to the Single Supervisory Mechanism’s comprehensive assessment.
In June non-performing loans accounted for 16.8 per cent of total credit to customers; bad debts came to 9.4 per cent (Table 3.4). Net of loan loss provisions, the share of non-performing loans was 10.5 per cent, while that of bad debts alone was 4.4 per cent. The ratio of net bad debts to regulatory capital was stable at 34.0 per cent. In
Non-performing loans increase further but coverage ratios improve
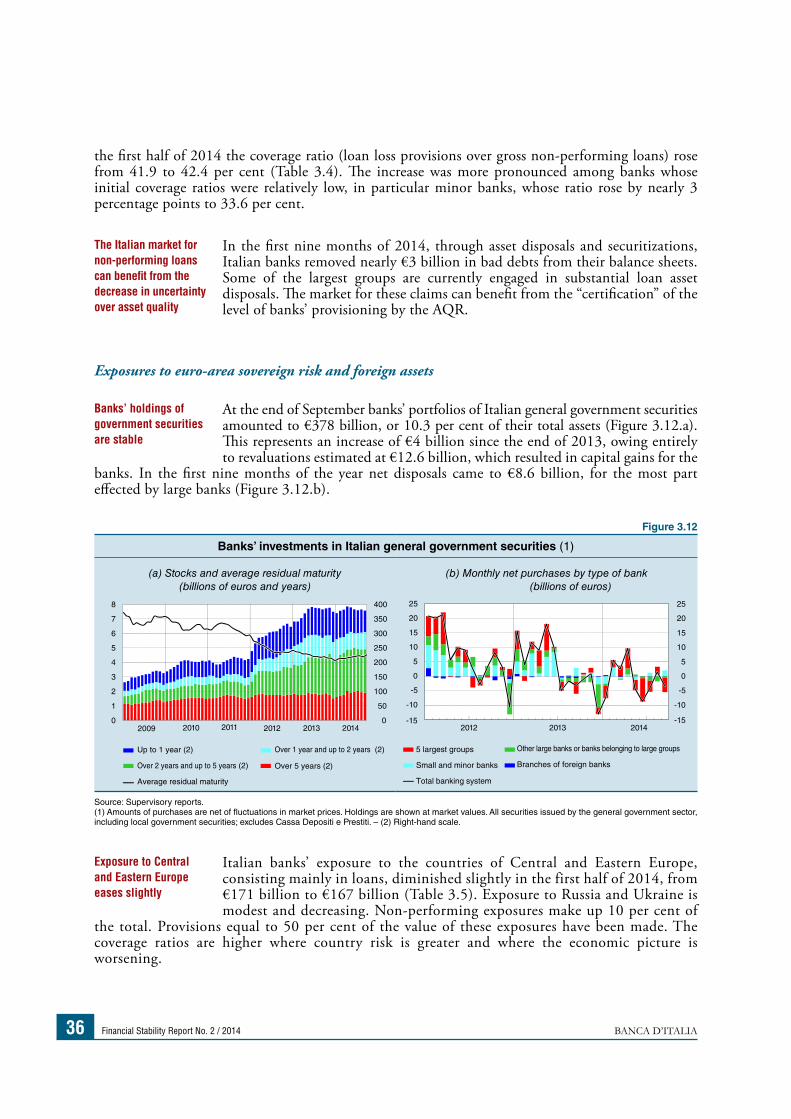
Financial Stability Report No. 2 / 2014 BANCA D’ITALIA36
the first half of 2014 the coverage ratio (loan loss provisions over gross non-performing loans) rose from 41.9 to 42.4 per cent (Table 3.4). The increase was more pronounced among banks whose initial coverage ratios were relatively low, in particular minor banks, whose ratio rose by nearly 3 percentage points to 33.6 per cent.
In the first nine months of 2014, through asset disposals and securitizations, Italian banks removed nearly €3 billion in bad debts from their balance sheets. Some of the largest groups are currently engaged in substantial loan asset disposals. The market for these claims can benefit from the “certification” of the level of banks’ provisioning by the AQR.
Exposures to euro-area sovereign risk and foreign assets
At the end of September banks’ portfolios of Italian general government securities amounted to €378 billion, or 10.3 per cent of their total assets (Figure 3.12.a). This represents an increase of €4 billion since the end of 2013, owing entirely to revaluations estimated at €12.6 billion, which resulted in capital gains for the
banks. In the first nine months of the year net disposals came to €8.6 billion, for the most part effected by large banks (Figure 3.12.b).
Italian banks’ exposure to the countries of Central and Eastern Europe, consisting mainly in loans, diminished slightly in the first half of 2014, from €171 billion to €167 billion (Table 3.5). Exposure to Russia and Ukraine is modest and decreasing. Non-performing exposures make up 10 per cent of
the total. Provisions equal to 50 per cent of the value of these exposures have been made. The coverage ratios are higher where country risk is greater and where the economic picture is worsening.
The Italian market for non-performing loans can benefit from the decrease in uncertainty over asset quality
Banks’ holdings of government securities are stable
Exposure to Central and Eastern Europe eases slightly
Figure 3.12
Banks’ investments in Italian general government securities (1)
(a) Stocks and average residual maturity (billions of euros and years)
(b) Monthly net purchases by type of bank (billions of euros)
2009 2010 2011 2012 2013 20140
50
100
150
200
250
300
350
400
0
1
2
3
4
5
6
7
8
Over 1 year and up to 2 years (2)
Over 5 years (2)
Up to 1 year (2)
Over 2 years and up to 5 years (2)
Average residual maturity
5 largest groups
Small and minor banks
Total banking system
Other large banks or banks belonging to large groups
Branches of foreign banks
2012 2013 2014-15
-10
-5
0
5
10
15
20
25
-15
-10
-5
0
5
10
15
20
25
Source: Supervisory reports.(1) Amounts of purchases are net of fluctuations in market prices. Holdings are shown at market values. All securities issued by the general government sector, including local government securities; excludes Cassa Depositi e Prestiti. – (2) Right-hand scale.
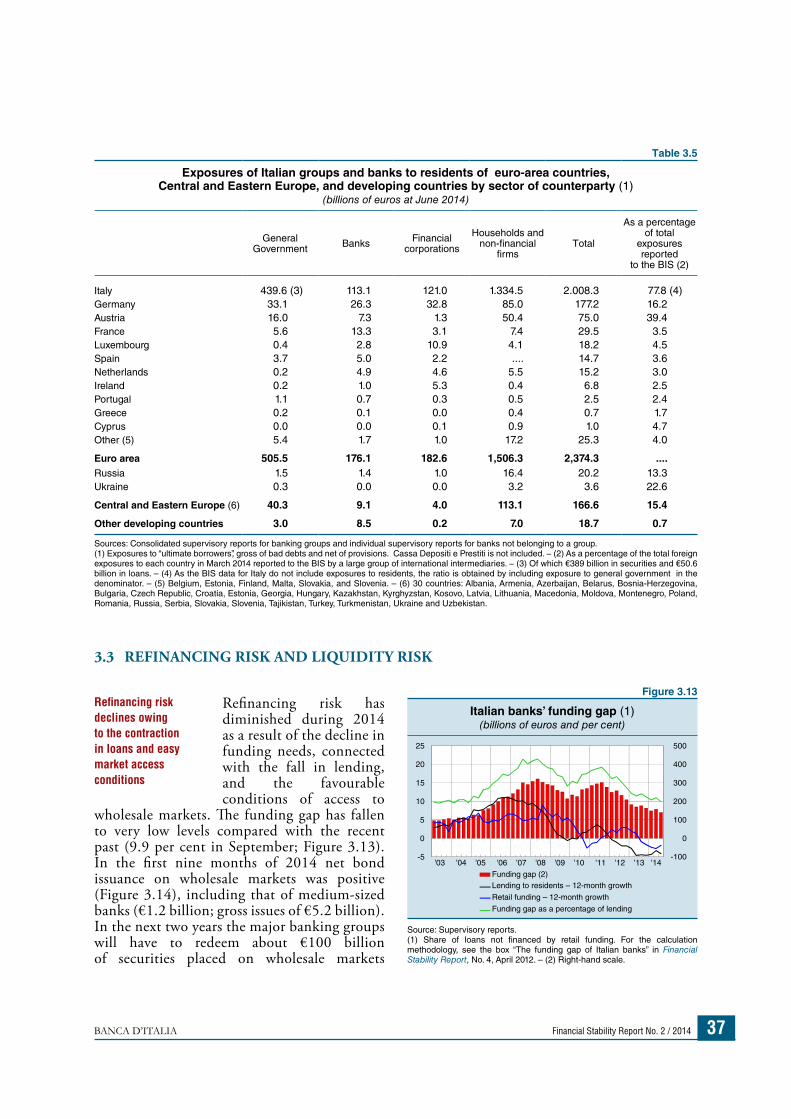
BANCA D’ITALIA Financial Stability Report No. 2 / 2014 37
3.3 REFINANCING RISK AND LIQUIDITY RISK
Refinancing risk has diminished during 2014 as a result of the decline in funding needs, connected with the fall in lending, and the favourable conditions of access to
wholesale markets. The funding gap has fallen to very low levels compared with the recent past (9.9 per cent in September; Figure 3.13). In the first nine months of 2014 net bond issuance on wholesale markets was positive (Figure 3.14), including that of medium-sized banks (€1.2 billion; gross issues of €5.2 billion). In the next two years the major banking groups will have to redeem about €100 billion of securities placed on wholesale markets
Refinancing risk declines owing to the contraction in loans and easy market access conditions
Figure 3.13
Italian banks’ funding gap (1)(billions of euros and per cent)
'03 '14 -100
0
100
200
300
400
500
-5
0
5
10
15
20
25
'04 '05 '06 '07 '08 '09 '10 '11 '12 '13 Funding gap (2)Lending to residents – 12-month growth
Retail funding – 12-month growth
Funding gap as a percentage of lending
Source: Supervisory reports.(1) Share of loans not financed by retail funding. For the calculation methodology, see the box “The funding gap of Italian banks” in Financial Stability Report, No. 4, April 2012. – (2) Right-hand scale.
Table 3.5
Exposures of Italian groups and banks to residents of euro-area countries, Central and Eastern Europe, and developing countries by sector of counterparty (1)
(billions of euros at June 2014)
General Government Banks Financial
corporations
Households and non-financial
firmsTotal
As a percentage of total
exposures reported
to the BIS (2)
Italy 439.6 (3) 113.1 121.0 1.334.5 2.008.3 77.8 (4)Germany 33.1 26.3 32.8 85.0 177.2 16.2Austria 16.0 7.3 1.3 50.4 75.0 39.4France 5.6 13.3 3.1 7.4 29.5 3.5Luxembourg 0.4 2.8 10.9 4.1 18.2 4.5Spain 3.7 5.0 2.2 .... 14.7 3.6Netherlands 0.2 4.9 4.6 5.5 15.2 3.0Ireland 0.2 1.0 5.3 0.4 6.8 2.5Portugal 1.1 0.7 0.3 0.5 2.5 2.4Greece 0.2 0.1 0.0 0.4 0.7 1.7Cyprus 0.0 0.0 0.1 0.9 1.0 4.7Other (5) 5.4 1.7 1.0 17.2 25.3 4.0
Euro area 505.5 176.1 182.6 1,506.3 2,374.3 ....Russia 1.5 1.4 1.0 16.4 20.2 13.3Ukraine 0.3 0.0 0.0 3.2 3.6 22.6
Central and Eastern Europe (6) 40.3 9.1 4.0 113.1 166.6 15.4
Other developing countries 3.0 8.5 0.2 7.0 18.7 0.7
Sources: Consolidated supervisory reports for banking groups and individual supervisory reports for banks not belonging to a group.(1) Exposures to “ultimate borrowers”, gross of bad debts and net of provisions. Cassa Depositi e Prestiti is not included. − (2) As a percentage of the total foreign exposures to each country in March 2014 reported to the BIS by a large group of international intermediaries. − (3) Of which €389 billion in securities and €50.6 billion in loans. – (4) As the BIS data for Italy do not include exposures to residents, the ratio is obtained by including exposure to general government in the denominator. – (5) Belgium, Estonia, Finland, Malta, Slovakia, and Slovenia. – (6) 30 countries: Albania, Armenia, Azerbaijan, Belarus, Bosnia-Herzegovina, Bulgaria, Czech Republic, Croatia, Estonia, Georgia, Hungary, Kazakhstan, Kyrghyzstan, Kosovo, Latvia, Lithuania, Macedonia, Moldova, Montenegro, Poland, Romania, Russia, Serbia, Slovakia, Slovenia, Tajikistan, Turkey, Turkmenistan, Ukraine and Uzbekistan.
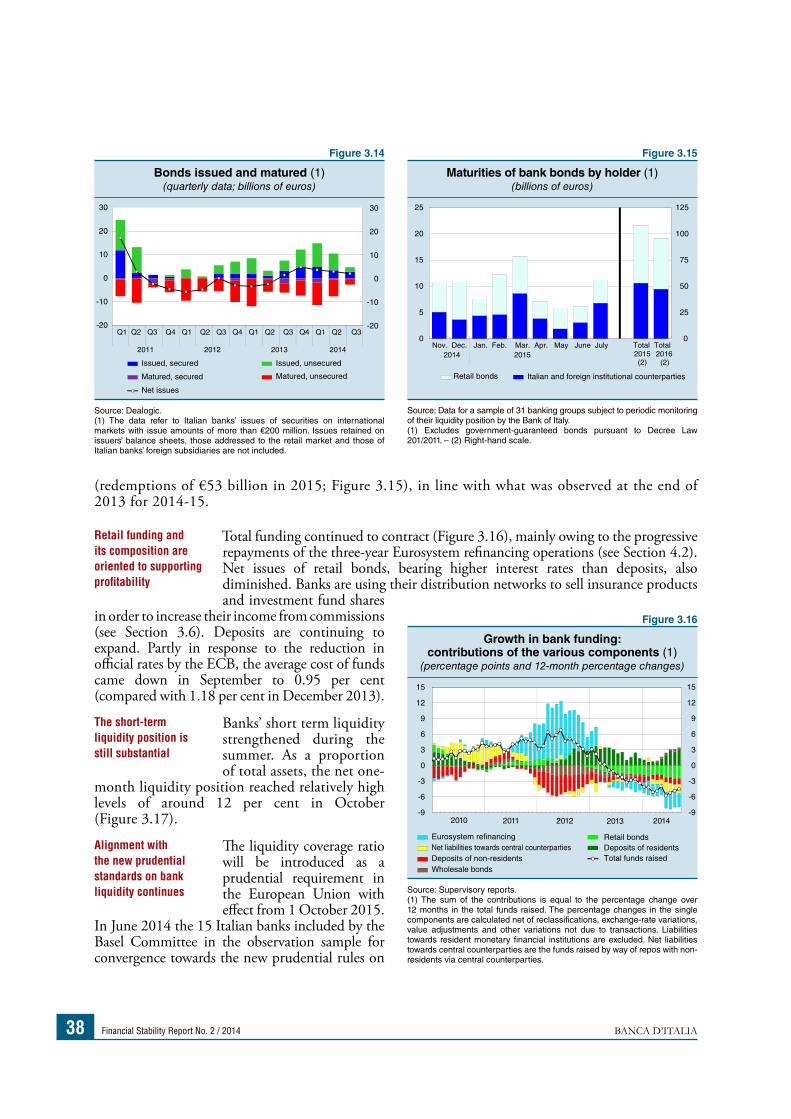
Financial Stability Report No. 2 / 2014 BANCA D’ITALIA38
(redemptions of €53 billion in 2015; Figure 3.15), in line with what was observed at the end of 2013 for 2014-15.
Total funding continued to contract (Figure 3.16), mainly owing to the progressive repayments of the three-year Eurosystem refinancing operations (see Section 4.2). Net issues of retail bonds, bearing higher interest rates than deposits, also diminished. Banks are using their distribution networks to sell insurance products and investment fund shares
in order to increase their income from commissions (see Section 3.6). Deposits are continuing to expand. Partly in response to the reduction in official rates by the ECB, the average cost of funds came down in September to 0.95 per cent (compared with 1.18 per cent in December 2013).
Banks’ short term liquidity strengthened during the summer. As a proportion of total assets, the net one-
month liquidity position reached relatively high levels of around 12 per cent in October (Figure 3.17).
The liquidity coverage ratio will be introduced as a prudential requirement in the European Union with effect from 1 October 2015.
In June 2014 the 15 Italian banks included by the Basel Committee in the observation sample for convergence towards the new prudential rules on
Retail funding and its composition are oriented to supporting profitability
The short-term liquidity position is still substantial
Alignment with the new prudential standards on bank liquidity continues
Figure 3.14
Bonds issued and matured (1)(quarterly data; billions of euros)
-20
-10
0
10
20
30
Q1 Q2 Q3 Q4 Q1 Q2 Q3 Q4 Q1 Q2 Q3 Q4 Q1 Q2 Q3
2011 2012 2013 2014
Issued, secured
Matured, secured
Issued, unsecured
Matured, unsecured
Net issues
-20
-10
0
10
20
30
Source: Dealogic. (1) The data refer to Italian banks’ issues of securities on international markets with issue amounts of more than €200 million. Issues retained on issuers’ balance sheets, those addressed to the retail market and those of Italian banks’ foreign subsidiaries are not included.
Figure 3.15
Maturities of bank bonds by holder (1)(billions of euros)
Nov. Dec. Jan. Feb. Mar. Apr. May June July Total2015(2)
Total 2016(2)
Retail bonds Italian and foreign institutional counterparties
2015
0
25
50
75
100
125
0
5
10
15
20
25
2014
Source: Data for a sample of 31 banking groups subject to periodic monitoring of their liquidity position by the Bank of Italy.(1) Excludes government-guaranteed bonds pursuant to Decree Law 201/2011. – (2) Right-hand scale.
Figure 3.16
Growth in bank funding: contributions of the various components (1)
(percentage points and 12-month percentage changes)
2010 2011 2012 2013 2014-9
-6
-3
0
3
6
9
12
15
Eurosystem refinancing Net liabilities towards central counterparties Deposits of non-residentsWholesale bonds
Retail bonds Deposits of residents Total funds raised
-9
-6
-3
0
3
6
9
12
15
Source: Supervisory reports.(1) The sum of the contributions is equal to the percentage change over 12 months in the total funds raised. The percentage changes in the single components are calculated net of reclassifications, exchange-rate variations, value adjustments and other variations not due to transactions. Liabilities towards resident monetary financial institutions are excluded. Net liabilities towards central counterparties are the funds raised by way of repos with non-residents via central counterparties.
BANCA D’ITALIA Financial Stability Report No. 2 / 2014 39
liquidity met the liquidity coverage ratio established for 2015.9 At the same date, all the sample groups had a net stable funding ratio of more than 100 per cent.
3.4 INTEREST RATE RISK AND MARKET RISK
The VaR of the leading Italian banks points to a decline in the financial risk deriving from securities and derivatives evaluated at fair value (Figure 3.18). This is due to the reduction in the volatility of the yields on Italian government securities, which make up the bulk of financial instruments held for investment purposes.
The interest rate risk of the 11 largest Italian banking groups is modest and also declining. A simulation of a rise of 200 basis points in the risk-free interest rate curve (according to the methodology suggested by the Basel Committee) would result, for data from 30 June, in an average decrease in the net value of assets and
liabilities equal to 4.4 per cent of regulatory capital (6.8 per cent in June 2013), which is well below the 20 per cent early warning threshold set in the regulations. There is also little dispersion of results among the groups: the average figure is the outcome of losses not exceeding 13.4 per cent and gains of up to 4.3 per cent of capital. These results reflect the presence in the balance sheets of Italian banks of a large share of variable rate items whose economic value is unlikely to change with shifts in the yield curve.
Movements in the interest rate curve affect not just capital items but also firms’ profitability. Our recent analyses indicate that the loss of value associated with a rise in interest rates through a change in the prices of assets and liabilities would be on average partially offset by an increase in interest income (see the box “The risks for banks deriving from a rise in interest rates”, Financial Stability Report, No. 6, 2013). The recent stress test (see the box “Interest rate risk and net interest income in the comprehensive assessment”) also provided some useful elements for assessing the impact on economic results of a rise in the interest rates.
9 In 2015 banks will have to meet a liquidity coverage ratio of 60 per cent. The minimum requirement will be raised gradually, reaching 100 per cent in 2018.
Italian banks’ financial risks are diminishing
Exposure to interest rate risk is modest and declining
Figure 3.18
VaR performance of a sample of banks (1)(indices, 1 January 2011=100)
2011 2012 2014 0
50
100
150
200
250
300
0
50
100
150
200
250
300
Trading book
2013
Trading and banking books
Source: Data from a sample of 6 banking groups using internal models to quantify market risk, collected as part of the periodic monitoring of market risk by the Bank of Italy. (1) Averages weighted according to the size of the single intermediaries’ portfolios. The indices are constructed so as to reflect the performance of the VaRs in relation to all positions (securities and derivatives) valued at fair value (in red) and to the trading book component alone (in blue). A decline indicates a reduction in risk.
Figure 3.17
Banks’ net liquidity position (1)(averages; per cent of total assets)
2010 2011 2012 2013 2014-6
-3
0
3
6
9
12
15
Cumulative cash flowHighly liquid assets
Net liquidity position
-6
-3
0
3
6
9
12
15
Source: Data for a sample of 31 banking groups subject to periodic monitoring of their liquidity position by the Bank of Italy. Monthly averages of weekly observations.(1) The net liquidity position is calculated as the (positive or negative) difference between holdings of assets eligible for use as collateral for Eurosystem refinancing operations and cumulative expected cash flow. The time frame is 1 month; on prudential grounds it is assumed that there is no roll-over of maturing obligations vis-à-vis institutional counterparties.
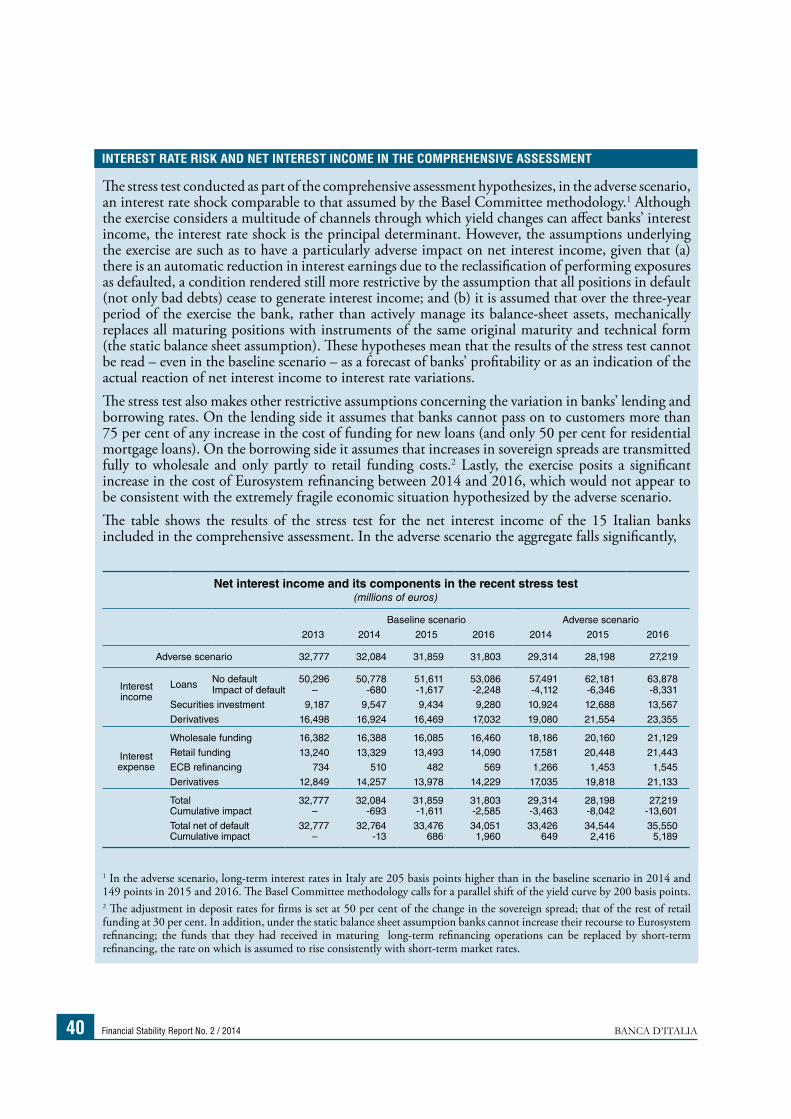
Financial Stability Report No. 2 / 2014 BANCA D’ITALIA40
The stress test conducted as part of the comprehensive assessment hypothesizes, in the adverse scenario, an interest rate shock comparable to that assumed by the Basel Committee methodology.1 Although the exercise considers a multitude of channels through which yield changes can affect banks’ interest income, the interest rate shock is the principal determinant. However, the assumptions underlying the exercise are such as to have a particularly adverse impact on net interest income, given that (a) there is an automatic reduction in interest earnings due to the reclassification of performing exposures as defaulted, a condition rendered still more restrictive by the assumption that all positions in default (not only bad debts) cease to generate interest income; and (b) it is assumed that over the three-year period of the exercise the bank, rather than actively manage its balance-sheet assets, mechanically replaces all maturing positions with instruments of the same original maturity and technical form (the static balance sheet assumption). These hypotheses mean that the results of the stress test cannot be read – even in the baseline scenario – as a forecast of banks’ profitability or as an indication of the actual reaction of net interest income to interest rate variations.The stress test also makes other restrictive assumptions concerning the variation in banks’ lending and borrowing rates. On the lending side it assumes that banks cannot pass on to customers more than 75 per cent of any increase in the cost of funding for new loans (and only 50 per cent for residential mortgage loans). On the borrowing side it assumes that increases in sovereign spreads are transmitted fully to wholesale and only partly to retail funding costs.2 Lastly, the exercise posits a significant increase in the cost of Eurosystem refinancing between 2014 and 2016, which would not appear to be consistent with the extremely fragile economic situation hypothesized by the adverse scenario.The table shows the results of the stress test for the net interest income of the 15 Italian banks included in the comprehensive assessment. In the adverse scenario the aggregate falls significantly,
1 In the adverse scenario, long-term interest rates in Italy are 205 basis points higher than in the baseline scenario in 2014 and 149 points in 2015 and 2016. The Basel Committee methodology calls for a parallel shift of the yield curve by 200 basis points.2 The adjustment in deposit rates for firms is set at 50 per cent of the change in the sovereign spread; that of the rest of retail funding at 30 per cent. In addition, under the static balance sheet assumption banks cannot increase their recourse to Eurosystem refinancing; the funds that they had received in maturing long-term refinancing operations can be replaced by short-term refinancing, the rate on which is assumed to rise consistently with short-term market rates.
INTEREST RATE RISK AND NET INTEREST INCOME IN THE COMPREHENSIVE ASSESSMENT
Net interest income and its components in the recent stress test(millions of euros)
2013
Baseline scenario Adverse scenario
2014 2015 2016 2014 2015 2016
Adverse scenario 32,777 32,084 31,859 31,803 29,314 28,198 27,219
Interest income
Loans No default 50,296 50,778 51,611 53,086 57,491 62,181 63,878Impact of default – -680 -1,617 -2,248 -4,112 -6,346 -8,331
Securities investment 9,187 9,547 9,434 9,280 10,924 12,688 13,567
Derivatives 16,498 16,924 16,469 17,032 19,080 21,554 23,355
Interest expense
Wholesale funding 16,382 16,388 16,085 16,460 18,186 20,160 21,129
Retail funding 13,240 13,329 13,493 14,090 17,581 20,448 21,443
ECB refinancing 734 510 482 569 1,266 1,453 1,545
Derivatives 12,849 14,257 13,978 14,229 17,035 19,818 21,133
TotalCumulative impact
32,777–
32,084-693
31,859-1,611
31,803-2,585
29,314-3,463
28,198-8,042
27,219-13,601
Total net of defaultCumulative impact
32,777–
32,764-13
33,476686
34,0511,960
33,426649
34,5442,416
35,5505,189
BANCA D’ITALIA Financial Stability Report No. 2 / 2014 41
3.5 BANKS’ CAPITAL AND PROFITABILITY
In the first six months of 2014 capital increases were completed for a total of €11 billion; the funds raised on the market, together, for some banks, with the share of half-yearly profits set aside, fostered capital strengthening. At the end of June the common equity tier 1 (CET1) capital and the total own funds of the Italian
banking system averaged 11.9 and 15.2 per cent of risk weighted assets. With the new regulatory arrangements (Basel III), which will become fully operational in Italy in 2018, the capital aggregates are no longer directly comparable with those in force until 31 December 2013.
The capital strength of small and medium-sized groups and banks (those not involved in the comprehensive assessment) is above average. Last June, in fact, their CET1 was equal to 13.3 per cent of their risk-weighted assets; for mutual banks the ratio was 15.6 per cent.
At the end of January Regulation EU No. 575 of 26 June 2013 (the capital requirements regulation, which implements in the European Union the rules drawn up at international level by the Basel Committee) introduced a capital requirement for banks against the risk of changes in the credit valuation adjustment (CVA) for derivatives.10 For Italian banking groups the capital
requirement generated in June 2014 by the CVA for derivatives amounted to €994 million, of which two thirds was attributable to the three largest groups in terms of assets. This amount is 0.92 per cent of the total capital requirement and confirms the limited role of the Italian banking system in derivatives business with financial counterparties.
For the 15 Italian banks included by the Basel Committee on Banking Supervision in the sample for monitoring convergence towards the new prudential rules, the ratio of CET1 to the total on- and off-balance sheet exposures calculated according to the Basel III definitions (the leverage ratio) averaged 5 per cent on
30 June 2014, a significantly higher value than the regulatory minimum that should enter into force in 2018 (3 per cent) and above the figure found in the main euro-area countries.
In the first half of 2014 the annualized ROE was 2.8 per cent, against 1.3 per cent in the first half of 2013 (Figure 3.19); the ROE of the banks involved in the comprehensive assessment was 2.5 per cent and that of the other banks 3.5 per cent. For the banking system as a whole the improvement in profitability was due
10 According to international accounting rules, the CVA is an adjustment that must be made to the book value of derivatives to take account of the probability that the counterparties of the transactions may default. The increases in the CVA are caused by the worsening of counterparties’ creditworthiness and give rise to accounting losses. The scope for applying the capital requirement for the CVA established by the regulation is narrower than that laid down by the Basel III rules. In particular, the requirement does not have to be calculated for transactions in derivatives with EU member states and their central banks or those with non-financial entities that do a limited amount of business in derivatives.
Substantial capital increases are launched in 2014
The coefficients of small and medium-sized banks are higher than those of the rest of the system
The impact of the new capital requirements for derivatives is limited
The average leverage ratio is above 3 per cent
In the first six months of 2014 profitability improves, but is still very low
producing a cumulative loss of income over the three years of €13.6 billion (equal to an average of 8.4 per cent of regulatory capital). This outcome is the resultant of the positive effect of the larger increase in lending rates than in funding rates and the greater negative effect of reclassifying a portion of the loan portfolio as defaulted. Excluding this latter effect from the calculation, net interest income would increase in the baseline scenario (by €2.0 billion in the three years) and even more, owing to the sharper rise in interest rates, in the adverse scenario (by €5.2 billion). The improvement would be driven by rising proceeds on loans and securities.
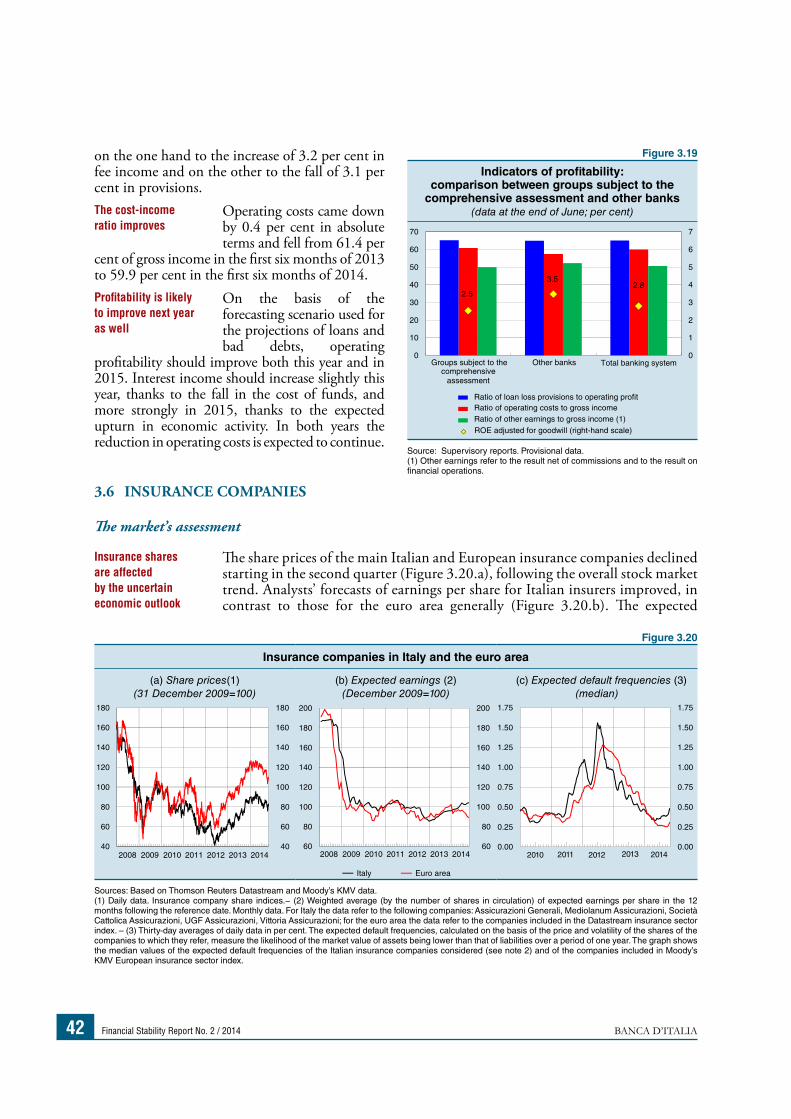
Financial Stability Report No. 2 / 2014 BANCA D’ITALIA42
on the one hand to the increase of 3.2 per cent in fee income and on the other to the fall of 3.1 per cent in provisions.
Operating costs came down by 0.4 per cent in absolute terms and fell from 61.4 per
cent of gross income in the first six months of 2013 to 59.9 per cent in the first six months of 2014.
On the basis of the forecasting scenario used for the projections of loans and bad debts, operating
profitability should improve both this year and in 2015. Interest income should increase slightly this year, thanks to the fall in the cost of funds, and more strongly in 2015, thanks to the expected upturn in economic activity. In both years the reduction in operating costs is expected to continue.
3.6 INSURANCE COMPANIES
The market’s assessment
The share prices of the main Italian and European insurance companies declined starting in the second quarter (Figure 3.20.a), following the overall stock market trend. Analysts’ forecasts of earnings per share for Italian insurers improved, in contrast to those for the euro area generally (Figure 3.20.b). The expected
The cost-income ratio improves
Profitability is likely to improve next year as well
Insurance shares are affected by the uncertain economic outlook
Figure 3.19
Indicators of profitability: comparison between groups subject to the
comprehensive assessment and other banks(data at the end of June; per cent)
2.5
3.52.8
0
1
2
3
4
5
6
7
0
10
20
30
40
50
60
70
Groups subject to thecomprehensive
assessment
Other banks Total banking system
Ratio of loan loss provisions to operating profit Ratio of operating costs to gross incomeRatio of other earnings to gross income (1)ROE adjusted for goodwill (right-hand scale)
Source: Supervisory reports. Provisional data.(1) Other earnings refer to the result net of commissions and to the result on financial operations.
Figure 3.20
Insurance companies in Italy and the euro area
(a) Share prices(1)(31 December 2009=100)
(b) Expected earnings (2)(December 2009=100)
(c) Expected default frequencies (3)(median)
60
80
100
120
140
160
180
200
60
80
100
120
140
160
180
200
40
60
80
100
120
140
160
180
40
60
80
100
120
140
160
180
2010 2011 2012 2013 2014
Italy Euro area
2008 2009 2010 2011 2012 2013 2014 2008 2009 2010 2011 2012 2013 20140.00
0.25
0.50
0.75
1.00
1.25
1.50
1.75
0.00
0.25
0.50
0.75
1.00
1.25
1.50
1.75
Sources: Based on Thomson Reuters Datastream and Moody’s KMV data.(1) Daily data. Insurance company share indices.− (2) Weighted average (by the number of shares in circulation) of expected earnings per share in the 12 months following the reference date. Monthly data. For Italy the data refer to the following companies: Assicurazioni Generali, Mediolanum Assicurazioni, Società Cattolica Assicurazioni, UGF Assicurazioni, Vittoria Assicurazioni; for the euro area the data refer to the companies included in the Datastream insurance sector index. – (3) Thirty-day averages of daily data in per cent. The expected default frequencies, calculated on the basis of the price and volatility of the shares of the companies to which they refer, measure the likelihood of the market value of assets being lower than that of liabilities over a period of one year. The graph shows the median values of the expected default frequencies of the Italian insurance companies considered (see note 2) and of the companies included in Moody’s KMV European insurance sector index.
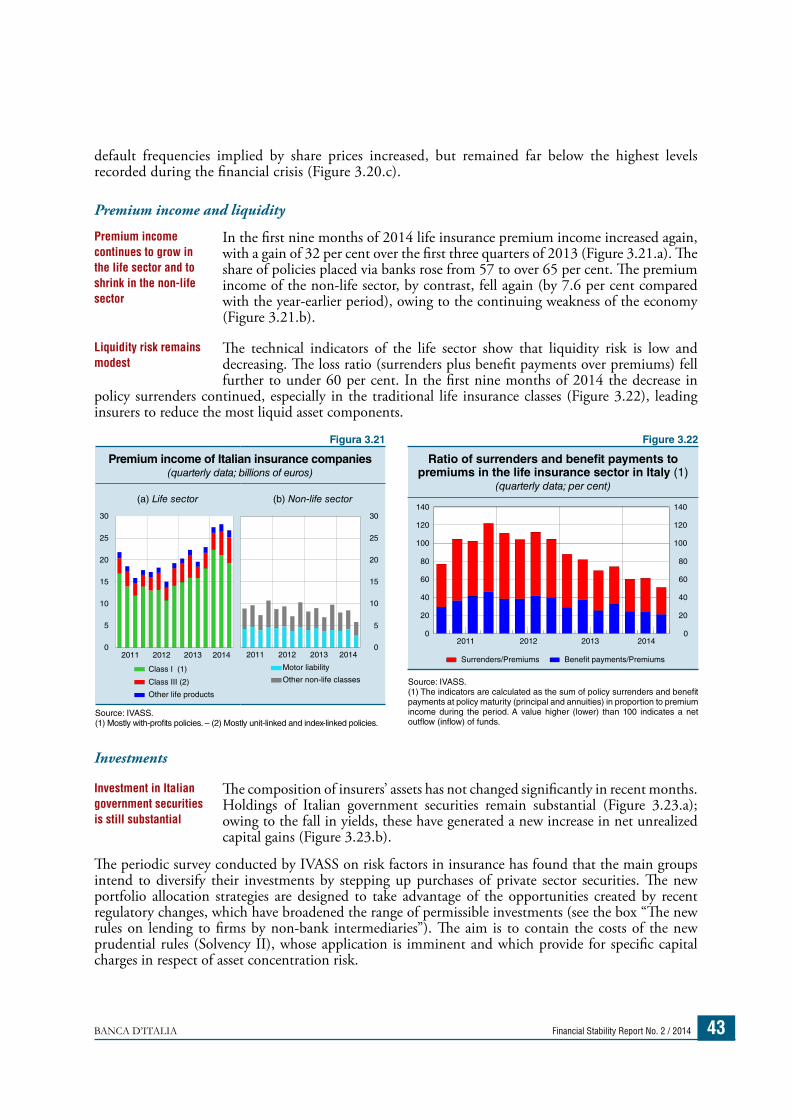
BANCA D’ITALIA Financial Stability Report No. 2 / 2014 43
default frequencies implied by share prices increased, but remained far below the highest levels recorded during the financial crisis (Figure 3.20.c).
Premium income and liquidity
In the first nine months of 2014 life insurance premium income increased again, with a gain of 32 per cent over the first three quarters of 2013 (Figure 3.21.a). The share of policies placed via banks rose from 57 to over 65 per cent. The premium income of the non-life sector, by contrast, fell again (by 7.6 per cent compared with the year-earlier period), owing to the continuing weakness of the economy (Figure 3.21.b).
The technical indicators of the life sector show that liquidity risk is low and decreasing. The loss ratio (surrenders plus benefit payments over premiums) fell further to under 60 per cent. In the first nine months of 2014 the decrease in
policy surrenders continued, especially in the traditional life insurance classes (Figure 3.22), leading insurers to reduce the most liquid asset components.
Investments
The composition of insurers’ assets has not changed significantly in recent months. Holdings of Italian government securities remain substantial (Figure 3.23.a); owing to the fall in yields, these have generated a new increase in net unrealized capital gains (Figure 3.23.b).
The periodic survey conducted by IVASS on risk factors in insurance has found that the main groups intend to diversify their investments by stepping up purchases of private sector securities. The new portfolio allocation strategies are designed to take advantage of the opportunities created by recent regulatory changes, which have broadened the range of permissible investments (see the box “The new rules on lending to firms by non-bank intermediaries”). The aim is to contain the costs of the new prudential rules (Solvency II), whose application is imminent and which provide for specific capital charges in respect of asset concentration risk.
Premium income continues to grow in the life sector and to shrink in the non-life sector
Liquidity risk remains modest
Investment in Italian government securities is still substantial
Figure 3.22
Ratio of surrenders and benefit payments to premiums in the life insurance sector in Italy (1)
(quarterly data; per cent)
0
20
40
60
80
100
120
140
0
20
40
60
80
100
120
140
2011 2012 2013 2014
Benefit payments/PremiumsSurrenders/Premiums
Source: IVASS.(1) The indicators are calculated as the sum of policy surrenders and benefit payments at policy maturity (principal and annuities) in proportion to premium income during the period. A value higher (lower) than 100 indicates a net outflow (inflow) of funds.
Figura 3.21
Premium income of Italian insurance companies(quarterly data; billions of euros)
(a) Life sector (b) Non-life sector
0
5
10
15
20
25
30
2011 2012 2013 20140
5
10
15
20
25
30
2011 2012 2013 2014
Other non-life classes
Motor liability
Other life products
Class III (2)
Class I (1)
Source: IVASS.(1) Mostly with-profits policies. – (2) Mostly unit-linked and index-linked policies.
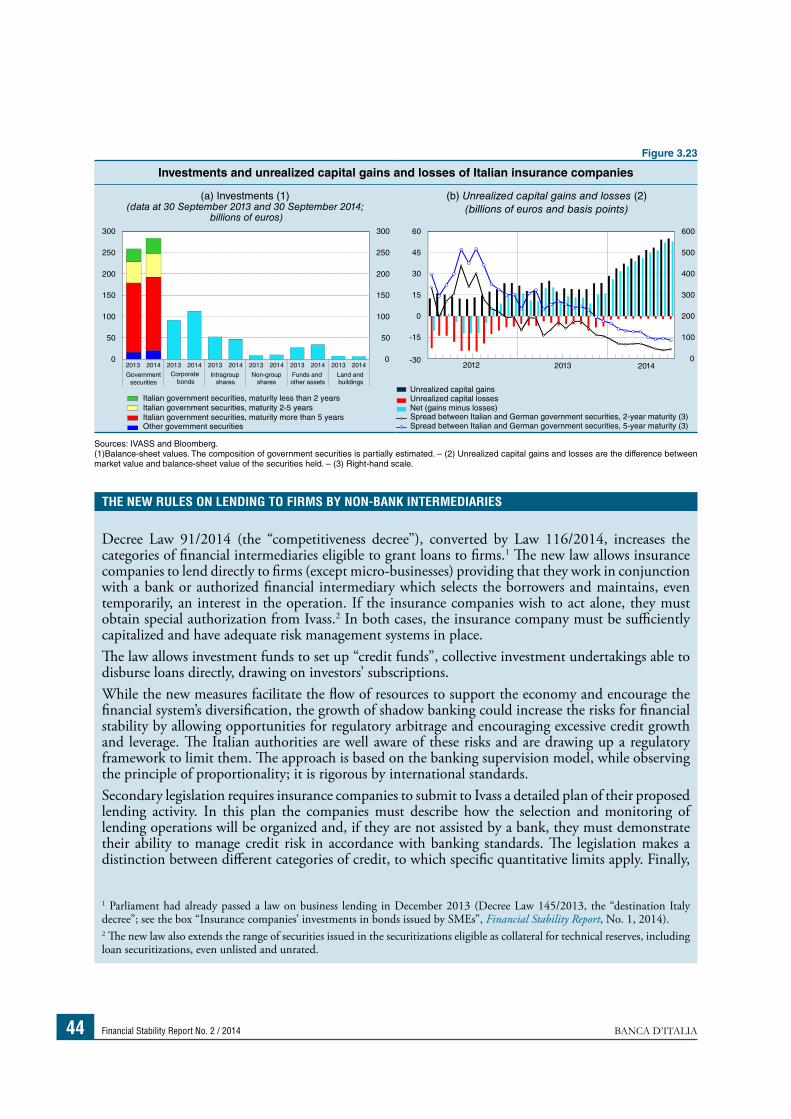
Financial Stability Report No. 2 / 2014 BANCA D’ITALIA44
Figure 3.23
Investments and unrealized capital gains and losses of Italian insurance companies
(a) Investments (1)(data at 30 September 2013 and 30 September 2014;
billions of euros)
(b) Unrealized capital gains and losses (2) (billions of euros and basis points)
20142012 2013 0
100
200
300
400
500
600
-30
-15
0
15
30
45
60
0
50
100
150
200
250
300
0
50
100
150
200
250
300
2013 2014 2013 2014 2013 2014 2013 2014 2013 2014 2013 2014
Government securities
Corporate bonds
Intragroupshares
Non-groupshares
Funds andother assets
Land and buildings
Italian government securities, maturity less than 2 years Italian government securities, maturity 2-5 years Italian government securities, maturity more than 5 years Other government securities
Unrealized capital gainsUnrealized capital lossesNet (gains minus losses)Spread between Italian and German government securities, 2-year maturity (3) Spread between Italian and German government securities, 5-year maturity (3)
Sources: IVASS and Bloomberg.(1)Balance-sheet values. The composition of government securities is partially estimated. – (2) Unrealized capital gains and losses are the difference between market value and balance-sheet value of the securities held. – (3) Right-hand scale.
Decree Law 91/2014 (the “competitiveness decree”), converted by Law 116/2014, increases the categories of financial intermediaries eligible to grant loans to firms.1 The new law allows insurance companies to lend directly to firms (except micro-businesses) providing that they work in conjunction with a bank or authorized financial intermediary which selects the borrowers and maintains, even temporarily, an interest in the operation. If the insurance companies wish to act alone, they must obtain special authorization from Ivass.2 In both cases, the insurance company must be sufficiently capitalized and have adequate risk management systems in place.The law allows investment funds to set up “credit funds”, collective investment undertakings able to disburse loans directly, drawing on investors’ subscriptions.While the new measures facilitate the flow of resources to support the economy and encourage the financial system’s diversification, the growth of shadow banking could increase the risks for financial stability by allowing opportunities for regulatory arbitrage and encouraging excessive credit growth and leverage. The Italian authorities are well aware of these risks and are drawing up a regulatory framework to limit them. The approach is based on the banking supervision model, while observing the principle of proportionality; it is rigorous by international standards.Secondary legislation requires insurance companies to submit to Ivass a detailed plan of their proposed lending activity. In this plan the companies must describe how the selection and monitoring of lending operations will be organized and, if they are not assisted by a bank, they must demonstrate their ability to manage credit risk in accordance with banking standards. The legislation makes a distinction between different categories of credit, to which specific quantitative limits apply. Finally,
1 Parliament had already passed a law on business lending in December 2013 (Decree Law 145/2013, the “destination Italy decree”; see the box “Insurance companies’ investments in bonds issued by SMEs”, Financial Stability Report, No. 1, 2014). 2 The new law also extends the range of securities issued in the securitizations eligible as collateral for technical reserves, including loan securitizations, even unlisted and unrated.
THE NEW RULES ON LENDING TO FIRMS BY NON-BANK INTERMEDIARIES
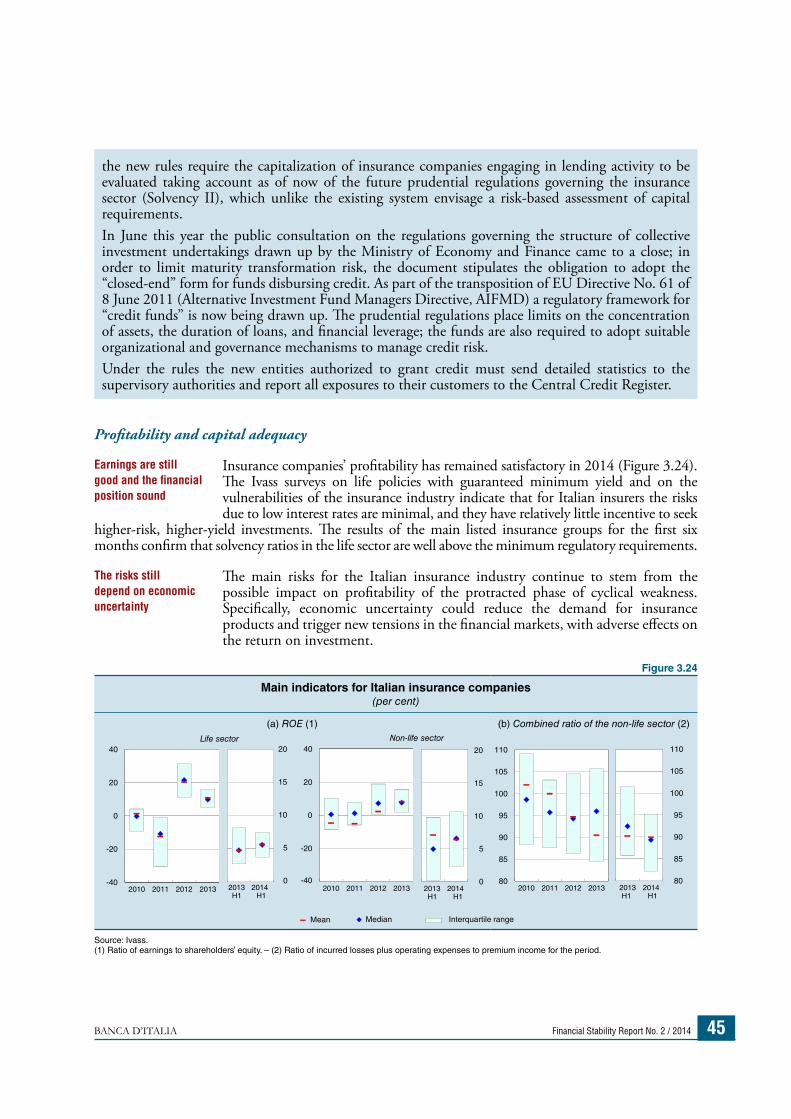
BANCA D’ITALIA Financial Stability Report No. 2 / 2014 45
Profitability and capital adequacy
Insurance companies’ profitability has remained satisfactory in 2014 (Figure 3.24). The Ivass surveys on life policies with guaranteed minimum yield and on the vulnerabilities of the insurance industry indicate that for Italian insurers the risks due to low interest rates are minimal, and they have relatively little incentive to seek
higher-risk, higher-yield investments. The results of the main listed insurance groups for the first six months confirm that solvency ratios in the life sector are well above the minimum regulatory requirements.
The main risks for the Italian insurance industry continue to stem from the possible impact on profitability of the protracted phase of cyclical weakness. Specifically, economic uncertainty could reduce the demand for insurance products and trigger new tensions in the financial markets, with adverse effects on the return on investment.
Earnings are still good and the financial position sound
The risks still depend on economic uncertainty
the new rules require the capitalization of insurance companies engaging in lending activity to be evaluated taking account as of now of the future prudential regulations governing the insurance sector (Solvency II), which unlike the existing system envisage a risk-based assessment of capital requirements.In June this year the public consultation on the regulations governing the structure of collective investment undertakings drawn up by the Ministry of Economy and Finance came to a close; in order to limit maturity transformation risk, the document stipulates the obligation to adopt the “closed-end” form for funds disbursing credit. As part of the transposition of EU Directive No. 61 of 8 June 2011 (Alternative Investment Fund Managers Directive, AIFMD) a regulatory framework for “credit funds” is now being drawn up. The prudential regulations place limits on the concentration of assets, the duration of loans, and financial leverage; the funds are also required to adopt suitable organizational and governance mechanisms to manage credit risk.Under the rules the new entities authorized to grant credit must send detailed statistics to the supervisory authorities and report all exposures to their customers to the Central Credit Register.
Figure 3.24
Main indicators for Italian insurance companies (per cent)
(a) ROE (1) (b) Combined ratio of the non-life sector (2)
80
85
90
95
100
105
110
2013H1
2014H1
80
85
90
95
100
105
110
2010 2011 2012 2013 0
5
10
15
20
2013H1
2014H1
-40
-20
0
20
40
2010 2011 2012 2013
Non-life sector
0
5
10
15
20
2013H1
2014H1
-40
-20
0
20
40
2010 2011 2012 2013
Life sector
Median Interquartile range Mean
Source: Ivass.(1) Ratio of earnings to shareholders’ equity. – (2) Ratio of incurred losses plus operating expenses to premium income for the period.
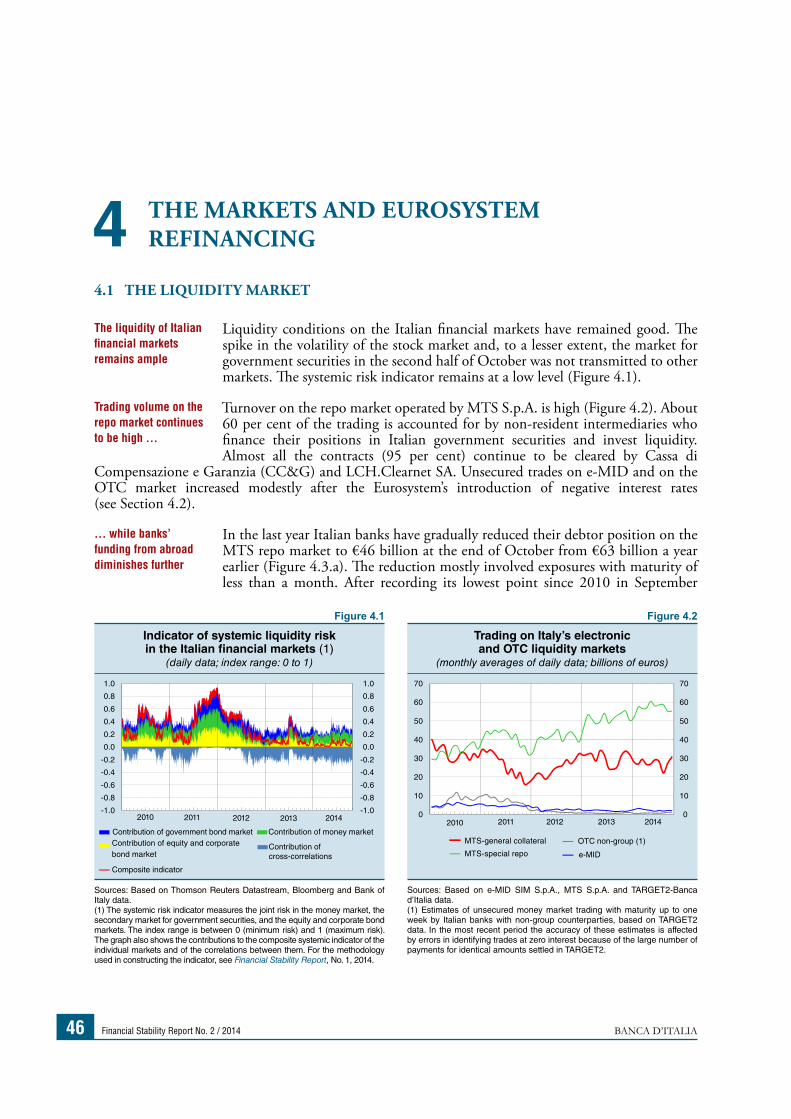
Financial Stability Report No. 2 / 2014 BANCA D’ITALIA46
THE MARKETS AND EUROSYSTEM REFINANCING4
4.1 THE LIQUIDITY MARKET
Liquidity conditions on the Italian financial markets have remained good. The spike in the volatility of the stock market and, to a lesser extent, the market for government securities in the second half of October was not transmitted to other markets. The systemic risk indicator remains at a low level (Figure 4.1).
Turnover on the repo market operated by MTS S.p.A. is high (Figure 4.2). About 60 per cent of the trading is accounted for by non-resident intermediaries who finance their positions in Italian government securities and invest liquidity. Almost all the contracts (95 per cent) continue to be cleared by Cassa di
Compensazione e Garanzia (CC&G) and LCH.Clearnet SA. Unsecured trades on e-MID and on the OTC market increased modestly after the Eurosystem’s introduction of negative interest rates (see Section 4.2).
In the last year Italian banks have gradually reduced their debtor position on the MTS repo market to €46 billion at the end of October from €63 billion a year earlier (Figure 4.3.a). The reduction mostly involved exposures with maturity of less than a month. After recording its lowest point since 2010 in September
The liquidity of Italian financial markets remains ample
Trading volume on the repo market continues to be high …
… while banks’ funding from abroad diminishes further
Figure 4.1
Indicator of systemic liquidity riskin the Italian financial markets (1)
(daily data; index range: 0 to 1)
-1.0
-0.8
-0.6
-0.4
-0.2
0.0
0.2
0.4
0.6
0.8
1.0
-1.0
-0.8
-0.6
-0.4
-0.2
0.0
0.2
0.4
0.6
0.8
1.0
Contribution of money market
Contribution of cross-correlations
Contribution of government bond market Contribution of equity and corporate bond market
Composite indicator
2010 2011 2012 2013 2014
Sources: Based on Thomson Reuters Datastream, Bloomberg and Bank of Italy data.(1) The systemic risk indicator measures the joint risk in the money market, the secondary market for government securities, and the equity and corporate bond markets. The index range is between 0 (minimum risk) and 1 (maximum risk). The graph also shows the contributions to the composite systemic indicator of the individual markets and of the correlations between them. For the methodology used in constructing the indicator, see Financial Stability Report, No. 1, 2014.
Figure 4.2
Trading on Italy’s electronic and OTC liquidity markets
(monthly averages of daily data; billions of euros)
2010 2011 2012 2013 2014
MTS-general collateral
MTS-special repo
OTC non-group (1)
e-MID
0
10
20
30
40
50
60
70
0
10
20
30
40
50
60
70
Sources: Based on e-MID SIM S.p.A., MTS S.p.A. and TARGET2-Banca d’Italia data.(1) Estimates of unsecured money market trading with maturity up to one week by Italian banks with non-group counterparties, based on TARGET2 data. In the most recent period the accuracy of these estimates is affected by errors in identifying trades at zero interest because of the large number of payments for identical amounts settled in TARGET2.
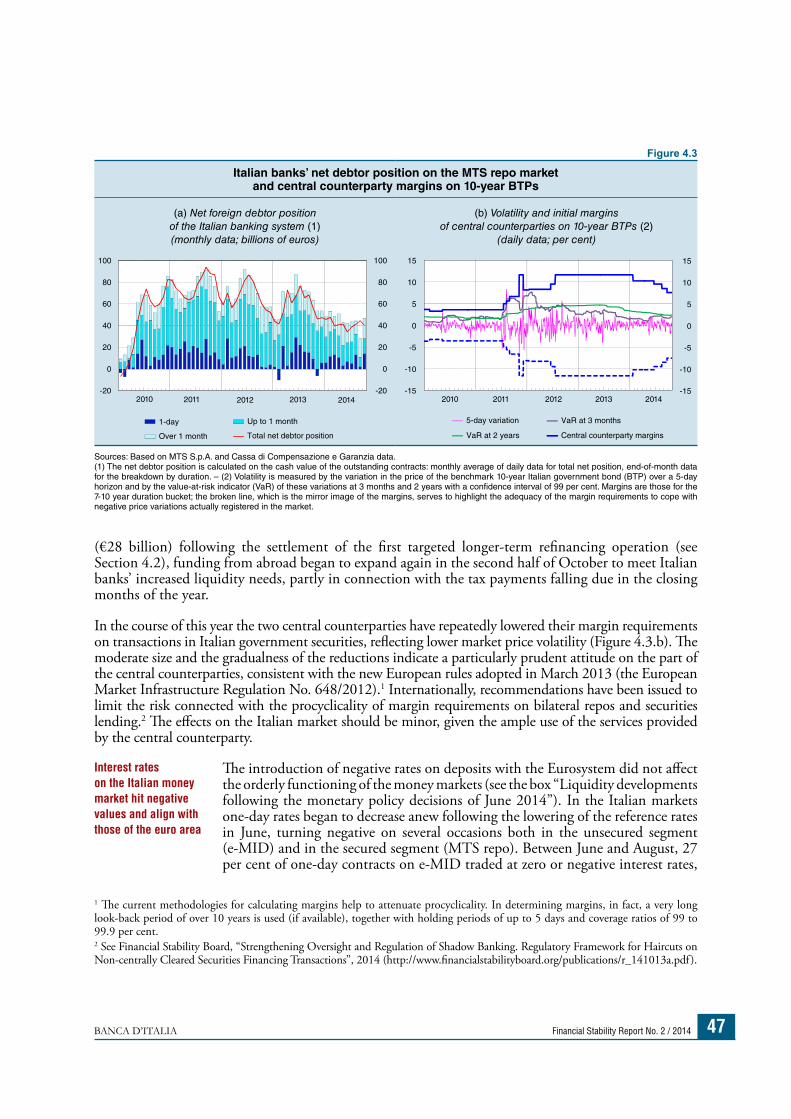
BANCA D’ITALIA Financial Stability Report No. 2 / 2014 47
(€28 billion) following the settlement of the first targeted longer-term refinancing operation (see Section 4.2), funding from abroad began to expand again in the second half of October to meet Italian banks’ increased liquidity needs, partly in connection with the tax payments falling due in the closing months of the year.
In the course of this year the two central counterparties have repeatedly lowered their margin requirements on transactions in Italian government securities, reflecting lower market price volatility (Figure 4.3.b). The moderate size and the gradualness of the reductions indicate a particularly prudent attitude on the part of the central counterparties, consistent with the new European rules adopted in March 2013 (the European Market Infrastructure Regulation No. 648/2012).1 Internationally, recommendations have been issued to limit the risk connected with the procyclicality of margin requirements on bilateral repos and securities lending.2 The effects on the Italian market should be minor, given the ample use of the services provided by the central counterparty.
The introduction of negative rates on deposits with the Eurosystem did not affect the orderly functioning of the money markets (see the box “Liquidity developments following the monetary policy decisions of June 2014”). In the Italian markets one-day rates began to decrease anew following the lowering of the reference rates in June, turning negative on several occasions both in the unsecured segment (e-MID) and in the secured segment (MTS repo). Between June and August, 27 per cent of one-day contracts on e-MID traded at zero or negative interest rates,
1 The current methodologies for calculating margins help to attenuate procyclicality. In determining margins, in fact, a very long look-back period of over 10 years is used (if available), together with holding periods of up to 5 days and coverage ratios of 99 to 99.9 per cent.2 See Financial Stability Board, “Strengthening Oversight and Regulation of Shadow Banking. Regulatory Framework for Haircuts on Non-centrally Cleared Securities Financing Transactions”, 2014 (http://www.financialstabilityboard.org/publications/r_141013a.pdf).
Interest rates on the Italian money market hit negative values and align with those of the euro area
Figure 4.3
Italian banks’ net debtor position on the MTS repo market and central counterparty margins on 10-year BTPs
(a) Net foreign debtor position of the Italian banking system (1)(monthly data; billions of euros)
(b) Volatility and initial margins of central counterparties on 10-year BTPs (2)
(daily data; per cent)
2010 2011 2012 2013 2014-20
0
20
40
60
80
100
-20
0
20
40
60
80
100
5-day variation
VaR at 2 years
VaR at 3 months
Central counterparty margins
1-day
Over 1 month
Up to 1 month
Total net debtor position
2010 2011 2012 2013 2014-15
-10
-5
0
5
10
15
-15
-10
-5
0
5
10
15
Sources: Based on MTS S.p.A. and Cassa di Compensazione e Garanzia data.(1) The net debtor position is calculated on the cash value of the outstanding contracts: monthly average of daily data for total net position, end-of-month data for the breakdown by duration. – (2) Volatility is measured by the variation in the price of the benchmark 10-year Italian government bond (BTP) over a 5-day horizon and by the value-at-risk indicator (VaR) of these variations at 3 months and 2 years with a confidence interval of 99 per cent. Margins are those for the 7-10 year duration bucket; the broken line, which is the mirror image of the margins, serves to highlight the adequacy of the margin requirements to cope with negative price variations actually registered in the market.
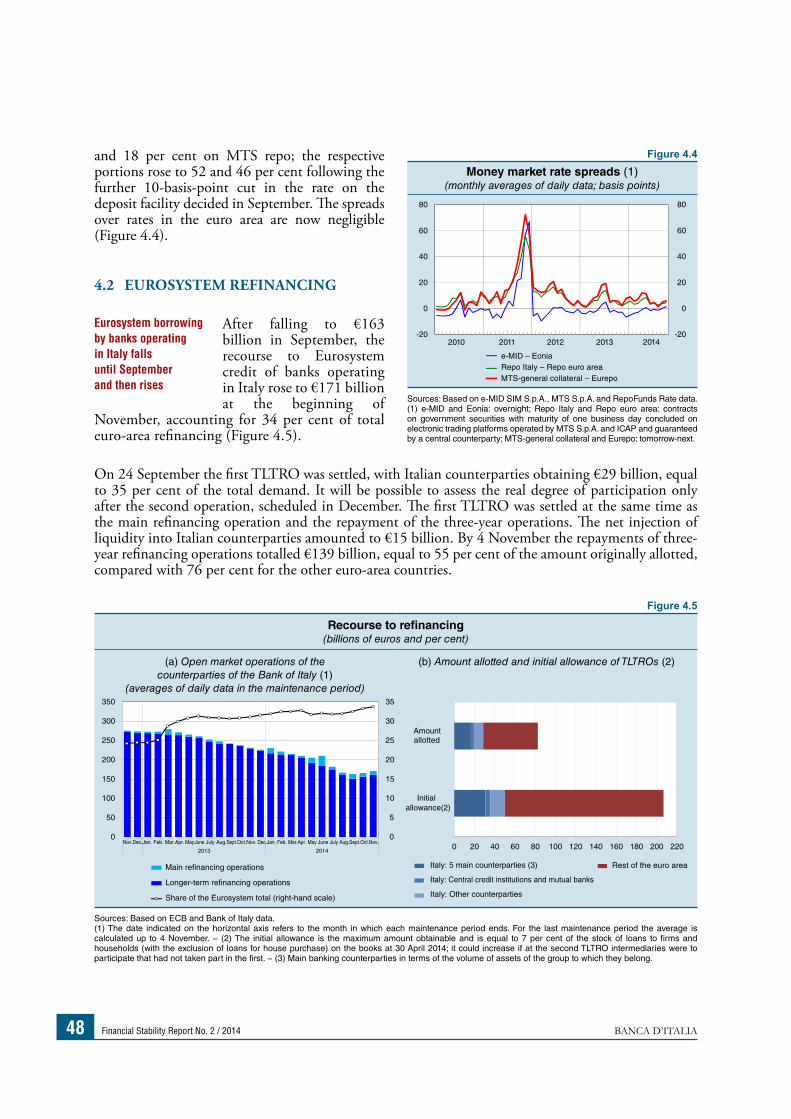
Financial Stability Report No. 2 / 2014 BANCA D’ITALIA48
and 18 per cent on MTS repo; the respective portions rose to 52 and 46 per cent following the further 10-basis-point cut in the rate on the deposit facility decided in September. The spreads over rates in the euro area are now negligible (Figure 4.4).
4.2 EUROSYSTEM REFINANCING
After falling to €163 billion in September, the recourse to Eurosystem credit of banks operating in Italy rose to €171 billion at the beginning of
November, accounting for 34 per cent of total euro-area refinancing (Figure 4.5).
On 24 September the first TLTRO was settled, with Italian counterparties obtaining €29 billion, equal to 35 per cent of the total demand. It will be possible to assess the real degree of participation only after the second operation, scheduled in December. The first TLTRO was settled at the same time as the main refinancing operation and the repayment of the three-year operations. The net injection of liquidity into Italian counterparties amounted to €15 billion. By 4 November the repayments of three-year refinancing operations totalled €139 billion, equal to 55 per cent of the amount originally allotted, compared with 76 per cent for the other euro-area countries.
Eurosystem borrowing by banks operating in Italy falls until September and then rises
Figure 4.5
Recourse to refinancing(billions of euros and per cent)
(a) Open market operations of the counterparties of the Bank of Italy (1)
(averages of daily data in the maintenance period)
(b) Amount allotted and initial allowance of TLTROs (2)
0 20 40 60 80 100 120 140 160 180 200 220
Initialallowance(2)
Amountallotted
0
5
10
15
20
25
30
35
0
50
100
150
200
250
300
350
Nov.Dec.Jan. Feb. Mar.Apr. May June July Aug.Sept.Oct.Nov. Dec.Jan. Feb. Mar.Apr. May June July Aug.Sept.Oct.Nov.
2013 2014
Main refinancing operations
Longer-term refinancing operations
Share of the Eurosystem total (right-hand scale)
Rest of the euro areaItaly: 5 main counterparties (3)
Italy: Central credit institutions and mutual banks
Italy: Other counterparties Sources: Based on ECB and Bank of Italy data.(1) The date indicated on the horizontal axis refers to the month in which each maintenance period ends. For the last maintenance period the average is calculated up to 4 November. − (2) The initial allowance is the maximum amount obtainable and is equal to 7 per cent of the stock of loans to firms and households (with the exclusion of loans for house purchase) on the books at 30 April 2014; it could increase if at the second TLTRO intermediaries were to participate that had not taken part in the first. − (3) Main banking counterparties in terms of the volume of assets of the group to which they belong.
Figure 4.4Money market rate spreads (1)
(monthly averages of daily data; basis points)
e-MID – Eonia Repo Italy – Repo euro area MTS-general collateral – Eurepo
2010 2011 2012 2013 2014-20
0
20
40
60
80
-20
0
20
40
60
80
Sources: Based on e-MID SIM S.p.A., MTS S.p.A. and RepoFunds Rate data.(1) e-MID and Eonia: overnight; Repo Italy and Repo euro area: contracts on government securities with maturity of one business day concluded on electronic trading platforms operated by MTS S.p.A. and ICAP and guaranteed by a central counterparty; MTS-general collateral and Eurepo: tomorrow-next.
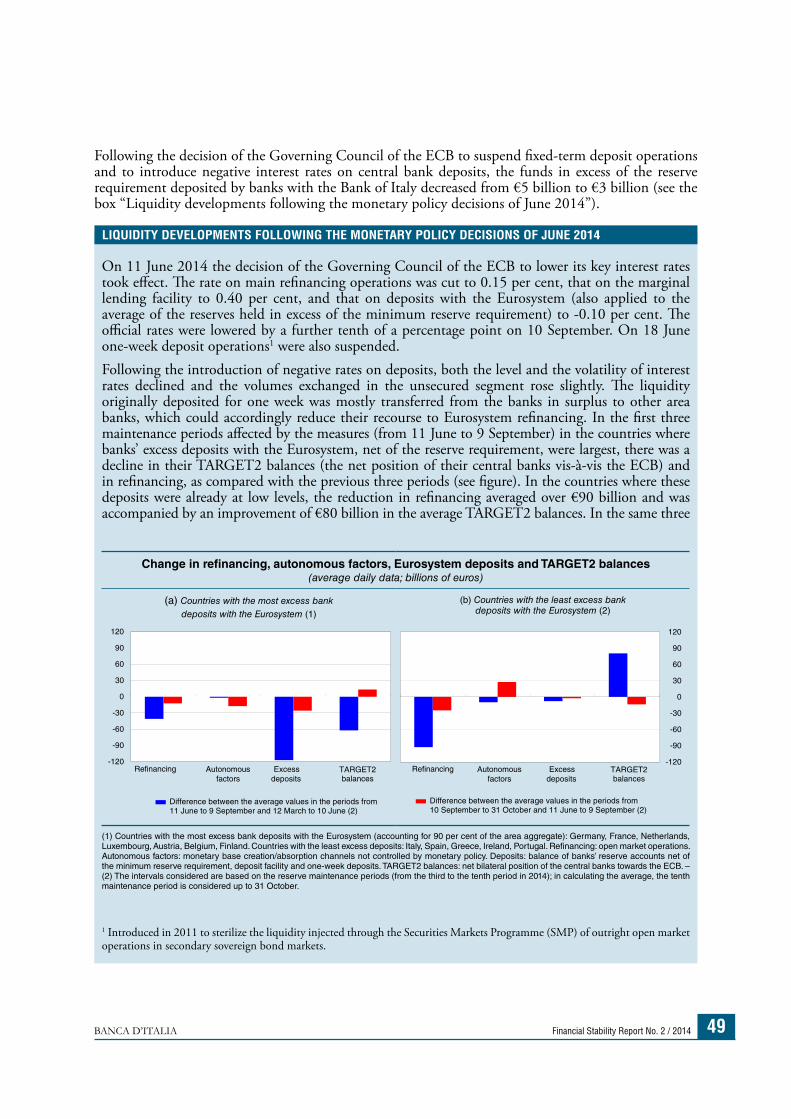
BANCA D’ITALIA Financial Stability Report No. 2 / 2014 49
Following the decision of the Governing Council of the ECB to suspend fixed-term deposit operations and to introduce negative interest rates on central bank deposits, the funds in excess of the reserve requirement deposited by banks with the Bank of Italy decreased from €5 billion to €3 billion (see the box “Liquidity developments following the monetary policy decisions of June 2014”).
LIQUIDITY DEVELOPMENTS FOLLOWING THE MONETARY POLICY DECISIONS OF JUNE 2014
On 11 June 2014 the decision of the Governing Council of the ECB to lower its key interest rates took effect. The rate on main refinancing operations was cut to 0.15 per cent, that on the marginal lending facility to 0.40 per cent, and that on deposits with the Eurosystem (also applied to the average of the reserves held in excess of the minimum reserve requirement) to -0.10 per cent. The official rates were lowered by a further tenth of a percentage point on 10 September. On 18 June one-week deposit operations1 were also suspended.Following the introduction of negative rates on deposits, both the level and the volatility of interest rates declined and the volumes exchanged in the unsecured segment rose slightly. The liquidity originally deposited for one week was mostly transferred from the banks in surplus to other area banks, which could accordingly reduce their recourse to Eurosystem refinancing. In the first three maintenance periods affected by the measures (from 11 June to 9 September) in the countries where banks’ excess deposits with the Eurosystem, net of the reserve requirement, were largest, there was a decline in their TARGET2 balances (the net position of their central banks vis-à-vis the ECB) and in refinancing, as compared with the previous three periods (see figure). In the countries where these deposits were already at low levels, the reduction in refinancing averaged over €90 billion and was accompanied by an improvement of €80 billion in the average TARGET2 balances. In the same three
1 Introduced in 2011 to sterilize the liquidity injected through the Securities Markets Programme (SMP) of outright open market operations in secondary sovereign bond markets.
Change in refinancing, autonomous factors, Eurosystem deposits and TARGET2 balances(average daily data; billions of euros)
(a) Countries with the most excess bank deposits with the Eurosystem (1)
(b) Countries with the least excess bank deposits with the Eurosystem (2)
Refinancing Autonomousfactors
Excessdeposits
TARGET2 balances
-120
-90
-60
-30
0
30
60
90
120
-120
-90
-60
-30
0
30
60
90
120
Difference between the average values in the periods from 10 September to 31 October and 11 June to 9 September (2)
Difference between the average values in the periods from 11 June to 9 September and 12 March to 10 June (2)
Refinancing Autonomousfactors
Excessdeposits
TARGET2 balances
(1) Countries with the most excess bank deposits with the Eurosystem (accounting for 90 per cent of the area aggregate): Germany, France, Netherlands, Luxembourg, Austria, Belgium, Finland. Countries with the least excess deposits: Italy, Spain, Greece, Ireland, Portugal. Refinancing: open market operations. Autonomous factors: monetary base creation/absorption channels not controlled by monetary policy. Deposits: balance of banks’ reserve accounts net of the minimum reserve requirement, deposit facility and one-week deposits. TARGET2 balances: net bilateral position of the central banks towards the ECB. – (2) The intervals considered are based on the reserve maintenance periods (from the third to the tenth period in 2014); in calculating the average, the tenth maintenance period is considered up to 31 October.
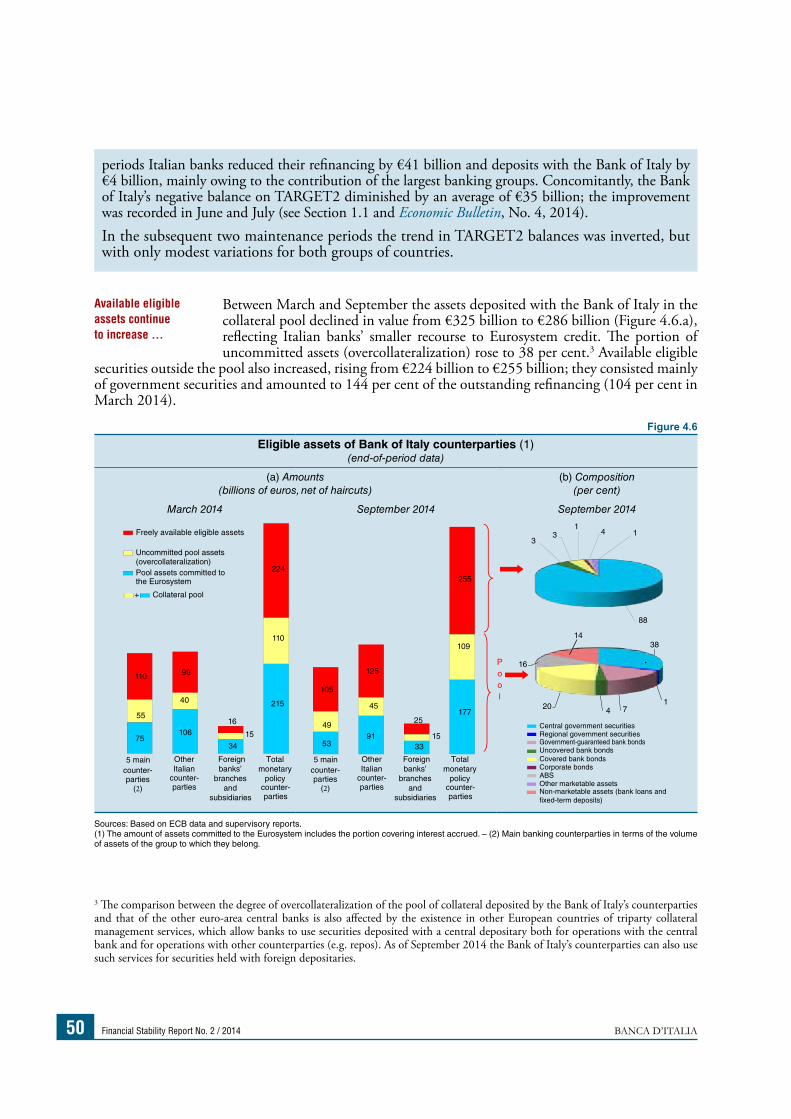
Financial Stability Report No. 2 / 2014 BANCA D’ITALIA50
Between March and September the assets deposited with the Bank of Italy in the collateral pool declined in value from €325 billion to €286 billion (Figure 4.6.a), reflecting Italian banks’ smaller recourse to Eurosystem credit. The portion of uncommitted assets (overcollateralization) rose to 38 per cent.3 Available eligible
securities outside the pool also increased, rising from €224 billion to €255 billion; they consisted mainly of government securities and amounted to 144 per cent of the outstanding refinancing (104 per cent in March 2014).
3 The comparison between the degree of overcollateralization of the pool of collateral deposited by the Bank of Italy’s counterparties and that of the other euro-area central banks is also affected by the existence in other European countries of triparty collateral management services, which allow banks to use securities deposited with a central depositary both for operations with the central bank and for operations with other counterparties (e.g. repos). As of September 2014 the Bank of Italy’s counterparties can also use such services for securities held with foreign depositaries.
Available eligible assets continue to increase …
Figure 4.6Eligible assets of Bank of Italy counterparties (1)
(end-of-period data)
(a) Amounts(billions of euros, net of haircuts)
(b) Composition(per cent)
March 2014 September 2014 September 2014
38
17420
16
14
88
33
14 1
53 91
33
177
49
45
15
109
105
125
25
255
75 106
34
215
55
40
15
110
110 98
16
224
Pool
Freely available eligible assets
Uncommitted pool assets (overcollateralization)Pool assets committed to the Eurosystem
+ Collateral pool
Central government securitiesRegional government securitiesGovernment-guaranteed bank bondsUncovered bank bondsCovered bank bondsCorporate bondsABSOther marketable assetsNon-marketable assets (bank loans and fixed-term deposits)
Total monetary
policy counter-parties
Foreign banks’
branches and
subsidiaries
Other Italian
counter-parties
5 main
(2)
counter-parties
5 main
(2)
counter-parties
Total monetary
policy counter-parties
Foreign banks’
branches and
subsidiaries
Other Italian
counter-parties
Sources: Based on ECB data and supervisory reports.(1) The amount of assets committed to the Eurosystem includes the portion covering interest accrued. – (2) Main banking counterparties in terms of the volume of assets of the group to which they belong.
periods Italian banks reduced their refinancing by €41 billion and deposits with the Bank of Italy by €4 billion, mainly owing to the contribution of the largest banking groups. Concomitantly, the Bank of Italy’s negative balance on TARGET2 diminished by an average of €35 billion; the improvement was recorded in June and July (see Section 1.1 and Economic Bulletin, No. 4, 2014).In the subsequent two maintenance periods the trend in TARGET2 balances was inverted, but with only modest variations for both groups of countries.
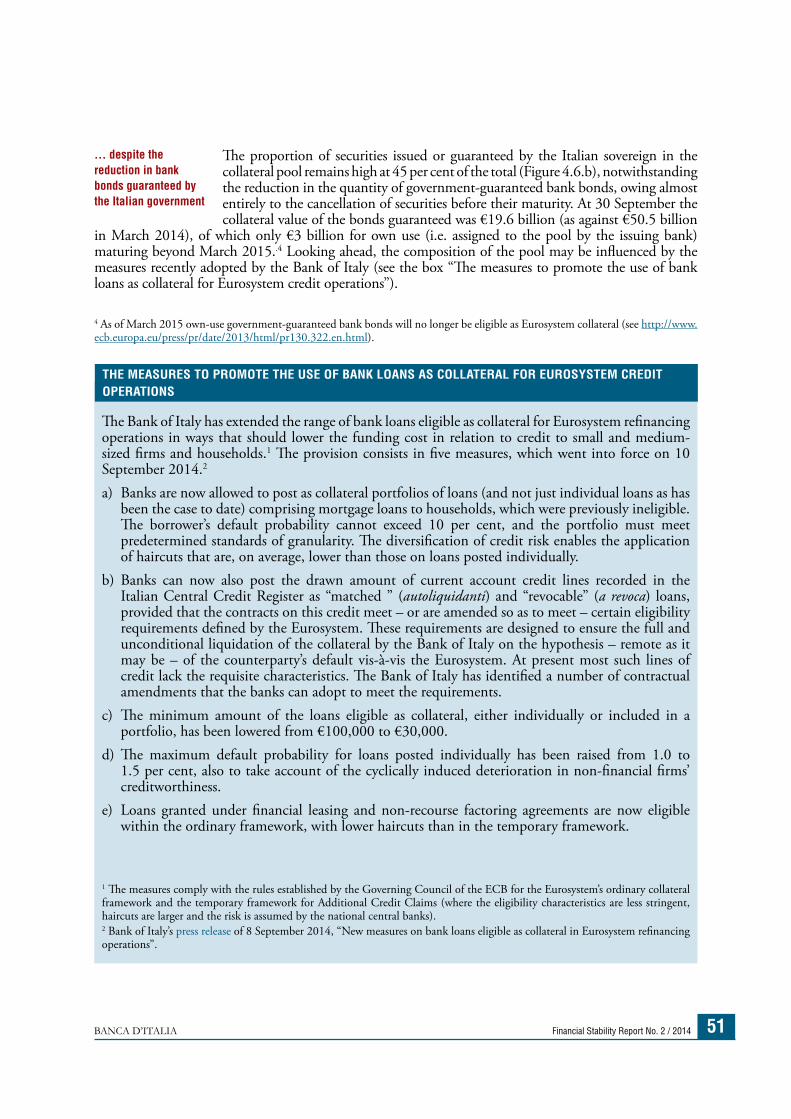
BANCA D’ITALIA Financial Stability Report No. 2 / 2014 51
The proportion of securities issued or guaranteed by the Italian sovereign in the collateral pool remains high at 45 per cent of the total (Figure 4.6.b), notwithstanding the reduction in the quantity of government-guaranteed bank bonds, owing almost entirely to the cancellation of securities before their maturity. At 30 September the collateral value of the bonds guaranteed was €19.6 billion (as against €50.5 billion
in March 2014), of which only €3 billion for own use (i.e. assigned to the pool by the issuing bank) maturing beyond March 2015..4 Looking ahead, the composition of the pool may be influenced by the measures recently adopted by the Bank of Italy (see the box “The measures to promote the use of bank loans as collateral for Eurosystem credit operations”).
4 As of March 2015 own-use government-guaranteed bank bonds will no longer be eligible as Eurosystem collateral (see http://www.ecb.europa.eu/press/pr/date/2013/html/pr130.322.en.html).
… despite the reduction in bank bonds guaranteed by the Italian government
THE MEASURES TO PROMOTE THE USE OF BANK LOANS AS COLLATERAL FOR EUROSYSTEM CREDIT OPERATIONS
The Bank of Italy has extended the range of bank loans eligible as collateral for Eurosystem refinancing operations in ways that should lower the funding cost in relation to credit to small and medium-sized firms and households.1 The provision consists in five measures, which went into force on 10 September 2014.2
a) Banks are now allowed to post as collateral portfolios of loans (and not just individual loans as has been the case to date) comprising mortgage loans to households, which were previously ineligible. The borrower’s default probability cannot exceed 10 per cent, and the portfolio must meet predetermined standards of granularity. The diversification of credit risk enables the application of haircuts that are, on average, lower than those on loans posted individually.
b) Banks can now also post the drawn amount of current account credit lines recorded in the Italian Central Credit Register as “matched ” (autoliquidanti) and “revocable” (a revoca) loans, provided that the contracts on this credit meet – or are amended so as to meet – certain eligibility requirements defined by the Eurosystem. These requirements are designed to ensure the full and unconditional liquidation of the collateral by the Bank of Italy on the hypothesis – remote as it may be – of the counterparty’s default vis-à-vis the Eurosystem. At present most such lines of credit lack the requisite characteristics. The Bank of Italy has identified a number of contractual amendments that the banks can adopt to meet the requirements.
c) The minimum amount of the loans eligible as collateral, either individually or included in a portfolio, has been lowered from €100,000 to €30,000.
d) The maximum default probability for loans posted individually has been raised from 1.0 to 1.5 per cent, also to take account of the cyclically induced deterioration in non-financial firms’ creditworthiness.
e) Loans granted under financial leasing and non-recourse factoring agreements are now eligible within the ordinary framework, with lower haircuts than in the temporary framework.
1 The measures comply with the rules established by the Governing Council of the ECB for the Eurosystem’s ordinary collateral framework and the temporary framework for Additional Credit Claims (where the eligibility characteristics are less stringent, haircuts are larger and the risk is assumed by the national central banks).2 Bank of Italy’s press release of 8 September 2014, “New measures on bank loans eligible as collateral in Eurosystem refinancing operations”.
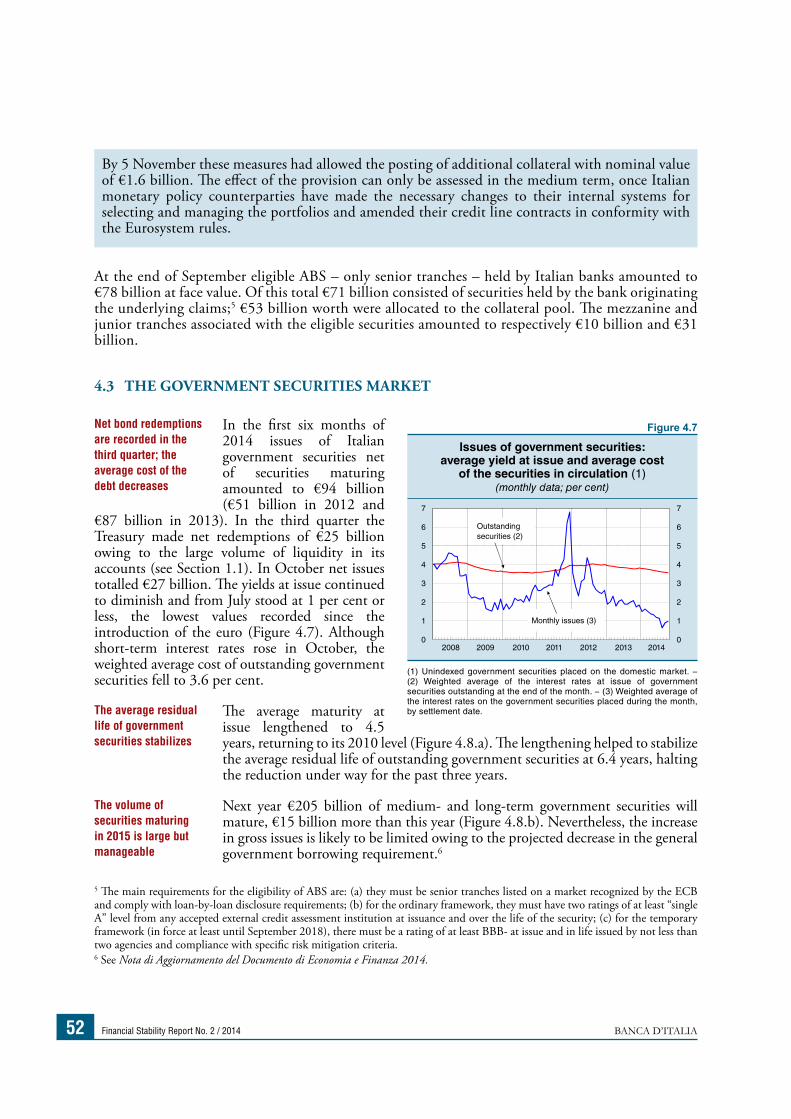
Financial Stability Report No. 2 / 2014 BANCA D’ITALIA52
At the end of September eligible ABS – only senior tranches – held by Italian banks amounted to €78 billion at face value. Of this total €71 billion consisted of securities held by the bank originating the underlying claims;5 €53 billion worth were allocated to the collateral pool. The mezzanine and junior tranches associated with the eligible securities amounted to respectively €10 billion and €31 billion.
4.3 THE GOVERNMENT SECURITIES MARKET
In the first six months of 2014 issues of Italian government securities net of securities maturing amounted to €94 billion (€51 billion in 2012 and
€87 billion in 2013). In the third quarter the Treasury made net redemptions of €25 billion owing to the large volume of liquidity in its accounts (see Section 1.1). In October net issues totalled €27 billion. The yields at issue continued to diminish and from July stood at 1 per cent or less, the lowest values recorded since the introduction of the euro (Figure 4.7). Although short-term interest rates rose in October, the weighted average cost of outstanding government securities fell to 3.6 per cent.
The average maturity at issue lengthened to 4.5 years, returning to its 2010 level (Figure 4.8.a). The lengthening helped to stabilize the average residual life of outstanding government securities at 6.4 years, halting the reduction under way for the past three years.
Next year €205 billion of medium- and long-term government securities will mature, €15 billion more than this year (Figure 4.8.b). Nevertheless, the increase in gross issues is likely to be limited owing to the projected decrease in the general government borrowing requirement.6
5 The main requirements for the eligibility of ABS are: (a) they must be senior tranches listed on a market recognized by the ECB and comply with loan-by-loan disclosure requirements; (b) for the ordinary framework, they must have two ratings of at least “single A” level from any accepted external credit assessment institution at issuance and over the life of the security; (c) for the temporary framework (in force at least until September 2018), there must be a rating of at least BBB- at issue and in life issued by not less than two agencies and compliance with specific risk mitigation criteria.6 See Nota di Aggiornamento del Documento di Economia e Finanza 2014.
Net bond redemptions are recorded in the third quarter; the average cost of the debt decreases
The average residual life of government securities stabilizes
The volume of securities maturing in 2015 is large but manageable
Figure 4.7
Issues of government securities: average yield at issue and average cost
of the securities in circulation (1)(monthly data; per cent)
2008 2009 2010 2011 2012 2013 20140
1
2
3
4
5
6
7
0
1
2
3
4
5
6
7
Outstanding securities (2)
Monthly issues (3)
(1) Unindexed government securities placed on the domestic market. − (2) Weighted average of the interest rates at issue of government securities outstanding at the end of the month. − (3) Weighted average of the interest rates on the government securities placed during the month, by settlement date.
By 5 November these measures had allowed the posting of additional collateral with nominal value of €1.6 billion. The effect of the provision can only be assessed in the medium term, once Italian monetary policy counterparties have made the necessary changes to their internal systems for selecting and managing the portfolios and amended their credit line contracts in conformity with the Eurosystem rules.
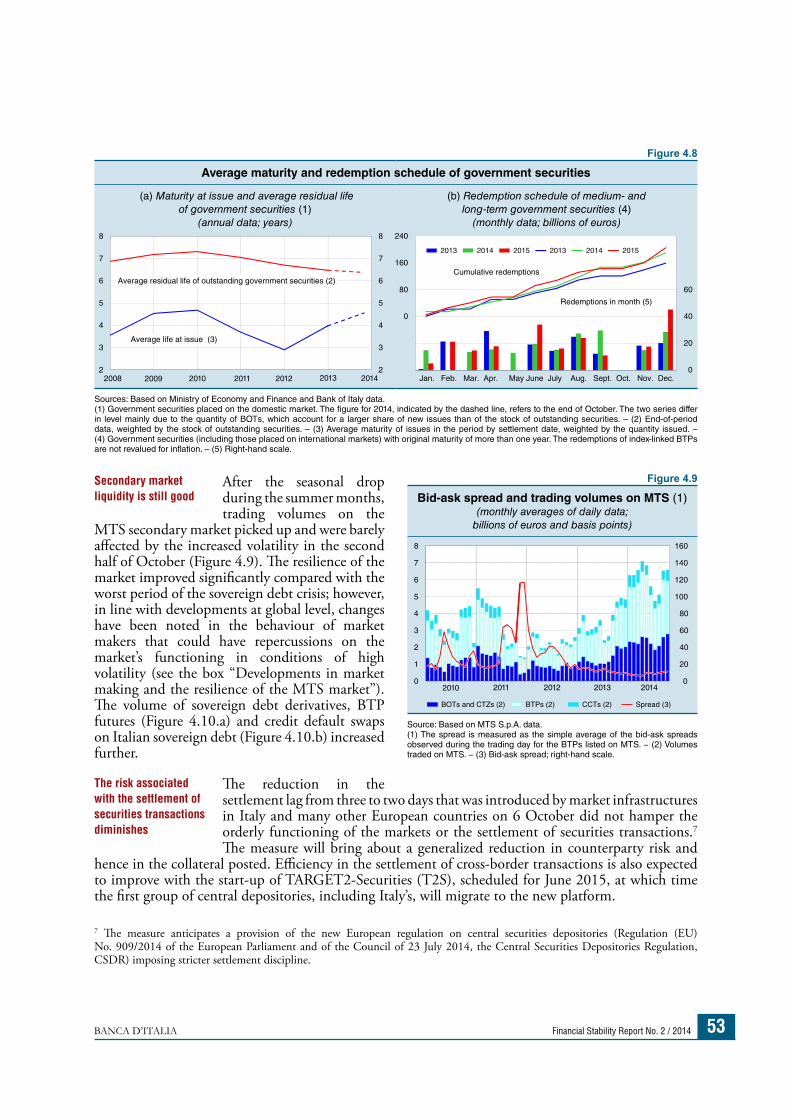
BANCA D’ITALIA Financial Stability Report No. 2 / 2014 53
After the seasonal drop during the summer months, trading volumes on the
MTS secondary market picked up and were barely affected by the increased volatility in the second half of October (Figure 4.9). The resilience of the market improved significantly compared with the worst period of the sovereign debt crisis; however, in line with developments at global level, changes have been noted in the behaviour of market makers that could have repercussions on the market’s functioning in conditions of high volatility (see the box “Developments in market making and the resilience of the MTS market”). The volume of sovereign debt derivatives, BTP futures (Figure 4.10.a) and credit default swaps on Italian sovereign debt (Figure 4.10.b) increased further.
The reduction in the settlement lag from three to two days that was introduced by market infrastructures in Italy and many other European countries on 6 October did not hamper the orderly functioning of the markets or the settlement of securities transactions.7 The measure will bring about a generalized reduction in counterparty risk and
hence in the collateral posted. Efficiency in the settlement of cross-border transactions is also expected to improve with the start-up of TARGET2-Securities (T2S), scheduled for June 2015, at which time the first group of central depositories, including Italy’s, will migrate to the new platform.
7 The measure anticipates a provision of the new European regulation on central securities depositories (Regulation (EU) No. 909/2014 of the European Parliament and of the Council of 23 July 2014, the Central Securities Depositories Regulation, CSDR) imposing stricter settlement discipline.
Secondary market liquidity is still good
The risk associated with the settlement of securities transactions diminishes
Figure 4.9
Bid-ask spread and trading volumes on MTS (1)(monthly averages of daily data;
billions of euros and basis points)
BOTs and CTZs (2) BTPs (2) CCTs (2) Spread (3)
2010 2011 2012 2013 2014 0
20
40
60
80
100
120
140
160
0
1
2
3
4
5
6
7
8
Source: Based on MTS S.p.A. data.(1) The spread is measured as the simple average of the bid-ask spreads observed during the trading day for the BTPs listed on MTS. − (2) Volumes traded on MTS. − (3) Bid-ask spread; right-hand scale.
Figure 4.8
Average maturity and redemption schedule of government securities
(a) Maturity at issue and average residual life of government securities (1)
(annual data; years)
(b) Redemption schedule of medium- and long-term government securities (4)
(monthly data; billions of euros)
0
20
40
60
0
80
160
240
Jan. Feb. Mar. Apr. May June July Aug. Sept. Oct. Nov. Dec.
2013 2014 2015 2013 2014 2015
Cumulative redemptions
Redemptions in month (5)
2009 2010 2011 2012 2013 201420082
3
4
5
6
7
8
2
3
4
5
6
7
8
Average residual life of outstanding government securities (2)
Average life at issue (3)
Sources: Based on Ministry of Economy and Finance and Bank of Italy data.(1) Government securities placed on the domestic market. The figure for 2014, indicated by the dashed line, refers to the end of October. The two series differ in level mainly due to the quantity of BOTs, which account for a larger share of new issues than of the stock of outstanding securities. – (2) End-of-period data, weighted by the stock of outstanding securities. – (3) Average maturity of issues in the period by settlement date, weighted by the quantity issued. − (4) Government securities (including those placed on international markets) with original maturity of more than one year. The redemptions of index-linked BTPs are not revalued for inflation. – (5) Right-hand scale.
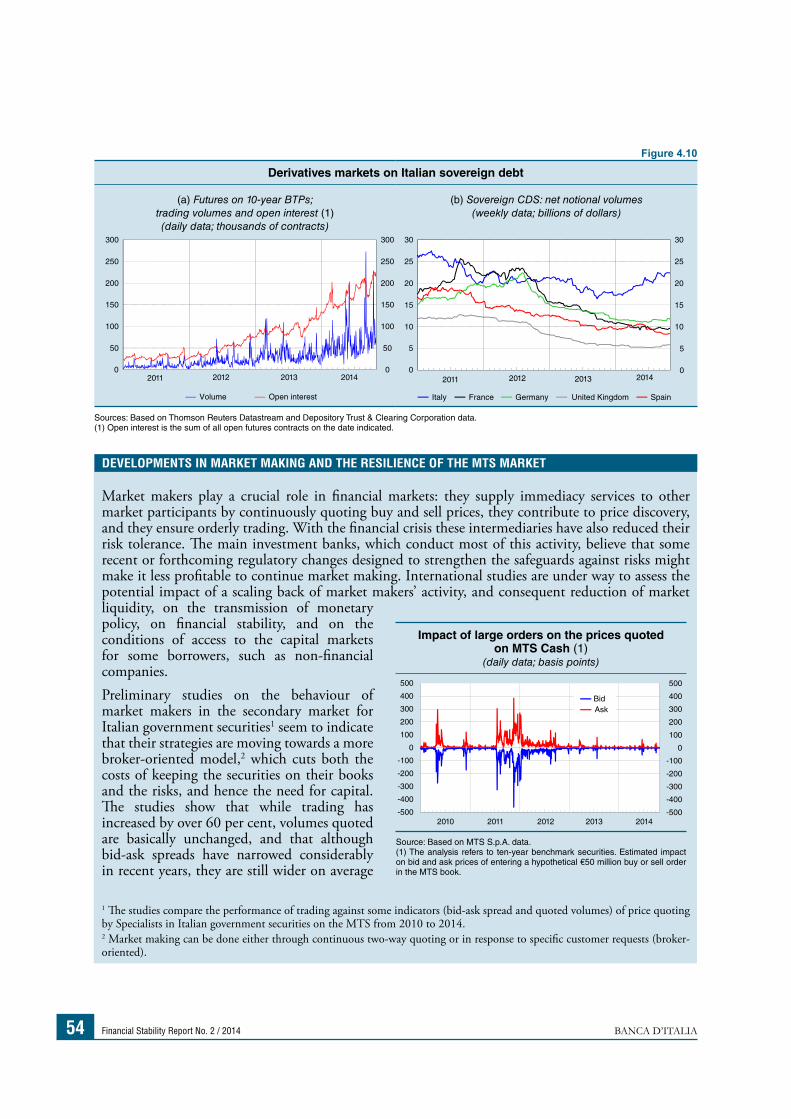
Financial Stability Report No. 2 / 2014 BANCA D’ITALIA54
Figure 4.10
Derivatives markets on Italian sovereign debt
(a) Futures on 10-year BTPs; trading volumes and open interest (1)(daily data; thousands of contracts)
(b) Sovereign CDS: net notional volumes(weekly data; billions of dollars)
Italy France Germany United Kingdom SpainVolume Open interest
2011 2012 2013 2014 0
5
10
15
20
25
30
0
5
10
15
20
25
30
2011 2012 2013 2014 0
50
100
150
200
250
300
0
50
100
150
200
250
300
Sources: Based on Thomson Reuters Datastream and Depository Trust & Clearing Corporation data.(1) Open interest is the sum of all open futures contracts on the date indicated.
DEVELOPMENTS IN MARKET MAKING AND THE RESILIENCE OF THE MTS MARKET
Market makers play a crucial role in financial markets: they supply immediacy services to other market participants by continuously quoting buy and sell prices, they contribute to price discovery, and they ensure orderly trading. With the financial crisis these intermediaries have also reduced their risk tolerance. The main investment banks, which conduct most of this activity, believe that some recent or forthcoming regulatory changes designed to strengthen the safeguards against risks might make it less profitable to continue market making. International studies are under way to assess the potential impact of a scaling back of market makers’ activity, and consequent reduction of market liquidity, on the transmission of monetary policy, on financial stability, and on the conditions of access to the capital markets for some borrowers, such as non-financial companies. Preliminary studies on the behaviour of market makers in the secondary market for Italian government securities1 seem to indicate that their strategies are moving towards a more broker-oriented model,2 which cuts both the costs of keeping the securities on their books and the risks, and hence the need for capital. The studies show that while trading has increased by over 60 per cent, volumes quoted are basically unchanged, and that although bid-ask spreads have narrowed considerably in recent years, they are still wider on average
1 The studies compare the performance of trading against some indicators (bid-ask spread and quoted volumes) of price quoting by Specialists in Italian government securities on the MTS from 2010 to 2014.2 Market making can be done either through continuous two-way quoting or in response to specific customer requests (broker-oriented).
Impact of large orders on the prices quoted on MTS Cash (1)
(daily data; basis points)
2010 2011 2012 2013 2014-500
-400
-300
-200
-100
0
100
200
300
400
500
BidAsk
-500
-400
-300
-200
-100
0
100
200
300
400
500
Source: Based on MTS S.p.A. data.(1) The analysis refers to ten-year benchmark securities. Estimated impact on bid and ask prices of entering a hypothetical €50 million buy or sell order in the MTS book.
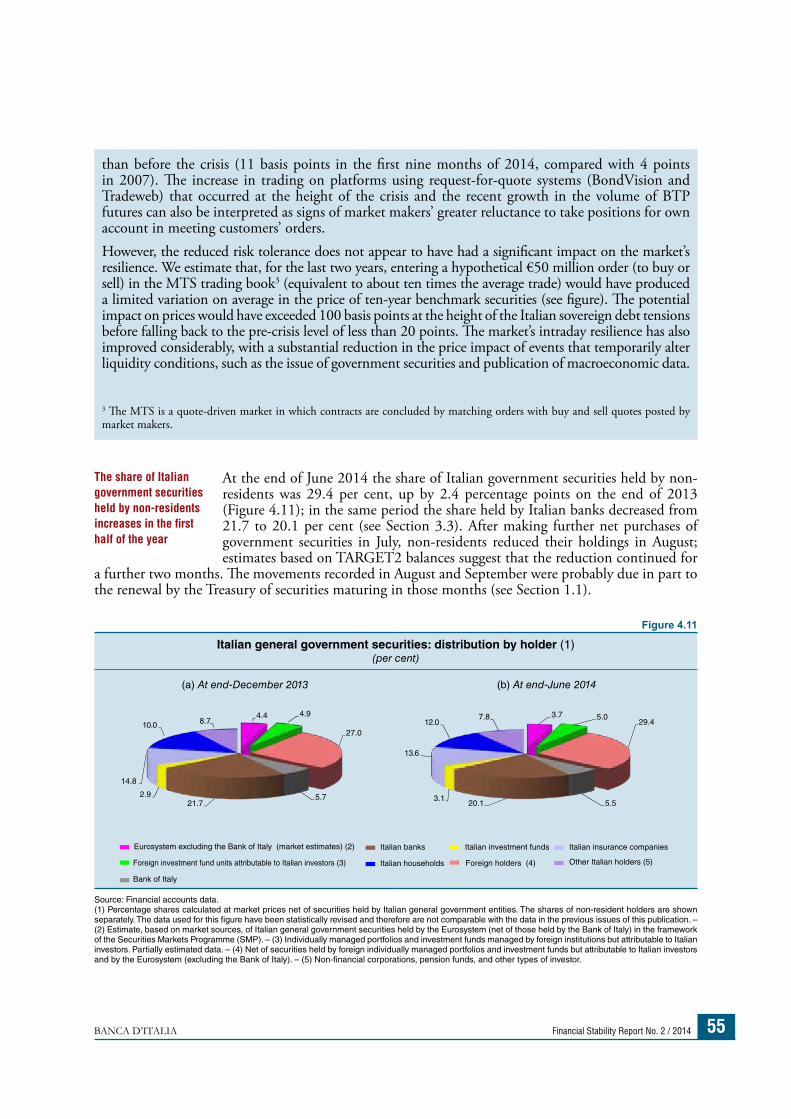
BANCA D’ITALIA Financial Stability Report No. 2 / 2014 55
At the end of June 2014 the share of Italian government securities held by non-residents was 29.4 per cent, up by 2.4 percentage points on the end of 2013 (Figure 4.11); in the same period the share held by Italian banks decreased from 21.7 to 20.1 per cent (see Section 3.3). After making further net purchases of government securities in July, non-residents reduced their holdings in August; estimates based on TARGET2 balances suggest that the reduction continued for
a further two months. The movements recorded in August and September were probably due in part to the renewal by the Treasury of securities maturing in those months (see Section 1.1).
The share of Italian government securities held by non-residents increases in the first half of the year
than before the crisis (11 basis points in the first nine months of 2014, compared with 4 points in 2007). The increase in trading on platforms using request-for-quote systems (BondVision and Tradeweb) that occurred at the height of the crisis and the recent growth in the volume of BTP futures can also be interpreted as signs of market makers’ greater reluctance to take positions for own account in meeting customers’ orders. However, the reduced risk tolerance does not appear to have had a significant impact on the market’s resilience. We estimate that, for the last two years, entering a hypothetical €50 million order (to buy or sell) in the MTS trading book3 (equivalent to about ten times the average trade) would have produced a limited variation on average in the price of ten-year benchmark securities (see figure). The potential impact on prices would have exceeded 100 basis points at the height of the Italian sovereign debt tensions before falling back to the pre-crisis level of less than 20 points. The market’s intraday resilience has also improved considerably, with a substantial reduction in the price impact of events that temporarily alter liquidity conditions, such as the issue of government securities and publication of macroeconomic data.
3 The MTS is a quote-driven market in which contracts are concluded by matching orders with buy and sell quotes posted by market makers.
Figure 4.11
Italian general government securities: distribution by holder (1)(per cent)
(a) At end-December 2013 (b) At end-June 2014
3.7 5.029.4
5.520.13.1
13.6
12.07.84.4 4.9
27.0
5.721.7
2.9
14.8
10.0 8.7
Italian banks Italian investment funds
Italian households
Italian insurance companies
Other Italian holders (5)Foreign holders (4)
Eurosystem excluding the Bank of Italy (market estimates) (2)
Foreign investment fund units attributable to Italian investors (3)
Bank of Italy
Source: Financial accounts data.(1) Percentage shares calculated at market prices net of securities held by Italian general government entities. The shares of non-resident holders are shown separately. The data used for this figure have been statistically revised and therefore are not comparable with the data in the previous issues of this publication. – (2) Estimate, based on market sources, of Italian general government securities held by the Eurosystem (net of those held by the Bank of Italy) in the framework of the Securities Markets Programme (SMP). – (3) Individually managed portfolios and investment funds managed by foreign institutions but attributable to Italian investors. Partially estimated data. – (4) Net of securities held by foreign individually managed portfolios and investment funds but attributable to Italian investors and by the Eurosystem (excluding the Bank of Italy). – (5) Non-financial corporations, pension funds, and other types of investor.