Embed Size (px)
DESCRIPTION
Balancing Evaluation and Program Needs. REAP Symposium 2009. Agenda. Introduction EYA Organizational Overview Performance and Quality Improvement Division PQI Charge from the EYA Leadership Team Method: Cross-functional Teams Areas of Focus - PowerPoint PPT Presentation
Citation preview

Balancing Evaluation and Balancing Evaluation and Program NeedsProgram Needs
Balancing Evaluation and Balancing Evaluation and Program NeedsProgram Needs
REAP Symposium 2009REAP Symposium 2009
AgendaAgenda• Introduction• EYA Organizational Overview• Performance and Quality Improvement Division• PQI Charge from the EYA Leadership Team• Method: Cross-functional Teams• Areas of Focus
• Balanced Scorecard/ Key Performance Indicators• Master Quality Plan and Toolkit• Totally Integrated Electronic Record• Report Functionality
• Integrating Processes • Q and A
“It is one of the most beautiful compensations of this life that no person can sincerely try to help another without helping oneself.”
~Ralph Waldo Emerson

January 27, 20093
A Proven HistoryA Proven HistoryPioneering “Firsts”Pioneering “Firsts”
1968: First provider of an outdoor therapeutic program in Florida.
1969: First provider of an outdoor therapeutic program for Girls in the Southeast.
1982: First Private Provider of State Training School in Southeast.
1985: Funded/Implemented Demonstration Project for ReEntry in Florida.
1991: Funded and Implemented Early Intervention Demonstration Project (Hi-Five).
1994: One of First Private Providers of High Risk Programming for Girls in Florida.
1996: External Review of Data and Programs and Outcomes by Clemson and Harvard.
1996: First Outdoor Therapeutic Programs to be Accredited by COA.
2001: Largest private provider of conditional release programming in Florida.
2007: Achieves agency-wide COA accreditation.
2008: EYA Becomes Lead Agency Provider.
Eckerd Youth Alternatives Eckerd Youth Alternatives Mission: Develop and share programs that promote the well-being of
children and serve at-risk youth and their families.
Vision: Ensure that each child has the opportunity to succeed.

• We base our concepts upon a belief in God and the uniqueness and inherent worth of each individual.
• We believe that youth always come first. • We strive to assist youth in developing their potential to achieve
balanced physical, intellectual, emotional, and spiritual strength. • We believe that youth and their families are our partners in
treatment. • We seek to build a culturally diverse organization that honors the
cultural diversity of the youth, families and communities we serve. • We embrace innovation, flexibility, reflection, and continuous
improvement. • We thrive in a culture of learning, personal development and
professional growth. • We value all members of our staff and strive to provide the highest
level of care and support to each. • We hold ourselves accountable for achieving superior outcomes. • We strive for excellence in all of our endeavors.
EYA Values EYA Values

Continuum of Services for Youth and FamiliesContinuum of Services for Youth and Families

January 27, 20098
Safety Quality Assurance Performance
Improvement& Planning
Evidence-Based Practices & Outcomes
Areas of FocusAreas of Focus
QUALITY
STAFF
Targeted Recruitment Professional
Development Retention
FINANCIAL
Fiscal Strength & Discipline
Accurate Analysis & Forecasting
Capital Allocation & Cash Management
EXTERNAL RELATIONS
Donor Cultivation Communications &
Publications Alumni Relations
GROWTH ANDTRANSFORMATION
Mission-Driven Reinvestment Business Viability Assessment Marketplace Analysis Targeted Retooling
& Expansion

Performance & Quality ImprovementPerformance & Quality ImprovementPerformance & Quality ImprovementPerformance & Quality Improvement
As a performance-based organization, we clearly define, As a performance-based organization, we clearly define, collect, validate, analyze and communicate our outcomes collect, validate, analyze and communicate our outcomes to make informed decisions based on evidenceto make informed decisions based on evidence
Cross-functional TeamsCross-functional Teams• Balanced Scorecard• Master Quality Improvement Plan with Toolkit• Data Collection (Totally Integrated Electronic
Record) and Report Functionality

Balanced Scorecard TeamBalanced Scorecard TeamThe Balance Scorecard™ is a performance management tool that tracks the most important goals and initiatives at an organization. It measures financial and operational activities to ensure that they are aligned with the organizational mission, vision and strategies.
SummarySummary
Benefit Ensures consistency and thoughtfullness in the methodologies used to measure outcomes and provides feedback to all levels of the organization.
Tasks • Prepare list of the different scorecards• Select the measurement criteria • Identify data source, instrument, collection,
analysis, reporting for each measurement• Create communication tool
Effort: Medium
Impact: High
Balanced Scorecard BasicsBalanced Scorecard Basics
• Developed by Robert Kaplan and David Norton (1990)Developed by Robert Kaplan and David Norton (1990)• Based on research exploring organizational performance measurementBased on research exploring organizational performance measurement• Communication ToolCommunication Tool• Measurement SystemMeasurement System• Strategic Management SystemStrategic Management System
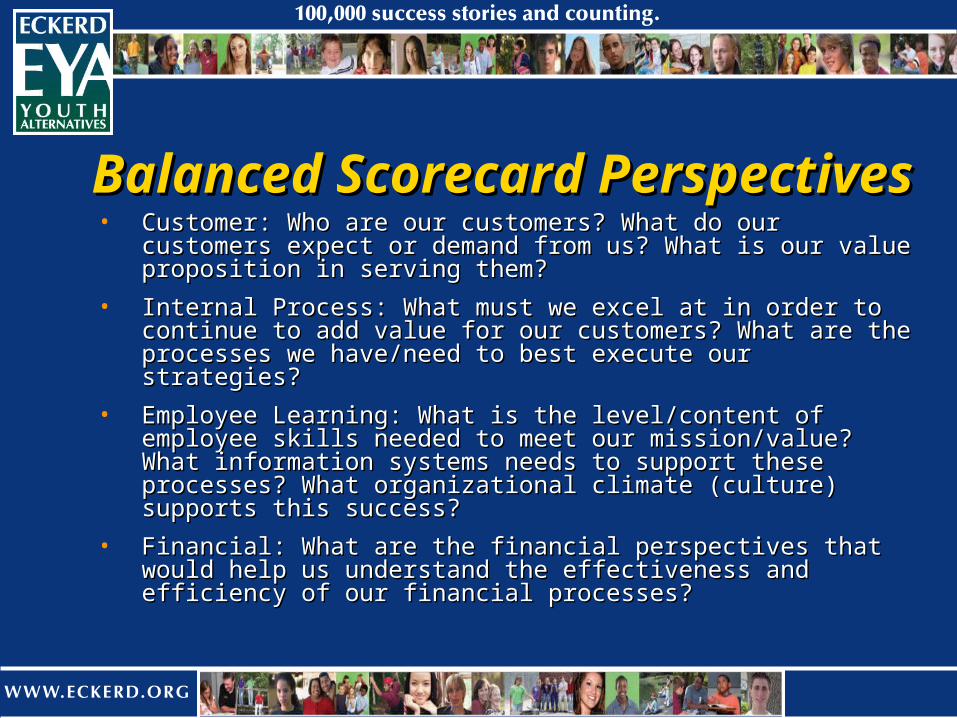
Balanced Scorecard PerspectivesBalanced Scorecard Perspectives• Customer: Who are our customers? What do our customers Customer: Who are our customers? What do our customers
expect or demand from us? What is our value proposition in expect or demand from us? What is our value proposition in serving them?serving them?
• Internal Process: What must we excel at in order to continue to Internal Process: What must we excel at in order to continue to add value for our customers? What are the processes we add value for our customers? What are the processes we have/need to best execute our strategies?have/need to best execute our strategies?
• Employee Learning: What is the level/content of employee skills Employee Learning: What is the level/content of employee skills needed to meet our mission/value? What information systems needed to meet our mission/value? What information systems needs to support these processes? What organizational climate needs to support these processes? What organizational climate (culture) supports this success?(culture) supports this success?
• Financial: What are the financial perspectives that would help us Financial: What are the financial perspectives that would help us understand the effectiveness and efficiency of our financial understand the effectiveness and efficiency of our financial processes?processes?

Balanced Scorecard PerspectivesBalanced Scorecard PerspectivesBalanced ScorecardBalanced Scorecard CurrentCurrent DepartmentsDepartments
Customer/ClientCustomer/Client QualityQuality OperationsOperations
External RelationsExternal Relations
Employee LearningEmployee Learning StaffStaff Human ResourcesHuman Resources
Internal ProcessInternal Process GrowthGrowth DevelopmentDevelopment
PQIPQI
EducationEducation
Facilities ServicesFacilities Services
AdmissionsAdmissions
FinancialFinancial FinancialFinancial Treasury/Risk MgtTreasury/Risk Mgt
AccountingAccounting

Performance Measure CriteriaPerformance Measure Criteria•Linked to strategyLinked to strategy•Easily understoodEasily understood•Link in a chain of cause and effectLink in a chain of cause and effect•Updated frequentlyUpdated frequently•AccessibleAccessible•Measurable (averages, avoiding initiatives)Measurable (averages, avoiding initiatives)•Is it driving the “right” behavior?Is it driving the “right” behavior?
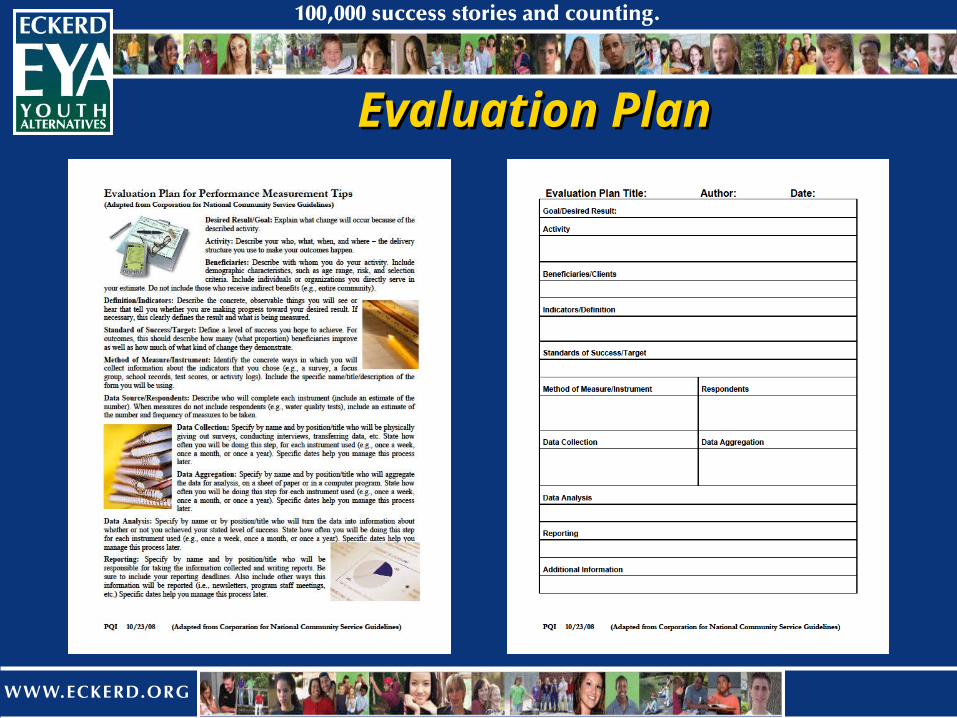
Evaluation PlanEvaluation Plan

Sample Evaluation PlanSample Evaluation Plan
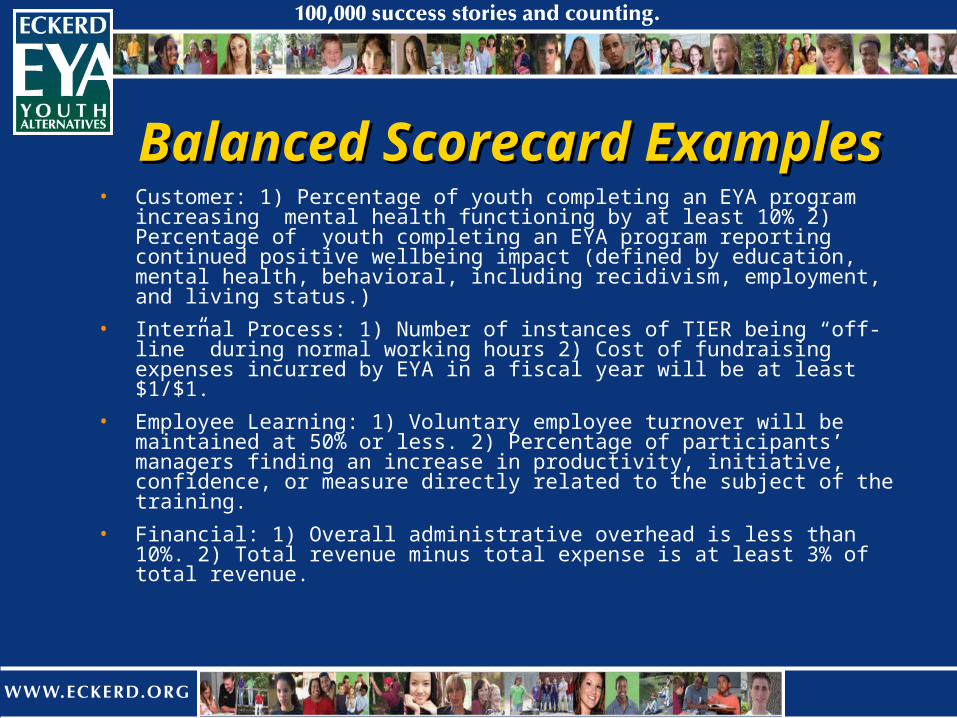
Balanced Scorecard ExamplesBalanced Scorecard Examples• Customer: 1) Percentage of youth completing an EYA program
increasing mental health functioning by at least 10% 2) Percentage of youth completing an EYA program reporting continued positive wellbeing impact (defined by education, mental health, behavioral, including recidivism, employment, and living status.)
• Internal Process: 1) Number of instances of TIER being “off-line” during normal working hours 2) Cost of fundraising expenses incurred by EYA in a fiscal year will be at least $1/$1.
• Employee Learning: 1) Voluntary employee turnover will be maintained at 50% or less. 2) Percentage of participants’ managers finding an increase in productivity, initiative, confidence, or measure directly related to the subject of the training.
• Financial: 1) Overall administrative overhead is less than 10%. 2) Total revenue minus total expense is at least 3% of total revenue.

Master QI Plan TeamMaster QI Plan Team
SummarySummary
Benefit
Effort: High
Impact: High
A comprehensive document that establishes organizational strategies for identifying critical areas, assessing, developing and implementing quality assurance objectives and procedures in a consistent and methodical way.
Allows us to deliver top quality care to our clients, provide excellent, reliable data and information to our internal and external customers and measures outcomes for continuous quality improvement.
• Assess current systems and tools• Cross functional needs assessment• Define requirements, resources and
deliverables• Implementation strategies that include
training and ongoing support.
Tasks

Data and Reporting TeamData and Reporting Team
Effort: Medium
Impact: Medium
SummarySummary
Benefit
Several key tools are used to track and report the quality monitoring and response information, including PBViews and TIER computer systems. This initiative will re-deploy these systems and train the individuals who will be using the systems.
Appropriate tools to capture and report large amounts of data is critical in the monitoring of a diverse group of programs in multiple locations. Having effective tools will minimize the time required by staff and leadership to report and analyze quality data.
• Deploy software with clear expectations on who and when data will be entered
• Engage vendor to re-deploy TIER system• Create a training plan for all users of the
different systems to ensure they are comfortable using the system
Tasks

Business Users
Summary InformationSummary Information
Transactional DetailsTransactional Details
Management
Portal/IntranetPortal/Intranet
Everyone
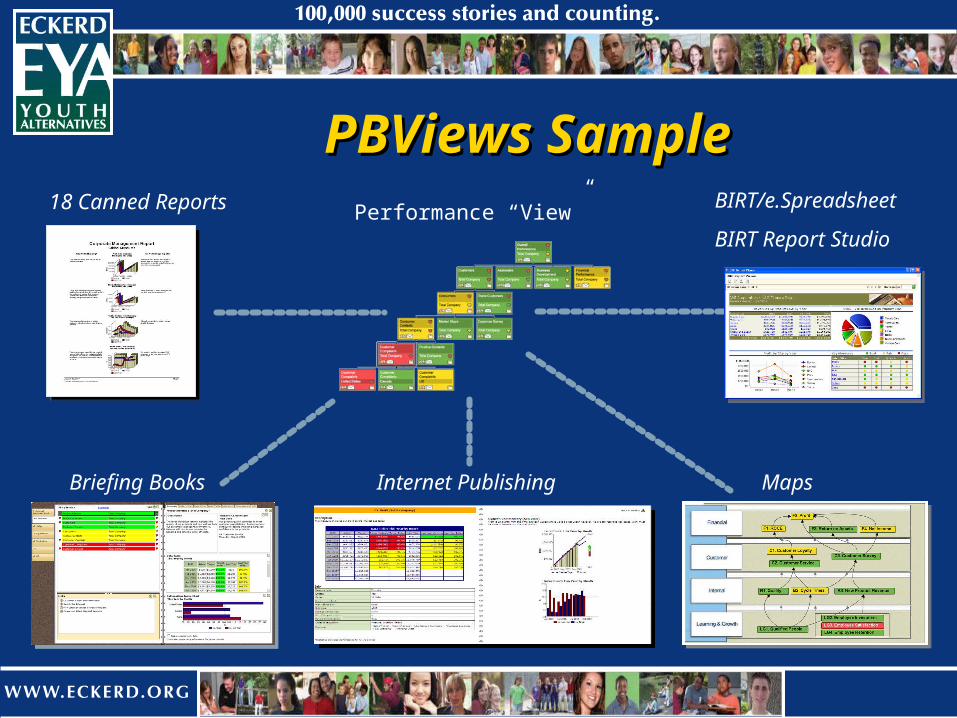
PBViews Sample PBViews Sample
Maps
18 Canned Reports
Briefing Books Internet Publishing
Performance “View”BIRT/e.Spreadsheet
BIRT Report Studio
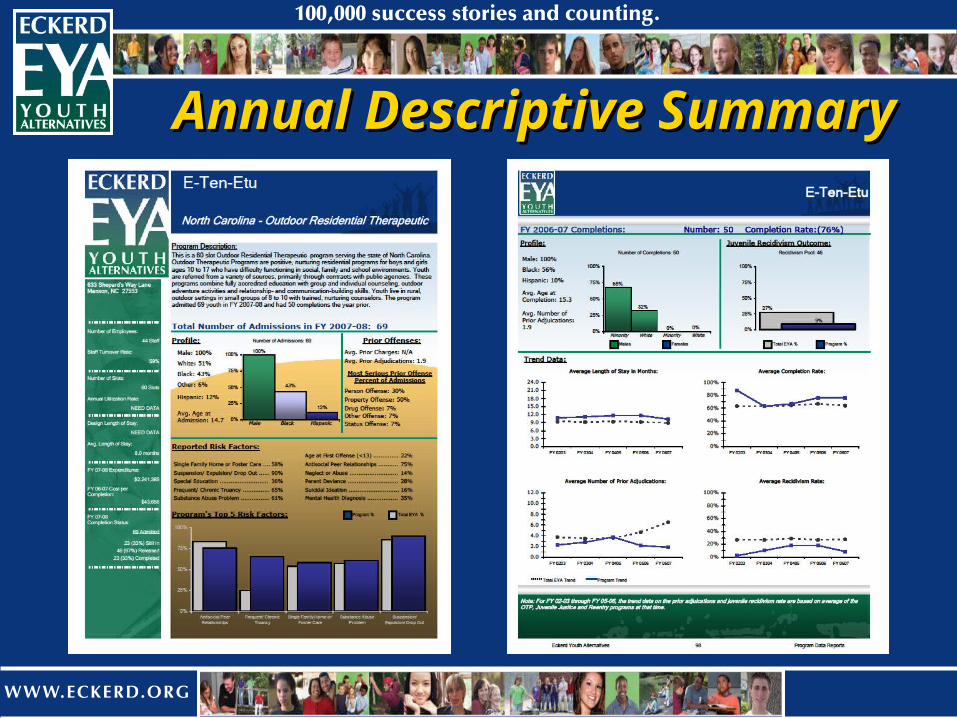
Annual Descriptive SummaryAnnual Descriptive Summary
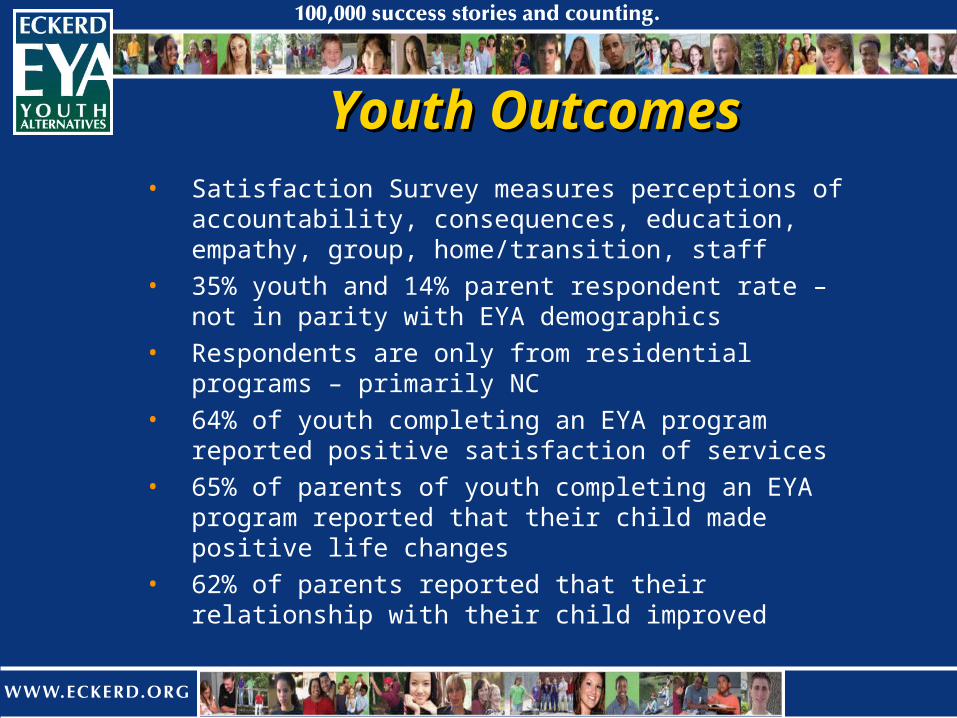
Youth OutcomesYouth Outcomes• Satisfaction Survey measures perceptions of
accountability, consequences, education, empathy, group, home/transition, staff
• 35% youth and 14% parent respondent rate – not in parity with EYA demographics
• Respondents are only from residential programs – primarily NC
• 64% of youth completing an EYA program reported positive satisfaction of services
• 65% of parents of youth completing an EYA program reported that their child made positive life changes
• 62% of parents reported that their relationship with their child improved
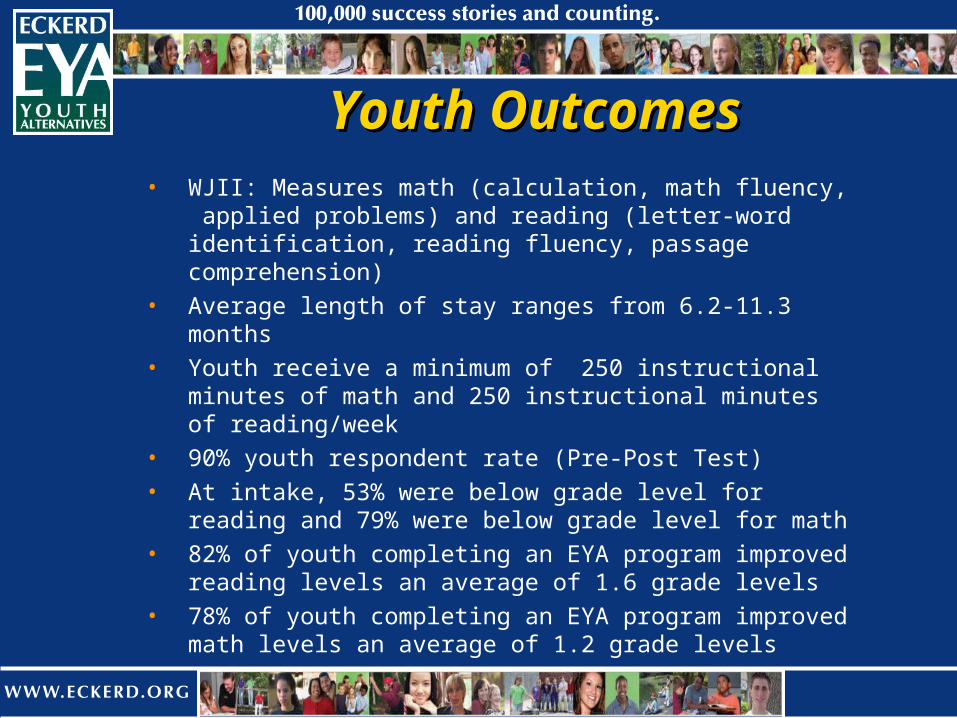
Youth OutcomesYouth Outcomes• WJII: Measures math (calculation, math fluency,
applied problems) and reading (letter-word identification, reading fluency, passage comprehension)
• Average length of stay ranges from 6.2-11.3 months• Youth receive a minimum of 250 instructional minutes
of math and 250 instructional minutes of reading/week• 90% youth respondent rate (Pre-Post Test)• At intake, 53% were below grade level for reading and
79% were below grade level for math• 82% of youth completing an EYA program improved
reading levels an average of 1.6 grade levels • 78% of youth completing an EYA program improved
math levels an average of 1.2 grade levels
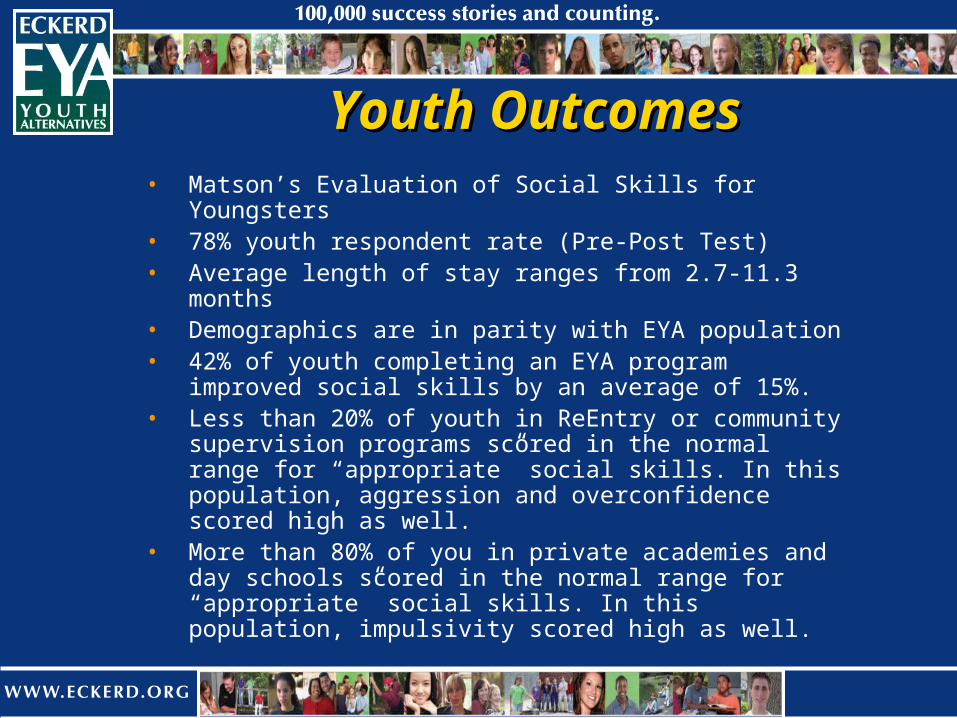
Youth OutcomesYouth Outcomes• Matson’s Evaluation of Social Skills for Youngsters• 78% youth respondent rate (Pre-Post Test)• Average length of stay ranges from 2.7-11.3 months• Demographics are in parity with EYA population• 42% of youth completing an EYA program improved
social skills by an average of 15%.• Less than 20% of youth in ReEntry or community
supervision programs scored in the normal range for “appropriate” social skills. In this population, aggression and overconfidence scored high as well.
• More than 80% of you in private academies and day schools scored in the normal range for “appropriate” social skills. In this population, impulsivity scored high as well.
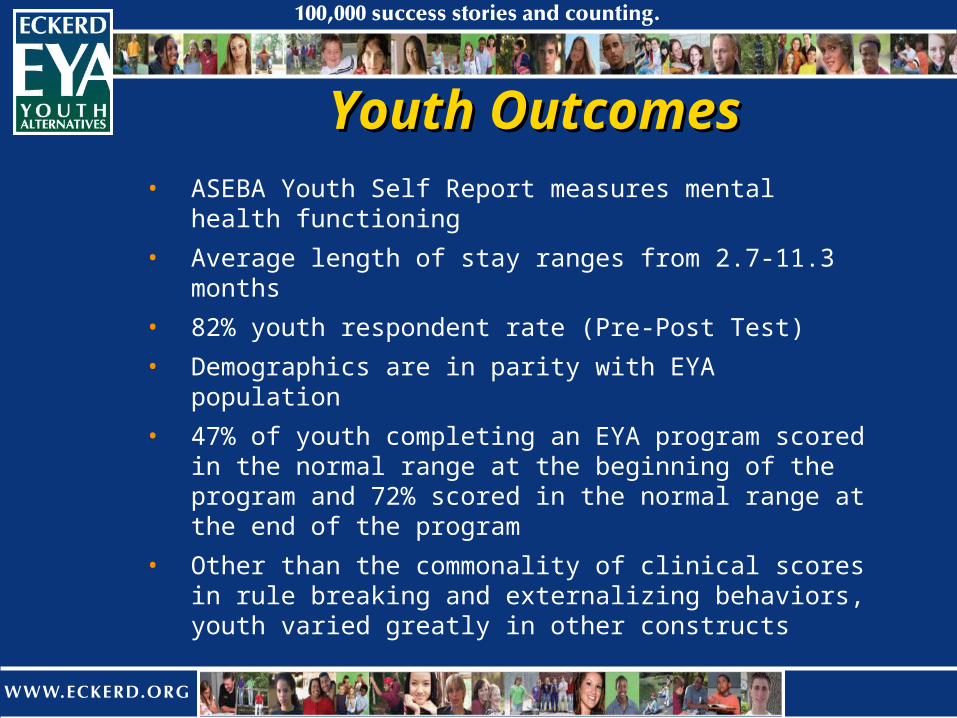
Youth OutcomesYouth Outcomes• ASEBA Youth Self Report measures mental health
functioning
• Average length of stay ranges from 2.7-11.3 months
• 82% youth respondent rate (Pre-Post Test)
• Demographics are in parity with EYA population
• 47% of youth completing an EYA program scored in the normal range at the beginning of the program and 72% scored in the normal range at the end of the program
• Other than the commonality of clinical scores in rule breaking and externalizing behaviors, youth varied greatly in other constructs
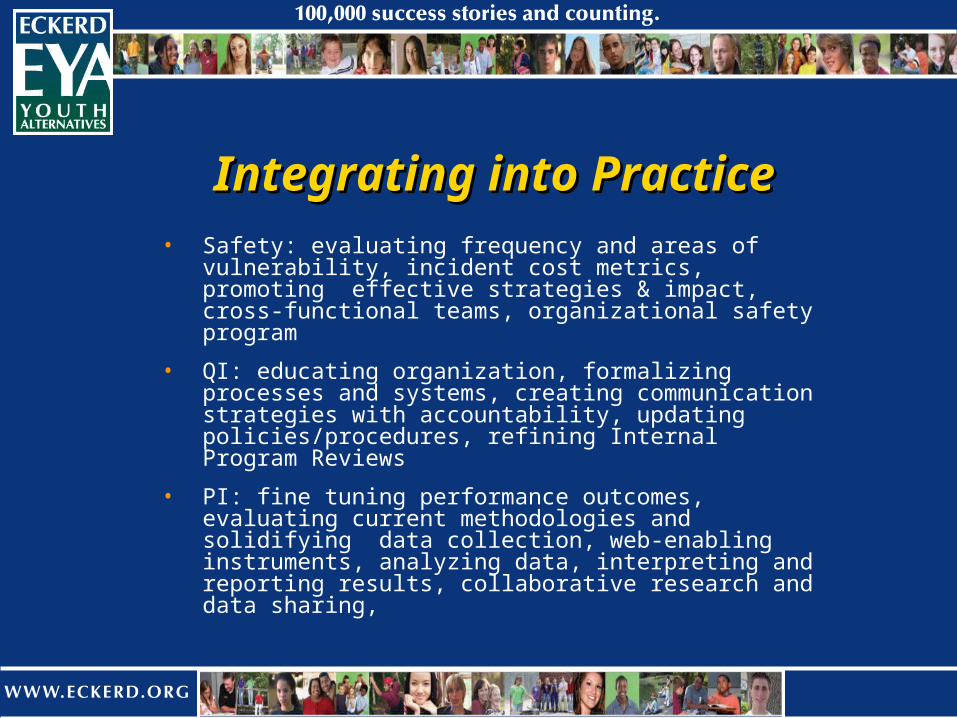
Integrating into PracticeIntegrating into Practice• Safety: evaluating frequency and areas of
vulnerability, incident cost metrics, promoting effective strategies & impact, cross-functional teams, organizational safety program
• QI: educating organization, formalizing processes and systems, creating communication strategies with accountability, updating policies/procedures, refining Internal Program Reviews
• PI: fine tuning performance outcomes, evaluating current methodologies and solidifying data collection, web-enabling instruments, analyzing data, interpreting and reporting results, collaborative research and data sharing,
January 27, 200929
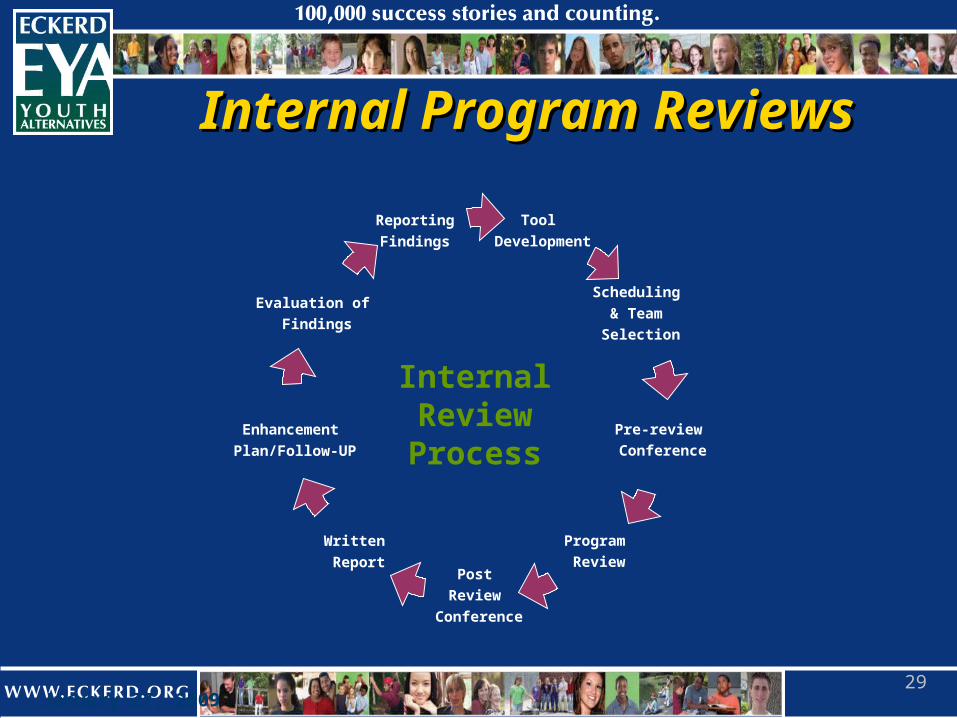
Internal Program Reviews Internal Program Reviews
Tool Development
Scheduling & Team Selection
Pre-review Conference
Program Review
Post Review
Conference
Written Report
Enhancement Plan/Follow-UP
Evaluation of Findings
ReportingFindings
Internal Review Process
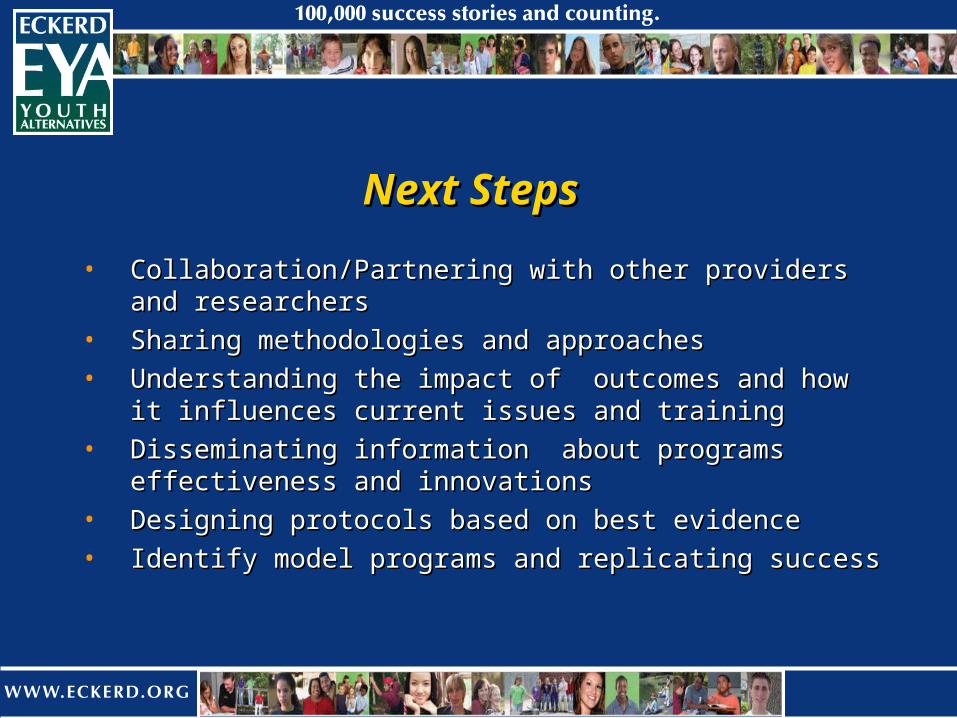
Next StepsNext Steps
• Collaboration/Partnering with other providers and researchersCollaboration/Partnering with other providers and researchers• Sharing methodologies and approachesSharing methodologies and approaches• Understanding the impact of outcomes and how it influences Understanding the impact of outcomes and how it influences
current issues and trainingcurrent issues and training• Disseminating information about programs effectiveness and Disseminating information about programs effectiveness and
innovationsinnovations• Designing protocols based on best evidenceDesigning protocols based on best evidence• Identify model programs and replicating successIdentify model programs and replicating success
Q and AQ and AOpportunity is missed by most because it is dressed in
overalls and looks like work. ~Thomas Edison
Maurie Lung, LMHC, LMFTEckerd Youth Alternatives, Inc./Life Adventures Counseling & ConsultingPO Box 10907, St. Petersburg, FL [email protected]
Greg Holeman, Chief Quality OfficerEckerd Youth Alternatives100 N. Starcrest Dr., Clearwater, FL 33765727-461-1236 [email protected]