Embed Size (px)
Citation preview
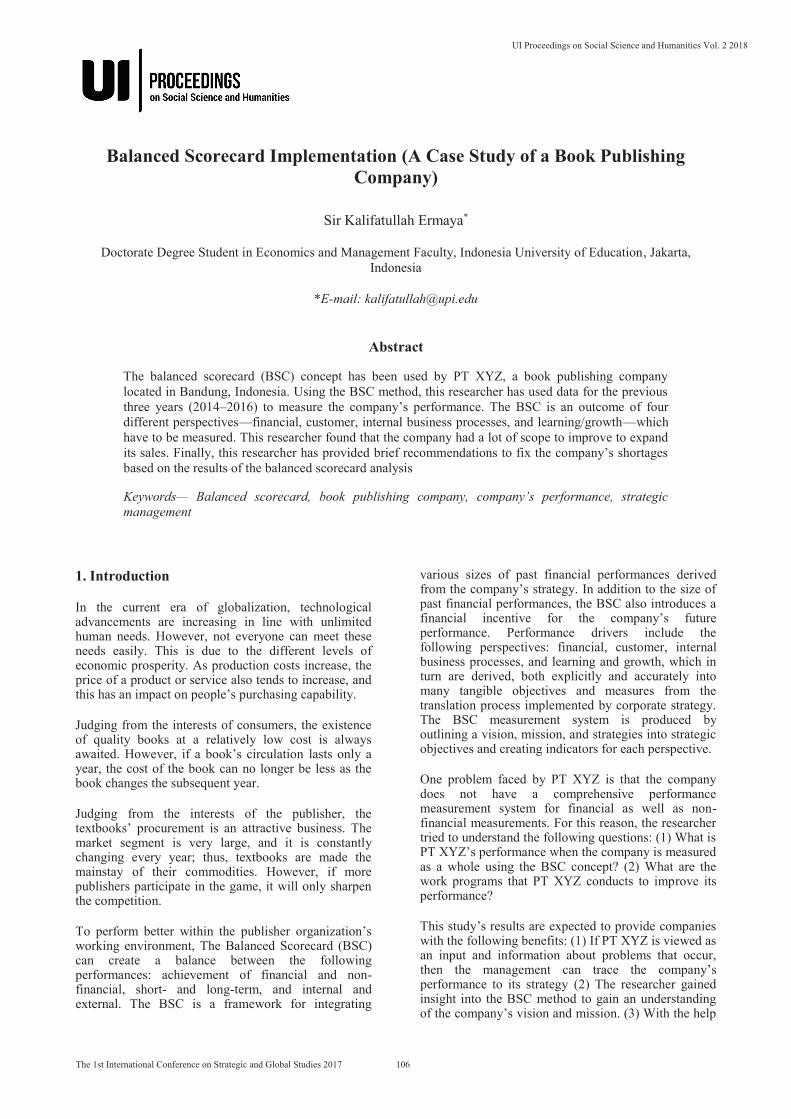
Balanced Scorecard Implementation (A Case Study of a Book Publishing Company)
Sir Kalifatullah Ermaya*
Doctorate Degree Student in Economics and Management Faculty, Indonesia University of Education, Jakarta, Indonesia
*E-mail: [email protected]
Abstract
The balanced scorecard (BSC) concept has been used by PT XYZ, a book publishing company located in Bandung, Indonesia. Using the BSC method, this researcher has used data for the previous three years (2014–2016) to measure the company’s performance. The BSC is an outcome of four different perspectives—financial, customer, internal business processes, and learning/growth—which have to be measured. This researcher found that the company had a lot of scope to improve to expand its sales. Finally, this researcher has provided brief recommendations to fix the company’s shortages based on the results of the balanced scorecard analysis
Keywords— Balanced scorecard, book publishing company, company’s performance, strategic management
1. Introduction
In the current era of globalization, technological advancements are increasing in line with unlimited human needs. However, not everyone can meet these needs easily. This is due to the different levels of economic prosperity. As production costs increase, the price of a product or service also tends to increase, and this has an impact on people’s purchasing capability.
Judging from the interests of consumers, the existence of quality books at a relatively low cost is always awaited. However, if a book’s circulation lasts only a year, the cost of the book can no longer be less as the book changes the subsequent year.
Judging from the interests of the publisher, the textbooks’ procurement is an attractive business. The market segment is very large, and it is constantly changing every year; thus, textbooks are made the mainstay of their commodities. However, if more publishers participate in the game, it will only sharpen the competition.
To perform better within the publisher organization’s working environment, The Balanced Scorecard (BSC) can create a balance between the following performances: achievement of financial and non-financial, short- and long-term, and internal and external. The BSC is a framework for integrating
various sizes of past financial performances derived from the company’s strategy. In addition to the size of past financial performances, the BSC also introduces a financial incentive for the company’s future performance. Performance drivers include the following perspectives: financial, customer, internal business processes, and learning and growth, which in turn are derived, both explicitly and accurately into many tangible objectives and measures from the translation process implemented by corporate strategy. The BSC measurement system is produced by outlining a vision, mission, and strategies into strategic objectives and creating indicators for each perspective.
One problem faced by PT XYZ is that the company does not have a comprehensive performance measurement system for financial as well as non-financial measurements. For this reason, the researcher tried to understand the following questions: (1) What is PT XYZ’s performance when the company is measured as a whole using the BSC concept? (2) What are the work programs that PT XYZ conducts to improve its performance?
This study’s results are expected to provide companies with the following benefits: (1) If PT XYZ is viewed as an input and information about problems that occur, then the management can trace the company’s performance to its strategy (2) The researcher gained insight into the BSC method to gain an understanding of the company’s vision and mission. (3) With the help
UI Proceedings on Social Science and Humanities Vol. 2 2018
106The 1st International Conference on Strategic and Global Studies 2017
of the BSC readers can understand the management-related.
2. Literature Review
Strategic Management
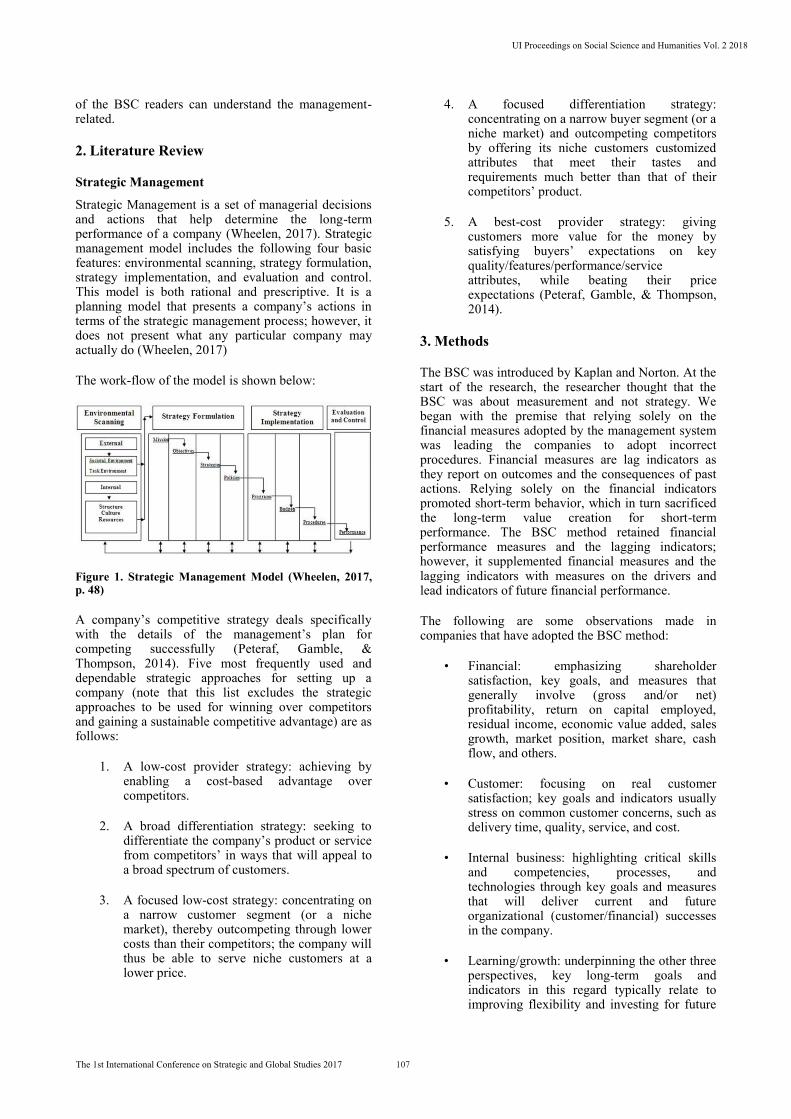
Strategic Management is a set of managerial decisions and actions that help determine the long-term performance of a company (Wheelen, 2017). Strategic management model includes the following four basic features: environmental scanning, strategy formulation, strategy implementation, and evaluation and control. This model is both rational and prescriptive. It is a planning model that presents a company’s actions in terms of the strategic management process; however, it does not present what any particular company may actually do (Wheelen, 2017)
The work-flow of the model is shown below:
Figure 1. Strategic Management Model (Wheelen, 2017, p. 48)
A company’s competitive strategy deals specifically with the details of the management’s plan for competing successfully (Peteraf, Gamble, & Thompson, 2014). Five most frequently used and dependable strategic approaches for setting up a company (note that this list excludes the strategic approaches to be used for winning over competitors and gaining a sustainable competitive advantage) are as follows:
1. A low-cost provider strategy: achieving by enabling a cost-based advantage over competitors.
2. A broad differentiation strategy: seeking to differentiate the company’s product or service from competitors’ in ways that will appeal to a broad spectrum of customers.
3. A focused low-cost strategy: concentrating on a narrow customer segment (or a niche market), thereby outcompeting through lower costs than their competitors; the company will thus be able to serve niche customers at a lower price.
4. A focused differentiation strategy: concentrating on a narrow buyer segment (or a niche market) and outcompeting competitors by offering its niche customers customized attributes that meet their tastes and requirements much better than that of their competitors’ product.
5. A best-cost provider strategy: giving customers more value for the money by satisfying buyers’ expectations on key quality/features/performance/service attributes, while beating their price expectations (Peteraf, Gamble, & Thompson, 2014).
3. Methods
The BSC was introduced by Kaplan and Norton. At the start of the research, the researcher thought that the BSC was about measurement and not strategy. We began with the premise that relying solely on the financial measures adopted by the management system was leading the companies to adopt incorrect procedures. Financial measures are lag indicators as they report on outcomes and the consequences of past actions. Relying solely on the financial indicators promoted short-term behavior, which in turn sacrificed the long-term value creation for short-term performance. The BSC method retained financial performance measures and the lagging indicators; however, it supplemented financial measures and the lagging indicators with measures on the drivers and lead indicators of future financial performance.
The following are some observations made in companies that have adopted the BSC method:
• Financial: emphasizing shareholder satisfaction, key goals, and measures that generally involve (gross and/or net) profitability, return on capital employed, residual income, economic value added, sales growth, market position, market share, cash flow, and others.
• Customer: focusing on real customer satisfaction; key goals and indicators usually stress on common customer concerns, such as delivery time, quality, service, and cost.
• Internal business: highlighting critical skills and competencies, processes, and technologies through key goals and measures that will deliver current and future organizational (customer/financial) successes in the company.
• Learning/growth: underpinning the other three perspectives, key long-term goals and indicators in this regard typically relate to improving flexibility and investing for future
UI Proceedings on Social Science and Humanities Vol. 2 2018
107The 1st International Conference on Strategic and Global Studies 2017
development and new opportunities (Atkinson, 2006, p. 53–54).
4. Result and Discussion
Results of the data are derived by performing a Cascading BSC (Luis, 2007) both at the company and divisional levels to measure the performance of the BSC management system through continuous improvement programs. Establishing performance targets using the BSC method is based on the following four perspectives: financial, customer, internal business processes, and learning/growth. The cascading process was performed through the following steps:
Step 1: Division Purpose
In the early stages of the performance of the BSC Cascading corporate level in each division, a study on each of the divisions should be conducted; this should include an analysis of the vision and mission of the division. The vision and mission of this division must align with that of the company’s. The divisions included in the analysis are as follows: finance, marketing, production, and human resource. These four divisions were chosen as they provided greatest influences in improving business performance in PT XYZ. The mission statement has represented the company from various perspectives; this is also a measure of performance.
Step 2: Division Relevance
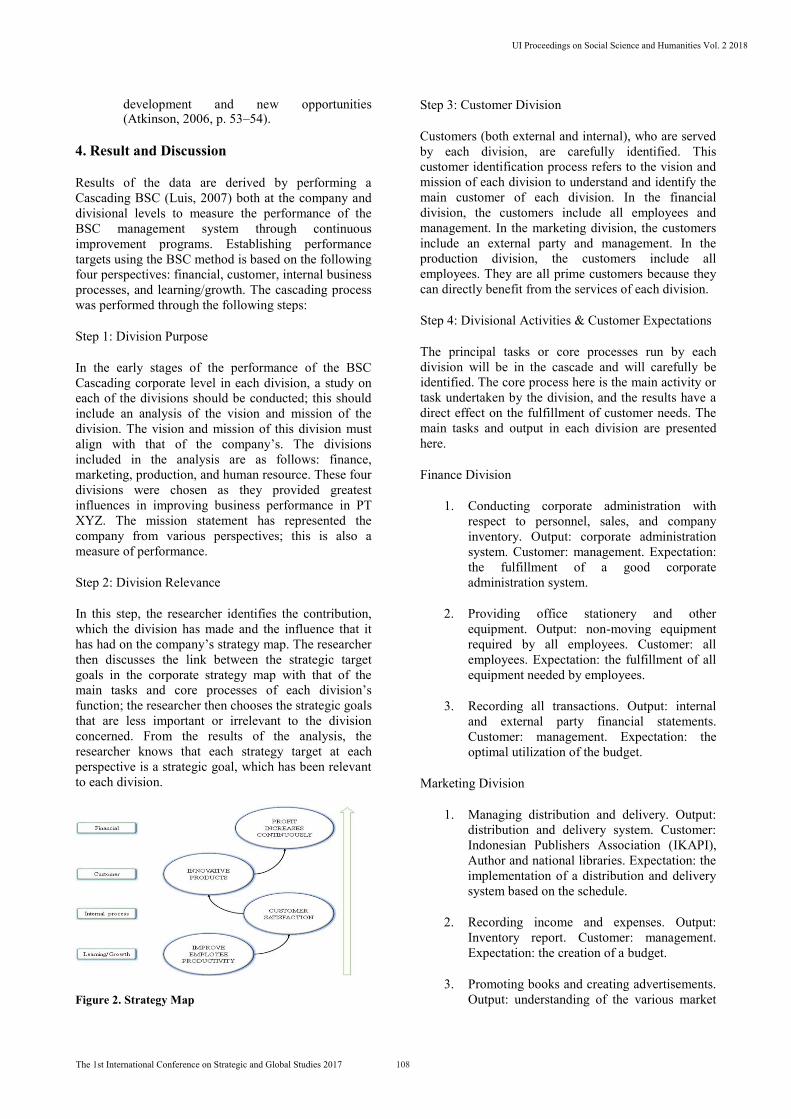
In this step, the researcher identifies the contribution, which the division has made and the influence that it has had on the company’s strategy map. The researcher then discusses the link between the strategic target goals in the corporate strategy map with that of the main tasks and core processes of each division’s function; the researcher then chooses the strategic goals that are less important or irrelevant to the division concerned. From the results of the analysis, the researcher knows that each strategy target at each perspective is a strategic goal, which has been relevant to each division.
Figure 2. Strategy Map
Step 3: Customer Division
Customers (both external and internal), who are served by each division, are carefully identified. This customer identification process refers to the vision and mission of each division to understand and identify the main customer of each division. In the financial division, the customers include all employees and management. In the marketing division, the customers include an external party and management. In the production division, the customers include all employees. They are all prime customers because they can directly benefit from the services of each division.
Step 4: Divisional Activities & Customer Expectations
The principal tasks or core processes run by each division will be in the cascade and will carefully be identified. The core process here is the main activity or task undertaken by the division, and the results have a direct effect on the fulfillment of customer needs. The main tasks and output in each division are presented here.
Finance Division
1. Conducting corporate administration with respect to personnel, sales, and company inventory. Output: corporate administration system. Customer: management. Expectation: the fulfillment of a good corporate administration system.
2. Providing office stationery and other equipment. Output: non-moving equipment required by all employees. Customer: all employees. Expectation: the fulfillment of all equipment needed by employees.
3. Recording all transactions. Output: internal and external party financial statements. Customer: management. Expectation: the optimal utilization of the budget.
Marketing Division
1. Managing distribution and delivery. Output: distribution and delivery system. Customer: Indonesian Publishers Association (IKAPI), Author and national libraries. Expectation: the implementation of a distribution and delivery system based on the schedule.
2. Recording income and expenses. Output: Inventory report. Customer: management. Expectation: the creation of a budget.
3. Promoting books and creating advertisements. Output: understanding of the various market
UI Proceedings on Social Science and Humanities Vol. 2 2018
108The 1st International Conference on Strategic and Global Studies 2017
segments. Customer: main consumers (teachers and students) and management. Expectation: the establishment of a good promotion system.
4. Selling books to consumers. Output: books sold. Customer: main consumers (teachers and students). Expectation: saleable books.
Production Division
1. Responsible for printing and book making process. Output: governance of printing and book making. Customer: management. Expectation: utilization to minimize errors and optimize profits.
2. Responsible for all purchases of production materials. Output: governance of material manufactured. Customer: management. Expectation: the establishment of an appropriate information system that is based on the conditions.
3. Recording all activities in the production section. Output: reports in the production section. Customer: management. Expectation:
UI Proceedings on Social Science and Humanities Vol. 2 2018
109The 1st International Conference on Strategic and Global Studies 2017
optimal budget utilization.
Human Resources Division
1. Establishing and implementing employee recruitment system. Output: system and guidelines for employee recruitment and fulfillment of the number of employees as needed. Customer: all employees. Expectation: the fulfillment of the needs of new employees’ both in terms of quantity and quality.
2. Establishing and implementing performance appraisal system and career planning of Human Resources. Output: system and guidelines for the implementation of performance appraisal and career planning of Human Resources. Customer: all employees. Expectation: the implementation of a performance appraisal system and career planning that can encourage the development of individual capacity and can simultaneously synergize with the improvement of the company’s performance.
3. Facilitating the training process and the development of relevant competencies for employees. Output: employees who have attended the training. Customer: management and employees. Expectation: skilled and competencies of employees.
4. Facilitating the process of embodiment of a work culture that demonstrates company values. Output: an understanding of work culture by all employees. Customer: management and employees. Expectation: the establishment of good governance in the company.
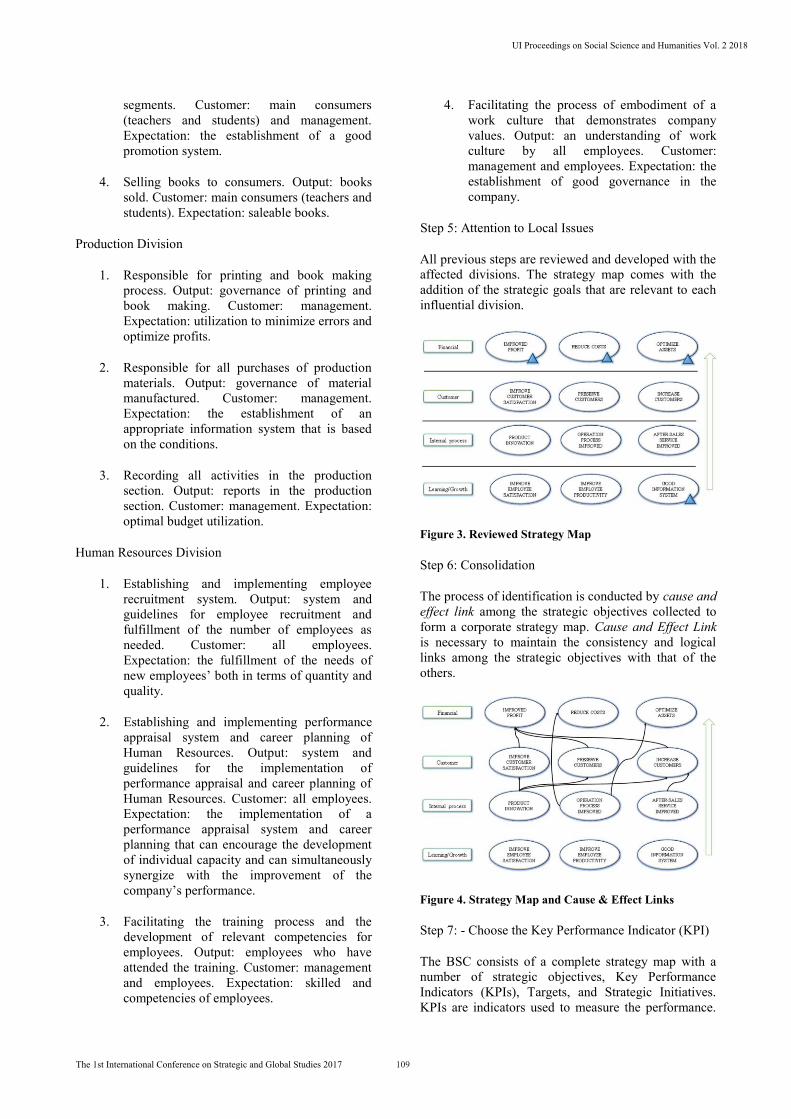
Step 5: Attention to Local Issues
All previous steps are reviewed and developed with the affected divisions. The strategy map comes with the addition of the strategic goals that are relevant to each influential division.
Figure 3. Reviewed Strategy Map
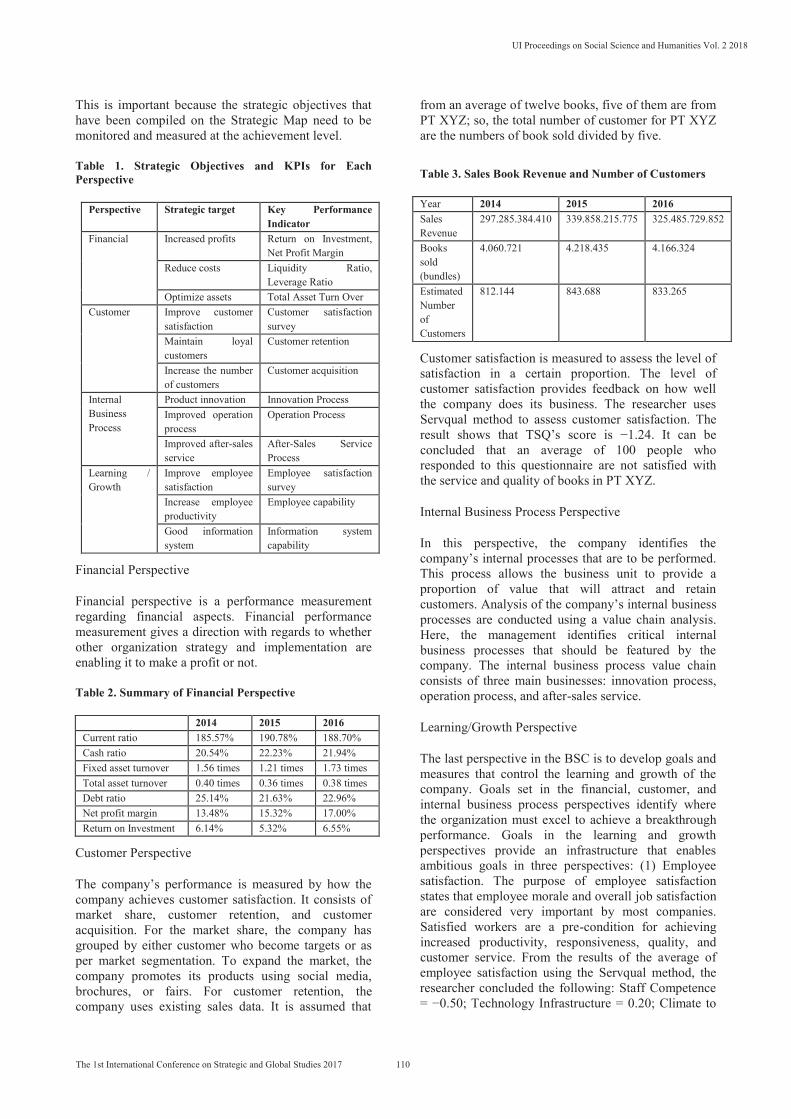
Step 6: Consolidation
The process of identification is conducted by cause and effect link among the strategic objectives collected to form a corporate strategy map. Cause and Effect Link is necessary to maintain the consistency and logical links among the strategic objectives with that of the others.
Figure 4. Strategy Map and Cause & Effect Links
Step 7: - Choose the Key Performance Indicator (KPI)
The BSC consists of a complete strategy map with a number of strategic objectives, Key Performance Indicators (KPIs), Targets, and Strategic Initiatives. KPIs are indicators used to measure the performance.
This is important because the strategic objectives that have been compiled on the Strategic Map need to be monitored and measured at the achievement level.
Table 1. Strategic Objectives and KPIs for Each Perspective
Perspective Strategic target Key Performance Indicator
Financial Increased profits Return on Investment, Net Profit Margin
Reduce costs Liquidity Ratio, Leverage Ratio
Optimize assets Total Asset Turn Over Customer Improve customer
satisfaction Customer satisfaction survey
Maintain loyal customers
Customer retention
Increase the number of customers
Customer acquisition
Internal Business Process
Product innovation Innovation Process Improved operation process
Operation Process
Improved after-sales service
After-Sales Service Process
Learning / Growth
Improve employee satisfaction
Employee satisfaction survey
Increase employee productivity
Employee capability
Good information system
Information system capability
Financial Perspective
Financial perspective is a performance measurement regarding financial aspects. Financial performance measurement gives a direction with regards to whether other organization strategy and implementation are enabling it to make a profit or not.
Table 2. Summary of Financial Perspective
2014 2015 2016 Current ratio 185.57% 190.78% 188.70% Cash ratio 20.54% 22.23% 21.94% Fixed asset turnover 1.56 times 1.21 times 1.73 times Total asset turnover 0.40 times 0.36 times 0.38 times Debt ratio 25.14% 21.63% 22.96% Net profit margin 13.48% 15.32% 17.00% Return on Investment 6.14% 5.32% 6.55%
Customer Perspective
The company’s performance is measured by how the company achieves customer satisfaction. It consists of market share, customer retention, and customer acquisition. For the market share, the company has grouped by either customer who become targets or as per market segmentation. To expand the market, the company promotes its products using social media, brochures, or fairs. For customer retention, the company uses existing sales data. It is assumed that
from an average of twelve books, five of them are from PT XYZ; so, the total number of customer for PT XYZ are the numbers of book sold divided by five.
Table 3. Sales Book Revenue and Number of Customers
Year 2014 2015 2016 Sales Revenue
297.285.384.410 339.858.215.775 325.485.729.852
Books sold (bundles)
4.060.721 4.218.435 4.166.324
Estimated Number of Customers
812.144 843.688 833.265
Customer satisfaction is measured to assess the level of satisfaction in a certain proportion. The level of customer satisfaction provides feedback on how well the company does its business. The researcher uses Servqual method to assess customer satisfaction. The result shows that TSQ’s score is −1.24. It can be concluded that an average of 100 people who responded to this questionnaire are not satisfied with the service and quality of books in PT XYZ.
Internal Business Process Perspective
In this perspective, the company identifies the company’s internal processes that are to be performed. This process allows the business unit to provide a proportion of value that will attract and retain customers. Analysis of the company’s internal business processes are conducted using a value chain analysis. Here, the management identifies critical internal business processes that should be featured by the company. The internal business process value chain consists of three main businesses: innovation process, operation process, and after-sales service.
Learning/Growth Perspective
The last perspective in the BSC is to develop goals and measures that control the learning and growth of the company. Goals set in the financial, customer, and internal business process perspectives identify where the organization must excel to achieve a breakthrough performance. Goals in the learning and growth perspectives provide an infrastructure that enables ambitious goals in three perspectives: (1) Employee satisfaction. The purpose of employee satisfaction states that employee morale and overall job satisfaction are considered very important by most companies. Satisfied workers are a pre-condition for achieving increased productivity, responsiveness, quality, and customer service. From the results of the average of employee satisfaction using the Servqual method, the researcher concluded the following: Staff Competence = −0.50; Technology Infrastructure = 0.20; Climate to
UI Proceedings on Social Science and Humanities Vol. 2 2018
110The 1st International Conference on Strategic and Global Studies 2017
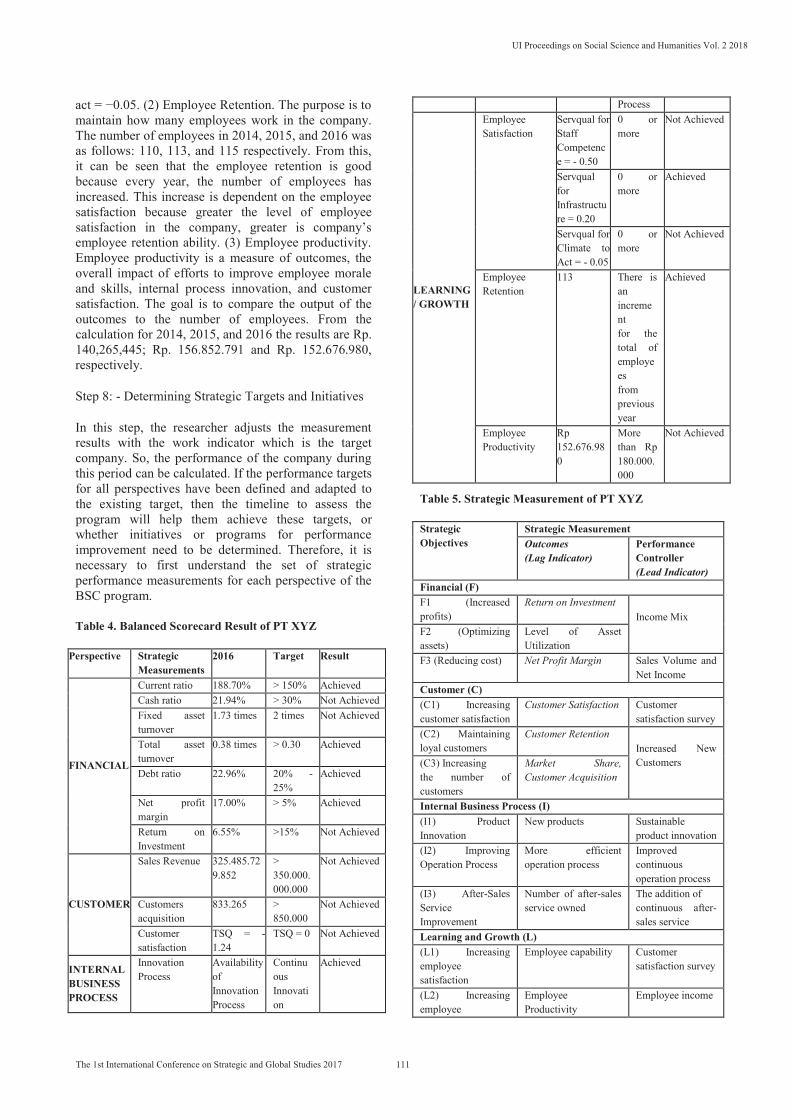
act = −0.05. (2) Employee Retention. The purpose is to maintain how many employees work in the company. The number of employees in 2014, 2015, and 2016 was as follows: 110, 113, and 115 respectively. From this, it can be seen that the employee retention is good because every year, the number of employees has increased. This increase is dependent on the employee satisfaction because greater the level of employee satisfaction in the company, greater is company’s employee retention ability. (3) Employee productivity. Employee productivity is a measure of outcomes, the overall impact of efforts to improve employee morale and skills, internal process innovation, and customer satisfaction. The goal is to compare the output of the outcomes to the number of employees. From the calculation for 2014, 2015, and 2016 the results are Rp. 140,265,445; Rp. 156.852.791 and Rp. 152.676.980, respectively.
Step 8: - Determining Strategic Targets and Initiatives
In this step, the researcher adjusts the measurement results with the work indicator which is the target company. So, the performance of the company during this period can be calculated. If the performance targets for all perspectives have been defined and adapted to the existing target, then the timeline to assess the program will help them achieve these targets, or whether initiatives or programs for performance improvement need to be determined. Therefore, it is necessary to first understand the set of strategic performance measurements for each perspective of the BSC program.
Table 4. Balanced Scorecard Result of PT XYZ
Perspective Strategic Measurements
2016 Target Result
FINANCIAL
Current ratio 188.70% > 150% Achieved Cash ratio 21.94% > 30% Not Achieved Fixed asset turnover
1.73 times 2 times Not Achieved
Total asset turnover
0.38 times > 0.30 Achieved
Debt ratio 22.96% 20% - 25%
Achieved
Net profit margin
17.00% > 5% Achieved
Return on Investment
6.55% >15% Not Achieved
CUSTOMER
Sales Revenue 325.485.729.852
> 350.000.000.000
Not Achieved
Customers acquisition
833.265 > 850.000
Not Achieved
Customer satisfaction
TSQ = -1.24
TSQ = 0 Not Achieved
INTERNAL BUSINESS PROCESS
Innovation Process
Availability of Innovation Process
Continuous Innovation
Achieved
Process
LEARNING / GROWTH
Employee Satisfaction
Servqual for Staff Competence = - 0.50
0 or more
Not Achieved
Servqual for Infrastructure = 0.20
0 or more
Achieved
Servqual for Climate to Act = - 0.05
0 or more
Not Achieved
Employee Retention
113 There is an increment for the total of employees from previous year
Achieved
Employee Productivity
Rp 152.676.980
More than Rp 180.000.000
Not Achieved
Table 5. Strategic Measurement of PT XYZ
Strategic Objectives
Strategic Measurement Outcomes (Lag Indicator)
Performance Controller (Lead Indicator)
Financial (F) F1 (Increased profits)
Return on Investment Income Mix F2 (Optimizing
assets) Level of Asset Utilization
F3 (Reducing cost) Net Profit Margin Sales Volume and Net Income
Customer (C) (C1) Increasing customer satisfaction
Customer Satisfaction Customer satisfaction survey
(C2) Maintaining loyal customers
Customer Retention Increased New Customers
(C3) Increasing the number of customers
Market Share, Customer Acquisition
Internal Business Process (I) (I1) Product Innovation
New products Sustainable product innovation
(I2) Improving Operation Process
More efficient operation process
Improved continuous operation process
(I3) After-Sales Service Improvement
Number of after-sales service owned
The addition of continuous after-sales service
Learning and Growth (L) (L1) Increasing employee satisfaction
Employee capability Customer satisfaction survey
(L2) Increasing employee
Employee Productivity
Employee income
UI Proceedings on Social Science and Humanities Vol. 2 2018
111The 1st International Conference on Strategic and Global Studies 2017
productivity (L3) Good Information System
Access information system
Modern information systems and continuous improvement
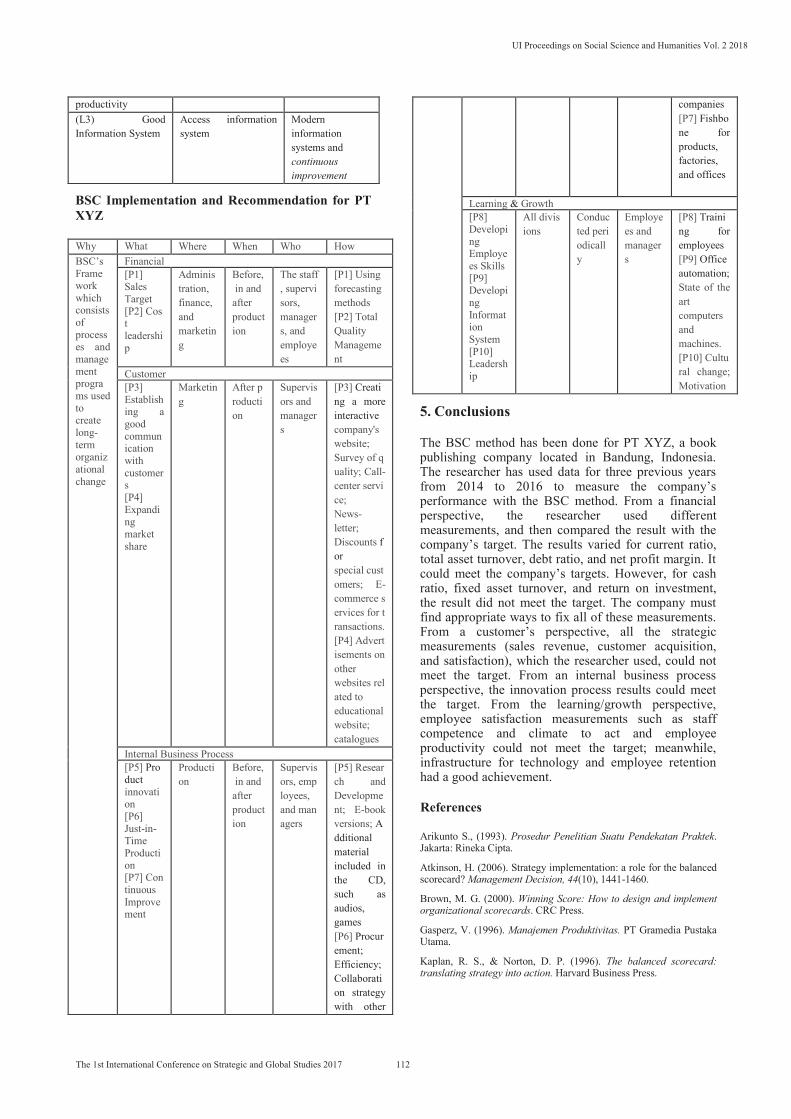
BSC Implementation and Recommendation for PT XYZ
Why What Where When Who How BSC’s Framework which consists of processes and management programs used to create long-term organizational change
Financial [P1] Sales Target [P2] Cost leadership
Administration, finance, and marketing
Before, in and after production
The staff, supervisors, managers, and employees
[P1] Using forecasting methods [P2] Total Quality Management
Customer [P3] Establishing a good communication with customers [P4] Expanding market share
Marketing
After production
Supervisors and managers
[P3] Creating a more interactive company's website; Survey of quality; Call-center service; News-letter; Discounts for special customers; E-commerce services for transactions. [P4] Advertisements on other websites related to educational website; catalogues
Internal Business Process [P5] Product innovation [P6] Just-in-Time Production [P7] Continuous Improvement
Production
Before, in and after production
Supervisors, employees, and managers
[P5] Research and Development; E-book versions; Additional material included in the CD, such as audios, games [P6] Procurement; Efficiency; Collaboration strategy with other
companies [P7] Fishbone for products, factories, and offices
Learning & Growth [P8] Developing Employees Skills [P9] Developing Information System [P10] Leadership
All divisions
Conducted periodically
Employees and managers
[P8] Training for employees [P9] Office automation; State of the art computers and machines. [P10] Cultural change; Motivation
5. Conclusions
The BSC method has been done for PT XYZ, a book publishing company located in Bandung, Indonesia. The researcher has used data for three previous years from 2014 to 2016 to measure the company’s performance with the BSC method. From a financial perspective, the researcher used different measurements, and then compared the result with the company’s target. The results varied for current ratio, total asset turnover, debt ratio, and net profit margin. It could meet the company’s targets. However, for cash ratio, fixed asset turnover, and return on investment, the result did not meet the target. The company must find appropriate ways to fix all of these measurements. From a customer’s perspective, all the strategic measurements (sales revenue, customer acquisition, and satisfaction), which the researcher used, could not meet the target. From an internal business process perspective, the innovation process results could meet the target. From the learning/growth perspective, employee satisfaction measurements such as staff competence and climate to act and employee productivity could not meet the target; meanwhile, infrastructure for technology and employee retention had a good achievement.
References
Arikunto S., (1993). Prosedur Penelitian Suatu Pendekatan Praktek. Jakarta: Rineka Cipta.
Atkinson, H. (2006). Strategy implementation: a role for the balanced scorecard? Management Decision, 44(10), 1441-1460.
Brown, M. G. (2000). Winning Score: How to design and implement organizational scorecards. CRC Press.
Gasperz, V. (1996). Manajemen Produktivitas. PT Gramedia Pustaka Utama.
Kaplan, R. S., & Norton, D. P. (1996). The balanced scorecard: translating strategy into action. Harvard Business Press.
UI Proceedings on Social Science and Humanities Vol. 2 2018
112The 1st International Conference on Strategic and Global Studies 2017

Luis, S., & Biromo, P. A. (2007). Step by step in cascading balanced scorecard to functional scorecards. Jakarta: Gramedia Pustaka Utama, 152.
Peteraf, M., Gamble, J., & Thompson Jr, A. (2014). Essentials of strategic management: The quest for competitive advantage. McGraw-Hill Education.
Prakarsa, W. (1994). Sistem Pengukuran Kinerja-Pendekatan Kontemporer. Strategi Pembiayaan dan Regrouping BUMN. Jakarta: FE-UI.
Rivai, V. (2009). Manajemen sumber daya manusia untuk perusahaan: Dari teori ke praktik. Rajawali Pers.
Singarimbun, M. (1995), Metode Penelitian, Yogyakarta: Universiats Gajah Mada Press.
Tjahjono, H. K. (2004). Budaya Organisasional dan Balanced Scorecard: Dimensi Teori dan Praktik. UPFE UMY.
Tjiptono, F. (1996). Manajemen Jasa. Yogyakarta: Penerbit ANDI.
Trihendradi, C. (2004). Memecahkan Kasus Statistik: Deskriptif, Parametrik, dan Non-Parametrik dengan SPSS 12. Penerbit ANDI. Yogyakarta.
Umar, H. (2002). Metode riset bisnis: panduan mahasiswa untuk melaksanakan riset dilengkapi contoh proposal dan hasil riset bidang manajemen dan akuntansi. Gramedia Pustaka Utama.
Walpole, R. E. (1986). Ilmu Peluang dan Statistika untuk Insinyur dan Ilmuwan’ (transl: RK Sembiring), ITB, Bandung.
Weston, J. Fred. (1986). Dasar-dasar Manajemen Keuangan. 1 ed. Penerbit Erlangga.
Wheelen, T. L., Hunger, J. D., Hoffman, A. N., & Bamford, C. E. (2017). Strategic management and business policy. Pearson.
Yuwono, S., Sukarna, E., & Ichsan, M. (2003). Petunjuk Praktis Penyusun Balanced Scorecard. Jakarta. Gramedia Pustaka Utama.
UI Proceedings on Social Science and Humanities Vol. 2 2018
113The 1st International Conference on Strategic and Global Studies 2017