Embed Size (px)
Citation preview
Project of Balanced Scorecard implementation in Irisa, co-opt.
Bc.Michaela Zárubová
Master thesis
2007

ABSTRACT
The main aim of this master thesis is to propose the Project of Balanced Scorecard imple-
mentation in Irisa, co-opt. This modern tool of strategic management has not been used in
Irisa, so far. The theory explains some aspects of the performance management and intro-
duces Balanced Scorecard as the new tool of strategic management. Another part focuses
on analyses, i.e. PEST, Porter´s Five Forces Model, financial analysis and SWOT analysis.
The results clear up the contemporary position of Irisa and lead to solutions for BSC utili-
zation before the implementation. Finally, the thesis is composed of the Balanced Score-
card implementation with all its aspects, proposals and recommendations and risks of the
project.
Keywords: Balanced Scorecard, strategy, strategy map, performance
ABSTRAKT
Hlavním cílem diplomové práce je navrhnout projekt implementace Balanced Scorecard
pro společnost Irisa, výrobní družstvo. Tento moderní nástroj strategického řízení podniku
nebyl dosud ve společnosti využíván. Teorie vysvětluje některé aspekty řízení výkonnosti
podniku a představuje nový nástroj strategického managementu – Balanced Scorecard. Dal-
ší část se zaměřuje na výsledky analýz, tj.PEST, Porterův model pěti sil, finanční analýzu a
souhrnnou PEST analýzu. Výsledky pomáhají vyjasnit současnou situaci, ve které se Irisa
nachází a formulovat východiska pro využití přístupu BSC před tím, než bude zaveden.
Závěrečná část je tvořena samotným projektem implementace Balanced Scorecard se všemi
jeho aspekty, návrhy a doporučeními a možnými riziky projektu.
Klíčová slova: Balanced Scorecard, strategie, strategická mapa, výkonnost

I would like to thank my supervisor Ing. Daniel Remeš for his professional and valuable
advice, information, patience, friendly approach and for the support that made this project
such an interesting experience.
Furthermore, I would like to express my thanks to Ing. J.Sehnálek and Ing. D.Smilková
from Irisa for their willingness, time, help and cooperation.
CONTENTS
INTRODUCTION................................................................................................................9
I THEORY...................................................................................................................11
1 PERFORMANCE MEASUREMENTS FOR SUCCESS .....................................12
2 THE BALANCED SCORECARD..........................................................................14
2.1 WHY BALANCED SCORECARD AND WHY NOW? ....................................................17
2.2 BALANCED SCORECARD PERSPECTIVES ................................................................18
2.2.1 Financial perspective ....................................................................................20 2.2.2 Customer perspective ...................................................................................20 2.2.3 Internal processes perspective ......................................................................20 2.2.4 Learning and growth perspective..................................................................21
2.3 VISUALIZING STRATEGIES IN MAPS........................................................................21
2.3.1 Strategy maps................................................................................................22
2.4 IMPLEMENTING A BALANCED SCORECARD MANAGEMENT PROGRAM ...................24
2.4.1 Launching the Balanced Scorecard program ................................................24 2.4.2 The dynamics: Mobilizing the organization .................................................25 2.4.3 Building an integrated management system .................................................26 2.4.4 Managing the Balanced Scorecard strategic management system................27 2.4.5 Summary: Translating strategy into action...................................................27
2.5 ADVANTAGES OF THE MODEL ...............................................................................30
2.6 CRITIQUE AGAINST THE BSC ................................................................................31
2.7 CONCLUSION TO THE BSC ....................................................................................33
II PRACTICAL PART.................................................................................................34
3 IRISA, CO-OPT........................................................................................................35
4 PEST ANALYSIS .....................................................................................................38
4.1 POLITICAL ANALYSIS ............................................................................................39
4.2 ECONOMIC ANALYSIS............................................................................................40
4.3 SOCIAL ANALYSIS .................................................................................................41
4.4 TECHNOLOGICAL ANALYSIS ..................................................................................41
5 PORTER´S FIVE FORCES MODEL ....................................................................42
5.1 ENTRANTS ............................................................................................................43
5.2 SUPPLIERS ............................................................................................................43
5.3 RIVALRY...............................................................................................................43
5.4 BUYERS ................................................................................................................44
5.5 SUBSTITUTES ........................................................................................................44
6 FINANCIAL ANALYSIS ........................................................................................45
6.1 INCOME STATEMENT ANALYSIS .............................................................................45
6.1.1 Assets and liabilities analysis .......................................................................46 6.1.2 Revenues and expenses analysis...................................................................47
6.2 CASH FLOW ANALYSIS ..........................................................................................48
6.3 SOLVENCY / LEVERAGE RATIOS ............................................................................49
6.4 LIQUIDITY RATIOS.................................................................................................51
6.5 PROFITABILITY RATIOS .........................................................................................52
6.6 EQUITY MULTIPLIER..............................................................................................53
6.7 ACTIVITY RATIOS..................................................................................................54
6.8 SPIDER ANALYSIS..................................................................................................55
6.9 OTHER RATIOS ......................................................................................................57
6.10 ADDITIONAL RATIOS .............................................................................................58
6.11 ECONOMIC VALUE ADDED.....................................................................................60
6.12 DU-PONT DECOMPOSITION MODEL ......................................................................61
6.13 CONCLUSION TO FINANCIAL ANALYSIS .................................................................63
7 SWOT ANALYSIS ...................................................................................................65
8 SOLUTIONS FOR BSC APPROACH UTILIZATION.......................................67
9 BALANCED SCORECARD IMPLEMENTATION ............................................68
9.1 CONSTITUTION OF ORGANIZATION PRESUMPTIONS FOR THE IMPLEMENTATION .....68
9.2 CLARIFYING OF STRATEGIES .................................................................................69
9.3 STRATEGY OBJECTIVES AND A STRATEGY MAP .....................................................70
9.4 MEASURES AND TARGETS .....................................................................................72
9.4.1 Financial perspective ....................................................................................72 9.4.2 Customer perspective ...................................................................................74 9.4.3 Internal processes perspective ......................................................................76 9.4.4 Learning and growth perspective..................................................................78
9.5 THE ROLL-OUT PROCESS ......................................................................................81
9.6 BSC INTEGRATION INTO MANAGEMENT SYSTEM...................................................84
9.7 THE BALANCED SCORECARD TIMELINE................................................................86
9.8 PROJECT BUDGET..................................................................................................87
9.9 CONTRIBUTIONS OF THE BSC PROJECT .................................................................88
9.10 RISKS OF THE BSC PROJECT..................................................................................89
9.11 PROPOSALS AND RECOMMENDATIONS ..................................................................90
CONCLUSION...................................................................................................................91
BIBLIOGRAPHY ..............................................................................................................92
LIST OF SYMBOLS AND ABBREVIATIONS .............................................................94

LIST OF FIGURES ...........................................................................................................96
LIST OF TABLES .............................................................................................................97
LIST OF APPENDICES....................................................................................................98
Tomas Bata University in Zlín, Faculty of management and economics 9
INTRODUCTION
Responsibility and trust are watchwords at today´s companies. But what is a manager re-
sponsible for? For decades we have been talking about “decentralized profit responsibil-
ity”. We usually measure results in monetary terms. The income statements which we pre-
pare for particular business units and departments are modeled on the income statement of
the company.
Is this enough? Is the mission of the various parts of a company simply to create profits and
return on investment? In many cases probably not. Wise executives know that their com-
pany must develop the capabilities which it will need to prosper in the future. But doing so
will produce no profits in the current year, only costs.
Here lies the fundamental reason why companies require a balanced scorecard. The need is
even clearer for the many organizations without profit as a goal, including government
agencies, internal staff units in industry, and others. We have to do more to describe what
we expect of an operation, and how well our expectations are being met.
Perhaps this matter was less urgent before. Both sales and production were primarily fo-
cused on the short run. Preparing for the future was something companies did in their de-
velopment departments and through requirements of centralized authorization for capital
expenditures.
Today we no longer consider this approach adequate. Preparing for the future is about in-
vesting in competence, cultivation customer relationships, and creating data bases. Much of
this work is done elsewhere in the organization than at headquarters. There is a danger that
profit targets will clash with long-term decisions.
The BSC has quickly become recognized as an important management tool with the poten-
tial to improve organizational performance. Organizations are competing in complex envi-
Tomas Bata University in Zlín, Faculty of management and economics 10
ronments so that an accurate understanding of their goals and the methods for attaining
those goals is vital. The Balanced Scorecard translates an organization´s mission and strat-
egy into a comprehensive set of performance measures that provides the framework for a
strategic measurement and management system. It retains an emphasis on achieving finan-
cial objectives, but also includes the performance drivers of these financial objectives. The
BSC enables companies to track financial results while simultaneously monitoring progress
in building the capabilities and acquiring the intangible assets they need for future growth.
The aim of this work is to create Balanced Scorecard implementation project for Irisa, co-
opt in Vsetín. This modern tool of strategic management has not been used so far but Irisa
realizes that one of the most important aims of every company is to hold a market in these
difficult market conditions with a contribution of an effective strategic management. The
main advantage of BSC method is not only the strategy implementation but also a strategic
system formation of efficiency measurement in a company.
The theory explains some aspects of the performance management and introduces new tool
of strategic management called Balanced Scorecard. It focuses both on the positive and
negative aspects of the BSC.
After that follows a presentation of Irisa, co-opt., the analyses, e.g. PEST, Michael Porter´s
Five Forces Model, financial analysis and summarizing SWOT analysis. Results of analy-
ses and proposals to BSC utilization in Irisa will clear up the contemporary position of the
company before the process of Balanced Scorecard implementation.
Finally, the master thesis is composed of the Balanced Scorecard implementation with all
its aspects, final recommendations and risks and contributions of the project.

Tomas Bata University in Zlín, Faculty of management and economics 11
I. THEORY
Tomas Bata University in Zlín, Faculty of management and economics 12
1 PERFORMANCE MEASUREMENTS FOR SUCCESS
Traditional financial measures – ROI, net profit, sales growth, and market share – fail to
capture the true picture of a firm´s value propositions because they focus on the past. They
tell the story of what has happened to the organization. They explain the results of past
transactions and disregard what the future benefits could be. Traditional financial measures
are only part of the information that managers need to successfully guide their organiza-
tions through highly competitive marketplaces.
During the 1990s, two Harvard professors and consultants – Kaplan and Norton, devised a
tool, the Balanced Scorecard, to rectify the deficiencies in relying primarily on traditional
financial measures. A Balanced Scorecard allows better measurement of firm´s capabilities
to create long-term value by identifying the key drivers of this value. The drivers are then
translated into four categories of measures – customer, internal/operational, innova-
tion/learning, and financial. The financial measures are typically focused on short-term
results; while the other three categories are coupled to future oriented activities needed to
successfully sustain the enterprise.
Obviously financial health is critical for any business organization – cash in the bank is
necessary to pay the bills. However, many managers become nearsighted as a result of this
requirement and believe that by making fundamental improvements in their operations, the
financial numbers will resolve themselves. This is an utter fallacy. Managers should de-
velop strategic measures that are specifically tied to their firm´s unique strategy. There is
not a “one size fits all” Balanced Scorecard. The following is the basic categorization for
balanced measures of firm performance. [7]
I. Financial perspective
Measures that indicate whether the company´s strategy, implementation, and execution are
contributing to bottom line improvement.
� Cash flow
� Sales growth

Tomas Bata University in Zlín, Faculty of management and economics 13
� Market share
� ROE
II. Customer perspective
Customer concerns in four categories.
1. Time-measures time required for company to meet customer´s needs.
2. Quality-defect level as sent to customers.
3. Performance-how company´s products/services contribute to creating value for its
customers.
4. Cost-not just price of goods/services, but what does it “cost” the customer when he
finally uses it.
III. Internal / Operational perspective
� Business processes that have the greatest impact on customer satisfaction.
� What competencies are needed to maintain market leadership?
IV. Innovation / Learning perspective
� Ability to innovate, improve, and learn ties directly to company´s value.
� Launch new products.
� More value for customers.
� Penetration of new markets.
However, a balanced performance measurement tool is not a collection of disparate finan-
cial and non-financial measures. It is more than supplementing traditional financial meas-
ures with non-financial measures. It is a process of developing interrelated measures, some
leading and some lagging, that uniquely depicts a firm´s strategy in attempting to create
competitive advantage. [7]
Tomas Bata University in Zlín, Faculty of management and economics 14
2 THE BALANCED SCORECARD
“When you can measure what you are speaking about, and express it in numbers, you
know something about it; but when you cannot measure it, when you cannot express it in
numbers, your knowledge is of a meager and unsatisfactory kind…“
William Thompson (Lord Kelvin), 1824-1907 [13]
Organizations in today´s change-filled, highly competitive environment must devote sig-
nificant time, energy, and human and financial resources to measuring their performance in
achieving strategic goals. Most do just that, but despite the substantial effort and related
costs, many are dissatisfied with their measurement efforts.
Increasingly, organizations are concluding that while measurement is more crucial than
ever, their systems for capturing, monitoring, and sharing performance information are
critically flawed. Today´s systems in many ways bear a remarkable resemblance to their
reporting ancestors. Although the methods of modern business have transformed dramati-
cally over the decades, our systems of measurement have remained firmly mired in the
past. [13]
A balanced scorecard is a format for describing the activities of an organization through a
number of measures for each of (usually) four perspectives. It assists organizations in over-
coming three key issues:
� effective organizational performance measurement,
� the rise of intangible assets, and
� the challenge of implementing strategy.
Some would say that this is just another performance report, combining financial and non-
financial metrics. But there is more to the scorecard than immediately meets the eye:
Tomas Bata University in Zlín, Faculty of management and economics 15
� The scorecard is balanced: the four perspectives aim for a complete description of
what you need to know about the business. First, there is a time dimension going
from bottom to top. Current profitability, etc. may largely be a consequence of what
was done last quarter or last year; if new skills are added now it should have conse-
quences for next year´s efficiency and finance.
� The scorecard is balanced in another way also: it shows both internal and external
aspects of the business. It is obvious that a “well-oiled machinery” of internal proc-
esses is important in any business, and may not always correlate with external per-
ceptions. On the other hand, customers´ views and the contacts that have been es-
tablished in the market-place are obviously important too. The scorecard shows
both.
� Finally, the scorecard is linked through cause-and-effect assumptions. Among its
most important uses is to reflect on how strong these linkages are, what time delays
they involve, and how certain we can be about them in the face of external competi-
tion and change.
Since its first appearance, the concept of the BSC has been widely adopted as a new ap-
proach to management control both in business and government. A scorecard is an easy-to-
understand generic format for describing the ambitions and achievements of an organiza-
tion. [15]
The Balanced Scorecard is like the dials in an airplane cockpit: it gives managers complex
information at a glance. [15]
Tomas Bata University in Zlín, Faculty of management and economics 16
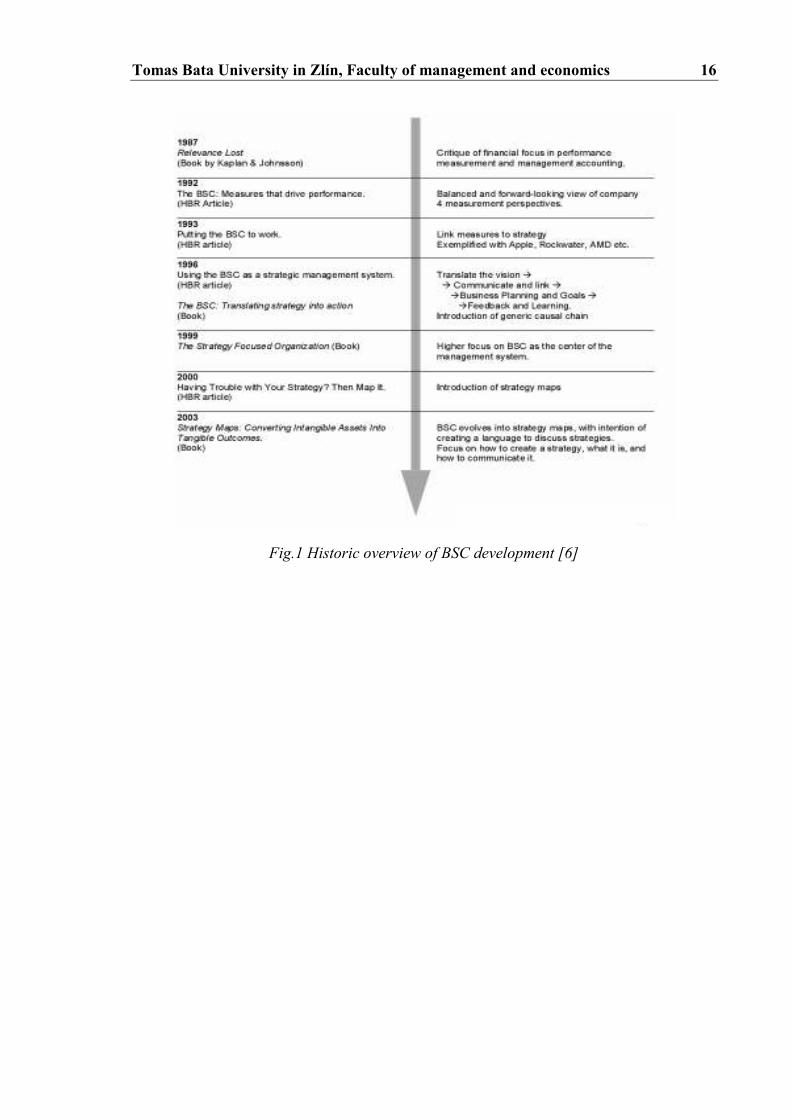
Fig.1 Historic overview of BSC development [6]

Tomas Bata University in Zlín, Faculty of management and economics 17
2.1 Why Balanced Scorecard and why now?
“The average business executive has spent 10,000 hours in being educated…but only spent
10 hours being trained in creativity.” [12]
Management guru Peter Drucker once observed that the most common source of mistakes
in management decisions is the emphasis on finding the right answer rather than the right
question. We are all familiar with the impressive statistics surrounding BSC usage in the
organizational world: adopted by approximately 50% of the Fortune 1000, hailed as one of
the 75 most influential business ideas of the 20th century, embraced by public, private, and
nonprofit enterprises alike. Mere adoption of the tool, however, does not guarantee that
business results will necessarily begin flowing as rapidly as Niagara Falls.
Any type of change has the potential to feel threatening to those who are affected by it.
Change is difficult; therefore, it´s essential for you to answer the questions of why the BSC
is a necessary step for your organization and why now. As Larry Weinbach, CEO of Uni-
sys, points out: [12]
“Make sure that you recognize not everybody is going to come on board on day one and
that it´s going to take a lot of face time to ensure that people understand where you want to
go and why…The why becomes a big issue because, it may seem surprising, but a lot of
people may not understand why you want to make the strategic change, even if the com-
pany is not doing well. [11]
The rationale for change may be glaringly apparent to you, but chances are you have far
greater access to strategic information than most of your employees, the very group who
will ultimately be charged with the responsibility of living the BSC on a day-to-day basis.
To them, the case for change may be unwarranted or simply unknown, and without that
knowledge it will prove exceedingly difficult for you to gain their true commitment to the
implementation. [11]
Tomas Bata University in Zlín, Faculty of management and economics 18
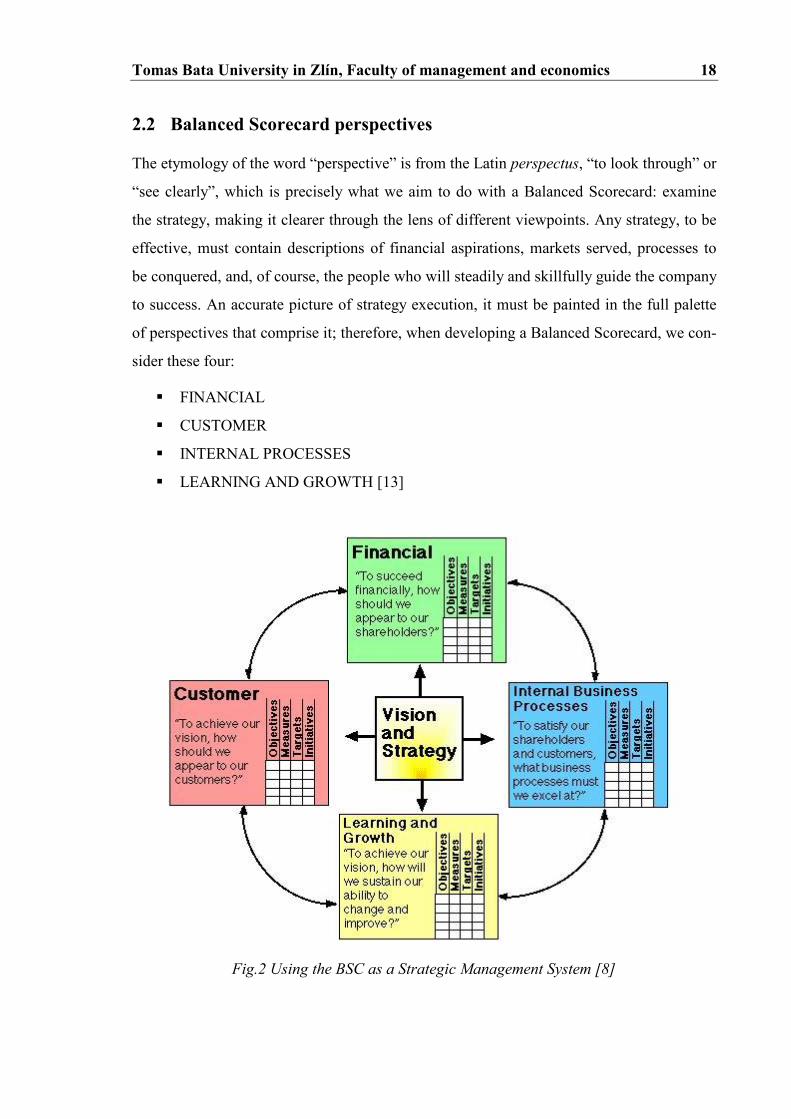
2.2 Balanced Scorecard perspectives
The etymology of the word “perspective” is from the Latin perspectus, “to look through” or
“see clearly”, which is precisely what we aim to do with a Balanced Scorecard: examine
the strategy, making it clearer through the lens of different viewpoints. Any strategy, to be
effective, must contain descriptions of financial aspirations, markets served, processes to
be conquered, and, of course, the people who will steadily and skillfully guide the company
to success. An accurate picture of strategy execution, it must be painted in the full palette
of perspectives that comprise it; therefore, when developing a Balanced Scorecard, we con-
sider these four:
� FINANCIAL
� CUSTOMER
� INTERNAL PROCESSES
� LEARNING AND GROWTH [13]
Fig.2 Using the BSC as a Strategic Management System [8]

Tomas Bata University in Zlín, Faculty of management and economics 19
Within each of the Balanced Scorecard financial, customer, internal processes, and learning
and growth perspectives, the firm must define the following:
� Strategic objectives – what the strategy is to achieve in that perspective.
� Measures – how progress for that particular objective will be measured.
� Targets - the target value sought for each measure.
� Initiatives – what will be done to facilitate the reaching of the target. [6]
The following sections provide examples of some objectives and measures for the 4 per-
spectives.
Tab.1 Building strategy maps [6]
PERSPECTIVES Objectives Measures
Financial growth revenue growth profitability return on equity cost leadership unit cost maximize value at least cost cost-to-spend ratio maximize cost savings purchasing influenced savings timely payments under pr. pay delinquent payment penalties maximize productivity ratios Customer new products % of sales from new products responsive supply on-time delivery to be preferred supplier share of key accounts customer partnerships number of cooperative efforts quality quality of product/service Internal Process manufacturing excellence cycle time, yield increase design productivity engineering efficiency reduce product launch delays actual launch date vs. plan Learning and Growth manufacturing learning time to new process maturity product focus % of product representing 80% of sales time to market time compared to that of competitors Targets Initiatives
Financial 20% increase of EVA likes program 15% increase of sales Customer increase new customers to 6 focus group program fast product delivery –4weeks account penetration program increase sales from new quality management products to 10,000,000 customer loyalty Internal Process increase investments to 5 mil. Critical opportunity sales support increase pro.capacity to 90% reference sell program higher pers.productivity to 400 pull marketing and image program higher new technology to5p.a. target marketing program Learning and Growth increase incom. orders to 50 selling skills program decrease staff turnover to 2% customer database increase trainings to 15 sales learning system
Tomas Bata University in Zlín, Faculty of management and economics 20
2.2.1 Financial perspective
How do we look to shareholders?
This question is answered by the financial perspective. Financial measures are an important
component of the Balanced Scorecard in the for-profit, public, and nonprofit worlds. In the
for-profit domain, the measures in this perspective tell us whether our strategy execution –
which is detailed through measures chosen in the other perspectives – is leading to im-
proved bottom-line results. In the nonprofit and public sectors, financial measures ensure
that we are achieving our results, but doing so in an efficient manner that minimizes cost.
We normally encounter classic lagging indicators in the Financial perspective. Typical ex-
amples include revenue, profitability, and asset utilization.
2.2.2 Customer perspective
How do customers see us?
When choosing measures for the Customer perspective of the Scorecard, organizations
must answer two critical questions: “Who are our target customers?” and “What is our
value proposition in serving them?” Sounds simple enough, but both of these questions
offer many challenges to organizations. Most organizations will state that they do in fact
have a target customer audience, yet their actions reveal an “all things to all customers”
strategy.
2.2.3 Internal processes perspective
What must we excel at?
Here we identify the key processes at which the organization must excel in order to con-
tinue adding value for customers. Our task in this perspective is to identify those processes
and develop the best possible measures with which to track our progress. To satisfy cus-
tomers, you may have to identify entirely new internal processes rather than focusing your
efforts on the incremental improvement of existing activities. Service development and
delivery, partnering with the community, and reporting are examples of items that may be
represented in this perspective
Tomas Bata University in Zlín, Faculty of management and economics 21
2.2.4 Learning and growth perspective
Can we continue to improve and create value?
If you expect to achieve ambitious results for internal processes, customers, and financial
stakeholders, where are these gains found? The measures in the Learning and Growth per-
spective of the BSC serve as the enablers of the other three perspectives. In essence they
are the foundation on which this entire house of a BSC is built. [12]
2.3 Visualizing strategies in maps
When Kaplan and Norton initially conceived the Balanced Scorecard, they were attempting
to solve a problem of measurement: How do we acknowledge the importance of financial
metrics in decision making and business success while also recognizing the rapid rise of
intangible assets and their critical importance to the overall recipe for organizational suc-
cess? Their answer was the use a balanced set of measures in four distinct, yet related, per-
spectives: financial, customer, internal processes and employee learning and growth. How-
ever, if those measures are leading to dysfunctional behaviours of some kind, that focused
rowing could have you headed straight down a course of uncharted and rocky rapids that is
sure to turn your cozy assumptions about measurement upside down.
Recognizing this potential hazard, Kaplan and Norton began prefacing the discussions of
measures with one of objectives: What exactly were executives attempting to accomplish?
Answering this fundamental question made the development of measures that much easier
because a context was created for the deliberation. It soon became standard practice to be-
gin a BSC implementation by articulating key objectives derived directly from the organi-
zation´s strategy.
A successful business unit strategy positions a company in the competitive landscape so
that it can capture a significant amount of value. Once this position has been identified, the
company can translate this strategy into a strategy map and Balanced Scorecard. [12]
Tomas Bata University in Zlín, Faculty of management and economics 22
Fig.3 Four perspectives of BSC [6]
2.3.1 Strategy maps
Strategy maps fulfil several purposes:
� They enable discussions about cause-effect relationships when facing strategic deci-
sions, and about possible strategic actions.
� They assist in finding and selecting metrics to monitor activities.
� The completed map can be used to communicate strategies and their inherent logic:
“Why we believe we will succeed.”
Tomas Bata University in Zlín, Faculty of management and economics 23
An old saying reminds us that “a picture tells a thousand words”, and so it is with the strat-
egy map. Kaplan and Norton provide a wide range of such maps for many different types of
organizations. They also suggest that there are “generic” parts of such maps, such as the
customer perspective being closely linked to the “value proposition” chosen by the organi-
zation.
A strategy map should answer two related questions:
How does this organization intend to succeed?
How can we recognize whether this organization is succeeding?
The more dependencies there are, the more careful the corporate level has to be in judging
this company separately. One of the main purposes of the maps is to communicate strate-
gies and their inherent logic in the organization. They should document where the chosen
strategy is going to take us and over what timescale, what activities will be needed, and
also make the long-term success credible. [15]
For an example of a strategy map from Norton and Kaplan see APPENDIX 1.

Tomas Bata University in Zlín, Faculty of management and economics 24
2.4 Implementing a Balanced Scorecard management program
“I tried to tell my boss that a Balanced Scorecard was about management not measure-
ment.” [6]
This manager had been asked by his CEO to lead a middle-management task force to de-
velop a Balanced Scorecard for the division. He sensed that this effort was doomed to fail-
ure, because the CEO viewed the scorecard as a narrow effort to improve the organiza-
tion´s performance measurement system, not as a new way to manage the business.
The goal of a scorecard project is not to develop a new set of measures. Measurement –
how we describe results and targets – is indeed a powerful motivational and evaluation
tool. But the measurement framework in the Balanced Scorecard should be deployed to
develop a new management system. [6]
2.4.1 Launching the Balanced Scorecard program
Organizations launch scorecards programs for a variety of reasons. For example:
Fig.4 Launching the BSC program [6]
Tomas Bata University in Zlín, Faculty of management and economics 25
Note that none of the reasons above relates solely to improving the measurement system.
Each reason is part of a broad, overarching goal – mobilizing the organization to new stra-
tegic directions.
2.4.2 The dynamics: Mobilizing the organization
A management system does not appear instantaneously. Because of its scope, complexity,
and impact, a new management system must be phased in over time. This approach is pref-
erable since the CEO has an opportunity to unfreeze the organization from its previous
processes and send a message about the new process.
The first few steps in the implementation process
� clarified the company vision and strategy,
� communicated the corporate strategy,
� launched cross-business strategic initiatives, and
� led to each SBU developing its own strategy, consistent with that of the company.
These steps all occurred during the first year. The corporate review process created some
unanticipated benefits. As the individual SBUs developed specific strategies, they identi-
fied several cross-business issues that were not included in the original corporate scorecard.
For example, many of the SBUs realized that they must understand their customers better
and needed to solicit feedback on customer satisfaction. The bottom-up strategy formula-
tion at the SBU level, within the context established at the company level, led to an entirely
new approach for accomplishing the SBU´s strategy. Several such strategic initiatives
emerged from the SBUs, and were then incorporated into an updated corporate scorecard.
Immediately upon approval of their scorecards, the SBUs began a monthly review process.
The monthly reviews were supplemented with quarterly reviews that focused more heavily
on strategic issues.

Tomas Bata University in Zlín, Faculty of management and economics 26
After two years, the Balanced Scorecard had become integrated into the regular manage-
ment cycle. The new management measures and processes had facilitated a shift of the en-
tire organizational culture, from an unfocused generalist to a targeted specialist one. [6]
2.4.3 Building an integrated management system
Once a scorecard has been designed and introduced, concerns soon arise if the scorecard is
not tied into other management programs, such as budgeting, alignment of strategic initia-
tives, and setting o personal targets. Without such connections, the effort devoted to devel-
oping a Balanced Scorecard may not deliver tangible benefits.
Most companies have a management calendar that identifies the different management
processes being used and the schedule for the operation of each process. Typically, the cal-
endar is organized around the budgeting and operational review process. The BSC provides
a vehicle to introduce strategic thinking into ongoing management processes, but such a
linkage must be made explicit.
The management calendar incorporates four essential features of a strategic management
system:
1. Strategy formulation and strategic issue update.
2. Link to personal objectives and rewards.
3. Link to planning, resource allocation, and annual budgets.
4. Feedback and strategic learning.
A link to personal objectives and rewards (especially by managers) is crucial by BSC im-
plementation. As companies attempt to implement new strategies, managers must continu-
ally take risks and experiment so that they can learn and grow. Executives must encourage
this innovative behaviour by managing the linkage to personal objectives and rewards.
Clearly, incentive compensation motivates performance. [6]
Tomas Bata University in Zlín, Faculty of management and economics 27
2.4.4 Managing the Balanced Scorecard strategic management system
Introducing a new management system centered on the BSC must overcome the organiza-
tional inertia that tends to envelop and absorb virtually any change program. Two types of
change agents are required for effective implementation of the new system. First, an or-
ganization needs transitional leaders, the managers who facilitate the building of the score-
card and who help embed it as a new management system. Second, the organization needs
to designate a manager to operate the strategic management system on an ongoing recur-
ring basis. An additional difficulty of embedding the BSC as a strategic management sys-
tem is that the responsibilities of both the transitional leaders and the manager of the ongo-
ing system do not fall within traditional organizational boxes. [6]
2.4.5 Summary: Translating strategy into action
Companies initially adopt the BSC for a variety of reasons (see Figure 4). In general, or-
ganizations can achieve these targeted objectives with the development of an initial BSC.
But the development of the scorecard and, especially, the process among senior managers
to define the objectives, measures, and targets for the scorecard, ultimately reveals an op-
portunity to use the BSC in a far more pervasive and comprehensive manner than originally
intended.
The Balanced Scorecard can be the cornerstone of an organization´s management system
since it aligns and supports key processes, including: clarify and update strategy, communi-
cate strategy throughout the organization, align departmental and person goals to the strat-
egy, identify and align strategic initiatives, link strategic objectives to long-term targets and
annual budgets, align strategic and operational reviews, obtain feedback to learn about and
improve strategy.
Further, by integrating the BSC into the management calendar, all management processes
can be aligned with and stay focused on implementing the organization´s long-term strat-
egy.

Tomas Bata University in Zlín, Faculty of management and economics 28
Everyone familiar with organizations knows implicitly that myriad control systems influ-
ence day-to-day organizations. But there is little systematical understanding of why or how
managers use these systems to accomplish their agendas. Executives use the many elements
of their management system to orchestrate their agendas. By building the management sys-
tem around the scorecard framework, they can achieve the ultimate payoff – translating
strategy into action. [6]
Another approach to the implementation of the Balanced Scorecard is presented by
Horváth & Partners. They introduce this model in five steps.
� To create organization presumptions for the implementation.
� To clarify strategies.
� To make the actual BSC model.
� To cascade the scorecard – roll-out process.
� To make the scorecard useful.
The first part of the process is creating organization presumptions for the implementation.
Organization presumptions have two meanings. Firstly, it is necessary to define conceptual
rules valid for all SBUs where the BSC is going to be implemented. It means to create per-
spectives. Secondly, it is important to determine an agreement on what capabilities are
needed within the company to actually pursue the strategy, to ensure BSC process man-
agement, i.e. project organization, course, information, communication, standardization of
used methods and clarifying of critical success factors.
Then, review and clarify strategies. This often requires some facilitated arguments and dis-
cussions, so that broad disagreements can be dealt with. Many organizations do not ade-
quately resolve their strategic differences, so people work separately towards different vi-
sions. For example, one automaker´s strategies for selling cars were split by group: the
CEO believed in forming alliances with exotic makers, the sales executive leaned on re-
bates, and the product group, with limited budgets, soaped up existing economy cars. The
Tomas Bata University in Zlín, Faculty of management and economics 29
result was an ineffectual, expensive hodgepodge. When one leader with a clear vision
worked with others to develop strategies, they were able to transform the culture and organ-
izational structure to produce vehicles that eventually saved the company.
The next step is to create a model for the Balanced Scorecard for an organization unit. This
organization unit can be a firm, SBU or an internal department. Based on the BSC struc-
ture, there are several steps that create the heart of BSC implementation. They are:
� Strategic goals concretizations.
� Strategic goals connection based on chain of causes and consequences.
� Choice of measures.
� Target value determination.
� Agreement on strategic actions.
The roll-out process is another part in BSC implementation. For larger organizations, a
Balanced Scorecard is first installed at the top, where commitment is most vital to success.
It is then cascaded throughout the organization, to focus departments´ goals with the over-
all company goals. For single stores or small companies, this step might be unnecessary.
The final step is getting people to use the scorecard as a routine matter – making it part of
the culture. This is where most management initiatives go wrong, leading to this sage ad-
vice: If you want something to be a useful tool, make it the only initiative you try this quar-
ter, give it your full attention and don´t take any shortcuts. Otherwise, an initiative be-
comes a fad.
Once created, the scorecard should become a part of a business´ daily life; it should be em-
bedded into company´s operations as a standard decision-making tool. The scorecard
makes the results of changes measurable, so stores or companies can learn what business
models yield the best long-term results – in short, what works and what does not work. If it
is updated regularly, the scorecard can give warnings of problems ahead, or signal opportu-
nities. It can (and should) also be used as the focus of continuous improvement. [3]
Tomas Bata University in Zlín, Faculty of management and economics 30
2.5 Advantages of the model
The advantage with the model proposed was to provide management with one single
agenda for all different initiatives and elements of the business to be managed. A second
advantage was to avoid sub-optimization by managers (knowingly or not) trying to boost
specific, often financial, measures (such as product output) while sacrificing other non-
financial aspects (such as product quality).
In 1993 September-October issue of Harvard Business Review Kaplan and Norton further
elaborated on their idea in Putting the Balanced Scorecard to Work. There was little new
content in this follow-up article based on four large American companies usage of balanced
scorecard, however, they stressed some important issues:
� The balanced scorecard is a top-down way to put the company´s strategy and vision
into action.
� It is forward-looking, addressing current and future success rather than the tradi-
tional, backward looking, financial measurement.
� Integrates internal and external measures, for example by having customer satisfac-
tion measures.
� It provides focus on the few most important aspects of the business.
The article also described a generic process for implementing balanced scorecard, while
stating that the content of each company´s scorecard need always be based on that com-
pany´s strategy and vision. Kaplan and Norton stress this direct link from overall vision
and mission via strategy and critical success factors down to individual measures. [2]
Other benefits of the BSC:
� Improved cost, cycle time, productivity and mission effectiveness.
� Alignment among mission, vision, strategies, objectives, measures, targets, initia-
tives.
Tomas Bata University in Zlín, Faculty of management and economics 31
� Measures provide basis for prioritization of activities and allocation of resources.
� Identification of best practices and benchmarking.
� More efficient and less risky decision making.
� Visibility and accountability.
� Improved estimates based on prior data.[1]
2.6 Critique against the BSC
As we have seen, a vast number of companies are using balanced scorecard. There are
many advocates for the model, and surprisingly few critics. The critics are mostly arguing
for a change in Kaplan and Norton´s balanced scorecard model, they almost never seek to
reject it totally. Kaplan and Norton seem to have chosen not to answer the criticism, but
rather continue their course of development of the framework. Generally, the criticism
comes from three angles.
The first kind of criticism focuses on Kaplan and Norton´s top-down strategy view based
on Porter´s positioning strategy school (Mintzberg, 1998). The criticism states that this is a
static and outdated view of strategy formulation and that it does not encompass much of the
last years of research.
The second type of criticism focuses on the lack of certain perspectives. The most common
one is the, already discussed, need of many organizations to add an employee perspective.
This reflects how many (often service oriented) organizations want to place their employ-
ees in the centre. Another perspective that is often proposed is society and environment,
sometimes also called sustainability.
The third type of criticism describes causal relations between the perspectives, organization
and learning → business processes → customer → financial, which is claimed to be ge-

Tomas Bata University in Zlín, Faculty of management and economics 32
neric by Kaplan and Norton (1996). Is this causality inherent in the model really holds? By
using an analytical approach, the claimed causal chain does not hold. [2]
Other potential pitfalls:
� Requires sustained senior management commitment and resources.
� Do not assign planning activities to full-time planning staff unless you want “shelf-
ware”.
� BSC will become the latest in a parade of faddish trends (if you let it).
� Analysis paralysis (e.g. development of metrics, complex data gathering).
� Lack of buy-in at lower levels in the organization (fear of being measured).
� Too many conflicting concepts / approaches.
� Too many change initiatives going on at once.
� Terminology stupefaction. [1]

Tomas Bata University in Zlín, Faculty of management and economics 33
2.7 Conclusion to the BSC
The BSC has emerged as a proven and effective tool in our quest to capture, describe, and
translate intangible assets into real value for all of organization´s stakeholders and, in the
process, to allow organizations to implement their differentiation strategies successfully. It
provides the management system for companies to invest in the long-term – in customers,
in employees, in new product development, and in systems – rather than managing the bot-
tom line to pump up short-term earnings.
Developed by R.Kaplan and D.Norton, this deceptively simple methodology translates an
organization´s strategy into performance objectives, measures, targets, and initiatives in
four balanced perspectives. Organizations around the globe have embraced the BSC and
reaped swift benefits from its commonsense principles. Such benefits include increased
financial returns, greater employee alignment with overall goals, improved collaboration,
and an unrelenting focus on strategy, to name just a few. To reap those rewards, however,
an organization must possess the tools necessary to craft an effective Balanced Scorecard.
[13]
The Balanced Scorecard requires a rigorous process and commitment, but its benefits are
worth the costs. Even if you only adopt a few of the elements of the Balanced Scorecard,
the research suggests you will have a competitive advantage. Best of all, much of the score-
card is simple common sense: getting agreement on strategy, strengths, and weaknesses;
measuring essential business numbers; and focusing not just on financial outcomes, but
also on the issues that will affect those outcomes in the future. The Balanced Scorecard,
and all its pieces, leverages common sense into a substantial competitive advantage. [3]

Tomas Bata University in Zlín, Faculty of management and economics 34
II. PRACTICAL PART
Tomas Bata University in Zlín, Faculty of management and economics 35
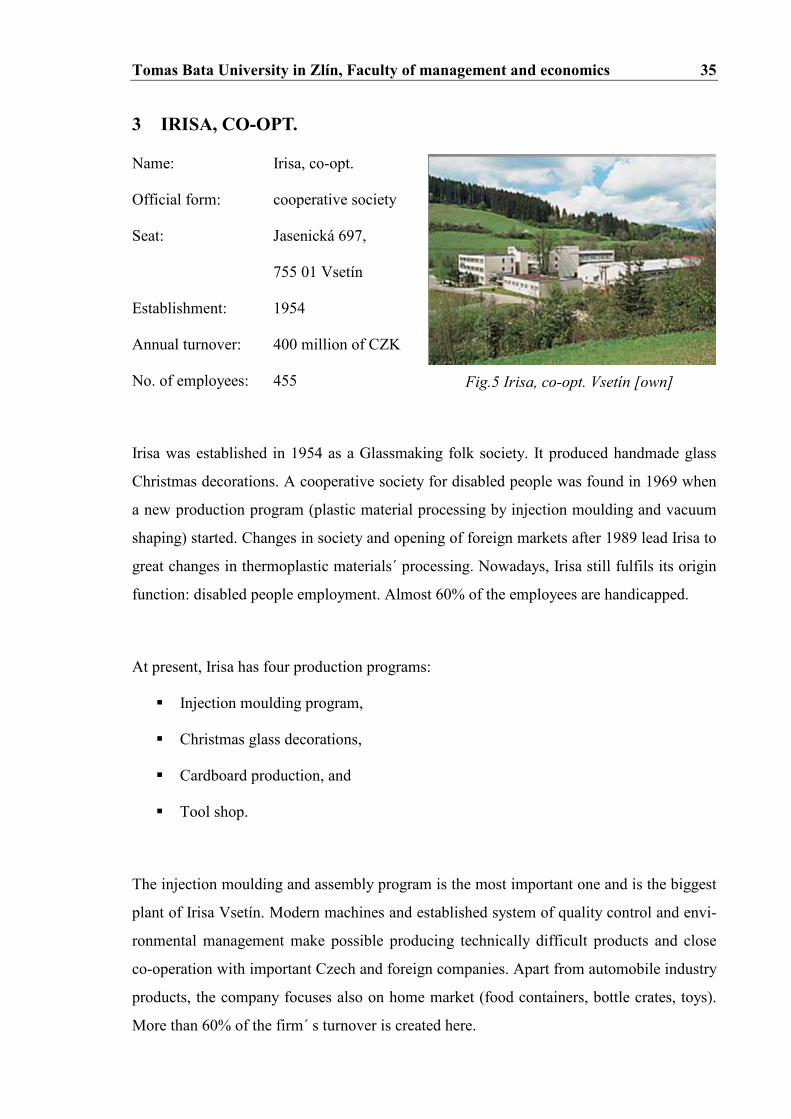
Fig.5 Irisa, co-opt. Vsetín [own]
3 IRISA, CO-OPT.
Name: Irisa, co-opt.
Official form: cooperative society
Seat: Jasenická 697,
755 01 Vsetín
Establishment: 1954
Annual turnover: 400 million of CZK
No. of employees: 455
Irisa was established in 1954 as a Glassmaking folk society. It produced handmade glass
Christmas decorations. A cooperative society for disabled people was found in 1969 when
a new production program (plastic material processing by injection moulding and vacuum
shaping) started. Changes in society and opening of foreign markets after 1989 lead Irisa to
great changes in thermoplastic materials´ processing. Nowadays, Irisa still fulfils its origin
function: disabled people employment. Almost 60% of the employees are handicapped.
At present, Irisa has four production programs:
� Injection moulding program,
� Christmas glass decorations,
� Cardboard production, and
� Tool shop.
The injection moulding and assembly program is the most important one and is the biggest
plant of Irisa Vsetín. Modern machines and established system of quality control and envi-
ronmental management make possible producing technically difficult products and close
co-operation with important Czech and foreign companies. Apart from automobile industry
products, the company focuses also on home market (food containers, bottle crates, toys).
More than 60% of the firm´ s turnover is created here.
Tomas Bata University in Zlín, Faculty of management and economics 36
Christmas glass decorations production has a very good position in association Ornex (2nd
biggest producer in CZ) due to long tradition and modern trends and technologies. Irisa
offers wide range of high-quality hand painted traditional or stylish glass decorations. The
size and design of the decorations have a distinct, individual appearance characterized by
coloured effects, creative expression or being finished off with other decorative material.
95% of the production is exported to the various countries of the world.
Cardboard production started to develop very soon after establishing the cooperative soci-
ety to pack the Christmas glass decorations. Now Irisa offers different cardboard products
according to the customer´s needs. Tool shop is equipped with all necessary equipment for
difficult-shape mould production. In includes CNC milling machine, electro-erosive ma-
chines etc. Process of the mould production is continuously checked and all produced
moulds are tested.
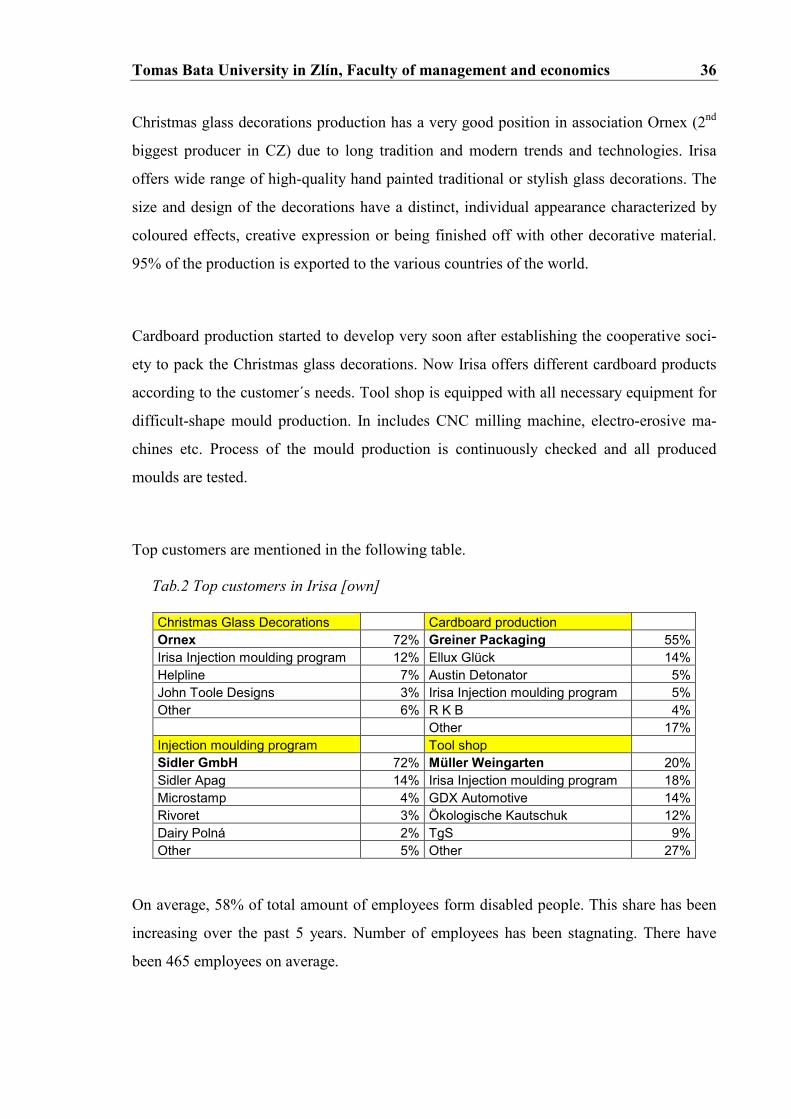
Top customers are mentioned in the following table.
Tab.2 Top customers in Irisa [own]
Christmas Glass Decorations Cardboard production Ornex 72% Greiner Packaging 55% Irisa Injection moulding program 12% Ellux Glück 14% Helpline 7% Austin Detonator 5% John Toole Designs 3% Irisa Injection moulding program 5% Other 6% R K B 4% Other 17% Injection moulding program Tool shop Sidler GmbH 72% Müller Weingarten 20% Sidler Apag 14% Irisa Injection moulding program 18% Microstamp 4% GDX Automotive 14% Rivoret 3% Ökologische Kautschuk 12% Dairy Polná 2% TgS 9% Other 5% Other 27%
On average, 58% of total amount of employees form disabled people. This share has been
increasing over the past 5 years. Number of employees has been stagnating. There have
been 465 employees on average.
Tomas Bata University in Zlín, Faculty of management and economics 37
Irisa employs disabled people due to cost advantageousness. Their physical and mental
conditions are not so good to target the performance. Irisa provides handicapped people to
join the work procedure. It mobilizes their skills and motivation for continuous improve-
ments in process capabilities and quality. According to the § 35 of Income tax law, tax is
decreased to a company up to 18,000 CZK / 1 handicapped employee per year. Irisa´s EBT
in 2006 was 8,873 thousands of CZK. Total tax abatement of all handicapped employees
was approximately 5,200 thousands of CZK. Total tax savings were around 2,129 thou-
sands of CZK. Irisa´s EAT was the same as EBT, i.e. 8,873 thousands of CZK. Irisa does
not plan to employ more handicapped people in future due to lack of suitable work for
them but it keeps the contemporary rate.
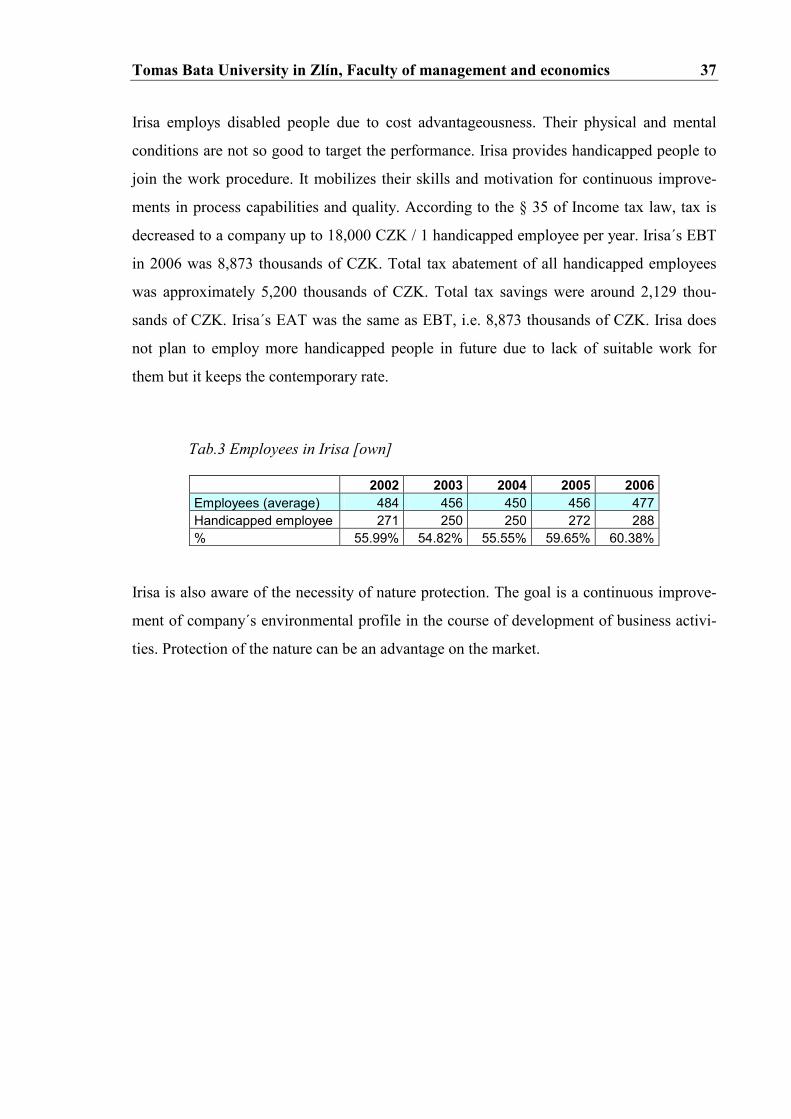
Tab.3 Employees in Irisa [own]
2002 2003 2004 2005 2006
Employees (average) 484 456 450 456 477 Handicapped employee 271 250 250 272 288 % 55.99% 54.82% 55.55% 59.65% 60.38%
Irisa is also aware of the necessity of nature protection. The goal is a continuous improve-
ment of company´s environmental profile in the course of development of business activi-
ties. Protection of the nature can be an advantage on the market.
Tomas Bata University in Zlín, Faculty of management and economics 38
4 PEST ANALYSIS
A PEST analysis measures the external macro-environment that affects all firms. P.E.S.T.
is an acronym for the Political, Economic, Social, and Technological factors of the external
macro-environment. Such external factors usually are beyond the firm´s control and some-
times present themselves as threats. For this reason, some say that “pest” is an appropriate
term for these factors. However, changes in the external environment also create new op-
portunities and the letters sometimes are rearranged to construct the more optimistic term
of STEP analysis.
Many macro-environmental factors are country-specific and a PEST analysis will need to
be performed for all countries of interest. The following are examples of some of the fac-
tors that might be considered in a PEST analysis.
Key problems:
� POLITICAL ANALYSIS: Harmonization with EU standards, Trade regulations,
Favored trading partners, EU funds.
� ECONOMIC ANALYSIS: Investments, Skill level of workforce, Economic growth
rate, Infrastructure quality, Currency.
� SOCIAL ANALYSIS: Education, Support of handicapped employees, Attitudes
(environmental consciousness).
� TECHNOLOGICAL ANALYSIS: New products, Research and development, Re-
cent technological developments, Modernization, Automation.
Tomas Bata University in Zlín, Faculty of management and economics 39
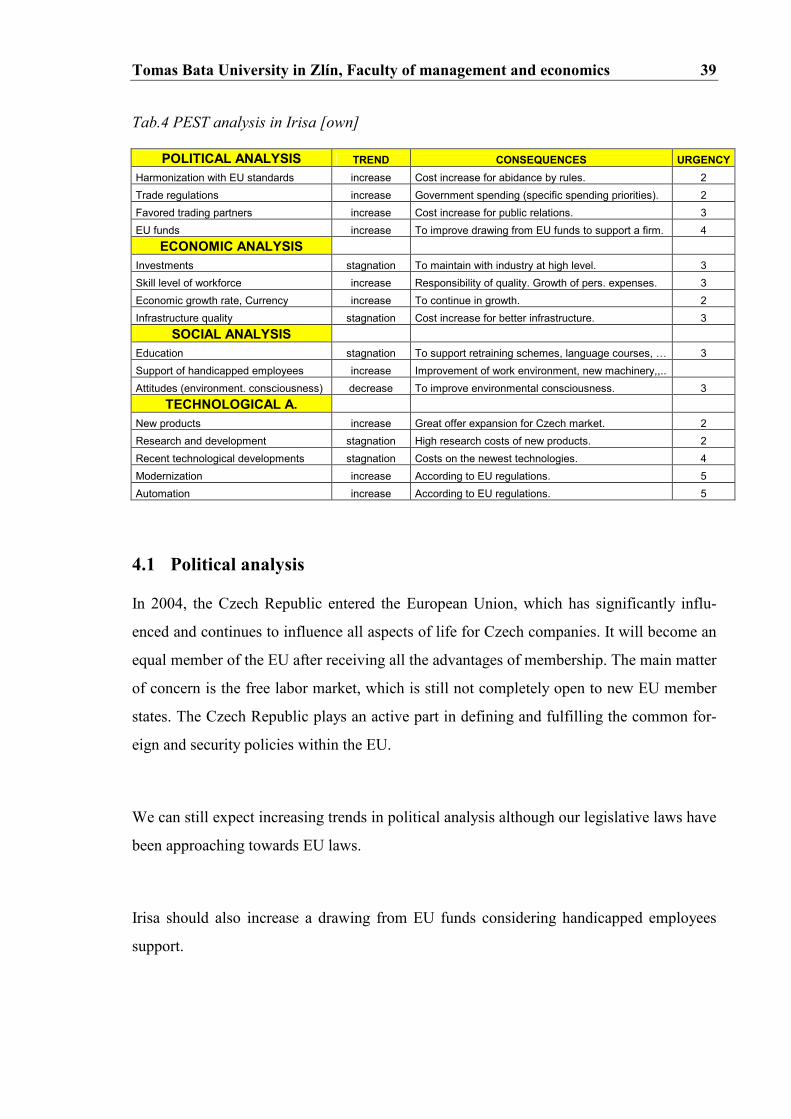
Tab.4 PEST analysis in Irisa [own]
POLITICAL ANALYSIS TREND CONSEQUENCES URGENCY
Harmonization with EU standards increase Cost increase for abidance by rules. 2
Trade regulations increase Government spending (specific spending priorities). 2
Favored trading partners increase Cost increase for public relations. 3
EU funds increase To improve drawing from EU funds to support a firm. 4
ECONOMIC ANALYSIS
Investments stagnation To maintain with industry at high level. 3
Skill level of workforce increase Responsibility of quality. Growth of pers. expenses. 3
Economic growth rate, Currency increase To continue in growth. 2
Infrastructure quality stagnation Cost increase for better infrastructure. 3
SOCIAL ANALYSIS
Education stagnation To support retraining schemes, language courses, … 3
Support of handicapped employees increase Improvement of work environment, new machinery,,..
Attitudes (environment. consciousness) decrease To improve environmental consciousness. 3
TECHNOLOGICAL A.
New products increase Great offer expansion for Czech market. 2
Research and development stagnation High research costs of new products. 2
Recent technological developments stagnation Costs on the newest technologies. 4
Modernization increase According to EU regulations. 5
Automation increase According to EU regulations. 5
4.1 Political analysis
In 2004, the Czech Republic entered the European Union, which has significantly influ-
enced and continues to influence all aspects of life for Czech companies. It will become an
equal member of the EU after receiving all the advantages of membership. The main matter
of concern is the free labor market, which is still not completely open to new EU member
states. The Czech Republic plays an active part in defining and fulfilling the common for-
eign and security policies within the EU.
We can still expect increasing trends in political analysis although our legislative laws have
been approaching towards EU laws.
Irisa should also increase a drawing from EU funds considering handicapped employees
support.
Tomas Bata University in Zlín, Faculty of management and economics 40
4.2 Economic analysis
For several years now, the Czech Republic has been attracting the attention of investors the
world over. The reasons for this are easy to see: a strong and growing economy, equitable
and stable conditions, a qualified workforce and the low cost of doing business. For that
reason, the Czech Republic is showing consistent yearly growth of capital investments and
a growing number of multinational, economically mature companies coming here to do
business. In all companies is accentuated cost decrease.
The Czech Republic has over the last two decades rapidly raised the country´s standard of
living, developed its service sector and concentrated on implementing important economic
reforms. The country has also laid the groundwork for its continued development, particu-
larly within the European economy. Currently, the Czech Republic ranks among the fast-
est-developing countries in the region and compensates for the delay that resulted from the
historical development.
Rubber and plastic production in the Czech Republic has developed considerably over the
past five years. Its position among processing industries has been constantly improving.
The main specific aspect of this industry is the fact that, in contrast to most other industries
and fields of production, it has hardly been affected by national economic reforms or by
global economic cycle phases. Thanks to high investment activity, many reputable compa-
nies have brought their businesses here. The manufacture of rubber and plastic products
belongs among the most dynamic branches of the manufacturing industry.
Czech taxes are on the EU average. However, the state takes a lot more from income than
elsewhere in Europe and less from consumption. Direct taxes from income and profit con-
tribute to the state budget with 68.5%.
Tomas Bata University in Zlín, Faculty of management and economics 41
4.3 Social analysis
Protection of Czech nature is a necessary component of efforts leading to the preservation
the unique character and variety of the Czech Republic. Protection is realized not only with
protected areas and national parks but also with reduction of emissions and ecological
power supplies. Irisa is aware of the need of environment protection and its goal is to ame-
liorate environmental profile of all division. Irisa renders this decision to be a market ad-
vantage and influence its surroundings.
Due to the fact that plastic industry has been growing rapidly during the past few years, it is
necessary to educate employees via retraining schemes. Up today, there has been a great
emphasis on quality. Now, employees will be educated and trained in marketing, human
resources, information technologies, communication, as well.
Irisa also supports to employ handicapped people. Almost 60% from 450 employees are
handicapped people. The firm is aware of work environment improvement and it gives a
great amount of money to better it every year.
4.4 Technological analysis
This factor influences business significantly. Irisa should buy new and better machinery to
be competitive, mainly to injection moulding machines. New technologies purchases go
together with the productivity increase and capacity expansion. Irisa should also invest into
the new information technology. Employees do not exploit given information effectively. A
modern server would simplify and speed up most of operations in Irisa.
Tomas Bata University in Zlín, Faculty of management and economics 42
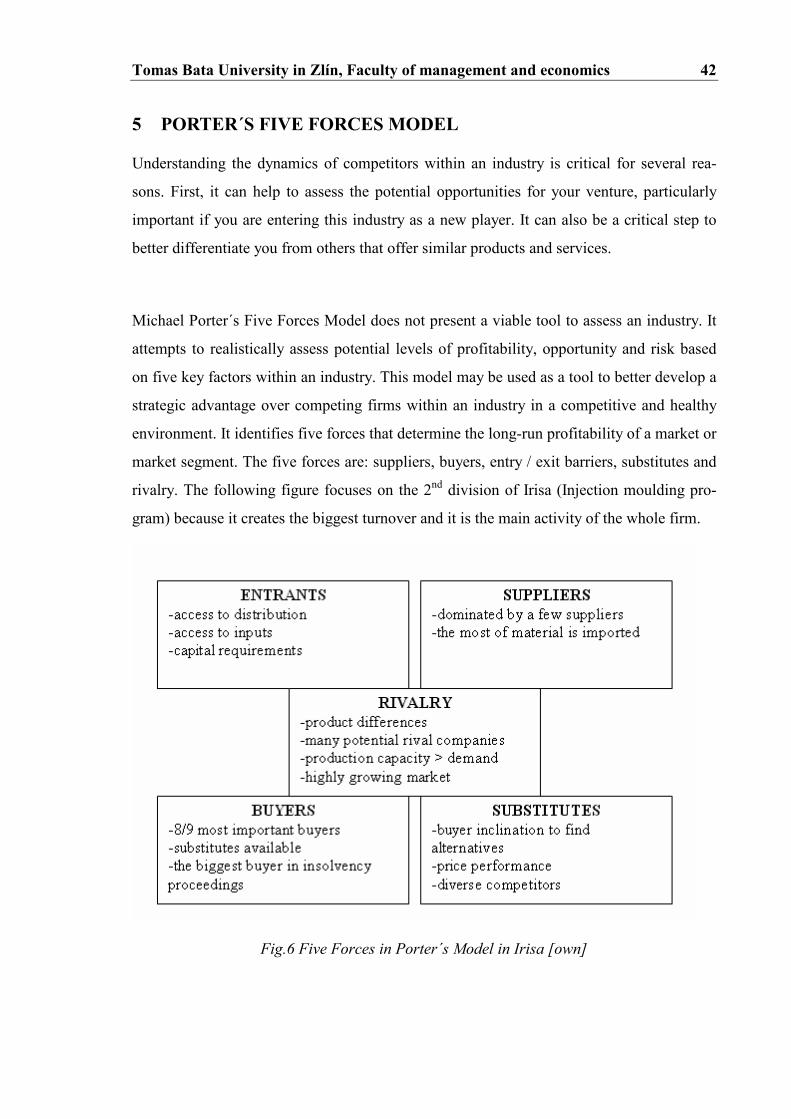
5 PORTER´S FIVE FORCES MODEL
Understanding the dynamics of competitors within an industry is critical for several rea-
sons. First, it can help to assess the potential opportunities for your venture, particularly
important if you are entering this industry as a new player. It can also be a critical step to
better differentiate you from others that offer similar products and services.
Michael Porter´s Five Forces Model does not present a viable tool to assess an industry. It
attempts to realistically assess potential levels of profitability, opportunity and risk based
on five key factors within an industry. This model may be used as a tool to better develop a
strategic advantage over competing firms within an industry in a competitive and healthy
environment. It identifies five forces that determine the long-run profitability of a market or
market segment. The five forces are: suppliers, buyers, entry / exit barriers, substitutes and
rivalry. The following figure focuses on the 2nd division of Irisa (Injection moulding pro-
gram) because it creates the biggest turnover and it is the main activity of the whole firm.
Fig.6 Five Forces in Porter´s Model in Irisa [own]

Tomas Bata University in Zlín, Faculty of management and economics 43
5.1 Entrants
It is probable that Irisa will be threatened by new entrants to the market. Every company
that possesses injection moulding machinery is a potential rival. But the real threats are
already existing rival companies. The rivalry among firms in an industry is quite low – in-
dustry is considered to be disciplined.
For customers, it is not relatively easy to change the contemporary suppliers. If the real
threat occurs, Irisa would choose from several competitive moves:
� Changing prices – lowering prices to gain a temporary advantage.
� Improving product differentiation – improving features, implementing innovations
in the manufacturing process and in the product itself.
� Exploiting relationships with suppliers – set high quality standards and required to
meet its demands for product specification and price.
5.2 Suppliers
There are 5 major suppliers for Irisa. They are usually big multinational companies with its
subsidiaries in the Czech Republic. In case of changing one of the suppliers, there would
not occur a serious problem. This force is also influenced by the crude oil price because the
most of material is imported.
5.3 Rivalry
There are many potential rival companies. They usually prefer the low cost method. If they
can set up the production in e.g. Turkey, Ukraine, and so on, they reach the market advan-
tage. Other potential threats are:
� Product differentials – customers are aware of differences in products.
� Product capacity is higher than the actual demand.
� Highly growing market.
Tomas Bata University in Zlín, Faculty of management and economics 44
5.4 Buyers
Irisa has one major buyer – Sidler GmbH from Germany – that purchases a significant pro-
portion of output, almost 80%. About 5% of output purchases its subsidiary in France –
Sidler Apag GmbH. Other 5 to 6 buyers are important as well but they possess around 5%
of the total purchase. Irisa should focus on buyers’ structure. It is not adequate to have one
major buyer (80%) because in case of its bankruptcy, Irisa should have dealt with serious
problems.
Sidler has been in insolvency proceedings from 01/03/2007. About 800.000 EUR has not
been paid to Irisa but it is expected that till the end of April, Irisa will have got about 30%
of this total amount and till the end of the year 2007, Irisa will have received about 90%
from the rest (approximately 495.000 EUR from 550.000 EUR). In the future, Irisa counts
with Sidler GmbH as its main buyer but it depends on the new management (Flextronic) in
Sidler after finishing of insolvency proceedings.
5.5 Substitutes
The treat of substitutes impacts price-based competition. New technologies contribute to
competition though substitute products and services. A buyer inclination to find alterna-
tives is another threat of substitutes. This force is not so big because substitutes can use
new materials similar to plastic goods that have been produced so far. There is no great
pressure on products due to this fact.
Tomas Bata University in Zlín, Faculty of management and economics 45
6 FINANCIAL ANALYSIS
For the financial analysis were provided financial reports (Balanced Sheet, Profit and Loss
Statement, Cash-flow Statement) from 2002 to 2006.
Financial analysis can assist in looking deep within quarterly or annual financial statements
to determine how well or poorly any enterprise or business has performed over the time
periods in question and explains financial circumstances. The main goal is to shed light on
the true financial condition of a company so realistic valuations can be determined for in-
vestment, lending, or merger and acquisition purposes.
Firstly, this financial analysis contains the income statement analysis (assets and liabilities
and revenues and expenses analysis) with trends during the past few years. After that, it is
completed by analyses of ratios (solvency / leverage, liquidity, profitability, activity, others
and additional – such as Altman Z-Score and Index IN). The conclusion consists of total
summary, financial position of the company and recommendations.
6.1 Income statement analysis
To an enterprising investor, income statement analysis reveals much more than company´s
earnings. It provides important insights into how effectively management is controlling
expenses, the amount of interest income and expense, and the taxes paid. Investors can use
income statement analysis to calculate financial ratios that will reveal the rate of return the
business is earning on the shareholders´ retained earnings and assets; they can also compare
a company´s profits to its competitors by examining various profit margins such as the
gross profit margin, operating profit margin, and net profit margin.
The basic information about the structure of assets and liabilities and revenues and ex-
penses in Irisa are mentioned in APPENDIX 2 and 3.
Tomas Bata University in Zlín, Faculty of management and economics 46
6.1.1 Assets and liabilities analysis
As we can see from the tables mentioned in APPENDIX 2, assets and liabilities in Irisa,
co-opt. have risen by 6% on average during the past 5 years. The total increase of assets /
liabilities is by 25% (2006/2002). Every year the increase was around 5 %, except the large
growth in 2005 where the rake off was around 17% and the slight decrease in 2003 (3%).
The major part of assets consists of fixed assets, mainly of tangible fixed assets (around
57% on average). It is visible that every year there has been a slight decline by 4% p.a. It is
interesting that in years 2002 – 2005 there was a predominance of fixed assets over current
assets. In 2006 the situation turned. Indispensable is also inventory with its 20% share on
total assets / liabilities every year. Current assets increase was caused by revenues and fi-
nancial assets growth. The main part of total liabilities is constituted by equity (around
60% p.a.), mainly reserve funds (47% on average). These have been decreasing year by
year. Bank loans and financial accommodations formed quite a small part of total liabilities
in 2002, 2003 and 2004 (about 14% p.a.) but in 2005 and 2006 formed about 25% that is
the average level of the same companies in industry. We can consider the company as a
profitable one because there has been a slight growth of equity every year with the mainte-
nance of registered capital. This has decreased a bit due to salaried shares of leaving mem-
bers from Irisa.
In comparison with a branch of industry, the situation is quite similar. The last year 2006 is
formed only by three quarters because the analyses have not been available till the thesis
handover deadline. We can see the great increase of total assets and liabilities (it almost
doubled from 2002 to 2006). The major part of total assets is formed by fixed assets (about
53% on average). The major part of total liabilities consists of equity (around 56% per
year). An important part is formed by bank loans and financial accommodations (around
17% of total liabilities).
Tomas Bata University in Zlín, Faculty of management and economics 47
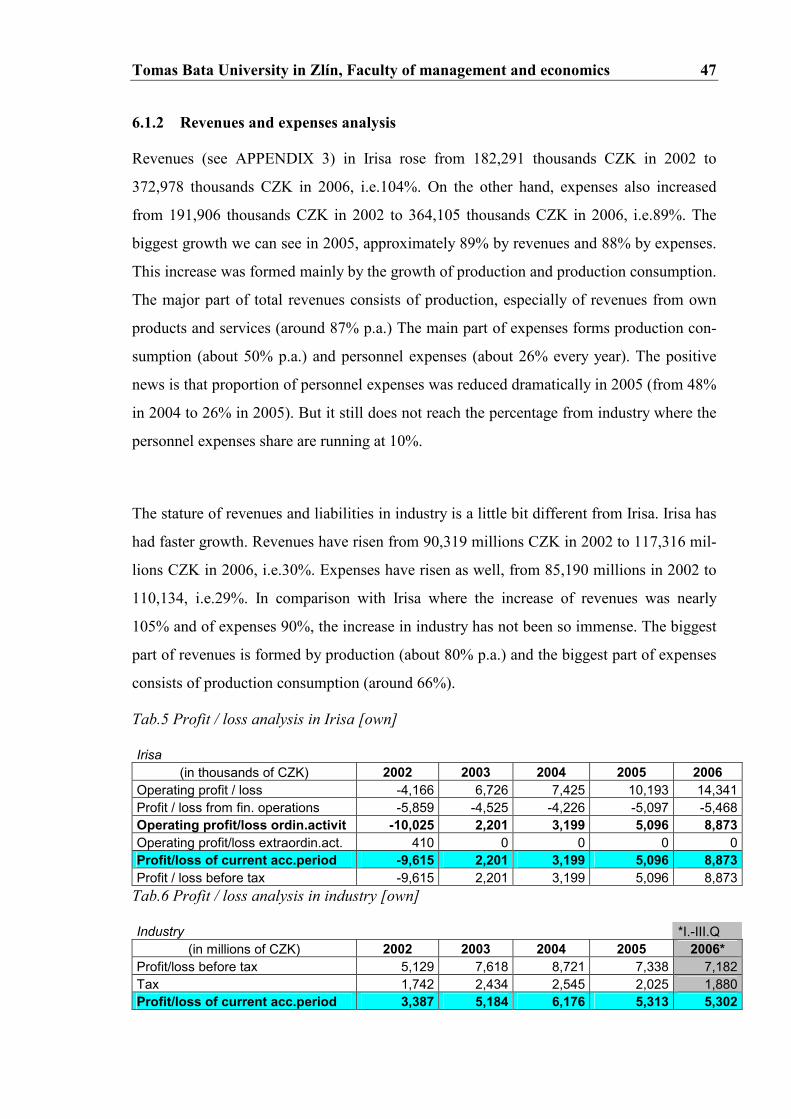
6.1.2 Revenues and expenses analysis
Revenues (see APPENDIX 3) in Irisa rose from 182,291 thousands CZK in 2002 to
372,978 thousands CZK in 2006, i.e.104%. On the other hand, expenses also increased
from 191,906 thousands CZK in 2002 to 364,105 thousands CZK in 2006, i.e.89%. The
biggest growth we can see in 2005, approximately 89% by revenues and 88% by expenses.
This increase was formed mainly by the growth of production and production consumption.
The major part of total revenues consists of production, especially of revenues from own
products and services (around 87% p.a.) The main part of expenses forms production con-
sumption (about 50% p.a.) and personnel expenses (about 26% every year). The positive
news is that proportion of personnel expenses was reduced dramatically in 2005 (from 48%
in 2004 to 26% in 2005). But it still does not reach the percentage from industry where the
personnel expenses share are running at 10%.
The stature of revenues and liabilities in industry is a little bit different from Irisa. Irisa has
had faster growth. Revenues have risen from 90,319 millions CZK in 2002 to 117,316 mil-
lions CZK in 2006, i.e.30%. Expenses have risen as well, from 85,190 millions in 2002 to
110,134, i.e.29%. In comparison with Irisa where the increase of revenues was nearly
105% and of expenses 90%, the increase in industry has not been so immense. The biggest
part of revenues is formed by production (about 80% p.a.) and the biggest part of expenses
consists of production consumption (around 66%).
Tab.5 Profit / loss analysis in Irisa [own]
Irisa (in thousands of CZK) 2002 2003 2004 2005 2006
Operating profit / loss -4,166 6,726 7,425 10,193 14,341 Profit / loss from fin. operations -5,859 -4,525 -4,226 -5,097 -5,468 Operating profit/loss ordin.activit -10,025 2,201 3,199 5,096 8,873
Operating profit/loss extraordin.act. 410 0 0 0 0 Profit/loss of current acc.period -9,615 2,201 3,199 5,096 8,873
Profit / loss before tax -9,615 2,201 3,199 5,096 8,873
Tab.6 Profit / loss analysis in industry [own]
Industry *I.-III.Q (in millions of CZK) 2002 2003 2004 2005 2006*
Profit/loss before tax 5,129 7,618 8,721 7,338 7,182 Tax 1,742 2,434 2,545 2,025 1,880 Profit/loss of current acc.period 3,387 5,184 6,176 5,313 5,302
Tomas Bata University in Zlín, Faculty of management and economics 48
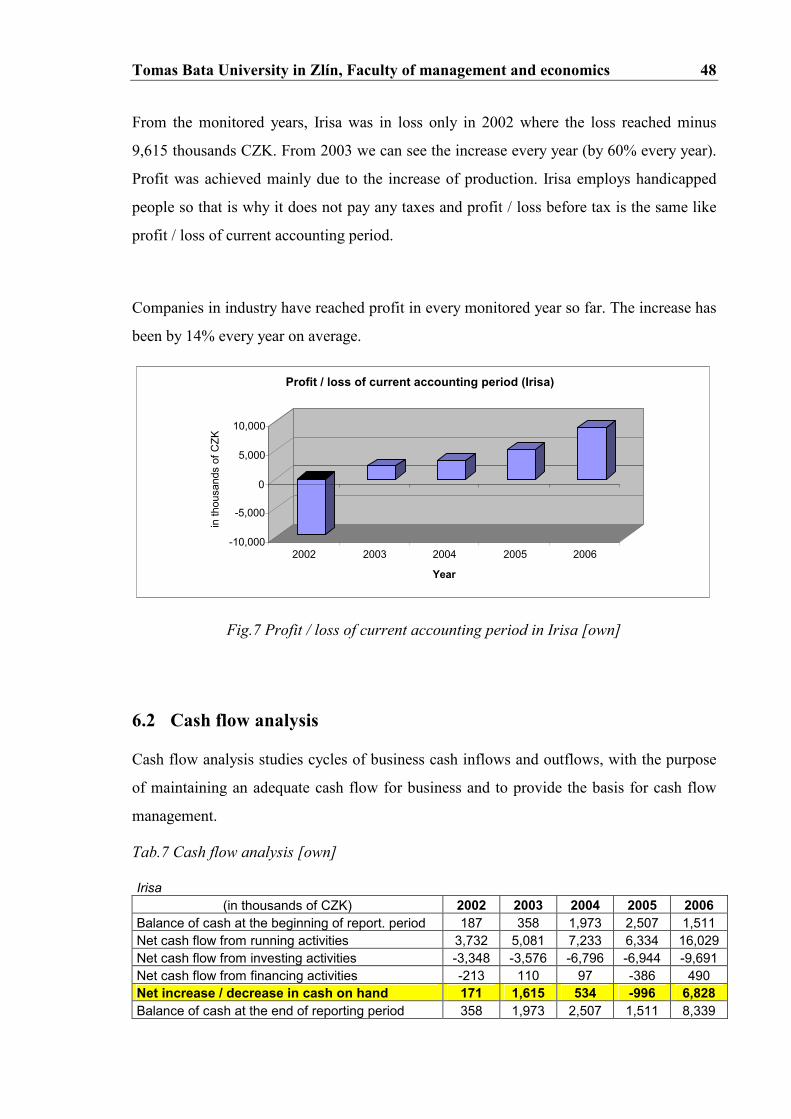
From the monitored years, Irisa was in loss only in 2002 where the loss reached minus
9,615 thousands CZK. From 2003 we can see the increase every year (by 60% every year).
Profit was achieved mainly due to the increase of production. Irisa employs handicapped
people so that is why it does not pay any taxes and profit / loss before tax is the same like
profit / loss of current accounting period.
Companies in industry have reached profit in every monitored year so far. The increase has
been by 14% every year on average.
Fig.7 Profit / loss of current accounting period in Irisa [own]
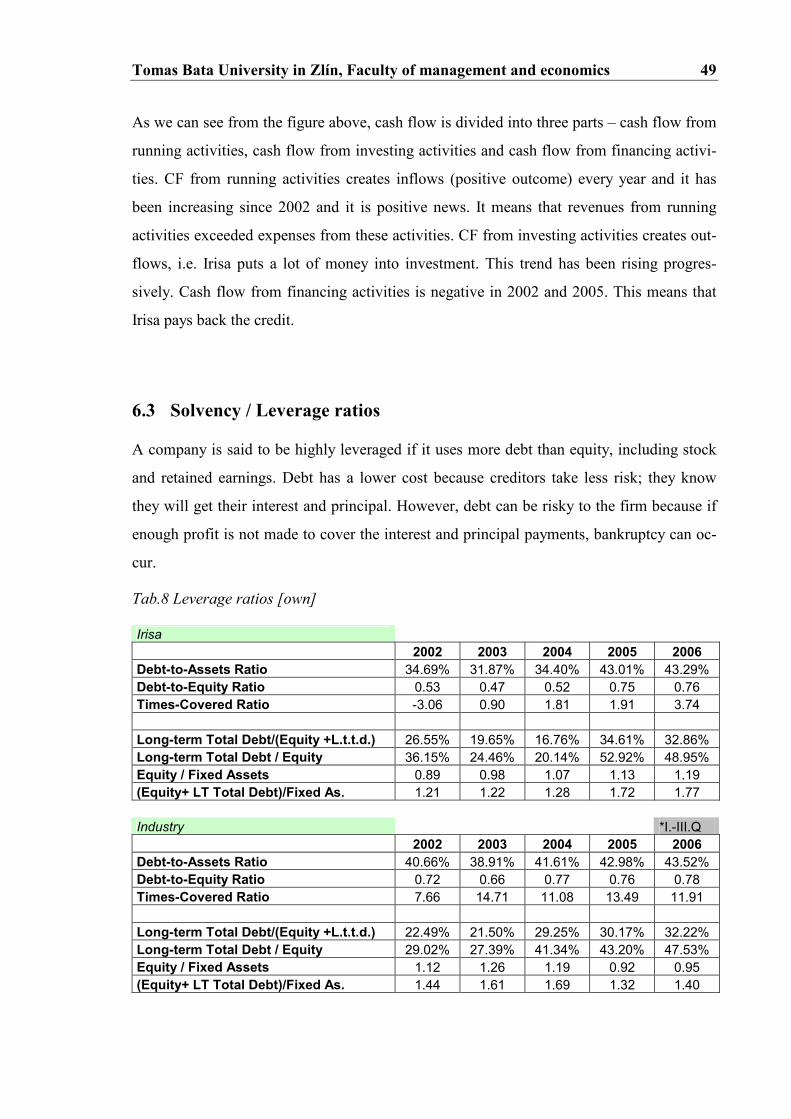
6.2 Cash flow analysis
Cash flow analysis studies cycles of business cash inflows and outflows, with the purpose
of maintaining an adequate cash flow for business and to provide the basis for cash flow
management.
Tab.7 Cash flow analysis [own]
Irisa (in thousands of CZK) 2002 2003 2004 2005 2006
Balance of cash at the beginning of report. period 187 358 1,973 2,507 1,511 Net cash flow from running activities 3,732 5,081 7,233 6,334 16,029 Net cash flow from investing activities -3,348 -3,576 -6,796 -6,944 -9,691 Net cash flow from financing activities -213 110 97 -386 490 Net increase / decrease in cash on hand 171 1,615 534 -996 6,828
Balance of cash at the end of reporting period 358 1,973 2,507 1,511 8,339
-10,000
-5,000
0
5,000
10,000
in thousa
nds of CZK
2002 2003 2004 2005 2006 Year
Profit / loss of current accounting period (Irisa)
Tomas Bata University in Zlín, Faculty of management and economics 49
As we can see from the figure above, cash flow is divided into three parts – cash flow from
running activities, cash flow from investing activities and cash flow from financing activi-
ties. CF from running activities creates inflows (positive outcome) every year and it has
been increasing since 2002 and it is positive news. It means that revenues from running
activities exceeded expenses from these activities. CF from investing activities creates out-
flows, i.e. Irisa puts a lot of money into investment. This trend has been rising progres-
sively. Cash flow from financing activities is negative in 2002 and 2005. This means that
Irisa pays back the credit.
6.3 Solvency / Leverage ratios
A company is said to be highly leveraged if it uses more debt than equity, including stock
and retained earnings. Debt has a lower cost because creditors take less risk; they know
they will get their interest and principal. However, debt can be risky to the firm because if
enough profit is not made to cover the interest and principal payments, bankruptcy can oc-
cur.
Tab.8 Leverage ratios [own]
Irisa 2002 2003 2004 2005 2006
Debt-to-Assets Ratio 34.69% 31.87% 34.40% 43.01% 43.29% Debt-to-Equity Ratio 0.53 0.47 0.52 0.75 0.76 Times-Covered Ratio -3.06 0.90 1.81 1.91 3.74 Long-term Total Debt/(Equity +L.t.t.d.) 26.55% 19.65% 16.76% 34.61% 32.86% Long-term Total Debt / Equity 36.15% 24.46% 20.14% 52.92% 48.95% Equity / Fixed Assets 0.89 0.98 1.07 1.13 1.19 (Equity+ LT Total Debt)/Fixed As. 1.21 1.22 1.28 1.72 1.77 Industry *I.-III.Q 2002 2003 2004 2005 2006
Debt-to-Assets Ratio 40.66% 38.91% 41.61% 42.98% 43.52% Debt-to-Equity Ratio 0.72 0.66 0.77 0.76 0.78 Times-Covered Ratio 7.66 14.71 11.08 13.49 11.91 Long-term Total Debt/(Equity +L.t.t.d.) 22.49% 21.50% 29.25% 30.17% 32.22% Long-term Total Debt / Equity 29.02% 27.39% 41.34% 43.20% 47.53% Equity / Fixed Assets 1.12 1.26 1.19 0.92 0.95 (Equity+ LT Total Debt)/Fixed As. 1.44 1.61 1.69 1.32 1.40
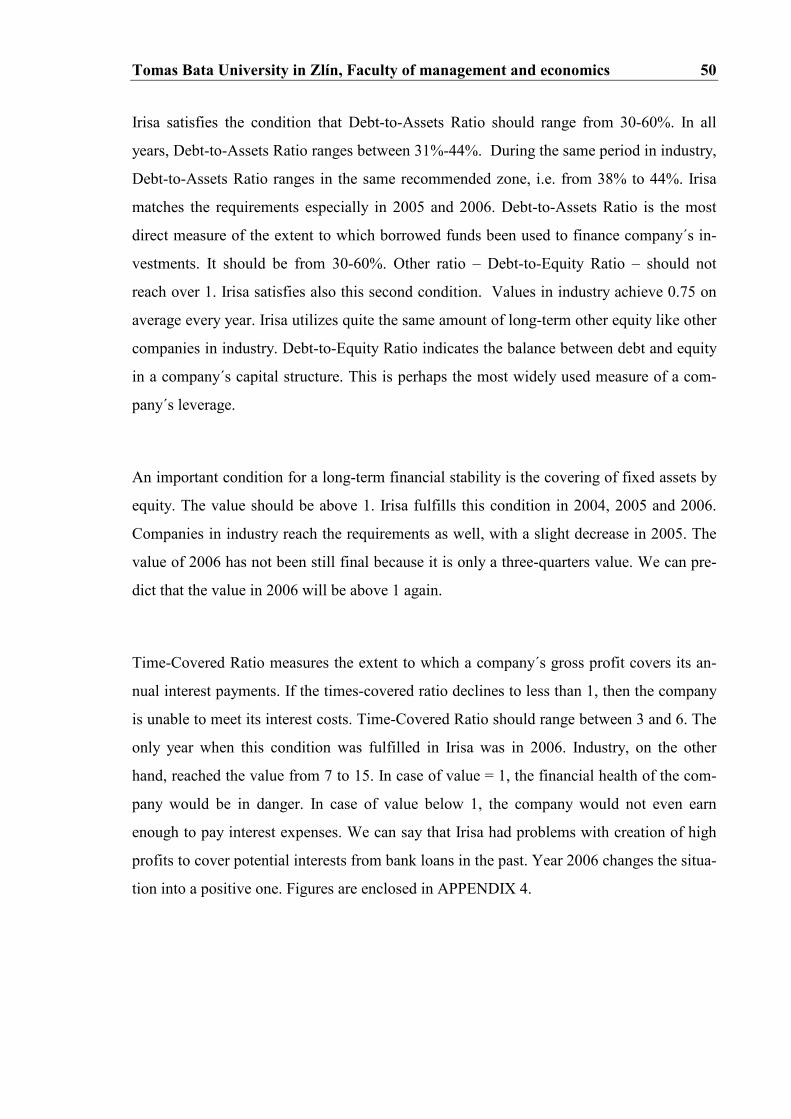
Tomas Bata University in Zlín, Faculty of management and economics 50
Irisa satisfies the condition that Debt-to-Assets Ratio should range from 30-60%. In all
years, Debt-to-Assets Ratio ranges between 31%-44%. During the same period in industry,
Debt-to-Assets Ratio ranges in the same recommended zone, i.e. from 38% to 44%. Irisa
matches the requirements especially in 2005 and 2006. Debt-to-Assets Ratio is the most
direct measure of the extent to which borrowed funds been used to finance company´s in-
vestments. It should be from 30-60%. Other ratio – Debt-to-Equity Ratio – should not
reach over 1. Irisa satisfies also this second condition. Values in industry achieve 0.75 on
average every year. Irisa utilizes quite the same amount of long-term other equity like other
companies in industry. Debt-to-Equity Ratio indicates the balance between debt and equity
in a company´s capital structure. This is perhaps the most widely used measure of a com-
pany´s leverage.
An important condition for a long-term financial stability is the covering of fixed assets by
equity. The value should be above 1. Irisa fulfills this condition in 2004, 2005 and 2006.
Companies in industry reach the requirements as well, with a slight decrease in 2005. The
value of 2006 has not been still final because it is only a three-quarters value. We can pre-
dict that the value in 2006 will be above 1 again.
Time-Covered Ratio measures the extent to which a company´s gross profit covers its an-
nual interest payments. If the times-covered ratio declines to less than 1, then the company
is unable to meet its interest costs. Time-Covered Ratio should range between 3 and 6. The
only year when this condition was fulfilled in Irisa was in 2006. Industry, on the other
hand, reached the value from 7 to 15. In case of value = 1, the financial health of the com-
pany would be in danger. In case of value below 1, the company would not even earn
enough to pay interest expenses. We can say that Irisa had problems with creation of high
profits to cover potential interests from bank loans in the past. Year 2006 changes the situa-
tion into a positive one. Figures are enclosed in APPENDIX 4.

Tomas Bata University in Zlín, Faculty of management and economics 51
6.4 Liquidity ratios
Company´s liquidity is a measure of its ability to meet short-term obligations. An asset is
deemed liquid if it can be readily converted into cash. Liquid assets are current assets such
as cash, marketable securities, accounts receivable, and so on. Two commonly used liquid-
ity ratios are:
Tab.9 Liquidity ratios [own]
Irisa 2002 2003 2004 2005 2006
Current ratio 1.06 1.02 1.13 1.36 1.34 Quick ratio 0.41 0.51 0.33 0.67 0.85 Cash ratio 0.01 0.04 0.05 0.02 0.11 Working capital / Current Assets 5.34% 2.37% 11.59% 26.39% 25.44% Working capital / Assets 1.40% 0.71% 4.33% 12.81% 13.16% Industry *I.-III.Q 2002 2003 2004 2005 2006
Current ratio 1.61 1.75 2.17 1.50 1.71 Quick ratio 1.14 1.28 1.65 1.03 1.17 Cash ratio 0.18 0.16 0.22 0.24 0.17 Working capital / Current Assets 38.00% 42.78% 53.97% 33.46% 41.37% Working capital / Assets 17.05% 22.19% 28.60% 12.66% 16.53%
Liquidity ratios reach very low values in Irisa. Current ratio measures the extent to which
the claims of short-term creditors are covered by assets that can be quickly converted into
cash. Most companies should have a ratio of at least 1.5, because failure to meet these
commitments can lead to bankruptcy. Industry fulfills this condition but Irisa approaches to
this requirement as well. Current ratio in Irisa was the highest in 2005 (1.36) and in indus-
try in 2004 (2.17).
Quick ratio measures a company´s ability to pay off the claims of short-term creditors with-
out relying on the sale of its inventories. This is a valuable measure since in practice the
sale of inventories is often difficult. Quick ratio should reach at least 1. Industry reached
this values without difficulties again – it ranged from 1.03 (2005) to 1.65 (2004). Irisa ´s
best outcome was in 2006 (0.85). We can expect the slight increase in the following years.
Tomas Bata University in Zlín, Faculty of management and economics 52
Cash ratio indicates a conservative view of liquidity such as when a company has pledged
its receivables and its inventory, or the analyst suspect severe liquidity problems with in-
ventory and receivables. It should be from 0.2 to 0.5. In Irisa the values are still very low
but we can see the rapid growth (especially in 2005 and 2006) and we can predict to reach
cash ratio condition in 2 or 3 years.
Working capital compares current assets to current liabilities, and serves as the liquid re-
serve available to satisfy contingencies and uncertainties. A high working capital balance is
mandated if the entity is unable to borrow on short notice. The ratio (working capital / cur-
rent assets) indicates the short-term solvency of a business and in determining if a firm can
pay its current liabilities when due. Working capital on current assets constitutes around
20% per year in Irisa and about 40% in industry and working capital on assets reached 13%
last year that is quite near to values in industry (2006 – 16%). Figures are enclosed in
APPENDIX 5.
6.5 Profitability ratios
Profit ratios measure the efficiency with which the company uses its resources. The more
efficient the company, the greater is its profitability. It is useful to compare a company´s
profitability against that of its major competitors in its industry. Such a comparison tells
whether the company is operating more or less efficiently than its rivals. In addition, the
change in a company´s profit ratios over time tells whether its performance is improving or
declining. A number of different profit ratios can be used, and each of them measures a
different aspect of a company´s performance.
Tab.10 Profitability ratios [own]
Irisa
2002 2003 2004 2005 2006
Return on Sales -5.82% 1.33% 1.95% 1.63% 2.68% Return on Revenues -5.27% 1.19% 1.73% 1.47% 2.38% Return on Assets -6.05% 1.43% 1.99% 2.70% 4.45% Return on Equity -9.27% 2.10% 3.03% 4.73% 7.85% Return on Investment -8.05% 2.02% 2.97% 4.20% 7.25%
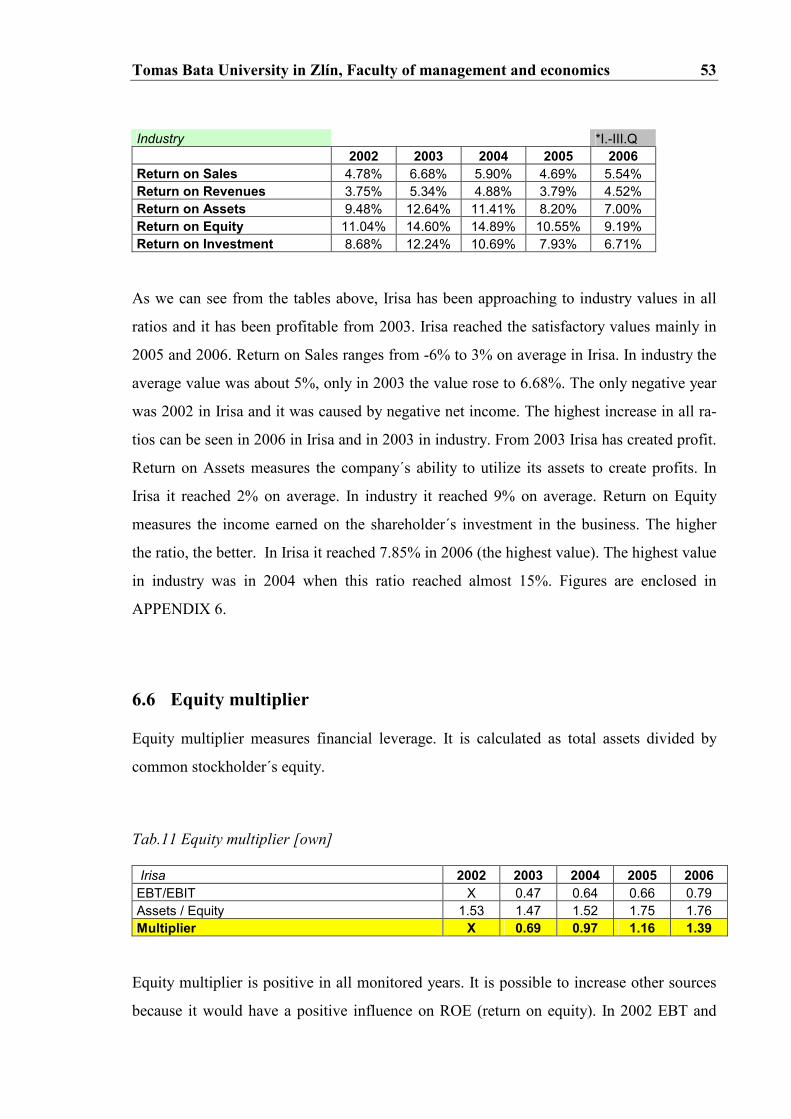
Tomas Bata University in Zlín, Faculty of management and economics 53
Industry *I.-III.Q 2002 2003 2004 2005 2006
Return on Sales 4.78% 6.68% 5.90% 4.69% 5.54% Return on Revenues 3.75% 5.34% 4.88% 3.79% 4.52% Return on Assets 9.48% 12.64% 11.41% 8.20% 7.00% Return on Equity 11.04% 14.60% 14.89% 10.55% 9.19% Return on Investment 8.68% 12.24% 10.69% 7.93% 6.71%
As we can see from the tables above, Irisa has been approaching to industry values in all
ratios and it has been profitable from 2003. Irisa reached the satisfactory values mainly in
2005 and 2006. Return on Sales ranges from -6% to 3% on average in Irisa. In industry the
average value was about 5%, only in 2003 the value rose to 6.68%. The only negative year
was 2002 in Irisa and it was caused by negative net income. The highest increase in all ra-
tios can be seen in 2006 in Irisa and in 2003 in industry. From 2003 Irisa has created profit.
Return on Assets measures the company´s ability to utilize its assets to create profits. In
Irisa it reached 2% on average. In industry it reached 9% on average. Return on Equity
measures the income earned on the shareholder´s investment in the business. The higher
the ratio, the better. In Irisa it reached 7.85% in 2006 (the highest value). The highest value
in industry was in 2004 when this ratio reached almost 15%. Figures are enclosed in
APPENDIX 6.
6.6 Equity multiplier
Equity multiplier measures financial leverage. It is calculated as total assets divided by
common stockholder´s equity.
Tab.11 Equity multiplier [own]
Irisa 2002 2003 2004 2005 2006
EBT/EBIT X 0.47 0.64 0.66 0.79 Assets / Equity 1.53 1.47 1.52 1.75 1.76 Multiplier X 0.69 0.97 1.16 1.39
Equity multiplier is positive in all monitored years. It is possible to increase other sources
because it would have a positive influence on ROE (return on equity). In 2002 EBT and
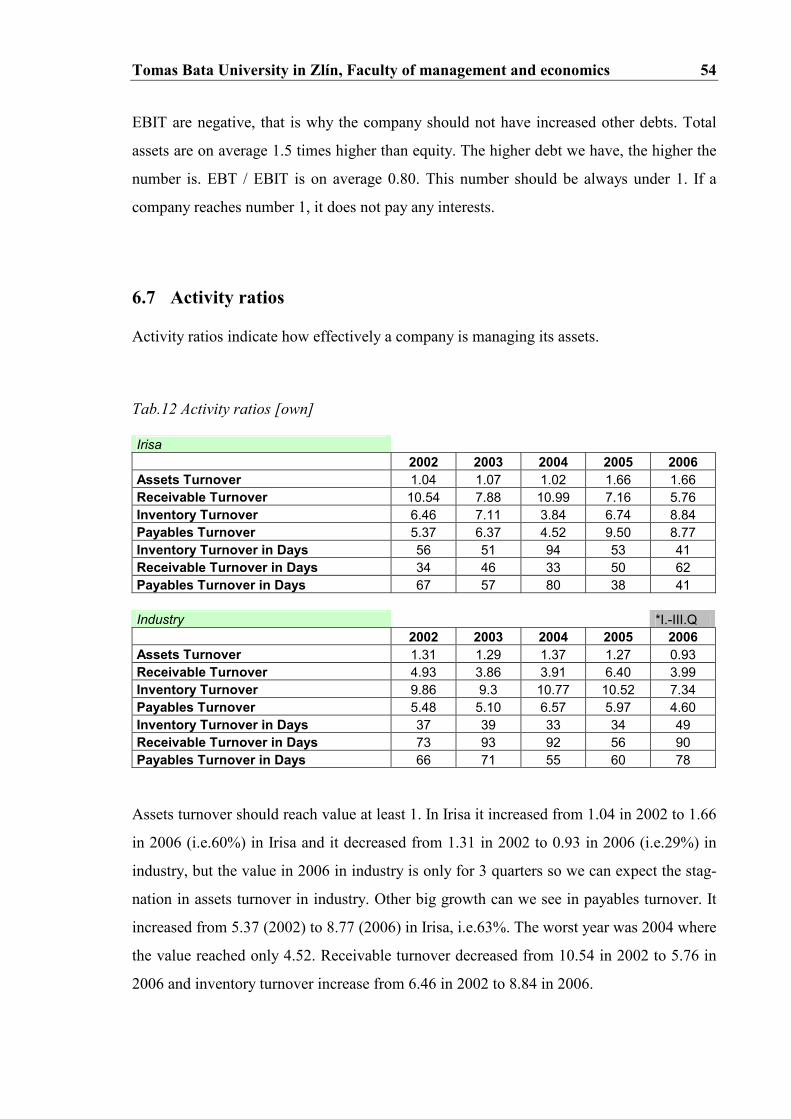
Tomas Bata University in Zlín, Faculty of management and economics 54
EBIT are negative, that is why the company should not have increased other debts. Total
assets are on average 1.5 times higher than equity. The higher debt we have, the higher the
number is. EBT / EBIT is on average 0.80. This number should be always under 1. If a
company reaches number 1, it does not pay any interests.
6.7 Activity ratios
Activity ratios indicate how effectively a company is managing its assets.
Tab.12 Activity ratios [own]
Irisa
2002 2003 2004 2005 2006
Assets Turnover 1.04 1.07 1.02 1.66 1.66 Receivable Turnover 10.54 7.88 10.99 7.16 5.76 Inventory Turnover 6.46 7.11 3.84 6.74 8.84 Payables Turnover 5.37 6.37 4.52 9.50 8.77 Inventory Turnover in Days 56 51 94 53 41 Receivable Turnover in Days 34 46 33 50 62 Payables Turnover in Days 67 57 80 38 41 Industry *I.-III.Q 2002 2003 2004 2005 2006
Assets Turnover 1.31 1.29 1.37 1.27 0.93 Receivable Turnover 4.93 3.86 3.91 6.40 3.99 Inventory Turnover 9.86 9.3 10.77 10.52 7.34 Payables Turnover 5.48 5.10 6.57 5.97 4.60 Inventory Turnover in Days 37 39 33 34 49 Receivable Turnover in Days 73 93 92 56 90 Payables Turnover in Days 66 71 55 60 78
Assets turnover should reach value at least 1. In Irisa it increased from 1.04 in 2002 to 1.66
in 2006 (i.e.60%) in Irisa and it decreased from 1.31 in 2002 to 0.93 in 2006 (i.e.29%) in
industry, but the value in 2006 in industry is only for 3 quarters so we can expect the stag-
nation in assets turnover in industry. Other big growth can we see in payables turnover. It
increased from 5.37 (2002) to 8.77 (2006) in Irisa, i.e.63%. The worst year was 2004 where
the value reached only 4.52. Receivable turnover decreased from 10.54 in 2002 to 5.76 in
2006 and inventory turnover increase from 6.46 in 2002 to 8.84 in 2006.
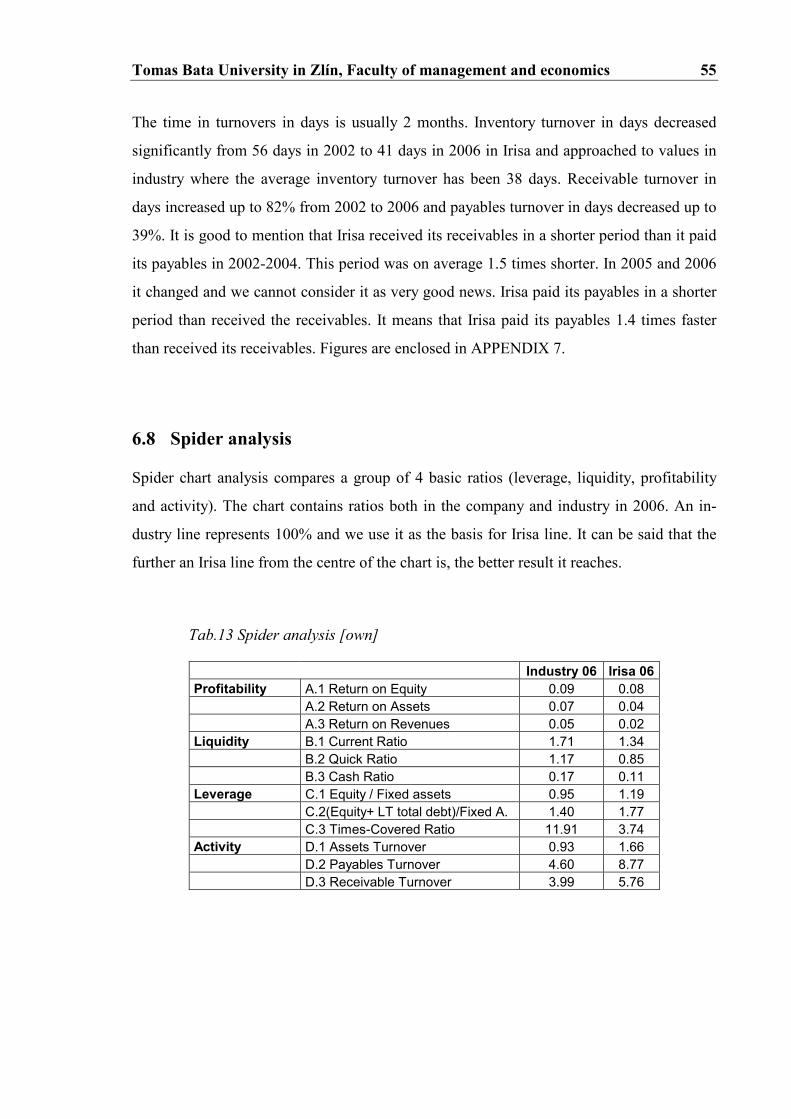
Tomas Bata University in Zlín, Faculty of management and economics 55
The time in turnovers in days is usually 2 months. Inventory turnover in days decreased
significantly from 56 days in 2002 to 41 days in 2006 in Irisa and approached to values in
industry where the average inventory turnover has been 38 days. Receivable turnover in
days increased up to 82% from 2002 to 2006 and payables turnover in days decreased up to
39%. It is good to mention that Irisa received its receivables in a shorter period than it paid
its payables in 2002-2004. This period was on average 1.5 times shorter. In 2005 and 2006
it changed and we cannot consider it as very good news. Irisa paid its payables in a shorter
period than received the receivables. It means that Irisa paid its payables 1.4 times faster
than received its receivables. Figures are enclosed in APPENDIX 7.
6.8 Spider analysis
Spider chart analysis compares a group of 4 basic ratios (leverage, liquidity, profitability
and activity). The chart contains ratios both in the company and industry in 2006. An in-
dustry line represents 100% and we use it as the basis for Irisa line. It can be said that the
further an Irisa line from the centre of the chart is, the better result it reaches.
Tab.13 Spider analysis [own]
Industry 06 Irisa 06
Profitability A.1 Return on Equity 0.09 0.08 A.2 Return on Assets 0.07 0.04 A.3 Return on Revenues 0.05 0.02 Liquidity B.1 Current Ratio 1.71 1.34 B.2 Quick Ratio 1.17 0.85 B.3 Cash Ratio 0.17 0.11 Leverage C.1 Equity / Fixed assets 0.95 1.19 C.2(Equity+ LT total debt)/Fixed A. 1.40 1.77 C.3 Times-Covered Ratio 11.91 3.74 Activity D.1 Assets Turnover 0.93 1.66 D.2 Payables Turnover 4.60 8.77 D.3 Receivable Turnover 3.99 5.76

Tomas Bata University in Zlín, Faculty of management and economics 56
Spider analysis
0
0,5
1
1,5
2
A.1
A.2
A.3
B.1
B.2
B.3
C.1
C.2
C.3
D.1
D.2
D.3
Industry 06 Irisa 06
Fig.8 Spider analysis [own]
Irisa reaches better results mainly in activity and leverage ratios. The best valuations can
we see in C.1, C.2 and D.1, D.2 and D.3 (Assets Turnover, Payables Turnover and Receiv-
able Turnover). It is evident that Irisa prefers long-term financial stability to productivity.
Irisa utilizes its indebtedness to influence positively its ROE (return on equity). On the
other hand, the worst results can we see in C.3 (Times-Cover Ratios) that reaches only 31%
from 100% in industry. Ratios of profitability have been approaching to industry results in
the past few years so we can expect further increase in the next years. Considering activity
ratios, Irisa exploits its property more effectively than companies in industry. Industry val-
ues are for 3 quarters of 2006 and it can be expected that the value is going to rise.
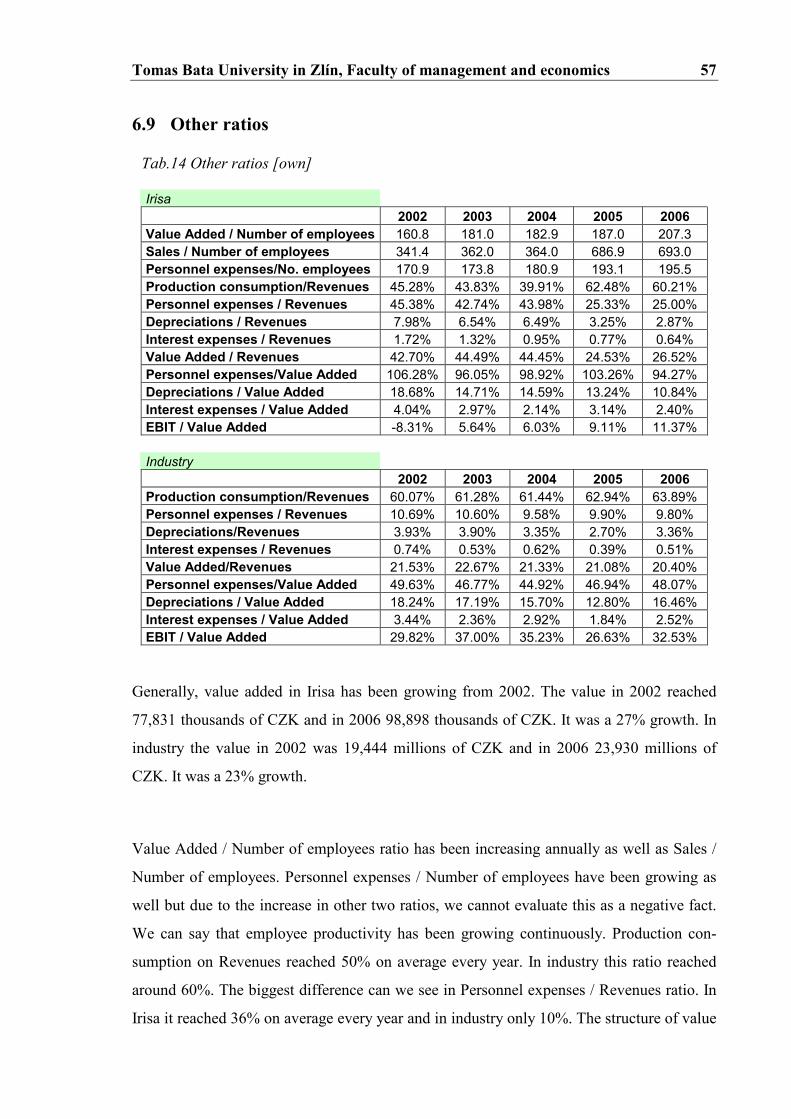
Tomas Bata University in Zlín, Faculty of management and economics 57
6.9 Other ratios
Tab.14 Other ratios [own]
Irisa
2002 2003 2004 2005 2006
Value Added / Number of employees 160.8 181.0 182.9 187.0 207.3 Sales / Number of employees 341.4 362.0 364.0 686.9 693.0 Personnel expenses/No. employees 170.9 173.8 180.9 193.1 195.5 Production consumption/Revenues 45.28% 43.83% 39.91% 62.48% 60.21% Personnel expenses / Revenues 45.38% 42.74% 43.98% 25.33% 25.00% Depreciations / Revenues 7.98% 6.54% 6.49% 3.25% 2.87% Interest expenses / Revenues 1.72% 1.32% 0.95% 0.77% 0.64% Value Added / Revenues 42.70% 44.49% 44.45% 24.53% 26.52% Personnel expenses/Value Added 106.28% 96.05% 98.92% 103.26% 94.27% Depreciations / Value Added 18.68% 14.71% 14.59% 13.24% 10.84% Interest expenses / Value Added 4.04% 2.97% 2.14% 3.14% 2.40% EBIT / Value Added -8.31% 5.64% 6.03% 9.11% 11.37%
Industry
2002 2003 2004 2005 2006
Production consumption/Revenues 60.07% 61.28% 61.44% 62.94% 63.89% Personnel expenses / Revenues 10.69% 10.60% 9.58% 9.90% 9.80% Depreciations/Revenues 3.93% 3.90% 3.35% 2.70% 3.36% Interest expenses / Revenues 0.74% 0.53% 0.62% 0.39% 0.51% Value Added/Revenues 21.53% 22.67% 21.33% 21.08% 20.40% Personnel expenses/Value Added 49.63% 46.77% 44.92% 46.94% 48.07% Depreciations / Value Added 18.24% 17.19% 15.70% 12.80% 16.46% Interest expenses / Value Added 3.44% 2.36% 2.92% 1.84% 2.52% EBIT / Value Added 29.82% 37.00% 35.23% 26.63% 32.53%
Generally, value added in Irisa has been growing from 2002. The value in 2002 reached
77,831 thousands of CZK and in 2006 98,898 thousands of CZK. It was a 27% growth. In
industry the value in 2002 was 19,444 millions of CZK and in 2006 23,930 millions of
CZK. It was a 23% growth.
Value Added / Number of employees ratio has been increasing annually as well as Sales /
Number of employees. Personnel expenses / Number of employees have been growing as
well but due to the increase in other two ratios, we cannot evaluate this as a negative fact.
We can say that employee productivity has been growing continuously. Production con-
sumption on Revenues reached 50% on average every year. In industry this ratio reached
around 60%. The biggest difference can we see in Personnel expenses / Revenues ratio. In
Irisa it reached 36% on average every year and in industry only 10%. The structure of value

Tomas Bata University in Zlín, Faculty of management and economics 58
added is quite similar to industry except Personnel expenses / Value Added ratio and EBIT
/ Value Added ratio. Irisa has almost a double-higher share of personnel expenses than in-
dustry. Depreciation / VA is similar to industry (around 15% annually). Interest expenses /
VA ratio is quite balanced (around 2.5%). The last ratio EBIT / VA is very low in Irisa
(4.7% every year). The first year 2002 was this ratio even negative due to the negative
Earnings before interests and taxes. In industry are the values around 32%.
The last five ratios should form 100%. Irisa reaches higher value due to other items that
have an influence on value added.
6.10 Additional ratios
The most known additional ratios are Altman Z-Score and Index IN01. They measure fi-
nancial health of the company and a possibility of failure in future.
1. Altman Z-Score
The Z-Score model is a quantitative model developed in 1968 by Edward Altman to predict
bankruptcy (financial distress) of a business, using a blend of the traditional financial ratios
and a statistical method known as multiple discriminant analysis.
The Z-Score is known to be about 90% accurate in forecasting business failure one year
into the future and about 80% accurate in forecasting it two years into the future.
Z-Score (values) Probability of Failure
Less than 1.8 Very high
Greater than 1.81 but less than 2.99 Not sure
Greater than 3.0 Unlikely
Tab.15 Altman Z-Score [own]
Tomas Bata University in Zlín, Faculty of management and economics 59
Irisa 2002 2003 2004 2005 2006
0,717 * Working Capital / Total Assets 0.010 0.007 0.029 0.093 0.093 0,847 * Net profit / Total Assets -0.051 0.008 0.017 0.025 0.034 3,107 * EBIT / Total Assets -0.127 0.094 0.096 0.128 0.175 0,420 * Equity / Other sources 0.791 0.898 0.801 0.557 0.550 0,998 * Revenues / Total Assets 1.145 1.203 1.149 1.836 1.868 Z-Score 1.768 2.210 2.091 2.639 2.720
Z-Score for the Czech Republic 1.733 2.137 2.060 2.635 2.701
It is visible that Irisa had great financial problems in 2002 but fortunately since 2003 it has
been improving. It can be expected that in 2 or 3 years Irisa will have reached values higher
than 3.0 and the probability of failure will be very low. Irisa should increase its liquidity to
advance ratios connected with working capital.
2. Index IN01
Index IN01 (credibility index) was created by Inka Neumaierová and Ivan Neumaier on
Czech companies conditions. It is based on mathematical and statistical models of rating
and experience of financial health of companies.
Index IN01 (values) Creation of value
Less than 0.75 Very high probability of bankruptcy
Greater than 0.75 but less than 1.77 Grey zone
Greater than 1.77 Creation of value
Tab.16 Index IN01 [own]
Irisa 2002 2003 2004 2005 2006
0,13 * Total Assets / Other sources 0.375 0.408 0.378 0.302 0.300 0,04 * EBIT / Interest expenses -0.082 0.076 0.113 0.116 0.190 3,92 * EBIT / Total Assets -0.160 0.118 0.121 0.161 0.221 0,21 * Revenues / Total Assets 0.241 0.253 0.242 0.386 0.393 0,09 * Current A/(ST payables+SH b.loans) 0.095 0.092 0.102 0.122 0.121 Index IN01 0.469 0.947 0.955 1.088 1.225
Tomas Bata University in Zlín, Faculty of management and economics 60
Index IN01 follows the progression in Z-Score. In 2002 there was a big possibility of bank-
ruptcy in Irisa but since 2003 the values have improved. Now the company occurs in a grey
zone but we can expect the further growth in the following years. The biggest problems are
caused by low liquidity.
6.11 Economic value added
Economic Value Added (EVA) is the financial measure that comes closer than any other to
capturing the true economic profit of an enterprise. EVA also is the performance measure
most directly linked to the creation of shareholder wealth over time. It can be calculated as:
EVA = Net Income – re* Equity (1)
re….cost of equity
Cost of equity is going to be calculated according to the most used method in the Czech
Republic – Build up model that is used in Ministry of industry. For further information see
www.mpo.cz.
Tab.17 Economic Value Added [own]
2002 2003 2004 2005 2006
Risk-free rate 5.10% 4.10% 4.80% 3.53% 3.78% Share - liquidity risk 4.90% 4.90% 4.92% 4.81% 4.79% Business risk 10.00% 4.34% 3.17% 0.12% 0.00% Financial stability risk 8.13% 9.47% 7.90% 0.78% 2.72% WACC 28.13% 22.81% 20.79% 9.24% 11.29% Cost of equity 32.63% 26.23% 23.35% 11.55% 14.58% (in thousands of CZK) 2002 2003 2004 2005 2006
Net income -9,615 2,201 3,199 5,096 8,873 Equity 103,731 104,884 105,510 107,714 113,014 EVA -43,466 -25,314 -21,442 -7,342 -7,609
As we can see from the table above, cost of equity has been decreasing since 2002. The
highest cost of equity, as well as WACC (weighted average cost of capital), were in 2002.
The value in risk-free rate in 2006 (3.78%) is considered only for three quarters of 2006.
Cost of equity is influenced mainly by taxes (that have been decreasing since 2002) and
interest expenses (that were 3,144,000 CZK in 2002 and 2,372,000 CZK in 2006). Cost of
equity must be always higher or equal to WACC.
Tomas Bata University in Zlín, Faculty of management and economics 61
The final Economic Value Added was negative from 2002 to 2006. It means that Irisa did
not create value for shareholders. The positive news is that the negative value has been
decreasing and we can expect the positive EVA in the near future. One of the major prob-
lems was the high business risk in 2002 but it decreased significantly to 0% in 2006. Fi-
nancial stability risk has decreased as well. In 2002 it was 8.13% and in 2006 only 2.72%.
This risk contains liquidity ratios (Current ratios) both in Irisa and industry. Share-liquidity
risk was on average around 4.864%. This risk is influenced by sum of equity and bank
loans which has been around 140,000 thousands of CZK p.a.
According to this Build-up model (Economic model), EVA was not counted from modified
accounting data. These could distort the real EVA that could be higher than results
achieved above. Appraisal based only on accounting data can be misrepresenting.
6.12 Du-Pont Decomposition Model
Du-Pont Model is an expression which breaks ROE (Return on Equity) into three parts:
� Operating efficiency (measured by profit margin),
� Asset use efficiency (measured by asset turnover),
� Financial leverage (measured by equity multiplier).
This analysis allows the analyst to understand where superior (or inferior) return is derived
from by comparison with companies in similar industries.
Tomas Bata University in Zlín, Faculty of management and economics 62
Net I / EBT 2002 1.000 2003 1.000 2004 1.000 Net Inc./Revenues 2005 1.000 2002 -0.058 2006 1.000 2003 0.013 * 2004 0.020 EBT / Revenues Net income / Equity 2005 0.016 2002 -0,058
2002 -0.093 2006 0.027 2003 0.0,13 2003 0.021 2004 0.020 2004 0.030 * 2005 0.016 2005 0.047 2006 0.027 2006 0.079
Revenues / Assets Revenue/Inventory Inventory / Assets 2002 1.04 2002 6.457 2002 0.161 2003 1.07 2003 7.113 * 2003 0.151 2004 1.02 2004 3.837 2004 0.265 2005 1.66 2005 6.736 2005 0.246 2006 1.66 2006 8.843 2006 0.188 * Assets / Equity Other source/Equity Cash ratio/St payable 2002 1.531 2002 0.531 2002 0.000057 2003 1.468 2003 0.468 * 2003 0.000017 2004 1.524 2004 0.524 2004 0.000015 2005 1.755 2005 0.755 2005 0.000082 2006 1.763 2006 0.763 2006 0.000036 * STpayab/O. source Cash ratio/Assets 2002 0.319 2002 0.0000063 2003 0.477 / 2003 0.0000026 2004 0.616 2004 0.0000031 2005 0.299 2005 0.0000011 2006 0.359 2006 0.0000055
Fig.9 Du-Pont model [own]
ROE (Return on Equity) was influenced by profit margin, assets turnover and equity multi-
plier. The biggest effect had all ratios. We can see a big increase in profit margin. This in-
crease was caused by the decline of depreciations, personnel expenses, interest expenses
and other expenses. The slow growth can we also see in assets turnover. It was positively
influenced by inventory turnover. Equity multiplier measures financial leverage. The high-
est values can we see in the last measured year 2006. The growth can we see in other
sources / equity. The growth was 43%. Profit margin (except 2002) was more or less the
same. As we can see from the model, Irisa belongs to high leverage industries. These sec-
tors rely on high leverage to generate acceptable ROE.
Tomas Bata University in Zlín, Faculty of management and economics 63
6.13 Conclusion to financial analysis
Financial analysis showed the strengths and weaknesses of Irisa, co-opt. It contains several
partial analyses that give the compact view on the financial situation of the company.
In four from five monitored year, Irisa reached profit. Only in 2002 it was in loss. Every
year we can see a slight increase by 60% on average. Profit was reached due to the produc-
tion growth. This fact influenced the profitability ratios a lot. It is visible that the profitabil-
ity of equity or other sources is higher than interest revenues provided by bank. 60% of
employees in Irisa are handicapped people. It does not pay any taxes due to financial sup-
port and grants from state. Cash flow analysis showed the big inflows into investment ac-
tivities.
Concerning solvency / leverage ratios, Irisa reached adequate indebtedness that was firstly
at 10% lower than in industry (from 2002 to 2004) but then (in 2005 and 2006) it accom-
plished industry values. This improvement positively influenced Times-Covered Ratio
(mainly in 2006). Irisa does not have problems in profit creation for potential bank loans
interests covering.
The biggest problem can be seen in liquidity ratios that measure firm´s ability to meet
short-term obligations. All ratios reached very low values both in Irisa and industry during
the monitored years. We must positively appreciate that the low values have been improv-
ing during the monitored years (They all have been approaching to the recommended val-
ues of Commerce Department). Nevertheless, low liquidity influenced low values of work-
ing capital (mainly in 2002-2004) and ratios connected with working capital and it can en-
danger financial stability of the company. Irisa should beware of cash flows by way of
short-term payment schedules.
The profitability analysis showed satisfactory level in all profitability ratios in Irisa during
the past 5 years. The best values were reached mainly in 2005 and 2006. The only low val-
ues can we see in Return to Equity. Equity multiplier is related to ROE (return on equity).
Tomas Bata University in Zlín, Faculty of management and economics 64
It has been positive since 2002. Total assets in Irisa are on average 1.5 times higher than
equity.
Irisa managed its assets effectively according to activity ratios only in the past 2 years. All
ratios have been improving a bit from 2002 but the biggest improvement has been visible
from 2005. Turnovers (inventory, receivable, payables) in days have decreased to satisfac-
tory values similar in industry.
Other ratios focused mainly on employee productivity and value added structure. We can
say that according to the growing values, employee productivity has been growing continu-
ously. The only bigger difference is in personnel expenses / VA ratio where Irisa reached
double higher values than in industry. It should try to lower personnel expenses to future.
Additional ratios analysis focused on financial health of the company and prediction of
possible bankruptcy in future. Z-Score and Index IN01 confirmed that Irisa had some fi-
nancial problems in 2002 but since that time it has been improving. We can say that Irisa´s
probability of failure is very low now.
A modern tool of performance measurement presents EVA (economic value added). Ac-
cording to the Build-up model that works with possible risks (risk-free rate, liquidity risk,
business risk, financial stability risk and financial structure risk) we can see that EVA have
been growing since 2002 but it has not reached positive values. It means that it did not cre-
ate values for shareholders. One of the major problems was the high share-liquidity risk.
On the other hand, EVA was counted only from accounting data that could misrepresent
the real value of EVA that could be higher.
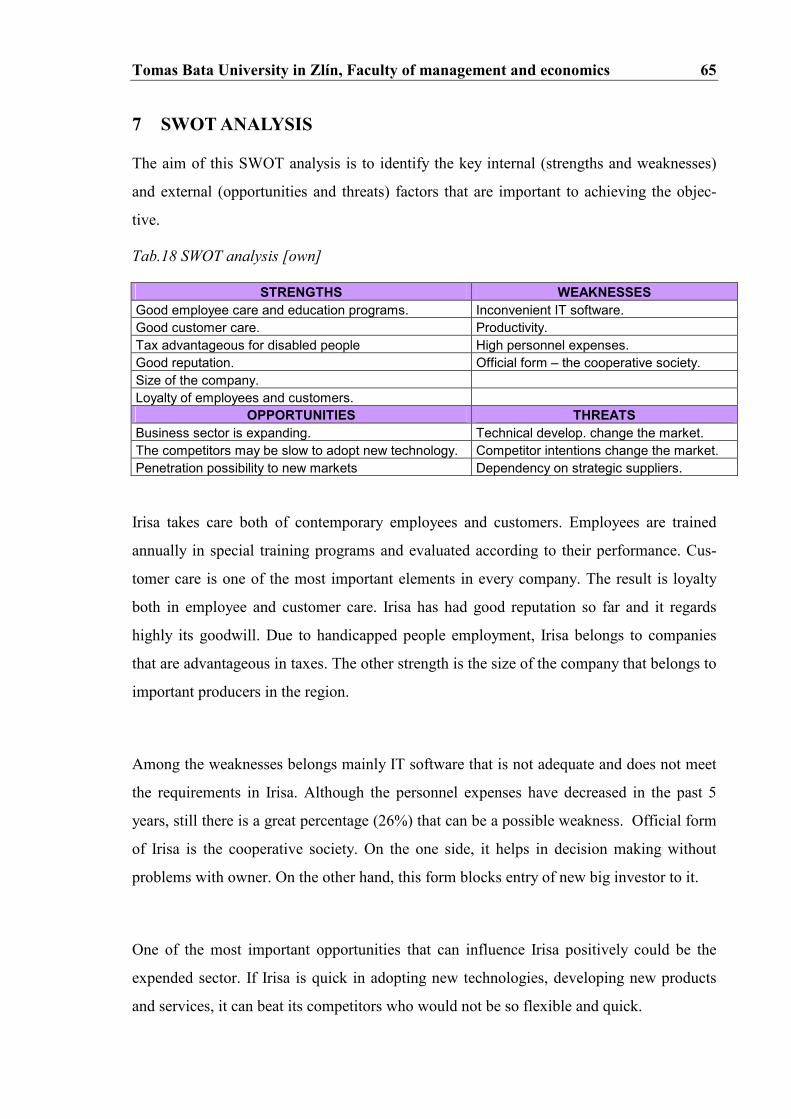
Tomas Bata University in Zlín, Faculty of management and economics 65
7 SWOT ANALYSIS
The aim of this SWOT analysis is to identify the key internal (strengths and weaknesses)
and external (opportunities and threats) factors that are important to achieving the objec-
tive.
Tab.18 SWOT analysis [own]
STRENGTHS WEAKNESSES
Good employee care and education programs. Inconvenient IT software. Good customer care. Productivity. Tax advantageous for disabled people High personnel expenses. Good reputation. Official form – the cooperative society. Size of the company. Loyalty of employees and customers.
OPPORTUNITIES THREATS
Business sector is expanding. Technical develop. change the market. The competitors may be slow to adopt new technology. Competitor intentions change the market. Penetration possibility to new markets Dependency on strategic suppliers.
Irisa takes care both of contemporary employees and customers. Employees are trained
annually in special training programs and evaluated according to their performance. Cus-
tomer care is one of the most important elements in every company. The result is loyalty
both in employee and customer care. Irisa has had good reputation so far and it regards
highly its goodwill. Due to handicapped people employment, Irisa belongs to companies
that are advantageous in taxes. The other strength is the size of the company that belongs to
important producers in the region.
Among the weaknesses belongs mainly IT software that is not adequate and does not meet
the requirements in Irisa. Although the personnel expenses have decreased in the past 5
years, still there is a great percentage (26%) that can be a possible weakness. Official form
of Irisa is the cooperative society. On the one side, it helps in decision making without
problems with owner. On the other hand, this form blocks entry of new big investor to it.
One of the most important opportunities that can influence Irisa positively could be the
expended sector. If Irisa is quick in adopting new technologies, developing new products
and services, it can beat its competitors who would not be so flexible and quick.

Tomas Bata University in Zlín, Faculty of management and economics 66
In connection with technological development, the market could be changed and there
would not be the need of contemporary products. Irisa should react quickly to this possible
threat. Other important threat could be dependency on one strategic supplier.

Tomas Bata University in Zlín, Faculty of management and economics 67
8 SOLUTIONS FOR BSC APPROACH UTILIZATION
The main aim of the Balanced Scorecard approach is the increase of performance in Irisa.
BSC helps to clarify and facilitates to realize strategies in a company. It combines tradi-
tional financial measures with non-financial measures and provides managers with richer
and more relevant information about the activities they are managing, increasing the likeli-
hood of organizational objectives being achieved.
After the PEST analysis, Five Forces Model, financial analysis and summary SWOT analy-
sis there are several proposals and solutions for the Balanced Scorecard utilization in Irisa.
According to these results is formed strategy that is defined in these following points.
Firstly, Irisa has constantly faced up to one big problem with the major buyer (see the Por-
ter Five Forces Model). Irisa’s main customer – Sidler GmbH – created almost 80% of
Irisa’s revenues. Sidler has been in insolvency proceedings from March 2007. Although it
is expected that all payments will have been paid till the end of the year 2007, Irisa should
try to reconstruct its buyers’ structure. It is not favourable to have only one major buyer
that, in case of financial problems, can influence the whole company. The suggestion for
resolution can be, apart from others, also the Balanced Scorecard approach.
Secondly, BSC approach can help in developing customer relationships that retain the loy-
alty of existing customers and enable new customers segments and market areas to be
served effectively and efficiently.
Thirdly, it can mobilize employee skills and motivation for continuous improvements in
process capabilities, quality and response times.
Finally, it tries to introduce innovative products and services desired by targeted customer
segments and produce customized high-quality products and services at low cost and with
short lead times.
Tomas Bata University in Zlín, Faculty of management and economics 68
9 BALANCED SCORECARD IMPLEMENTATION
The Balanced Scorecard concept tries to help managers to achieve desired results. More-
over, it helps to increase firm’s performance. To construct and implement a Balanced
Scorecard, managers should:
� Create organization presumptions for the implementation.
� Articulate the business’ s vision and strategy.
� Make the actual BSC model.
� Cascade the scorecard – roll-out process
� Make the scorecard useful.
9.1 Constitution of organization presumptions for the implementation
Implementing a strategy begins by educating and involving the people who must execute it
and constitution of a team of competent people who will implement the BSC successfully.
The team will be formed by management executives who are familiar with a company´s
strategy and are able to implement it through central command and control. The BSC per-
mits a top-to-bottom alignment. To gain maximum benefit, the executive team should
share the vision and strategy with the whole organization. By communicating the strategy
and by linking it to personal goals, the scorecard creates a shared understanding and com-
mitment among all organizational participants.
Four Balanced Scorecards are going to be implemented in Irisa – successively in every di-
vision. The first BSC to be implemented is going to be in Injection moulding program divi-
sion (Division 2) because its share is the biggest on the total turnover of Irisa (around
60%). Moreover, it will be implemented there due to big difference in production in other
three divisions of Irisa. After the successful implementation in this division, the following
balanced scorecards are going to be implemented in other three divisions.

Tomas Bata University in Zlín, Faculty of management and economics 69
Every team in each division will be created from the general director of Irisa and the execu-
tive managers in each division. The team will have 5 to 7 people who will be responsible
for the successful implementation. Every month is going to be hold a meeting to ensure
regular observation of objective competition.
Before the BSC implementation in Division 2 (Injection moulding program division), the
executive team will create the preliminary report that contains:
� Strategy, organization and culture presumption control,
� Assignment of priorities,
� Clarification of resources and project range,
� Project cost calculation and
� Risk estimations. [3]
9.2 Clarifying of strategies
The main strategies in Division 2 are:
� To get new customers not only from automotive industry. Electro-technical and
consumer goods industries are perspective for future. The main aim is to create the
relationship among Irisa and producers in this field and offer the services and goods
to them. Hereafter, Division 2 will look for new customers by WLW Internet sup-
plier search engine for the business-to-business sector and will participate on spe-
cialized fairs.
� To lower the % share of Sidler (the major customer that creates 80% of share).
� To redevelop the vacuum shaped goods production, mainly for automated electro-
technical producers.
� To increase total sales.
� To get ready for e-communication with customers.

Tomas Bata University in Zlín, Faculty of management and economics 70
9.3 Strategy objectives and a strategy map
A strategy map creation follows after clarifying of strategies and objectives clarification. It
will enable to discuss relationships between constituent parts of a strategy map. It is a dia-
gram that describes how an organization creates value by connecting strategic objectives in
explicit cause-and-effect relationship with each other in the four BSC objectives. Strategy
maps are a strategic part of the Balanced Scorecard framework to describe strategies for
value creation.
Fig.10 A strategy map in Division 2 in Irisa [own]
Tomas Bata University in Zlín, Faculty of management and economics 71
Value maximization for shareholders can be influenced by three financial objectives:
� Turnover increase,
� Cost savings maximization,
� Assets utilization increase.
Turnover can be increased by
� attracting of new customers,
� increasing sales from new products, and
� customer satisfaction.
Furthermore, turnover increase influences growth of assets utilization.
New customers can appreciate the new products in the company. This leads to customer
satisfaction. To launch new products and reach increasing sales, it is necessary to improve
technology innovations, both technologic equipment and new technologies implementa-
tion. This implementation needs a qualified staff and in consequence there will be a need of
special trainings for employees. To satisfy customers (both new and current), it is necessary
to be focused on customer management. One of important tools how to better the contem-
porary communication with customers is to prepare for e-communication.
Turnover can be increased also by new products launching that is influenced mainly by
production process innovations. These have also an impact on productivity increase. More-
over, it will be necessary to improve motivation of employees.
Cost savings maximization can be influenced by
� productivity increase.
Productivity increase is closely influenced by staff turnover decrease. Motivation of em-
ployees can rise due to growth of wages and annual remunerations.

Tomas Bata University in Zlín, Faculty of management and economics 72
9.4 Measures and targets
Firstly, it is necessary to set up objectives (about 4 per perspective), measures, current con-
dition and possible targets into future in Division 2. The future target data are going to be
monitored for years 2010, 2011 and 2012.
9.4.1 Financial perspective
Tab.19 Financial perspective in Division 2 [own]
Objectives Measures Current Targets
condition 2010 2011 2012
Value maximization EVA -7,609 2,000 5,000 7,000 for shareholders (in thousands of CZK) Turnover increase Sales 260 350 450 600 (in millions of CZK) Cost savings Costs decrease 5% 6% 7% 8% maximization % p.a. Assets utilization Inventory turnover in days 41 40 39 38 increase Payables turnover in days 41 36 33 29
Financial objectives represent the long-term goal of the organization. For Division 2, the
financial themes of increasing value for shareholders, turnover increase, cost savings maxi-
mization and enhancing asset utilization can provide the necessary linkages across all four
scorecard perspectives.
The major financial objective is to maximize the value for shareholders. This objective is
superior to other objectives and it is influenced both directly and indirectly by other objec-
tives in all perspectives. The measurement of this objective is executed by Economic Value
Added (EVA) according to Economic Model. Since 2002 EVA has been rising signifi-
cantly in Irisa but still it has reached negative values. EVA reached values around - 43,000
thousands of CZK in 2002 and - 7,000 thousands of CZK in 2006. The main aim of Irisa is
to reach a positive value till the end of 2012, at least 7,000,000 CZK. The way how to in-
crease EVA is in cost of equity decrease. Cost of equity is influenced by WACC (weighted
average cost of capital) that have been falling since 2002 (from 28% in 2002 to 11% in
2006). WACC are influenced mainly by financial stability risk that can be decreased due to

Tomas Bata University in Zlín, Faculty of management and economics 73
current ratio increase in Irisa. Based on the progress of the last 5 years, we can predict this
target to be fulfilled.
Second objective that can influence Division 2 significantly is turnover increase measured
by sales. Production rose from 80 (2002) to 260 (2006) millions of CZK. The target for
2012 is to reach 600 millions of CZK of the total revenues.
Other important objective is maximization of unit cost savings measured by cost decrease.
Total expenses in Division 2 rose significantly from 2005 to 2006. The target is to lower
these expenses at least by 5% every year. For the time being, 5% is the maximal value due
to expected wage increase. Costs can be decreased by lowering of production consumption
(formed by consumption of material and energy and services). This will contribute to
higher profitability and return-on-investment ratios. Moulding injection plant should also
try to decrease indirect costs, such as electrical energy consumption. Cost decrease can be
fulfilled by high working productivity, as well.
Assets utilization increase measured mainly by Inventory and Payables turnover in days is
another objective of Division 2´s financial perspective. Inventory turnover in days de-
creased from 56 days in 2002 to 41 days in 2006 and the target for 2012 is to decline this
ratio to 38 days. Division 2 should try to decrease inventories from current 19% on total
assets to at least 15% in 2012 (also considering the growth of sales). Payables turnover
reached 67 days in 2002 and 41 days in 2006. With this almost 39% decrease (from 2002 to
2006) can we predict that in 2012 this ratio can achieve the value desired, i.e.29 days. Divi-
sion 2 should focus on short-term payables that should be decreased by at least 3% (from
current 15% of total liabilities - 2006) by the end of 2012.

Tomas Bata University in Zlín, Faculty of management and economics 74
9.4.2 Customer perspective
Tab.20 Customer perspective in Division 2 [own]
Objectives Measures Current Targets
condition 2010 2011 2012
Attract new Number of new customer p.a. 3 4 7 8 customers Sales from new customers 5,000 40,000 140,000 280,000 (in thousands of CZK) Increase sales Number of new products p.a. 3 250 270 300 from new products Sales from new products % 3-10% 12% 17% 20% Quick supplier Time of customer satisfaction 6 5.5 5 4 response (product delivery) in weeks Customer Value for money ( 0-10 scale) 7 8 9 10 satisfaction (0…the worst, 10 the best) Incidents of defects 3% 2.5% 2% 1.5 %
One of the most important objectives in customer perspective is to attract new customers.
This objective is measured by a number of new customers per year. Every year there have
entered 2 to 3 new customers on average to Division 2 (to these customers are counted only
those ones who created turnover higher than 500,000 CZK), so far. This division would
like to increase this share of new customers to at least 8 new customers per year. This
would enable a better price influence and policy from side of Division 2 and would prevent
and protect it against unexpected situations from customer side (e.g. The problem of Sidler
GmbH that have been in insolvency proceedings since March 2007 and still it threatens
that the big amount of money will not have been paid till the end of 2007.)
Another important measure that can influence attracting the new customers is sales from
new customers. On average, three new customers have reached 5,000 thousands of CZK of
sales. According to the planned increase of new customers every year and the total increase
in sales, the value of sales from new customers should grow to 280,000 thousands of CZK
in 2012.
Second objective in customer perspective is increasing sales from new products. Contem-
porary number of new products ranges around 3 new products per year. But in 2007 and
2008, there is going to be a great increase due to cooperation with a company Witte. It is
expected to produce around 240 new products already in 2007 and 2008. For the future,

Tomas Bata University in Zlín, Faculty of management and economics 75
Division 2 plans to produce around 275 new products p.a. on average. Sales from new
products have ranged from 3 to 10% on average. The plan for 2012 is to reach 20% annual
growth in sales from new products.
Time and speed of customer´s satisfaction belong to quick supplier response. An average
product delivery to customers lasts 6 weeks (except some unexpected exceptions). It is not
possible to lower this delivery less than 4 weeks due to the production process and other
services connected with production. Nevertheless, Irisa would like to decrease this delivery
time up to 4 weeks till 2012.
Customer satisfaction can be measured by Value for money index. Its scale – 0 to 10 - ex-
plains how much customers are satisfied with the value of product and with its price. 0
represents the worst value for money, 10 the contrary. Even price-sensitive customers,
however, may favor suppliers that offer not low prices, but low costs to acquire and use the
product or service of a good quality. Division 2 has reached the very good value for money
according to customers so far. Its aim for future is to increase this index at least to 9-10 – to
offer an excellent value for money spent on products.
Another important measure of customer satisfaction, that is Division 2 aware of, is the
quality of the product measured by incidence of defects. This measure has ranged from 2%
to 3% per year so far but this division tries to lower this share (less than 2%) p.a. In spite of
these incidents, the products still have a high-quality image. Reliability and long-term func-
tion of product are the most desired characteristics of products nowadays, not only in Irisa.
Moreover, it is necessary to focus on consistent, continuous and successive checks of im-
portant points of production lines to eliminate product defects.

Tomas Bata University in Zlín, Faculty of management and economics 76
9.4.3 Internal processes perspective
Tab.21 Internal processes perspective in Division 2 [own]
Objectives Measures Current Targets
condition 2010 2011 2012
Technology Quality improvement 6,000 - 7,000 8,000 9,000 10,000 innovations investment in thousands of CZK p.a. p.a. p.a. p.a. Productivity Production capacity utilization 75% 77.5% 80% 85% increase % Personnel productivity 452 500 550 600 (Value Added / employee) Production Number of new implemented 2 3 4 5 process innovations technologies (per year) Customer Internal cooperation level 15% 20% 30% 50% management among firm´s departments %
In Division 2 technology equipment has been on a satisfactory level so far due to perma-
nent innovations of technological fittings. However, it is still necessary to invest money
into technology equipment, mainly to double component injection services, cascade injec-
tion of surface mouldings etc. Regarding to price pressures and increasing granulate prices,
it is important to equip every compress machine with immediate recycling system of bis-
cuits. Quality improvement investment has ranged from 6 to 7 millions of CZK every year
up today and to future it is planned to increase this rate up to 10 millions of CZK p.a. Some
other technology equipment plans for the following years include: enlargement of the pro-
duction area in injection moulding services, enforce the crane track in pressing plant,
economize and recycle material, better use of manipulators, etc. Moreover, it is planned to
invest money into software and hardware equipment.
Division 2 owns unused production capacities that create extra services costs. Production
capacity utilization forms 75% of total capacity (continuous operating from Sunday – 10pm
to Friday 10 pm). Reserve is in continuous proceedings, including Saturdays and Sundays.
The utilization is greatly dependent on the product range because not every injection form
is compatible with every pressing machine. Nevertheless, it is expected that Division 2 will
increase the total capacity by 10% into 85% due to renewal of some specialized production
programs. Otherwise, this dead space would have to be sold.
Tomas Bata University in Zlín, Faculty of management and economics 77
Personnel productivity is another measure that can increase productivity in Division 2. It is
measured as: Value Added / number of employees. Number of employees in Division 2
rose from 198 in 2002 to 219 in 2006. The biggest value was in 2005 (234 employees). As
we can see, in 2006 this personnel productivity reached value 452 but to the future it is
planned to reach 600 due to value added increase.
New technology implementation process includes 2 new implemented technologies per
year on average. These technologies are usually very expensive, e.g. by two-component
injection production it is mainly an investment into metal plating (approximately 15 mil.of
CZK per production line). Division 2 would like to higher this number into 5 new tech-
nologies p.a. It will be necessary to invest into specialized technologies, such as renewal of
vacuum steaming machinery and tampoo-printing. It will be important to think of new
closed systems protecting work environment. In connection with environment, Division 2
plans to cancel technologies of steaming machinery purification with lixivium and it tries
to verify other machinery not dependent on chemical materials.
The fourth important objective in internal processes perspective is customer management.
This can be measured by employee questionnaires among company´s departments. These
questionnaires represent the level of internal cooperation (customer orientation) among 4
divisions in Irisa. The internal communication in Division 2 reaches approximately 95%
but the contemporary level of intra-divisional communication varies only from 10-15% and
Division 2 would like to higher this share at least to 30%. To secure the highest response
rate of questionnaires, every department (with response rate higher than 85%) will get re-
muneration per employee.
Tomas Bata University in Zlín, Faculty of management and economics 78
9.4.4 Learning and growth perspective
Tab.22 Learning and growth perspective in Division 2 [own]
Objectives Measures Current Targets
condition 2010 2011 2012
Special trainings Number of trainings per year 3 4 5 6 for employees Number of trained employees 20 50 80 100 Staff turnover Number of leaving employees/ 10% 9% 8% 7% decrease Number of total employees % Motivation % of remuneration from 15% 17.5% 20% 25% increase wage Wages increase 3% 3.5% 4% 4.5%
E-communication Number of incoming orders 30 50 60 70 readiness through Internet per day
Number of trainings for employees in Division 2 varies from 2-3 every year on average.
Every employee takes part in these trainings according to actual work contracts. The num-
ber of trainings should increase both for employees and workers to 6 in 2012 to get quali-
fied staff. From approximately 200 workers, only 20 of them participate on specialized
trainings, usually not in Irisa but in companies where they learn how to work on some spe-
cial machinery. The number of trained employees should rise at least to the half of total
workers in Division 2 in 2012. Every year there should be some examination to secure the
employee development. Up to now, there has been an emphasis on quality trainings (ISO
9001, 14 001, TS 16 949). But Irisa is aware of focusing on other spheres – e.g. technology,
marketing, human resources, communication, IT etc.
Another objective is the reduction of staff turnover. The higher rate it is, the worse. Divi-
sion 2´s current condition is moving around 10% but it would like to lower into 7% p.a. in
2012. Employee departing or leaving shows a failure of long-term going business. A com-
pany that puts a lot of money into employee education, trainings and responsibility should
try to keep this employee and create such conditions where the employee likes to work and
can be motivated into professional growth.
Employees should be implied into firm´s financial results. They have been motivated by
the percentage of remuneration from wage that has been around 15% p.a. If they work well,
they receive higher remunerations. If not, the contrary happens. Only 5 chief executives
Tomas Bata University in Zlín, Faculty of management and economics 79
receive remunerations according to profit / loss of current accounting period. The percent-
age of remuneration should increase to 20-25% in 2012 to motivate employees and in-
crease their responsibility.
Another measure that influences employee motivation is wages increase. Wages have in-
creased by 3% per annum so far but the management is aware of the necessity of employee
motivation and satisfaction in Division 2. The target in 2012 is to increase wages up to 4-
5% per annum according to the firm´s performance.
For Division 2, a very important objective is the readiness for electronic communication. It
has been using so-called EDI communication (two IT systems communicate together di-
rectly) for 2 years. This system speeds up the communication among companies and re-
duces error rate by data write-over-mode. Division 2 utilizes this system with the biggest
customers (Sidler, Witte, Visteon) and the number of incoming orders is about 30 per day
on average. For future, this division would like to increase this number into 70 per day and
also to broaden this system from Irisa´s side towards suppliers. The other important aim
can be a web presentation.

Tomas Bata University in Zlín, Faculty of management and economics 80
The following table shows the Balanced Scorecard proposed for Division 2 in Irisa, co-opt.
Tab.23 The Balanced Scorecard in Division 2 in Irisa [own]
Objectives Measures Current Targets
condition 2010 2011 2012
Value maximization EVA -7,609 2,000 5,000 7,000 for shareholders (in thousands of CZK) Turnover increase Sales 260 350 450 600 (in millions of CZK) Cost savings Costs decrease 5% 6% 7% 8% maximization % p.a. Assets utilization Inventory turnover in days 41 40 39 38 increase Payables turnover in days 41 36 33 29
Objectives Measures Current Targets
condition 2010 2011 2012
Attract new Number of new customer p.a. 3 4 5 6 customers Sales from new customers 5,000 40,000 140,000 280,000 (in thousands of CZK) Increase sales Number of new products p.a. 3 250 270 300 from new products Sales from new products % 3-10% 12% 17% 20% Quick supplier Time of customer satisfaction 6 5.5 5 4 response (product delivery) in weeks Customer Value for money ( 0-10 scale) 7 8 9 10 satisfaction (0…the worst, 10 the best) Incidents of defects 3% 2.5% 2% 1.5 %
Objectives Measures Current Targets
condition 2010 2011 2012
Technology Quality improvement 6,000 - 7,000 8,000 9,000 10,000 innovations investment in thousands of CZK p.a. p.a. p.a. p.a. Productivity Production capacity utilization 75% 77.5% 80% 85% increase % Personnel productivity 452 500 550 600 (Value Added / employee) Production Number of new implemented 2 3 4 5 process innovations technologies (per year) Customer Internal cooperation level 15% 20% 25% 30% management among firm´s departments %
Objectives Measures Current Targets
condition 2010 2011 2012
Special trainings Number of trainings per year 3 4 5 6 for employees Number of trained employees 20 50 80 100 Staff turnover Number of leaving employees/ 10% 9% 8% 7% decrease Number of total employees % Motivation % of remuneration from 15% 17.5% 20% 25% increase wage Wages increase 3% 3.5% 4% 4.5% E-communication Number of incoming orders 30 50 60 70 readiness through Internet per day

Tomas Bata University in Zlín, Faculty of management and economics 81
9.5 The Roll-out Process
Firstly, it is important to identify the roll-out structure. Factual completion in Irisa will util-
ize vertical interconnection (i.e. top – down connection). By vertical alignment, it is neces-
sary to make sure that all downstream units are moving in the same direction. Firstly, the
Roll-out Process will be launched in Division 2 (Moulding injection plant). In Irisa overall,
it can be hard to predefine and align all the objectives and measurements of the diverse
units because their strategy worlds are not always transparent from the corporate level.
Viewpoints must be discussed, compared, and synchronized with the strategic perspectives
of other units, and strategy contents (based on strategy maps) must be coordinated before
balanced scorecards can be derived and strategic action programs can be conducted in the
various organizational units.
In the cascading process, management teams adapt strategic objectives from the corporate
strategy map. Not every corporate objective may be relevant to every other organizational
unit, and specific strategic priorities in downstream units may lead to additional strategic
objectives in their strategy maps that are not directly derived from the top-level map.
In the Roll-out Process, there are many available methods according to specific circum-
stances and conditions. The most suitable method for Division 2 is the Consequential de-
duction of objectives. It assumes that individual objectives are created only to particular
topics that “can extend”. The objectives (with the help of BSC techniques and questioning)
are specified and transferred to perspectives.
As we can see from the figure below, single departments in the Division 2 of Irisa are in-
volved mainly to Learning and growth and Internal processes objectives. They participate
in these objectives by 35% and 40% share according to managers´ estimation.
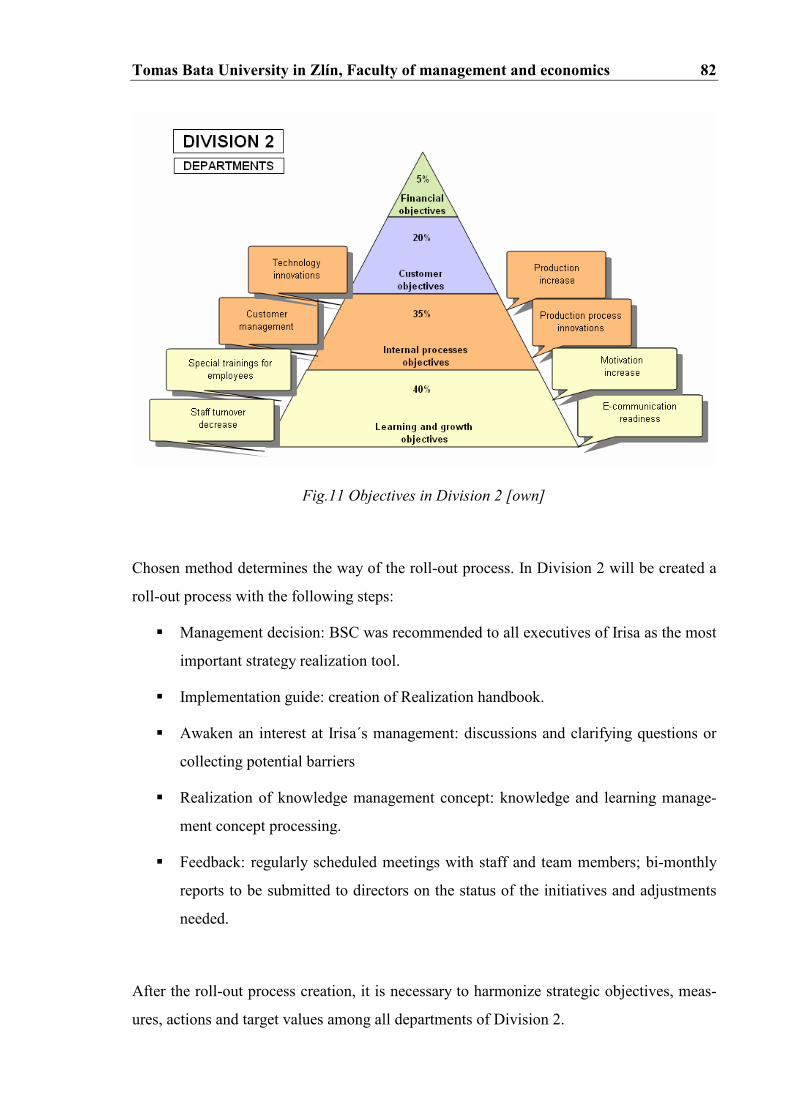
Tomas Bata University in Zlín, Faculty of management and economics 82
Fig.11 Objectives in Division 2 [own]
Chosen method determines the way of the roll-out process. In Division 2 will be created a
roll-out process with the following steps:
� Management decision: BSC was recommended to all executives of Irisa as the most
important strategy realization tool.
� Implementation guide: creation of Realization handbook.
� Awaken an interest at Irisa´s management: discussions and clarifying questions or
collecting potential barriers
� Realization of knowledge management concept: knowledge and learning manage-
ment concept processing.
� Feedback: regularly scheduled meetings with staff and team members; bi-monthly
reports to be submitted to directors on the status of the initiatives and adjustments
needed.
After the roll-out process creation, it is necessary to harmonize strategic objectives, meas-
ures, actions and target values among all departments of Division 2.

Tomas Bata University in Zlín, Faculty of management and economics 83
Fig.12 Influence of each department on objectives [own]
The figure above shows influences of each department in Division 2 and its parts on the
company´s BSC objectives in four perspectives. Each of four major departments is in
charge of all objectives. Single parts of departments do not participate on every BSC objec-
tive; they focus only on separate partial missions that finally influence the whole structure
of Balanced Scorecard strategy map.
Tomas Bata University in Zlín, Faculty of management and economics 84
9.6 BSC integration into management system
Once a scorecard has been designed and introduced in Irisa, it is necessary to tie it into
other programs of company (controlling, budgeting and planning, reporting, etc.). Without
such connections, the effort devoted to developing a Balanced Scorecard may not deliver
tangible benefits.
After the Balanced Scorecard implementation, controlling department will be responsible
for relevant data affording into each perspective of the BSC. Moreover, it will be in charge
of permanent and continuous monitoring of strategic objectives and if they are achieved
correctly. In case of negative deflections appearance, controlling department will create
strategic plans to remove these deflections.
Planning department will connect strategic objectives, long-term intentions and budgets
with short-term objectives and plans. After this change, financial and non-financial ratios
will directly influence operating planning that will enable to intensify the focus on strategic
objectives. If the strategy formulation and strategic issues update has been done well, the
budgeting process should simply involve translating the first year of a multiyear (3-5 years)
plan into an operational budget.
Another important step is to get employees to use the scorecard as a routine matter – mak-
ing it part of the culture. In Division 2, a Balanced Scorecard will be first installed at the
top, where commitment is most vital to success. It is then cascaded throughout the organi-
zation, to focus departments´ goals with the overall company goals. It will be necessary to
accept each objective by employees to increase personal involvement. It will be important
to create such a system that will be understood by all employees that will take over its ob-
jectives as their own. To spread strategic awareness among employees, the company should
develop a multi-pronged communications program. It covers the BSC extensively in the
monthly company newsletter, presenting the BSC as a new way of working and thinking –
not just another initiative.

Tomas Bata University in Zlín, Faculty of management and economics 85
Reporting will be in charge of information providing that will be gathered in electronic
form and will be available for all employees.
Another essential feature is going to be a link to personal objectives and rewards. Clearly,
incentive compensation motivates performance. However, in the early implementation,
Irisa should use the BSC to stimulate SBU strategy formulation and review but not shift its
formal incentive compensation to scorecard measures. After a year of experience with the
scorecard, Irisa can start to link executive incentive compensation to the BSC.
The last but not least is to focus on feedback and strategic learning. This process links
monthly operational reviews – where managers compare short-term performance with tar-
gets established in the annual budget – and quarterly strategic reviews that examine longer-
term trends in scorecard measures to assess whether and how well the strategy is working.
Balanced Scorecard software
Balanced Scorecard software can make it easier to follow up and manage the business. It
will allow to build a business model and to create the metrics and reporting needed to boost
a company´s performance. Software requirements are specific to every company and every
project but the main requirements are: user comfort, line connection ability, documenta-
tion, simulations by changes, strategic feedback, etc. The most common software tools
supporting BSC are: Gentia Software, Cockpit communicator, Dialog strategy BSC, Ar-
cplan – in-Sight, QPR-QPR Scorecard.
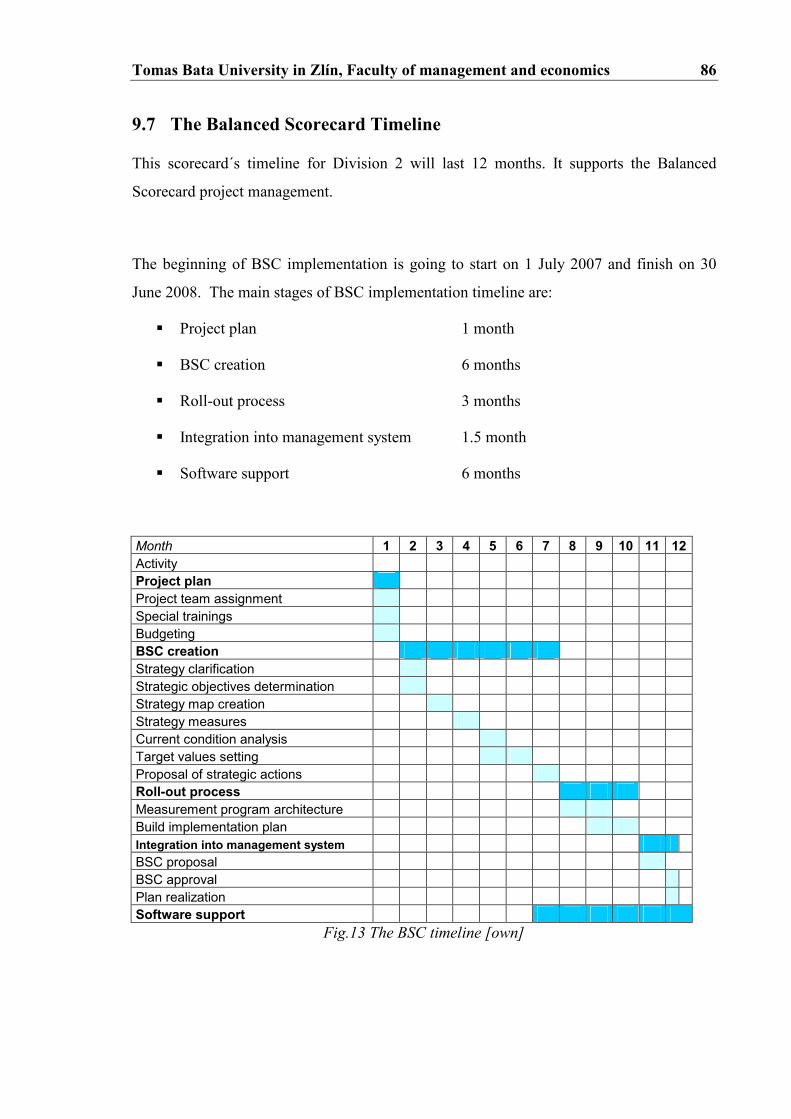
Tomas Bata University in Zlín, Faculty of management and economics 86
9.7 The Balanced Scorecard Timeline
This scorecard´s timeline for Division 2 will last 12 months. It supports the Balanced
Scorecard project management.
The beginning of BSC implementation is going to start on 1 July 2007 and finish on 30
June 2008. The main stages of BSC implementation timeline are:
� Project plan 1 month
� BSC creation 6 months
� Roll-out process 3 months
� Integration into management system 1.5 month
� Software support 6 months
Month 1 2 3 4 5 6 7 8 9 10 11 12
Activity
Project plan
Project team assignment
Special trainings
Budgeting
BSC creation
Strategy clarification
Strategic objectives determination
Strategy map creation
Strategy measures
Current condition analysis
Target values setting
Proposal of strategic actions
Roll-out process
Measurement program architecture
Build implementation plan
Integration into management system BSC proposal
BSC approval
Plan realization
Software support
Fig.13 The BSC timeline [own]
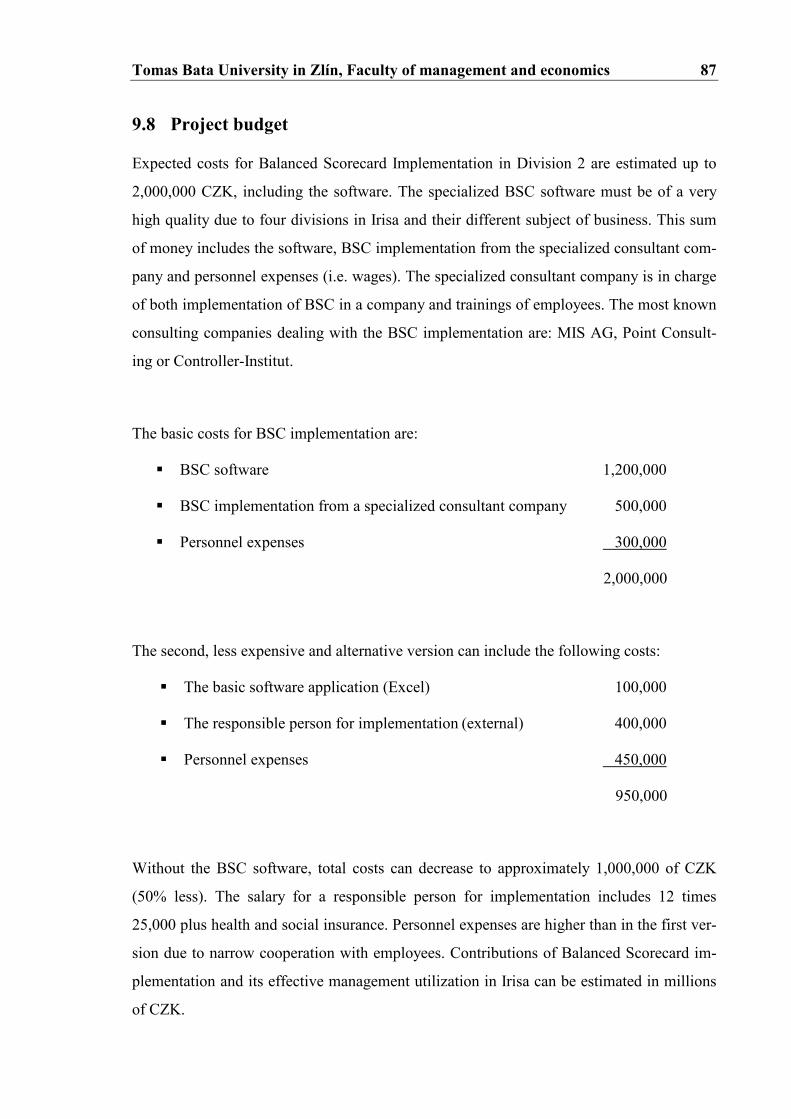
Tomas Bata University in Zlín, Faculty of management and economics 87
9.8 Project budget
Expected costs for Balanced Scorecard Implementation in Division 2 are estimated up to
2,000,000 CZK, including the software. The specialized BSC software must be of a very
high quality due to four divisions in Irisa and their different subject of business. This sum
of money includes the software, BSC implementation from the specialized consultant com-
pany and personnel expenses (i.e. wages). The specialized consultant company is in charge
of both implementation of BSC in a company and trainings of employees. The most known
consulting companies dealing with the BSC implementation are: MIS AG, Point Consult-
ing or Controller-Institut.
The basic costs for BSC implementation are:
� BSC software 1,200,000
� BSC implementation from a specialized consultant company 500,000
� Personnel expenses 300,000
2,000,000
The second, less expensive and alternative version can include the following costs:
� The basic software application (Excel) 100,000
� The responsible person for implementation (external) 400,000
� Personnel expenses 450,000
950,000
Without the BSC software, total costs can decrease to approximately 1,000,000 of CZK
(50% less). The salary for a responsible person for implementation includes 12 times
25,000 plus health and social insurance. Personnel expenses are higher than in the first ver-
sion due to narrow cooperation with employees. Contributions of Balanced Scorecard im-
plementation and its effective management utilization in Irisa can be estimated in millions
of CZK.
Tomas Bata University in Zlín, Faculty of management and economics 88
9.9 Contributions of the BSC project
There are many important contributions that can bring the implementation of Balanced
Scorecard project. The most important are mentioned here:
� It improves the bottom line by reducing process cost and improving productivity
and mission effectiveness.
� It helps in strategy realization and communication within the company.
� A performance measurement system such as the BSC allows Irisa to align its strate-
gic activities to the strategic plan. It permits real deployment and implementation of
the strategy on a continuous basis. With it, Irisa can get feedback needed to guide
the planning efforts. Without it, Irisa is “flying blind”.
� It helps to increase Economic Value Added and Sales due to specialized connec-
tions among four perspectives in a strategy map.
� It allows managers to identify best practices in an organization and expand their us-
age elsewhere.
� The visibility provided by a measurement system supports better and faster budget
decisions and control of processes in Irisa. This means it can reduce risk.
� The visibility provides accountability and incentives based on real data. This serves
for reinforcement and the motivation that comes from competition.
� Collection of process cost data for many past projects allow to learn how to esti-
mate costs more accurately for future projects.
Tomas Bata University in Zlín, Faculty of management and economics 89
9.10 Risks of the BSC project
BSC project can have key problematic effects on Irisa and their stakeholders in today´s
changing business environment. BSC concept can negatively influence the survival of
firms and hinder much-needed business ecosystem innovation, thereby negatively affecting
customer value rejuvenation, shareholders´ benefits, and other stakeholders´s as well as
societal benefits in general.
Four major problem areas in Irisa could be identified as:
� Balanced Scorecard implementation can fail due to lack of interest from the man-
agement side.
� Another key problem could be the lack of money necessary for the BSC implemen-
tation process.
� BSC concept does not have to be spread to all levels in a company. It can stop at the
top management level.
� Bad communication in BSC sharing among employees can be the cause of failure.
Tomas Bata University in Zlín, Faculty of management and economics 90
9.11 Proposals and recommendations
Balanced Scorecard implementation in Irisa can bring several advantages and improve-
ments based on successful working out. The major improvements include:
� Balanced Scorecard concept can try to solve one big problem referred to customers
that has Irisa faced up so far. It can change the customer structure in Irisa. One big
customer, although it creates 80% of profit, can enforce Irisa´s production in case of
unexpected situations such as insolvency proceedings of Sidler GmbH. Owing to
BSC concept, Irisa can increase the share of new customers. This could enable it a
better price influence and policy from Irisa´s side.
� Irisa´s awareness improvement. Employees would be able to access information
about the company easily, to find out the necessary rules and duties that are respon-
sible for to improve their skills and motivation in process capabilities and quality.
� BSC perspectives look at financial resources planning and its evaluation in favour
of improvement of assets utilization from a different angle.
� It will help Irisa´s vision and mission to come up to expectations.
� It will provide a complete overview of firm´s assets, not only focused on the past
development (financial perspective) but on the contemporary situation (customer
and internal processes perspective) and future prospects (learning and growth per-
spective).
� It will better the customer relationships, both of existing customer and new ones. It
will enable new customer segments and market areas to be served effectively and
efficiently.
� According to customers´ desires, it will help to introduce innovative products and
services of high-quality and at low cost.
Irisa can benefit from the BSC concept in case of full support from chief executive man-
agement and connection with other managerial concepts of leadership, i.e. the connection
with strategic and operative planning, controlling or integration into reporting system.
Tomas Bata University in Zlín, Faculty of management and economics 91
CONCLUSION
The Balanced Scorecard is one of the most successful and endurable management concepts
in recent years. In the past few years since Robert Kaplan and David Norton introduced the
concept of the Balanced Scorecard, it has attracted much interest as a format for reporting
on performance, and increasingly, to support strategic thinking. But it has come a long way
since its introduction in 1992. The philosophy was that financial measures were not ade-
quate for managing complex companies.
A Balanced Scorecard provides a means for linking the strategies of different businesses
within an organization to the overall corporate vision. It supplements traditional financial
measures with criteria that measure performance from a variety of perspectives. But per-
haps the most important aspect of a BSC is that it allows organizations to link long-term
strategy with short-term actions.
The first part of this master thesis deals with the theory background of the Balanced Score-
card topic and its implementation. The following part describes Irisa and analyses that
characterize the readiness of Irisa for BSC implementation. From these analyses are formed
solutions for Balanced Scorecard utilization in Irisa.
The Balanced Scorecard implementation can provide managers from Irisa the future com-
petitive success. It helps to translate an organization´s mission and strategy into a compre-
hensive set of performance measures that provides the framework for a strategic measure-
ment and management system. In Irisa, the BSC retains an emphasis on achieving financial
objectives, but also includes the performance drivers of these financial objectives. It en-
ables to track financial results while simultaneously monitoring progress in building the
capabilities and acquiring the intangible assets they need for future growth.
The final part is concluded by possible contributions and risks of the project and proposals
and recommendations to Irisa.
Tomas Bata University in Zlín, Faculty of management and economics 92
BIBLIOGRAPHY
[1] COOKE, T. Translating strategy into results with the Balanced Scorecard. Central
Arizona Project, June 29, 2005.
[2] HALLMAN, P. The role of causality in the balanced scorecard framework. Stock-
holm: Royal Institute of Technology, 2005.
[3] HORVÁTH & PARTNERS. Balanced Scorecard v praxi. Praha: Profess Consult-
ing, s.r.o., 2002. ISBN 80-7259-018-9.
[4] KAPLAN, R.S., NORTON, D.P. Alignment: How to apply the Balanced Scorecard
to corporate strategy. Boston: Harvard Business School Press, 2006. ISBN 159-1396-905.
[5] KAPLAN, R.S., NORTON, D.P. Balanced Scorecard: Strategický systém měření
výkonnosti podniku. Praha: Management Press, 2002. ISBN 80-7261-063-5.
[6] KAPLAN, R.S., NORTON, D.P. The Balanced Scorecard: Translating strategy
into action. Boston: Harvard Business School Publishing Corporation, 1996. ISBN 0-
87584-651-3.
[7] KAPLAN, R.S., NORTON, D.P. Harvard Business Review on Measures that drive
performance. Boston: Harvard Business School Publishing Corporation, 1992. ISBN 0-
69158-748-3.
[8] KAPLAN, R.S., NORTON, D.P. Harvard Business Review on Measuring Corpo-
rate Performance. Boston: Harvard Business School Publishing Corporation, 1996. ISBN
0-87584-882-6.
[9] KAPLAN, R.S., NORTON, D.P. Strategy focused organization. Boston: Harvard
Business School Publishing Corporation, 2001. ISBN 1-57851-250-6.
[10] KAPLAN, R.S., NORTON, D.P. Strategy maps. Boston: Harvard Business School
Publishing Corporation, 2004. ISBN 1-59139-134-2.
[11] MURRAY, E.J., RICHARDSON, P.R. Fast Forward: Organizational Change in
100 Days. New York: Oxford University Press, 2002. ISBN 0-195-15311-1.
[12] NIVEN, P.R. Balanced Scorecard Diagnostics. Maintaining maximum perform-
ance. New Jersey: John Wiley & Sons, Inc., 2005. ISBN 0-471-68123-7.
Tomas Bata University in Zlín, Faculty of management and economics 93
[13] NIVEN, P.R. Balanced Scorecard step by step: maximizing performance and main-
taining results. New Jersey: John Wiley & Sons, Inc., 2006. ISBN 0-471-78049-9.
[14] OLVE, N.G., SJOSTRAND, A. Balanced Scorecard. Southern Gate Chichester,
West Sussex: Capstone Publishing Ltd., 2006. ISBN 184-1127-086.
[15] OLVE, N.G., PETRI, C.J., ROY, J., ROY, S. Making scorecards actionable. Bal-
ancing Strategy and Control. New Jersey: John Wiley & Sons, Inc., 2003. ISBN 0-470-
84871-5.
[16] VOELPEL, S.C., LEIBOLD, M., ECKHOFF, R.A., DAVENPORT, T.H. The Tyr-
anny of the Balanced Scorecard in the Innovation Economy. Cambridge: 4th International
Critical Management Studies Conference, July 4-6, 2005.
Sources of company
[17] Balanced Sheet and Profit and loss statement 2002-2006
Internet sources
[18] Balanced Scorecard Institute. Internet web pages. [online] c.2007. Available from
WWW: <http://www.balancedscorecard.com>.
[19] Balanced Scorecard Collaborative. Internet web pages. [online] c.2007. Available
from WWW: <http://www.bscol.com>.
[20] Balanced Scorecard Method. Internet web pages. [online] c.2007. Available from
WWW: <http://www.valuebasedmanagement.net>.
[21] Český statistický úřad. Internet web pages. [online] c.2007. Available from WWW:
<http://www.czso.cz>.
[22] Harvard University. Internet web pages. [online] c.2007. Available from WWW:
<http://www.harvard.edu>.
[23] Harvard Business School. Internet web pages. [online] c.2007. Available from
WWW: <http://www.hbs.edu>.
[24] Ministerstvo Průmyslu a Obchodu. Internet web pages. [online] c.2007. Available
from WWW: <http://www.mpo.cz>.
[25] Irisa, co-opt. Internet web pages. [online] c.2007. Available from WWW:
<http://www.irisa.cz>.

Tomas Bata University in Zlín, Faculty of management and economics 94
LIST OF SYMBOLS AND ABBREVIATIONS
BSC Balanced Scorecard
CF Cash flow
CEO Chief Executive Officer
Co-opt Cooperative society
CZK Czech crown
EAT Earnings after Taxes
EBIT Earnings before Interest and Taxes
EBT Earnings before Taxes
e.g. For example
Etc. Et cetera, and so on
EUR Euro
EVA Economic Value Added
GmbH Gesellschaft mit beschränkter Handlung, limited, ltd.
IC Intellectual capital
i.e. Id est, that is
lab laboratory
L.t.t.d. Long-term total debt
LT Long-term
p.a. Per annum, per year
ROA Return on Assets
ROE Return on Equity
ROI Return on Investment
ROS Return on Sales
R&D Research and Development

Tomas Bata University in Zlín, Faculty of management and economics 95
SBU Strategic Business Unit
ST Short-term
VA Value Added
WACC Weighted Average Cost of Capital
WLW Wer liefert was?, Internet supplier search engine
Tomas Bata University in Zlín, Faculty of management and economics 96
LIST OF FIGURES
Figure 1 Historic overview of BSC development 16
Figure 2 Using the BSC as a Strategic Management System 18
Figure 3 Four perspectives of BSC 22
Figure 4 Launching the BSC program 25
Figure 5 Irisa, co-opt. Vsetín 35
Figure 6 Five Forces in Porter´s Model in Irisa 42
Figure 7 Profit / loss of current accounting period in Irisa 48
Figure 8 Spider analysis 56
Figure 9 Du-Pont Model 62
Figure 10 A Strategy map in Division 2 in Irisa 70
Figure 11 Objectives in Division 2 82
Figure 12 Influence of each department on objectives 83
Figure 13 The BSC timeline 86
Tomas Bata University in Zlín, Faculty of management and economics 97
LIST OF TABLES
Table 1 Building strategy maps 19
Table 2 Top customers in Irisa 36
Table 3 Employees in Irisa 37
Table 4 PEST analysis in Irisa 39
Table 5 Profit / loss analysis in Irisa 47
Table 6 Profit / loss analysis in industry 47
Table 7 Cash flow analysis 48
Table 8 Leverage ratios 49
Table 9 Liquidity ratios 51
Table 10 Profitability ratios 52
Table 11 Equity multiplier 53
Table 12 Activity ratios 54
Table 13 Spider analysis 55
Table 14 Other ratios 57
Table 15 Altman Z-Score 59
Table 16 Index IN01 59
Table 17 Economic Value Added 60
Table 18 SWOT analysis 65
Table 19 Financial perspective in Division 2 72
Table 20 Customer perspective in Division 2 74
Table 21 Internal processes perspective in Division 2 76
Table 22 Learning and growth perspective in Division 2 78
Table 23 The Balanced Scorecard in Division 2 in Irisa 80

Tomas Bata University in Zlín, Faculty of management and economics 98
LIST OF APPENDICES
Appendix 1 Strategy map
Appendix 2 Assets and liabilities analysis
Appendix 3 Revenues and expenses analysis
Appendix 4 Solvency / leverage ratios figures
Appendix 5 Liquidity ratios figures
Appendix 6 Profitability ratios figures
Appendix 7 Activity ratios figures
Appendix 8 Balanced Sheet 2002-2006
Appendix 9 Profit / loss statement 2002-2006
APPENDIX A I: STRATEGY MAP
Kaplan, Norton: Strategy maps [10]
APPENDIX A II: ASSETS AND LIABILITIES ANALYSIS

% analysis of assets and liabilities Trends-Irisa (in thousands of CZK) 2003/2002 2004/2003 2005/2004 2006/2005
TOTAL ASSETS -3.08% 4.48% 17.51% 5.44%
Fixed assets -8.43% -7.34% -3.12% -0.87%
Intangible fixed assets -10.35% -17.64% -37.79% -44.56% Tangible fixed assets -8.24% -6.58% -0.85% 0.92% Long-term financial assets -83.87% 0.00% 0.00% 0.00% Current assets 10.82% 30.27% 52.68% 12.34%
Inventory -9.30% 83.93% 8.93% -19.60% Long-term receivables 0.00% 0.00% 0.00% 0.00% Short-term receivables 33.58% -28.88% 193.59% 13.11% Short-term financial assets 451.12% 27.07% -39.73% 451.89% Accruals 56.47% 62.66% -20.75% -13.22%
TOTAL LIABILITIES -3.08% 4.48% 17.51% 5.44%
Equity 1.11% 0.60% 2.09% 4.92%
Registered capital -9.69% -12.51% -14.22% -16.03% Capital funds 0.00% 0.00% 0.00% 0.00% Reserve funds, statut.res.acc.,.. -9.62% 0.41% 1.12% 2.36% Profit / loss- previous year 0.00% 0.00% 0.00% 0.00% Profit / loss - current year 436.85% 45.34% 59.30% 74.12% Other sources -10.96% 12.77% 46.93% 6.13%
Reserves 0.00% 0.00% 0.00% 0.00% Long-term payables -80.88% -13.08% 296.81% -22.27% Short-term payables 32.98% 45.61% -28.73% 27.46% Bank loans and fin.accommodations -4.82% -17.64% 15.49% 0.53% Accruals 0.00% 0.00% 0.00% 0.00%
% analysis of assets and liabilities Trends industry *I.-III.Q. (in millions of CZK) 2003/2002 2004/2003 2005/2004 2006/2005
TOTAL ASSETS 11.44% 26.80% 17.14% 15.20%
Fixed assets 2.69% 23.56% 57.00% 11.28%
Intangible + tangible fixed assets 6.40% 25.59% 7.52% 10.27% Long-term financial assets -26.80% 0.13% 773.78% 13.09% Current assets 28.91% 29.51% -16.34% 21.61%
Inventory 16.17% 16.45% 10.71% 21.04% Long-term, short-term receivables 39.97% 33.06% -33.91% 35.67% Short-term financial assets 3.85% 42.97% 35.37% -23.11% Accruals -64.82% 34.51% -9.63% 12.02%
TOTAL LIABILITIES 11.44% 26.80% 17.14% 15.20%
Equity 15.78% 16.83% 21.33% 14.58%
Other sources 6.64% 35.61% 21.00% 16.63%
Reserves -36.11% 42.93% -47.62% 15.79% Long-term payables 39.54% 13.42% -1.03% 37.68% Bank loans and fin.accommodations -0.31% 104.18% 33.68% 23.94% Accruals -8.25% 140.25% -77.75% -19.83%
0
20 000
40 000
60 000
80 000
100 000
120 000
140 000
160 000
180 000
200 000
in thousands of CZK
2002 2003 2004 2005 2006
Year
Total assets / liabilities (Irisa)
0
20 000
40 000
60 000
80 000
100 000
120 000
in millions of CZK
2002 2003 2004 2005 2006
Year
Total assets / liabilities (industry)
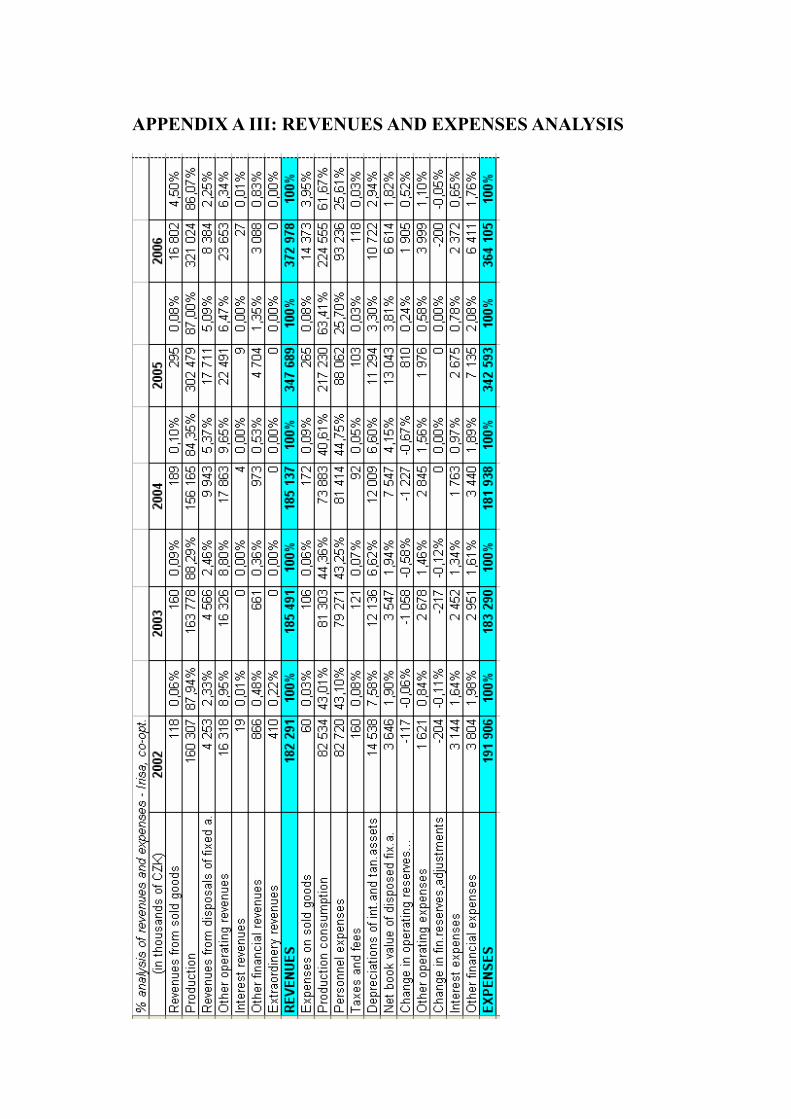
APPENDIX A III: REVENUES AND EXPENSES ANALYSIS
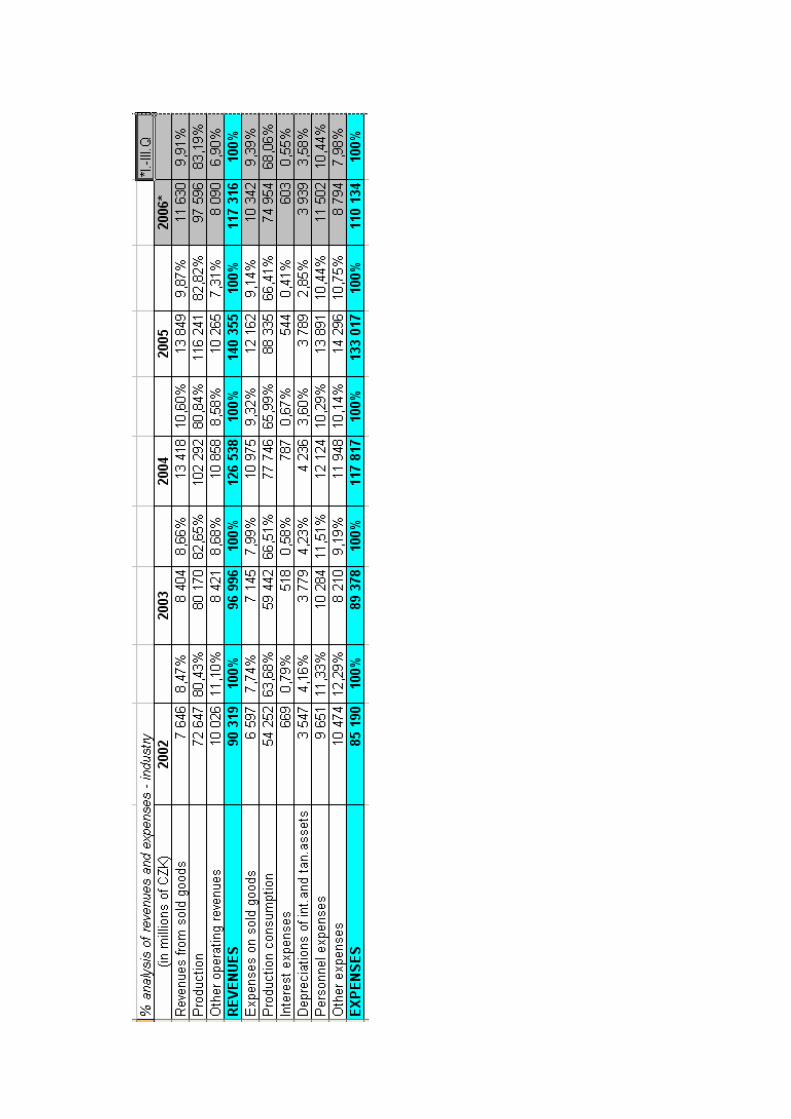

% analysis of revenues and exp. Trends Irisa (in thousands of CZK) 2003/2002 2004/2003 2005/2004 2006/2005
Revenues from sold goods 35.63% 18.13% 56.08% 55.59% Production 2.17% -4.65% 93.69% 6.13% Revenues from disposals of fixed a. 7.36% 117.76% 78.13% -52.66% Other operating revenues 0.05% 9.41% 25.91% 5.17% Interest revenues 0.00% 0.00% 125% 200% Other financial revenues -23.67% 47.20% 383.45% -34.35% Extraordinary revenues 0.00% 0.00% 0.00% 0.00% REVENUES 1.76% -0.19% 87.80% 7.27%
Expenses on sold goods 76.67% 62.26% 54.07% 53.77% Production consumption -1.49% -9.12% 194.02% 3.37% Personnel expenses -4.17% 2.70% 8.17% 5.88% Taxes and fees -24.38% -23.97% 11.96% 14.56% Depreciations of int.and tan. assets -16.52% -1.05% -5.95% -5.06% Net book value of disposed fix.a. -2.72% 112.77% 72.82% -49.29% Change in operating reserves… 804.27% 15.97% 66.01% 135.19% Other operating expenses 65.21% 6.24% -30.54% 102.38% Change in fin.reserves, adjustments 6.37% 0.00% 0.00% 0.00% Interest expenses -22.01% -28.10% 51.73% -11.33% Other financial expenses -22.42% 16.57% 107.41% -10.15% EXPENSES -4.49% -0.74% 88.30% 6.28%
% analysis of revenues and exp. Trends industry *I.-III.Q (in millions of CZK) 2003/2002 2004/2003 2005/2004 2006/2005
Revenues from sold goods 9.91% 59.66% 3.21% -16.02% Production 10.36% 27.59% 13.64% -16.04% Other operating revenues -16.01% 28.94% -5.46% -21.19% REVENUES 7.39% 30.46% 10.92% -16.41%
Expenses on sold goods 8.31% 53.60% 10.82% -14.96% Production consumption 9.57% 30.79% 13.62% -15.15% Interest expenses -22.57% 51.93% -30.88% 10.85% Depreciations of int.and tan. assets 6.54% 12.09% -10.55% 3.96% Personnel expenses 6.56% 17.89% 14.57% -17.20% Other expenses -21.62% 45.53% 19.65% -38.49% EXPENSES 4.92% 31.82% 12.90% -17.20%
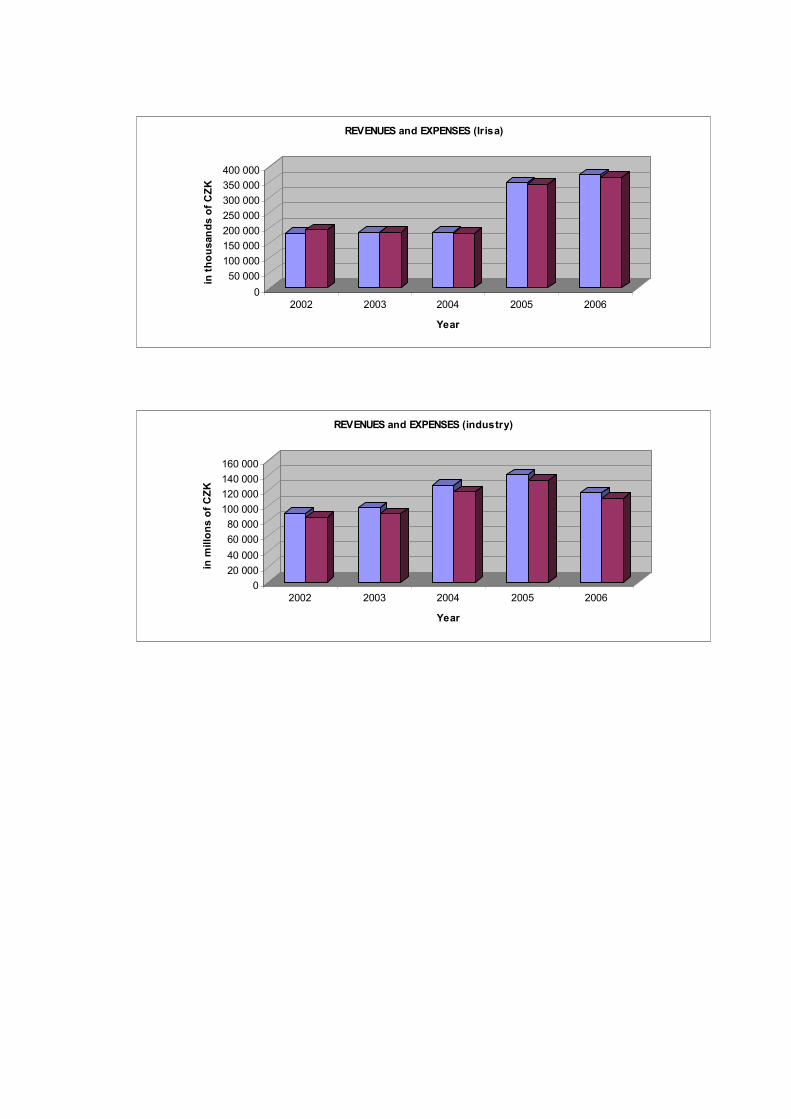
0
50 000
100 000
150 000
200 000
250 000
300 000
350 000
400 000
in thousands of CZK
2002 2003 2004 2005 2006
Year
REVENUES and EXPENSES (Irisa)
0
20 000
40 000
60 000
80 000
100 000
120 000
140 000
160 000
in millons of CZK
2002 2003 2004 2005 2006
Year
REVENUES and EXPENSES (industry)
APPENDIX A IV: SOLVENCY / LEVERAGE RATIOS FIGURES
Times-Covered Ratio Irisa x industry
-5
0
5
10
15
20
2002 2003 2004 2005 2006
Year
Times-Covered Ratio Irisa Times-Covered Ratio industry
Debt-to-Assets Ratio Irisa x industry
0% 10% 20% 30% 40% 50%
2002 2003 2004 2005 2006 Year
Debt-to-Assets Ratio Irisa Debt-to-Assets Ratio industry
Debt-to-Equity Ratio Irisa x industry
0 0.2 0.4
0.6 0.8 1
2002 2003 2004 2005 2006 Year
Debt-to-Equity Ratio Irisa Debt-to-Equity Ratio industry
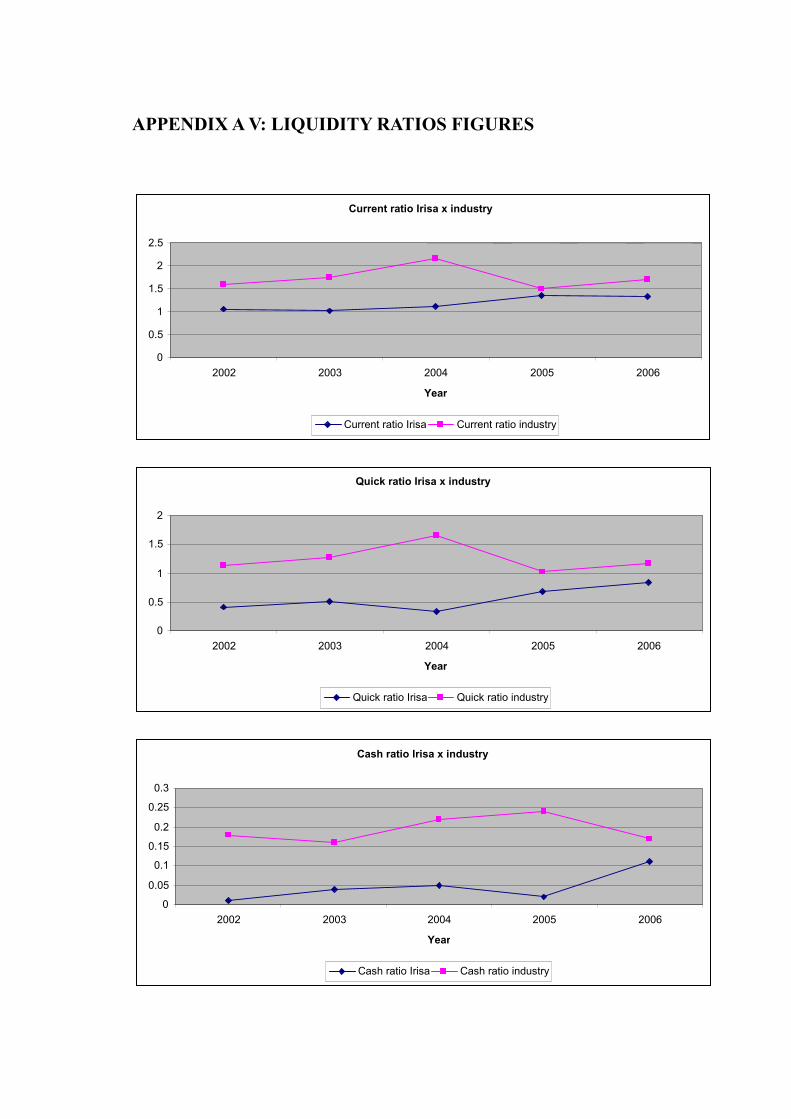
APPENDIX A V: LIQUIDITY RATIOS FIGURES
Current ratio Irisa x industry
0
0.5
1
1.5
2
2.5
2002 2003 2004 2005 2006 Year
Current ratio Irisa Current ratio industry
Quick ratio Irisa x industry
0
0.5
1
1.5
2
2002 2003 2004 2005 2006 Year
Quick ratio Irisa Quick ratio industry
Cash ratio Irisa x industry
0 0.05 0.1
0.15 0.2
0.25 0.3
2002 2003 2004 2005 2006 Year
Cash ratio Irisa Cash ratio industry
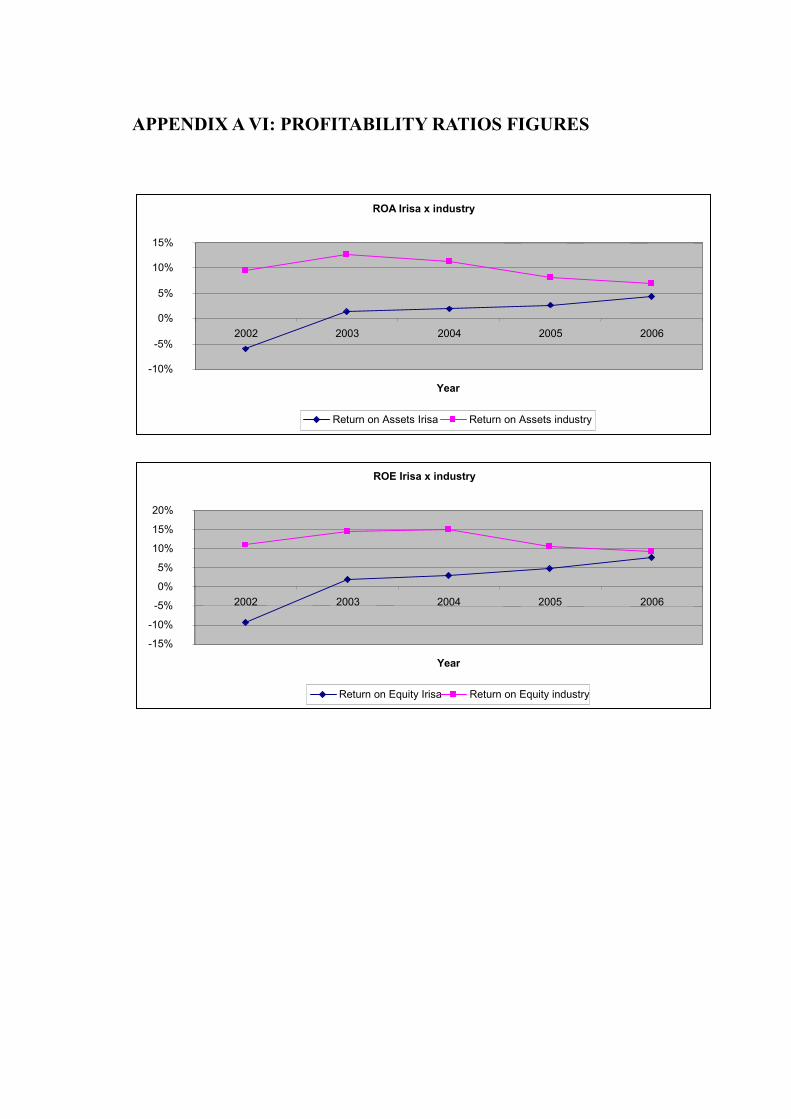
APPENDIX A VI: PROFITABILITY RATIOS FIGURES
ROA Irisa x industry
-10%
-5%
0%
5%
10%
15%
2002 2003 2004 2005 2006
Year
Return on Assets Irisa Return on Assets industry
ROE Irisa x industry
-15% -10% -5% 0% 5%
10% 15% 20%
2002 2003 2004 2005 2006
Year
Return on Equity Irisa Return on Equity industry
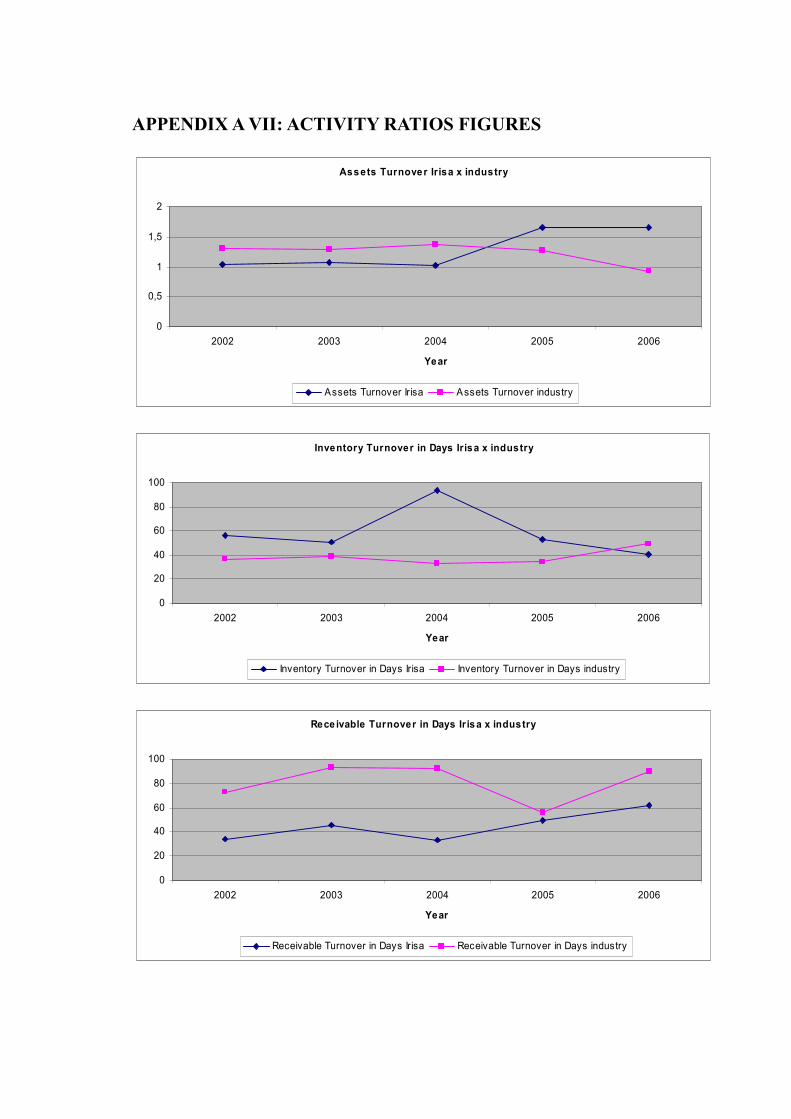
APPENDIX A VII: ACTIVITY RATIOS FIGURES
Assets Turnover Irisa x industry
0
0,5
1
1,5
2
2002 2003 2004 2005 2006
Year
Assets Turnover Irisa Assets Turnover industry
Inventory Turnover in Days Irisa x industry
0
20
40
60
80
100
2002 2003 2004 2005 2006
Year
Inventory Turnover in Days Irisa Inventory Turnover in Days industry
Rece ivable Turnover in Days Ir isa x industry
0
20
40
60
80
100
2002 2003 2004 2005 2006
Year
Receivable Turnover in Days Irisa Receivable Turnover in Days industry
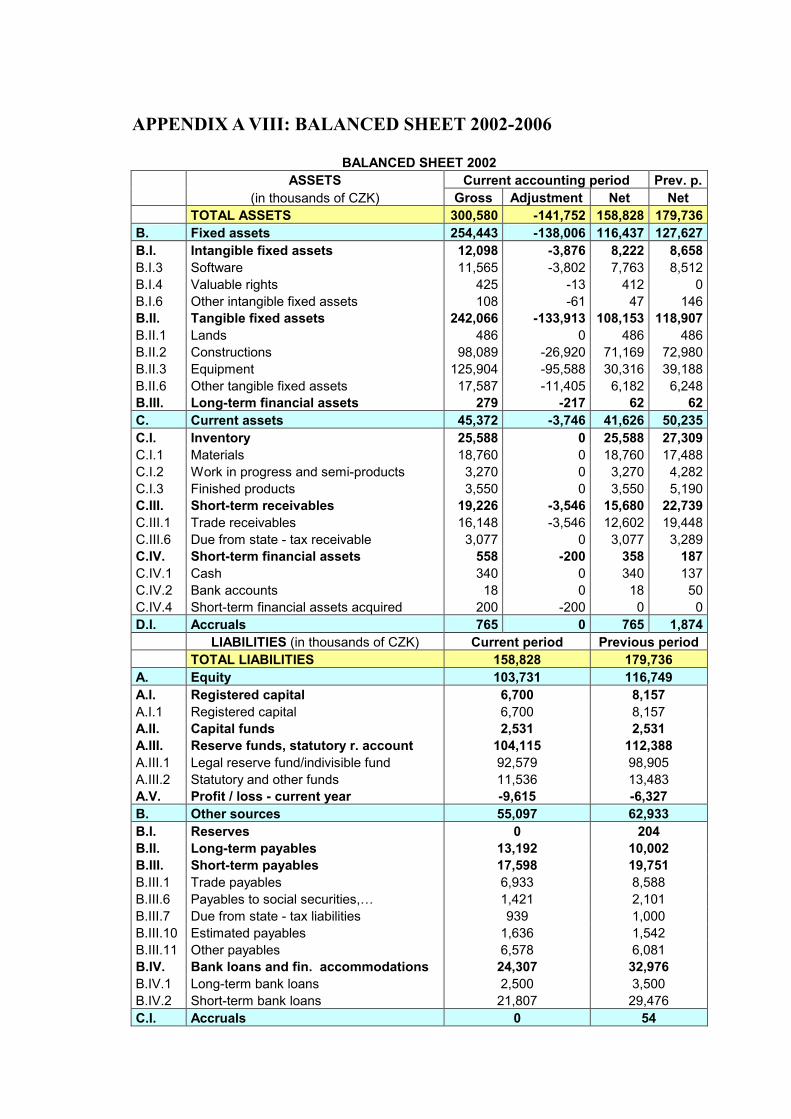
APPENDIX A VIII: BALANCED SHEET 2002-2006
BALANCED SHEET 2002
ASSETS Current accounting period Prev. p.
(in thousands of CZK) Gross Adjustment Net Net
TOTAL ASSETS 300,580 -141,752 158,828 179,736
B. Fixed assets 254,443 -138,006 116,437 127,627
B.I. Intangible fixed assets 12,098 -3,876 8,222 8,658
B.I.3 Software 11,565 -3,802 7,763 8,512 B.I.4 Valuable rights 425 -13 412 0 B.I.6 Other intangible fixed assets 108 -61 47 146 B.II. Tangible fixed assets 242,066 -133,913 108,153 118,907
B.II.1 Lands 486 0 486 486 B.II.2 Constructions 98,089 -26,920 71,169 72,980 B.II.3 Equipment 125,904 -95,588 30,316 39,188 B.II.6 Other tangible fixed assets 17,587 -11,405 6,182 6,248 B.III. Long-term financial assets 279 -217 62 62
C. Current assets 45,372 -3,746 41,626 50,235
C.I. Inventory 25,588 0 25,588 27,309
C.I.1 Materials 18,760 0 18,760 17,488 C.I.2 Work in progress and semi-products 3,270 0 3,270 4,282 C.I.3 Finished products 3,550 0 3,550 5,190 C.III. Short-term receivables 19,226 -3,546 15,680 22,739
C.III.1 Trade receivables 16,148 -3,546 12,602 19,448 C.III.6 Due from state - tax receivable 3,077 0 3,077 3,289 C.IV. Short-term financial assets 558 -200 358 187
C.IV.1 Cash 340 0 340 137 C.IV.2 Bank accounts 18 0 18 50 C.IV.4 Short-term financial assets acquired 200 -200 0 0 D.I. Accruals 765 0 765 1,874
LIABILITIES (in thousands of CZK) Current period Previous period
TOTAL LIABILITIES 158,828 179,736
A. Equity 103,731 116,749
A.I. Registered capital 6,700 8,157
A.I.1 Registered capital 6,700 8,157 A.II. Capital funds 2,531 2,531
A.III. Reserve funds, statutory r. account 104,115 112,388
A.III.1 Legal reserve fund/indivisible fund 92,579 98,905 A.III.2 Statutory and other funds 11,536 13,483 A.V. Profit / loss - current year -9,615 -6,327
B. Other sources 55,097 62,933
B.I. Reserves 0 204
B.II. Long-term payables 13,192 10,002
B.III. Short-term payables 17,598 19,751
B.III.1 Trade payables 6,933 8,588 B.III.6 Payables to social securities,… 1,421 2,101 B.III.7 Due from state - tax liabilities 939 1,000 B.III.10 Estimated payables 1,636 1,542 B.III.11 Other payables 6,578 6,081 B.IV. Bank loans and fin. accommodations 24,307 32,976
B.IV.1 Long-term bank loans 2,500 3,500 B.IV.2 Short-term bank loans 21,807 29,476 C.I. Accruals 0 54
BALANCED SHEET 2003
ASSETS Current accounting period Prev. p.
(in thousands of CZK) Gross Adjustment Net Net
TOTAL ASSETS 304,871 -150,928 153,943 158,828
B. Fixed assets 254,858 -148,240 106,618 116,437
B.I. Intangible fixed assets 12,718 -5,347 7,371 8,222
B.I.3 Software 12,036 -5,236 6,800 7,763 B.I.4 Valuable rights 425 -34 391 412 B.I.6 Other intangible fixed assets 106 -76 30 47 B.I.7 Int. fixed assets under construction 150 0 150 0 B.II. Tangible fixed assets 242,129 -142,892 99,237 108,153
B.II.1 Lands 486 0 486 486 B.II.2 Constructions 97,949 -29,129 68,820 71,169 B.II.3 Equipment 125,107 -102,346 23,759 30,316 B.II.6 Other tangible fixed assets 17,587 -11,415 6,172 6,182 B.III. Long-term financial assets 10 0 10 62
C. Current assets 48,816 -2,688 46,128 41,626
C.I. Inventory 23,209 0 23,209 25,588
C.I.1 Materials 16,770 0 16,770 18,760 C.I.2 Work in progress and semi-products 3,171 0 3,171 3,270 C.I.3 Finished products 3,188 0 3,188 3,550 C.I.5 Merchandise 47 0 47 8 C.I.6 Advanced payments for inventory 33 0 33 0 C.III. Short-term receivables 23,434 -2,488 20,946 15,680
C.III.1 Trade receivables 17,235 -2,488 14,747 12,602 C.III.6 Due from state - tax receivable 5,304 0 5,304 3,077 C.III.7 Short-term deposits given 893 0 893 0 C.III.9 Other receivables 2 0 2 1 C.IV. Short-term financial assets 2,173 -200 1,973 358
C.IV.1 Cash 305 0 305 340 C.IV.2 Bank accounts 1,668 0 1,668 18 D.I. Accruals 1,197 0 1,197 765
LIABILITIES (in thousands of CZK) Current period Previous period
TOTAL LIABILITIES 153,943 158,828
A. Equity 104,884 103,731
A.I. Registered capital 6,051 6,700
A.II. Capital funds 2,531 2,531
A.III. Reserve funds, statutory r. account 94,101 104,115
A.III.1 Legal reserve fund/indivisible fund 82,964 92,579 A.III.2 Statutory and other funds 11,137 11,536 A.V. Profit / loss - current year 2,201 -9,615
B. Other sources 49,059 55,097
B.II. Long-term payables 2,522 13,192
B.III. Short-term payables 23,402 17,598
B.III.1 Trade payables 4,902 6,933 B.III.4 Payables from partners,… 199 91 B.III.6 Payables to social securities,… 1,764 1,421 B.III.7 Due from state - tax liabilities 740 939 B.III.8 Short-term deposits received 29 0 B.III.10 Estimated payables 2,159 1,636 B.III.11 Other payables 13,609 6,578 B.IV. Bank loans and fin. accommodations 23,135 24,307
B.IV.1 Long-term bank loans 1,500 2,500 B.IV.2 Short-term bank loans 21,635 21,807
BALANCED SHEET 2004
ASSETS Current accounting period Prev. p.
(in thousands of CZK) Gross Adjustment Net Net
TOTAL ASSETS 315,804 -154,972 160,832 153,943
B. Fixed assets 252,227 -153,434 98,793 106,618
B.I. Intangible fixed assets 12,922 -6,851 6,071 7,371
B.I.3 Software 12,029 -6,700 5,329 6,800 B.I.4 Valuable rights 425 -56 369 391 B.I.6 Other intangible fixed assets 108 -95 13 30 B.I.7 Int. fixed assets under construction 360 0 360 150 B.II. Tangible fixed assets 239,295 -146,583 92,712 99,237
B.II.1 Lands 486 0 486 486 B.II.2 Constructions 99,932 -31,545 68,387 68,820 B.II.3 Equipment 123,604 -104,762 18,842 23,759 B.II.6 Other tangible fixed assets 15,117 -10,276 4,841 6,172 B.II.7 Tang. fixed assets under construction 156 0 156 0 B.III. Long-term financial assets 10 0 10 10
C. Current assets 61,630 -1,538 60,092 46,128
C.I. Inventory 42,688 0 42,688 23,209
C.I.1 Materials 37,374 0 37,374 16,770 C.I.2 Work in progress and semi-products 2,829 0 2,829 3,171 C.I.3 Finished products 2,415 0 2,415 3,188 C.I.5 Merchandise 70 0 70 47 C.I.6 Advanced payments for inventory 0 0 0 33 C.III. Short-term receivables 16,235 -1,338 14,897 20,946
C.III.1 Trade receivables 15,394 -1,338 14,056 14,747 C.III.6 Due from state - tax receivable 45 0 45 5,304 C.III.7 Short-term deposits given 793 0 793 893 C.III.9 Other receivables 3 0 3 2 C.IV. Short-term financial assets 2,707 -200 2,507 1,973
C.IV.1 Cash 283 0 283 305 C.IV.2 Bank accounts 2,224 0 2,224 1,668 C.IV.4 Short-term fin. assets acquired 200 -200 0 0 D.I. Accruals 1,947 0 1,947 1,197
LIABILITIES (in thousands of CZK) Current period Previous period
TOTAL LIABILITIES 160,832 153,943
A. Equity 105,510 104,884
A.I. Registered capital 5,294 6,051
A.II. Capital funds 2,531 2,531
A.III. Reserve funds, statutory r. account 94,486 94,101
A.V. Profit / loss - current year 3,199 2,201
B. Other sources 55,322 49,059
B.II. Long-term payables 2,192 2,522
B.III. Short-term payables 34,075 23,402
B.III.1 Trade payables 25,535 4,902 B.III.4 Payables from partners,… 223 199 B.III.6 Payables to social securities,… 1,624 1,764 B.III.7 Due from state - tax liabilities 384 740 B.III.8 Short-term deposits received 51 29 B.III.10 Estimated payables 424 2,159 B.III.11 Other payables 5,834 13,609 B.IV. Bank loans and fin. accommodations 19,055 23,135
B.IV.1 Long-term bank loans 0 1,500 B.IV.2 Short-term bank loans 19,055 21,635
BALANCED SHEET 2005
ASSETS Current accounting period Prev. p.
(in thousands of CZK) Gross Adjustment Net Net
TOTAL ASSETS 352,952 -163,954 188,998 160,832
B. Fixed assets 258,468 -162,760 95,708 98,793
B.I. Intangible fixed assets 13,358 -9,581 3,777 6,071
B.I.3 Software 12,459 -9,396 3,063 5,329 B.I.4 Valuable rights 791 -77 714 369 B.I.6 Other intangible fixed assets 108 -108 0 13 B.II. Tangible fixed assets 245,100 -153,179 91,921 92,712
B.II.1 Lands 486 0 486 486 B.II.2 Constructions 100,953 -33,673 67,280 68,387 B.II.3 Equipment 129,057 -108,510 20,547 18,842 B.II.6 Other tangible fixed assets 14,550 -10,996 3,554 4,841 B.II.7 Tang.fixed assets under construction 54 0 54 156 B.III. Long-term financial assets 10 0 10 10
C. Current assets 92,941 -1,194 91,747 60,092
C.I. Inventory 46,500 0 46,500 42,688
C.I.1 Materials 34,670 0 34,670 37,374 C.I.2 Work in progress and semi-products 7,509 0 7,509 2,829 C.I.3 Finished products 4,287 0 4,287 2,415 C.I.5 Merchandise 34 0 34 70 C.III. Short-term receivables 44,730 -994 43,736 14,897
C.III.1 Trade receivables 38,467 -994 37,473 14,056 C.III.4 Receivables from partners,.. 327 0 327 0 C.III.6 Due from state - tax receivable 698 0 698 45 C.III.7 Short-term deposits given 220 0 220 793 C.III.8 Estimated receivable 5,015 0 5,015 0 C.III.9 Other receivables 3 0 3 3 C.IV. Short-term financial assets 1,711 -200 1,511 2,507
C.IV.1 Cash 219 0 219 283 C.IV.2 Bank accounts 1,292 0 1,292 2,224 C.IV.4 Short-term fin. assets acquired 200 -200 0 0 D.I. Accruals 1,543 0 1,543 1,947
LIABILITIES (in thousands of CZK) Current period Previous period
TOTAL LIABILITIES 188,998 160,832
A. Equity 107,714 105,510
A.I. Registered capital 4,541 5,294
A.II. Capital funds 2,531 2,531
A.III. Reserve funds, statutory r. account 95,546 94,486
A.V. Profit / loss - current year 5,096 3,199
B. Other sources 81,284 55,322
B.II. Long-term payables 8,698 2,192
B.III. Short-term payables 24,284 34,075
B.III.1 Trade payables 14,658 25,535 B.III.4 Payables from partners,… 342 223 B.III.6 Payables to social securities,… 1,662 1,624 B.III.7 Due from state - tax liabilities 783 384 B.III.8 Short-term deposits received 293 51 B.III.10 Estimated payables 675 424 B.III.11 Other payables 5,871 5,834 B.IV. Bank loans and fin. accommodations 48,302 19,055
B.IV.1 Long-term bank loans 5,047 0 B.IV.2 Short-term bank loans 43,255 19,055

BALANCED SHEET 2006
ASSETS Current accounting period Prev. p.
(in thousands of CZK) Gross Adjustment Net Net
TOTAL ASSETS 367,146 -167,868 199,278 188,998
B. Fixed assets 259,842 -164,969 94,873 95,708
B.I. Intangible fixed assets 14,101 -12,007 2,094 3,777
B.I.3 Software 12,425 -11,806 619 3,063 B.I.4 Valuable rights 846 -93 753 714 B.I.6 Other intangible fixed assets 108 -108 0 0 B.II. Tangible fixed assets 245,731 -152,962 92,769 91,921
B.II.1 Lands 486 0 486 486 B.II.2 Constructions 104,323 -35,949 68,374 67,280 B.II.3 Equipment 125,416 -106,017 19,399 20,547 B.II.6 Other tangible fixed assets 14,550 -10,996 3,554 3,554 B.II.7 Tang. fixed assets under construction 564 0 564 54 B.II.8 Advance payments for tang.f.as. 392 0 392 0 B.III. Long-term financial assets 10 0 10 10
C. Current assets 105,965 -2,899 103,066 91,747
C.I. Inventory 39,284 -1,900 37,384 46,500
C.I.1 Materials 30,069 -1,900 28,169 34,670 C.I.2 Work in progress and semi-products 5,193 0 5,193 7,509 C.I.3 Finished products 3,855 0 3,855 4,287 C.I.5 Merchandise 167 0 167 34 C.III. Short-term receivables 58,342 -999 57,343 43,736
C.III.1 Trade receivables 51,738 -999 50,739 37,473 C.III.4 Receivables from partners,.. 426 0 426 327 C.III.6 Due from state - tax receivable 613 0 613 698 C.III.7 Short-term deposits given 339 0 339 220 C.III.8 Estimated receivable 5,224 0 5,224 5,015 C.III.9 Other receivables 2 0 2 3 C.IV. Short-term financial assets 8,339 0 8,339 1,511
C.IV.1 Cash 269 0 269 219 C.IV.2 Bank accounts 8,070 0 8,070 1,292 D.I. Accruals 1,339 0 1,339 1,543
LIABILITIES (in thousands of CZK) Current period Previous period
TOTAL LIABILITIES 199,278 188,998
A. Equity 113,014 107,714
A.I. Registered capital 3,813 4,541
A.II. Capital funds 2,531 2,531
A.III. Reserve funds, statutory r. account 97,797 95,546
A.V. Profit / loss - current year 8,873 5,096
B. Other sources 86,264 81,284
B.II. Long-term payables 6,761 8,698
B.III. Short-term payables 30,944 24,284
B.III.1 Trade payables 19,236 14,658 B.III.4 Payables from partners,… 210 342 B.III.6 Payables to social securities,… 1,892 1,662 B.III.7 Due from state - tax liabilities 357 783 B.III.8 Short-term deposits received 279 293 B.III.10 Estimated payables 1,757 675 B.III.11 Other payables 7,213 5,871 B.IV. Bank loans and fin. accommodations 48,559 48,302
B.IV.1 Long-term bank loans 2,658 5,047 B.IV.2 Short-term bank loans 45,901 43,255
APPENDIX A IX: PROFIT / LOSS STATEMENT 2002-2006
PROFIT / LOSS STATEMENT 2002
Profit / loss account Current period Previous period
(in thousands of CZK) I. Revenues from sold goods 118 162 A. Expenses on sold goods 60 128 + Sale margin 58 34
II. Production 160,307 184,117
II.1 Revenues from own products 160,978 182,545 II.2 Change in inventory of own products -2,953 -1,158 II.3 Capitalization 2,282 2,730 B. Production consumption 82,534 91,929
B.1 Consumption of material and energy 73,060 83,455 B.2 Services 9,474 8,484 + Value Added 77,831 92,222
C. Personnel expenses 82,720 94,549
C.1 Wages and salaries 60,662 69,140 C.2 Remuneration of board members 60 70 C.3 Social security expenses/health insurance 20,623 23,661 C.4 Other social expenses 1,375 1,678 D. Taxes and fees 160 150 E. Depreciations of intangible and tang. assets 14,538 15,019 III. Revenues from disposals of fixed assets 4,253 3,519
III.2 Revenues from disposals of materials 4,253 3,519 F. Net book value of disposed fixed assets 3,646 2,572
F.2 Net book value of sold material 3,646 2,572 G. Change in operating reserves / adjustments -117 -4 IV. Other operating revenues 16,318 18,007 H. Other operating expenses 1,621 1,314 * Operating profit / loss -4,166 148
M. Change in financial reserves / adjustments -204 122 X. Interest revenues 19 1 N. Interest expenses 3,144 3,314 XI. Other financial revenues 866 417 O. Other financial expenses 3,804 3,267 * Profit / loss from financial operations -5,859 -6,285
Q. Income tax on ordinary income 0 0 ** Operating profit / loss ordinary activity -10,025 -6,137
XIII. Extraordinary revenues 410 0 R. Extraordinary expenses 0 190 S. Income tax on extraordinary income 0 0 * Operating profit / loss extraordinary act. 410 -190
*** Profit / loss of current accounting period -9,615 -6,327
Profit / loss before tax -9,615 -6,327
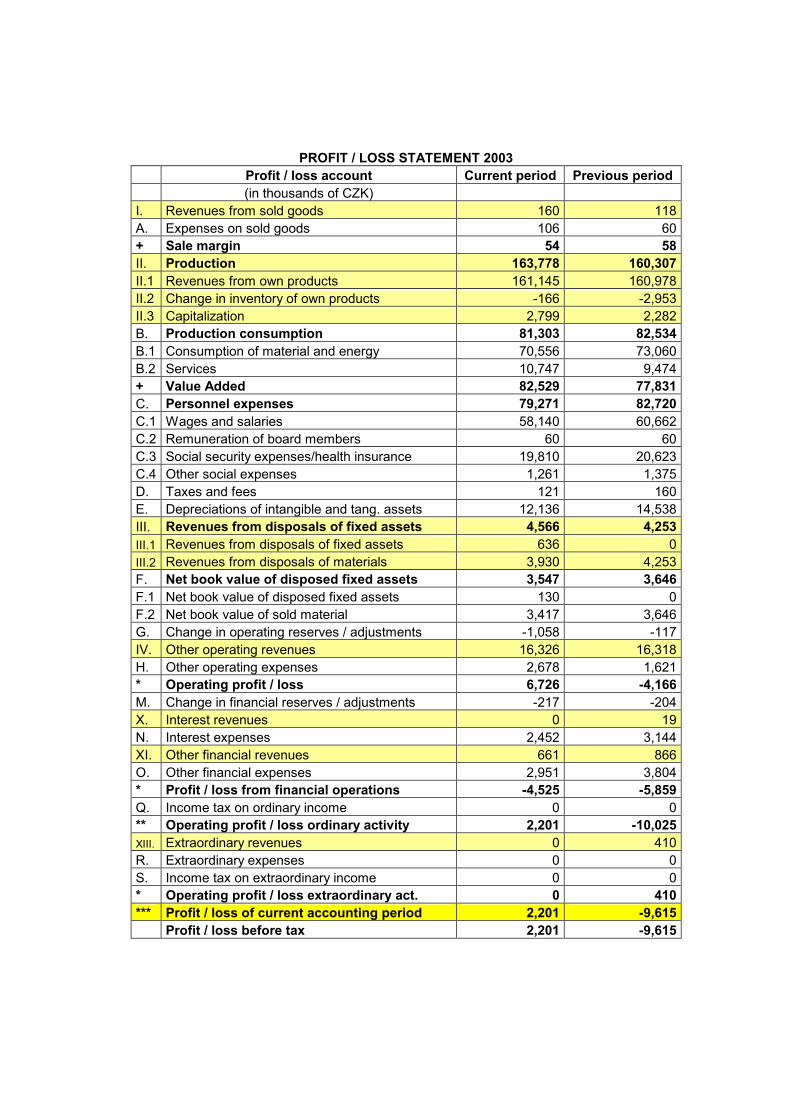
PROFIT / LOSS STATEMENT 2003
Profit / loss account Current period Previous period
(in thousands of CZK) I. Revenues from sold goods 160 118 A. Expenses on sold goods 106 60 + Sale margin 54 58
II. Production 163,778 160,307
II.1 Revenues from own products 161,145 160,978 II.2 Change in inventory of own products -166 -2,953 II.3 Capitalization 2,799 2,282 B. Production consumption 81,303 82,534
B.1 Consumption of material and energy 70,556 73,060 B.2 Services 10,747 9,474 + Value Added 82,529 77,831
C. Personnel expenses 79,271 82,720
C.1 Wages and salaries 58,140 60,662 C.2 Remuneration of board members 60 60 C.3 Social security expenses/health insurance 19,810 20,623 C.4 Other social expenses 1,261 1,375 D. Taxes and fees 121 160 E. Depreciations of intangible and tang. assets 12,136 14,538 III. Revenues from disposals of fixed assets 4,566 4,253
III.1 Revenues from disposals of fixed assets 636 0
III.2 Revenues from disposals of materials 3,930 4,253 F. Net book value of disposed fixed assets 3,547 3,646
F.1 Net book value of disposed fixed assets 130 0 F.2 Net book value of sold material 3,417 3,646 G. Change in operating reserves / adjustments -1,058 -117 IV. Other operating revenues 16,326 16,318 H. Other operating expenses 2,678 1,621 * Operating profit / loss 6,726 -4,166
M. Change in financial reserves / adjustments -217 -204 X. Interest revenues 0 19 N. Interest expenses 2,452 3,144 XI. Other financial revenues 661 866 O. Other financial expenses 2,951 3,804 * Profit / loss from financial operations -4,525 -5,859
Q. Income tax on ordinary income 0 0 ** Operating profit / loss ordinary activity 2,201 -10,025
XIII. Extraordinary revenues 0 410 R. Extraordinary expenses 0 0 S. Income tax on extraordinary income 0 0 * Operating profit / loss extraordinary act. 0 410
*** Profit / loss of current accounting period 2,201 -9,615
Profit / loss before tax 2,201 -9,615
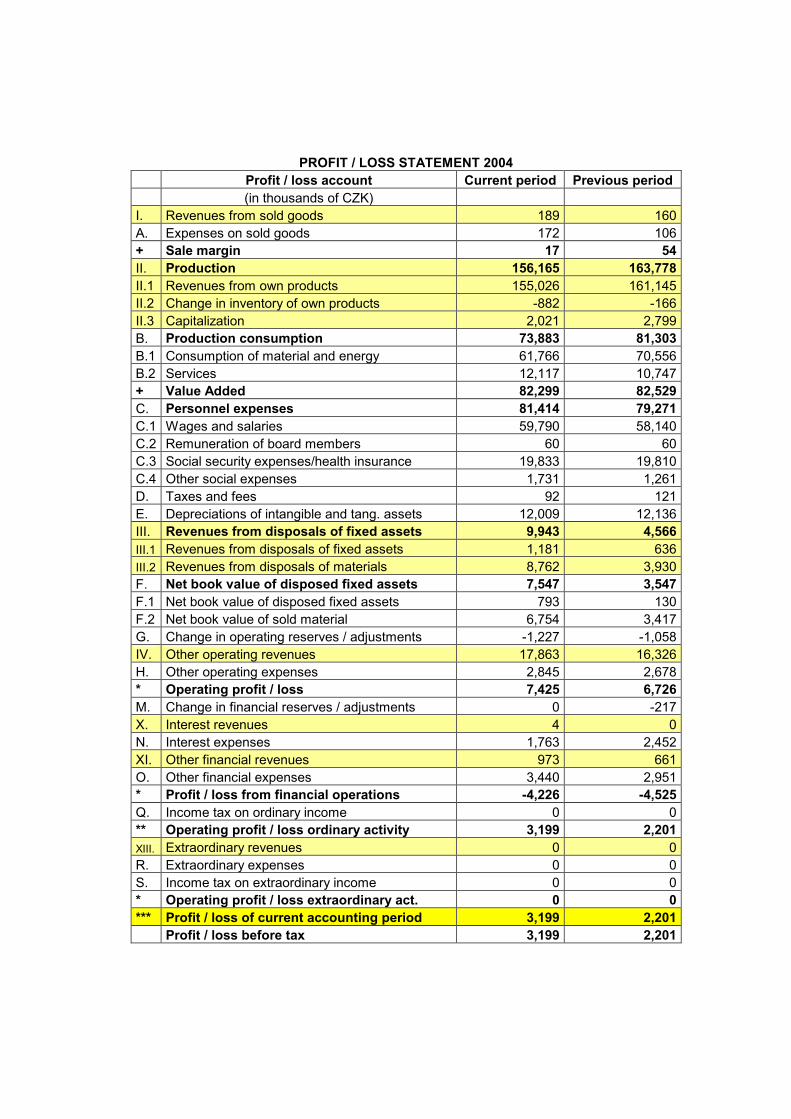
PROFIT / LOSS STATEMENT 2004
Profit / loss account Current period Previous period
(in thousands of CZK) I. Revenues from sold goods 189 160 A. Expenses on sold goods 172 106 + Sale margin 17 54
II. Production 156,165 163,778
II.1 Revenues from own products 155,026 161,145 II.2 Change in inventory of own products -882 -166 II.3 Capitalization 2,021 2,799 B. Production consumption 73,883 81,303
B.1 Consumption of material and energy 61,766 70,556 B.2 Services 12,117 10,747 + Value Added 82,299 82,529
C. Personnel expenses 81,414 79,271
C.1 Wages and salaries 59,790 58,140 C.2 Remuneration of board members 60 60 C.3 Social security expenses/health insurance 19,833 19,810 C.4 Other social expenses 1,731 1,261 D. Taxes and fees 92 121 E. Depreciations of intangible and tang. assets 12,009 12,136 III. Revenues from disposals of fixed assets 9,943 4,566
III.1 Revenues from disposals of fixed assets 1,181 636
III.2 Revenues from disposals of materials 8,762 3,930 F. Net book value of disposed fixed assets 7,547 3,547
F.1 Net book value of disposed fixed assets 793 130 F.2 Net book value of sold material 6,754 3,417 G. Change in operating reserves / adjustments -1,227 -1,058 IV. Other operating revenues 17,863 16,326 H. Other operating expenses 2,845 2,678 * Operating profit / loss 7,425 6,726
M. Change in financial reserves / adjustments 0 -217 X. Interest revenues 4 0 N. Interest expenses 1,763 2,452 XI. Other financial revenues 973 661 O. Other financial expenses 3,440 2,951 * Profit / loss from financial operations -4,226 -4,525
Q. Income tax on ordinary income 0 0 ** Operating profit / loss ordinary activity 3,199 2,201
XIII. Extraordinary revenues 0 0 R. Extraordinary expenses 0 0 S. Income tax on extraordinary income 0 0 * Operating profit / loss extraordinary act. 0 0
*** Profit / loss of current accounting period 3,199 2,201
Profit / loss before tax 3,199 2,201
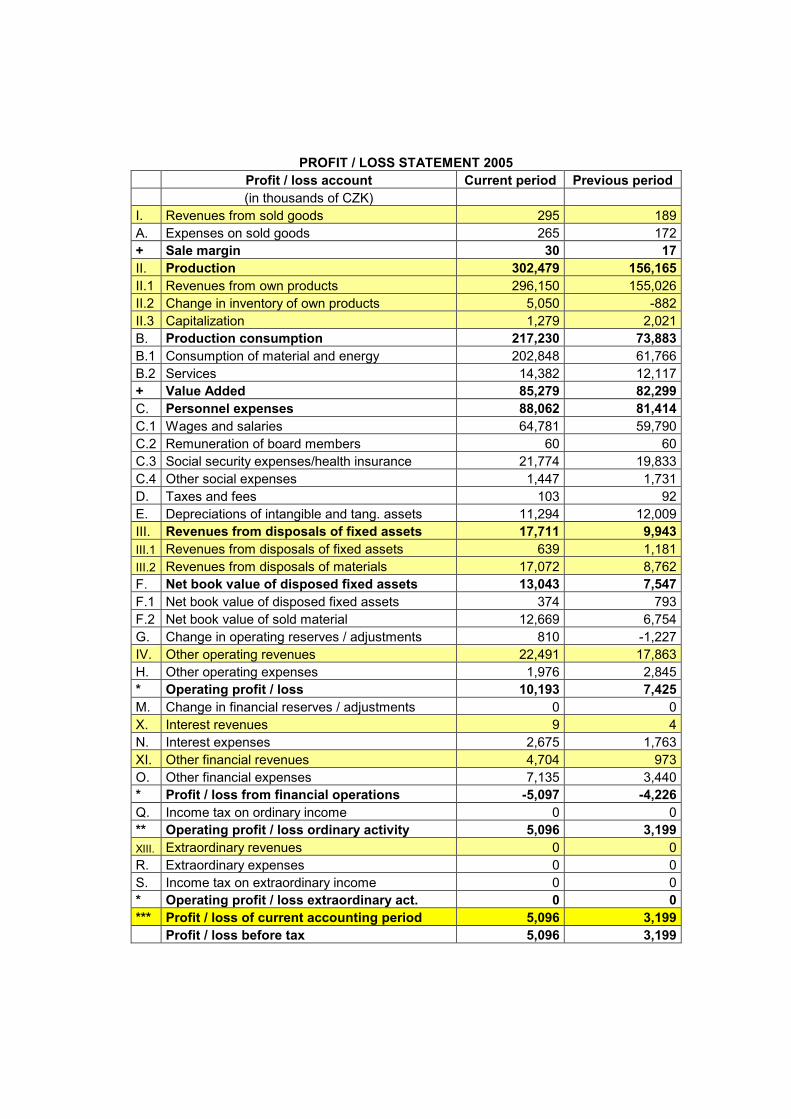
PROFIT / LOSS STATEMENT 2005
Profit / loss account Current period Previous period
(in thousands of CZK) I. Revenues from sold goods 295 189 A. Expenses on sold goods 265 172 + Sale margin 30 17
II. Production 302,479 156,165
II.1 Revenues from own products 296,150 155,026 II.2 Change in inventory of own products 5,050 -882 II.3 Capitalization 1,279 2,021 B. Production consumption 217,230 73,883
B.1 Consumption of material and energy 202,848 61,766 B.2 Services 14,382 12,117 + Value Added 85,279 82,299
C. Personnel expenses 88,062 81,414
C.1 Wages and salaries 64,781 59,790 C.2 Remuneration of board members 60 60 C.3 Social security expenses/health insurance 21,774 19,833 C.4 Other social expenses 1,447 1,731 D. Taxes and fees 103 92 E. Depreciations of intangible and tang. assets 11,294 12,009 III. Revenues from disposals of fixed assets 17,711 9,943
III.1 Revenues from disposals of fixed assets 639 1,181
III.2 Revenues from disposals of materials 17,072 8,762 F. Net book value of disposed fixed assets 13,043 7,547
F.1 Net book value of disposed fixed assets 374 793 F.2 Net book value of sold material 12,669 6,754 G. Change in operating reserves / adjustments 810 -1,227 IV. Other operating revenues 22,491 17,863 H. Other operating expenses 1,976 2,845 * Operating profit / loss 10,193 7,425
M. Change in financial reserves / adjustments 0 0 X. Interest revenues 9 4 N. Interest expenses 2,675 1,763 XI. Other financial revenues 4,704 973 O. Other financial expenses 7,135 3,440 * Profit / loss from financial operations -5,097 -4,226
Q. Income tax on ordinary income 0 0 ** Operating profit / loss ordinary activity 5,096 3,199
XIII. Extraordinary revenues 0 0 R. Extraordinary expenses 0 0 S. Income tax on extraordinary income 0 0 * Operating profit / loss extraordinary act. 0 0
*** Profit / loss of current accounting period 5,096 3,199
Profit / loss before tax 5,096 3,199
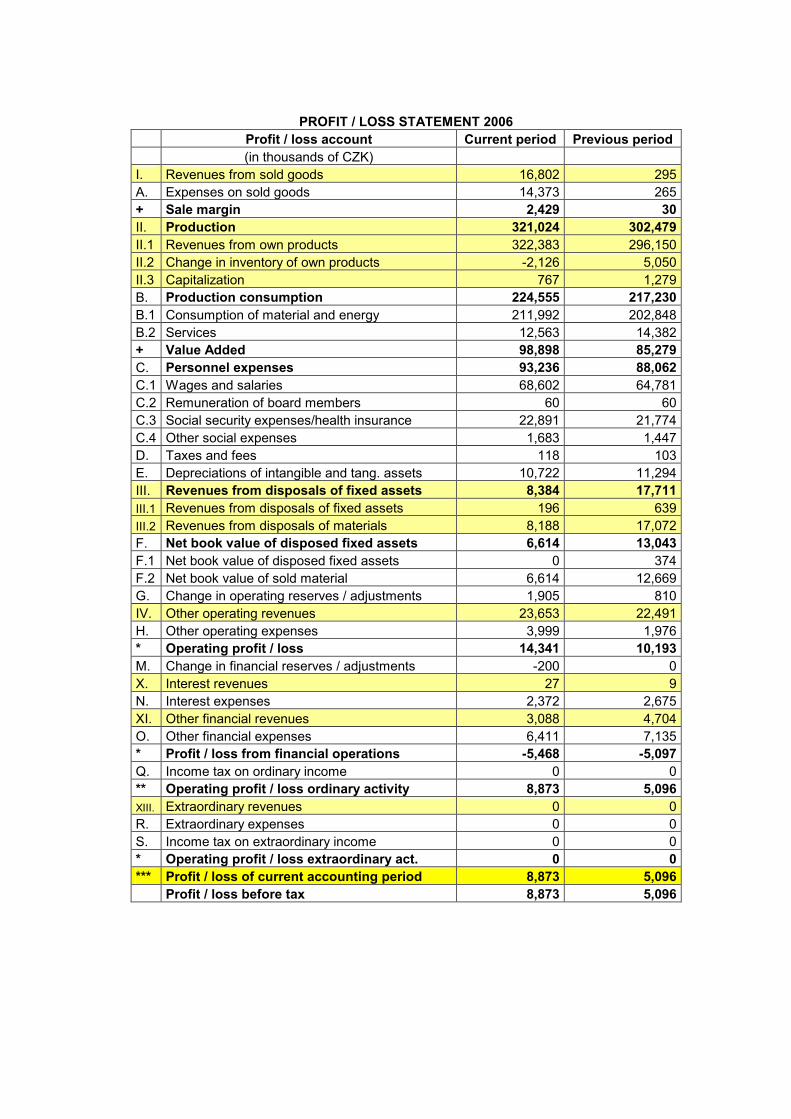
PROFIT / LOSS STATEMENT 2006
Profit / loss account Current period Previous period
(in thousands of CZK) I. Revenues from sold goods 16,802 295 A. Expenses on sold goods 14,373 265 + Sale margin 2,429 30
II. Production 321,024 302,479
II.1 Revenues from own products 322,383 296,150 II.2 Change in inventory of own products -2,126 5,050 II.3 Capitalization 767 1,279 B. Production consumption 224,555 217,230
B.1 Consumption of material and energy 211,992 202,848 B.2 Services 12,563 14,382 + Value Added 98,898 85,279
C. Personnel expenses 93,236 88,062
C.1 Wages and salaries 68,602 64,781 C.2 Remuneration of board members 60 60 C.3 Social security expenses/health insurance 22,891 21,774 C.4 Other social expenses 1,683 1,447 D. Taxes and fees 118 103 E. Depreciations of intangible and tang. assets 10,722 11,294 III. Revenues from disposals of fixed assets 8,384 17,711
III.1 Revenues from disposals of fixed assets 196 639
III.2 Revenues from disposals of materials 8,188 17,072 F. Net book value of disposed fixed assets 6,614 13,043
F.1 Net book value of disposed fixed assets 0 374 F.2 Net book value of sold material 6,614 12,669 G. Change in operating reserves / adjustments 1,905 810 IV. Other operating revenues 23,653 22,491 H. Other operating expenses 3,999 1,976 * Operating profit / loss 14,341 10,193
M. Change in financial reserves / adjustments -200 0 X. Interest revenues 27 9 N. Interest expenses 2,372 2,675 XI. Other financial revenues 3,088 4,704 O. Other financial expenses 6,411 7,135 * Profit / loss from financial operations -5,468 -5,097
Q. Income tax on ordinary income 0 0 ** Operating profit / loss ordinary activity 8,873 5,096
XIII. Extraordinary revenues 0 0 R. Extraordinary expenses 0 0 S. Income tax on extraordinary income 0 0 * Operating profit / loss extraordinary act. 0 0
*** Profit / loss of current accounting period 8,873 5,096
Profit / loss before tax 8,873 5,096