Embed Size (px)
Citation preview
101c2 Empirically-Derived Production Limits Introduction
Baker SA 101c2 2015 Data Summary 12.15.15.Doc PUGET SOUND ENERGY 15 December 2015 Baker River Hydroelectric Project Page 1
1.0 Introduction
SA 101(c)(2) Empirically-Derived Production Estimates PSE implemented a study approach in April 2013 for monitoring adult returns and the size and number of outmigrating smolts to provide feedback on basin sockeye production limits. PSE developed the study approach in collaboration with the ARG in response to Settlement Agreement Article 101(c)(2). Baker Basin sockeye smolt production limits can be monitored from an analysis of empirically derived data which will help establish fry production goals until a practical limit is achieved. The empirical approach is fundamental and minimizes the need for complex statistical analyses by relying on observation and comparing annual trends in data; adult and smolt data collection consists of sockeye number, frequency, smolt length, and smolt weight. The phased approach uses these numerical and morphological data to monitor density-dependent responses to increased fry production and provide feedback on basin sockeye production limits.
This approach was developed for implementation of SA 101(c)(2) and utilizes available data collection and monitoring methods to look for indicators of density dependence and if feasible use the information to guide future hatchery fry releases. Over time, comparison of smolt data will disclose the trends and relationships for indication of density dependence in the form of reduced smolt size, condition, or other characteristics that ultimately influence survival to adult. This is a long term effort that will monitor system feedback during phases of fry production. Documentation will be included in the SA 101 annual report provided to the ARG and FERC as part of reporting requirements described in SA 102 Aquatics Reporting. The study approach (April 8, 2013) was approved by the ARG and implemented beginning with the 2013 outmigration season.
ARTICLE 101(C)(2)
EMPIRICALLY-DERIVED PRODUCTION LIMITS FOR SOCKEYE SALMON IN THE BAKER RIVER BASIN
Aquatic Resources Group
2015 Data Collection Results
December 2015
101c2 Empirically-Derived Production Limits Empirical Data Monitoring and Analyses
Baker SA 101c2 2015 Data Summary 12.15.15.Doc PUGET SOUND ENERGY 15 December 2015 Baker River Hydroelectric Project Page 2
1.1 Schedule At the conclusion of each outmigration season a data summary will be presented to the ARG. Data collected, such as adult returns, fry production, smolt outmigrants, lengths, condition factors, and if collected- percent dry weights, will be reported annually according to the reporting schedule in SA 102. As monitoring continues, new data can be compared to baseline (2010-2012) data.
1.2 Annual Updates This report represents the 2015 data summary. The 2013 (first year), and 2014 data summary for SA 101(c)(2) was provided to the ARG and reported in corresponding SA 101 annual reports provided to the FERC according to the reporting schedule in SA 102.
2.0 Empirical Data Monitoring and Analyses
2.1 Numerical Empirical Data Monitoring the numerical response to increased fry production is included in this approach. Relationships between the number of fry produced, the number of smolts that outmigrate, and the number that return as adults are metrics that can be achieved by simply counting and comparing over time; limits to these relationships can be tested by increasing the number of fry until the number of smolts, and ultimately adult returns, is maximized. Morphological metrics such as length and condition are secondary, because decreases may be a viable tradeoff for increased production.
The upper limits to these relationships are unknown for the Baker system, and the approach for increasing sockeye fry capacity from production limits ultimately is linked to evaluating long-term trends in fry to smolt, and smolt to adult recruitment. The lower limits can be observed by recent record high outmigration and adult return numbers.
The Baker fish passage and fish production facilities provide an opportunity to enumerate all fry that are released, all outmigrating smolts, and a count of returning adults that when combined with harvest numbers, provide a means to evaluate production from fry to both the smolt and adult stage. The approach to monitoring these data includes annual accounting of the empirical data recorded in tables 1 - 4. Morphological Empirical Data
2.2 Morphological Empirical Data
Smolt Length and Weight Data The Upper Baker and Lower Baker FSC provide an opportunity to collect a sample of outmigrating juvenile sockeye salmon. The approach for monitoring morphological data is to use juvenile sockeye size and condition information available from the downstream passage sampling operation to track trends or changes from baseline years, and by monitoring these changes, gain insight into system production and limits to fry production. A ratio of smolt length and weight is calculated in a formula known as “Coefficient of Condition of Fish” (100,000Weight/Length3) or “K factor”. The relative robustness of a fish is expressed by K, and variations in a fish’s K factor may reflect both the quantity and quality of food consumed. Intercohort variability in average smolt
101c2 Empirically-Derived Production Limits Empirical Data Monitoring and Analyses
Baker SA 101c2 2015 Data Summary 12.15.15.Doc PUGET SOUND ENERGY 15 December 2015 Baker River Hydroelectric Project Page 3
length or K factor may be used as indicators to monitor for emerging density-dependent trends. As competitive processes limit food consumption, average length and condition will decrease as the population trends toward carrying capacity. Comparison of K factors provides an efficient and non-lethal method of monitoring trends in fish condition.
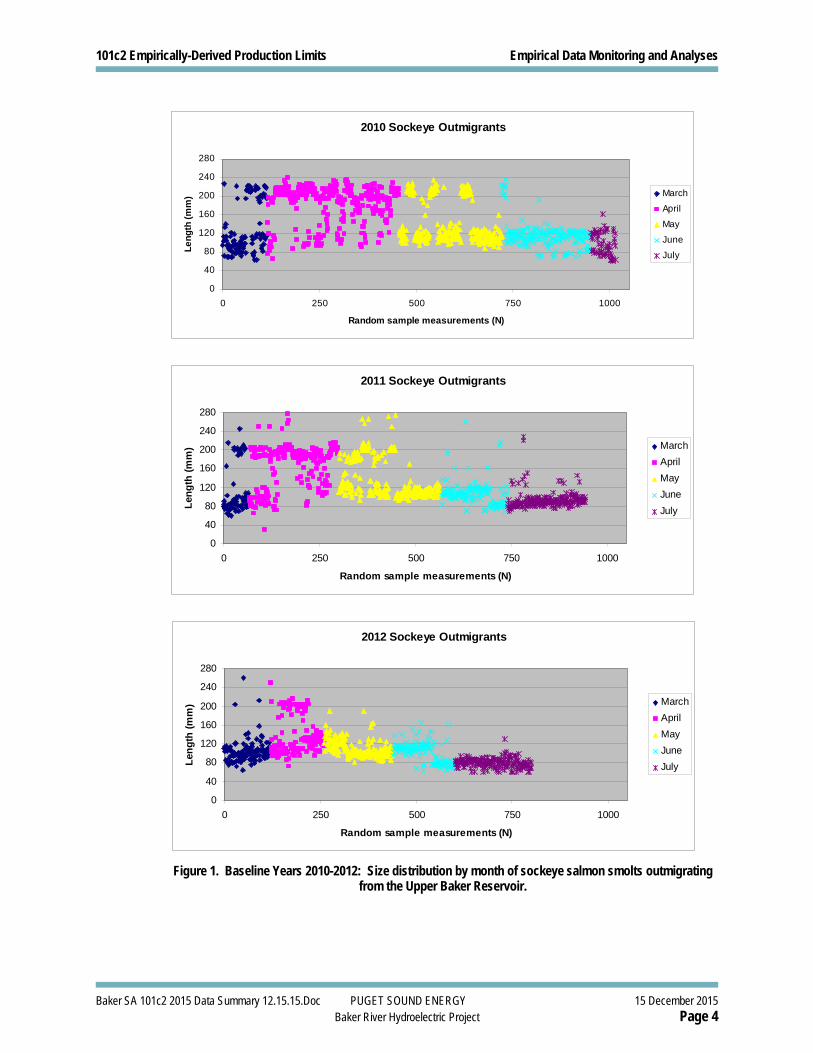
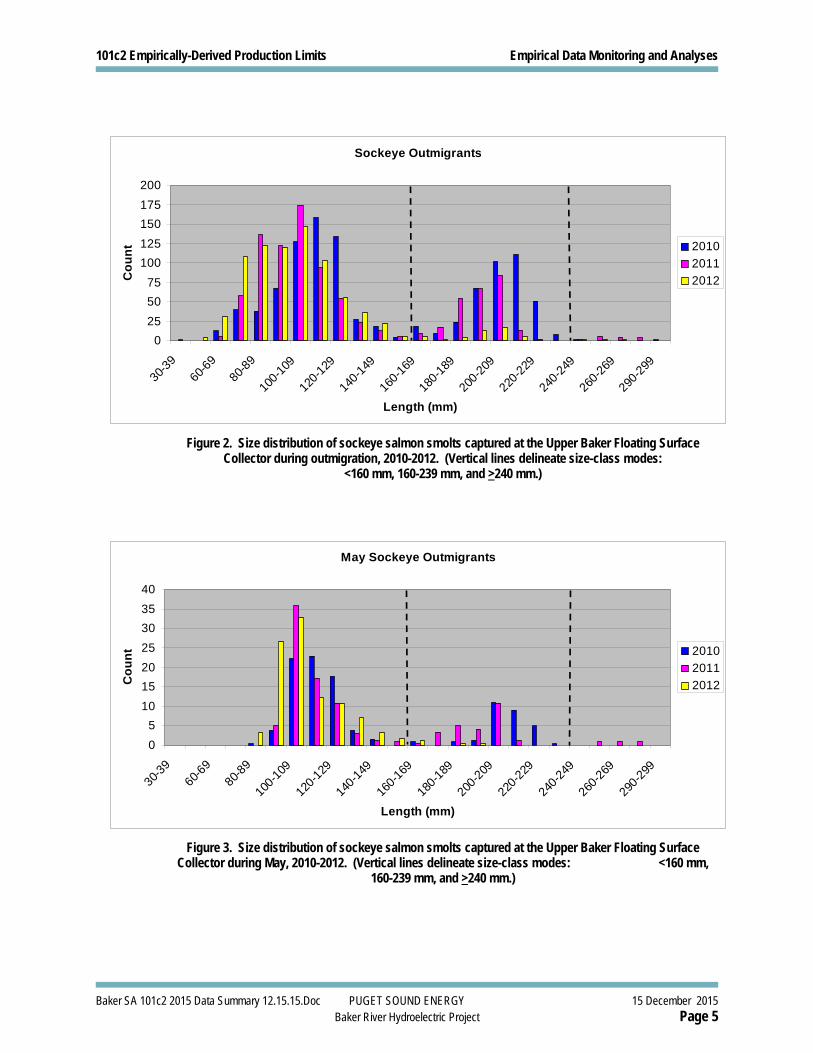
Seasonal size-distribution of outmigrants For the baseline years (2010-2012 sockeye outmigrations), three very distinct size classes were evident (figures 2, 3). Modes at approximately 160 mm and 240 mm suggested that most age-1 smolts were less than 160 mm and most age-2 smolts were between 160 and 240 mm. The percentage of smolts outmigrating at sizes greater than 240 mm was relatively low, but this largest size-class likely represented age-3 and older cohorts. Furthermore, these three size-classes segregated seasonally (figure 1).
101c2 Empirically-Derived Production Limits Empirical Data Monitoring and Analyses
Baker SA 101c2 2015 Data Summary 12.15.15.Doc PUGET SOUND ENERGY 15 December 2015 Baker River Hydroelectric Project Page 4
Figure 1. Baseline Years 2010-2012: Size distribution by month of sockeye salmon smolts outmigrating
from the Upper Baker Reservoir.
2010 Sockeye Outmigrants
0
40
80
120
160
200
240
280
0 250 500 750 1000
Random sample measurements (N)
Le
ng
th (
mm
) March
April
May
June
July
2011 Sockeye Outmigrants
0
40
80
120
160
200
240
280
0 250 500 750 1000
Random sample measurements (N)
Len
gth
(m
m) March
April
May
June
July
2012 Sockeye Outmigrants
0
40
80
120
160
200
240
280
0 250 500 750 1000
Random sample measurements (N)
Len
gth
(m
m) March
April
May
June
July
101c2 Empirically-Derived Production Limits Empirical Data Monitoring and Analyses
Baker SA 101c2 2015 Data Summary 12.15.15.Doc PUGET SOUND ENERGY 15 December 2015 Baker River Hydroelectric Project Page 5
Sockeye Outmigrants
0
25
50
75
100
125
150
175
200
30-3
9
60-6
9
80-8
9
100-
109
120-
129
140-
149
160-
169
180-
189
200-
209
220-
229
240-
249
260-
269
290-
299
Length (mm)
Co
un
t 2010
2011
2012
Figure 2. Size distribution of sockeye salmon smolts captured at the Upper Baker Floating Surface
Collector during outmigration, 2010-2012. (Vertical lines delineate size-class modes: <160 mm, 160-239 mm, and >240 mm.)
May Sockeye Outmigrants
0
5
10
15
20
25
30
35
40
30-3
9
60-6
9
80-8
9
100-
109
120-
129
140-
149
160-
169
180-
189
200-
209
220-
229
240-
249
260-
269
290-
299
Length (mm)
Co
un
t 2010
2011
2012
Figure 3. Size distribution of sockeye salmon smolts captured at the Upper Baker Floating Surface Collector during May, 2010-2012. (Vertical lines delineate size-class modes: <160 mm,
160-239 mm, and >240 mm.)
101c2 Empirically-Derived Production Limits Empirical Data Monitoring and Analyses
Baker SA 101c2 2015 Data Summary 12.15.15.Doc PUGET SOUND ENERGY 15 December 2015 Baker River Hydroelectric Project Page 6
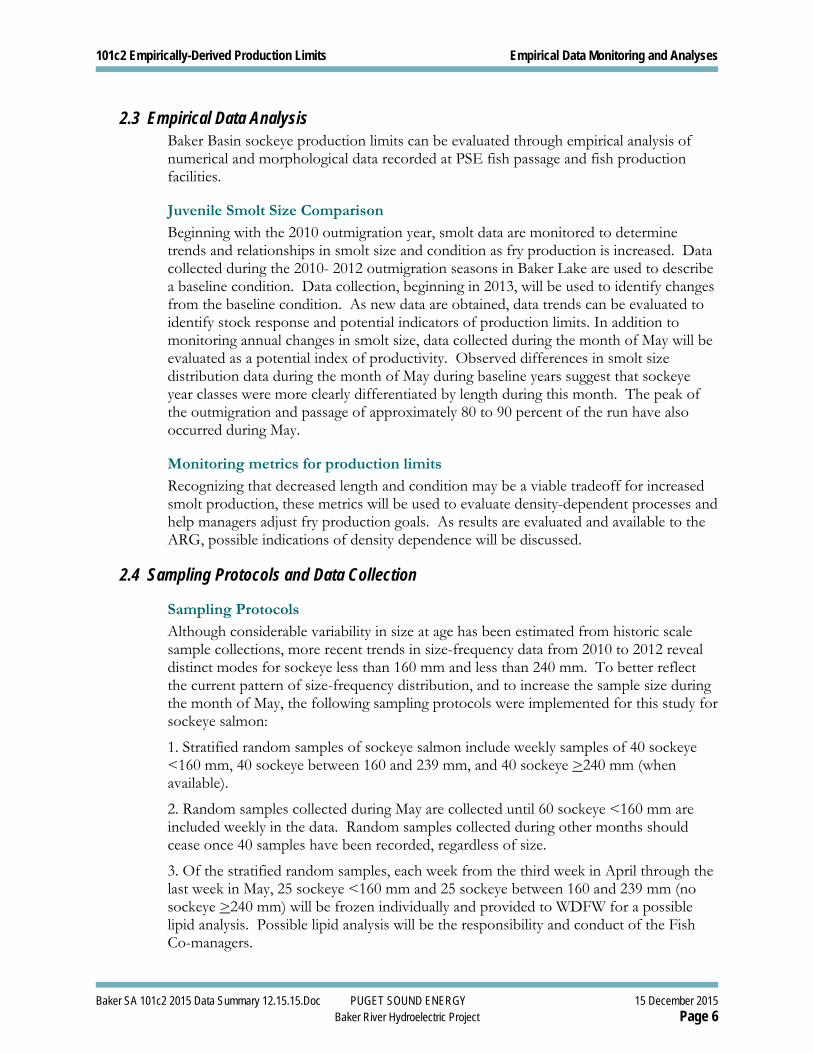
2.3 Empirical Data Analysis Baker Basin sockeye production limits can be evaluated through empirical analysis of numerical and morphological data recorded at PSE fish passage and fish production facilities.
Juvenile Smolt Size Comparison
Beginning with the 2010 outmigration year, smolt data are monitored to determine trends and relationships in smolt size and condition as fry production is increased. Data collected during the 2010- 2012 outmigration seasons in Baker Lake are used to describe a baseline condition. Data collection, beginning in 2013, will be used to identify changes from the baseline condition. As new data are obtained, data trends can be evaluated to identify stock response and potential indicators of production limits. In addition to monitoring annual changes in smolt size, data collected during the month of May will be evaluated as a potential index of productivity. Observed differences in smolt size distribution data during the month of May during baseline years suggest that sockeye year classes were more clearly differentiated by length during this month. The peak of the outmigration and passage of approximately 80 to 90 percent of the run have also occurred during May.
Monitoring metrics for production limits
Recognizing that decreased length and condition may be a viable tradeoff for increased smolt production, these metrics will be used to evaluate density-dependent processes and help managers adjust fry production goals. As results are evaluated and available to the ARG, possible indications of density dependence will be discussed.
2.4 Sampling Protocols and Data Collection
Sampling Protocols
Although considerable variability in size at age has been estimated from historic scale sample collections, more recent trends in size-frequency data from 2010 to 2012 reveal distinct modes for sockeye less than 160 mm and less than 240 mm. To better reflect the current pattern of size-frequency distribution, and to increase the sample size during the month of May, the following sampling protocols were implemented for this study for sockeye salmon:
1. Stratified random samples of sockeye salmon include weekly samples of 40 sockeye <160 mm, 40 sockeye between 160 and 239 mm, and 40 sockeye >240 mm (when available).
2. Random samples collected during May are collected until 60 sockeye <160 mm are included weekly in the data. Random samples collected during other months should cease once 40 samples have been recorded, regardless of size.
3. Of the stratified random samples, each week from the third week in April through the last week in May, 25 sockeye <160 mm and 25 sockeye between 160 and 239 mm (no sockeye >240 mm) will be frozen individually and provided to WDFW for a possible lipid analysis. Possible lipid analysis will be the responsibility and conduct of the Fish Co-managers.
101c2 Empirically-Derived Production Limits Empirical Data Monitoring and Analyses
Baker SA 101c2 2015 Data Summary 12.15.15.Doc PUGET SOUND ENERGY 15 December 2015 Baker River Hydroelectric Project Page 7
Upstream, Downstream Trap Counts and Fry Production
Puget Sound Energy will continue to monitor fry production from returning broodstock and subsequent smolt production, relying upon observation and comparing counts derived from the Baker upstream and downstream and hatchery production. The empirical approach is fundamental and minimizes the need for complex statistical analyses; it consists primarily of developing trends from fish counts and production with data collection that consists of sockeye number, frequency, smolt length, and smolt weight. The approach also provides a means to recognize emerging trends within a historical context for the data.
2.5 Annual Update - Results of Data Monitoring and Analysis for 2015
Metrics
Annual morphological empirical data are monitored relative to baseline years (2010-2012) for the following:
1. Condition factor of sockeye smolts
These data are presented by date and separately for the month of May. Average condition factors are analyzed for three size groups: <160 mm, 160-239 mm, and >239 mm. Trends in average condition factor will be used to monitor for indication of system stress and potential limits to smolt production.
Results are shown as graphs in Figures 5, 8, 10, 13, 15, 17, 19, 21, and 23:
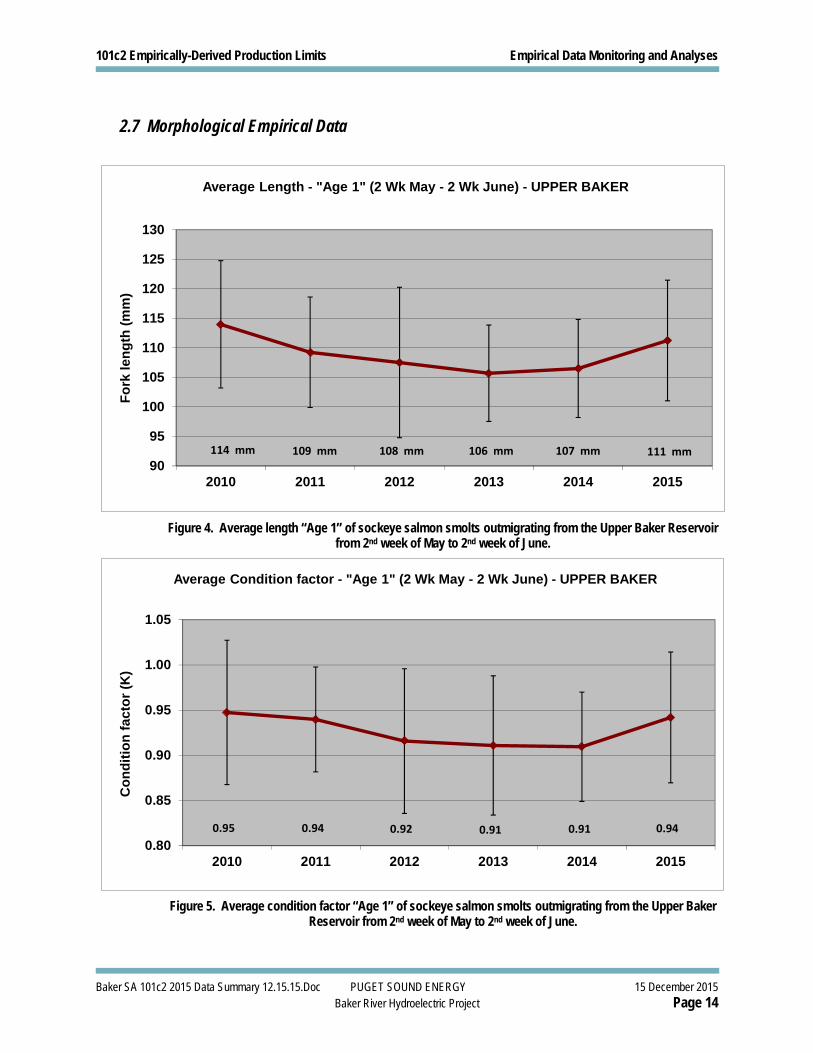
(5) 2010-2015 average condition factor “Age 1” of sockeye smolts outmigrating from Upper Baker Reservoir from 2nd week of May to 2nd week of June
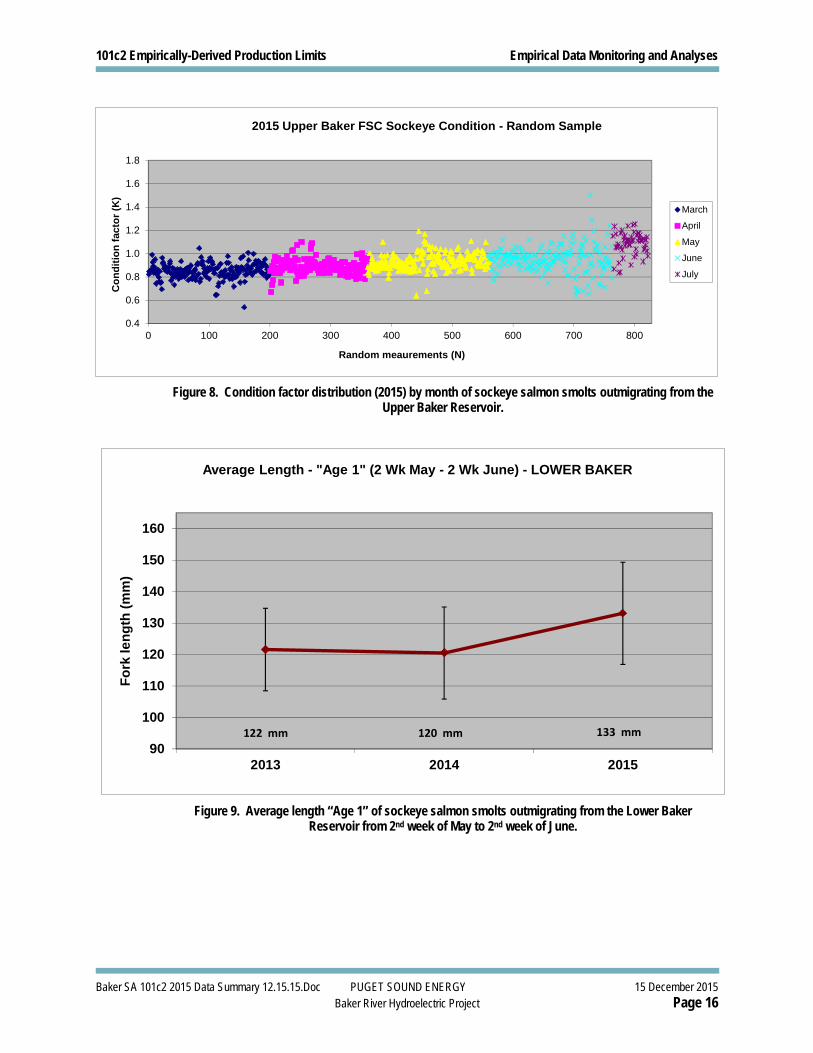
(8) Condition factor distribution (2015) by month of sockeye smolts outmigrating from Upper Baker Reservoir
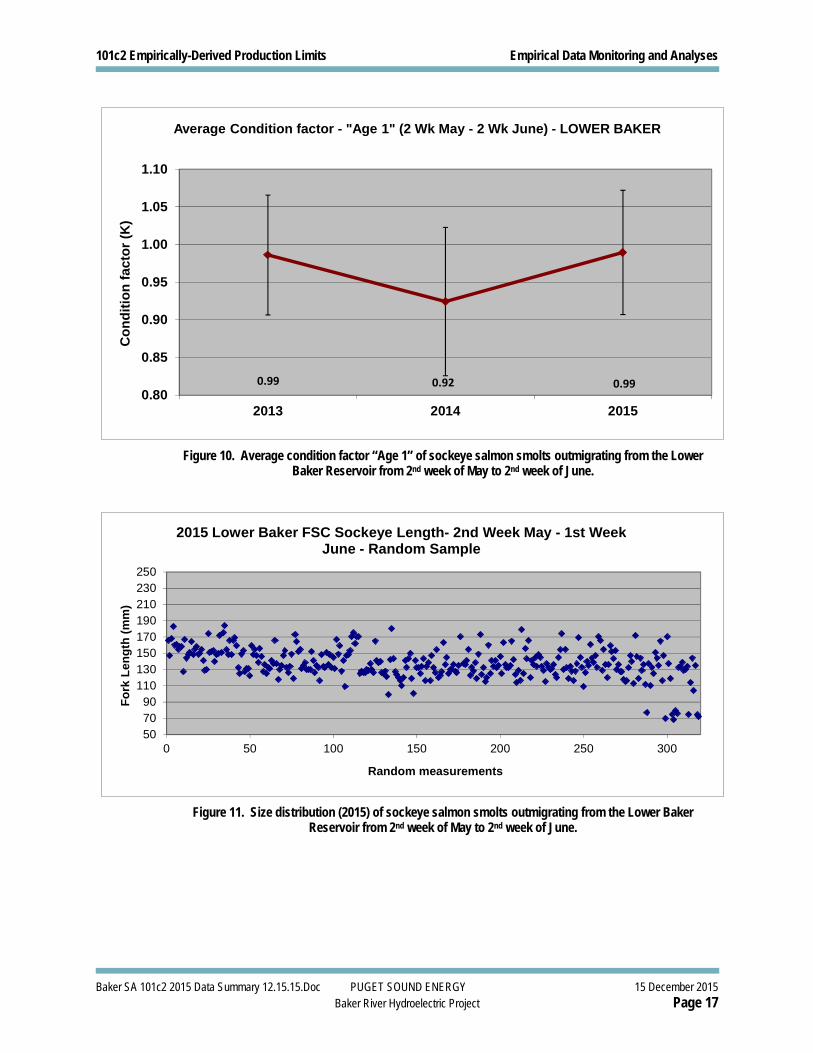
(10) 2013-2015 average condition factor “Age 1” of sockeye smolts outmigrating from Lower Baker Reservoir from 2nd week of May to 2nd week of June
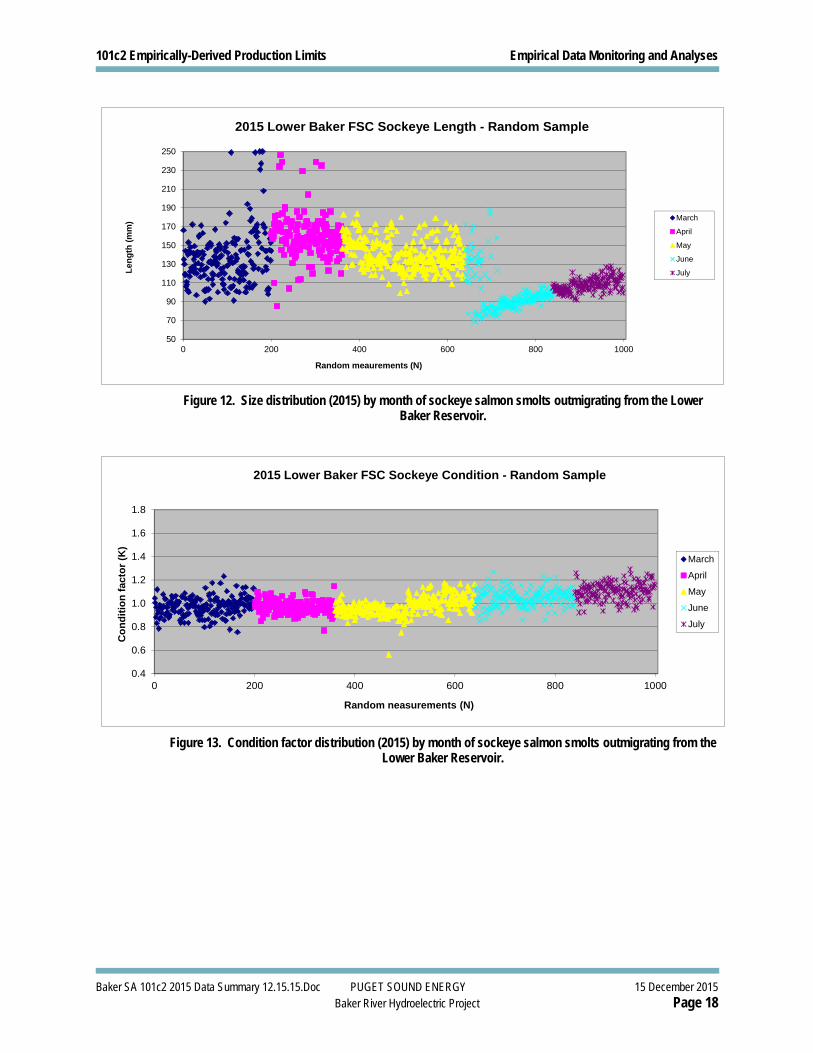
(13) Condition factor distribution (2015) by month of sockeye smolts outmigrating from Lower Baker Reservoir
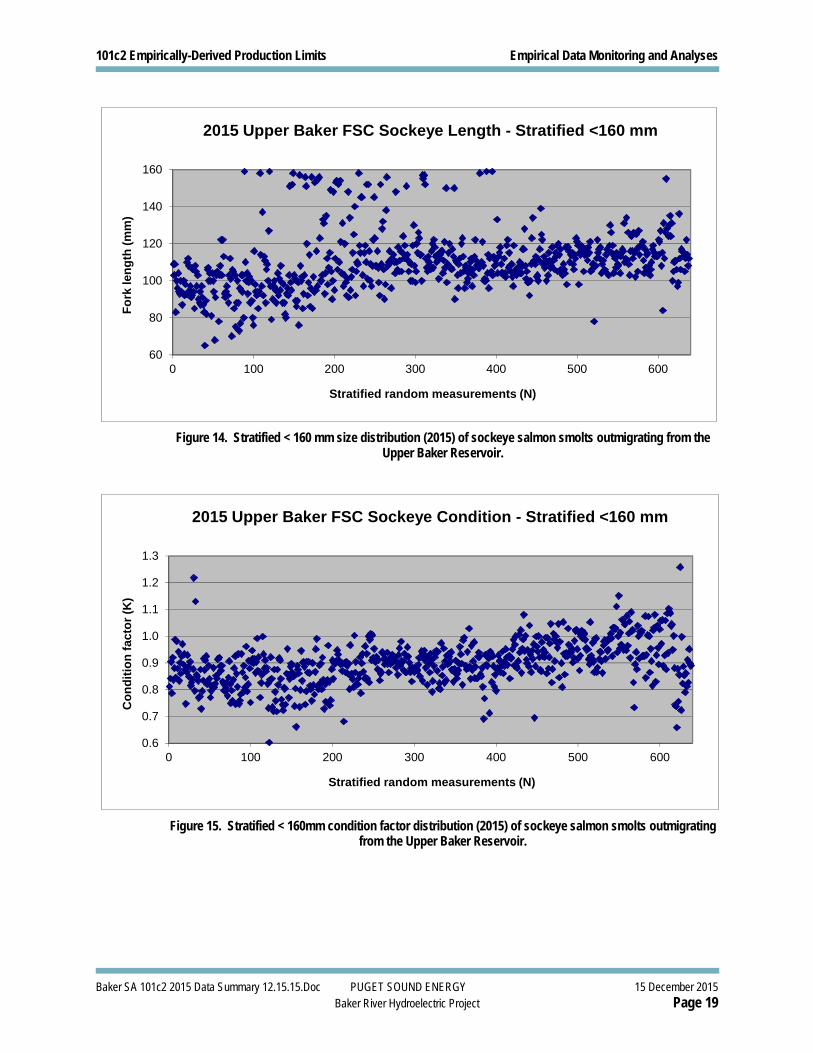
(15) Stratified <160 mm condition factor distribution (2015) of sockeye smolts outmigrating from Upper Baker Reservoir
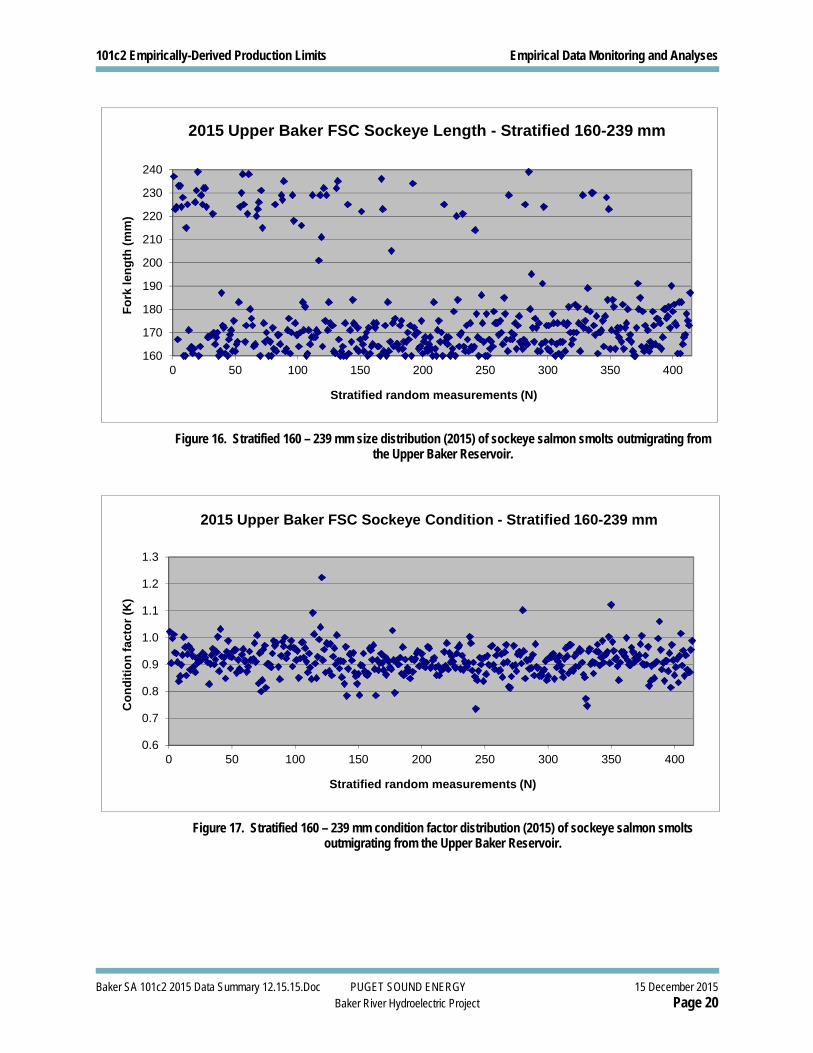
(17) Stratified 160-239 mm condition factor distribution (2015) of sockeye smolts outmigrating from Upper Baker Reservoir
There were only 5 sockeye for the >239 mm strata, so this strata was not graphed
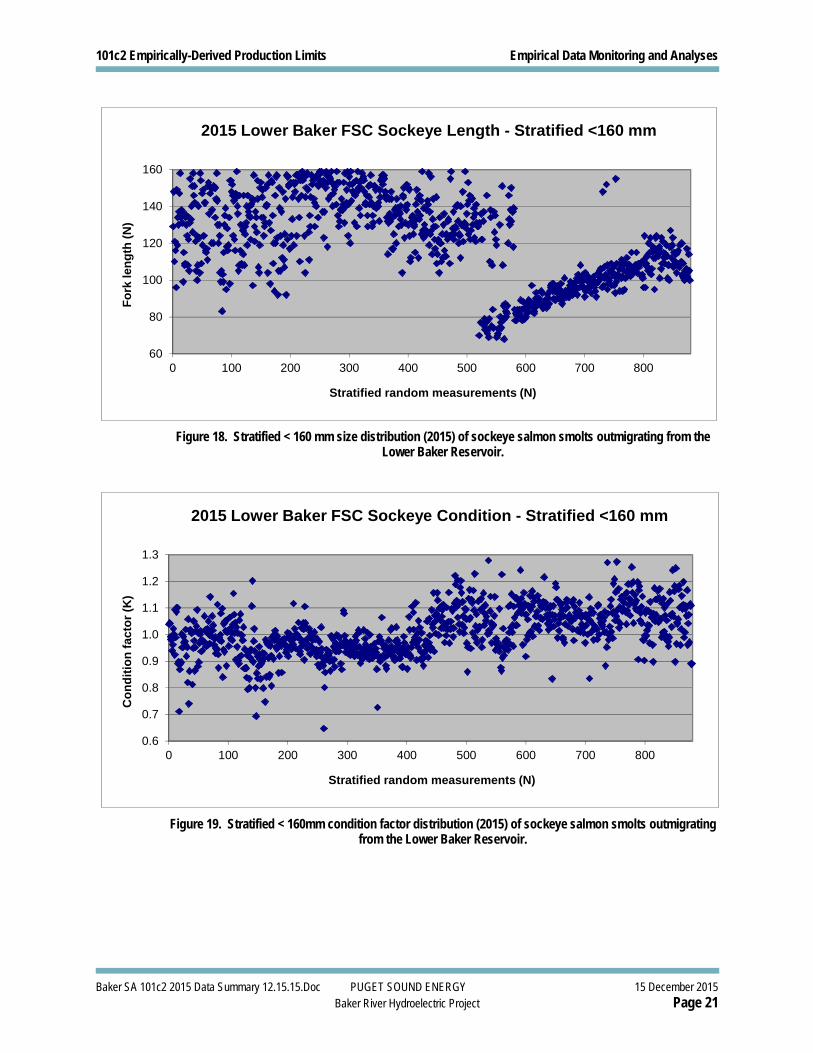
(19) Stratified <160 mm condition factor distribution (2015) of sockeye smolts outmigrating from Lower Baker Reservoir
101c2 Empirically-Derived Production Limits Empirical Data Monitoring and Analyses
Baker SA 101c2 2015 Data Summary 12.15.15.Doc PUGET SOUND ENERGY 15 December 2015 Baker River Hydroelectric Project Page 8
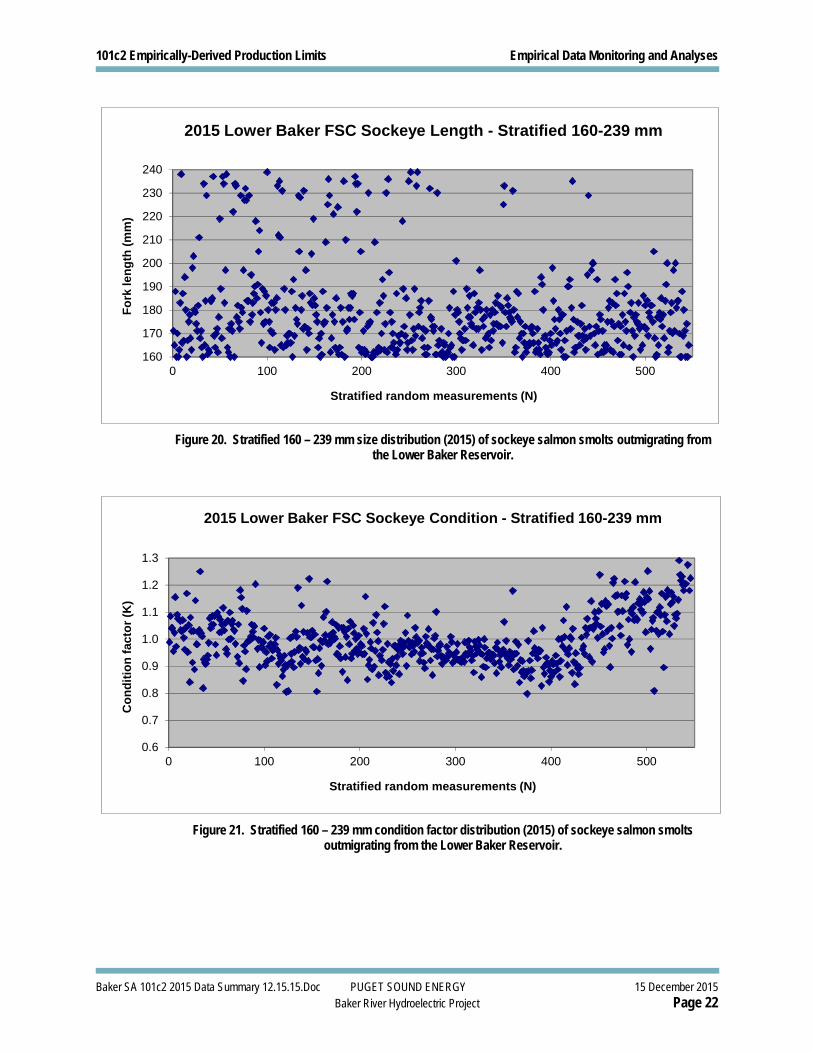
(21) Stratified 160-239 mm condition factor distribution (2015) of sockeye smolts outmigrating from Lower Baker Reservoir
(23) Stratified >239 mm condition factor distribution (2015) of sockeye smolts outmigrating from Lower Baker Reservoir.
2. Length of sockeye smolts
These data are presented by date and separately for the month of May. Average lengths are analyzed for three size groups: <160 mm, 160-239 mm, and >240 mm. Trends in average length will be used to monitor for indication of system stress and potential limits to smolt production.
Results are shown as graphs in Figures 4, 6, 7, 9, 11, 12, 14, 16, 18, 20, and 22:
(4) 2010-2015 average length “Age 1” of sockeye smolts outmigrating from Upper Baker Reservoir from 2nd week of May to 2nd week of June
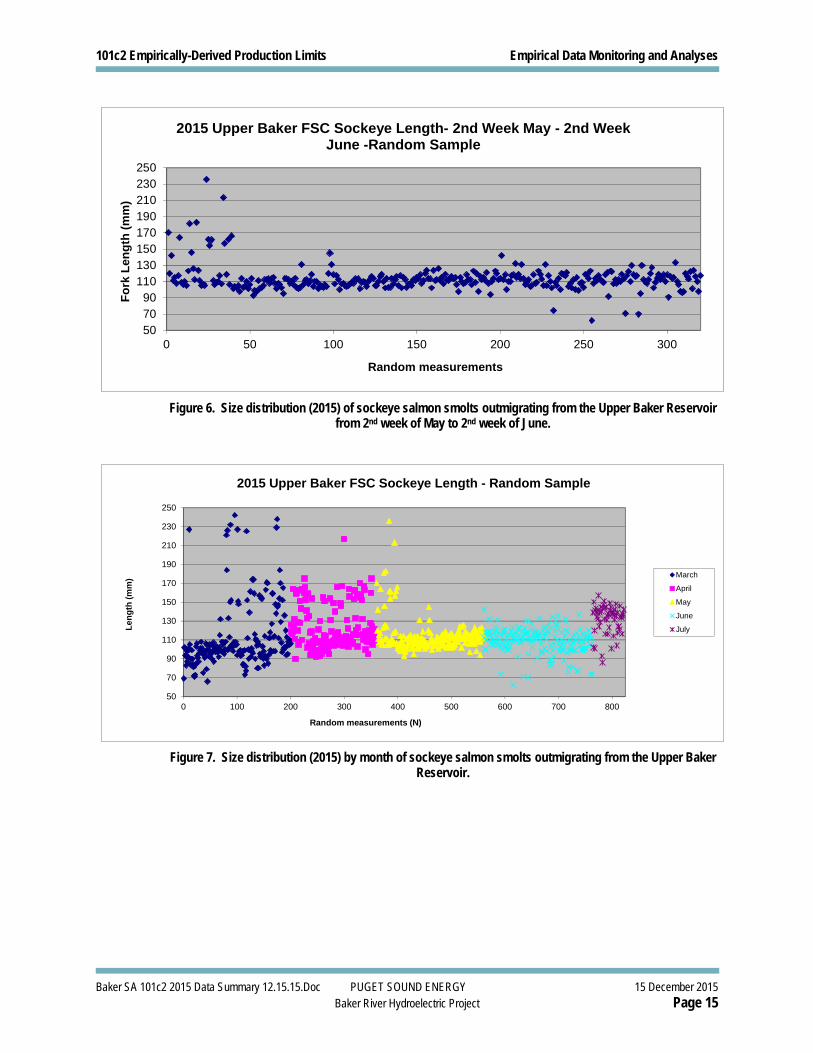
(6) Size distribution (2015) of sockeye smolts outmigrating from Upper Baker Reservoir from 2nd week of May to 2nd week of June
(7) Size distribution (2015) by month of sockeye smolts outmigrating from Upper Baker Reservoir
(9) 2013-2015 average length “Age 1” of sockeye smolts outmigrating from Lower Baker Reservoir from 2nd week of May to 2nd week of June
(11) Size distribution (2015) of sockeye smolts outmigrating from Lower Baker Reservoir from 2nd week of May to 2nd week of June
(12) Size distribution (2015) by month of sockeye smolts outmigrating from Lower Baker Reservoir
(14) Stratified <160 mm size distribution (2015) of sockeye smolts outmigrating from Upper Baker Reservoir
(16) Stratified 160-239 mm size distribution (2015) of sockeye smolts outmigrating from Upper Baker Reservoir
There were only 5 sockeye for the >239 mm strata, so this strata was not graphed
(18) Stratified <160 mm size distribution (2015) of sockeye smolts outmigrating from Lower Baker Reservoir
(20) Stratified 160-239 mm size distribution (2015) of sockeye smolts outmigrating from Lower Baker Reservoir
(22) Stratified >239 mm size distribution (2015) of sockeye smolts outmigrating from Lower Baker Reservoir.
Annual numerical empirical data are monitored for the following:
101c2 Empirically-Derived Production Limits Empirical Data Monitoring and Analyses
Baker SA 101c2 2015 Data Summary 12.15.15.Doc PUGET SOUND ENERGY 15 December 2015 Baker River Hydroelectric Project Page 9
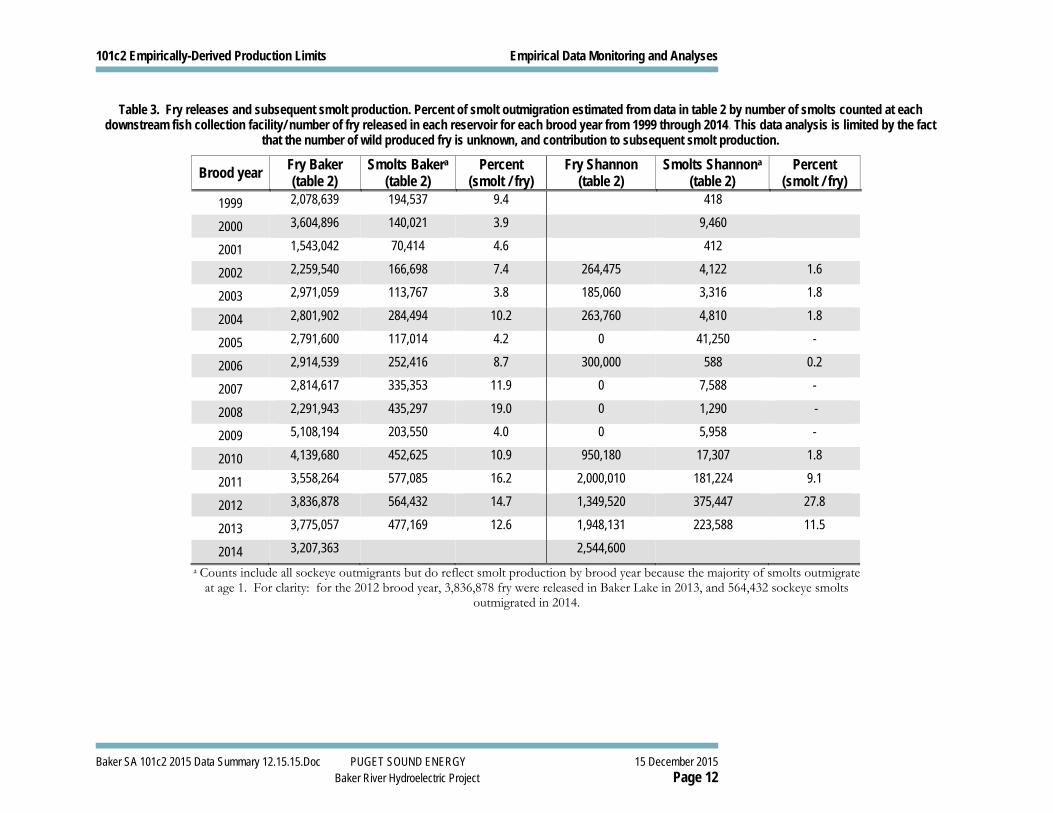
3. Fry releases and subsequent smolt production (Results shown in Table 3)
Percent of smolt outmigration are estimated from data in table 2 by the number of smolts counted at each downstream fish collection facility/number of fry released in each reservoir.
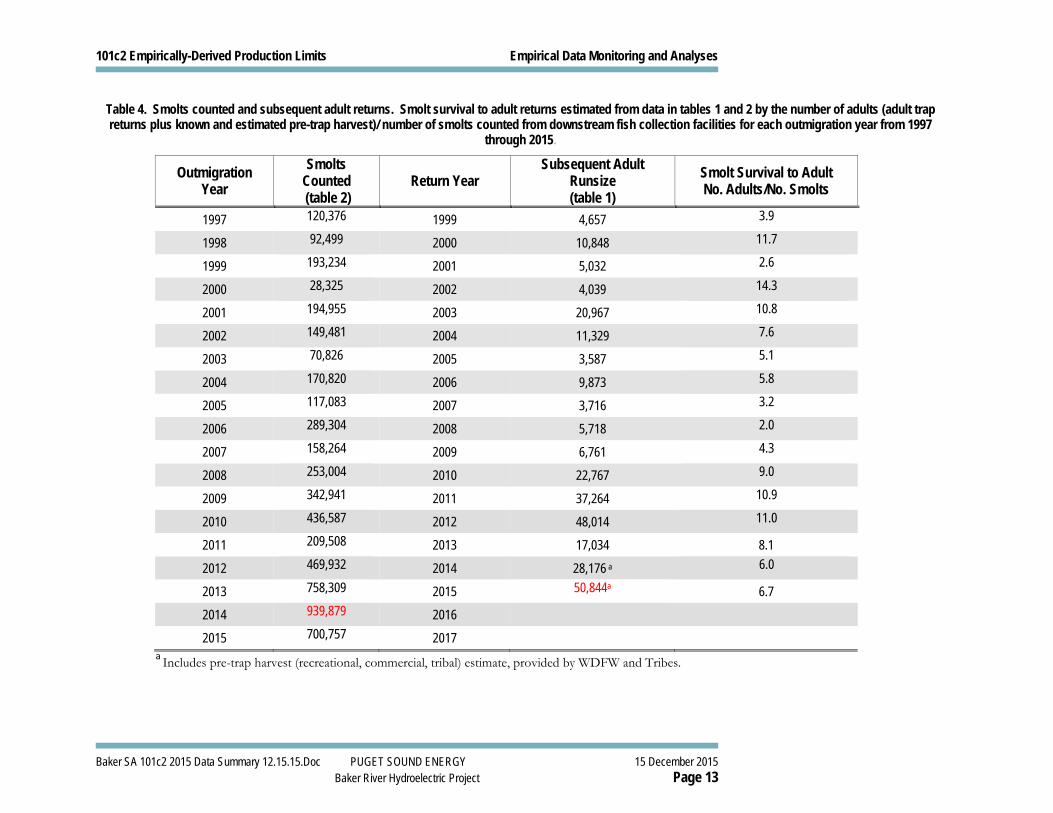
4. Smolt to adult recruits (Results shown in Table 4)
A general index of smolt to adult recruits are estimated from data in tables 1 and 2 by the number of adults (adult trap returns plus known and estimated pre-trap harvest)/number of smolts counted from the downstream fish collection facilities.
5. Returning broodstock (Results shown in Tables 1,2)
Number of female spawners used for Spawning beach 4 and artificial incubation in the hatchery, and the number of adults released for natural production are recorded.
101c2 Empirically-Derived Production Limits Empirical Data Monitoring and Analyses
Baker SA 101c2 2015 Data Summary 12.15.15.Doc PUGET SOUND ENERGY 15 December 2015 Baker River Hydroelectric Project Page 10
2.6 Numerical Empirical Data
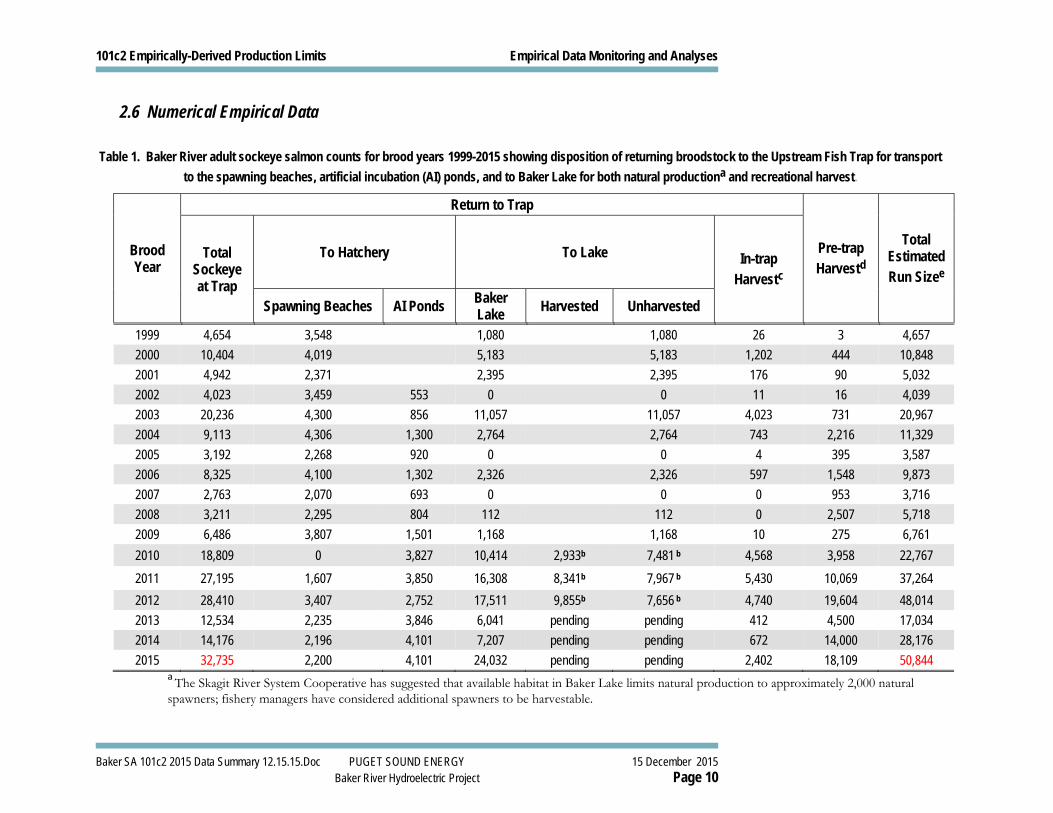
Table 1. Baker River adult sockeye salmon counts for brood years 1999-2015 showing disposition of returning broodstock to the Upstream Fish Trap for transport
to the spawning beaches, artificial incubation (AI) ponds, and to Baker Lake for both natural productiona and recreational harvest.
Brood Year
Return to Trap
Pre-trap Harvestd
Total Estimated Run Sizee
Total Sockeye at Trap
To Hatchery To Lake In-trap Harvestc
Spawning Beaches AI Ponds Baker Lake
Harvested Unharvested
1999 4,654 3,548 1,080 1,080 26 3 4,657
2000 10,404 4,019 5,183 5,183 1,202 444 10,848
2001 4,942 2,371 2,395 2,395 176 90 5,032
2002 4,023 3,459 553 0 0 11 16 4,039
2003 20,236 4,300 856 11,057 11,057 4,023 731 20,967
2004 9,113 4,306 1,300 2,764 2,764 743 2,216 11,329
2005 3,192 2,268 920 0 0 4 395 3,587
2006 8,325 4,100 1,302 2,326 2,326 597 1,548 9,873
2007 2,763 2,070 693 0 0 0 953 3,716
2008 3,211 2,295 804 112 112 0 2,507 5,718
2009 6,486 3,807 1,501 1,168 1,168 10 275 6,761
2010 18,809 0 3,827 10,414 2,933b 7,481 b 4,568 3,958 22,767
2011 27,195 1,607 3,850 16,308 8,341b 7,967 b 5,430 10,069 37,264
2012 28,410 3,407 2,752 17,511 9,855b 7,656 b 4,740 19,604 48,014
2013 12,534 2,235 3,846 6,041 pending pending 412 4,500 17,034
2014 14,176 2,196 4,101 7,207 pending pending 672 14,000 28,176
2015 32,735 2,200 4,101 24,032 pending pending 2,402 18,109 50,844 a The Skagit River System Cooperative has suggested that available habitat in Baker Lake limits natural production to approximately 2,000 natural spawners; fishery managers have considered additional spawners to be harvestable.
101c2 Empirically-Derived Production Limits Empirical Data Monitoring and Analyses
Baker SA 101c2 2015 Data Summary 12.15.15.Doc PUGET SOUND ENERGY 15 December 2015 Baker River Hydroelectric Project Page 11
b Preliminary estimates subject to change (Source: WDFW).
c In-trap count includes mortalities.
d Pre-trap harvest (recreational, commercial, tribal) provided by WDFW and tribal reporting.
e Run size estimate consists of recreational, commercial, and tribal catch plus counts at the Baker River upstream fish trap.
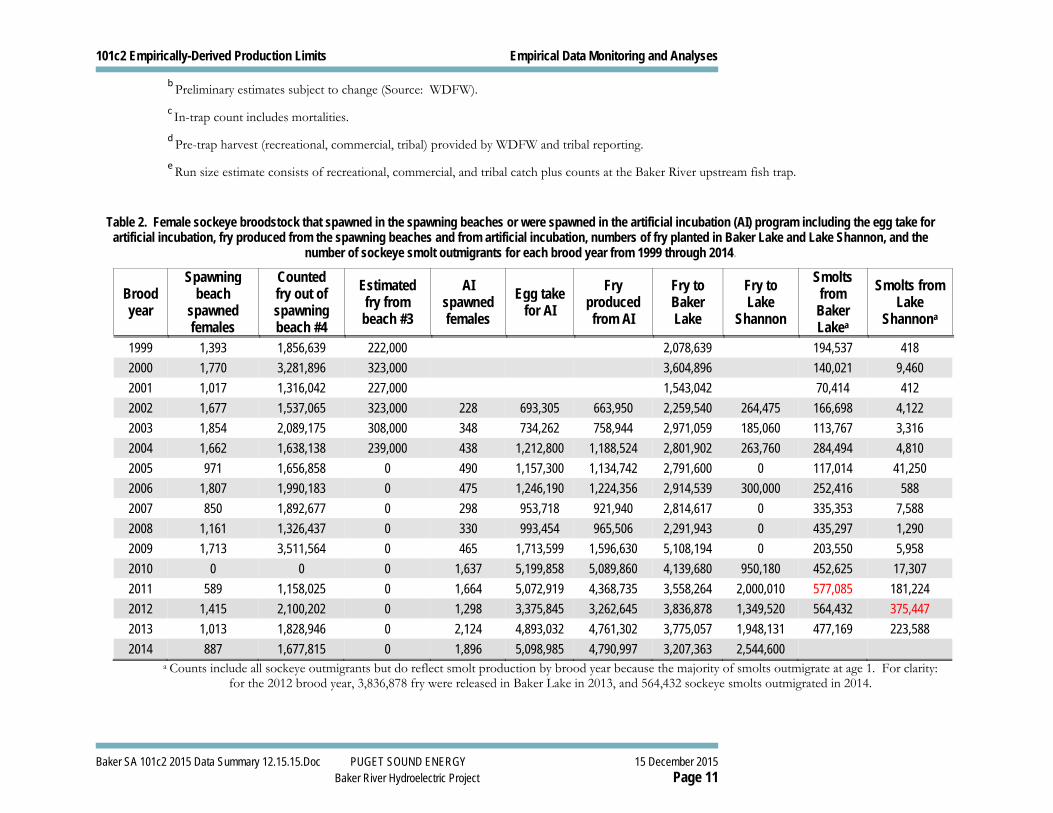
Table 2. Female sockeye broodstock that spawned in the spawning beaches or were spawned in the artificial incubation (AI) program including the egg take for artificial incubation, fry produced from the spawning beaches and from artificial incubation, numbers of fry planted in Baker Lake and Lake Shannon, and the
number of sockeye smolt outmigrants for each brood year from 1999 through 2014.
Brood year
Spawning beach
spawned females
Counted fry out of spawning beach #4
Estimated fry from beach #3
AI spawned females
Egg take for AI
Fry produced from AI
Fry to Baker Lake
Fry to Lake
Shannon
Smolts from
Baker Lakea
Smolts from Lake
Shannona
1999 1,393 1,856,639 222,000 2,078,639 194,537 418
2000 1,770 3,281,896 323,000 3,604,896 140,021 9,460
2001 1,017 1,316,042 227,000 1,543,042 70,414 412
2002 1,677 1,537,065 323,000 228 693,305 663,950 2,259,540 264,475 166,698 4,122
2003 1,854 2,089,175 308,000 348 734,262 758,944 2,971,059 185,060 113,767 3,316
2004 1,662 1,638,138 239,000 438 1,212,800 1,188,524 2,801,902 263,760 284,494 4,810
2005 971 1,656,858 0 490 1,157,300 1,134,742 2,791,600 0 117,014 41,250
2006 1,807 1,990,183 0 475 1,246,190 1,224,356 2,914,539 300,000 252,416 588
2007 850 1,892,677 0 298 953,718 921,940 2,814,617 0 335,353 7,588
2008 1,161 1,326,437 0 330 993,454 965,506 2,291,943 0 435,297 1,290
2009 1,713 3,511,564 0 465 1,713,599 1,596,630 5,108,194 0 203,550 5,958
2010 0 0 0 1,637 5,199,858 5,089,860 4,139,680 950,180 452,625 17,307
2011 589 1,158,025 0 1,664 5,072,919 4,368,735 3,558,264 2,000,010 577,085 181,224
2012 1,415 2,100,202 0 1,298 3,375,845 3,262,645 3,836,878 1,349,520 564,432 375,447
2013 1,013 1,828,946 0 2,124 4,893,032 4,761,302 3,775,057 1,948,131 477,169 223,588
2014 887 1,677,815 0 1,896 5,098,985 4,790,997 3,207,363 2,544,600 a Counts include all sockeye outmigrants but do reflect smolt production by brood year because the majority of smolts outmigrate at age 1. For clarity:
for the 2012 brood year, 3,836,878 fry were released in Baker Lake in 2013, and 564,432 sockeye smolts outmigrated in 2014.
101c2 Empirically-Derived Production Limits Empirical Data Monitoring and Analyses
Baker SA 101c2 2015 Data Summary 12.15.15.Doc PUGET SOUND ENERGY 15 December 2015 Baker River Hydroelectric Project Page 12
Table 3. Fry releases and subsequent smolt production. Percent of smolt outmigration estimated from data in table 2 by number of smolts counted at each downstream fish collection facility/ number of fry released in each reservoir for each brood year from 1999 through 2014. This data analysis is limited by the fact
that the number of wild produced fry is unknown, and contribution to subsequent smolt production.
Brood year Fry Baker (table 2)
Smolts Bakera
(table 2) Percent
(smolt / fry) Fry Shannon
(table 2) Smolts Shannona
(table 2) Percent
(smolt / fry)
1999 2,078,639 194,537 9.4 418
2000 3,604,896 140,021 3.9 9,460
2001 1,543,042 70,414 4.6 412
2002 2,259,540 166,698 7.4 264,475 4,122 1.6
2003 2,971,059 113,767 3.8 185,060 3,316 1.8
2004 2,801,902 284,494 10.2 263,760 4,810 1.8
2005 2,791,600 117,014 4.2 0 41,250 -
2006 2,914,539 252,416 8.7 300,000 588 0.2
2007 2,814,617 335,353 11.9 0 7,588 -
2008 2,291,943 435,297 19.0 0 1,290 -
2009 5,108,194 203,550 4.0 0 5,958 -
2010 4,139,680 452,625 10.9 950,180 17,307 1.8
2011 3,558,264 577,085 16.2 2,000,010 181,224 9.1
2012 3,836,878 564,432 14.7 1,349,520 375,447 27.8
2013 3,775,057 477,169 12.6 1,948,131 223,588 11.5
2014 3,207,363 2,544,600
a Counts include all sockeye outmigrants but do reflect smolt production by brood year because the majority of smolts outmigrate at age 1. For clarity: for the 2012 brood year, 3,836,878 fry were released in Baker Lake in 2013, and 564,432 sockeye smolts
outmigrated in 2014.
101c2 Empirically-Derived Production Limits Empirical Data Monitoring and Analyses
Baker SA 101c2 2015 Data Summary 12.15.15.Doc PUGET SOUND ENERGY 15 December 2015 Baker River Hydroelectric Project Page 13
Table 4. Smolts counted and subsequent adult returns. Smolt survival to adult returns estimated from data in tables 1 and 2 by the number of adults (adult trap returns plus known and estimated pre-trap harvest)/ number of smolts counted from downstream fish collection facilities for each outmigration year from 1997
through 2015.
Outmigration Year
Smolts Counted (table 2)
Return Year
Subsequent Adult Runsize (table 1)
Smolt Survival to Adult No. Adults/No. Smolts
1997 120,376 1999 4,657 3.9
1998 92,499 2000 10,848 11.7
1999 193,234 2001 5,032 2.6
2000 28,325 2002 4,039 14.3
2001 194,955 2003 20,967 10.8
2002 149,481 2004 11,329 7.6
2003 70,826 2005 3,587 5.1
2004 170,820 2006 9,873 5.8
2005 117,083 2007 3,716 3.2
2006 289,304 2008 5,718 2.0
2007 158,264 2009 6,761 4.3
2008 253,004 2010 22,767 9.0
2009 342,941 2011 37,264 10.9
2010 436,587 2012 48,014 11.0
2011 209,508 2013 17,034 8.1
2012 469,932 2014 28,176 a 6.0
2013 758,309 2015 50,844a 6.7
2014 939,879 2016
2015 700,757 2017 a Includes pre-trap harvest (recreational, commercial, tribal) estimate, provided by WDFW and Tribes.
101c2 Empirically-Derived Production Limits Empirical Data Monitoring and Analyses
Baker SA 101c2 2015 Data Summary 12.15.15.Doc PUGET SOUND ENERGY 15 December 2015 Baker River Hydroelectric Project Page 14
2.7 Morphological Empirical Data
90
95
100
105
110
115
120
125
130
2010 2011 2012 2013 2014 2015
Fo
rk le
ng
th (
mm
)
Average Length - "Age 1" (2 Wk May - 2 Wk June) - UPPER BAKER
114 mm 109 mm 108 mm 106 mm 107 mm 111 mm
Figure 4. Average length “Age 1” of sockeye salmon smolts outmigrating from the Upper Baker Reservoir
from 2nd week of May to 2nd week of June.
0.80
0.85
0.90
0.95
1.00
1.05
2010 2011 2012 2013 2014 2015
Co
nd
itio
n f
acto
r (K
)
Average Condition factor - "Age 1" (2 Wk May - 2 Wk June) - UPPER BAKER
0.95 0.94 0.92 0.91 0.91 0.94
Figure 5. Average condition factor “Age 1” of sockeye salmon smolts outmigrating from the Upper Baker
Reservoir from 2nd week of May to 2nd week of June.
101c2 Empirically-Derived Production Limits Empirical Data Monitoring and Analyses
Baker SA 101c2 2015 Data Summary 12.15.15.Doc PUGET SOUND ENERGY 15 December 2015 Baker River Hydroelectric Project Page 15
507090
110130150170190210230250
0 50 100 150 200 250 300
Fo
rk L
eng
th (
mm
)
Random measurements
2015 Upper Baker FSC Sockeye Length- 2nd Week May - 2nd Week June -Random Sample
Figure 6. Size distribution (2015) of sockeye salmon smolts outmigrating from the Upper Baker Reservoir
from 2nd week of May to 2nd week of June.
50
70
90
110
130
150
170
190
210
230
250
0 100 200 300 400 500 600 700 800
Len
gth
(m
m)
Random measurements (N)
2015 Upper Baker FSC Sockeye Length - Random Sample
March
April
May
June
July
Figure 7. Size distribution (2015) by month of sockeye salmon smolts outmigrating from the Upper Baker
Reservoir.
101c2 Empirically-Derived Production Limits Empirical Data Monitoring and Analyses
Baker SA 101c2 2015 Data Summary 12.15.15.Doc PUGET SOUND ENERGY 15 December 2015 Baker River Hydroelectric Project Page 16
0.4
0.6
0.8
1.0
1.2
1.4
1.6
1.8
0 100 200 300 400 500 600 700 800
Co
nd
itio
n f
acto
r (K
)
Random meaurements (N)
2015 Upper Baker FSC Sockeye Condition - Random Sample
March
April
May
June
July
Figure 8. Condition factor distribution (2015) by month of sockeye salmon smolts outmigrating from the
Upper Baker Reservoir.
90
100
110
120
130
140
150
160
2013 2014 2015
Fo
rk le
ng
th (
mm
)
Average Length - "Age 1" (2 Wk May - 2 Wk June) - LOWER BAKER
122 mm 120 mm 133 mm
Figure 9. Average length “Age 1” of sockeye salmon smolts outmigrating from the Lower Baker
Reservoir from 2nd week of May to 2nd week of June.
101c2 Empirically-Derived Production Limits Empirical Data Monitoring and Analyses
Baker SA 101c2 2015 Data Summary 12.15.15.Doc PUGET SOUND ENERGY 15 December 2015 Baker River Hydroelectric Project Page 17
0.80
0.85
0.90
0.95
1.00
1.05
1.10
2013 2014 2015
Co
nd
itio
n f
acto
r (K
)Average Condition factor - "Age 1" (2 Wk May - 2 Wk June) - LOWER BAKER
0.99 0.92 0.99
Figure 10. Average condition factor “Age 1” of sockeye salmon smolts outmigrating from the Lower
Baker Reservoir from 2nd week of May to 2nd week of June.
507090
110130150170190210230250
0 50 100 150 200 250 300
Fo
rk L
eng
th (
mm
)
Random measurements
2015 Lower Baker FSC Sockeye Length- 2nd Week May - 1st Week June - Random Sample
Figure 11. Size distribution (2015) of sockeye salmon smolts outmigrating from the Lower Baker
Reservoir from 2nd week of May to 2nd week of June.
101c2 Empirically-Derived Production Limits Empirical Data Monitoring and Analyses
Baker SA 101c2 2015 Data Summary 12.15.15.Doc PUGET SOUND ENERGY 15 December 2015 Baker River Hydroelectric Project Page 18
50
70
90
110
130
150
170
190
210
230
250
0 200 400 600 800 1000
Len
gth
(m
m)
Random meaurements (N)
2015 Lower Baker FSC Sockeye Length - Random Sample
March
April
May
June
July
Figure 12. Size distribution (2015) by month of sockeye salmon smolts outmigrating from the Lower
Baker Reservoir.
0.4
0.6
0.8
1.0
1.2
1.4
1.6
1.8
0 200 400 600 800 1000
Co
nd
itio
n f
act
or
(K)
Random neasurements (N)
2015 Lower Baker FSC Sockeye Condition - Random Sample
March
April
May
June
July
Figure 13. Condition factor distribution (2015) by month of sockeye salmon smolts outmigrating from the
Lower Baker Reservoir.
101c2 Empirically-Derived Production Limits Empirical Data Monitoring and Analyses
Baker SA 101c2 2015 Data Summary 12.15.15.Doc PUGET SOUND ENERGY 15 December 2015 Baker River Hydroelectric Project Page 19
60
80
100
120
140
160
0 100 200 300 400 500 600
Fo
rk le
ng
th (
mm
)
Stratified random measurements (N)
2015 Upper Baker FSC Sockeye Length - Stratified <160 mm
Figure 14. Stratified < 160 mm size distribution (2015) of sockeye salmon smolts outmigrating from the
Upper Baker Reservoir.
0.6
0.7
0.8
0.9
1.0
1.1
1.2
1.3
0 100 200 300 400 500 600
Co
nd
itio
n f
acto
r (K
)
Stratified random measurements (N)
2015 Upper Baker FSC Sockeye Condition - Stratified <160 mm
Figure 15. Stratified < 160mm condition factor distribution (2015) of sockeye salmon smolts outmigrating
from the Upper Baker Reservoir.
101c2 Empirically-Derived Production Limits Empirical Data Monitoring and Analyses
Baker SA 101c2 2015 Data Summary 12.15.15.Doc PUGET SOUND ENERGY 15 December 2015 Baker River Hydroelectric Project Page 20
160
170
180
190
200
210
220
230
240
0 50 100 150 200 250 300 350 400
Fo
rk le
ng
th (
mm
)
Stratified random measurements (N)
2015 Upper Baker FSC Sockeye Length - Stratified 160-239 mm
Figure 16. Stratified 160 – 239 mm size distribution (2015) of sockeye salmon smolts outmigrating from
the Upper Baker Reservoir.
0.6
0.7
0.8
0.9
1.0
1.1
1.2
1.3
0 50 100 150 200 250 300 350 400
Co
nd
itio
n f
acto
r (K
)
Stratified random measurements (N)
2015 Upper Baker FSC Sockeye Condition - Stratified 160-239 mm
Figure 17. Stratified 160 – 239 mm condition factor distribution (2015) of sockeye salmon smolts
outmigrating from the Upper Baker Reservoir.
101c2 Empirically-Derived Production Limits Empirical Data Monitoring and Analyses
Baker SA 101c2 2015 Data Summary 12.15.15.Doc PUGET SOUND ENERGY 15 December 2015 Baker River Hydroelectric Project Page 21
60
80
100
120
140
160
0 100 200 300 400 500 600 700 800
Fo
rk le
ng
th (
N)
Stratified random measurements (N)
2015 Lower Baker FSC Sockeye Length - Stratified <160 mm
Figure 18. Stratified < 160 mm size distribution (2015) of sockeye salmon smolts outmigrating from the
Lower Baker Reservoir.
0.6
0.7
0.8
0.9
1.0
1.1
1.2
1.3
0 100 200 300 400 500 600 700 800
Co
nd
itio
n f
acto
r (K
)
Stratified random measurements (N)
2015 Lower Baker FSC Sockeye Condition - Stratified <160 mm
Figure 19. Stratified < 160mm condition factor distribution (2015) of sockeye salmon smolts outmigrating
from the Lower Baker Reservoir.
101c2 Empirically-Derived Production Limits Empirical Data Monitoring and Analyses
Baker SA 101c2 2015 Data Summary 12.15.15.Doc PUGET SOUND ENERGY 15 December 2015 Baker River Hydroelectric Project Page 22
160
170
180
190
200
210
220
230
240
0 100 200 300 400 500
Fo
rk le
ng
th (
mm
)
Stratified random measurements (N)
2015 Lower Baker FSC Sockeye Length - Stratified 160-239 mm
Figure 20. Stratified 160 – 239 mm size distribution (2015) of sockeye salmon smolts outmigrating from
the Lower Baker Reservoir.
0.6
0.7
0.8
0.9
1.0
1.1
1.2
1.3
0 100 200 300 400 500
Co
nd
itio
n f
acto
r (K
)
Stratified random measurements (N)
2015 Lower Baker FSC Sockeye Condition - Stratified 160-239 mm
Figure 21. Stratified 160 – 239 mm condition factor distribution (2015) of sockeye salmon smolts
outmigrating from the Lower Baker Reservoir.
101c2 Empirically-Derived Production Limits Empirical Data Monitoring and Analyses
Baker SA 101c2 2015 Data Summary 12.15.15.Doc PUGET SOUND ENERGY 15 December 2015 Baker River Hydroelectric Project Page 23
240
260
280
300
320
340
360
0 50 100 150 200 250 300 350
Fo
rk le
ng
th (
mm
)
Stratified random measurements (N)
2015 Lower Baker FSC Sockeye Length - Stratified >239 mm
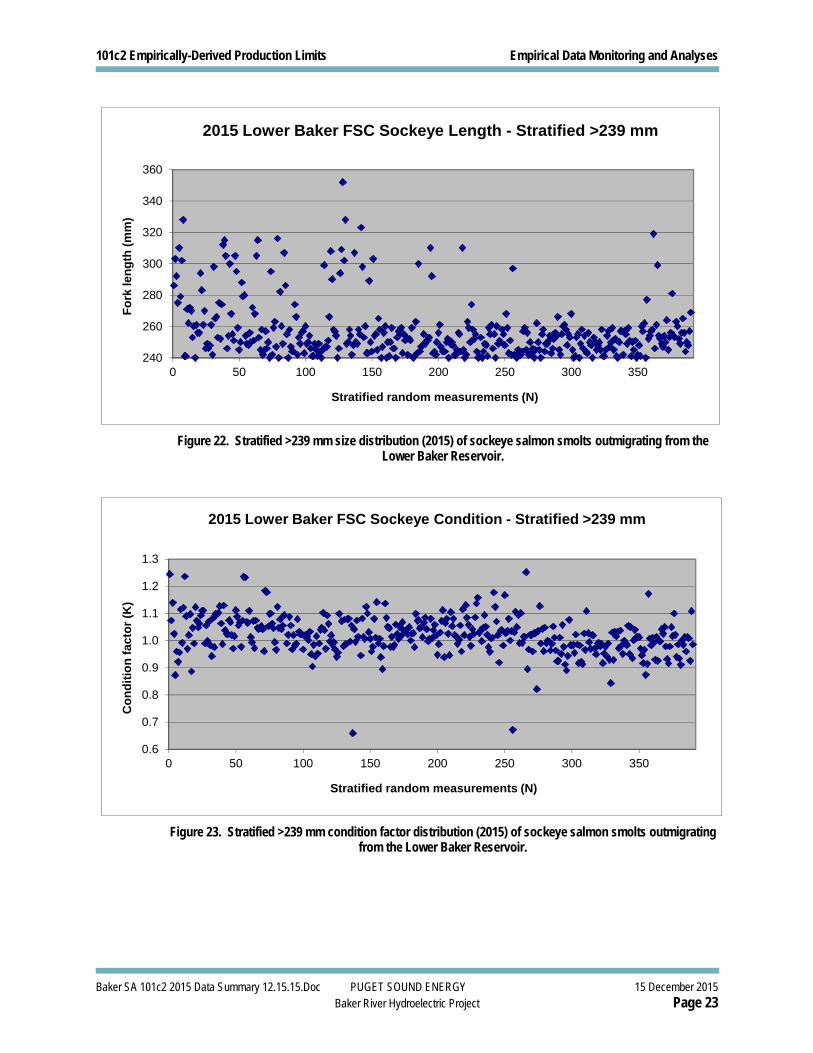
Figure 22. Stratified >239 mm size distribution (2015) of sockeye salmon smolts outmigrating from the
Lower Baker Reservoir.
0.6
0.7
0.8
0.9
1.0
1.1
1.2
1.3
0 50 100 150 200 250 300 350
Co
nd
itio
n f
acto
r (K
)
Stratified random measurements (N)
2015 Lower Baker FSC Sockeye Condition - Stratified >239 mm
Figure 23. Stratified >239 mm condition factor distribution (2015) of sockeye salmon smolts outmigrating
from the Lower Baker Reservoir.
101c2 Empirically-Derived Production Limits Empirical Data Monitoring and Analyses
Baker SA 101c2 2015 Data Summary 12.15.15.Doc PUGET SOUND ENERGY 15 December 2015 Baker River Hydroelectric Project Page 24
2.8 In Summary
2015 Numerical
Baker Lake’s Upper Baker FSC collected 477,169 sockeye smolts is the third highest on record (577,085 in 2013 represents the highest and the current observed floor to production capability).
Lake Shannon’s Lower Baker FSC collected 223,588 sockeye smolts and is the second highest on record (375,447 in 2014 represents the highest and the current observed floor to production capability).
The combined number of juvenile sockeye migrants captured and transported at PSE’s Upper Baker and Lower Baker downstream fish passage facilities in 2015 was 700,757 third highest on record (939,879 in 2014 represents the highest).
A total of 32,735 sockeye entered the upstream trap during the 2015. When adjusted for terminal harvest, the run total is the highest among the top tier of sockeye returns. Terminal harvest was estimated at 18,109 for a total terminal area return of 50,844.
Baker fish hatchery and Sockeye Spawning Beach 4 combined, produced 6.49 million fry, among the highest in 56 years of production from Baker facilities (6.59 in 2014 represents the highest). Sockeye fry production has increased more than two-fold from levels prior to 2008.
2015 Morphological
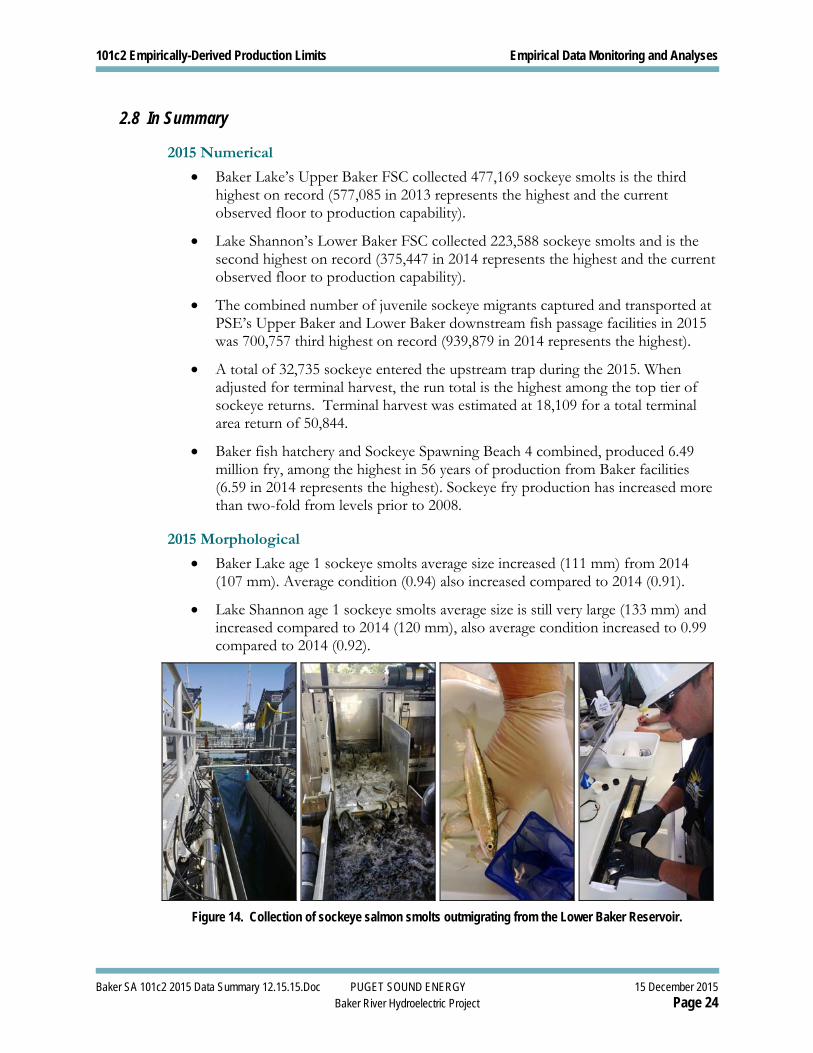
Baker Lake age 1 sockeye smolts average size increased (111 mm) from 2014 (107 mm). Average condition (0.94) also increased compared to 2014 (0.91).
Lake Shannon age 1 sockeye smolts average size is still very large (133 mm) and increased compared to 2014 (120 mm), also average condition increased to 0.99 compared to 2014 (0.92).
Figure 14. Collection of sockeye salmon smolts outmigrating from the Lower Baker Reservoir.