Embed Size (px)
Citation preview

Aquaculture 312 (2011) 1–14
Contents lists available at ScienceDirect
Aquaculture
j ourna l homepage: www.e lsev ie r.com/ locate /aqua-on l ine
Review
The biological requirements for post-smolt Atlantic salmon inclosed-containment systems
Helgi Thorarensen a,⁎, Anthony P. Farrell b,1
a Department of Aquaculture and Fish Biology, Holar University, 551 Saudarkrokur, Icelandb Faculty of Land and Food Systems, & Department of Zoology, 2357 Main Mall, UBC, Vancouver, BC, V6T 1Z4, Canada
⁎ Corresponding author. Tel.: +354 455 6300; fax: +E-mail addresses: [email protected] (H. Thorarensen), fa
1 Tel.: +1 604 666 6647; fax: +1 604 666 3497.
0044-8486/$ – see front matter © 2010 Elsevier B.V. Aldoi:10.1016/j.aquaculture.2010.11.043
a b s t r a c t
a r t i c l e i n f oArticle history:Received 16 March 2009Received in revised form 24 November 2010Accepted 27 November 2010Available online 2 December 2010
Keywords:FishThermal growth coefficientDensityOxygenCarbon dioxideAmmonia
This review summarises information on some key factors that are relevant for aquaculture of Atlantic salmon inclosed containment systems. These factors include expected growth performance, oxygen demand andproduction of metabolites, as well as required water quality and maximum fish density.The thermal growth coefficient (TGC) appears to be a good predictor of expected mean growth of Atlanticsalmon within the temperature range of 4–14 °C. The mean TGC reported in some recent growth studies is 2.7,which is somewhat higher than the 2.4–2.5 reported from the Norwegian, Scottish and Chilean salmon industry.While TGC can predict long-term growth performance, in the short-term TGC can be variable, fluctuatingseasonally between periods of TGC values in excess of 4.5 to negative values (weight loss). These fluctuations ingrowth rate and associated variations in metabolic rate are not always dependent on temperature and must betaken into account when designing closed containment systems.Several models have been proposed that predict the oxygen consumption of Atlantic salmon based on fish size,activity and ambient temperature. Oxygen consumption can also be predicted from feed intake. However, themodels are only indicators and actual values for oxygen consumption may deviate significantly from thepredicted values depending on feed intake and growth rate for example. The rate of production of wastemetabolites can be predicted from oxygen consumption rates using the respiratory quotient (for CO2) andammonia quotient (for NH3).Water quality (primarily oxygen, CO2 and NH3) has a significant effect on the growth of Atlantic salmon. There isevidence to indicate that growth rate increases progressivelywithoxygen saturationup to at least 100%saturation.Furthermore, CO2 and NH3 levels may limit the growth of Atlantic salmon when they exceed 10 mg L−1 and0.012 mg L−1, respectively.There is evidence to indicate that salmondensity up to at least 80 kg−1 m3does not limit the growth or survival ofAtlantic salmon provided that water quality is maintained within acceptable limits. At higher densities bothgrowth rate and fishwelfaremay be compromised. Regardless, in practical applications themaximum density ofAtlantic salmon in a closed containment systemmaybedeterminedmoreby the technical and logistical problemsof maintaining acceptable water quality rather than the growth rate of the fish.Closed containment systems offer possibilities of rearing Atlantic salmon under controlled conditions at highdensities. They offer possibilities for optimising growth conditions for fish. However, comparatively highproduction cost ofmaintainingwater qualitymay preclude competitionwith conventional cage rearing systems.
354 455 [email protected] (A.P. Farrell).
l rights reserved.
© 2010 Elsevier B.V. All rights reserved.
Contents
1. Introduction . . . . . . . . . . . . . . . . . . . . . . . . . . . . . . . . . . . . . . . . . . . . . . . . . . . . . . . . . . . . . . . 22. Specific growth rate, thermal growth coefficient and food conversion ratio . . . . . . . . . . . . . . . . . . . . . . . . . . . . . . . . . . . 23. Oxygen . . . . . . . . . . . . . . . . . . . . . . . . . . . . . . . . . . . . . . . . . . . . . . . . . . . . . . . . . . . . . . . . . 4
3.1. Oxygen consumption . . . . . . . . . . . . . . . . . . . . . . . . . . . . . . . . . . . . . . . . . . . . . . . . . . . . . . . 43.2. Acceptable levels of oxygen . . . . . . . . . . . . . . . . . . . . . . . . . . . . . . . . . . . . . . . . . . . . . . . . . . . . 5
2 H. Thorarensen, A.P. Farrell / Aquaculture 312 (2011) 1–14
4. Carbon dioxide . . . . . . . . . . . . . . . . . . . . . . . . . . . . . . . . . . . . . . . . . . . . . . . . . . . . . . . . . . . . . . 64.1. Production of carbon dioxide . . . . . . . . . . . . . . . . . . . . . . . . . . . . . . . . . . . . . . . . . . . . . . . . . . . . 64.2. Acceptable levels of carbon dioxide . . . . . . . . . . . . . . . . . . . . . . . . . . . . . . . . . . . . . . . . . . . . . . . . . 7
5. Ammonia . . . . . . . . . . . . . . . . . . . . . . . . . . . . . . . . . . . . . . . . . . . . . . . . . . . . . . . . . . . . . . . . 75.1. TAN production . . . . . . . . . . . . . . . . . . . . . . . . . . . . . . . . . . . . . . . . . . . . . . . . . . . . . . . . . . 75.2. Acceptable levels of ammonia . . . . . . . . . . . . . . . . . . . . . . . . . . . . . . . . . . . . . . . . . . . . . . . . . . . 8
6. Nitrite and nitrate . . . . . . . . . . . . . . . . . . . . . . . . . . . . . . . . . . . . . . . . . . . . . . . . . . . . . . . . . . . . 97. Fish density . . . . . . . . . . . . . . . . . . . . . . . . . . . . . . . . . . . . . . . . . . . . . . . . . . . . . . . . . . . . . . . 98. Flow requirements . . . . . . . . . . . . . . . . . . . . . . . . . . . . . . . . . . . . . . . . . . . . . . . . . . . . . . . . . . . . 109. Summary . . . . . . . . . . . . . . . . . . . . . . . . . . . . . . . . . . . . . . . . . . . . . . . . . . . . . . . . . . . . . . . . 11
9.1. Growth . . . . . . . . . . . . . . . . . . . . . . . . . . . . . . . . . . . . . . . . . . . . . . . . . . . . . . . . . . . . . . 119.2. Oxygen consumption and excretion of CO2 and TAN . . . . . . . . . . . . . . . . . . . . . . . . . . . . . . . . . . . . . . . . . 119.3. Water quality . . . . . . . . . . . . . . . . . . . . . . . . . . . . . . . . . . . . . . . . . . . . . . . . . . . . . . . . . . . 119.4. Rearing density . . . . . . . . . . . . . . . . . . . . . . . . . . . . . . . . . . . . . . . . . . . . . . . . . . . . . . . . . . 119.5. Flow requirements . . . . . . . . . . . . . . . . . . . . . . . . . . . . . . . . . . . . . . . . . . . . . . . . . . . . . . . . . 11
Acknowledgment. . . . . . . . . . . . . . . . . . . . . . . . . . . . . . . . . . . . . . . . . . . . . . . . . . . . . . . . . . . . . . . 12References . . . . . . . . . . . . . . . . . . . . . . . . . . . . . . . . . . . . . . . . . . . . . . . . . . . . . . . . . . . . . . . . . . 12
1. Introduction
Most of the global aquaculture production of salmon comes fromnet-pens that are open to the environment. Furthermore, it isrecognised that the potential for environmental impact of thesenet-pen farms is significant, e.g., through organic waste release, fishescapes and disease threats to natural populations (Black, 2001).Environmental impacts can be better controlled and managed ifsalmon are cultured in contained systems, such as land-based farmsor floating containers. However, the environmental controlsrequired for contained fish farms carry additional economic costscompared with net-pens, e.g., costs of construction and operation,which have resulted in a succession of unprofitable land-basedfarms. A potential solution to offset the additional costs ofenvironmental controls is to use a fish-intensive rearing system inwhich fish are reared at the highest density possible to maximiseproductivity and return on investments. It is possible to rear fish athigh density in contained systems provided there is adequatecontrol over the water quality of rearing environment. Even so, fishdensity can exceed levels where the growth of fish is compromised.The aim of this review is to use existing literature to help establishparameters for the environmental conditions that would supportmaximal growth and welfare of post-smolt Atlantic salmon underclosed-containment conditions.
To this end, we summarise available information on growth andfeed conversion of Atlantic salmon reared at high density in closed-containment fish farms. We specifically address the maximumloading density without compromising fish growth. At high rearingdensity, close control of water quality is an imperative. Therefore,we review information on the O2 demands of salmon, as well asexcretion rates for carbon dioxide (CO2) and ammonia (NH3). Theserates of gas removal/addition are then linked to water quality insalmonid aquaculture. Based on this information, we proposeminimum and maximum acceptable limits for O2, CO2, NH3 andsuspended solids.
In addition to reviewing the literature, supplemental informa-tion is provided from practical experiences from Icelandic land-based fish farms gained by interviews with Mr. Benedikt Kristjans-son, manager of the Silfurstjarnan fish farm, and Mr. Hjalti Bogasonmanager two farms owned by Islandsbleikja. Between 1990 and2000 these farms each produced about 1000 tonnes of salmonannually. One of these farms still produces salmon both for localand export markets while the other two farms have switched toculturing Arctic charr (Salvelinus alpinus), a more profitable fishspecies.
2. Specific growth rate, thermal growth coefficient and foodconversion ratio
The growth rate of fish is size-dependent and strongly influencedby factors such as feed availability, temperature, photoperiod andother environmental conditions (Brett, 1979; Austreng et al., 1987;Saunders and Harmon, 1988; Smith et al., 1993; Duston and Saunders,1995; Forsberg, 1995; Bœuf and Payan, 2001; Nordgarden et al.,2003).
There are twomainmethods to estimate salmonid growth rates forproduction. Most commonly, the growth rate of fish is expressed asspecific growth rate (SGR):
SGR = 100⋅ ln w2ð Þ−ln w1ð Þð Þ= t2–t1ð Þ
where w1 and w2 are the body mass at times t1 and t2 respectively.Therefore, SGR predicts growth of fish using the followingequation:
w2 = w1⋅eSGR⋅ t2–t1ð Þ=100ð Þ
:
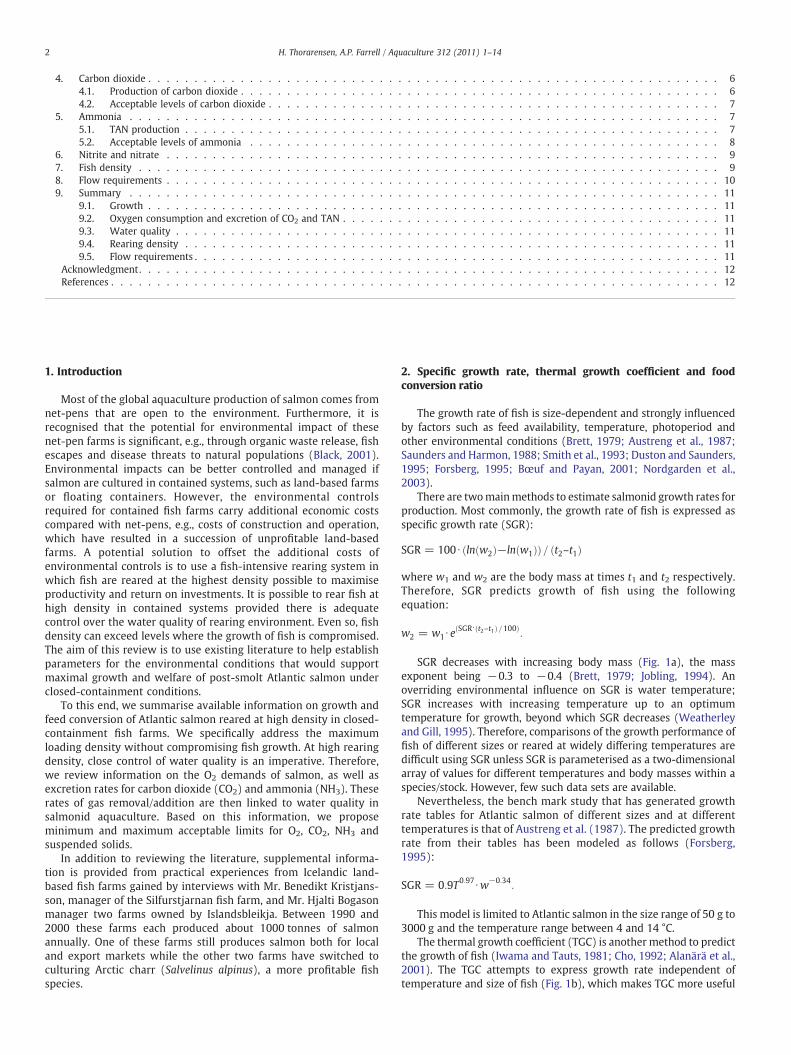
SGR decreases with increasing body mass (Fig. 1a), the massexponent being −0.3 to −0.4 (Brett, 1979; Jobling, 1994). Anoverriding environmental influence on SGR is water temperature;SGR increases with increasing temperature up to an optimumtemperature for growth, beyond which SGR decreases (Weatherleyand Gill, 1995). Therefore, comparisons of the growth performance offish of different sizes or reared at widely differing temperatures aredifficult using SGR unless SGR is parameterised as a two-dimensionalarray of values for different temperatures and body masses within aspecies/stock. However, few such data sets are available.
Nevertheless, the bench mark study that has generated growthrate tables for Atlantic salmon of different sizes and at differenttemperatures is that of Austreng et al. (1987). The predicted growthrate from their tables has been modeled as follows (Forsberg,1995):
SGR = 0:9T0:97⋅w−0:34:
This model is limited to Atlantic salmon in the size range of 50 g to3000 g and the temperature range between 4 and 14 °C.
The thermal growth coefficient (TGC) is another method to predictthe growth of fish (Iwama and Tauts, 1981; Cho, 1992; Alanärä et al.,2001). The TGC attempts to express growth rate independent oftemperature and size of fish (Fig. 1b), which makes TGC more useful
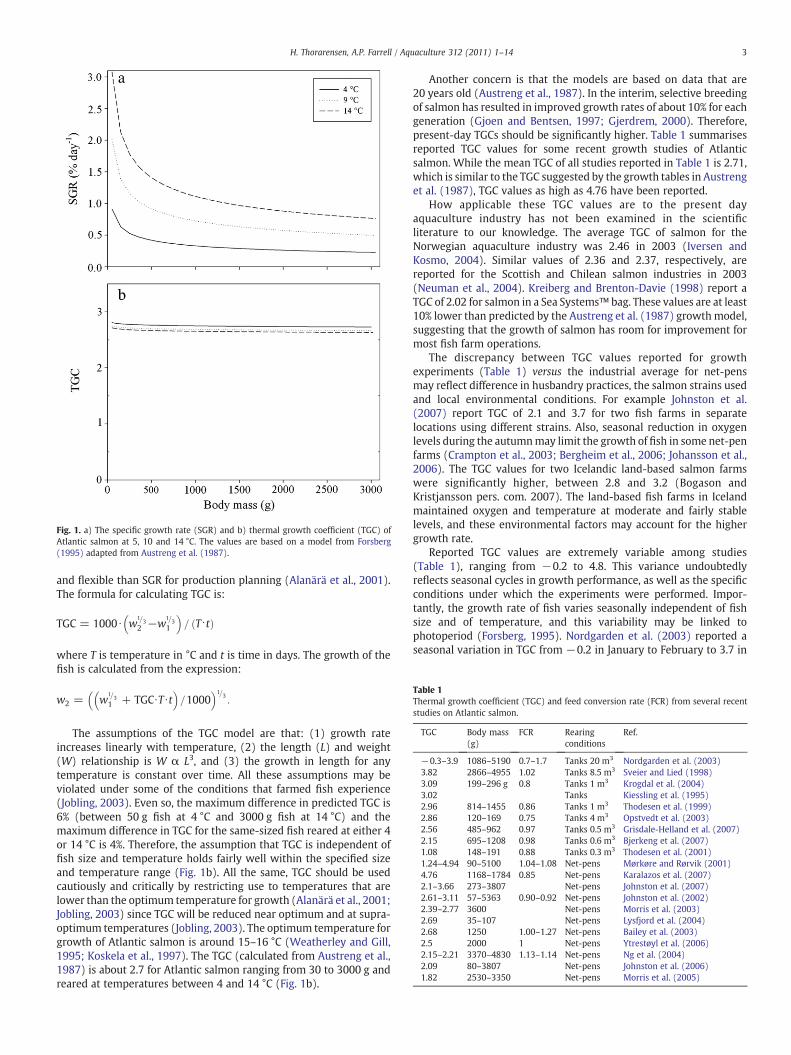
Fig. 1. a) The specific growth rate (SGR) and b) thermal growth coefficient (TGC) ofAtlantic salmon at 5, 10 and 14 °C. The values are based on a model from Forsberg(1995) adapted from Austreng et al. (1987).
Table 1Thermal growth coefficient (TGC) and feed conversion rate (FCR) from several recentstudies on Atlantic salmon.
TGC Body mass(g)
FCR Rearingconditions
Ref.
−0.3–3.9 1086–5190 0.7–1.7 Tanks 20 m3 Nordgarden et al. (2003)3.82 2866–4955 1.02 Tanks 8.5 m3 Sveier and Lied (1998)3.09 199–296 g 0.8 Tanks 1 m3 Krogdal et al. (2004)3.02 Tanks Kiessling et al. (1995)2.96 814–1455 0.86 Tanks 1 m3 Thodesen et al. (1999)2.86 120–169 0.75 Tanks 4 m3 Opstvedt et al. (2003)2.56 485–962 0.97 Tanks 0.5 m3 Grisdale-Helland et al. (2007)2.15 695–1208 0.98 Tanks 0.6 m3 Bjerkeng et al. (2007)1.08 148–191 0.88 Tanks 0.3 m3 Thodesen et al. (2001)1.24–4.94 90–5100 1.04–1.08 Net-pens Mørkøre and Rørvik (2001)4.76 1168–1784 0.85 Net-pens Karalazos et al. (2007)2.1–3.66 273–3807 Net-pens Johnston et al. (2007)2.61–3.11 57–5363 0.90–0.92 Net-pens Johnston et al. (2002)2.39–2.77 3600 Net-pens Morris et al. (2003)2.69 35–107 Net-pens Lysfjord et al. (2004)2.68 1250 1.00–1.27 Net-pens Bailey et al. (2003)2.5 2000 1 Net-pens Ytrestøyl et al. (2006)2.15–2.21 3370–4830 1.13–1.14 Net-pens Ng et al. (2004)2.09 80–3807 Net-pens Johnston et al. (2006)1.82 2530–3350 Net-pens Morris et al. (2005)
3H. Thorarensen, A.P. Farrell / Aquaculture 312 (2011) 1–14
and flexible than SGR for production planning (Alanärä et al., 2001).The formula for calculating TGC is:
TGC = 1000⋅ w1=32 −w
1=31
� �= T⋅tð Þ
where T is temperature in °C and t is time in days. The growth of thefish is calculated from the expression:
w2 = w1=31 + TGC⋅T⋅t
� �=1000
� �1=3:
The assumptions of the TGC model are that: (1) growth rateincreases linearly with temperature, (2) the length (L) and weight(W) relationship is W α L3, and (3) the growth in length for anytemperature is constant over time. All these assumptions may beviolated under some of the conditions that farmed fish experience(Jobling, 2003). Even so, the maximum difference in predicted TGC is6% (between 50 g fish at 4 °C and 3000 g fish at 14 °C) and themaximum difference in TGC for the same-sized fish reared at either 4or 14 °C is 4%. Therefore, the assumption that TGC is independent offish size and temperature holds fairly well within the specified sizeand temperature range (Fig. 1b). All the same, TGC should be usedcautiously and critically by restricting use to temperatures that arelower than the optimum temperature for growth (Alanärä et al., 2001;Jobling, 2003) since TGC will be reduced near optimum and at supra-optimum temperatures (Jobling, 2003). The optimum temperature forgrowth of Atlantic salmon is around 15–16 °C (Weatherley and Gill,1995; Koskela et al., 1997). The TGC (calculated from Austreng et al.,1987) is about 2.7 for Atlantic salmon ranging from 30 to 3000 g andreared at temperatures between 4 and 14 °C (Fig. 1b).
Another concern is that the models are based on data that are20 years old (Austreng et al., 1987). In the interim, selective breedingof salmon has resulted in improved growth rates of about 10% for eachgeneration (Gjoen and Bentsen, 1997; Gjerdrem, 2000). Therefore,present-day TGCs should be significantly higher. Table 1 summarisesreported TGC values for some recent growth studies of Atlanticsalmon. While the mean TGC of all studies reported in Table 1 is 2.71,which is similar to the TGC suggested by the growth tables in Austrenget al. (1987), TGC values as high as 4.76 have been reported.
How applicable these TGC values are to the present dayaquaculture industry has not been examined in the scientificliterature to our knowledge. The average TGC of salmon for theNorwegian aquaculture industry was 2.46 in 2003 (Iversen andKosmo, 2004). Similar values of 2.36 and 2.37, respectively, arereported for the Scottish and Chilean salmon industries in 2003(Neuman et al., 2004). Kreiberg and Brenton-Davie (1998) report aTGC of 2.02 for salmon in a Sea Systems™ bag. These values are at least10% lower than predicted by the Austreng et al. (1987) growthmodel,suggesting that the growth of salmon has room for improvement formost fish farm operations.
The discrepancy between TGC values reported for growthexperiments (Table 1) versus the industrial average for net-pensmay reflect difference in husbandry practices, the salmon strains usedand local environmental conditions. For example Johnston et al.(2007) report TGC of 2.1 and 3.7 for two fish farms in separatelocations using different strains. Also, seasonal reduction in oxygenlevels during the autumnmay limit the growth of fish in some net-penfarms (Crampton et al., 2003; Bergheim et al., 2006; Johansson et al.,2006). The TGC values for two Icelandic land-based salmon farmswere significantly higher, between 2.8 and 3.2 (Bogason andKristjansson pers. com. 2007). The land-based fish farms in Icelandmaintained oxygen and temperature at moderate and fairly stablelevels, and these environmental factors may account for the highergrowth rate.
Reported TGC values are extremely variable among studies(Table 1), ranging from −0.2 to 4.8. This variance undoubtedlyreflects seasonal cycles in growth performance, as well as the specificconditions under which the experiments were performed. Impor-tantly, the growth rate of fish varies seasonally independent of fishsize and of temperature, and this variability may be linked tophotoperiod (Forsberg, 1995). Nordgarden et al. (2003) reported aseasonal variation in TGC from −0.2 in January to February to 3.7 in
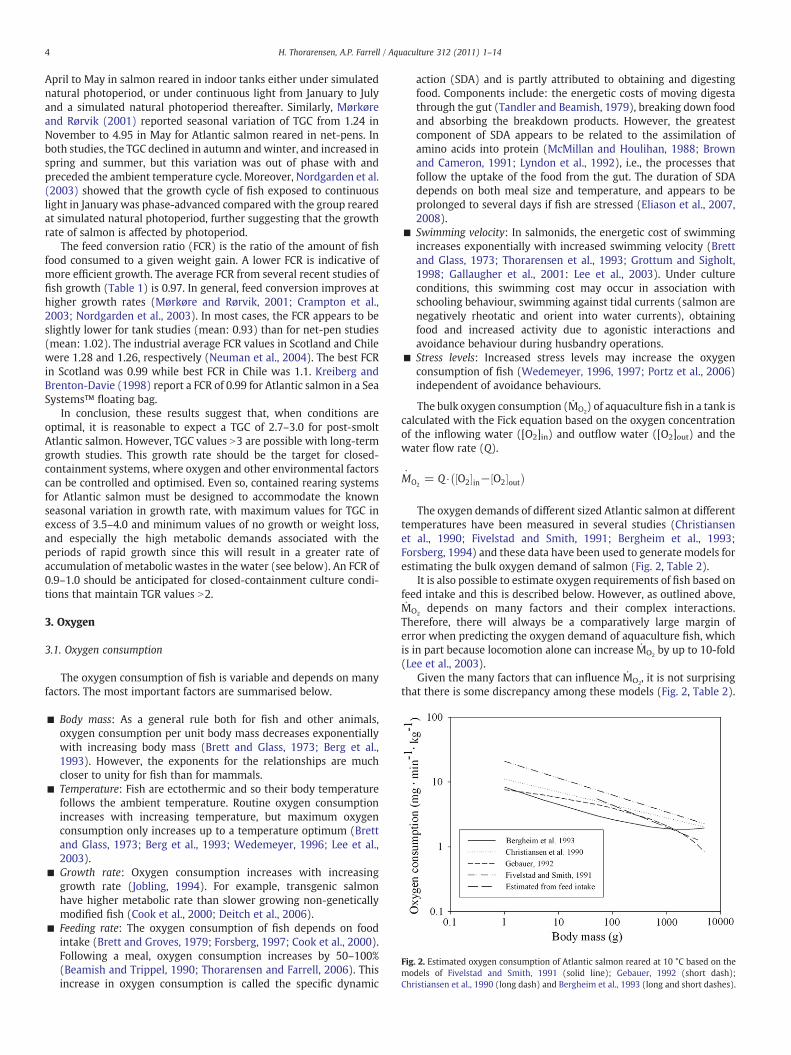
Fig. 2. Estimated oxygen consumption of Atlantic salmon reared at 10 °C based on themodels of Fivelstad and Smith, 1991 (solid line); Gebauer, 1992 (short dash);Christiansen et al., 1990 (long dash) and Bergheim et al., 1993 (long and short dashes).
4 H. Thorarensen, A.P. Farrell / Aquaculture 312 (2011) 1–14
April to May in salmon reared in indoor tanks either under simulatednatural photoperiod, or under continuous light from January to Julyand a simulated natural photoperiod thereafter. Similarly, Mørkøreand Rørvik (2001) reported seasonal variation of TGC from 1.24 inNovember to 4.95 in May for Atlantic salmon reared in net-pens. Inboth studies, the TGC declined in autumn andwinter, and increased inspring and summer, but this variation was out of phase with andpreceded the ambient temperature cycle. Moreover, Nordgarden et al.(2003) showed that the growth cycle of fish exposed to continuouslight in January was phase-advanced compared with the group rearedat simulated natural photoperiod, further suggesting that the growthrate of salmon is affected by photoperiod.
The feed conversion ratio (FCR) is the ratio of the amount of fishfood consumed to a given weight gain. A lower FCR is indicative ofmore efficient growth. The average FCR from several recent studies offish growth (Table 1) is 0.97. In general, feed conversion improves athigher growth rates (Mørkøre and Rørvik, 2001; Crampton et al.,2003; Nordgarden et al., 2003). In most cases, the FCR appears to beslightly lower for tank studies (mean: 0.93) than for net-pen studies(mean: 1.02). The industrial average FCR values in Scotland and Chilewere 1.28 and 1.26, respectively (Neuman et al., 2004). The best FCRin Scotland was 0.99 while best FCR in Chile was 1.1. Kreiberg andBrenton-Davie (1998) report a FCR of 0.99 for Atlantic salmon in a SeaSystems™ floating bag.
In conclusion, these results suggest that, when conditions areoptimal, it is reasonable to expect a TGC of 2.7–3.0 for post-smoltAtlantic salmon. However, TGC values N3 are possible with long-termgrowth studies. This growth rate should be the target for closed-containment systems, where oxygen and other environmental factorscan be controlled and optimised. Even so, contained rearing systemsfor Atlantic salmon must be designed to accommodate the knownseasonal variation in growth rate, with maximum values for TGC inexcess of 3.5–4.0 and minimum values of no growth or weight loss,and especially the high metabolic demands associated with theperiods of rapid growth since this will result in a greater rate ofaccumulation of metabolic wastes in the water (see below). An FCR of0.9–1.0 should be anticipated for closed-containment culture condi-tions that maintain TGR values N2.
3. Oxygen
3.1. Oxygen consumption
The oxygen consumption of fish is variable and depends on manyfactors. The most important factors are summarised below.
■ Body mass: As a general rule both for fish and other animals,oxygen consumption per unit body mass decreases exponentiallywith increasing body mass (Brett and Glass, 1973; Berg et al.,1993). However, the exponents for the relationships are muchcloser to unity for fish than for mammals.
■ Temperature: Fish are ectothermic and so their body temperaturefollows the ambient temperature. Routine oxygen consumptionincreases with increasing temperature, but maximum oxygenconsumption only increases up to a temperature optimum (Brettand Glass, 1973; Berg et al., 1993; Wedemeyer, 1996; Lee et al.,2003).
■ Growth rate: Oxygen consumption increases with increasinggrowth rate (Jobling, 1994). For example, transgenic salmonhave higher metabolic rate than slower growing non-geneticallymodified fish (Cook et al., 2000; Deitch et al., 2006).
■ Feeding rate: The oxygen consumption of fish depends on foodintake (Brett and Groves, 1979; Forsberg, 1997; Cook et al., 2000).Following a meal, oxygen consumption increases by 50–100%(Beamish and Trippel, 1990; Thorarensen and Farrell, 2006). Thisincrease in oxygen consumption is called the specific dynamic
action (SDA) and is partly attributed to obtaining and digestingfood. Components include: the energetic costs of moving digestathrough the gut (Tandler and Beamish, 1979), breaking down foodand absorbing the breakdown products. However, the greatestcomponent of SDA appears to be related to the assimilation ofamino acids into protein (McMillan and Houlihan, 1988; Brownand Cameron, 1991; Lyndon et al., 1992), i.e., the processes thatfollow the uptake of the food from the gut. The duration of SDAdepends on both meal size and temperature, and appears to beprolonged to several days if fish are stressed (Eliason et al., 2007,2008).
■ Swimming velocity: In salmonids, the energetic cost of swimmingincreases exponentially with increased swimming velocity (Brettand Glass, 1973; Thorarensen et al., 1993; Grottum and Sigholt,1998; Gallaugher et al., 2001: Lee et al., 2003). Under cultureconditions, this swimming cost may occur in association withschooling behaviour, swimming against tidal currents (salmon arenegatively rheotatic and orient into water currents), obtainingfood and increased activity due to agonistic interactions andavoidance behaviour during husbandry operations.
■ Stress levels: Increased stress levels may increase the oxygenconsumption of fish (Wedemeyer, 1996, 1997; Portz et al., 2006)independent of avoidance behaviours.
The bulk oxygen consumption (ṀO2) of aquaculture fish in a tank is
calculated with the Fick equation based on the oxygen concentrationof the inflowing water ([O2]in) and outflow water ([O2]out) and thewater flow rate (Q).
MO2= Q⋅ O2½ �in− O2½ �out
� �
The oxygen demands of different sized Atlantic salmon at differenttemperatures have been measured in several studies (Christiansenet al., 1990; Fivelstad and Smith, 1991; Bergheim et al., 1993;Forsberg, 1994) and these data have been used to generate models forestimating the bulk oxygen demand of salmon (Fig. 2, Table 2).
It is also possible to estimate oxygen requirements of fish based onfeed intake and this is described below. However, as outlined above,ṀO2
depends on many factors and their complex interactions.Therefore, there will always be a comparatively large margin oferror when predicting the oxygen demand of aquaculture fish, whichis in part because locomotion alone can increase ṀO2
by up to 10-fold(Lee et al., 2003).
Given the many factors that can influence ṀO2, it is not surprising
that there is some discrepancy among these models (Fig. 2, Table 2).

Table 2Oxygen consumption (in mg·kg−1·min−1) of post-smolt Atlantic salmon in land-based tanks.
Oxygen consumption Ref.
ṀO2=10−0.841 ∙(W/1000)−0.261 ∙T1.378 Fivelstad and Smith (1991)
ṀO2=2.641[(−0.027T−0.031)·ln(W)+0.266T+0.22] Gebauer (1992)
ṀO2=5.5W−0.2 ∙exp0.07T Christiansen et al. (1990)
ṀO2=7.76W−0.31 ∙100.015C Bergheim et al. (1993)
ṀO2max=0.26+8.46W−0.31 ∙100.015C Bergheim et al. (1993)
ṀO2maxmaximumṀO2
;W: bodymass (g); T: temperature (°C); C: water current (cm·s−1).
5H. Thorarensen, A.P. Farrell / Aquaculture 312 (2011) 1–14
At 10 °C, the factorial difference between the highest and lowestestimates is nearly three-fold. Bergheim et al. (1993) compiledinformation onṀO2
in Norwegian land-based salmon farms and foundthat observed measurements of ṀO2
deviated significantly from themodels. Similarly, Fivelstad et al. (1999a) found thatmodels of oxygenrequirements only explained about 32–50% of the total variation ofṀO2
in a Norwegian smolt farm. While most models estimate ṀO2
based on bodymass and temperature, Bergheim et al. (1993) found nosignificant effect of temperature on ṀO2
of salmon in several land-based fish farms. Instead, they found water current (and thusswimming velocity) more important in determining the ṀO2
of thesalmon. Thus, factors such as current velocity, time from feeding andphotoperiod appear to contribute to this discrepancy (Bergheim et al.,1993). The variance inṀO2
and the limited ability of models to predictṀO2
will necessitate that adequate safety factors are built into thedesign of land-based farms.
Bulk ṀO2was measured continuously for a single load of over
60,000 kg of adult Atlantic salmon (average weight of 5 kg) aboard alive haul vessel (Farrell, 2006). The fish density during the transportwas around 60 kg m−3, which is very similar to that anticipated forintensive salmon culture. These fish were schooling in the live-holdand had been starved for a week prior to transport so SDA wasavoided. BulkṀO2
stabilised to around 3 mg O2kg−1 min−1 about 3 hafter the stress of loading the fish on board. More recently, Tang et al.(2008) analysed bulk ṀO2
for 80 such trips. They concluded thatFarrell (2006) had over-estimated the water flow rate through thelive-hold, resulting in an overestimate of bulk ṀO2
due to a minorerror in the calibration of water flow through the vessel's cargo holds.Instead, their analysis showed that bulkṀO2
during livehold transportof adult Atlantic salmon stabilised at 2.26 mgO2kg−1 min−1 at 10 °C,a value that is very similar to those reported for single salmon inrespirometry vessels and in good agreement with predictions of thevarious models for oxygen consumption of Atlantic salmon (Fig. 2).
The ṀO2of fish is linked to feed intake (Forsberg, 1997). Timmons
et al. (2001) suggest that, as a general rule, the ratio between the dailyoxygen consumption and feed intake (in units of mass) is about0.25:1. This value is lower than values reported from studies ofAtlantic salmon. Forsberg (1997) measured a ratio almost twice ashigh, around 0.47:1, while Seymour et al. (1992) reported a ratioranging from 0.25:1 to 0.50:1 in post-smolt Atlantic salmon fed to amaximum level. The reasons for this discrepancy are unclear.
Obviously the ratio betweenṀO2and feed intake is not constant. It
is high when fish are fed low rations (and infinitely high in starvedfish) and lower when they are fed full ration (Forsberg, 1997).Moreover, the relationship is not isometric, i.e., when feed intakedoubles, the ṀO2
does not necessarily double (Forsberg, 1997). Thediscrepancy between different estimates of ṀO2
and feed intake mayalso reflect experimental error. For example, overestimates of feedintake may reduce the ratio and inefficient oxygenation of the rearingwater may cause the estimated ratio to be too high. Therefore,estimates of mean ṀO2
based on feed intake may be inaccurate.The diurnal fluctuations in the ṀO2
of fish are primarily associatedwith feed intake (Brett and Zala, 1975; Bergheim et al., 1993;Thorarensen and Farrell, 2006). These fluctuations are important inaquaculture because they affect the oxygen concentration in the rearing
water. Two independent empirical studies of theṀO2of Atlantic salmon
in intensive culture in tanks, suggest that the ṀO2maxmay be 15–25%
higher than the mean diurnal ṀO2(Bergheim et al., 1993; Forsberg,
1994). Design of closed containment systems needs to accommodatesuch fluctuations in ṀO2
, because when ṀO2increases, the oxygen
concentration in the tank correspondingly decreases. Fluctuations inṀO2
should not reduce the oxygen concentration in the water to a levelwhere the growth of the fish is impaired. Consequently, information onacceptable levels of oxygen for optimal growth is a central requirementto designing an optimal closed containment system.
3.2. Acceptable levels of oxygen
Oxygen is poorly soluble in water. There is approximately 30-times less oxygen in a litre of water than a litre of air. Furthermore, theamount of oxygen contained in water decreases with increasingtemperature and salinity in predictable ways. Less oxygen is held infully air-saturated warm sea water than fully air-saturated coldfreshwater.
While oxygen content of the water sets the absolute availability ofoxygen in the water, it is the oxygen partial pressure gradient thatdetermines how rapidly oxygen can move from the water into thefish's blood to support its metabolic rate. This is because oxygenmoves by diffusion across the gills of fish. According to Fick's law ofdiffusion, the rate of diffusion of oxygen across the gills is determinedby the gill area, the diffusion distance across the gill epithelia, thediffusion constant and the partial pressure difference for oxygenacross the gills, i.e., the difference between the water and the venousblood. Ultimately, it is the partial pressure of oxygen that determineswhether the arterial blood is fully saturated with oxygen. Conse-quently, partial pressure of oxygen is the most useful term forexpressing oxygen levels in aquaculture water.
However, oxygen concentration (mgO2·L−1) is themore commonlyused term in aquaculture and, for a given temperature and salinity, thepartial pressure of oxygen and oxygen content in water are linearlyrelated. The practical method of choice for expressing oxygen levels inaquaculture water is % air saturation, which is directly proportional tothe partial pressure and is reported on most oxygen probes that havebuilt in algorithms for temperature and salinity. Thus, 100% air-saturated cold water will have the same partial pressure of oxygen,but a higher oxygen content than 100% air-saturated warmwater. (Theterm % air saturation is often reduced to just % saturation, but this cancause confusion when oxygenation is used).
Despite its importance, there is a general paucity of information onthe effect of oxygen on the growth and welfare of Atlantic salmon.However, there is evidence to indicate that during late summer andautumn, when temperatures are maximal and background aquaticrespiration is high, seasonally low levels of oxygen may reduce growthand increase mortality of Atlantic salmon in net-pens (Crampton et al.,2003; Bergheim et al., 2006). At low oxygen levels (50% air saturation),the growth rate of salmonids is compromised (Dabrowski et al., 2003).The minimum oxygen level commonly recommended for general fishaquaculture, 90 Torr (56–57% air saturation; Timmons et al., 2001; Portzet al., 2006), is too low for salmonids. The growth rate of Atlantic salmonpost-smolts was 30% lower when fish were reared at 5–6 mg O2 L−1
(about 58% air saturation) compared with fish reared at 8–9 mg O2 L−1
(about 89% saturation) (Berg and Danielsberg, 1993). Wedemeyer(1997) suggested using 71–81% air saturation for aquaculturefish in thetemperature rangeof 5–15 °C. Even so, there is good evidence to suggestthat even this level of oxygen availability is still too low to maximisegrowth rate of Atlantic salmon. For example, Crampton et al. (2003)found a linear increase in growth rate and a decrease in food conversionratio (FCR) for Atlantic salmon between 50 and 100% of air saturation(Fig. 3). Similarly, Bergheim et al. (2006) showed improved growthperformance of salmon from 70–75% to 80–85% air saturation.
6 H. Thorarensen, A.P. Farrell / Aquaculture 312 (2011) 1–14
There is conflicting evidence on theeffect of oxygen saturation above100% air saturation on the growth of Atlantic salmon. Lygren et al.(2000) did not find any improvement in the growth of Atlantic salmonpresmoltswhenoxygen injectionwasused to raise oxygen to 140–150%air saturation (as compared with results for 85–90%). In contrast,Hosfeld et al. (2008) found better growth performance in pre-smoltsreared at 123% oxygen saturation compared with both 93% or 111% airsaturation. It is not clear what caused this difference.
Higher levels of oxygen (beyond 140–150% air saturation) maybecome detrimental to salmon by causing oxidative stress, gas bubbledisease and increased susceptibility to other diseases and increasedmortality (Lygren et al., 2000; Fridell et al., 2007; Espmark et al., 2010).Exposure to hyperoxia also reduces the respiration frequency, whichresults in the retention of CO2 in the blood and causes a respiratoryacidosis (Powell and Perry, 1997). Raising oxygen availability to 500%air saturation, as may occur during transport of fish using pure O2, cancause plasma ion imbalance, hypercapnia, respiratory acidosis andstress in Atlantic salmon smolts (Brauner et al., 2000a). The effect ofhyperoxia on fish may depend on the total gas pressure (TGP) in therearing water. Thus, when the addition of oxygen causes the TGP toincrease over 100%, gas bubble disease is more likely to occur thanwhen the TGP is at or below100% (Wedemeyer;, 1996). Unfortunately,studies on hyperoxia seldom report TGP.
Collectively, these data suggest that at least 85% air saturation andperhaps up to 120% air saturation is required to maintain maximumgrowth rate of Atlantic salmon. Below this range, growth rate willdecrease and fish welfare may be compromised above 140% airsaturation. The linear relationship between growth and oxygenavailability between 50% and 100% air saturation (Crampton et al.,2003) suggests a 37% improvement of growth rate of Atlantic salmon byraising the oxygen availability from the recommended 70% to 100% airsaturation (Fig. 3).However, in closed-containment salmon aquaculturesystems, this benefit must be weighed against the cost of addingsupplemental oxygen to elevate oxygen saturation to optimise fishgrowth.
4. Carbon dioxide
4.1. Production of carbon dioxide
The concentration of dissolved carbon dioxide gas (CO2) inseawater is generally low. However, CO2 produced by the fish throughaerobic metabolism will accumulate in water during intensiveaquaculture because water volumes and exchange rates are typicallyreduced relative to fish biomass. In fact, CO2 accumulation is a limiting
Fig. 3. Growth rate of Atlantic salmon at different levels of oxygen saturation. The figure isredrawn from Crampton et al. (2003) (solid line), Berg and Danielsberg (1993) (filledcircles) and Hosfeld et al., 2008 (open squares). Broken lines show expected relationship.
factor in intensive aquaculture systems whenever oxygen is injectedinto the inlet water and water exchange rate is reduced (Sanni andForsberg, 1996). The problem that arises is that high concentrations ofdissolved CO2 gas have anaesthetic effects on fish (Bernier andRandall, 1998) and become lethal if allowed to rise excessively(Wedemeyer, 1997). Moreover, there is evidence that long-termexposure to sub-lethal but elevated levels of CO2 may compromisegrowth and welfare of Atlantic salmon (Fivelstad et al., 1999b).
Most of the CO2 produced in salmonids diffuses as a gas across gills inthe form of molecular CO2 (Perry et al., 1982). Molecular CO2 reacts withwater to produce carbonic acid (H2CO3), bicarbonate (HCO3
−) andcarbonate (CO3
−2):
CO2 ↔ H2CO3 ↔ Hþ þ HCO
−3 ↔ 2H
þ þ CO−23 :
The equilibrium of these reactions depends on water pH. Withinthe pH range recommended for aquaculture (Wedemeyer, 1996;Timmons et al., 2001) most of the CO2 excreted by fish will react withwater to produce HCO3
− and a comparatively small proportionremains as dissolved CO2 gas. However, any progressive addition ofCO2 to water causes pH to decrease and this, in turn, shifts theequilibrium from HCO3
− to CO2. Therefore, there is an inverseexponential relationship between CO2 partial pressure and waterpH. Given the difficulty of measuring CO2 in water, it is possible toestimate CO2 from pH measurements provided there is appropriatecalibration for the type of water since the buffering capacity ofseawater and freshwater differs dramatically.
The partial pressure of CO2 in well-aerated water is close toatmospheric levels (~0.3 Torr). The CO2 diffuses out of the fish and intothe water down a relatively small (1–3 Torr) partial pressure gradient(Clairborne, 1997) when compared with the partial pressure gradient foroxygen, which is 120–140 Torr when the ambient water is 100% air-saturated (Brauner et al., 2000b).
Unless CO2 is removed from the rearing water (usually with waterreplacement), CO2 excretion by the fish increases the concentrationand partial pressure of CO2 in the water. Any increase in ambient CO2
partial pressure is rapidly reflected in blood CO2 (Randall andDaxboeck, 1984). Thus, aquatic hypercarbia (an increase in the partialpressure of CO2 in the water) causes hypercapnia (an increase in thepartial pressure of CO2 in the blood) in the fish and correspondinglydecreases blood pH (acidemia). However, over a period of few daysfish can compensate for the reduced blood pH by excreting H+ andtaking up of HCO3
− from the surrounding water (Heisler, 1984, 1986;Clairborne, 1997). Thus, fish subjected to hypercarbic environmentsmay have near normal blood pH while being hypercapnic. Even so,there is a limit to these compensatory mechanisms, which then setsthe upper limit for CO2 tolerance in fish.
Long-term exposure to elevated levels of dissolved CO2 gas hasdetrimental effects on fish. Hypercapnia may compromise the capacityof blood to transport oxygen through the Bohr and Root effects iferythrocyte pH is not protected (Wedemeyer, 1997). High ambientlevels of CO2 also have profound effects on the respiratory andcardiovascular systems, e.g., increased ventilation rate, elevated bloodpressure and depressed heart rate (Perry and McKendry, 2001; Perryand Gilmour, 2002). The long-term effects of exposure to high levels ofCO2 on fish include reduced growth rate, higher FCR and nephrocalci-nosis (Smart et al., 1979; Smart, 1981; Fivelstad et al., 1999b, 2003b,2007). Furthermore, if the CO2 level is high enough to lower water pH,the water solubility of metals such as aluminium increases, which thenmay exert toxic metal effects on the fish (Fivelstad et al., 2003b). Incontrast to dissolved CO2, elevatedHCO3
− concentration does not appearto be harmful to fish (Randall and Wright, 1995).
Based on the stoichiometry of the chemical reactions involved in themetabolism of carbohydrates, one mole of CO2 is produced when onemole of O2 is consumed. This results in a respiratory quotient (RQ= theratio (moles) of CO2 producedwhenO2 is consumed) of unity. However,
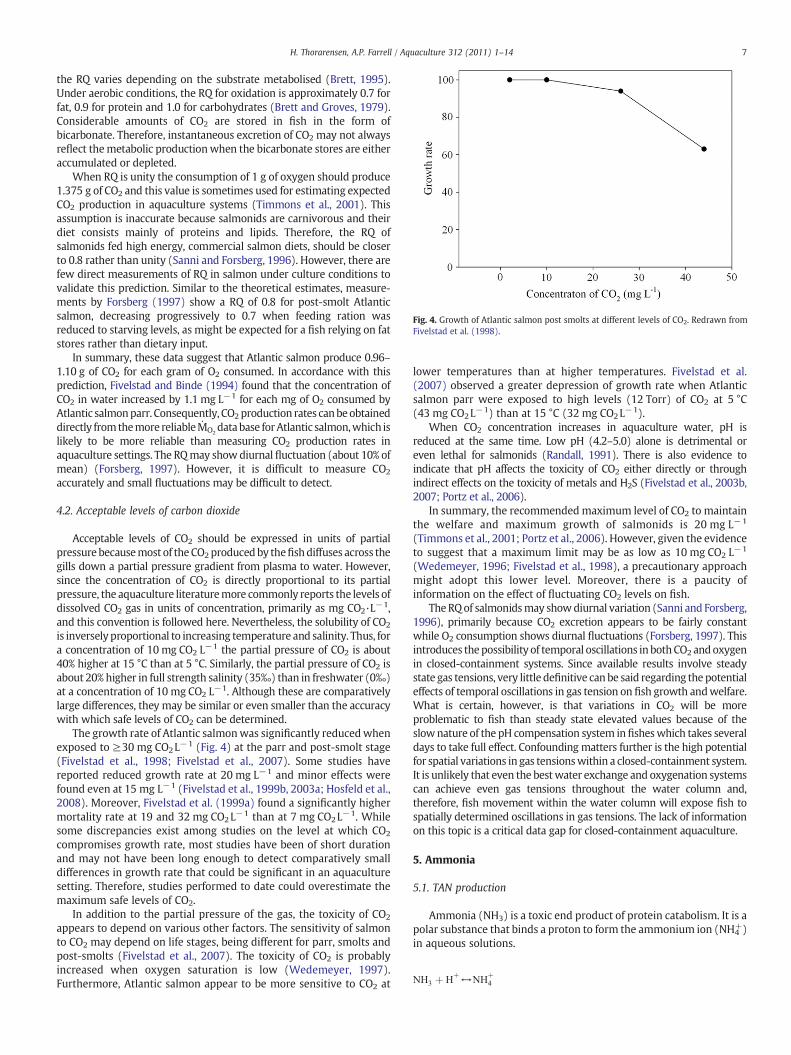
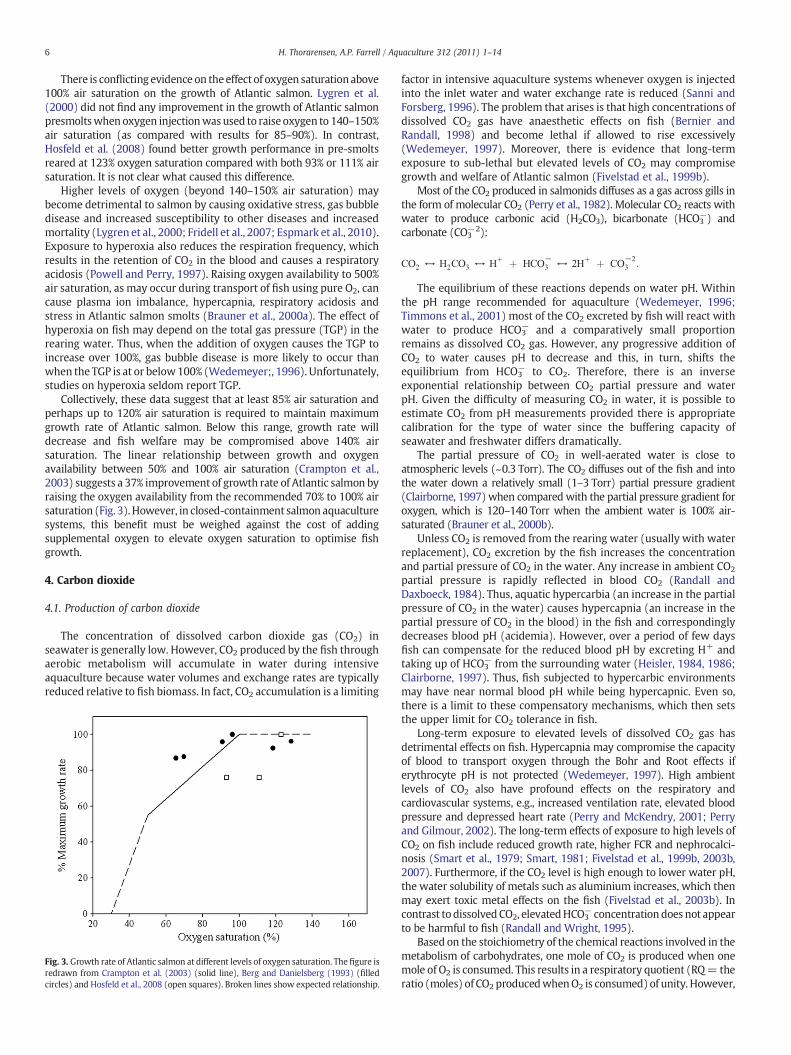
Fig. 4. Growth of Atlantic salmon post smolts at different levels of CO2. Redrawn fromFivelstad et al. (1998).
7H. Thorarensen, A.P. Farrell / Aquaculture 312 (2011) 1–14
the RQ varies depending on the substrate metabolised (Brett, 1995).Under aerobic conditions, the RQ for oxidation is approximately 0.7 forfat, 0.9 for protein and 1.0 for carbohydrates (Brett and Groves, 1979).Considerable amounts of CO2 are stored in fish in the form ofbicarbonate. Therefore, instantaneous excretion of CO2 may not alwaysreflect themetabolic productionwhen the bicarbonate stores are eitheraccumulated or depleted.
When RQ is unity the consumption of 1 g of oxygen should produce1.375 g of CO2 and this value is sometimes used for estimating expectedCO2 production in aquaculture systems (Timmons et al., 2001). Thisassumption is inaccurate because salmonids are carnivorous and theirdiet consists mainly of proteins and lipids. Therefore, the RQ ofsalmonids fed high energy, commercial salmon diets, should be closerto 0.8 rather than unity (Sanni and Forsberg, 1996). However, there arefew direct measurements of RQ in salmon under culture conditions tovalidate this prediction. Similar to the theoretical estimates, measure-ments by Forsberg (1997) show a RQ of 0.8 for post-smolt Atlanticsalmon, decreasing progressively to 0.7 when feeding ration wasreduced to starving levels, as might be expected for a fish relying on fatstores rather than dietary input.
In summary, these data suggest that Atlantic salmon produce 0.96–1.10 g of CO2 for each gram of O2 consumed. In accordance with thisprediction, Fivelstad and Binde (1994) found that the concentration ofCO2 in water increased by 1.1 mg L−1 for each mg of O2 consumed byAtlantic salmonparr. Consequently, CO2production rates canbeobtaineddirectly fromthemore reliableṀO2
database forAtlantic salmon,which islikely to be more reliable than measuring CO2 production rates inaquaculture settings. The RQmay showdiurnal fluctuation (about 10% ofmean) (Forsberg, 1997). However, it is difficult to measure CO2
accurately and small fluctuations may be difficult to detect.
4.2. Acceptable levels of carbon dioxide
Acceptable levels of CO2 should be expressed in units of partialpressure becausemost of theCO2producedby thefishdiffuses across thegills down a partial pressure gradient from plasma to water. However,since the concentration of CO2 is directly proportional to its partialpressure, the aquaculture literaturemore commonly reports the levels ofdissolved CO2 gas in units of concentration, primarily as mg CO2·L−1,and this convention is followed here. Nevertheless, the solubility of CO2
is inversely proportional to increasing temperature and salinity. Thus, fora concentration of 10 mg CO2 L−1 the partial pressure of CO2 is about40% higher at 15 °C than at 5 °C. Similarly, the partial pressure of CO2 isabout 20% higher in full strength salinity (35‰) than in freshwater (0‰)at a concentration of 10 mg CO2 L−1. Although these are comparativelylarge differences, they may be similar or even smaller than the accuracywith which safe levels of CO2 can be determined.
The growth rate of Atlantic salmonwas significantly reducedwhenexposed to ≥30 mg CO2L−1 (Fig. 4) at the parr and post-smolt stage(Fivelstad et al., 1998; Fivelstad et al., 2007). Some studies havereported reduced growth rate at 20 mg L−1 and minor effects werefound even at 15 mg L−1 (Fivelstad et al., 1999b, 2003a; Hosfeld et al.,2008). Moreover, Fivelstad et al. (1999a) found a significantly highermortality rate at 19 and 32 mg CO2L−1 than at 7 mg CO2L−1. Whilesome discrepancies exist among studies on the level at which CO2
compromises growth rate, most studies have been of short durationand may not have been long enough to detect comparatively smalldifferences in growth rate that could be significant in an aquaculturesetting. Therefore, studies performed to date could overestimate themaximum safe levels of CO2.
In addition to the partial pressure of the gas, the toxicity of CO2
appears to depend on various other factors. The sensitivity of salmonto CO2 may depend on life stages, being different for parr, smolts andpost-smolts (Fivelstad et al., 2007). The toxicity of CO2 is probablyincreased when oxygen saturation is low (Wedemeyer, 1997).Furthermore, Atlantic salmon appear to be more sensitive to CO2 at
lower temperatures than at higher temperatures. Fivelstad et al.(2007) observed a greater depression of growth rate when Atlanticsalmon parr were exposed to high levels (12 Torr) of CO2 at 5 °C(43 mg CO2L−1) than at 15 °C (32 mg CO2L−1).
When CO2 concentration increases in aquaculture water, pH isreduced at the same time. Low pH (4.2–5.0) alone is detrimental oreven lethal for salmonids (Randall, 1991). There is also evidence toindicate that pH affects the toxicity of CO2 either directly or throughindirect effects on the toxicity of metals and H2S (Fivelstad et al., 2003b,2007; Portz et al., 2006).
In summary, the recommendedmaximum level of CO2 to maintainthe welfare and maximum growth of salmonids is 20 mg L−1
(Timmons et al., 2001; Portz et al., 2006). However, given the evidenceto suggest that a maximum limit may be as low as 10 mg CO2 L−1
(Wedemeyer, 1996; Fivelstad et al., 1998), a precautionary approachmight adopt this lower level. Moreover, there is a paucity ofinformation on the effect of fluctuating CO2 levels on fish.
TheRQof salmonidsmay showdiurnal variation (Sanni and Forsberg,1996), primarily because CO2 excretion appears to be fairly constantwhile O2 consumption shows diurnal fluctuations (Forsberg, 1997). Thisintroduces thepossibility of temporal oscillations inbothCO2 andoxygenin closed-containment systems. Since available results involve steadystate gas tensions, very little definitive canbe said regarding the potentialeffects of temporal oscillations in gas tension on fish growth andwelfare.What is certain, however, is that variations in CO2 will be moreproblematic to fish than steady state elevated values because of theslownature of the pH compensation system infisheswhich takes severaldays to take full effect. Confounding matters further is the high potentialfor spatial variations in gas tensionswithin a closed-containment system.It is unlikely that even the bestwater exchange and oxygenation systemscan achieve even gas tensions throughout the water column and,therefore, fish movement within the water column will expose fish tospatially determined oscillations in gas tensions. The lack of informationon this topic is a critical data gap for closed-containment aquaculture.
5. Ammonia
5.1. TAN production
Ammonia (NH3) is a toxic end product of protein catabolism. It is apolar substance that binds a proton to form the ammonium ion (NH4
+)in aqueous solutions.
NH3 þ Hþ↔NH
þ4

Table 3Ammonia quotient (moles ammonia produced/moles oxygen consumed) of salmon.
AQ Ref.
0.07–0.12 Brett and Zala (1975)0.11–0.12 Seymour and Aabel (1990)0.03–0.1 Bergheim et al. (1991)0.095–0.111 Seymour et al. (1992)0.032–0.097 Forsberg (1997)
Table 4Recommended maximum levels of NH3–N (concentration of nitrogen bound as NH3)for salmonid aquaculture.
NH –N (mg·L−1) Ref.
8 H. Thorarensen, A.P. Farrell / Aquaculture 312 (2011) 1–14
The total concentration of nitrogen as both NH3 and NH4+ is called
total ammonia nitrogen (TAN). The equilibrium constant (pK=9.5–10.0) of the above equation is such that, at the pH of water and bodyfluids of salmon, most of TAN is in the form of NH4
+. The equilibrium isshifted to the right as pH and temperature decrease and when salinityincreases (Boyd, 2000). Even so, seawater is generally more alkalinethan freshwater and, at an equivalent TAN concentration, it has agreater NH3 concentration.
In fish, NH3 is the major nitrogenous metabolite, with urea oftencontributing a small fraction (10–20%) (Wood, 1995; Forsberg, 1997).Fish also excrete significant amounts of other nitrogen waste such asamino acids and protein that are not derived from proteinmetabolism(Kajimura et al., 2004). For example, loss of mucus from fish skin canalso increase in TAN in water.
The rate of nitrogen excretion increases appreciably with feedingrate (Wood, 1995; Forsberg, 1997; Kajimura et al., 2004). Dailyfluctuations in TAN excretion are linked to feeding and the maximumpostprandial TAN excretion may be about 30–67% higher than thedaily mean (Brett and Zala, 1975; Seymour, 1990; Seymour et al.,1992; Forsberg, 1997).
The ammonia quotient (AQ) is the ratio of ammonia produced andoxygen consumed. The reported AQ for salmonids is generallybetween 0.03 and 0.13 (Table 3). Atlantic salmon fed a full rationhave AQ of 0.09–0.13 (Forsberg, 1997), which corresponds to aproduction of 0.04–0.06 g of TAN for each gram of oxygen consumedby the fish.
TAN production can be estimated from the amount of ingestedfeed. The production of TAN depends on the digestibility and proteincontent of the feed, and on the proportion of absorbed amino acidsassimilated into proteins (Timmons et al., 2001). Therefore, TANproduction (PTAN) can be estimated based on the following equation:
PTAN = F⋅PC⋅0:092:
Where F is feeding rate (mass of food ∙unit time−1), PC is proteinratio of the diet. The constant is based on several assumptions.2 Forsimplicity, Timmons et al. (2001) suggested that TAN production forAtlantic salmon could be estimated as 10% of protein consumed, whichappears to be a reasonable approximation given the available data.
5.2. Acceptable levels of ammonia
In freshwater fish, the main pathway for NH3 excretion appears tobe diffusion of NH3 across the gills and down a partial pressuregradient (Wood, 1995). Therefore, any accumulation of NH3 in rearingwater will increase the water partial pressure of NH3, reducing theefflux of NH3 across the gills and elevating plasma NH3 (Wright, 1993;Shingles et al., 2001).
In seawater fish, diffusion of NH3 down a partial pressure gradientacross the gills is also an important pathway for NH3 excretion. Inaddition, the transepithelial potential offish in seawatermay also favourpassive movement of NH4
+ from plasma across the gills down its
2 The constant 0.092=0.016 ∙0.8 ∙0.8 ∙0.9 is calculated making the following assump-tions (Timmons et al., 2001). Protein is 16% nitrogen, 80% of nitrogen is assimilated, 80% ofassimilated nitrogen is excreted, 90% of nitrogen is excreted as TAN.
electrochemical gradient (Randall and Wright, 1995). Moreover, thegills of rainbow trout appear to be more permeable to NH4
+ in seawaterthan in freshwater (Wilson and Taylor, 1992) and rainbow troutmay beable to actively excrete NH4
+ against a high concentration gradient inseawater viaNa+/NH4
+ exchangemechanism (Wilson and Taylor, 1992;Randall and Tsui, 2002). This suggests that NH3 excretion throughdiffusion is not as important in seawater as it is in freshwater and thathigh concentrations of NH4
+may also contribute to ammonia toxicity inseawater (Randall and Wright, 1995).
The mechanism of ammonia toxicity has recently been reviewed(Randall and Tsui, 2002; McKenzie et al., 2003; Randall and Ip, 2006).Briefly, NH3 is a non-polar gas that is highly soluble in water anddiffuses readily through cell membranes whereas most membranesare much less permeable to NH4
+ (Randall and Wright, 1995).However, the pH of intracellular fluid is lower than that ofextracellular fluid and, therefore, ammonia is trapped inside cells asNH4
+ (Randall and Wright, 1995). At normal blood pH (pH 7.9–8.0),98% of TAN in blood exists as NH4
+ (Randall andWright, 1995) and it isthis species that may be responsible for toxic effects (McKenzie et al.,2003; Randall and Ip, 2006). Acute toxicity of ammonia in vertebratesappears to be mainly due to its effect on the central nervous system(Randall and Tsui, 2002). However, toxic effects also includedisruption of enzyme systems and membrane stability, gill damageand histological lesions in various internal organs and osmoregulatorydisturbances (Boyd, 2000; McKenzie et al., 2003; Portz et al., 2006).The short-term effects of elevated NH3 on fish are a lack of foraging,reduced swimming performance, increased gill ventilation, erraticand quick movements, coughing, convulsions, loss of equilibrium andultimately mortality (Meade, 1985; Russo and Thurston, 1991;Shingles et al., 2001). Chronic exposure to elevated levels of NH3
will increase metabolic rate, reduce growth rate, disease resistanceand fecundity (Russo and Thurston, 1991; Shingles et al., 2001;Timmons et al., 2001).
The recommended maximum safe levels for NH3 in salmonidaquaculture to support maximum growth and welfare range between0.012 and 0.030 mg NH3–N L−1 (Table 4). However, there aresignificant species differences in sensitivity to NH3 (McKenzie et al.,2003). Following an experiment involving long-term exposure ofAtlantic salmon to elevated aquatic levels of NH3, Fivelstad et al.(1995) suggested that the maximum safe level for NH3–N was0.012 mg NH3–N L−1. A recommendedmaximum level for short-termexposure (4 h) is 0.1 mg NH3–N L−1 (Wedemeyer, 1996). Waterquality may affect the toxicity of NH3 (e.g., temperature, salinity,hardness and alkalinity) and modulate the maximum safe levels forNH3 (Randall and Wright, 1995). TAN toxicity varies with pH, but theinfluence of temperature and salinity on toxicity of TAN is limited(Randall and Tsui, 2002).
Exercise, feeding and stress all affect the sensitivity of salmonids toambient NH3 levels (Randall and Tsui, 2002). Swimming fish appear tobe more susceptible to acute NH3 toxicity than resting fish (Randalland Tsui, 2002). This is because plasma NH3 levels naturally increaseduring exercise (Shingles et al., 2001; Wicks et al., 2002; Jain andFarrell, 2003), adding to the burden of elevated ambient NH3. Elevatedplasma NH3 may contribute to reduced swimming performance athigh ambient NH3. Plasma NH3 also increases in salmonids followingfeeding (Kiessling et al., 1995; Karlsson et al., 2006) and can reach alevel that is toxic for starved fish (Wicks and Randall, 2002a,b).
3
0.0165–0.025 Wedemeyer (1996, 1997)0.0125 Timmons et al. (2001)0.012 Fivelstad et al. (1995)

9H. Thorarensen, A.P. Farrell / Aquaculture 312 (2011) 1–14
However, actively feeding fish have greater tolerance for external NH3
possibly because of up-regulation of glutamate synthetase, whichthen reduces internal levels of NH3 (Wicks et al., 2002). Thus, fish doshow some compensatory ability towards elevated plasma NH3.
High fish density and poor rearing conditions can induce stress,which increases NH3 production. Therefore, stressed fish becomemore susceptible to elevated ambient NH3 (Randall and Tsui, 2002).The recommendedmaximum ammonia levels for aquaculture fish are,in general, based on test performed on starved, unstressed fish thatare not exercising and, therefore, may not produce optimal growth(Randall and Tsui, 2002).
6. Nitrite and nitrate
In recirculation aquaculture systems, metabolic ammonia as wellas decomposing feed and feces is converted by nitrifying bacteria tonitrite (NO2
−) and subsequently to nitrate (NO3−). Biofilters provide
substrate for these bacteria to grow on. The nitrifying bacteria areubiquitous and start multiplying in a biofilter once the ammoniaconcentration increases. Initially, bacteria that oxidise ammonia tonitrate, such as Nitrosomonas spp., multiply, causing the nitriteconcentration to increase and the ammonia concentration todecrease. Increased nitrite levels then cause bacteria that oxidisenitrite to nitrate, such as Nitrobacter spp., to multiply, decreasing thenitrite concentration and increasing the nitrate concentration. Thisprocess takes several weeks to complete (Timmons et al., 2001).
Nitrite concentration in recirculation systems may reach toxiclevels during either the priming of the biofilter or with a malfunction.Nitrite toxicity causes gill hypertrophy, hyperplasia and lamellarseparation, in addition to haemorrhage and necrotic lesions in thethymus (Wedemeyer and Yasutake, 1978). However, the principaltoxic effect of nitrite is methaemoglobinemia or “brown blooddisease” (Jensen, 2003). Nitrite oxidises the Fe2+ ion of thehaemoglobin to the Fe3+ state (methaemoglobin) and this oxidisedform of haemoglobin cannot bind oxygen (Jensen, 2003). Therefore,methaemoglobinemia impairs oxygen transport in blood in directproportion to the percentage of methaemoglobin in the blood and thismay limit swimming performance (Brauner et al., 1993). Severemethaemoglobinemia will affect growth and can become lethal(Russo et al., 1981).
Nitrite is the ionised form of nitrous acid (HNO2), a relatively strongacid. However, at the pH normally encountered in aquacultureoperations (pH 6–8), only small amounts are present of the nitrousacid (Colt, 2006). The gill membrane is permeable to nitrous acid, butnot to nitrite. Nitrite is particularly toxic to fish in hypoosmoticfreshwater that actively take up ions at the gills to compensate forthose lost in urine and by passive diffusion across the gills. Nitrite cancompetitively inhibit Cl− uptake (Williams and Eddy, 1986) through anaffinity for the branchial Cl− uptake mechanism, presumably the Cl−/HCO3
− exchanger (Jensen, 2003). This mechanism allows nitrite toaccumulate in the fish against a concentration gradient (Bath and Eddy,1980). The severity of this accumulationdependson the ratio of ambientCl− and NO2
− (Bath and Eddy, 1980). Therefore, nitrite is less toxic inseawater where Cl− concentration is high. Moreover, seawater teleostsare hyposmotic and extrude Cl− across the gills, in contrast tofreshwater fish. However, seawater teleosts drink seawater to compen-sate forwater loss, thus opening the possibility for nitrate uptake acrossthe gut (Jensen, 2003). Since theCl−/HCO3
− exchanger is also involved inpH regulation in fish, nitrite accumulation may affect the tolerance tohypercarbic water.
The 96-hour LC50 for rainbow trout is 0.3 mg NO2−L−1 (Russo et al.,
1981). However, as explained above, the toxicity level is stronglyaffected by the water pH and anion concentration; increasing thedissolved Cl− to 50 mg L−1 may increase the tolerance of salmonidfishes to nitrite by a factor of 50 (Wedemeyer and Yasutake, 1978;Tomasso et al., 1980; Russo et al., 1981). The recommended level for
nitrite is b0.1 mg L−1, which should be adequate to protect the fishunder most conditions (Wedemeyer, 1996; Timmons et al., 2001).
Nitrate will generally not reach toxic levels to fish in aquacultureoperations (Wedemeyer, 1996). The 96-hour LC50 for salmonids is1000–3000 mg L−1, which is comparable to the lethal concentrationof NaCl. Such concentrations may reflect osmotic disturbances ratherthan direct toxic effects (Colt and Armstrong, 1981). Recommendedlevels for nitrate in aquaculture range from b1 mg L−1 (Wedemeyer,1996) to 400 mg L−1 (Timmons et al., 2001) and 500 mg L−1 for largemarine fish.
7. Fish density
In intensive culture systems, the maximum biomass that a givenflow rate can support is primarily determined by the metabolic rate ofthe fish, that is how much oxygen they consume, and how muchwater is available for diluting metabolic wastes from the fish.Behavioural requirements for space are usually a secondary factor indetermining maximum density (Wedemeyer, 1996).
Excessive fish density (expressed as kg fish m−3) may induce astress response (Wedemeyer, 1997; Pickering, 1998). Stress responsesin aquaculture fish have been reviewed extensively (see e.g. Mazeaudet al., 1977; Wedemeyer, 1997; Pickering, 1998; Portz et al., 2006).Briefly, the stress responses consist of an initial release of catechola-mines from chromaffin cells into the blood stream that in turn stimulatethe hypothalamic–pituitary-axis, causing release of corticosteroids (e.g.,cortisol) from the head kidney (Randall and Perry, 1992; Mommsenet al., 1999; Barton, 2002). These primary responses elicit secondarymetabolic (e.g., increased plasma glucose and lactate), haematological(e.g., increased haematocrit), hydromineral (e.g., increased plasmachloride) and structural (e.g., gastric tissue morphology) responses(Barton, 1997). The secondary responses may trigger tertiary responsessuch as reduced growth rate, reduced metabolic scope for activity,reduced swimming performance, decreased disease resistance, de-creased reproductive capacity, altered behaviour and increased mor-tality (Wedemeyer, 1997; Portz et al., 2006).
In salmonid aquaculture, it has been similarly suggested thatincreased densitymay cause various tertiary stress responses, includingincreased mortality, increased metabolism, reduced growth rate,increased size variation, reduced feed intake, increased FCR, poor healthcondition and agonistic behaviour (Wedemeyer, 1997; Ellis et al., 2002;Boujard et al., 2002; Turnbull et al., 2005; Portz et al., 2006). However,results fromdifferent studies on the effect of density on aquaculture fishare inconsistent. In an analysis of 43 published studies on the effect ofrearing density on rainbow trout growth and welfare, Ellis et al. (2002)concluded that increased stocking density does not appear to causeincreased crowding stress, increased disease incidence or increasedmortality. However, therewas evidence to indicate that the fishwelfaremay be reduced at increased density when feed intake is reduced, foodconversion efficiency is increased, growth rate is reduced and fins areeroded (Ellis et al., 2002). The immediate reasons for these responses areunclear, although they are likely linked to either water quality orbehavioural interactions (Wedemeyer, 1997; Ellis et al., 2002).
Increased fish density causes behavioural interactions that arestressful to fish (see reviews by Wedemeyer, 1997; Ellis et al., 2002).These may include non-aggressive interactions such as physicalobstruction from food and collisions with other fish. Moreover,increased density may initiate aggressive behaviour associated withdominance hierarchies (Ellis et al., 2002). Aggressive behaviour thencauses fin and body damage, as well as subordinate behaviours withreduce growth rate in the subordinates and increased size variationamong fish within a tank (Jobling, 1995; North et al., 2006).
The maximum density of Atlantic salmon in contained rearingsystems can bemuch higher than the 15–25 kg m−3 recommended fornet-pens (Willoughby, 1999; Turnbull et al., 2005). However, differ-ences exist for reported effects of high rearing density on growth of

10 H. Thorarensen, A.P. Farrell / Aquaculture 312 (2011) 1–14
Atlantic salmon and rainbow trout. Kjartansson et al. (1988) found nosignificantdifference in the growth and stress hormone levels inAtlanticsalmon kept at 35–45 kg m−3, 65–85 kg m−3 or 100–125 kg m−3. Berget al. (1996) found that there was no difference in the growth rate ofgroups of salmon held at 40–87 kg m−3 compared with 30–50 kg m3.Both Refstie and Kittelsen (1976) and Soderberg and Meade (1987)reported no effect of density on the growth of Atlantic salmon, leadingSoderberg et al. (1993) to conclude that Atlantic salmon parr could bereared at densities up to 80 kg m−3 without reducing growth rate oraffecting fish health. North et al. (2006) found no difference in growthrate of rainbow trout reared at stocking densities of up to 80 kg m−3.Stress increased for Arctic charr, another salmonid species, when rearedbelow 30–40 kg m3, growth was not impaired until 100 kg m3 (Chris-tiansen et al., 1992; Jorgensen et al., 1993). Based on availableinformation, it is difficult to predict themaximumdensitywhen growthis impaired in Atlantic salmon. Many studies use relatively large rangesof densities and, therefore, the fidelity of these studies is limited.However, the results of three studies are summarised in Fig. 5 and thesesuggest that density up to 80 kg m3 does not limit the growth of post-smolt Atlantic salmon.
In contrast, other studies indicate that high rearing densitycompromises growth rate of salmonids. Boujard et al. (2002) foundrainbow trout reared at N70 kg m−3 had a reduced growth ratecompared to rearing at 25 kg m−3. Rasmussen et al. (2007) reportedslightly but significantly lower growth rate of rainbow trout reared at54–124 kg m−3 compared with 18–45 kg m−3. Seymour et al.(1992) reported reduced growth rate, higher FCR and increasedmortality of Atlantic salmon reared at 50–120 m−3 compared toeither 17–50 kg m−3 or 33–90 kg m−3.
When rearing density is high, ambient oxygen levels tend to showlarge fluctuations and this variation could secondarily influencegrowth performance. Furthermore, if oxygen is added to the rearingwater, oxygen concentration may vary regionally within the contain-ment system and the associated localised elevations in CO2 concen-trations could reach critical levels (Fivelstad et al., 1998, 1999a, b).
Conversely, low oxygen saturation can impair growth rate andincrease mortality in salmon (Berg and Danielsberg, 1993; Cramptonet al., 2003; Berg et al., 1996). Therefore, a cautionary note is that theapparent effects of high density may in fact be uneven and reducedoxygen levels. Thus, Seymour et al. (1992) found that the growth rate ofhigh-density rearing of post-smolt salmon was improvedwith ambientoxygen 7–11 mg L−1 versus 5–10 mg L−1.
Interestingly, Forsberg and Bergheim (1996) found no significanteffects of fluctuating oxygen availability between 42 and 135% air
Fig. 5. Growth of Atlantic salmon (% of maximum in each study) reared at differentdensities. Redrawn from Kjartansson et al. (1988) (filled circles, solid line), Berg et al.(1996) (open circles, dotted line) and Soderberg et al. (1993) (filled triangles, broken line).
saturation (mean diurnal levels kept above 80% air saturation) onAtlantic salmon growth, FCR and mortality compared with fish rearedat constant 76% air saturation. Similarly, Seland and Berg (1993) didnot find significant effect on growth of periodic short term exposureto low oxygen levels. Forsberg and Bergheim (1996) conclude thatfluctuations in oxygen levels do not affect growth rate of salmon if themean oxygen saturation is kept above 70–80% air saturation.
In Norwegian land-based farms for post-smolt salmon, thereported density ranged from 10 to 100 kg m−3 (Forsberg, 1995).However, growth of fish in the Norwegian land-based farms wasgenerally lower than in net-pens and this may be related to poorwater quality (Forsberg, 1995). In the land-based farms in Iceland,salmon are commonly reared at density from 20 kg m−3, with themaximum set at 50 kg m−3 before fish are graded or slaughtered(Kristjansson pers. com., 2007). Practical as well as biological reasonsexisted for choosing 50 kg m−3 as the upper limit for density. The fishfarmers claim that if the density is higher, it is difficult to cope withfluctuations in oxygen demand (Kristjansson pers. com., 2007).Commercial rainbow trout farmers in Europe, North-America andAustralasia typically use densities within the range of 15–40 kg m−3,with 60 kg m−3 as a maximum (Ellis et al., 2002). However, withadequate water exchange and supplemental oxygen, the potential forusing higher fish densities clearly exists.
In conclusion, there appears to be little or no consistent effect ofdensity up to about 80 kg m−3 on the growth, survival and welfare ofAtlantic salmon. At higher densities some studies report reducedgrowth rate. Whether the reduced growth and other tertiary stressresponses at high densities are a result of poor water quality isunclear. The welfare of aquaculture fish may be compromised at highdensities and, therefore, a precautionary approach is warranted.
8. Flow requirements
Models of carbon dioxide and ammonia accumulation in singlepass aquaculture systems suggest that, when water exchange isreduced and the oxygen need of post-smolt Atlantic salmon issupplied by injecting pure oxygen, ambient CO2will increase to a levelthat may limit fish growth and impair welfare. Sanni et al. (1993)suggest that CO2 will limit production when water flow rate is0.13 L min−1 kg−1. The validity of the assumptions used in thiscalculationwas tested by Sanni and Forsberg (1996) by comparing themodel with measurements from land-based farms. The results showthat when water flow was 0.14 to 0.4 L min1 kg−1, CO2 levels did notexceed 12 mg L−1. Despite the accuracy of this model prediction, thewater requirement is likely an underestimate because they used20 mg L−1 of dissolved CO2 gas as a critical level rather than the10 mg L−1 suggested by a more recent study (Fivelstad et al., 1998).Accommodating this change would elevate the water flow require-ment to 0.2–0.3 L min−1 kg−1. In addition, the minimum acceptablewater exchange in intensive fish farms will also depend on bothalkalinity (Colt and Orwicz, 1991; Fivelstad and Binde, 1994) andtemperature of the water (Fivelstad et al., 2007).
In intensive systems, where oxygen is injected and water flow isreduced, un-ionized ammonia is not a limiting factor for a single-passsystem as long as water pH remains below 7.0 (Colt and Orwicz, 1991;Fivelstad et al., 1993; Fivelstad and Binde, 1994). According to thepredictions of the above model (Sanni et al., 1993), NH3 will not reachcritical levels in a flow-through system where oxygen is added to thewater. Moreover, the NH3 concentration is relatively independent ofwater flow rates between 0.05 and 0.30 L min−1 kg−1 because pHdrops as flow rate is reduced in this range, shifting NH3 to NH4
+. Thepredictions of the model are in accordance with direct measurementsof NH3 in intensive rearing systems, which also suggest that NH3 doesnot limit production in a single pass system (Seymour, 1990).However, when water exchange is reduced further in recirculationsystems, NH3 may become a limiting factor.

Table 5Recommended parameters and formulae for production planning for Atlantic salmon inclosed-containment systems.
Variable Parameter/formula
TGC 2.7Mean oxygen consumption (mg·kg−1·min−1)based on body mass (W) and swimmingvelocity (C)
ṀO2=7.76W−0.31 ∙100.015C
Mean oxygen consumption from feed consumed(g oxygen:g feed)
0.25–0.45:1
Mean CO2 produced from oxygen consumption(RQ: 0.8)
1.1 g of CO2/g O2 consumed
Mean TAN produced from oxygen consumption 0.04–0.06 g TAN/g O2
consumed
11H. Thorarensen, A.P. Farrell / Aquaculture 312 (2011) 1–14
The model developed by Sanni et al. (1993) also predicts thatsuspended solids will not reach limiting levels (15 mg L−1) in a flow-through system, but again this situation changes when water isrecirculated.
9. Summary
The review has explored some of the most important biologicallimitations to the production of Atlantic salmon in containedaquaculture systems. The main conclusions are presented below andsummarised in Tables 5 and 6.
9.1. Growth
The growth rate of Atlantic salmon is variable and this fact ismanifested in results from various growth studies, as well as in thevariance in growth rate among production sites. The mean TGC from anumber of recent growth studies of Atlantic salmon post-smolts is2.71 (Table 1). This growth rate should be attainable in commercialclosed-containment aquaculture systems where water quality can becontrolled (Table 5). The TGC can be used to estimate growth ofAtlantic salmon within the temperature range between 4 and 14 °C.Presently the industrial average is close to 2.3 for net-pen operations.However, in some net-pen farms the water quality is suboptimal forpart of the year and this may contribute to the discrepancy with theexpected TGC.
There is ample evidence to indicate that the growth rate of Atlanticsalmon varies independent of temperature such that growthperformance at comparable temperatures is comparatively better inspring and early summer than in autumn and winter. This seasonalityof growth rate must be considered when designing contained systemsfor Atlantic salmon. In particular, the systems should be able toaccommodate the highmetabolic rate associatedwith periods of rapidgrowth when the TGC may reach 4 or even higher.
It should be possible to maintain a FCR of close to 1 in containedsystems (Table 5). This FCR is lower than average values for net-pens,where the mean values are close to 1.26 for commercial farms.However, closed-containment systems should allow for a moreprecise control of feeding rate than in net-pens.
Table 6Acceptable levels for water quality, density and flow for maintaining growth andwelfare of post-smolt Atlantic salmon.
Variable Acceptable levels
Oxygen saturation 80–100%CO2 ≤10 mg L−1
NH3 ≤0.012 mg L−1
NO2− b0.1 mg L−1
Density ≤80 kg m−3
Water exchange in flow through systems ≥0.2–0.3 L min−1 kg−1
9.2. Oxygen consumption and excretion of CO2 and TAN
Several models have been proposed to predict the ṀO2of Atlantic
salmon of different sizes, different temperatures and swimmingvelocity. Empirical values clearly deviate from these models forvarious reasons. However, the models provide a good generalindication of mean ṀO2
of salmon over extended periods (Table 5)that are especially useful for design and management purposes.
The ṀO2of Atlantic salmon varies with feeding rate and activity.
This may causemaximumṀO2to be about 30% higher than the diurnal
average.Feeding rate can be used to estimate themean dailyṀO2
of Atlanticsalmon. For each kg of feed that salmon ingest, they consume 0.25 to0.47 kg of oxygen.
Themean production and excretion of metabolic CO2 in fish can beestimated from ṀO2
using the RQ (Table 5). The theoretical RQ ofaquaculture Atlantic salmon estimated from feed composition isabout 0.8, andmeasured values are similar. This suggests that for eachmg of oxygen that the fish remove from the water, they produce 0.96–1.10 mg of CO2. The RQ shows some diurnal fluctuations primarilybecause ṀO2
fluctuates while CO2 excretion is fairly constant.The mean daily production and excretion of TAN can also be
estimated fromṀO2(Table 5). Themean AQ of Atlantic salmon fed full
ration is 0.09–0.13, which corresponds to a production of 0.04–0.06 gof TAN for each gram of oxygen consumed by the fish. Dailyfluctuations in TAN production are associated with feeding andmaximum rates are 30 to 60% higher than the daily mean production.
9.3. Water quality
The recommended minimum routine outflow oxygen level inrearing water for salmonids is 70–80% of air saturation. However,growth rate of Atlantic salmon has been shown to increase linearlywith increasing oxygen availability from 50 to 100% air saturation.There is even some evidence to indicate that the growth performanceof Atlantic salmon increases up to 120% air saturation, although thisshould be confirmed. Air saturation beyond 120–140% should beavoided because of observed detrimental effects on salmon (Table 6).
Elevated ambient dissolved CO2 limits the growth of Atlantic salmonand can be lethal. It is suggested, that the maximum acceptable level ofCO2, where the growth and welfare of post-smolt Atlantic salmon arenot compromised, is 10 mg L−1 (Table 6).
High levels of NH3 in water are toxic to fish. The maximumacceptable level of NH3 for post-smolt Atlantic salmon is 0.012 mg L−1.In seawater fish, NH4
+may exert toxic actions. A nitrite concentration inexcess of 0.1 mg L−1 may be harmful to fish. However, the toxicity ofnitrite depends on ambient concentrations of other anions, primarilychloride which is high in seawater.
9.4. Rearing density
Results for the effects of rearingdensity on the growth andwelfare ofAtlantic salmon post-smolt vary considerably. A density of up to80 kg m3 does not appear to limit growth rate of Atlantic salmon incontained systems where water quality is maintained at acceptablelevels (Table 6). However, it should be noted that good growth does notnecessarily indicate that the rearing conditions provide optimalwelfare.
9.5. Flow requirements
Contained aquaculture systems allow for control of water quality.The oxygen demand of the fish is the primary determinant of waterexchange in fish tanks. When water exchange is reduced and wateroxygen levels are supplemented by injecting pure oxygen, theconcentration of CO2 may exceed acceptable levels. In a flow-throughsystemwhereoxygen is injected, theminimumrequiredflowtoprevent
12 H. Thorarensen, A.P. Farrell / Aquaculture 312 (2011) 1–14
excessive CO2 accumulation is 0.2–0.3 L min−1 kg−1 (Table 6). Actionmust be taken to remove CO2 at lower water flow rates. The minimumflow rate to maintain acceptable levels of NH3 is 0.05 L min−1 kg−1.
Acknowledgment
The preparation of this review was supported by Fisheries andOceans Canada.
References
Alanärä, A., Kadri, S., Paspatis, M., 2001. Feeding management. In: Houlihan, D., Bouchard,T., Jobling, M. (Eds.), Food Intake in Fish. Blackwell Science, Oxford, pp. 323–353.
Austreng, E., Storebakken, T., Åsgård, T., 1987. Growth rate estimates for culturedAtlantic salmon and rainbow trout. Aquaculture 60, 157–160.
Bailey, J., Alanärä, A., Crampton, V., 2003. Do delivery rate and pellet size affect growthrate in Atlantic salmon (Salmo salar L.) raised under semi-commercial farmingconditions? Aquaculture 224, 79–88.
Barton, B.A., 1997. Stress in finfish: past, present and future — a historical perspective.In: Iwama, G.K., Pickering, A.D., Sumpter, J.P., Schreck, C.P. (Eds.), Fish Stress andHealth in Aquaculture. Cambridge University Press, Cambridge, pp. 1–34.
Barton, B.A., 2002. Stress in fishes: a diversity of responses with particular reference tochanges in circulating corticosteroids. Integr. Comp. Biol. 42, 517–525.
Bath, R.N., Eddy, F.B., 1980. Transport of nitrite across fish gills. J. Exp. Zool. 214,119–121.
Beamish, F.W.H., Trippel, E.A., 1990. Heat increment— a static or dynamic dimension inbioenergetic models. Trans. Am. Fish. Soc. 119, 649–661.
Bœuf, G., Payan, P., 2001. How should salinity influence fish growth? Comp. Biochem.Physiol. C 130, 411–423.
Berg, A., Danielsberg, A., 1993. Oksygennivå og fisketetthet. Forsøk pilotanleggetHemnskjel juni 1989–mars 1990 (Oxygen level and fish density. Experiments fromHemnskjel June 1989–March 1990). NHL-report STF 60A 93110, Norsk HydrotekniskLaboratorium, SINTEF, Trondheim. 62 pp. (In Norwegian).
Berg, A., Danielsberg, A., Seland, A., Sigholt, T., 1993. Oxygendemand for postsmolt Atlanticsalmon (Salmo salar). In: Reinesen, H., Dahle, L.A., Jørgensen, L., Tvinnerheim, K. (Eds.),Fish Farming Technology. Balkema, Rotterdam, pp. 297–299.
Berg, J.A., Sigholt, T., Seland, A., Danielsberg, A., 1996. Effect of stocking density, oxygenlevel, light regime and swimming velocity on the incidence of sexual maturation inadult Atlantic salmon (Salmo salar). Aquaculture 143, 43–59.
Bergheim, A., Seymour, S., Sanni, S., Tyvold, T., Fivelstad, S., 1991.Measurements of oxygenconsumption and ammonia excretion of Atlantic salmon (Salmo salar L.) incommercial-scale, single-pass freshwater and seawater land-based culture systems.Aquacult. Eng. 10, 251–267.
Bergheim, A., Forsberg, O.I., Sanni, S., 1993. Biological basis for land-based farming ofAtlantic salmon: oxygen consumption. In: Reinesen, H., Dahle, L.A., Jørgensen, L.,Tvinnerheim, K. (Eds.), Fish Farming Technology. Balkema, Rotterdam, pp. 289–295.
Bergheim, A., Gausen, M., Næss, A., Hølland, P.M., Krogedal, P., Crampton, V., 2006. Anewly developed oxygen injection system for cage farms. Aquacult. Eng. 34, 40–46.
Bernier, N.J., Randall, D.J., 1998. Carbon dioxide anaesthesia in rainbow trout: effects ofhypercapnic level and stress on induction and recovery from anaesthetictreatment. J. Fish Biol. 52, 621–637.
Bjerkeng, B., Peisker, M., Schwartzenberg, K.v., Ytrestøyl, T., Åsgård, T., 2007.Digestibility and muscle retention of astaxanthin in Atlantic salmon, Salmo salar,fed diets with the red yeast Phaffia rhodozyma in comparison with syntheticformulated astaxanthin. Aquaculture 269, 476–489.
Black, K.D., 2001. Environmental Impact of Aquaculture. Sheffield Academic Press.Boujard, T., Labbé, L., Aupérin, B., 2002. Feeding behaviour, energy expenditure and
growth of rainbow trout in relation to stocking density and food accessibility.Aquacult. Res. 33, 1233–1242.
Boyd, C.E., 2000. Water Quality — an Introduction. Kluwer Academic Publishers, Norwell.Brauner, C.J., Val, A.L., Randall, D.J., 1993. The effect of gradedmethaemoglobin levels on
the swimming performance of Chinook salmon (Oncorhynchus tshawytscha). J. Exp.Biol. 185, 121–135.
Brauner, C.J., Seidelin, M., Madsen, S.S., Jensen, F.B., 2000a. Effects of freshwaterhyperoxia and hypercapnia and their influences on subsequent seawater transferin Atlantic salmon (Salmo salar) smolts. Can. J. Fish. Aquat. Sci. 57, 2054–2064.
Brauner, C.J., Thorarensen, H., Gallaugher, P., Farrell, A.P., Randall, D.J., 2000b. CO2
transport and excretion in rainbow trout (Oncorhynchus mykiss) during gradedsustained exercise. Respir. Physiol. 119, 69–82.
Brett, J.R., 1979. Environmental Factors and Growth. In: Hoar, W.S., Randall, D.J., Brett, J.R.(Eds.), Fish Physiology VIII. Academic Press, New York, pp. 599–675.
Brett, J.R., 1995. Energetics. In: Groot, C., Margolis, L., Clarke, W.C. (Eds.), PhysiologicalEcology of Pacific Salmon. UBC Press, Vancouver, pp. 1–68.
Brett, J.R., Glass, N.R., 1973. Metabolic rates and critical swimming speeds of sockeyesalmon (Oncorhynchus nerka) in relation to size and temperature. J. Fish. Res. BoardCan. 30, 379–387.
Brett, J.R., Zala, C.A., 1975. Daily pattern of nitrogen excretion and oxygen-consumptionof sockeye salmon (Oncorhynchus nerka) under controlled conditions. J. Fish. Res.Board. Can. 2479–2486.
Brett, J.R., Groves, T.D.D., 1979. Physiological energetics. In: Hoar, W.S., Randall, D.J.,Brett, J.R. (Eds.), Fish Physiology VIII. Academic Press, New York, pp. 279–352.
Brown, C.R., Cameron, J.N., 1991. The relationship between specific dynamicaction (SDA) and protein synthesis rates in channel catfish. Physiol. Zool. 64,289–309.
Cho, C.Y., 1992. Feeding systems for rainbow trout and other salmonids with reference tocurrent estimates of energy and protein requirements. Aquaculture 100, 107–123.
Christiansen, J.S., Jobling, M., Jørgensen, E., 1990. Oksygen og vannbehov. Nye revidertetabeller. Nor. Fiskeoppdrett 15 (10), 28–29 (In Norwegian).
Christiansen, J.S., Svendsen, Y.S., Jobling, M., 1992. The combined effects of stockingdensity and sustained exercise on the behaviour, food-intake, and growth ofjuvenile Arctic charr (Salvelinus alpinus L.). Can. J. Zool. 70, 115–122.
Clairborne, J.B., 1997. Acid–base regulation. In: Evans, H. (Ed.), The Physiology of Fishes.Academic Press, New York, pp. 177–198.
Colt, J., 2006. Water quality requirements for reuse systems. Aquacult. Eng. 34,143–156.
Colt, J., Armstrong, D.A., 1981. Nitrogen toxicity to crustaceans, fish and molluscs. In:Allen, L.J., Kinney, E.C. (Eds.), Bioengineering Symposium for Fish Culture. AmericanFisheries Society, Bethseda, Maryland, pp. 34–47.
Colt, J., Orwicz, K., 1991. Modeling production capacity of aquatic culture systems underfreshwater conditions. Aquacult. Eng. 10, 1–29.
Cook, J.T., Sutterlin, A.M., McNiven, M.A., 2000. Effect of food deprivation on oxygenconsumption and body composition of growth-enhanced transgenic Atlanticsalmon (Salmo salar). Aquaculture 188, 47–63.
Crampton, V., Hølland, P.M., Bergheim, A., Gausen, M., Næss, A., 2003. Oxygen effects oncaged salmon. Fish Farming International, pp. 26–27.
Dabrowski, K., Lee, K.-J., Guz, L., Verlhac, V., Gabaudan, J., 2003. Effects of dietary ascorbicacid on oxygen stress (hypoxia or hyperoxia), growth and tissue vitamin concentra-tions in juvenile rainbow trout (Oncorhynchus mykiss). Aquaculture 233, 383–392.
Deitch, E.J., Fletcher, G.L., Petersen, L.H., Costa, I.A.S.F., Shears,M.A.,Driedzic,W.R., Gamperl,A.K., 2006. Cardiorespiratory modifications, and limitations, in post-smolt growthhormone transgenic Atlantic salmon Salmo salar. J. Exp. Biol. 209, 1310–1325.
Duston, J., Saunders, R.L., 1995. Advancing smolting to autumn in age 0+ Atlantic salmonby photoperiod, and long-term performance in sea water. Aquaculture 135, 295–309.
Eliason, E.J., Higgs, D.A., Farrell, A.P., 2007. Effect of isoenergetic diets with differentprotein and lipid content on the growth performance and heat increment ofrainbow trout. Aquaculture 272, 723–736.
Eliason, E.J., Higgs, D.A., Farrell, A.P., 2008. Postprandial gastrointestinal blood flow,oxygen consumption and heart rate in rainbow trout (Oncorhynchus mykiss).Comp. Biochem. Physiol. A 149, 380–388.
Ellis, T., North, B., Scott, A.P., Bromage, N.R., Porter, M., Gadd, D., 2002. The relationshipbetween stocking density andwelfare in farmed rainbow trout. J. Fish Biol. 61, 493–531.
Espmark, A.M., Hjelde, K., Baeverfjord, G., 2010. Development of gas bubble disease injuvenile Atlantic salmon exposed to water supersaturated with oxygen. Aquaculture306, 198–204.
Farrell, A.P., 2006. Bulk oxygen uptake measured with over 60,000 kg of adult salmonduring live-haul transportation at sea. Aquaculture 254, 646–652.
Fivelstad, S., Binde, M., 1994. Effects of reduced waterflow (increased loading) in softwater on Atlantic salmon smolts (Salmo salar L.) while maintaining oxygen atconstant level by oxygenation of the inlet water. Aquacult. Eng. 13, 211–238.
Fivelstad, S., Smith,M., 1991. The oxygen consumption rate of Atlantic salmon (Salmo salarL.) reared in a single-pass, land-based seawater system. Aquacult. Eng. 10, 227–235.
Fivelstad, S., Kallevik, H., Iversen, H.M., Møretrø, T., Våge, K., Binde, M., 1993. Sublethaleffects of ammonia in soft water on Atlantic salmon smolts at a low temperature.Aquacult. Int. 1, 157–169.
Fivelstad, S., Schwartz, J., Strømsnes, H., 1995. Sublethal effects and safe levels ofammonia in seawater for Atlantic salmon postsmolts (Salmo salar L.). Aquacult.Eng. 14, 271–280.
Fivelstad, S., Haavik, H., Løvik, G., Olsen, A.B., 1998. Sublethal effects and safe levels ofcarbon dioxide for Atlantic salmon postsmolts (Salmo salar L.). Aquaculture 160,305–316.
Fivelstad, S., Bergheim, S., Kløften, H., Haugen, R., Lohne, T., Olsen, A., 1999a. Water flowrequirements in the intensive production of Atlantic salmon (Salmo salar L.):growth and oxygen consumption. Aquacult. Eng. 20, 1–15.
Fivelstad, S., Olsen, A.B., Kløften, H., Ski, H., Stefansson, S., 1999b. Effects of carbondioxide on Atlantic salmon (Salmo salar L.) smolts at constant pH in bicarbonaterich freshwater. Aquaculture 178, 171–177.
Fivelstad, S., Olsen, A.B., Åsgård, T., Baeverfjord, G., Rasmussen, T., Vindheim, T.,Stefansson, S., 2003a. Long-term sublethal effects of carbon dioxide on Atlanticsalmon smolts (Salmo salar L.): ion regulation, haematology, element composition,nephrocalcinosis and growth parameters. Aquaculture 215, 301–319.
Fivelstad, S., Olsen, A.B., Wågbø, R., Zeitz, S., Hosfeld, A.-C.-D., Stefansson, S., 2003b. Amajor water quality problem in smolt farms: combined effects of carbon dioxideand reduced pH (Al) on Atlantic salmon (Salmo salar L.) smolts: physiology andgrowth. Aquaculture 215, 339–357.
Fivelstad, S., Waagbø, R., Stefnasson, S., Olsen, A.B., 2007. Impacts of elevated watercarbon dioxide partial pressure at two temperatures on Atlantic salmon (Salmosalar L.) parr growth and haematology. Aquaculture 269, 241–249.
Forsberg, O.I., 1994. Modelling oxygen consumption rates of post-smolt Atlantic salmonin commercial-scale land-based farms. Aquacult. Int. 2, 180–196.
Forsberg, O.I., 1995. Empirical investigations on growth of post-smolt Atlantic salmon inland-based farms. Evidence of a photoperiodic influence. Aquaculture 133, 235–248.
Forsberg, O.I., 1997. The impact of varying feeding regimes on oxygen consumption andexcretion of carbon dioxide and nitrogen in post-smolt Atlantic salmon, Salmo salarL. Aquacult. Res. 28, 29–41.
Forsberg, O.I., Bergheim, A., 1996. The impact of constant and fluctuating oxygenconcentrations and two water consumption rates on post-smolt Atlantic salmonproduction parameters. Aquacult. Eng. 15, 327–347.

13H. Thorarensen, A.P. Farrell / Aquaculture 312 (2011) 1–14
Fridell, F., Gadan, K., Sundh, H., Taranger, G.L., Glette, J., Olsen, R.E., Sundell, K., Evensen,Ø., 2007. Effect of hyperoxygenation and low water flow on the primary stressresponse and susceptibility of Atlantic salmon Salmo salar L. to experimentalchallenge with IPN virus. Aquaculture 270, 23–35.
Gallaugher, P.E., Thorarensen, H., Kiessling, A., Farrell, A.P., 2001. Effects of highintensity exercise training on cardiovascular function, oxygen uptake, internaloxygen transport and osmotic balance in Chinook salmon (Oncorhynchustshawytscha) during critical speed swimming. J. Exp. Biol. 204, 2861–2872.
Gebauer, R., 1992. Vannbehov. In: Gebauer, R., Eggen, G., Hansen, E., Eikenbrokk, B.(Eds.), Oppdrettsteknology. Tapir Forlag, Trondheim, pp. 171–218.
Gjerdrem, T., 2000. Genetic improvement in cold water species. Aquacult. Res. 31, 25–33.Gjoen, H.M., Bentsen, H.B., 1997. Past, present, and future of genetic improvement in
salmon aquaculture. ICES J. Mar. Sci. 54, 1009–1014.Grisdale-Helland, B., Shearer, K.D., Helland, S.J., 2007. Energy and nutrient utilization of
Atlantic cod, Atlantic salmon and rainbow trout fed diets differing in energycontent. Aquaculture Nutrition 13, 321–334.
Grottum, J.A., Sigholt, T., 1998. A model for oxygen consumption of Atlantic salmon(Salmo salar) based on measurements of individual fish in a tunnel respirometer.Aquacult. Eng. 17, 241–251.
Heisler, N., 1984. Acid base regulation in fishes. In: Hoar, W.S., Randall, D.J. (Eds.), FishPhysiology, XA. Academic Press, New York, pp. 315–401.
Heisler, N., 1986. Mechanisms and limitations of fish acid–base regulation. In: Nilsson, S.,Holmgren,S. (Eds.), Fish Physiology:RecentAdvances. CroomHelm, London, pp. 24–49.
Hosfeld, C.D., Engevik, A., Mollan, T., Lunde, T.M., Waagbø, R., Olsen, A.B., Breck, O.,Stefansson, S., Fivelstad, S., 2008. Long-term separate and combined effects ofenvironmental hypercapnia and hyperoxia in Atlantic salmon (Salmo salar L.)smolts. Aquaculture 280, 146–153.
Iversen, A., Kosmo, J.P., 2004. Kan vekstindeksene sammenlignes? Nor. Fiskeoppdrett 4,62–64 (In Norwegian).
Iwama, G.K., Tauts, A.F., 1981. A simple growth model for salmonids in hatcheries. Can.J. Fish. Aquat. Sci. 38, 649–656.
Jain, K.E., Farrell, A.P., 2003. Influence of seasonal temperature on the repeatswimming performance of rainbow trout Oncorhynchus mykiss. J. Exp. Biol. 206,3569–3579.
Jensen, F.B., 2003. Nitrite disrupts multiple physiological functions in aquatic animals.Comp. Biochem. Physiol. A 135, 9–24.
Jobling, M., 1994. Fish Bioenergetics. Chapman & Hall, London.Jobling, M., 1995. Simple indices for the assessment of the influences of the social
environment on growth performance, exemplified by studies on Arctic charr.Aquac. Int. 3, 60–65.
Jobling, M., 2003. The thermal growth coefficient (TGC) model of fish growth: acautionary note. Aquacult. Res. 34, 581–584.
Johansson, D., Ruohonen, K., Kiessling, A., Oppedal, F., Stiansen, J.-R., Kelly, M., Juell, J.-E.,2006. Effect of environmental factors on swimming depth preferences of Atlanticsalmon (Salmo salar L.) and temporal and spatial variations in oxygen levels in seacages at fjord site. Aquaculture 254, 594–605.
Johnston, I.A., Manthri, S., Alderson, R., Campbell, P., Mitchell, D., Whyte, D., Dingwall,A., Nickell, D., Selkirk, C., Robertson, B., 2002. Effects of dietary protein level onmuscle cellularity and flesh quality in Atlantic salmon with particular reference togaping. Aquaculture 210, 259–283.
Johnston, I.A., Li, X., Vieira, V.L.A., Nickell, D., Dingwall, A., Alderson, R., Campbell, P.,Bickerdike, R., 2006. Muscle and flesh quality traits in wild and farmed Atlanticsalmon. Aquaculture 256, 323–336.
Johnston, I.A., Bickerdike, R., Xuejun, L., Dingwall, A., Nickell, D., Alderson, R., Campbell,P., 2007. Fast growth was not associated with an increased incidence of soft fleshand gaping in two strains of Atlantic salmon (Salmo salar) grown under differentenvironmental conditions. Aquaculture 265, 148–155.
Jorgensen, E., Christjansen, J., Jobling, M., 1993. Effects of stocking density on foodintake, growth performance and oxygen consumption in Arctic charr (Salvelinusalpinus). Aquaculture 110, 191–204.
Kajimura, M., Croke, S.J., Glover, C.N., Wood, C.M., 2004. Dogmas and controversies inthe handling of nitrogenous wastes: the effect of feeding and fasting on theexcretion of ammonia, urea and other nitrogenous waste products in rainbowtrout. J. Exp. Biol. 207, 1993–2002.
Karalazos, V., Bendiksen, E.Å., Dick, J.R., Bell, J.G., 2007. Effects of dietary protein, and fatlevel and rapeseed oil on growth and tissue fatty acid composition and metabolismin Atlantic salmon (Salmo salar L.) reared at low water temperatures. Aquacult.Nutr. 13, 256–265.
Karlsson, A., Eliasson, E.J., Mydland, L.T., Farrell, A.P., Kiessling, A., 2006. Postprandialchanges in plasma free amino acids levels obtained simultaneously from thehepatic portal vein and the dorsal aorta in rainbow trout (Oncorhynchus mykiss).J. Exp. Biol. 209, 4885–4894.
Kiessling, A., Dosanjh, B., Higgs, D., Deacon, G., Rowshandeli, N., 1995. Dorsal aortacannulation; a method to monitor changes in blood levels of astaxanthin involuntarily feeding Atlantic salmon. Aquacult. Nutr. 1, 43–50.
Kjartansson, H., Fivelstad, S., Thomassen, J.M., Smith, M.J., 1988. Effects of differentstocking densities on physiological parameters and growth of adult Atlantic salmon(Salmo salar L.) reared in tanks. Aquaculture 73, 261–274.
Koskela, J., Pirhonen, J., Jobling, M., 1997. Feed intake, growth rate and bodycomposition of juvenile Baltic salmon exposed to different constant temperatures.Aquacult. Int. 5, 351–360.
Kreiberg, H., Brenton-Davie, V., 1998. Seawater growth of Atlantic salmon in SEASystem™ floating bag. Aquac. Update 81, 1–2.
Krogdal, Å., Sundby, A., Olli, J.J., 2004. Atlantic salmon (Salmo salar) and rainbow trout(Oncorhynchus mykiss) digest and metabolize nutrients differently. Effects of watersalinity and dietary starch level. Aquaculture 229, 335–360.
Lee, C.G., Farrell, A.P., Lotto, A., MacNutt, M.J., Hinch, S.G., Healey, M.C., 2003. The effectof temperature on swimming performance and oxygen consumption in adultsockeye (Oncorhynchus nerka) and coho (O. kisutch) salmon stocks. J. Exp. Biol. 206,3239–3251.
Lygren, B., Hamre, K., Waagbø, R., 2000. Effect of induced hyperoxia on the antioxidantstatus of Atlantic salmon Salmo salar L. fed three different levels of dietary vitaminE. Aquacult. Res. 31, 407–408.
Lyndon, A.R., Houlihan, D.F., Hall, S.J., 1992. The effect of short-term fasting and a singlemeal on protein synthesis and oxygen consumption in cod, Gadus morhua. J. Comp.Physiol. B 162, 209–215.
Lysfjord, G., Jobling, M., Solberg, C., 2004. Atlantic salmon, Salmo salar L., smoltproduction strategy affects body composition and early seawater growth.Aquaculture 237, 191–205.
Mazeaud, M.M., Mazeaud, F., Donaldson, E.M., 1977. Primary and secondary effects ofstress in fish: some new data with a general review. Trans. Am. Fish. Soc. 106,201–212.
McKenzie, D.J., Shingles, A., Taylor, E.W., 2003. Sub-lethal plasma ammonia accumu-lation and the exercise performance of salmonids. Comp. Biochem. Physiol. A 135,515–526.
McMillan, D.N., Houlihan, D.F., 1988. The effect of refeeding on tissue protein synthesisin rainbow trout. Physiol. Zool. 61, 429–441.
Meade, J.W., 1985. Allowable ammonia for fish culture. Prog. Fish Cult. 47, 135–145.Mommsen, T.P., Vijayan, M.M., Moon, T.W., 1999. Cortisol in teleosts: mechanisms of
action, and metabolic regulation. Rev. Fish Biol. Fish. 9, 211–268.Mørkøre, T., Rørvik, K.-A., 2001. Seasonal variations in growth, feed utilisation and
product quality of farmed Atlantic salmon (Salmo salar L.) transferred to sea wateras 0+ smolts or 1+ smolts. Aquaculture 199, 145–158.
Morris, P.C., Beattie, C., Elder, B., Finlay, J., Gallimore, P., Jewison, W., Lee, D., Mackenzie,K., McKinney, R., Sinnott, R., Smart, A., Weir, M., 2003. Effects of the timing of theintroduction of feeds containing different protein and lipid levels on theperformance and quality of Atlantic salmon, Salmo salar, over the entire seawaterphase of growth. Aquaculture 225, 41–65.
Morris, P.C., Beattie, C., Elder, B., Finlay, J., Gallimore, P., Jewison, W., Lee, D., Mackenzie,K., McKinney, R., Sinnott, R., Smart, A., Weir, M., 2005. Aquaculture 244, 187–201.
Neuman, J., Weir, M., Beattie, C., 2004. Skretting in the UK and Chile: an opportunity forcomparison. Skretting Outlook 21, 8–11.
Ng,W.-K., Sigholt, T., Bell, J.G., 2004. The influence of environmental temperature on theapparent nutrient and fatty acid digestibility in Atlantic salmon (Salmo salar L.) fedfinishing diets containing different blends of fish oil, rapeseed oil and palm oil.Aquacult. Res. 35, 1228–1237.
Nordgarden, U., Oppedal, F., Taranger, G.L., Hemre, G.-I., Hansen, T., 2003. Seasonallychanging metabolism in Atlantic salmon (Salmo salar L.). Aquacult. Nutr. 9, 287–289.
North, B.P., Turnbull, J.F., Ellis, T., Porter, M.J., Migaud, H., Bron, J., Bromage, N.R., 2006.The impact of stocking density on the welfare of rainbow trout (Oncorhynchusmykiss). Aquaculture 466–479.
Opstvedt, J., Aksnes, A., Hope, B., Pike, I.H., 2003. Efficiency of feed utilization in Atlanticsalmon (Salmo salar L.) fed diets with increasing substitution of fish meal withvegetable proteins. Aquaculture 221, 365–379.
Perry, S.F., Gilmour, K.M., 2002. Sensing and transfer of respiratory gases at the fish gill.J. Exp. Zool. 293, 249–263.
Perry, S.F., McKendry, J.E., 2001. The relative roles of external and internal CO2 versusH+
in eliciting the cardiorespiratory responses of Salmo salar and Squalus acanthias tohypercarbia. J. Exp. Biol. 204, 3963–3971.
Perry, S.F., Davie, P.S., Daxboeck, C., Randall, D.J., 1982. A comparison of CO2 excretion ina spontaneously ventilating blood-perfused trout preparation and saline perfusedgill preparations: contribution of branchial epithelium and red blood cell. J. Exp.Biol. 101, 47–60.
Pickering, A.D., 1998. Stress responses in fishes. In: Black, K.D., Pickering, A.D. (Eds.),Biology of Farmed Fish. Sheffield Academic Press, Sheffield, pp. 222–255.
Portz, D.E., Woodley, C.M., Cech, J.J., 2006. Stress-associated impacts of short-termholding on fishes. Rev. Fish Biol. Fish. 16, 125–170.
Powell, M.D., Perry, S.F., 1997. Respiratory and acid–base disturbances in rainbow troutblood during exposure to chloramines-T under hypoxia and hyperoxia. J. Fish Biol.50, 418–428.
Randall, D.J., 1991. The impact of variations in water pH on fish. In: Brune, D.E.,Tomasso, J.R. (Eds.), Aquaculture and Water Quality. World Aquaculture Society,Baton Rouge, LA, pp. 90–104.
Randall, D.J., Daxboeck, C., 1984. Oxygen and carbon dioxide transfer across fish gills.In: Hoar, W.S., Randall, D.J. (Eds.), Fish Physiology, XA. Academic Press, New York,pp. 263–314.
Randall, D.J., Ip, Y.K., 2006. Ammonia as respiratory gas in water and air-breathingfishes. Respir. Physiol. Neurobiol. 154, 216–225.
Randall, D.J., Perry, S.F., 1992. Catecholamines. In: Hoar, W.S., Randall, D.J., Farrell, A.P.(Eds.), Fish Physiology XIIB. Academic Press, San Diego, pp. 255–300.
Randall, D.J., Tsui, T.K.N., 2002. Ammonia toxicity in fish. Mar. Pollut. Bull. 45, 17–23.Randall, D.J., Wright, P.A., 1995. Circulation and gas transfer. In: Groot, G., Margolis, L.,
Clarke, W.C. (Eds.), Physiological Ecology of Pacific Salmon. UBC Press, Vancouver,pp. 441–458.
Rasmussen, R.S., Larsen, F.L., Jensen, S., 2007. Fin condition and growth among rainbowtrout reared at different sizes, densities, and feeding frequencies in high-temperature re-circulated water. Aquacult. Int. 15, 97–107.
Refstie, T., Kittelsen, A., 1976. Effect of density on growth and survival of artificiallyreared Atlantic salmon. Aquaculture 8, 319–326.
Russo, R., Thurston, R., 1991. Toxicity of ammonia, nitrite, andnitrate tofishes. In:Brune,D.E.,Tomasso, J.R. (Eds.), Aquaculture andWater Quality.World Aquaculture Society, BatonRouge, LA, pp. 58–89.
14 H. Thorarensen, A.P. Farrell / Aquaculture 312 (2011) 1–14
Russo, R., Thurston, R.V., Emerson, K., 1981. Acute toxicity of nitrite to rainbow trout(Salmo gairdneri): effect of pH, nitrite species, and anion species. Can. J. Fish. Aquat.Sci. 38, 389–393.
Sanni, S., Forsberg, O.I., 1996. Modelling pH and carbon dioxide in single-pass seawateraquaculture systems. Aquacult. Eng. 15, 91–110.
Sanni, S., Forsberg, O.I., Bergheim, A., 1993. A dynamicmodel forfishmetabolite productionandwater quality in land-based fish farms. In: Reinertsen, H., Dahle, L.A., Jorgensen, L.,Tvinnereim, K. (Eds.), Fish Farming Technology. Balkema, Rotterdam, pp. 367–374.
Saunders, R.L., Harmon, P.R., 1988. Extended daylength increases post-smolt growth ofAtlantic salmon. World Aquacult. 19, 72–73.
Seland, A., Berg, A., 1993. Sub-acute effects of oxygen drops in land-based fish farms. In:Reinesen, H., Dahle, L.A., Jørgensen, L., Tvinnerheim, K. (Eds.), Fish FarmingTechnology. A.A. Balkema, Rotterdam, pp. 375–381.
Seymour, E.A., 1990. Determination of optimal biological conditions for the growth ofAtlantic salmon in land-based farms by pilot scale research. International ResearchInstitute of Stavanger Arbeitsnotat / Rapport RF- 1990/243.
Seymour, E.A., Aabel, J.P., 1990. Towards optimisation of the design of closed land-basedfarms for Atlantic salmon (Salmo salar) by investigation of biological parametersPart II Fish of 500 to 1500 g weight. International Research Institute of StavangerArbeitsnotat / Rapport RF- 1990/224.
Seymour, E.A., Forsberg, O.I., Aabel, J.P., 1992. The effect of various stocking densities,low water use and two oxygen levels on production parameters of adult Atlanticsalmon in land-based tanks. International Research Institute of StavangerArbeitsnotat / Rapport RF- 1992/193.
Shingles, A., McKenzie, D.J., Taylor, E.W., Moretti, A., Butler, P.J., Ceradini, S., 2001.Effects of sub-lethal ammonia exposure on swimming performance in rainbowtrout (Oncorhynchus mykiss). J. Exp. Biol. 204, 2699–2707.
Smart, G.R., 1981. Aspects of water quality producing stress in intensive fish culture. In:Pickering, A.D. (Ed.), Stress and Fish. Academic Press, London, pp. 277–289.
Smart, G.R., Knox, D., Harrison, J.G., Ralph, J.A., Richards, R.H., Cowey, C.B., 1979.Nephrocalcinosis in rainbow trout Salmo gairdneri Richardson; the effect ofexposure to elevated CO2 concentration. J. Fish Dis. 2, 279–289.
Smith, I.P., Metcalfe, N.B., Huntingford, F.A., Kadri, S., 1993. Daily and seasonal patternsin the feeding behaviour of Atlantic salmon (Salmo salar L.) in a sea cage.Aquaculture 117, 165–178.
Soderberg, R.W., Meade, J.W., 1987. Effects of rearing density on growth, survival andfin condition of Atlantic salmon. Prog. Fish Cult. 49, 280–283.
Soderberg, R.V., Meade, J.W., Redell, L.A., 1993. Growth, survival, and food conversion ofAtlantic salmon reared at 4 different densities with common water quality. Prog. FishCult. 5, 29–31.
Sveier, H., Lied, E., 1998. The effect of feeding regime on growth, feed utilisation andweight dispersion in large Atlantic salmon (Salmo salar) reared in seawater.Aquaculture 165, 333–345.
Tandler, A., Beamish, F.W.H., 1979. Mechanical and biochemical components ofapparent specific dynamic action in largemouth bass, Micropterus salmonidesLacepede. J. Fish Biol. 14, 343–350.
Tang, S., Brauner, C.J., Farrell, A.P., 2008. Using bulk oxygen uptake to assess the welfareof adult Atlantic salmon, Salmo salar, during commercial live-haul transport.Aquaculture 286, 318–323.
Thodesen, J., Grisdale-Helland, B., Helland, S.J., Gjerde, B., 1999. Feed intake, growth andfeed utilization of offspring from wild and selected Atlantic salmon. Aquaculture180, 237–246.
Thodesen, J., Gjerde, B., Grisdale-Helland, B., Storebakken, T., 2001. Genetic variation infeed intake, growth and feed utilisation in Atlantic salmon (Salmo salar).Aquaculture 194, 273–281.
Thorarensen, H., Farrell, A.P., 2006. Postprandial intestinal blood flow, Metabolic rates,and exercise in Chinook salmon (Oncorhynchus tshawytscha). Physiol. Biochem.Zool. 79, 688–694.
Thorarensen, H., Gallaugher, P.E., Kiessling, A.K., Farrell, A.P., 1993. Intestinal blood flowin swimming Chinook salmon Oncorhynchus tshawytscha and the effects ofhematocrit on blood flow distribution. J. Exp. Biol. 179, 115–129.
Timmons, M.B., Ebeling, J.M., Wheaton, F.W., Summerfelt, S.T., Vinci, B.J., 2001.Recirculating aquaculture systems. NRAC Publication, No. 01-002. Cayuga AquaVentures, Ithaca, p. 650.
Tomasso, J.R., Wright, M.I., Simco, B.A., Davis, K.B., 1980. Inhibition of nitrite toxicity inchannel catfish by calcium chloride and sodium chloride. Prog. Fish Cult. 42,144–146.
Turnbull, J., Bell, A., Adams, C., Bron, J., Huntingford, F., 2005. Stocking density andwelfare of cage-farmed Atlantic salmon: application of a multivariate analysis.Aquaculture 243, 121–132.
Weatherley, A.H., Gill, H.S., 1995. Growth. In: Groot, G., Margolis, L., Clarke, W.C. (Eds.),Physiological Ecology of Pacific Salmon. UBC Press, Vancouver, pp. 102–158.
Wedemeyer, G.A., 1996. Physiology of Fish in Intensive Culture Systems. Chapman andHall, New York.
Wedemeyer, G.A., 1997. Effect of rearing conditions on the health and physiologicalquality of fish in intensive culture. In: Iwama, G.K., Pickering, A.D., Sumpter, J.P.,Schreck, C.B. (Eds.), Fish Stress and Health in Aquaculture, pp. 35–72.
Wedemeyer, G.A., Yasutake, W.T., 1978. Prevention and treatment of nitrite toxicity injuvenile steelhead trout (Salmo gairdneri). J. Fish. Res. Board Can. 38, 822–827.
Wicks, B.J., Randall, D.J., 2002a. The effect of feeding and fasting on ammonia toxicity injuvenile rainbow trout, Oncorhynchus mykiss. Aquat. Toxicol. 59, 71–82.
Wicks, B.J., Randall, D.J., 2002b. The effect of sub-lethal ammonia exposure on fed andunfed rainbow trout: the role of glutamine in regulation of ammonia. Comp.Biochem. Physiol. A 132, 275–285.
Wicks, B.J., Joensen, R., Tang, Q., Randall, D.J., 2002. Swimming and ammonia toxicity insalmonids: the effect of sub lethal exposure on the swimming performance of cohosalmon and the acute toxicity of ammonia in swimming and resting rainbow trout.Aquat. Toxicol. 59, 55–69.
Williams, E.M., Eddy, F.B., 1986. Chloride uptake in freshwater teleosts and itsrelationship to nitrite uptake and toxicity. J. Comp. Physiol. B 156, 867–872.
Willoughby, S., 1999. Manual of Salmonid Farming. Wiley-Blackwell, Oxford.Wilson, R.W., Taylor, E.W., 1992. Transbranchial ammonia gradients and acid–base
responses to high external ammonia in rainbow trout (Oncorhynchus mykiss)acclimated to different salinities. J. Exp. Biol. 166, 95–112.
Wood, C.M., 1995. Excretion. In: Groot, G., Margolis, L., Clarke, W.C. (Eds.), PhysiologicalEcology of Pacific Salmon. UBC Press, Vancouver, pp. 379–438.
Wright, P.A., 1993. Nitrogen excretion and enzyme pathways for ureagenesis infreshwater tilapia (Orochromis niloticus). Physiol. Zool. 66, 881–901.
Ytrestøyl, T., Struksnæs, G., Rørvik, K.-A., Koppe, W., Bjerkeng, B., 2006. Astaxanthindigestibility as affected by ration levels for Atlantic salmon, Salmo salar. Aquaculture261, 215–224.