Embed Size (px)
Citation preview
7/30/2019 Bajaj Auto 4Q FY 2013
http://slidepdf.com/reader/full/bajaj-auto-4q-fy-2013 1/14
Please refer to important disclosures at the end of this report 1
Y/E March (` cr) 4QFY13 4QFY12 % chg (yoy) 3QFY13 % chg (qoq)
Net Sales 4,746 4,651 2.0 5,413 (12.3)
EBITDA 837 921 (9.1) 1,012 (17.3)
EBITDA Margin (%) 17.6 19.8 (217)bp 18.7 (107)bp
Adj. net profit 766 752 1.9 819 (6.5)
Source: Company, Angel Research
Bajaj Auto (BJAUT) reported lower-than-expected operating performance for4QFY2013, nevertheless, the bottom-line was slightly ahead of our estimatesdriven by higher other income and lower tax-rate. Going ahead, BJAUT isplanning to launch six new variants of Discover in FY2014 , four of which wouldbe in the price range of ` 40,000- ` 50,000. Further, the company also intends torevamp its entire three wheeler portfolio in FY2014. We believe that theaggressive product launch pipeline coupled with the revival in demand in thedomestic and exports markets will enable BJAUT to register a healthy volumeCAGR of ~10% over FY2013-15E. Nevertheless, we expect EBITDA margins toremain under pressure as the benefits of favorable rates on forex hedges will benegated by the changing volume-mix in favor of lower margin products. Webroadly retain our revenue and earnings estimates for the company forFY2014/15. We maintain our Accumulate rating on the stock.
Lower-than-expected operating performance: For 4QFY2013, the top-line postedan in-line growth of 2% yoy (down 12.3% yoy) to ` 4,746cr, following a 3.5% yoy (13% qoq) drop in volumes to 981,242 units. The net average realization,however, improved strongly by 6.8% yoy (0.7% qoq) led by favorable foreignexchange rate on the exports front and also due to price hike in the exportmarkets (effective November 2012) to pass on the impact of reduction in exportincentives. The EBITDA margin declined 217bp yoy (107bp qoq) to 17.6%, belowour expectations of 18.6%, mainly due to adverse product-mix (higher share ofless than 125cc motorcycles in the product-mix) and increase in otherexpenditure. The adjusted net profit registered a marginal growth of 1.9% yoy (down 6.5% qoq) to ` 766cr. However, it was slightly ahead of our expectationsdriven by higher other income (74.6% yoy and 19.9% qoq) and lower tax-rate(at 25.9% as against 30.2% in 3QFY2013).
Outlook and valuation: At ` 1,834, BJAUT is trading at 13.4x FY2015E earnings. We maintain our Accumulate rating on the stock with a target price of ` 2,056,valuing the company at 15x FY2015E earnings.
Key financials (Standalone)Y/E March (` cr) FY2012 FY2013E FY2014E FY2015E
Net Sales 19,529 19,997 22,684 25,908
% chg 19.1 2.4 13.4 14.2
Net Profit 3,207 3,044 3,394 3,966
% chg 22.2 (5.1) 11.5 16.9
EBITDA (%) 19.4 18.2 18.0 18.5
EPS (`) 110.8 105.2 117.3 137.1
P/E (x) 16.5 17.4 15.6 13.4
P/BV (x) 8.8 7.0 5.6 4.5
RoE (%) 58.6 44.8 39.9 37.2
RoCE (%) 60.7 48.0 43.7 41.4
EV/Sales (x) 2.4 2.3 1.9 1.6
EV/EBITDA (x) 12.3 12.7 10.8 8.7
Source: Company, Angel Research
ACCUMULATECMP ` 1,834
Target Price ` 2,056
Investment Period 12 Months
Stock Info
Sector
Bloomberg Code BJAUT@IN
Shareholding Pattern (%)
Promoters 50.0
MF / Banks / Indian Fls 15.6
FII / NRIs / OCBs 18.6Indian Public / Others 15.8
Abs. (%) 3m 1yr 3yr
Sensex 4.2 26.2 20.5
Bajaj Auto (7.1) 16.5 69.6
Face Value ( ` )
BSE Sensex
Nifty
Reuters Code
10
20,286
6,187
BAJA.BO
Automobile
Avg. Daily Volume
Market Cap ( ` cr)
Beta
52 Week High / Low
53,065
0.6
2,229/1,423
35,286
Net Debt ( ` cr) (6,918)
Yaresh Kothari
022-3935 7800 Ext: 6844
Bajaj Auto
Performance Highlights
4QFY2013 Result Update | Automobile
May 17, 2013
7/30/2019 Bajaj Auto 4Q FY 2013
http://slidepdf.com/reader/full/bajaj-auto-4q-fy-2013 2/14
Bajaj Auto | 4QFY2013 Result Update
May 17, 2013 2
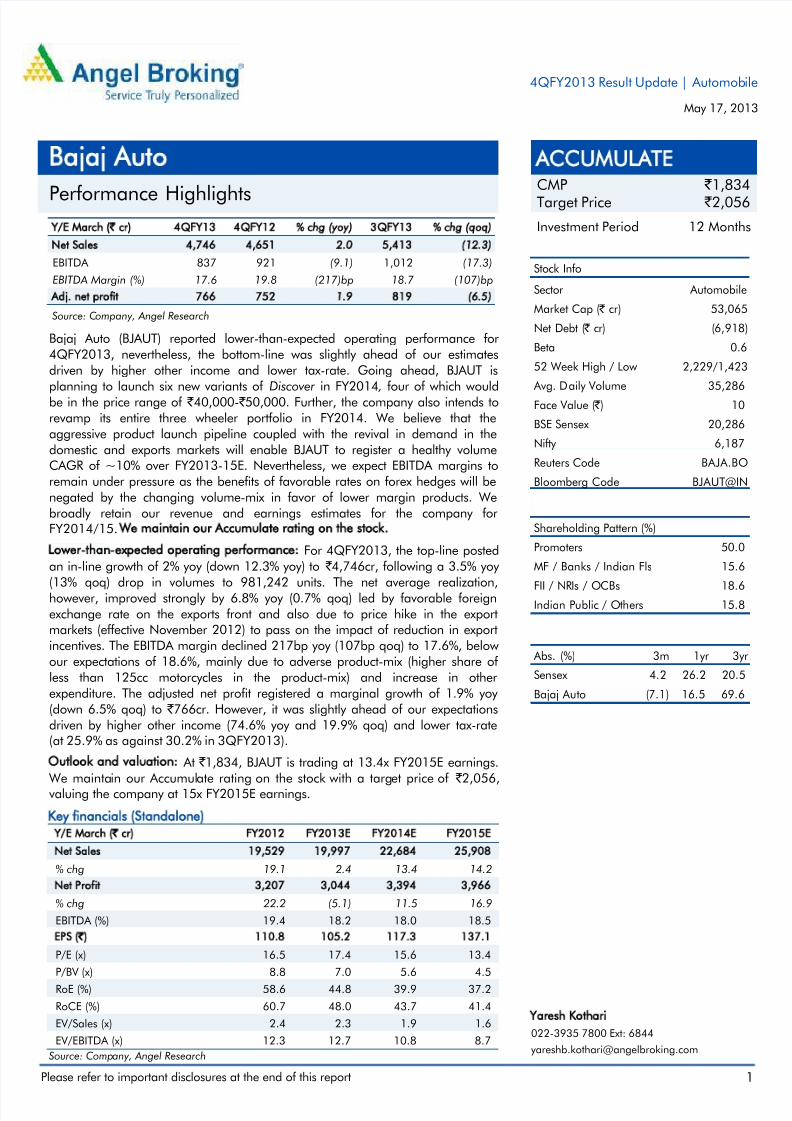
Exhibit 1: Quarterly financial performance (Standalone)
Y/E March (` cr) 4QFY13 4QFY12 % chg (yoy) 3QFY13 % chg (qoq) FY2013 FY2012 % chg (yoy)
Net sales 4,746 4,651 2.0 5,413 (12.3) 19,997 19,529 2.4
Consumption of RM 3,160 3,141 0.6 3,716 (15.0) 13,548 13,351 1.5(% of Sales) 66.6 67.5 68.6 67.7 68.4
Staff Costs 167 120 39.4 159 4.6 639 540 18.4
(% of Sales) 3.5 2.6 2.9 3.2 2.8
Purchases of TG 249 171 45.3 205 21.3 859 751 14.3
(% of Sales) 5.2 3.7 3.8 4.3 3.8
Other expenses 334 299 12.0 321 4.3 1,316 1,166 12.8
(% of Sales) 7.0 6.4 5.9 6.6 6.0
Total expenditure 3,910 3,731 4.8 4,401 (11.2) 16,362 15,809 3.5
Operating profit 837 921 (9.1) 1,012 (17.3) 3,635 3,720 (2.3)
OPM (%) 17.6 19.8 18.7 18.2 19.0
Interest 0 2 (90) 0 80.0 1 22 (98)
Depreciation 47 43 7.3 41 13.5 164 146 12.6
Other Income 244 139 74.6 203 19.9 795 608 30.8
PBT (excl. Extr. Items) 1,033 1,015 1.8 1,174 (12.0) 4,266 4,160 2.5
Extr. Income/(Expense) 0 (20) (100.0) 0 - 0 134 -
PBT (incl. Extr. Items) 1,033 1,035 (0.2) 1,174 (12.0) 4,266 4,026 6.0
(% of Sales) 21.8 22.3 21.7 21.3 20.6
Provision for Taxation 268 263 1.7 355 (24.6) 1,223 1,022 19.6
(% of PBT) 25.9 25.4 30.2 28.7 25.4
Reported PAT 766 772 (0.8) 819 (6.5) 3,044 3,004 1.3
Adj PAT 766 752 1.9 819 (6.5) 3,044 3,138 (3.0)
Adj. PATM 16.1 16.6 15.1 15.2 15.4
Equity capital (cr) 289.4 289.4 289.4 289.4 289.4
Reported EPS (`) 26.5 26.7 (0.8) 28.3 (6.5) 105.2 103.8 1.3
Adjusted EPS (`) 26.5 26.0 1.9 28.3 (6.5) 105.2 108.4 (3.0)
Source: Company, Angel Research
Exhibit 2: 4QFY2013 – Actual vs Angel estimates
Y/E March (` cr) Actual Estimates Variation (%)
Net Sales 4,746 4,784 (0.8)
EBITDA 837 890 (6.0)
EBITDA margin (%) 17.6 18.6 (97)bp
Adj. PAT 766 733 4.5
Source: Company, Angel Research
7/30/2019 Bajaj Auto 4Q FY 2013
http://slidepdf.com/reader/full/bajaj-auto-4q-fy-2013 3/14
Bajaj Auto | 4QFY2013 Result Update
May 17, 2013 3
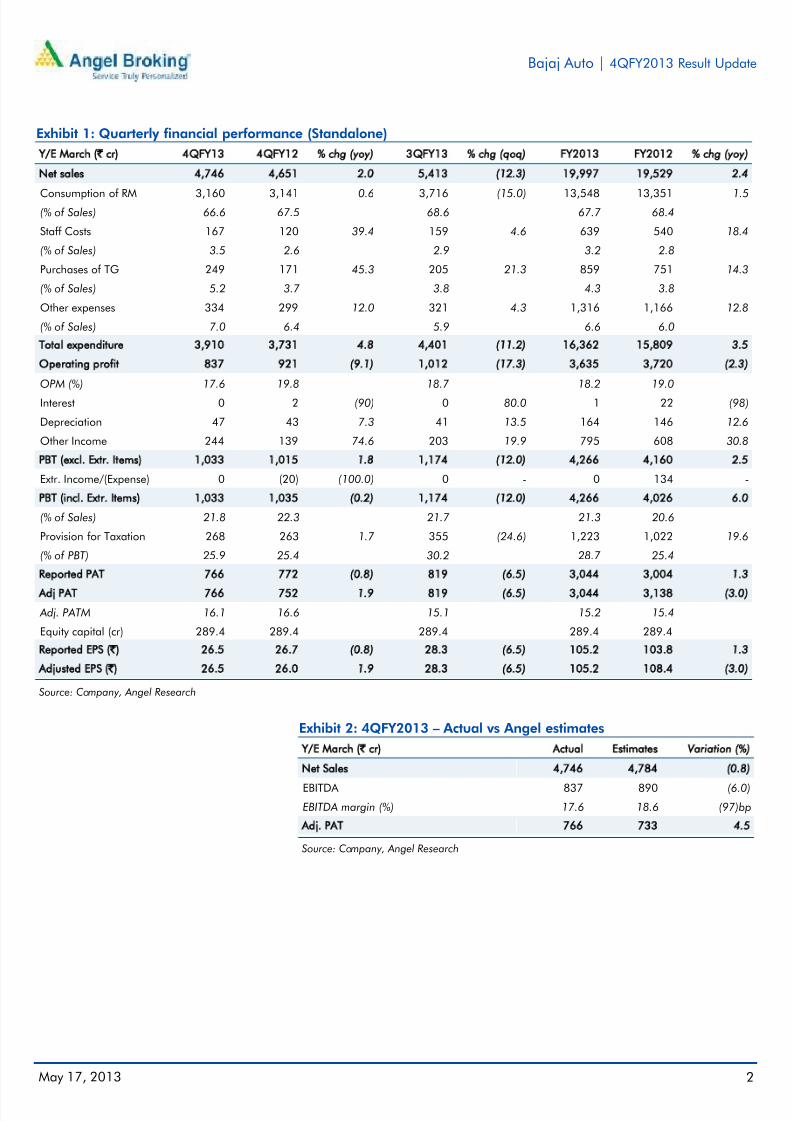
Exhibit 3: Quarterly volume performance
(units) 4QFY13 4QFY12 % chg (yoy) 3QFY13 % chg (qoq) FY2013 FY2012 % chg (yoy)
Domestic 616,237 669,753 (8.0) 751,519 (18.0) 2,690,005 2,769,736 (2.9)
Exports 365,005 347,414 5.1 376,222 (3.0) 1,547,157 1,579,824 (2.1)Total volumes 981,242 1,017,167 (3.5) 1,127,741 (13.0) 4,237,162 4,349,560 (2.6)
Motorcycles
Domestic 556,147 616,516 (9.8) 687,351 (19.1) 2,463,863 2,566,757 (4.0)
Exports 303,537 280,732 8.1 298,912 1.5 1,293,231 1,267,648 2.0
Total motorcycles 859,684 897,248 (4.2) 986,263 (12.8) 3,757,094 3,834,405 (2.0)
% of total volumes 87.6 88.2 87.5 88.7 88.2
Three-wheelers
Domestic 60,090 53,237 12.9 64,168 (6.4) 226,142 202,979 11.4
Exports 61,468 66,682 (7.8) 77,310 (20.5) 253,926 312,176 (18.7)
Total three-
wheelers 121,558 119,919 1.4 141,478 (14.1) 480,068 515,155 (6.8)% of total volumes 12.4 11.8 12.5 11.3 11.8
Source: Company, Angel Research
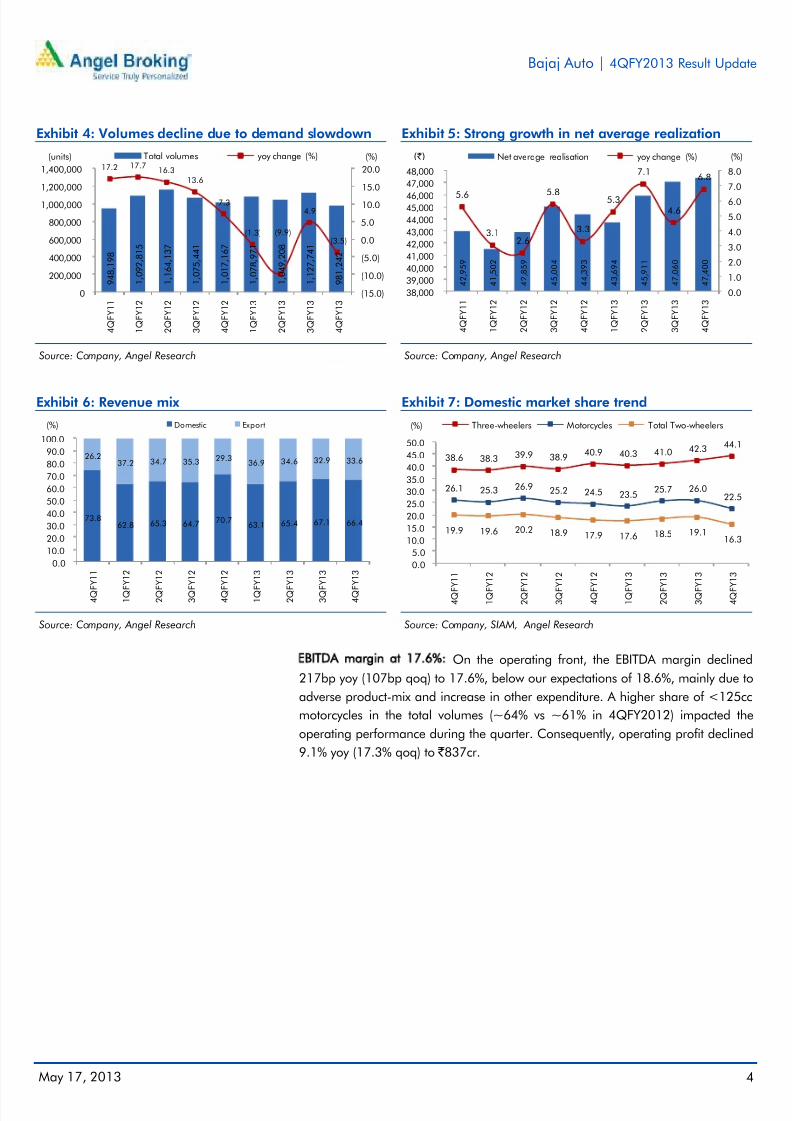
Modest top-line growth of 2% yoy: For 4QFY2013, the top-line posted an in-line
growth of 2% yoy (down 12.3% yoy) to ` 4,746cr, following a 3.5% yoy (13% qoq)
drop in volumes to 981,242 units. The net average realization, however, improved
strongly by 6.8% yoy led by favorable foreign exchange rate on the exports front
and also due to price hike in the export markets (effective November 2012) to pass
on the impact of reduction in export incentives. On a sequential basis though, net
average realization posted a marginal growth of 0.7% as export net average
realization declined by 7.9% largely driven by inferior product-mix. While, thedomestic revenues declined 3.3% yoy (13.2% qoq) led by 8% yoy (18% qoq)
decline in volumes; export revenues surged 18.2% yoy led a 5.1% yoy growth in
volumes and a 12.5% yoy growth in net average realization.
During the quarter, the domestic motorcycle volumes (down 9.8% yoy) remained
under pressure on account of subdued consumer sentiments and increasing
competition from Honda Motorcycles and Scooters India (HMSI). However
domestic three-wheeler segment posted a strong growth of 12.9% yoy benefitting
from the opening up of new permits in Delhi, Karnataka and Jaipur. Three-
wheeler export volumes for the quarter remained sluggish (down 7.8% yoy) largely
due to the impact of the hike in import duty in Sri Lanka.
7/30/2019 Bajaj Auto 4Q FY 2013
http://slidepdf.com/reader/full/bajaj-auto-4q-fy-2013 4/14
Bajaj Auto | 4QFY2013 Result Update
May 17, 2013 4
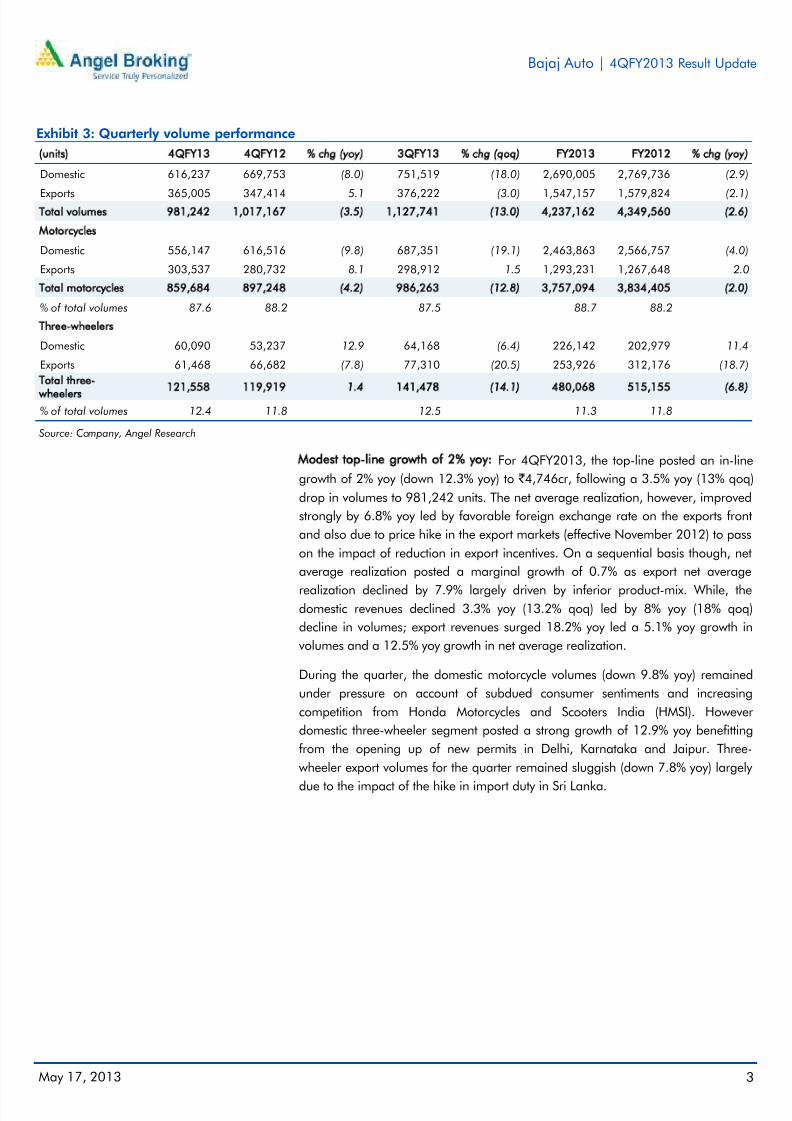
Exhibit 4: Volumes decline due to demand slowdown
Source: Company, Angel Research
Exhibit 5: Strong growth in net average realization
Source: Company, Angel Research
Exhibit 6: Revenue mix
Source: Company, Angel Research
Exhibit 7: Domestic market share trend
Source: Company, SIAM, Angel Research
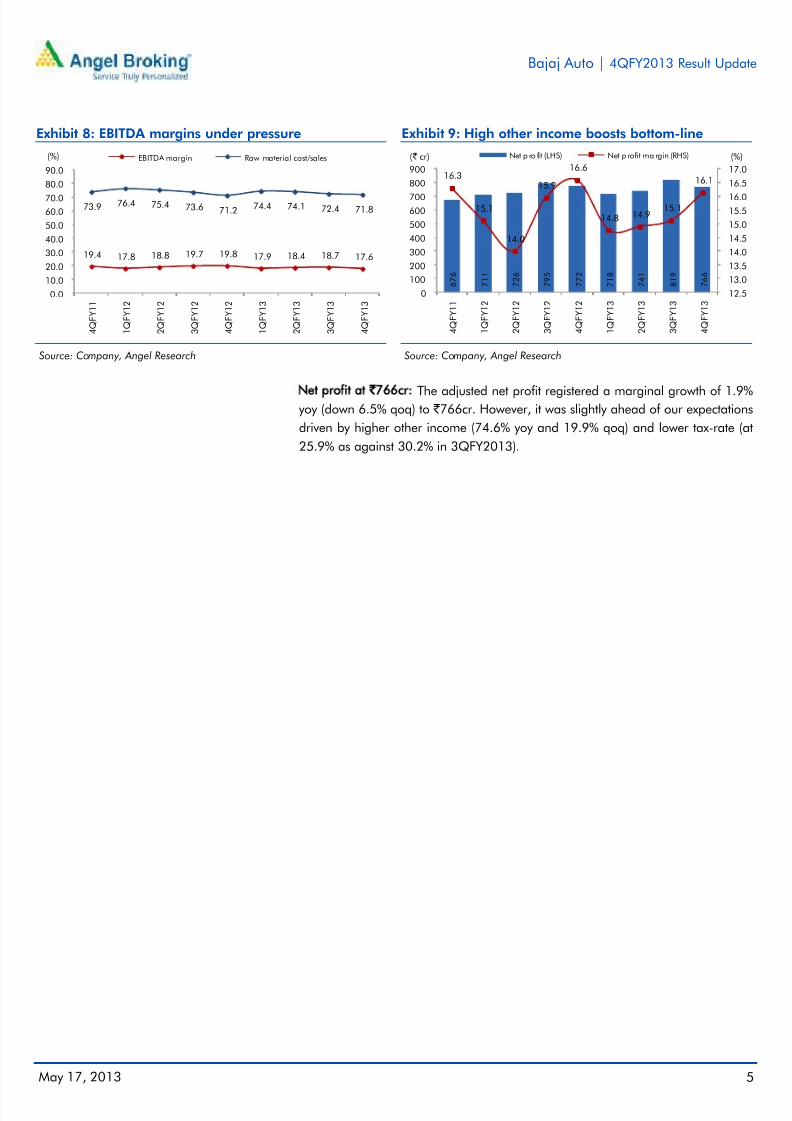
EBITDA margin at 17.6%: On the operating front, the EBITDA margin declined
217bp yoy (107bp qoq) to 17.6%, below our expectations of 18.6%, mainly due to
adverse product-mix and increase in other expenditure. A higher share of <125cc
motorcycles in the total volumes (~64% vs ~61% in 4QFY2012) impacted the
operating performance during the quarter. Consequently, operating profit declined
9.1% yoy (17.3% qoq) to ` 837cr.
9 4 8 , 1
9 8
1 , 0
9 2 , 8
1 5
1 , 1
6 4 , 1
3 7
1 , 0
7 5 , 4
4 1
1 , 0
1 7 , 1
6 7
1 , 0
7 8 , 9
7 1
1 , 0
4 9 , 2
0 8
1 , 1
2 7 , 7
4 1
9 8 1 , 2
4 2
17.2 17.716.3
13.6
7.3
(1.3) (9.9)
4.9
(3.5)
(15.0)
(10.0)
(5.0)
0.0
5.0
10.0
15.0
20.0
0
200,000
400,000
600,000
800,000
1,000,000
1,200,000
1,400,000
4 Q F Y 1 1
1 Q F Y 1 2
2 Q F Y 1 2
3 Q F Y 1 2
4 Q F Y 1 2
1 Q F Y 1 3
2 Q F Y 1 3
3 Q F Y 1 3
4 Q F Y 1 3
(%)(units) Total volumes yoy change (%)
4 2 , 9
5 9
4 1 , 5
0 2
4 2 , 8
5 9
4 5 , 0
0 4
4 4 , 3
9 3
4 3 , 6
9 4
4 5 , 9
1 1
4 7 , 0
6 0
4 7 , 4
0 0
5.6
3.12.6
5.8
3.3
5.3
7.1
4.6
6.8
0.0
1.0
2.0
3.0
4.0
5.0
6.0
7.0
8.0
38,000
39,000
40,000
41,000
42,000
43,000
44,000
45,00046,000
47,000
48,000
4 Q F Y 1 1
1 Q F Y 1 2
2 Q F Y 1 2
3 Q F Y 1 2
4 Q F Y 1 2
1 Q F Y 1 3
2 Q F Y 1 3
3 Q F Y 1 3
4 Q F Y 1 3
(%)(`) Net average realisation yoy change (%)
73.862.8 65.3 64.7 70.7
63.1 65.4 67.1 66.4
26.237.2 34.7 35.3 29.3
36.9 34.6 32.9 33.6
0.0
10.0
20.0
30.0
40.0
50.0
60.0
70.0
80.0
90.0
100.0
4 Q F
Y 1 1
1 Q F
Y 1 2
2 Q F
Y 1 2
3 Q F
Y 1 2
4 Q F
Y 1 2
1 Q F
Y 1 3
2 Q F
Y 1 3
3 Q F
Y 1 3
4 Q F
Y 1 3
(%) Domestic Export
38.6 38.3 39.9 38.940.9 40.3 41.0 42.3 44.1
26.1 25.3 26.9 25.2 24.5 23.525.7 26.0
22.5
19.9 19.6 20.2 18.9 17.9 17.6 18.5 19.116.3
0.0
5.0
10.0
15.0
20.0
25.0
30.0
35.0
40.0
45.0
50.0
4 Q F
Y 1 1
1 Q F
Y 1 2
2 Q F
Y 1 2
3 Q F
Y 1 2
4 Q F
Y 1 2
1 Q F
Y 1 3
2 Q F
Y 1 3
3 Q F
Y 1 3
4 Q F
Y 1 3
(%) Three-wheelers Motorcycles Total Two-wheelers
7/30/2019 Bajaj Auto 4Q FY 2013
http://slidepdf.com/reader/full/bajaj-auto-4q-fy-2013 5/14
Bajaj Auto | 4QFY2013 Result Update
May 17, 2013 5
Exhibit 8: EBITDA margins under pressure
Source: Company, Angel Research
Exhibit 9: High other income boosts bottom-line
Source: Company, Angel Research
Net profit at `766cr: The adjusted net profit registered a marginal growth of 1.9%yoy (down 6.5% qoq) to ` 766cr. However, it was slightly ahead of our expectations
driven by higher other income (74.6% yoy and 19.9% qoq) and lower tax-rate (at
25.9% as against 30.2% in 3QFY2013).
19.4 17.8 18.8 19.7 19.8 17.9 18.4 18.7 17.6
73.9 76.4 75.4 73.6 71.2 74.4 74.1 72.4 71.8
0.0
10.0
20.0
30.0
40.0
50.0
60.0
70.0
80.0
90.0
4 Q F Y 1 1
1 Q F Y 1 2
2 Q F Y 1 2
3 Q F Y 1 2
4 Q F Y 1 2
1 Q F Y 1 3
2 Q F Y 1 3
3 Q F Y 1 3
4 Q F Y 1 3
(%) EBITDA margin Raw material cost/sales
6 7 6
7 1 1
7 2 6
7 9 5
7 7 2
7 1 8
7 4 1
8 1 9
7 6 6
16.3
15.1
14.0
15.9
16.6
14.8 14.915.1
16.1
12.5
13.0
13.5
14.0
14.5
15.0
15.516.0
16.5
17.0
0
100
200
300
400
500
600700
800
900
4 Q F Y 1 1
1 Q F Y 1 2
2 Q F Y 1 2
3 Q F Y 1 2
4 Q F Y 1 2
1 Q F Y 1 3
2 Q F Y 1 3
3 Q F Y 1 3
4 Q F Y 1 3
(%)( ` cr) Net p ro fit (LHS) Net p rofit ma rgin (RHS)
7/30/2019 Bajaj Auto 4Q FY 2013
http://slidepdf.com/reader/full/bajaj-auto-4q-fy-2013 6/14
Bajaj Auto | 4QFY2013 Result Update
May 17, 2013 6
Conference call – Key highlights
The Management expects demand pressures to persist in 1QFY2014 in the
domestic markets and expects a flat to negative volume growth for the quarter.
While the retail demand in the month of May has been strong, the company
believes that it could be on account of the marriage season in North India.
The Management has guided for a 10-12% growth in the three-wheeler
segment and expects the growth to be driven by issue of new permits. The new
launches that are lined up in FY2014 are also expected to drive growth.
For FY2014, the company expects the export volumes to increase by 10-12%
led by growth in Africa and Latin America. However, the long term growth
from the export markets is expected to remain in the range of 15-18%. This
would be led by leveraging upon its association with Kawasaki (to enter the
South East Asian markets) and KTM. The company also intends to enter newercountries like Brazil going ahead.
On the capacity front, the management is planning to increase the
three-wheeler capacity in FY2014 to 60,000/month from the current levels of
50,000/month.
The net average USD/INR rate for the exports realization stood at ` 49.5 in
4QFY2013. The company expects the export realization to be at ` 54 and ` 55
per Dollar in FY2014 and FY2015 respectively as against ` 49.5 per Dollar in
FY2013. BJAUT has hedged about US$1,200mn of exports exposure
(US$800mn pertaining to FY2014) in the range of ` 53- ` 60/ Dollar.
The company has increased the prices in export markets to negate the impact
of cut in DEPB rates in October 2012. DEPB rates were lowered to 2.5% from
5.5% earlier. Of this reduction, 70-75% has been covered through price hikes.
The company has taken a price hike in the range of ` 500- ` 1,000/ vehicle
effective from April 2013.
Inventory at the dealer end remains at around five and half weeks.
BJAUT plans to spend ` 500cr in capex over the next two years.
7/30/2019 Bajaj Auto 4Q FY 2013
http://slidepdf.com/reader/full/bajaj-auto-4q-fy-2013 7/14
Bajaj Auto | 4QFY2013 Result Update
May 17, 2013 7
Investment arguments
Strong focus on Discover and Pulsar to improve market share: BJAUT has
witnessed moderation in demand in the domestic market recently due to
increased competitive activity and slowdown in the industry. However, BJAUT
continues to focus on its core brands, Discover and Pulsar. The successful
launches of Discover 100T , 125ST and Pulsar 200NS in FY2013 enabled the
company to arrest its market share losses. BJAUT lost ~100bp in market share
in the domestic motorcycle segment and the share stood at 24.4%. Going
ahead, the company intends to launch six new variants of Discover in FY2014,
four of which would be in the mass market category. We believe the new
launches will enable the company to regain the momentum in the domestic
markets and will lead to a volume CAGR of ~10% over FY2013-15E.
Three-wheelers registering healthy growth: BJAUT has a strong presence in the
three-wheeler market, with an overall market share (including exports) of
~57%. The company tops the passenger auto-rickshaw segment (~65%
market share), which accounts for ~85% of the three-wheeler market. The
three-wheeler segment fetches higher margins than the company ’s
two-wheeler business. Although competition in the domestic three-wheeler
space is intense, strong export volume growth has helped BJAUT to post a
~15% volume CAGR over FY2009-13E. Going ahead, the company plans to
revamp its entire three-wheeler portfolio in FY2014 which should help the
company sustain the growth.
Growth potential in export markets: BJAUT registered a strong exports CAGR
of ~20% during FY2009-13, aided by a ~20% CAGR in two-wheeler exports
and a ~16% CAGR in three-wheeler exports. While in FY2013, the exports
growth has remained muted due to import duty hike in Sri Lanka and
disruptions in Egypt, we expect volumes to recover in FY2014. We estimate the
company to register a ~12% volume CAGR in exports over FY2013-15E.
Further, favorable currency movement is likely to boost export revenues in
FY2014. BJAUT has hedged around two-third of its FY2014 exports at a
favorable USD-INR rate of ` 54 and above.
Outlook and valuation
We broadly retain our revenue and earnings estimates for the company forFY2014/15. BJAUT is planning to launch six new variants of Discover in FY2014,
four of which would be in the price range of ` 40,000- ` 50,000. Further, the
company also intends to revamp its entire three wheeler portfolio in FY2014. We
believe that the aggressive product launch pipeline coupled with the revival in
demand in the domestic and exports markets will enable BJAUT to register a
healthy volume CAGR of ~10% over FY2013-15E. Nevertheless, we expect
EBITDA margins to remain under pressure as the benefits of favorable rates on
forex hedges will be negated by the changing volume-mix in favor of lower margin
products.
7/30/2019 Bajaj Auto 4Q FY 2013
http://slidepdf.com/reader/full/bajaj-auto-4q-fy-2013 8/14
Bajaj Auto | 4QFY2013 Result Update
May 17, 2013 8
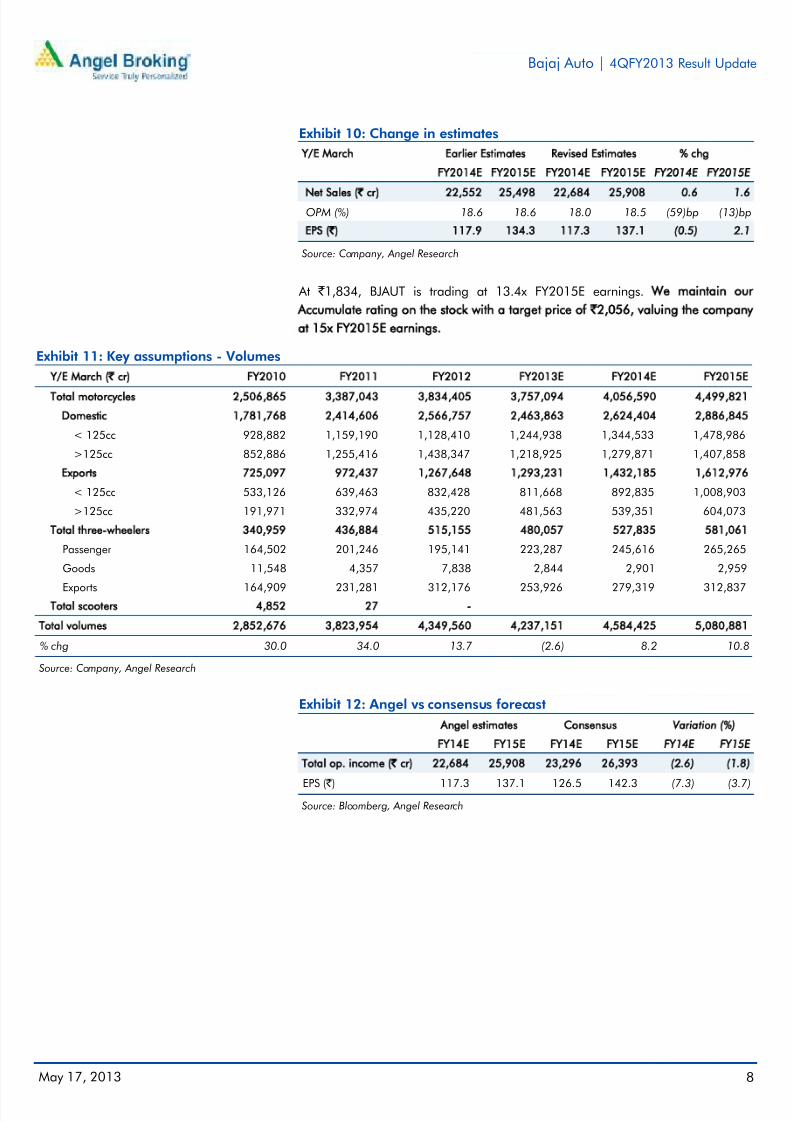
Exhibit 10: Change in estimates
Y/E March Earlier Estimates Revised Estimates % chg
FY2014E FY2015E FY2014E FY2015E FY2014E FY2015E
Net Sales (` cr) 22,552 25,498 22,684 25,908 0.6 1.6OPM (%) 18.6 18.6 18.0 18.5 (59)bp (13)bp
EPS (`) 117.9 134.3 117.3 137.1 (0.5) 2.1
Source: Company, Angel Research
At ` 1,834, BJAUT is trading at 13.4x FY2015E earnings. We maintain our
Accumulate rating on the stock with a target price of `2,056, valuing the company
at 15x FY2015E earnings.
Exhibit 11: Key assumptions - Volumes
Y/E March (` cr) FY2010 FY2011 FY2012 FY2013E FY2014E FY2015E
Total motorcycles 2,506,865 3,387,043 3,834,405 3,757,094 4,056,590 4,499,821
Domestic 1,781,768 2,414,606 2,566,757 2,463,863 2,624,404 2,886,845
< 125cc 928,882 1,159,190 1,128,410 1,244,938 1,344,533 1,478,986
>125cc 852,886 1,255,416 1,438,347 1,218,925 1,279,871 1,407,858
Exports 725,097 972,437 1,267,648 1,293,231 1,432,185 1,612,976
< 125cc 533,126 639,463 832,428 811,668 892,835 1,008,903
>125cc 191,971 332,974 435,220 481,563 539,351 604,073
Total three-wheelers 340,959 436,884 515,155 480,057 527,835 581,061
Passenger 164,502 201,246 195,141 223,287 245,616 265,265
Goods 11,548 4,357 7,838 2,844 2,901 2,959
Exports 164,909 231,281 312,176 253,926 279,319 312,837Total scooters 4,852 27 -
Total volumes 2,852,676 3,823,954 4,349,560 4,237,151 4,584,425 5,080,881
% chg 30.0 34.0 13.7 (2.6) 8.2 10.8
Source: Company, Angel Research
Exhibit 12: Angel vs consensus forecast
Angel estimates Consensus Variation (%)
FY14E FY15E FY14E FY15E FY14E FY15E
Total op. income (` cr) 22,684 25,908 23,296 26,393 (2.6) (1.8)
EPS ( ` ) 117.3 137.1 126.5 142.3 (7.3) (3.7)
Source: Bloomberg, Angel Research
7/30/2019 Bajaj Auto 4Q FY 2013
http://slidepdf.com/reader/full/bajaj-auto-4q-fy-2013 9/14
Bajaj Auto | 4QFY2013 Result Update
May 17, 2013 9
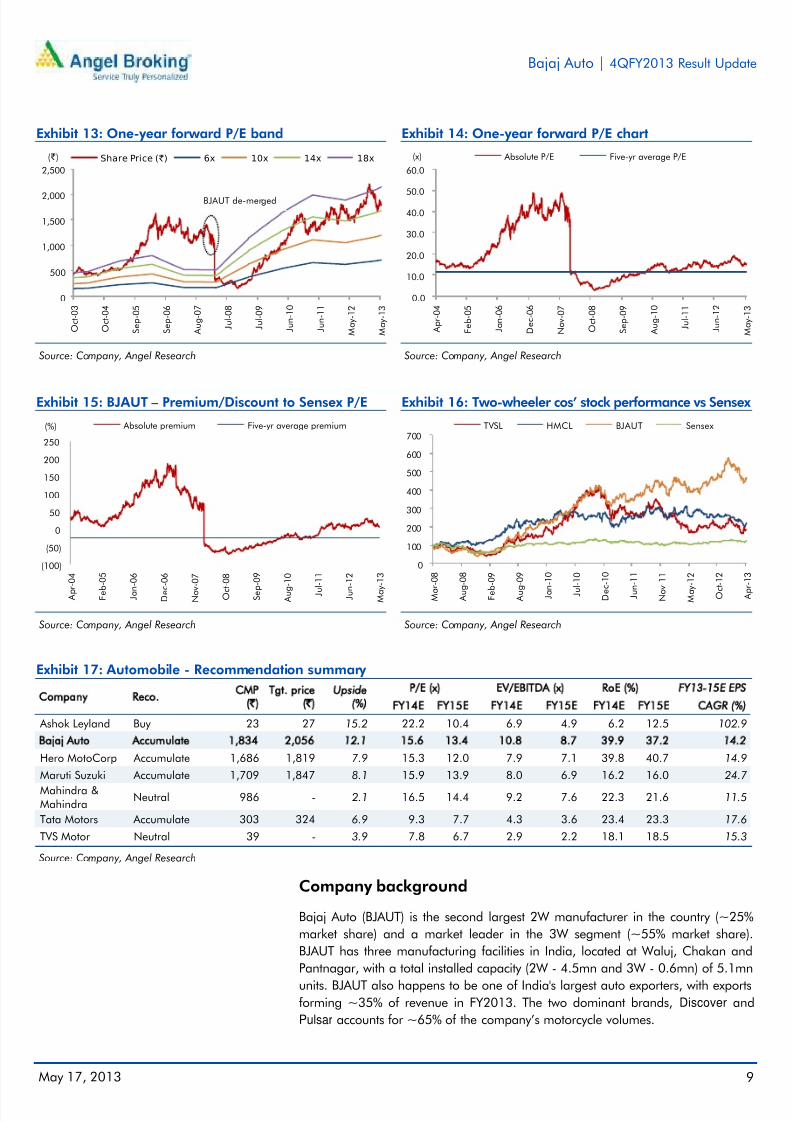
Exhibit 13: One-year forward P/E band
Source: Company, Angel Research
Exhibit 14: One-year forward P/E chart
Source: Company, Angel Research
Exhibit 15: BJAUT – Premium/Discount to Sensex P/E
Source: Company, Angel Research
Exhibit 16: Two-wheeler cos’ stock performance vs Sensex
Source: Company, Angel Research
Exhibit 17: Automobile - Recommendation summary
Company Reco.CMP
(`)Tgt. price
(`)Upside
(%)
P/E (x) EV/EBITDA (x) RoE (%) FY13-15E EPS
FY14E FY15E FY14E FY15E FY14E FY15E CAGR (%)
Ashok Leyland Buy 23 27 15.2 22.2 10.4 6.9 4.9 6.2 12.5 102.9
Bajaj Auto Accumulate 1,834 2,056 12.1 15.6 13.4 10.8 8.7 39.9 37.2 14.2
Hero MotoCorp Accumulate 1,686 1,819 7.9 15.3 12.0 7.9 7.1 39.8 40.7 14.9
Maruti Suzuki Accumulate 1,709 1,847 8.1 15.9 13.9 8.0 6.9 16.2 16.0 24.7
Mahindra &Mahindra
Neutral 986 - 2.1 16.5 14.4 9.2 7.6 22.3 21.6 11.5
Tata Motors Accumulate 303 324 6.9 9.3 7.7 4.3 3.6 23.4 23.3 17.6
TVS Motor Neutral 39 - 3.9 7.8 6.7 2.9 2.2 18.1 18.5 15.3
Source: Company, Angel Research
Company background
Bajaj Auto (BJAUT) is the second largest 2W manufacturer in the country (~25%
market share) and a market leader in the 3W segment (~55% market share).
BJAUT has three manufacturing facilities in India, located at Waluj, Chakan and
Pantnagar, with a total installed capacity (2W - 4.5mn and 3W - 0.6mn) of 5.1mn
units. BJAUT also happens to be one of India's largest auto exporters, with exportsforming ~35% of revenue in FY2013. The two dominant brands, Discover and
Pulsar accounts for ~65% of the company’s motorcycle volumes.
0
500
1,000
1,500
2,000
2,500
O c t - 0 3
O c t - 0 4
S e p - 0
5
S e p - 0
6
A u g - 0
7
J u l - 0 8
J u l - 0 9
J u n - 1
0
J u n - 1
1
M a y - 1
2
M a y - 1
3
( ` ) Share Price (`) 6x 10x 14x 18x
BJAUT de-merged
0.0
10.0
20.0
30.0
40.0
50.0
60.0
A p r - 0 4
F e b - 0
5
J a n - 0
6
D e c - 0
6
N o v - 0
7
O c t - 0 8
S e p - 0
9
A u g - 1
0
J u l - 1 1
J u n - 1
2
M a y - 1
3
(x) Absolute P/E Five-yr average P/E
(100)
(50)
0
50
100
150
200
250
A p r - 0 4
F e b
- 0 5
J a n
- 0 6
D e c
- 0 6
N o v
- 0 7
O c t - 0 8
S e p
- 0 9
A u g
- 1 0
J u
l - 1 1
J u n
- 1 2
M a y - 1
3
(%) Absolute premium Five-yr average premium
0
100
200
300
400
500
600
700
M a r - 0 8
A u g
- 0 8
F e b
- 0 9
A u g
- 0 9
J a n
- 1 0
J u
l - 1 0
D e c - 1
0
J u n
- 1 1
N o v - 1
1
M a y - 1
2
O c
t - 1 2
A p r - 1 3
TVSL HMCL BJAUT Sensex
7/30/2019 Bajaj Auto 4Q FY 2013
http://slidepdf.com/reader/full/bajaj-auto-4q-fy-2013 10/14
Bajaj Auto | 4QFY2013 Result Update
May 17, 2013 10
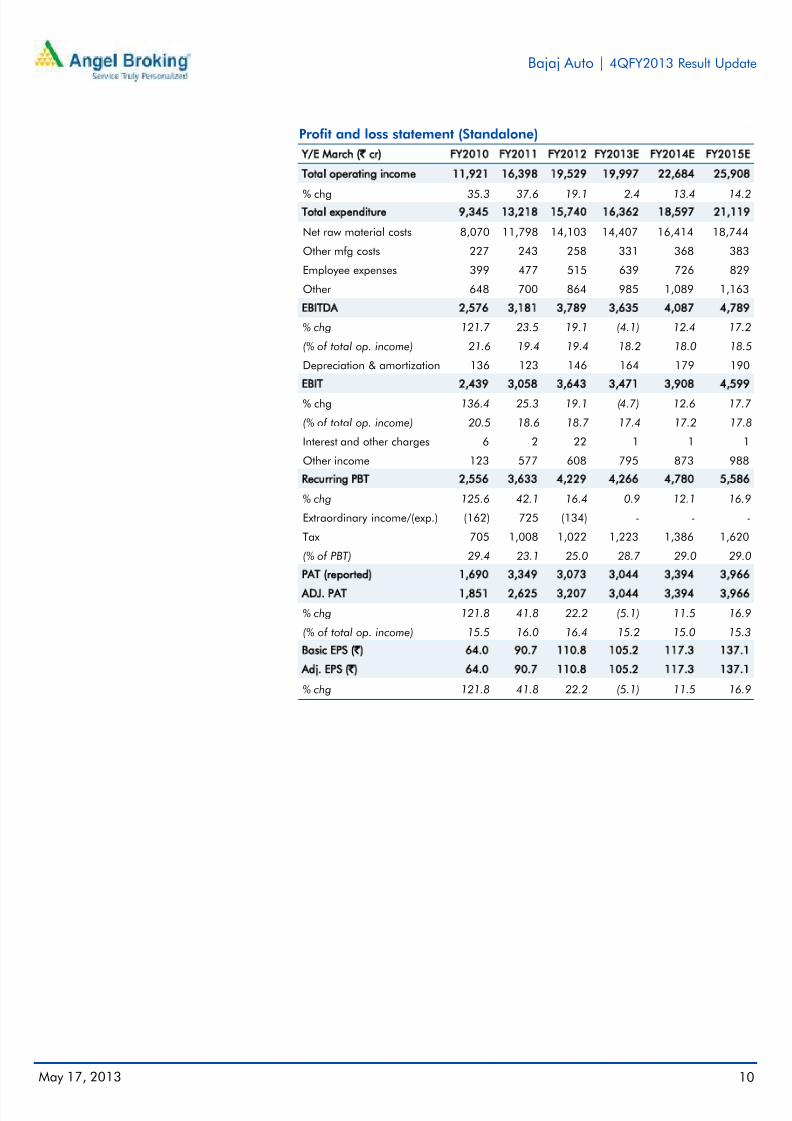
Profit and loss statement (Standalone)
Y/E March (` cr) FY2010 FY2011 FY2012 FY2013E FY2014E FY2015E
Total operating income 11,921 16,398 19,529 19,997 22,684 25,908
% chg 35.3 37.6 19.1 2.4 13.4 14.2Total expenditure 9,345 13,218 15,740 16,362 18,597 21,119
Net raw material costs 8,070 11,798 14,103 14,407 16,414 18,744
Other mfg costs 227 243 258 331 368 383
Employee expenses 399 477 515 639 726 829
Other 648 700 864 985 1,089 1,163
EBITDA 2,576 3,181 3,789 3,635 4,087 4,789
% chg 121.7 23.5 19.1 (4.1) 12.4 17.2
(% of total op. income) 21.6 19.4 19.4 18.2 18.0 18.5
Depreciation & amortization 136 123 146 164 179 190
EBIT 2,439 3,058 3,643 3,471 3,908 4,599
% chg 136.4 25.3 19.1 (4.7) 12.6 17.7
(% of total op. income) 20.5 18.6 18.7 17.4 17.2 17.8
Interest and other charges 6 2 22 1 1 1
Other income 123 577 608 795 873 988
Recurring PBT 2,556 3,633 4,229 4,266 4,780 5,586
% chg 125.6 42.1 16.4 0.9 12.1 16.9
Extraordinary income/(exp.) (162) 725 (134) - - -
Tax 705 1,008 1,022 1,223 1,386 1,620
(% of PBT) 29.4 23.1 25.0 28.7 29.0 29.0
PAT (reported) 1,690 3,349 3,073 3,044 3,394 3,966
ADJ. PAT 1,851 2,625 3,207 3,044 3,394 3,966
% chg 121.8 41.8 22.2 (5.1) 11.5 16.9
(% of total op. income) 15.5 16.0 16.4 15.2 15.0 15.3
Basic EPS (`) 64.0 90.7 110.8 105.2 117.3 137.1
Adj. EPS (`) 64.0 90.7 110.8 105.2 117.3 137.1
% chg 121.8 41.8 22.2 (5.1) 11.5 16.9
7/30/2019 Bajaj Auto 4Q FY 2013
http://slidepdf.com/reader/full/bajaj-auto-4q-fy-2013 11/14
Bajaj Auto | 4QFY2013 Result Update
May 17, 2013 11
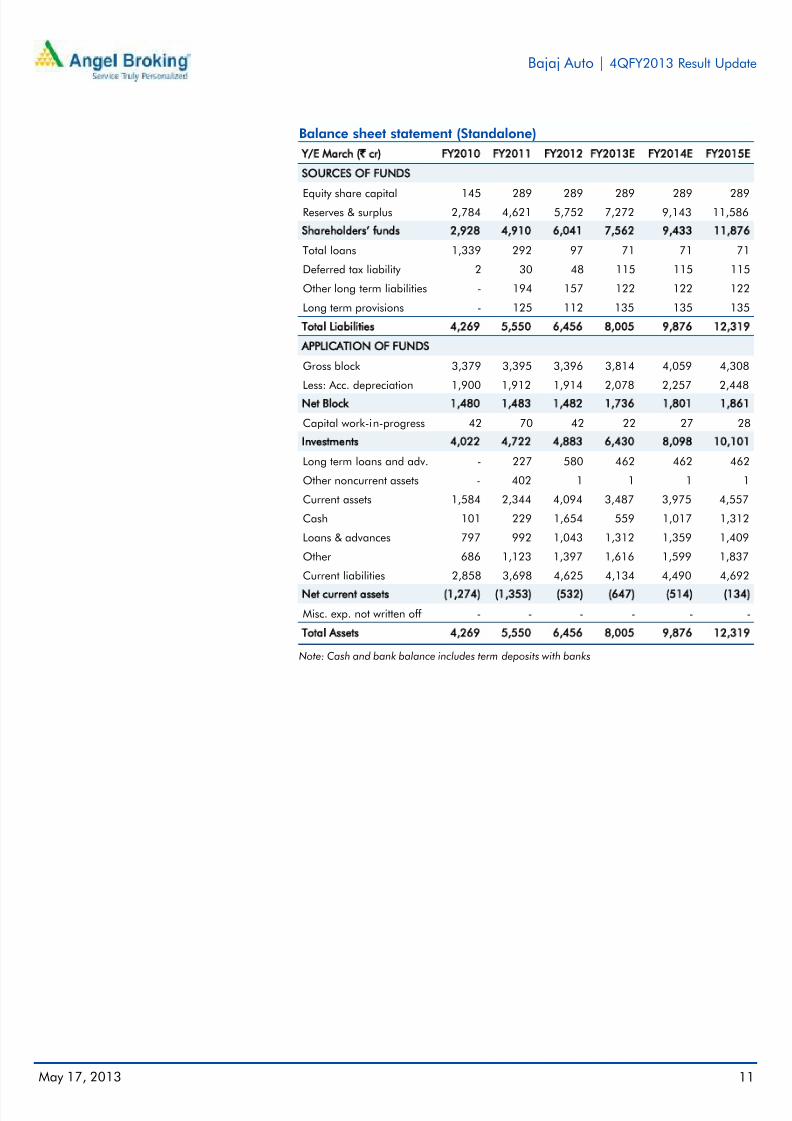
Balance sheet statement (Standalone)
Y/E March (` cr) FY2010 FY2011 FY2012 FY2013E FY2014E FY2015E
SOURCES OF FUNDS
Equity share capital 145 289 289 289 289 289Reserves & surplus 2,784 4,621 5,752 7,272 9,143 11,586
Shareholders’ funds 2,928 4,910 6,041 7,562 9,433 11,876
Total loans 1,339 292 97 71 71 71
Deferred tax liability 2 30 48 115 115 115
Other long term liabilities - 194 157 122 122 122
Long term provisions - 125 112 135 135 135
Total Liabilities 4,269 5,550 6,456 8,005 9,876 12,319
APPLICATION OF FUNDS
Gross block 3,379 3,395 3,396 3,814 4,059 4,308
Less: Acc. depreciation 1,900 1,912 1,914 2,078 2,257 2,448
Net Block 1,480 1,483 1,482 1,736 1,801 1,861
Capital work-in-progress 42 70 42 22 27 28
Investments 4,022 4,722 4,883 6,430 8,098 10,101
Long term loans and adv. - 227 580 462 462 462
Other noncurrent assets - 402 1 1 1 1
Current assets 1,584 2,344 4,094 3,487 3,975 4,557
Cash 101 229 1,654 559 1,017 1,312
Loans & advances 797 992 1,043 1,312 1,359 1,409
Other 686 1,123 1,397 1,616 1,599 1,837
Current liabilities 2,858 3,698 4,625 4,134 4,490 4,692
Net current assets (1,274) (1,353) (532) (647) (514) (134)
Misc. exp. not written off - - - - - -
Total Assets 4,269 5,550 6,456 8,005 9,876 12,319
Note: Cash and bank balance includes term deposits with banks
7/30/2019 Bajaj Auto 4Q FY 2013
http://slidepdf.com/reader/full/bajaj-auto-4q-fy-2013 12/14
Bajaj Auto | 4QFY2013 Result Update
May 17, 2013 12
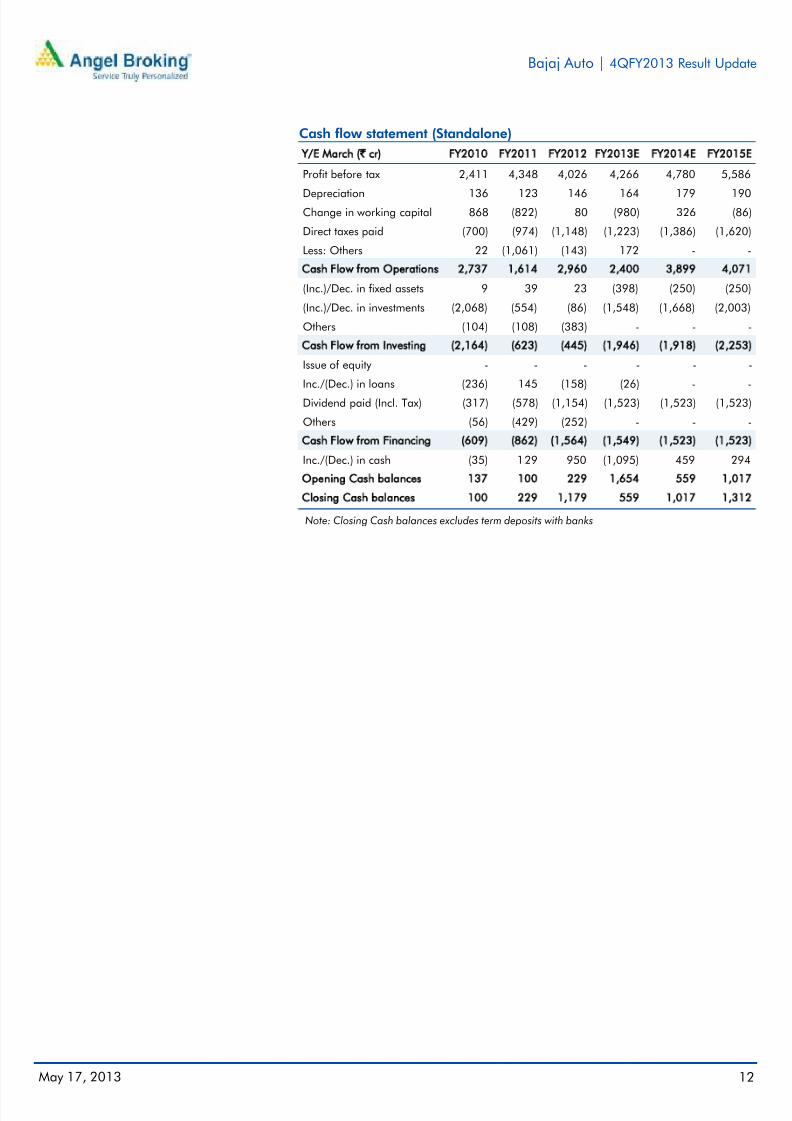
Cash flow statement (Standalone)
Y/E March (` cr) FY2010 FY2011 FY2012 FY2013E FY2014E FY2015E
Profit before tax 2,411 4,348 4,026 4,266 4,780 5,586
Depreciation 136 123 146 164 179 190Change in working capital 868 (822) 80 (980) 326 (86)
Direct taxes paid (700) (974) (1,148) (1,223) (1,386) (1,620)
Less: Others 22 (1,061) (143) 172 - -
Cash Flow from Operations 2,737 1,614 2,960 2,400 3,899 4,071
(Inc.)/Dec. in fixed assets 9 39 23 (398) (250) (250)
(Inc.)/Dec. in investments (2,068) (554) (86) (1,548) (1,668) (2,003)
Others (104) (108) (383) - - -
Cash Flow from Investing (2,164) (623) (445) (1,946) (1,918) (2,253)
Issue of equity - - - - - -
Inc./(Dec.) in loans (236) 145 (158) (26) - -
Dividend paid (Incl. Tax) (317) (578) (1,154) (1,523) (1,523) (1,523)
Others (56) (429) (252) - - -
Cash Flow from Financing (609) (862) (1,564) (1 ,549) (1,523) (1,523)
Inc./(Dec.) in cash (35) 129 950 (1,095) 459 294
Opening Cash balances 137 100 229 1,654 559 1,017
Closing Cash balances 100 229 1,179 559 1,017 1,312
Note: Closing Cash balances excludes term deposits with banks
7/30/2019 Bajaj Auto 4Q FY 2013
http://slidepdf.com/reader/full/bajaj-auto-4q-fy-2013 13/14
Bajaj Auto | 4QFY2013 Result Update
May 17, 2013 13
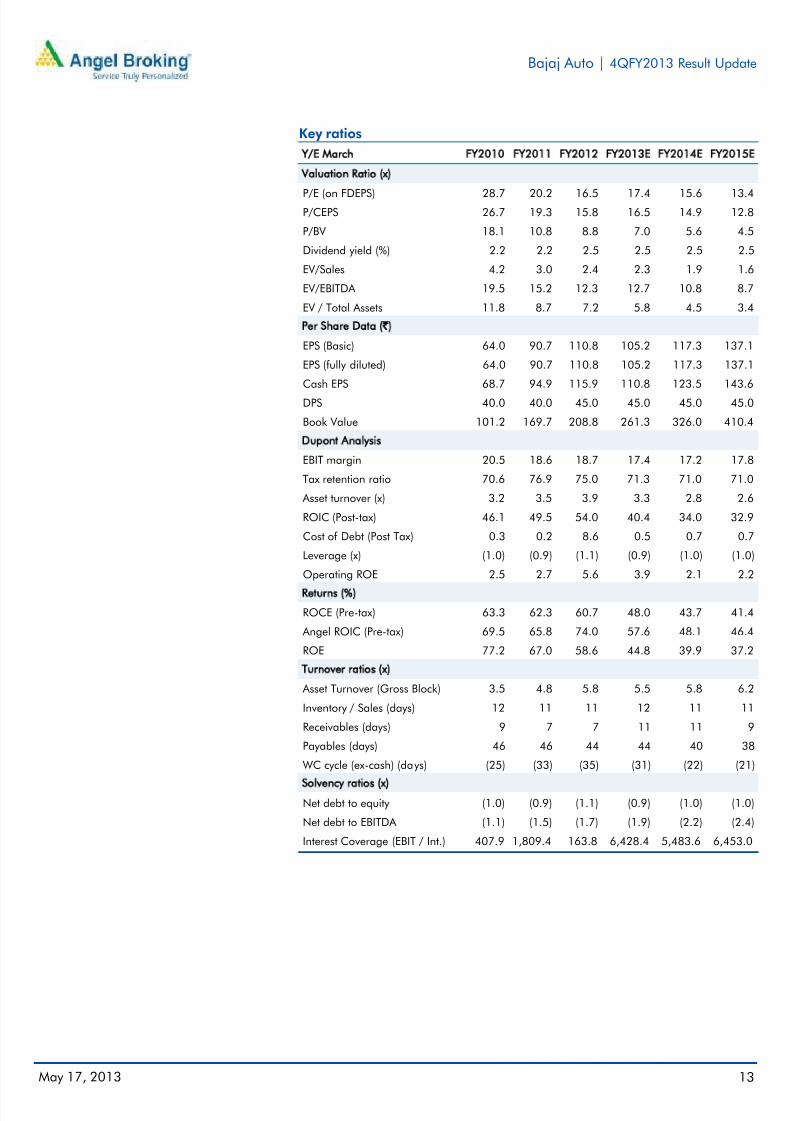
Key ratios
Y/E March FY2010 FY2011 FY2012 FY2013E FY2014E FY2015E
Valuation Ratio (x)
P/E (on FDEPS) 28.7 20.2 16.5 17.4 15.6 13.4P/CEPS 26.7 19.3 15.8 16.5 14.9 12.8
P/BV 18.1 10.8 8.8 7.0 5.6 4.5
Dividend yield (%) 2.2 2.2 2.5 2.5 2.5 2.5
EV/Sales 4.2 3.0 2.4 2.3 1.9 1.6
EV/EBITDA 19.5 15.2 12.3 12.7 10.8 8.7
EV / Total Assets 11.8 8.7 7.2 5.8 4.5 3.4
Per Share Data (`)
EPS (Basic) 64.0 90.7 110.8 105.2 117.3 137.1
EPS (fully diluted) 64.0 90.7 110.8 105.2 117.3 137.1
Cash EPS 68.7 94.9 115.9 110.8 123.5 143.6
DPS 40.0 40.0 45.0 45.0 45.0 45.0
Book Value 101.2 169.7 208.8 261.3 326.0 410.4
Dupont Analysis
EBIT margin 20.5 18.6 18.7 17.4 17.2 17.8
Tax retention ratio 70.6 76.9 75.0 71.3 71.0 71.0
Asset turnover (x) 3.2 3.5 3.9 3.3 2.8 2.6
ROIC (Post-tax) 46.1 49.5 54.0 40.4 34.0 32.9
Cost of Debt (Post Tax) 0.3 0.2 8.6 0.5 0.7 0.7
Leverage (x) (1.0) (0.9) (1.1) (0.9) (1.0) (1.0)
Operating ROE 2.5 2.7 5.6 3.9 2.1 2.2
Returns (%)
ROCE (Pre-tax) 63.3 62.3 60.7 48.0 43.7 41.4
Angel ROIC (Pre-tax) 69.5 65.8 74.0 57.6 48.1 46.4
ROE 77.2 67.0 58.6 44.8 39.9 37.2
Turnover ratios (x)
Asset Turnover (Gross Block) 3.5 4.8 5.8 5.5 5.8 6.2
Inventory / Sales (days) 12 11 11 12 11 11
Receivables (days) 9 7 7 11 11 9
Payables (days) 46 46 44 44 40 38
WC cycle (ex-cash) (days) (25) (33) (35) (31) (22) (21)
Solvency ratios (x)Net debt to equity (1.0) (0.9) (1.1) (0.9) (1.0) (1.0)
Net debt to EBITDA (1.1) (1.5) (1.7) (1.9) (2.2) (2.4)
Interest Coverage (EBIT / Int.) 407.9 1,809.4 163.8 6,428.4 5,483.6 6,453.0
7/30/2019 Bajaj Auto 4Q FY 2013
http://slidepdf.com/reader/full/bajaj-auto-4q-fy-2013 14/14
Bajaj Auto | 4QFY2013 Result Update
Research Team Tel: 022 - 39357800 E-mail: [email protected] Website: www.angelbroking.com
DISCLAIMER
This document is solely for the personal information of the recipient, and must not be singularly used as the basis of any investmentdecision. Nothing in this document should be construed as investment or financial advice. Each recipient of this document should make
such investigations as they deem necessary to arrive at an independent evaluation of an investment in the securities of the companies
referred to in this document (including the merits and risks involved), and should consult their own advisors to determine the merits and
risks of such an investment.
Angel Broking Limited, its affiliates, directors, its proprietary trading and investment businesses may, from time to time, make
investment decisions that are inconsistent with or contradictory to the recommendations expressed herein. The views contained in this
document are those of the analyst, and the company may or may not subscribe to all the views expressed within.
Reports based on technical and derivative analysis center on studying charts of a stock's price movement, outstanding positions and
trading volume, as opposed to focusing on a company's fundamentals and, as such, may not match with a report on a company's
fundamentals.
The information in this document has been printed on the basis of publicly available information, internal data and other reliablesources believed to be true, but we do not represent that it is accurate or complete and it should not be relied on as such, as thisdocument is for general guidance only. Angel Broking Limited or any of its affiliates/ group companies shall not be in any way responsible for any loss or damage that may arise to any person from any inadvertent error in the information contained in this report .
Angel Broking Limited has not independently verified all the information contained within this document. Accordingly, we cannot testify,nor make any representation or warranty, express or implied, to the accuracy, contents or data contained within this document. While
Angel Broking Limited endeavours to update on a reasonable basis the information discussed in this material, there may be regulatory,compliance, or other reasons that prevent us from doing so.
This document is being supplied to you solely for your information, and its contents, information or data may not be reproduced,
redistributed or passed on, directly or indirectly.
Angel Broking Limited and its affiliates may seek to provide or have engaged in providing corporate finance, investment banking or
other advisory services in a merger or specific transaction to the companies referred to in this report, as on the date of this report or in
the past.
Neither Angel Broking Limited, nor its directors, employees or affiliates shall be liable for any loss or damage that may arise from or in
connection with the use of this information.
Note: Please refer to the important ̀ Stock Holding Disclosure' report on the Angel website (Research Section). Also, please r efer to thelatest update on respective stocks for the disclosure status in respect of those stocks. Angel Broking Limited and its affiliates may haveinvestment positions in the stocks recommended in this report.
Disclosure of Interest Statement Bajaj Auto
1. Analyst ownership of the stock No
2. Angel and its Group companies ownership of the stock No
3. Angel and its Group companies' Directors ownership of the stock No
4. Broking relationship with company covered No
Ratings (Returns): Buy (> 15%) Accumulate (5% to 15%) Neutral (-5 to 5%)Reduce (-5% to -15%) Sell (< -15%)
Note: We have not considered any Exposure below ` 1 lakh for Angel, its Group companies and Directors