Embed Size (px)
Citation preview
Steve Keen Not Keen on Bailouts Economic Analysis & Policy
Page 1
Bailing out the Titanic with a ThimbleThe now commonplace observation in the media that this financial crisis is "the worst since the
Great Depression" may appear to be hyperbole to many academic economists. It is not—if anything, itmay understate the scale of the crisis.
Ever since Milton Friedman's Monetary History of the United States (Friedman and Schwartz,1971), neoclassical economists—including the current Chairman of the Federal Reserve, Ben Bernanke(Bernanke, 2002A)—have asserted that the Great Depression was caused by poor monetary policy bythe then Federal Reserve.1 So much for that theory: today's stark reality should make it unarguable thatthe real cause of Depression-scale financial crises is excessive private debt accumulated during apreceding speculative bubble—which accords with the "debt-deflation" hypothesis first developed byIrving Fisher, and perfected by Hyman Minsky, rather than Milton's tale of errant regulators.
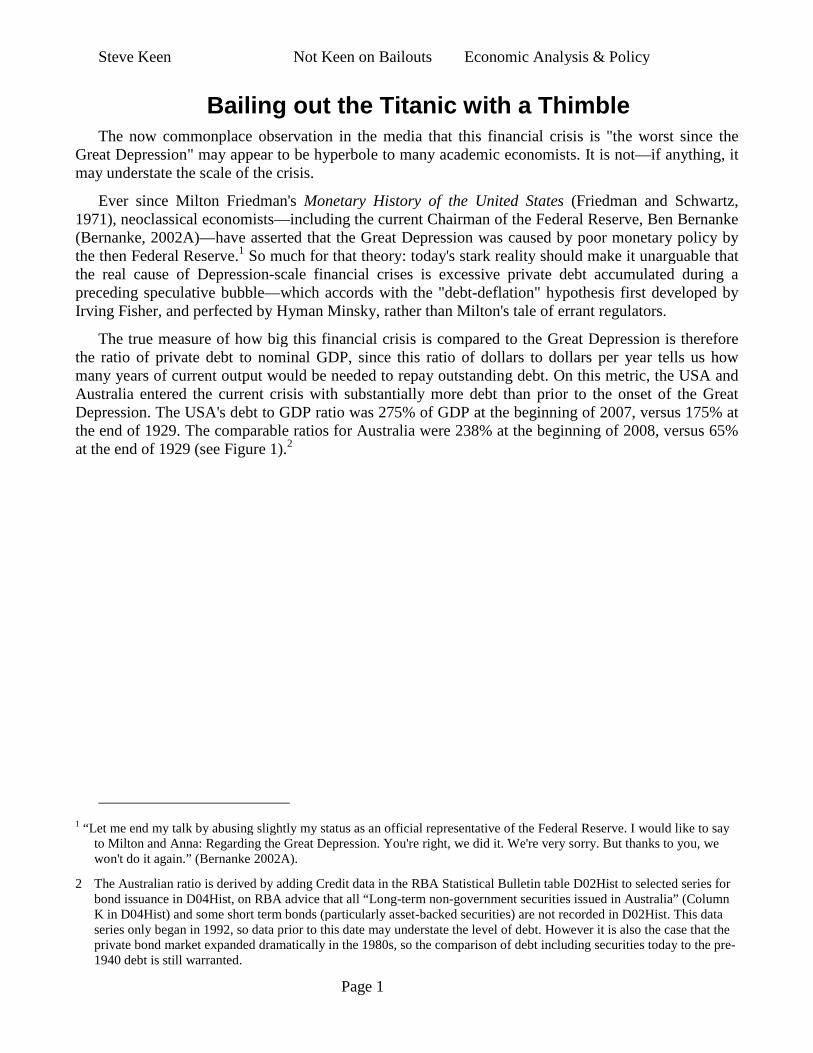
The true measure of how big this financial crisis is compared to the Great Depression is thereforethe ratio of private debt to nominal GDP, since this ratio of dollars to dollars per year tells us howmany years of current output would be needed to repay outstanding debt. On this metric, the USA andAustralia entered the current crisis with substantially more debt than prior to the onset of the GreatDepression. The USA's debt to GDP ratio was 275% of GDP at the beginning of 2007, versus 175% atthe end of 1929. The comparable ratios for Australia were 238% at the beginning of 2008, versus 65%at the end of 1929 (see Figure 1).2
1 “Let me end my talk by abusing slightly my status as an official representative of the Federal Reserve. I would like to sayto Milton and Anna: Regarding the Great Depression. You're right, we did it. We're very sorry. But thanks to you, wewon't do it again.” (Bernanke 2002A).
2 The Australian ratio is derived by adding Credit data in the RBA Statistical Bulletin table D02Hist to selected series forbond issuance in D04Hist, on RBA advice that all “Long-term non-government securities issued in Australia” (ColumnK in D04Hist) and some short term bonds (particularly asset-backed securities) are not recorded in D02Hist. This dataseries only began in 1992, so data prior to this date may understate the level of debt. However it is also the case that theprivate bond market expanded dramatically in the 1980s, so the comparison of debt including securities today to the pre-1940 debt is still warranted.
Steve Keen Not Keen on Bailouts Economic Analysis & Policy
Page 2
Figure 1: Sources for Debt Data: US Census and FRB Flow of Funds; RBA Bulletin TablesD02 and D04; Battellino 2007; Kent & Fisher 1999
Added to this is the qualitative change in the nature of debt. The most exotic of Roaring Twentiesera debt was probably margin lending; today we have added to that:
A kitchen soup of derivative instruments with a gross value of US$683 trillion as at June 2008,3 anda net value that is an unknowable factor of how many counterparties go bankrupt. These are clearlynot the benign risk-spreading instruments of conventional finance theory, but the "financial weaponsof mass destruction" of which Warren Buffett warned;
The peculiarly American deviant of "Adjustable Rate Mortgages", where a low "teaser" rate on afixed rate mortgage applies for a short period (up to five years), after which the rate resets to a highercommercial rate, AND the gap between the two rates is capitalised onto the outstanding debt duringthe teaser period. The crisis was triggered by 2.8 million subprime loans with an average value of$183,000, 62% of which were ARMs, and 70% of which have already reset; in the wings awaitanother 2.2 million Alt-A loans with an average value of $321,000, 53% of which are ARMs and54% of which still await resetting;4
The unquantifiable off-balance sheet activities of financial institutions; and
The junk bond activities of private equity firms.
The unwinding of all these financial esoterica will add to the underlying debt. As well as no doubtrequiring future economic historians to revise upwards today's recorded debt levels, the momentum ofthese debt instruments will also ensure that debt—and bankruptcies—will continue to rise even aseconomic activity falters.
3 See http://www.bis.org/statistics/otcder/dt1920a.csv.
4 See http://www.newyorkfed.org/regional/subprime.html.
1860 1870 1880 1890 1900 1910 1920 1930 1940 1950 1960 1970 1980 1990 2000 20100
50
100
150
200
250
300
350
400
Australia
USAAustralia including securities
Private Debt to GDP RatiosP
erce
nt
of
Nom
inal
GD
P

Steve Keen Not Keen on Bailouts Economic Analysis & Policy
Page 3
The greatest amplifier of the debt burden during a Depression, however, is deflation. The US's debtto GDP ratio rose another 60 percent after 1930, not because of increased borrowing, but becausefalling output and prices increased the real burden of debt even as borrowers managed (by design or viabankruptcy) to reduce debt in nominal terms (see Figures 2 and 3).
Figure 2: Source US Census
Fisher's characterisation of this phenomenon, that "the more debtors pay, the more they owe"5
deserves the moniker of "Fisher's Paradox".
5 "Then, the very effort of individuals to lessen their burden of debts increases it, because of the mass effect of thestampede to liquidate in swelling each dollar owed. Then we have the great paradox which, I submit, is the chief secretof most, if not all, great depressions: The more the debtors pay, the more they owe. The more the economic boat tips, themore it tends to tip. It is not tending to right itself, but is capsizing.", Fisher 1933 p. 344
1926 1928 1930 1932 1934 1936100
120
140
160
180
200
140
160
180
200
220
240
Debt (LHS)
Debt/GDP (RHS)
Falling Debt and a Rising Debt Ratio
US
$B
illi
on
Per
cent
ofG
DP

Steve Keen Not Keen on Bailouts Economic Analysis & Policy
Page 4
Figure 3: Source BLS (ftp://ftp.bls.gov/pub/special.requests/cpi/cpiai.txt)
This is clearly the nightmare that keeps Ben Bernanke awake and at the metaphorical printing press,and it is already with us in the monthly data. November's figure of a 1.9% fall in the CPI was thesteepest since 1932, and the second steepest fall on record, while as of December 2008, the USA hadexperienced five consecutive months of falling prices. The lagged annual rate of inflation is now barelyabove zero (see Figure 4).
Figure 4: Source BLS (ftp://ftp.bls.gov/pub/special.requests/cpi/cpiai.txt)
The current crisis thus has the two prerequisites for a Depression identified by Fisher: excessive
1926 1927 1928 1929 1930 1931 1932 1933 1934 1935 193615
10
5
0
5
10
Yearly
Monthly
USA Annual Inflation Rate, 1926-1936P
erce
ntag
eC
hang
e
1999 2000 2001 2002 2003 2004 2005 2006 2007 2008 200915
10
5
0
5
10
YearlyMonthly
USA Inflation Rate, 2005-Now
Yea
rly
Per
cen
tag
eC
han
ge

Steve Keen Not Keen on Bailouts Economic Analysis & Policy
Page 5
debt and falling prices. The one positive that may stand in the way of a Depression is a governmentsector that, in contrast to 1929, is aware of the dangers of a Depression, and determined to doeverything in its power to stop it. To this end, the last US government undertook numerous bailouts,while the Obama administration is planning a fiscal stimulus of the order of US$1 trillion. In monetarypolicy, the Federal Reserve has dropped its target rate to a range between 0.25 percent and zero, and itis "printing money"—increasing base money.
Figure 5: Source: Federal Reserve (http://www.federalreserve.gov/releases/h3/hist/h3hist1.txt)
The latter in particular is breathtaking—nothing of this scale has ever been attempted before. In amere four months, Bernanke has doubled the USA's monetary base. He is clearly putting to the test hisoft-quoted belief, that "If we do fall into deflation, however, we can take comfort that the logic of theprinting press example must assert itself, and sufficient injections of money will ultimately alwaysreverse a deflation" (Bernanke 2002).6
6 This statement won him the moniker of “Helicopter Ben”, even though it was Milton Friedman who first modelledmoney creation as if it were manna dropped from a heavenly procession of helicopters.
1900 1920 1940 1960 1980 2000 20200
5 105
1 106
1.5 106
2 106
USA Money Base
US$
Mil
lion

Steve Keen Not Keen on Bailouts Economic Analysis & Policy
Page 6
Figure 6: Source: Federal Reserve (http://www.federalreserve.gov/releases/h3/hist/h3hist1.txt)
From the perspective of conventional macroeconomics—whether old Keynesian, or neoclassical"new Keynesian"—monetary actions of this scale should lead to a substantial rise in the money supply,and then in either output or prices, as the "money multiplier" weaves its magic and amplifies theamount of money in circulation relative to the quantity of goods. However, as well as having reachedthe zero bound on official interest rates—with little impact on actual lending rates—it seems thatBernanke's quantitative easing is pushing on Keynes's monetary string. The "money multipliers" havecollapsed—to the point that the Money Base now exceeds M1 (see Figure 6 and Figure 7).
1990 1992 1994 1996 1998 2000 2002 2004 2006 2008 20104
2
0
2
4
6
8
10
12
14
16
18
20
22
24
26
28
30
Money BaseM2
USA Money Supply Monthly Rate of ChangeP
erce
nt

Steve Keen Not Keen on Bailouts Economic Analysis & Policy
Page 7
Figure 7: Source: Federal Reserve (http://www.federalreserve.gov/releases/h3/hist/h3hist1.txt)
The dramatic increase in Base Money has therefore had literally no effect on the amount of moneyin circulation to date. It will only do so if, over time, banks lend additional money. However, for theconventional money multiplier analysis of credit creation to work as textbook economics argues—sothat the creation of new money would equal a stable money multiplier times the injection of basemoney—an inconceivable further increase in America's private debt levels would be required. If thepre-Crunch M2 to M0 ratio were to be restored, M2 would have to rise by 86%. If the increase in debtsimply matched the increase in M2 (the ratio of private debt to M2 was 5.5:1 prior to the crisis; seeFigure 8), private debt would rise by almost US$7 trillion. This is hardly likely in a country that is nowjustifiably obsessed with de-leveraging. It is therefore more likely that the attempt to prevent deflationvia quantitative easing will fail to cause inflation.
1960 1965 1970 1975 1980 1985 1990 1995 2000 2005 20100
1
2
3
4
5
6
7
8
9
10
11
12
13
14
15
16
M1 to M0M2 to M0M3 to M0
USA Money Multipliers: Pushing on a StringR
atio

Steve Keen Not Keen on Bailouts Economic Analysis & Policy
Page 8
Figure 8: Source: Federal Reserve Flow of Funds (http://www.federalreserve.gov/releases/z1)
Bernanke's dilemma is that he is living in a Minskian world while perceiving it through Friedmaniteeyes. Having ignored the run up of debt and the asset bubbles it financed during the long boom (in his2002 paean to Milton Friedman, Bernanke specifically criticised the 1920s Fed for its""antispeculative" policy tightening of 1928-29", Bernanke 2002A; see also Bernanke and Gertler2001), the dynamics of debt are now swamping his attempts to mount a Monetarist rescue. As financialinstitutions retreat from lending, the collapse in credit-created money will overwhelm Bernanke'sattempts to expand fiat money.
I have a related expectation for the impact of planned fiscal stimuli. The policies being undertakennow and mooted by Obama are being championed by everyone from "born again Keynesian" free-marketers to old style Keynesians. They even accord with Minsky's belief that counter-cyclicalgovernment spending and central bank "lender of last resort" actions can stabilise an unstable economy.
However, though I am proudly Minskian in my economics, I expect the bailouts to fail. Minsky, Ifear, was an optimist. The basis for this opinion is the feeling that, even though Minsky gave Ponzifinance a key role in his "Financial Instability Hypothesis", he did not foresee the extent to whichmisguided government action would rescue Ponzi financing from itself, and therefore renew it, in thename of systemic stabilisation.
So rescued by every Federal Reserve intervention since Greenspan's bailout of Wall Street in the1987 Crash, Ponzi behaviour kept adding a mass of unproductive debt—debt that simply financed assetprice speculation rather than productive investment—to the already accumulated level of debt. As aresult, the level of debt far exceeds the money supply, and debt has risen far faster than GDP. Now, asborrowers desperately attempt to reduce debt, the reduction in debt-financed spending will far outweighany government fiscal stimulus.
From this perspective, each apparent economic recovery after a debt-induced crisis was really a re-ignition of the fundamentally Ponzi lending that had caused the preceding crisis—but with a change inthe sector that took on the debt. After the 1980s speculative bubbles on Wall Street (and in commercialproperty development, with its lending to the Charles Keatings of the world), we had the DotCom
1960 1965 1970 1975 1980 1985 1990 1995 2000 2005 20100
1
2
3
4
5
6
0
10
20
30
40
50
60
Debt to M2 (LHS)Debt to M3 (LHS)Debt to Base Money (RHS)
Ratio of Private Debt to M2R
atio

Steve Keen Not Keen on Bailouts Economic Analysis & Policy
Page 9
Bubble with its lending to highly unprofitable Internet startups, followed by the Subprime Bubble andits lending to individuals with impaired credit histories.7 It is inconceivable that any other sector of theAmerican public can be enticed (or trusted) to take on more debt, and thus to cause another Ponzirecovery. After all, the only group below the now exhausted Subprimes in credit-worthiness are alreadyin gaol.
Equally, private debt has now reached such extreme levels that I do not believe the economic crisisthat its unwinding will cause can be countered by conventional fiscal and monetary measures. Toquantify this assertion, it is necessary to take a monetary perspective on the factors determiningaggregate demand, and see it as the sum of nominal GDP plus the change in debt.8 When debt is smallrelative to nominal GDP, the contribution from change in debt to demand can safely be ignored; but asdebt rises relative to GDP, the proportion of aggregate expenditure that is debt-financed can becomesubstantial. Given the relative volatility of changes in debt to the GDP, it is feasible that changes indebt levels—especially private debt—will dominate changes in economic activity.
Figure 9: Sources: RBA Statistical Bulletin Tables D02 and G12
This is evident in the negative correlation between the contribution that change in debt makes to
7 And many other financial crises in between with their own rescues, such as that of Long Term Capital Management.
8 Because both income and additional debt are spent on net asset purchases as well as commodities, this perspectiveunavoidably entangles spending on asset markets as well as on goods and services.
1955 1960 1965 1970 1975 1980 1985 1990 1995 2000 2005 20102
0
2
4
6
8
10
12
14
16
18
20 0
10
9
8
7
6
5
4
3
2
1
0
Annual Change in Private DebtUnemployment Rate (RHS, inverted)
Demand from Change in Debt vs Unemployment, Australia
Per
cent
age
Con
trib
utio
nto
Ag
greg
ate
Dem
and
Un
empl
oym
ent
Rat
e
Steve Keen Not Keen on Bailouts Economic Analysis & Policy
Page 10
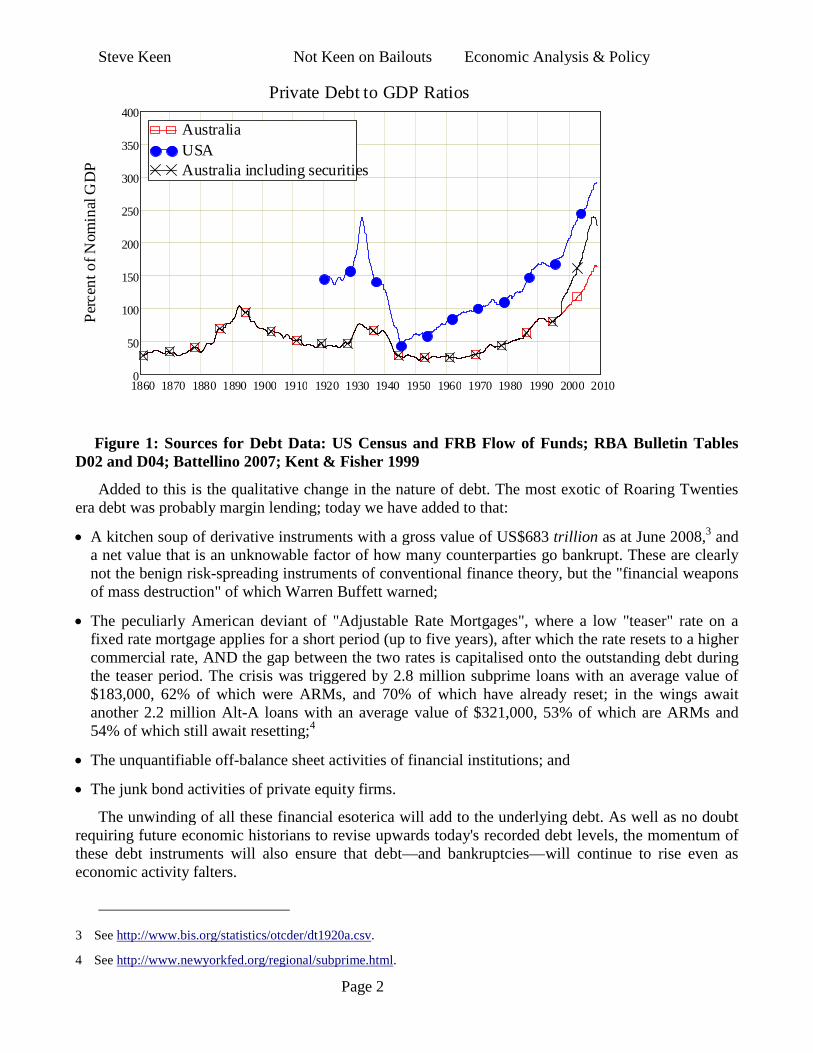
aggregate expenditure9 and the unemployment rate, which is illustrated visually in Figure 9 (theunemployment scale is inverted) and via a simple unlagged correlation coefficient in Figure 10. Thecorrelation over the entire time period is trivial and slightly positive. But as time goes on, and thechange in debt goes from contributing to just 4% of aggregate expenditure to almost 20%, thecorrelation becomes strongly negative.
Figure 10
A similar correlation is apparent in the US data (Figure 9 and Figure 11), where the growth ofprivate debt contributed to over 25% of aggregate expenditure at its peak, and where the fall in debt hasalready been marked—as has the rise in unemployment.
9 Defined as the change in debt, divided by the sum of the change in debt and nominal GDP.
1960 1965 1970 1975 1980 1985 1990 1995 2000 2005 2010100
90
80
70
60
50
40
30
20
10
0
10
20
30
40
50
60
Entire Sample PeriodTen Year Sliding Window
Correlation Unemployment & Debt Contribution to Demand, Aust.
Cor
rela
tio
nC
oef
fici
ent
(Per
cen
t)

Steve Keen Not Keen on Bailouts Economic Analysis & Policy
Page 11
Figure 11: Sources: Federal Reserve Flow of Funds and BEA NIPA(http://www.bea.gov/national/nipaweb)
The causal relation behind the correlation is the impact of de-leveraging on economic activity. Inthe USA’s case, at its peak the annual growth in private debt added US$4.7 trillion to aggregatespending, compared to an annual GDP of US$14 trillion. The immediate impact of the cessation ofprivate debt growth is thus a 25 percent reduction in aggregate spending.
If the private sector then succeeded in reducing aggregate debt levels by as little as 5 percent perannum, that would reduce aggregate spending by US$2.7 trillion in the first year.10 This far exceeds thesize of the fiscal stimulus mooted by the Obama administration.
Summarising my empirical argument, the scale of private debt in the USA means (a) that thedeleveraging process already underway in the USA will swamp government attempts to stimulatedemand; and (b) that it is highly unlikely that another “Ponzi” rescue of the American economy can beaffected via stimulating private borrowing; and (c) the collapse in credit creation will easily outweigheven Bernanke’s dramatic attempt to boost the money supply by increasing Base Money. A Depressionis therefore highly likely.
10 Without taking into account the impact of capitalised interest and bankruptcies.
1955 1960 1965 1970 1975 1980 1985 1990 1995 2000 2005 20100
5
10
15
20
25
30 0
11
10
9
8
7
6
5
4
3
2
1
0
Annual Change in Private DebtUnemployment Rate (RHS, inverted)
Demand from Change in Debt vs Unemployment, USAP
erce
nta
geC
ont
ribu
tio
nto
Ag
greg
ate
Dem
and
Un
empl
oym
ent
Rat
e

Steve Keen Not Keen on Bailouts Economic Analysis & Policy
Page 12
Figure 12
This presents a serious challenge to economic theory—even more serious than that posed by theGreat Depression, the understanding of which Bernanke once described as the “Holy Grail ofmacroeconomics” (Bernanke 1995, p.1). This is a challenge which I believe neoclassical economics hasfailed. To understand the Great Depression, and the economic crisis we are now experiencing, we needto abandon neoclassicism and turn to the alternative monetary perspective of the “Post Keynesian”school of thought.
The Financial Instability Hypothesis
There is now a substantial academic literature on Minsky's Financial Instability Hypothesis (FIH),including Minsky's own works and developments of it by a host of Post Keynesian orientedeconomists. A far from exhaustive list includes myself, Wynne Godley and Marc Lavoie, Randy Wray,Dimitri Papadimitriou, Jan Kregel, Thomas Palley, Éric Tymoigne and Mat Forstater; indicative papersinclude Keen (1995, 1999, 2000), Godley & Lavoie (2007), Wray (2007), Papadimitriou and Wray(1998), Kregel (1998), Palley (),Tymoigne (2007A and 2007B) and Forstater and Wray (2008). Forthose unfamiliar with the FIH, Keen (1995 and 2000) provides a brief verbal summary and amathematical model, and the bibliography to this paper includes a selection of web-accessible papersby Minsky and the authors noted above.
Given the space constraints of this paper, I will omit further discussion of the FIH and turn instead
1960 1965 1970 1975 1980 1985 1990 1995 2000 2005 2010100
90
80
70
60
50
40
30
20
10
0
10
20
30
40
50
60
Entire Sample PeriodTen Year Sliding Window
Correlation Unemployment & Debt Contribution to Demand, USAC
orr
elat
ion
Coe
ffic
ient
(Per
cent
)

Steve Keen Not Keen on Bailouts Economic Analysis & Policy
Page 13
to the related hypothesis in Post Keynesian economic thought, that the money supply is endogenouslydetermined, and therefore that credit plays an essential role in economic performance.
Endogenous money and financial crises
The proposition that the money supply is determined, not solely by the conventional “moneymultiplier” process, but predominantly via credit-creation decisions emanating from the interplaybetween the industrial and financial sectors of the economy, was first championed by the AmericanPost Keynesian economist Basil Moore (Moore 1979, 1983, 1988, 1989, 1994, 1995). Moore (andMinsky) argued that government money creation follows this with private credit creation with a lag, aproposition that found unexpected empirical support from Kydland and Prescott (1999).
There are thus two mechanisms for money creation, and in terms of the standard quantity of moneyand money multiplier equations, the causal sequence is reversed: increases in prices (largely but notexclusively wages) lead to increases in credit money, which subsequently force changes in eitherreserve requirements or base money. The credit money dog therefore wags the fiat money tail, incontrast to the textbook model of a credit money system under the control of reserve requirements andbase money injections.11
In one sense, this school of thought proposes that Friedman was correct that “money matters”, butwildly wrong in his mechanism of money creation. The expansions and contractions in economicactivity due to expansions and contractions in the money supply do occur, but these are due toendogenous changes in credit, rather than to the presence or absence of mythical helicopters flying overthe economy dispensing dollars as in Friedman's Optimal Quantity of Money paper. During normaltimes with an expanding economy, growth in credit fuels economic activity, while during a "credit-crunch", the level of endogenously-generated money in the economy falls, and this alone is sufficient tocause economic activity to contract.
This school of thought thus gives substance to Keynes’s contention that a credit economy isfundamentally different to a barter economy. Keynes’s argument in the General Theory relatedpredominantly to the difference between money and real wages in a monetary economy (Keynes 1936,p. 13). Modern Post Keynesians, and in particular a European group variant known as Circuit Theory,argues that the distinction between a credit economy and the intellectual fiction of a barter economy ismore fundamental still: in a credit economy, all exchanges are affected by the transfer of essentiallyvalueless tokens, whereas in a barter economy, exchanges involve the transfer of commodities ofequivalent value. The Circuitist deduction from this insight was that:
The only way to satisfy those three conditions is to have paymentsmade by means of promises of a third agent, the typical third agent beingnowadays a bank… any monetary payment must therefore be atriangular transaction, involving at least three agents, the payer, thepayee, and the bank. Real money is therefore credit money. (Graziani1989, p. 3).
This makes banks and credit money fundamental components of a market economy, not somethingthat can be tacked onto a Walrasian model of barter, and it necessitates a purely monetary model of the
11 For those unfamiliar with current monetary practice, Australia is one of six OECD nations with no reserve requirement.The USA, one of 24 that still has reserve requirements, has a zero requirement for “time deposits and savings depositsheld by entities other than individuals and households” and “Net Eurocurrency liabilities” of American financialinstitutions (O'Brien 2007, pp. 53-54).
Steve Keen Not Keen on Bailouts Economic Analysis & Policy
Page 14
economy. I have constructed such a model of a pure credit economy (Chapman and Keen 2005, Keen2008, 2009), and use it here to illustrate the basic mechanisms of endogenous credit creation, and theimpact of a “credit crunch”.12
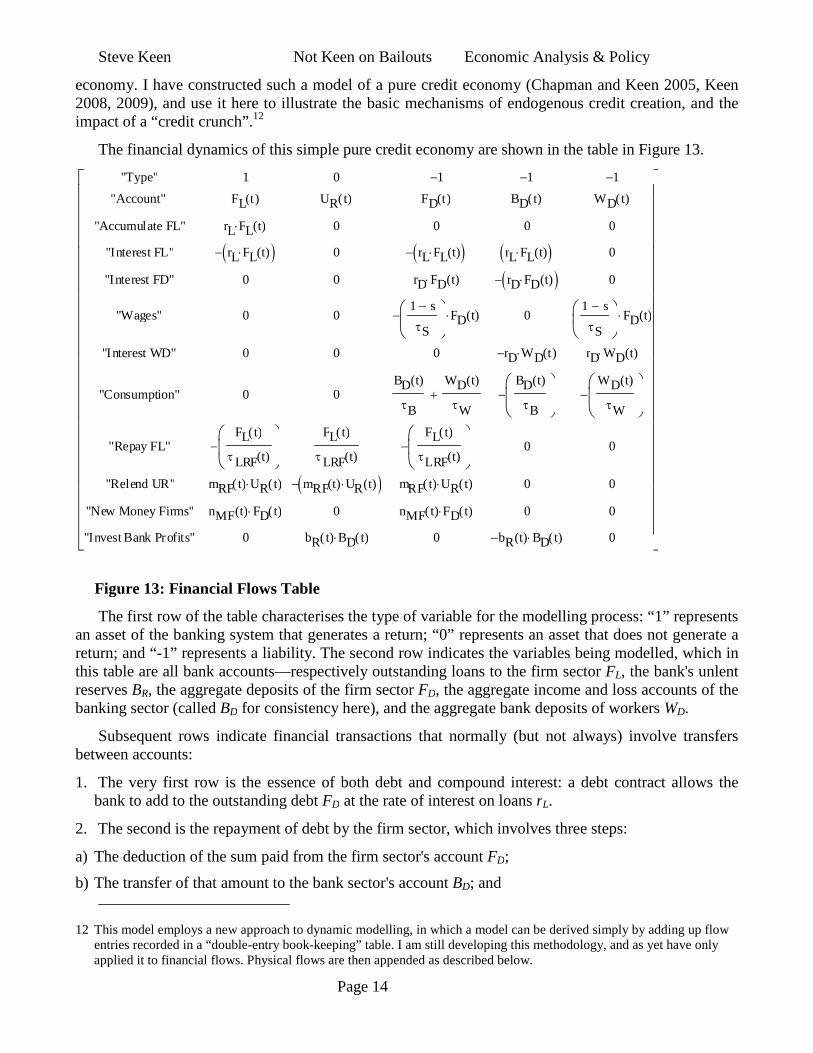
The financial dynamics of this simple pure credit economy are shown in the table in Figure 13.
Figure 13: Financial Flows Table
The first row of the table characterises the type of variable for the modelling process: “1” representsan asset of the banking system that generates a return; “0” represents an asset that does not generate areturn; and “-1” represents a liability. The second row indicates the variables being modelled, which inthis table are all bank accounts—respectively outstanding loans to the firm sector FL, the bank's unlentreserves BR, the aggregate deposits of the firm sector FD, the aggregate income and loss accounts of thebanking sector (called BD for consistency here), and the aggregate bank deposits of workers WD.
Subsequent rows indicate financial transactions that normally (but not always) involve transfersbetween accounts:
1. The very first row is the essence of both debt and compound interest: a debt contract allows thebank to add to the outstanding debt FD at the rate of interest on loans rL.
2. The second is the repayment of debt by the firm sector, which involves three steps:
a) The deduction of the sum paid from the firm sector's account FD;
b) The transfer of that amount to the bank sector's account BD; and
12 This model employs a new approach to dynamic modelling, in which a model can be derived simply by adding up flowentries recorded in a “double-entry book-keeping” table. I am still developing this methodology, and as yet have onlyapplied it to financial flows. Physical flows are then appended as described below.
"Type"
"Account"
"Accumulate FL"
"Interest FL"
"Interest FD"
"Wages"
"Interest WD"
"Consumption"
"Repay FL"
"Relend UR"
"New Money Firms"
"Invest Bank Profits"
1
FL t( )
rL FL t( )
rL FL t( )
0
0
0
0
FL t( )
LRF t( )
mRF t( ) UR t( )
nMF t( ) FD t( )
0
0
UR t( )
0
0
0
0
0
0
FL t( )
LRF t( )
mRF t( ) UR t( )
0
bR t( ) BD t( )
1
FD t( )
0
rL FL t( )
rD FD t( )
1 s
S
FD t( )
0
BD t( )
B
WD t( )
W
FL t( )
LRF t( )
mRF t( ) UR t( )
nMF t( ) FD t( )
0
1
BD t( )
0
rL FL t( ) rD FD t( )
0
rD WD t( )
BD t( )
B
0
0
0
bR t( ) BD t( )
1
WD t( )
0
0
0
1 s
S
FD t( )
rD WD t( )
WD t( )
W
0
0
0
0

Steve Keen Not Keen on Bailouts Economic Analysis & Policy
Page 15
c) The accounting acknowledgement that the payment has been received by the reduction of the recordof outstanding debt FL by the same amount;
3. The third row is interest payments at the rate rD on the outstanding bank account balance of the firmsector FD;
4. The fourth is the payment of wages. The rate of transfer here has two components: a share (1-s) inthe surplus generated by production (in Sraffa's sense rather than Marx's) where the remainder of theshare goes to firms as profit; and a rate of turnover between initial expenditure on production andsales receipts s, measured in terms of fractions of a year;
5. Interest payments on workers' deposit balances;
6. Consumption (and intermediate goods purchases) by banks and workers. These are flows fromaccounts BD and WD to FD in return for flows of good moving in the opposite direction, and occur atrates B and W respectively—where these are again time lags expressed as fractions of a year;
7. Repayment of loans at the time-variable rate LRF(t), which involve a transfer from the firm sector'saccount FD to the banking sectors unlent reserves account UR. Since this is in repayment ofoutstanding debt, the recorded level of debt also has to be reduced by the same amount that unlentreserves rise;
8. Relending of unlent reserves at the time-variable rate MRF(t), which involves a transfer of moneyfrom UR to FD, and a matching increase in the record of outstanding debt FL;
9. The creation of new credit (which occurs in practice by the expansion of lines of credit, overdraftand credit card limits) by expanding FD at the time-variable rate nMF(t); and finally
10. Investment of bank profits back into lending at the time-variable rate bR(t).13
To this model of financial flows I add a simple model of production, where output is the product ofemployed labour times labour productivity (which grows exponentially); a growing population; amoney wage set by a Phillips curve relation; and prices set by a lagged adjustment to the gap betweendemand and supply (a "neoclassical" price function, but phrased dynamically as opposed to thestandard neoclassical approach of comparative statics). The entire system is as shown in Figure 14.Parameter values and definitions are given in the Appendix.
13 This row could be dropped from the model without dramatically affecting the model's behaviour (as could row 5 forinterest payments on workers' accounts), but is included to generate the real-world result that the level of debt exceedsthe level of money (which is the sum of the deposit accounts in this model).

Steve Keen Not Keen on Bailouts Economic Analysis & Policy
Page 16
Figure 14: System equations
The figures below show simulations of the model with a “credit crunch” introduced at t=30 yearsby multipling the time-variable parameters in the model by 0.32: the firm sector's loan repaymenthorizon drops from 20 to 6.4 years, the rate of new money creation drops from 10% per annum to3.2%, and likewise for the other two time-variable parameters.14 The impact of this simulated creditcrunch on the model economy is dramatic—comparable to the impact of the Great Depression on theUS economy.
The driving force is a collapse in the amount of money circulating in the model and a corresponding
14 I could also have made consumption parameters time-variable, but restricted the variability to financial flow parametersfor the sake of simplicity.
tFL t( )d
dFD t( ) nMF t( )
FL t( )
LRF t( ) UR t( ) mRF t( )
tUR t( )
d
d
FL t( )
LRF t( )BD t( ) bR t( ) UR t( ) mRF t( )
tFD t( )
d
drD FD t( )
FL t( )
LRF t( ) rL FL t( ) FD t( ) nMF t( )
BD t( )
B UR t( ) mRF t( )
WD t( )
W
FD t( ) s 1( )
S
tBD t( )
d
drL FL t( ) rD FD t( ) rD WD t( ) BD t( ) bR t( )
BD t( )
B
tWD t( )
d
drD WD t( )
WD t( )
W
FD t( ) s 1( )
S
tP t( )
d
d
1
P P t( ) Q t( ) D t( )( )
L t( )1 s( )
S
FD t( )
W t( )
Q t( ) a t( ) L t( )( )
ta t( )
d
d a t( )
tN t( )
d
d N t( )
t( )L t( )
N t( )
tW t( )d
dPh t( )( ) W t( )
D t( )
s
SFD t( )
WD t( )
W
BD t( )
B
P t( )

Steve Keen Not Keen on Bailouts Economic Analysis & Policy
Page 17
rise in unlent reserves, as is evident in Figure 15.
Figure 15
The table in Figure 15 summarises the overall dynamics of the economy due to the credit crunch,while the subsequent figures illustrate the time paths of important system variables.15 Some of the keyoutcomes of the model that mimic the actual experience of the Great Depression are that the fall innominal debt levels does not cause a fall in the debt to GDP ratio (the first and last lines of the table);deflation is triggered by the crisis; employment falls dramatically; and substantial falls in money wagesresult in a rise in real wages, because the fall in prices more than exceeds the fall in money wages.
15 I do not contend that a credit crunch is the entire reason for the Great Depression, since the model currently omits theexcessive debt levels, the de-leveraging process and the Ponzi financing that are a major clearly part of a real-worldDepression. However the size of the “credit crunch” has been chosen so as to illustrate the potential impact of a changein financial flows on economic performance.
10 20 30 40 5010
100
1000
10000
1
10
100
1000
Firm Loan (FL)Firm Deposit (FD)
Unlent ReservesWorker WD (RHS)Bank BD (RHS)
Bank Accounts with 50% Credit Crunch
$9
Fir
mL
oan
,D
epo
sit
&U
nlen
tR
eser
ves)
$(W
orke
r&
Ban
kD
epos
its)

Steve Keen Not Keen on Bailouts Economic Analysis & Policy
Page 18
Figure 16: Summary of impact of credit crunch
Real output and employment fall substantially, as occurred during the Great Depression. Prices felltoo, again replicating the historical experience, and rather than solving the problem in a “neoclassical”way, the falling price level exacerbated the problem to some extent by undermining the attempts by thefirm sector to reduce its debt level (bearing in mind that one key parameter change was a reduction inthe firm sector’s time lag for debt repayment from 20 years to 6.4 years).
1.021.9%0.290.28Debt/Output Ratio
1.1010.1%1.100.99Real Wage
0.96-3.7%$31.82$33.05Money Wage
16.641564%24.5%1.5%Unemployment Rate
0.77-23.4%0.760.99Employment Rate
1.1110.5%443.03400.87Population
1.1110.5%2.011.82Labour Productivity
-0.60-160%-$0.86$1.43Nominal Demand Gap
0.81865-18.1349%19572.8523908.65Nominal Demand
0.81874-18.1264%19573.7023907.21Nominal Output
-0.68-168.1%-0.030.04Real Demand Gap
0.93596-6.40%673.63719.72Real Demand
0.93606-6.39%673.66719.68Real Output
0.85-15.3%334.53394.97Employment
0.87-12.5%$29.06$33.22Price Level
1.00-0.4%3.583.60Velocity of Money
0.82-17.8%$5,463$6,645Money (sum Deposits)
0.82-18.2%$410$501Worker Deposit
1.022.2%$215$210Bank Deposit
0.82-18.5%$4,839$5,934Firm Deposit
6.77577.0%$2,344$346Unlent Reserves
0.83-16.5%$5,602$6,713Firm Loan
RatioChangeValue 5 years laterValue at CrunchVariable

Steve Keen Not Keen on Bailouts Economic Analysis & Policy
Page 19
Figure 17
The unemployment rate rises dramatically, though its rise eventually stops and unemployment thenslowly falls.
Figure 18
The price level falls substantially, which, along with the fall in real output, explains the paradoxthat the debt to output ratio rises even though the nominal level of debt falls—Fisher’s Paradox.
10 20 30 40 500
500
1000
1500
100
200
300
400
500
Output
Employment
Real Output and EmploymentU
nits
Nu
mb
erof
Wor
ker
s
10 20 30 40 500
10
20
30
Unemployment Rate
Per
cen
t

Steve Keen Not Keen on Bailouts Economic Analysis & Policy
Page 20
Figure 19
A key “emergent property” of the simulation was that a substantial fall in the nominal wage hadalmost no impact on the real wage. This was unexpected but historically relevant, given Keynes’sarguments against cutting nominal wages during the Depression on precisely this basis (Keynes 1936,Chapter 19). Nominal wages fall in this model as unemployment rises—but the fall in nominal wagesbarely stops the advance of real wages, since the fall in the price level exceeds the fall in wages.
Figure 20
Figure 21 shows a transient drop in the real wage when the crisis begins, which then gives way to a
10 20 30 40 5010
15
20
25
30
35
Price Level$
per
unit
outp
ut
10 20 30 40 500
10
20
30
40
0.4
0.6
0.8
1
1.2
1.4
1.6
Wages
Mon
eyW
ages
($)
Rea
lW
ages
(Uni
tso
fO
utp
ut)

Steve Keen Not Keen on Bailouts Economic Analysis & Policy
Page 21
sustained rise in the real wage from that time on, regardless of a substantial rate of unemployment anda continuous fall in nominal wages.
Figure 21: Wage dynamics at a credit crunch—falling nominal and rising real wages
Conclusion
There are good empirical and theoretical grounds on which to expect that the proposed bailouts willfail to arrest the decline of the US and global economies into a Depression.
If so, what are the policy alternatives to bailouts, pump-priming, and the printing press? Obviouslywe have failed in the ultimate policy, to, as Minsky put it, “establish and enforce a ‘good financialsociety’ in which the tendency by businesses and bankers to engage in speculative finance isconstrained” (Minsky 1977, p. 16)—though that clearly has to be a post-GFC objective.
Recovery from the Depression the GFC will probably cause requires direct attention to the cause ofthe crisis itself—excessive private debt accumulated during a sequence of Ponzi-financed speculativebubbles.
The pillars of the American banking system in particular acted as direct descendants of CharlesPonzi,16 and they have bankrupted the American financial system as effectively as Ponzi bankruptedhimself. The system should be temporarily nationalised, and during that (potentially lengthy) interim,compelled to do what should be the main activity of finance—provide working capital for non-financialfirms.
The debt must be reduced, whether by monetary means (reflation) or outright debt moratoria. On theformer front, while I doubt the effectiveness of Bernanke’s printing press in causing inflation (andJapan’s attempt to do likewise in 2002 was a dismal failure), an effective way to cause inflation would
16 See http://en.wikipedia.org/wiki/Charles_Ponzi for an overview and Zukoff (2005) for an excellent and compellinghistory.
29.5 30 30.5 3132
32.5
33
33.5
0.98
0.99
1
1.01
Wages
Mon
eyW
ages
($)
Rea
lWag
es(U
nits
of
Ou
tpu
t)

Steve Keen Not Keen on Bailouts Economic Analysis & Policy
Page 22
be to increase money wages, with the direct objective of causing firms to increase their prices tocompensate.
The last suggestion is, of course, heresy in terms of conventional neoclassical economic theory,which brings me to the elephant in the economic living room: there are compelling reasons why thiscrisis should lead to a drastic revision in economic thought as well. It is no exaggeration to say that thenaïve faith in deregulated financial markets engendered by neoclassical economics played a large rolein the institutional changes and regulatory action (and inaction) that gave rise to this crisis. It is alsopatently obvious that neoclassically-trained economists were caught completely unawares by the crisis,despite—or rather, because of—the sophisticated mathematical forecasting models that theirpredecessors in the 1920s lacked, but which in turn lacked any appreciation of the actual financialdynamics of a credit-driven economy.
My favourite instance of this is the Panglossian confidence expressed in the global economy’s futureby the 2007 OECD Economic Outlook, which was published a mere two months before the crisis beganin earnest:
the current economic situation is in many ways better than what wehave experienced in years. Against that background, we have stuck to therebalancing scenario. Our central forecast remains indeed quite benign: asoft landing in the United States, a strong and sustained recovery inEurope, a solid trajectory in Japan and buoyant activity in China andIndia. In line with recent trends, sustained growth in OECD economieswould be underpinned by strong job creation and falling unemployment.(Cotis 2007, p. 7)
We must do better than this in future. If this crisis does turns into a Depression, then the non-monetary, equilibrium-obsessed, ahistorical practices that have come to dominate our profession mustalso be abandoned.
Appendix
Variable or Parameter Symbol Initial value Value at Crunch
Firm Loan FL 100 Dynamic
Unlent Reserves UL 100 Dynamic
Firm Deposit FD 100 Dynamic
Bank Deposit BD 30 Dynamic
Worker Deposit WD 300 Dynamic
Price Level P 20 Dynamic
Labour Force L 200 Dynamic
Output Q 200 Dynamic
Labour productivity a 1 Dynamic
Labour productivity growth rate 2% No Change
Population N 220 Dynamic

Steve Keen Not Keen on Bailouts Economic Analysis & Policy
Page 23
Population growth rate 2% No Change
Employment rate 90.9% Dynamic
Money Wages W 10 Dynamic
Demand D 100 Dynamic
Firm sector share of surplus s 45% No Change
Time lag between production and sales S ¼ year No Change
Time lag in loan repayment LRF 20 years 6.4 years
New money creation rate nM 10% 3.2%
Bank reinvestment of profits rate bR 20% 6.4%
Money relending rate mRF 100% 32%
Rate of interest on loans rL 5% No Change
Rate of interest on deposits rD 1% No Change
Banker consumption time lag B 1 year No Change
Worker consumption time lag W 2 weeks No Change
Phillips curve exponential relation(generalized exponential function fitted toPhillips’s UK 1861-1957 data)
Ph()
Bibliography
Bernanke, Ben (1995). “The Macroeconomics of the Great Depression: A Comparative Approach”,Journal of Money, Credit, and Banking, Vol. 27, pp. 1-28.
Bernanke, Ben (2002A). Remarks by Governor Ben S. Bernanke At the Conference to Honor MiltonFriedman, University of Chicago, Chicago, Illinois November 8, 2002 On Milton Friedman'sNinetieth Birthday(http://www.federalreserve.gov/boarddocs/speeches/2002/20021108/default.htm)
Bernanke, Ben (2002B). (Remarks by Governor Ben S. Bernanke Before the National EconomistsClub, Washington, D.C., November 21, 2002, "Deflation: Making Sure "It" Doesn't HappenHere; http://www.federalreserve.gov/boardDocs/speeches/2002/20021121/default.htm).
Bernanke, Ben And Gertler, Mark, (2001). "Quantitative Policy Implications Of New NormativeMacroeconomic Research: Should Central Banks Respond To Movements In Asset Prices?",AEA Papers And Proceedings, pp. 253-257.
Chapman, Brian and Keen, Steve, (2006). “Hic Rhodus, Hic Salta! Profit in a dynamic model of theMonetary Circuit”, Storia del Pensiero Economico 2-2006, pp. 139-156.
Cotis, Jean-Philippe (OECD Chief Economist) (2007). “Editorial: Achieving Further Rebalancing”OECD Economic Outlook, Volume 2007/1 No. 81, 21st May 2007, pp. 7-9.
Godley, Wynne and Lavoie, Marc, (2007). Monetary Economics: An Integrated Approach to Credit,Money, Income, Production and Wealth, Palgrave Macmillan, New York.
0.5270.949
.0091970.009197 0.009197e

Steve Keen Not Keen on Bailouts Economic Analysis & Policy
Page 24
Fisher, Chay and Kent, Christopher, (1999). Two Depressions, One Banking Collapse, Reserve Bank ofAustralia Research Discussion Papers, RDP1999-06,http://www.rba.gov.au/PublicationsAndResearch/RDP/RDP1999-06.html
Fisher Irving, (1933). "The debt-deflation theory of great depressions", Econometrica, Vol. 1, pp. 337-357.
Forstater, Mathew, and Wray, L. Randall, (eds.), (2008). Keynes for the Twenty-First Century: TheContinuing Relevance of the General Theory, Palgrave Macmillan, New York.
Friedman, Milton and Schwartz, Anna Jacobson, (1971). Monetary History of the United States, 1867-1960, Princeton University Press, Princeton.
Graziani Augusto, (1989). “The Theory of the Monetary Circuit”, Thames Papers in PoliticalEconomy, Spring, pp. 1-26. Reprinted in M. Musella and C. Panico (eds) (1995). The MoneySupply in the Economic Process, Edward Elgar, Aldershot.
Keen, Steve, (1995). “Finance and economic breakdown: modelling Minsky’s Financial InstabilityHypothesis”, Journal of Post Keynesian Economics, Vol. 17, No. 4, 607-635.
Keen, Steve, (1999). “The nonlinear dynamics of debt deflation”, Complexity International, Volume 6:http://journal-ci.csse.monash.edu.au/ci/vol06/keen/keen.html.
Keen, Steve, (2000). “The nonlinear economics of debt deflation”, in Barnett, W., Chiarella, C., Keen,S., Marks, R., Schnabl, H., (eds.), Commerce, Complexity and Evolution, Cambridge UniversityPress, 83-110.
Keen, Steve, (2008), “Keynes’s ‘revolving fund of finance’ and transactions in the Circuit”, in Wray,R., (ed.), The 60th Anniversary of Keynes’s General Theory, Edward Elgar, Aldershot.
Keen, Steve, (2009), “The non-conservation of money”, Physica A, (forthcoming).
Kregel, J. A., (1998). "Aspects of a Post Keynesian Theory of Finance", Journal of Post KeynesianEconomics, Vol. 21, pp. 111-33.
Kydland, Finn E., and Prescott, Edward C., (1999). “Business Cycles: Real Facts and a MonetaryMyth”, Federal Reserve Bank of Minneapolis Quarterly Review, Vol. 23, no. 1, pp. 25–31.
Minsky, Hyman, (1969). "Financial Model Building and Federal Reserve Policy: Discussion", Journalof Finance, May 1969, Vol. 24, iss. 2, pp. 295-97.
Minsky, Hyman, (1977). "The Financial Instability Hypothesis: An Interpretation of Keynes and anAlternative to 'Standard' Theory ", Nebraska Journal of Economics and Business, Vol. 16, pp. 5-16.
Minsky, Hyman, (1980A). "Capitalist Financial Processes and the Instability of Capitalism ", Journalof Economic Issues, Vol. 14, iss. 2, pp. 505-23.
Minsky, Hyman, (1980B). "Money, Financial Markets, and the Coherence of a Market Economy",Journal of Post Keynesian Economics, Vol. 3, pp. 21-31.
Minsky, Hyman, (1982). "Can 'It' Happen Again? A Reprise", Challenge, July-August 1982, Vol. 25,iss. 3, pp. 5-13.
Minsky, Hyman, (1985A). "Money and the Lender of Last Resort ", Challenge, March-April 1985,Vol. 28, iss. 1, pp. 12-18.
Minsky, Hyman, (1985B). "The Legacy of Keynes", Journal of Economic Education, Vol. 16, pp. 5-15.
Minsky, Hyman, (1986). "The Evolution of Financial Institutions and the Performance of theEconomy", Journal of Economic Issues, Vol. 20, pp. 345-53.
Minsky, Hyman, (1989). "Economic Implications of Extraordinary Movements in Stock Prices:Comments", Brookings Papers on Economic Activity, 1989, pp. 173-82.

Steve Keen Not Keen on Bailouts Economic Analysis & Policy
Page 25
Minsky, Hyman, (1995A). "Financial Factors in the Economics of Capitalism", Journal of FinancialServices Research, Vol. 9, pp. 197-208.
Minsky, Hyman, (1995B). "Financial Markets and Economic Instability, 1965-1980", NebraskaJournal of Economics and Business, Vol. 20, pp. 5-16.
Minsky, Hyman, (1995C). "Longer Waves in Financial Relations: Financial Factors in the More SevereDepressions II", Journal of Economic IssuesVol. 29, pp. 83-96.
Minsky, Hyman, (1998). "Back from the Brink", Challenge, January-February 1988, Vol. 31, pp. 22-28.
Moore, Basil J., (1979). "The Endogenous Money Stock", Journal of Post Keynesian Economics, Fall1979, Vol. 2, pp. 49-70.
Moore, Basil J., (1983). "Unpacking the Post Keynesian Black Box: Bank Lending and the MoneySupply", Journal of Post Keynesian Economics, Vol. 5, pp. 537-56.
Moore, Basil J., (1988). "Unpacking the Post-Keynesian Black Box: Wages, Bank Lending and theMoney Supply", in Arestis, Philip, (ed.), Post-Keynesian monetary economics: New approachesto financial modelling, Edward Elgar, Aldershot, pp. 122-51.
Moore, Basil J., (1989). "A Simple Model of Bank Intermediation", Journal of Post KeynesianEconomics, Vol. 12, pp. 10-28.
Moore, Basil J., (1994). "The Demise of the Keynesian Multiplier: A Reply to Cottrell", Journal ofPost Keynesian Economics, Fall 1994, Vol. 17, pp. 121-33.
Moore, Basil J., (1995). "Unpacking the Post Keynesian Black Box: Bank Lending and the MoneySupply", in Musella, Marco, and Panico, Carlo, (eds.), The money supply in the economicprocess: A post Keynesian perspective, Edward Elgar, Aldershot, pp. 365-84.
O'Brien, Yueh-Yun C. (2007). “Reserve requirement systems in OECD countries”, Board of Governorsof the Federal Reserve System (U.S.), Finance and Economics Discussion Series: 2007-54.
Palley, Thomas I., (2008). "Keynesian Models of Deflation and Depression Revisited", Journal ofEconomic Behavior and Organization, Vol. 68, pp. 167-77.
Papadimitriou, Dimitri B.; Wray, L. Randall, (1998). "The Economic Contributions of Hyman Minsky:Varieties of Capitalism and Institutional Reform", Review of Political Economy, Vol. 10, pp.199-225.
Tymoigne, Eric, (2007A). "A Hard-Nosed Look at Worsening U.S. Household Finance", Challenge,Vol. 50, iss. 4, pp. 88-111.
Tymoigne, Eric, (2007B). "Improving Financial Stability: Uncertainty versus Imperfection", Journal ofEconomic Issues, Vol. 41, pp. 503-10.
Tymoigne, Eric; Wray, L. Randall, (2006). "Money: An Alternative Story", in Arestis, Philip andSawyer, Malcolm, (eds.), A Handbook of Alternative Monetary Economics, Edward ElgarPublishers, Cheltenham, pp. 1-16.
Wray, L. Randall, (2007). "A Post Keynesian View of Central Bank Independence, Policy Targets, andthe Rules versus Discretion Debate", Journal of Post Keynesian Economics, Vol. 30, pp. 119-41.
Zuckoff, Mitchell (2005). Ponzi's Scheme: The True Story of a Financial Legend. Random House: NewYork.