Embed Size (px)
Citation preview
Backward-mode multiwavelength photoacoustic scannerusing a planar Fabry–Perot polymer film ultrasound
sensor for high-resolution three-dimensional imaging ofbiological tissues
Edward Zhang,* Jan Laufer, and Paul BeardDepartment of Medical Physics and Bioengineering, University College London, Gower Street, London WC1E 6BT, UK
*Corresponding author: [email protected]
Received 21 June 2007; revised 25 September 2007; accepted 5 October 2007;posted 10 October 2007 (Doc. ID 84398); published 25 January 2008
A multiwavelength backward-mode planar photoacoustic scanner for 3D imaging of soft tissues to depthsof several millimeters with a spatial resolution in the tens to hundreds of micrometers range is described.The system comprises a tunable optical parametric oscillator laser system that provides nanosecond laserpulses between 600 and 1200 nm for generating the photoacoustic signals and an optical ultrasoundmapping system based upon a Fabry–Perot polymer film sensor for detecting them. The system enablesphotoacoustic signals to be mapped in 2D over a 50 mm diameter aperture in steps of 10 �m with anoptically defined element size of 64 �m. Two sensors were used, one with a 22 �m thick polymer filmspacer and the other with a 38 �m thick spacer providing �3 dB acoustic bandwidths of 39 and 22 MHz,respectively. The measured noise equivalent pressure of the 38 �m sensor was 0.21 kPa over a 20 MHzmeasurement bandwidth. The instrument line-spread function (LSF) was measured as a function ofposition and the minimum lateral and vertical LSFs found to be 38 and 15 �m, respectively. To demon-strate the ability of the system to provide high-resolution 3D images, a range of absorbing objects wereimaged. Among these was a blood vessel phantom that comprised a network of blood filled tubes ofdiameters ranging from 62 to 300 �m immersed in an optically scattering liquid. In addition, to demon-strate the applicability of the system to spectroscopic imaging, a phantom comprising tubes filled withdyes of different spectral characteristics was imaged at a range of wavelengths. It is considered that thistype of instrument may provide a practicable alternative to piezoelectric-based photoacoustic systems forhigh-resolution structural and functional imaging of the skin microvasculature and other superficialstructures. © 2008 Optical Society of America
OCIS codes: 110.5125, 170.3880, 170.5120, 110.7170, 170.1460.
1. Introduction
Photoacoustic imaging is a noninvasive imaging mo-dality for visualizing the structure and function ofsoft tissues [1]. It relies upon irradiating the tissuesurface with low energy nanosecond pulses of visible,or more deeply penetrating near-infrared (NIR) laserlight. Absorption of the light by subsurface anatom-ical features such as blood vessels leads to impulsiveheating accompanied by rapid thermoelastic expan-sion and the subsequent generation of broadband
(tens of megahertz) ultrasonic pulses. The latterpropagate to the surface where they are detected atmultiple points using either an array of ultrasoundtransducers or a mechanically scanned single ele-ment receiver. By measuring the time of arrival of theacoustic pulses over the tissue surface and, knowingthe speed of sound, the acoustic signals can be back-projected in 3D to reconstruct a volumetric image ofthe internally absorbed optical energy distribution.The fundamental advantage of the technique is thatit combines the strong contrast and spectroscopic-based specificity of optical techniques with the highspatial resolution of ultrasound—in particular itavoids the spatial resolution limitations of purely
0003-6935/08/040561-17$15.00/0© 2008 Optical Society of America
1 February 2008 � Vol. 47, No. 4 � APPLIED OPTICS 561
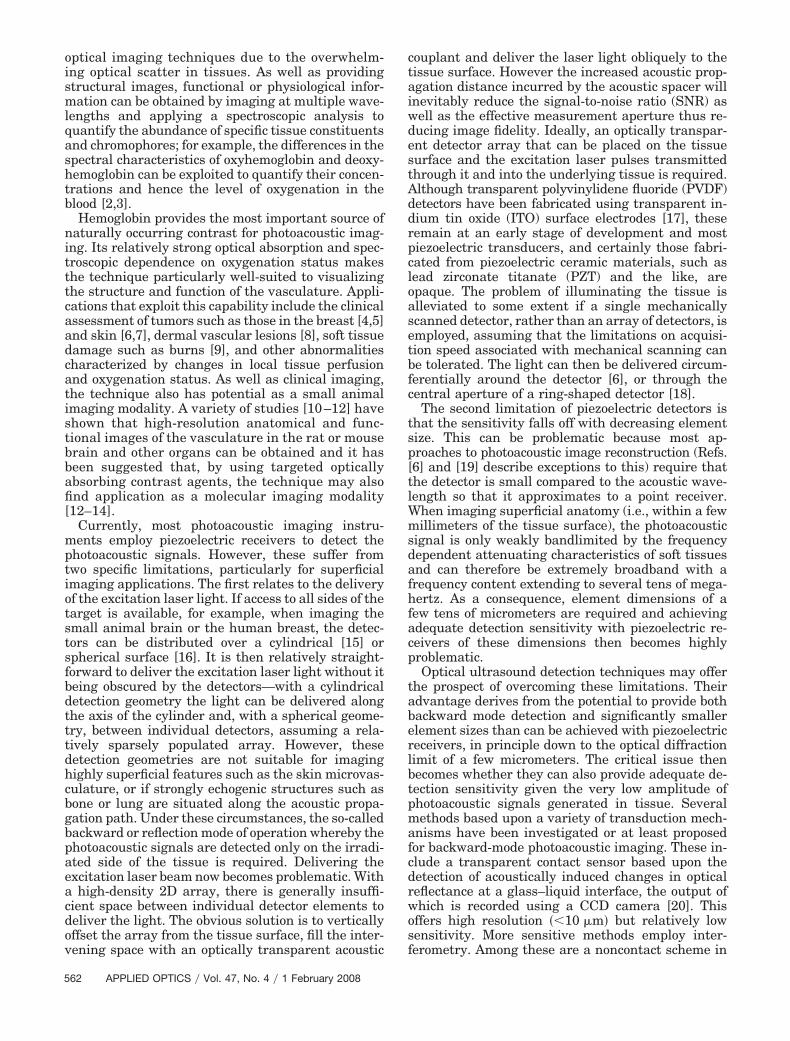
optical imaging techniques due to the overwhelm-ing optical scatter in tissues. As well as providingstructural images, functional or physiological infor-mation can be obtained by imaging at multiple wave-lengths and applying a spectroscopic analysis toquantify the abundance of specific tissue constituentsand chromophores; for example, the differences in thespectral characteristics of oxyhemoglobin and deoxy-hemoglobin can be exploited to quantify their concen-trations and hence the level of oxygenation in theblood [2,3].
Hemoglobin provides the most important source ofnaturally occurring contrast for photoacoustic imag-ing. Its relatively strong optical absorption and spec-troscopic dependence on oxygenation status makesthe technique particularly well-suited to visualizingthe structure and function of the vasculature. Appli-cations that exploit this capability include the clinicalassessment of tumors such as those in the breast [4,5]and skin [6,7], dermal vascular lesions [8], soft tissuedamage such as burns [9], and other abnormalitiescharacterized by changes in local tissue perfusionand oxygenation status. As well as clinical imaging,the technique also has potential as a small animalimaging modality. A variety of studies [10–12] haveshown that high-resolution anatomical and func-tional images of the vasculature in the rat or mousebrain and other organs can be obtained and it hasbeen suggested that, by using targeted opticallyabsorbing contrast agents, the technique may alsofind application as a molecular imaging modality[12–14].
Currently, most photoacoustic imaging instru-ments employ piezoelectric receivers to detect thephotoacoustic signals. However, these suffer fromtwo specific limitations, particularly for superficialimaging applications. The first relates to the deliveryof the excitation laser light. If access to all sides of thetarget is available, for example, when imaging thesmall animal brain or the human breast, the detec-tors can be distributed over a cylindrical [15] orspherical surface [16]. It is then relatively straight-forward to deliver the excitation laser light without itbeing obscured by the detectors—with a cylindricaldetection geometry the light can be delivered alongthe axis of the cylinder and, with a spherical geome-try, between individual detectors, assuming a rela-tively sparsely populated array. However, thesedetection geometries are not suitable for imaginghighly superficial features such as the skin microvas-culature, or if strongly echogenic structures such asbone or lung are situated along the acoustic propa-gation path. Under these circumstances, the so-calledbackward or reflection mode of operation whereby thephotoacoustic signals are detected only on the irradi-ated side of the tissue is required. Delivering theexcitation laser beam now becomes problematic. Witha high-density 2D array, there is generally insuffi-cient space between individual detector elements todeliver the light. The obvious solution is to verticallyoffset the array from the tissue surface, fill the inter-vening space with an optically transparent acoustic
couplant and deliver the laser light obliquely to thetissue surface. However the increased acoustic prop-agation distance incurred by the acoustic spacer willinevitably reduce the signal-to-noise ratio (SNR) aswell as the effective measurement aperture thus re-ducing image fidelity. Ideally, an optically transpar-ent detector array that can be placed on the tissuesurface and the excitation laser pulses transmittedthrough it and into the underlying tissue is required.Although transparent polyvinylidene fluoride (PVDF)detectors have been fabricated using transparent in-dium tin oxide (ITO) surface electrodes [17], theseremain at an early stage of development and mostpiezoelectric transducers, and certainly those fabri-cated from piezoelectric ceramic materials, such aslead zirconate titanate (PZT) and the like, areopaque. The problem of illuminating the tissue isalleviated to some extent if a single mechanicallyscanned detector, rather than an array of detectors, isemployed, assuming that the limitations on acquisi-tion speed associated with mechanical scanning canbe tolerated. The light can then be delivered circum-ferentially around the detector [6], or through thecentral aperture of a ring-shaped detector [18].
The second limitation of piezoelectric detectors isthat the sensitivity falls off with decreasing elementsize. This can be problematic because most ap-proaches to photoacoustic image reconstruction (Refs.[6] and [19] describe exceptions to this) require thatthe detector is small compared to the acoustic wave-length so that it approximates to a point receiver.When imaging superficial anatomy (i.e., within a fewmillimeters of the tissue surface), the photoacousticsignal is only weakly bandlimited by the frequencydependent attenuating characteristics of soft tissuesand can therefore be extremely broadband with afrequency content extending to several tens of mega-hertz. As a consequence, element dimensions of afew tens of micrometers are required and achievingadequate detection sensitivity with piezoelectric re-ceivers of these dimensions then becomes highlyproblematic.
Optical ultrasound detection techniques may offerthe prospect of overcoming these limitations. Theiradvantage derives from the potential to provide bothbackward mode detection and significantly smallerelement sizes than can be achieved with piezoelectricreceivers, in principle down to the optical diffractionlimit of a few micrometers. The critical issue thenbecomes whether they can also provide adequate de-tection sensitivity given the very low amplitude ofphotoacoustic signals generated in tissue. Severalmethods based upon a variety of transduction mech-anisms have been investigated or at least proposedfor backward-mode photoacoustic imaging. These in-clude a transparent contact sensor based upon thedetection of acoustically induced changes in opticalreflectance at a glass–liquid interface, the output ofwhich is recorded using a CCD camera [20]. Thisoffers high resolution ��10 �m� but relatively lowsensitivity. More sensitive methods employ inter-ferometry. Among these are a noncontact scheme in
562 APPLIED OPTICS � Vol. 47, No. 4 � 1 February 2008
which a focused laser beam is scanned across thetissue surface and acoustically induced displace-ments recovered from the phase shifted reflectedlight using a remote Mach–Zehnder receiving inter-ferometer [21]. A similar approach, in which a remoteconfocal Fabry–Perot interferometer (FPI) is used tomeasure displacements across the surface of a pelli-cle, has also been described [22].
A promising category of interferometric techniquesis based upon the detection of acoustically inducedchanges in the optical thickness of a solid planarFPI—the latter being fabricated by sandwiching adielectric [23] or polymer spacer [24–27] between apair of mirrors formed by the deposition of opticallyreflective coatings. It has been shown that, when us-ing a polymer film as the spacer, this type of sensorcan provide broadband frequency responses of theorder of several tens of megahertz [25], optically de-fined element sizes of a few tens of micrometers and,most critically, high sensitivity, comparable to that ofbroadband piezoelectric receivers [28,29]. Further-more, by using dichroic dielectric coatings to form theFPI mirrors, the sensor can be made transparentfor backward-mode detection [30]. These attributesmake this type of sensor well-suited to photoacousticdetection and it has now been implemented in avariety of guises. An early prototype system em-ployed a large area laser beam to illuminate the sen-sor, an angle-tuned scheme to set the phase bias, anda mechanically scanned photodiode to map the sensoroutput [31]. This was used to obtain 3D photoacousticimages of a realistic blood vessel phantom andshowed that the instrument could provide millimeterpenetration depths with spatial resolutions of the or-der of a few hundred micrometers [32]. Despite dem-onstrating the underlying feasibility of the concept,inertial limitations associated with mechanical scan-ning meant that image acquisition time was too longfor practical biomedical applications. To overcomethis, an alternative sensor readout scheme was sub-sequently developed [33]. This employed a single fo-cused laser beam that was optically scanned acrossthe surface of the sensor using a high-speedgalvanometer-based scanner and the phase bias setby tuning the wavelength of the sensor interrogationlaser, an 850 nm vertical-cavity surface-emitting la-ser (VCSEL). The system was evaluated by mappingthe output of various ultrasound transducers in 1Dand demonstrated that this type of sensor readoutscheme could, in principle, provide the necessary ac-quisition speed for practical in vivo photoacoustic im-aging.
In this paper, we describe an instrument based onthe latter approach but incorporating several keytechnical developments and evaluated specifically forthe purpose of photoacoustic imaging. These develop-ments include the addition of a second galvanometerso that the sensor output can be mapped in 2D andthe use of a new sensor design in which the FPImirrors are transparent over an extended range inthe near infrared �600–1200 nm�. The latter enables
the system to operate in backward mode over thewavelength range that tissue is relatively transpar-ent. In addition, a 1550 nm C–L band external cavitylaser is now used as the sensor interrogation laserresulting in a significant increase in detection sensi-tivity due to its low noise characteristics and highoutput power. As well as these developments, thesystem has been evaluated extensively by imagingvarious tissue mimicking phantoms. The underlyingfeasibility of the concept has been reported in a pre-liminary account [34,35]. In the current paper a de-tailed description of the operating principles of theinstrument, its performance, and application to high-resolution biomedical photoacoustic imaging is pro-vided. Subsections 2.B and 2.C describe the Fabry–Perot (FP) sensor head and the sensor readoutscheme, respectively. Subsection 2.D describes theperformance of the system in terms of the spatialscan parameters, acquisition time, and the acousticperformance. In Subsection 3.A, measurements of theline-spread function (LSF) of the instrument are dis-cussed and in Subsection 3.B images of a range oftissue mimicking phantoms are presented.
2. Backward-Mode Photoacoustic Scanner
A. Overview
The principles of operation of the scanner are as fol-lows. A tunable excitation laser system providesnanosecond visible or NIR optical pulses for generat-ing the photoacoustic waves. The latter are detectedover the surface of the tissue using a 2D optical ul-trasound field mapping system, the acoustically sen-sitive element of which is a planar FP polymer filmsensing interferometer (FPI). A key feature of thesystem is that it operates in backward mode. This ismade possible by designing the mirrors of the FPI tobe transparent to the excitation laser wavelength buthighly reflective at others. This allows the sensorhead to be placed in acoustic contact with the tissuesurface and the excitation laser pulses transmittedthrough it and into the underlying tissue. The result-ing photoacoustic waves propagate back to the sur-face where they modulate the optical thickness of theFPI and hence its reflectivity. By scanning a cw fo-cused laser beam (at a wavelength at which the FPImirrors are highly reflective) across the surface of thesensor and recording the time-varying reflected opti-cal power modulation at each point of the scan, thespatial-temporal distribution of the incident photo-acoustic waves can be mapped in 2D. The detectedphotoacoustic signals are then input to a k-spaceacoustic backpropagation algorithm in order to recon-struct a 3D image of the initial pressure distribution:the photoacoustic image.
In Subsections 2.B–2.D, a detailed description ofthe scanner hardware, operating principles, and per-formance is provided. The design and fabrication ofthe FP sensor is detailed in Subsection 2.B. The op-tical scanning system and interrogation scheme re-quired to map the sensor output are described inSubsection 2.C while the performance of the system
1 February 2008 � Vol. 47, No. 4 � APPLIED OPTICS 563
in terms of the spatial scan parameters, acquisitionspeed, and acoustic performance are outlined in Sub-section 2.D. An overview of the image reconstructionalgorithm is provided in Subsection 2.E.
B. Fabry–Perot Sensor Head: Design and Fabrication
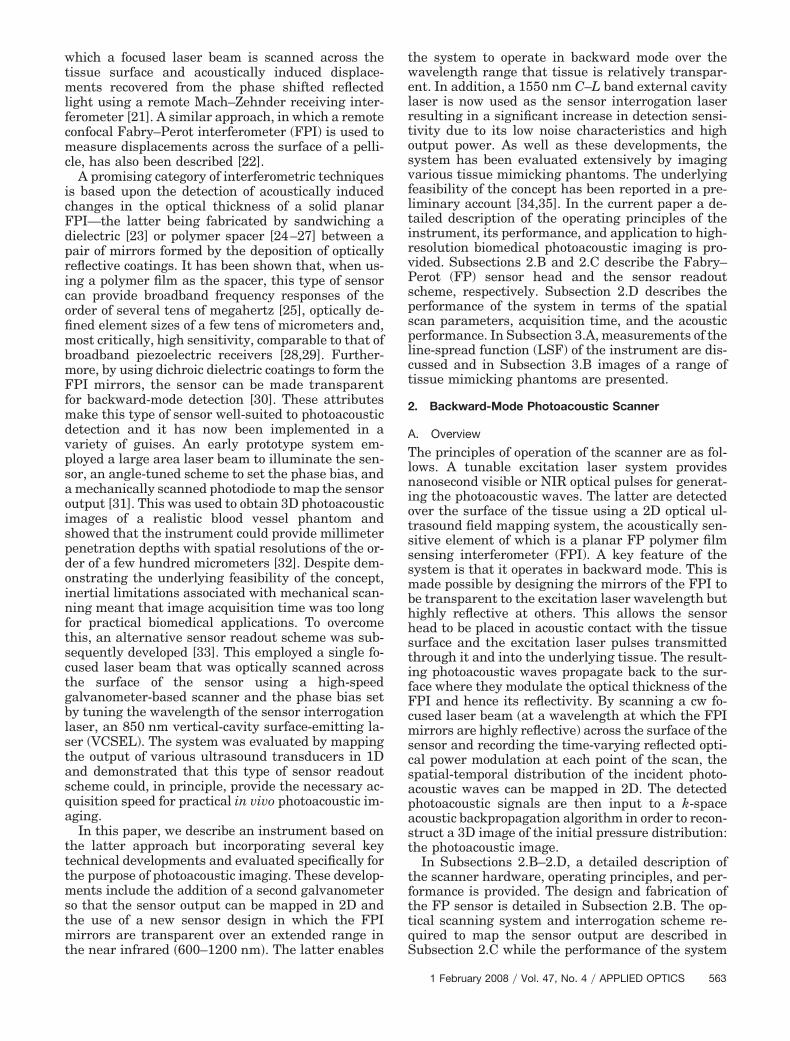
The FP sensor head design and the method of fabri-cation are broadly similar to that described previ-ously [30], the principal difference being that thespectral band over which the FPI mirrors arehighly transmissive has been shifted from 1050–1400nm to 590–1200 nm. This offers two advantages.First, the FPI mirrors now exhibit high transmit-tance over a wavelength range that coincides with theso-called NIR window (600–1000 nm) for biologicaltissues. This allows the sensor head to be transpar-ent, and therefore operate in backward mode, overthis important wavelength range. Second, it allowsthe sensor interrogation wavelength, at which themirrors are required to be highly reflective, to beshifted from 850 to �1550 nm. This enables the rel-atively inexpensive, widely tunable, and robust C–L�1516–1610 nm� band lasers originally developed foroptical telecommunications applications to be used asthe sensor interrogation laser source.
A schematic of the sensor head is shown in Fig.1. It comprises a wedged polymethylmethacrylate(PMMA) backing stub onto which a thin polymer(Parylene C) film spacer sandwiched between twodielectric dichroic mirrors is deposited in order toform the FPI. The fabrication procedure comprisesthe following four steps.
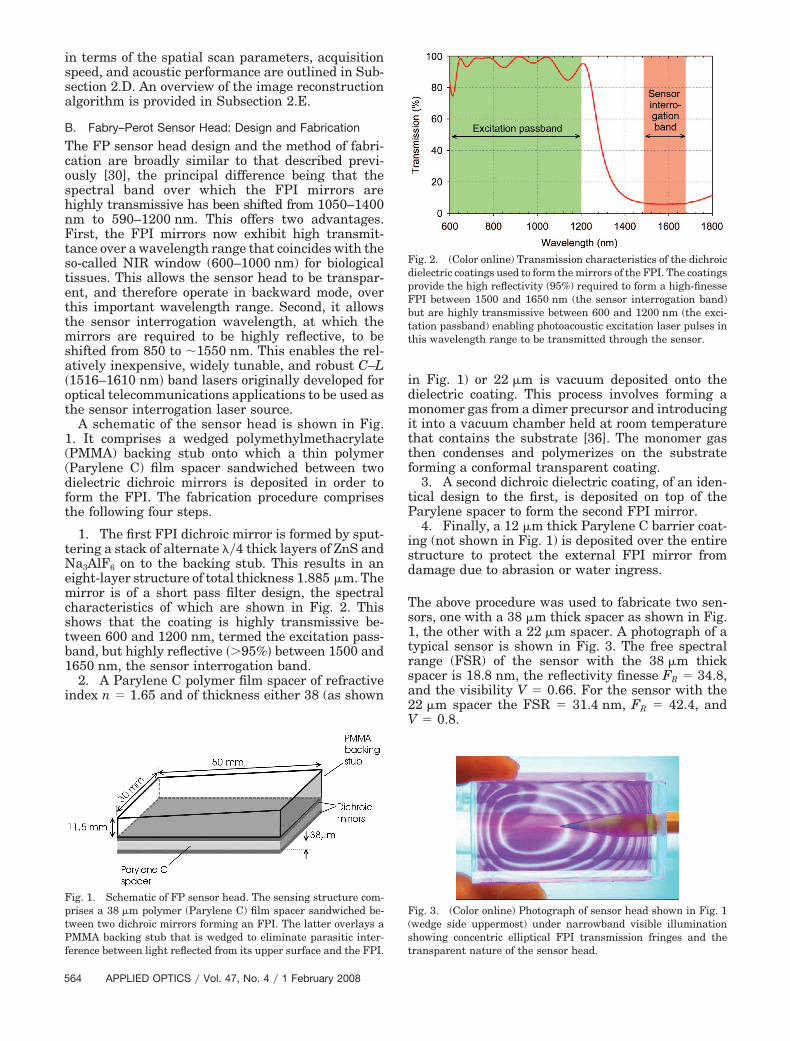
1. The first FPI dichroic mirror is formed by sput-tering a stack of alternate ��4 thick layers of ZnS andNa3AlF6 on to the backing stub. This results in aneight-layer structure of total thickness 1.885 �m. Themirror is of a short pass filter design, the spectralcharacteristics of which are shown in Fig. 2. Thisshows that the coating is highly transmissive be-tween 600 and 1200 nm, termed the excitation pass-band, but highly reflective ��95%� between 1500 and1650 nm, the sensor interrogation band.
2. A Parylene C polymer film spacer of refractiveindex n � 1.65 and of thickness either 38 (as shown
in Fig. 1) or 22 �m is vacuum deposited onto thedielectric coating. This process involves forming amonomer gas from a dimer precursor and introducingit into a vacuum chamber held at room temperaturethat contains the substrate [36]. The monomer gasthen condenses and polymerizes on the substrateforming a conformal transparent coating.
3. A second dichroic dielectric coating, of an iden-tical design to the first, is deposited on top of theParylene spacer to form the second FPI mirror.
4. Finally, a 12 �m thick Parylene C barrier coat-ing (not shown in Fig. 1) is deposited over the entirestructure to protect the external FPI mirror fromdamage due to abrasion or water ingress.
The above procedure was used to fabricate two sen-sors, one with a 38 �m thick spacer as shown in Fig.1, the other with a 22 �m spacer. A photograph of atypical sensor is shown in Fig. 3. The free spectralrange (FSR) of the sensor with the 38 �m thickspacer is 18.8 nm, the reflectivity finesse FR � 34.8,and the visibility V � 0.66. For the sensor with the22 �m spacer the FSR � 31.4 nm, FR � 42.4, andV � 0.8.
Fig. 1. Schematic of FP sensor head. The sensing structure com-prises a 38 �m polymer (Parylene C) film spacer sandwiched be-tween two dichroic mirrors forming an FPI. The latter overlays aPMMA backing stub that is wedged to eliminate parasitic inter-ference between light reflected from its upper surface and the FPI.
Fig. 2. (Color online) Transmission characteristics of the dichroicdielectric coatings used to form the mirrors of the FPI. The coatingsprovide the high reflectivity (95%) required to form a high-finesseFPI between 1500 and 1650 nm (the sensor interrogation band)but are highly transmissive between 600 and 1200 nm (the exci-tation passband) enabling photoacoustic excitation laser pulses inthis wavelength range to be transmitted through the sensor.
Fig. 3. (Color online) Photograph of sensor head shown in Fig. 1(wedge side uppermost) under narrowband visible illuminationshowing concentric elliptical FPI transmission fringes and thetransparent nature of the sensor head.
564 APPLIED OPTICS � Vol. 47, No. 4 � 1 February 2008
There are several advantages of the fabricationprocess outlined above. The use of a gas phase depo-sition process to form the polymer film spacer pro-vides a highly conformal coating with excellentsurface finish and uniformity of thickness (�5 nmover an area of 1 cm2). These attributes enable ahigh-quality FPI with good fringe visibility and fi-nesse to be produced. The thickness can also be pre-cisely controlled ��0.1 �m� to design sensors withspecific FSRs and acoustic bandwidths. Furthermore,the use of all vacuum deposition methods allows forthe inexpensive batch fabrication of large quantitiesof sensors with high repeatability.
C. System Design and Operating Principles
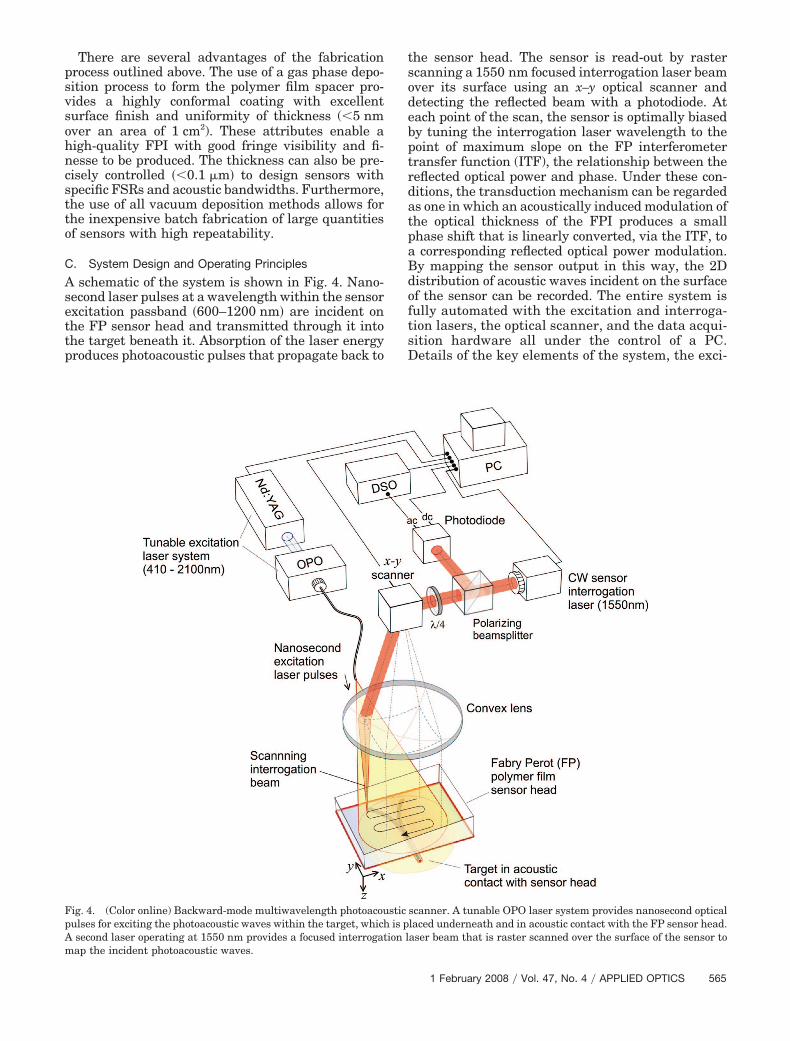
A schematic of the system is shown in Fig. 4. Nano-second laser pulses at a wavelength within the sensorexcitation passband �600–1200 nm� are incident onthe FP sensor head and transmitted through it intothe target beneath it. Absorption of the laser energyproduces photoacoustic pulses that propagate back to
the sensor head. The sensor is read-out by rasterscanning a 1550 nm focused interrogation laser beamover its surface using an x–y optical scanner anddetecting the reflected beam with a photodiode. Ateach point of the scan, the sensor is optimally biasedby tuning the interrogation laser wavelength to thepoint of maximum slope on the FP interferometertransfer function (ITF), the relationship between thereflected optical power and phase. Under these con-ditions, the transduction mechanism can be regardedas one in which an acoustically induced modulation ofthe optical thickness of the FPI produces a smallphase shift that is linearly converted, via the ITF, toa corresponding reflected optical power modulation.By mapping the sensor output in this way, the 2Ddistribution of acoustic waves incident on the surfaceof the sensor can be recorded. The entire system isfully automated with the excitation and interroga-tion lasers, the optical scanner, and the data acqui-sition hardware all under the control of a PC.Details of the key elements of the system, the exci-
Fig. 4. (Color online) Backward-mode multiwavelength photoacoustic scanner. A tunable OPO laser system provides nanosecond opticalpulses for exciting the photoacoustic waves within the target, which is placed underneath and in acoustic contact with the FP sensor head.A second laser operating at 1550 nm provides a focused interrogation laser beam that is raster scanned over the surface of the sensor tomap the incident photoacoustic waves.
1 February 2008 � Vol. 47, No. 4 � APPLIED OPTICS 565
tation source, the optical scanning system, phasebias control scheme, and the data acquisition sys-tem are provided below.
1. Excitation SourceOne of two fiber-coupled excitation sources was avail-able to generate the photoacoustic signals. The first(shown in Fig. 4) was a type I optical parametricoscillator (OPO)(GWU VisIR) pumped by the 355 nmfrequency tripled output of a Q-switched Nd:YAG la-ser (Spectra-Physics, Quanta Ray LAB170). This sys-tem is capable of providing 8 ns optical pulses overthe wavelength range 410–2100 nm with end-of-fiberpulse energies in the range 12–36 mJ (depending onwavelength) at a pulse repetition frequency (PRF)of 10 Hz. The second excitation source was a Q-switched Nd:YAG laser (Big Sky, Ultra) operating at1064 nm. This provided a shorter pulse duration of5.6 ns and a higher pulse energy and PRF of 45 mJand 20 Hz, respectively.
2. Scanning SystemA 10 mW fiber-coupled tunable cw external cavitylaser (Thorlabs ECL5000DT) operating at a nominalwavelength of 1550 nm was used to provide the sen-sor interrogation beam. The beam was focused usinga lens onto the surface of the sensor at normal inci-dence and optically scanned across it using an x–yscanner comprising a pair of mutually orthogonalclosed loop galvanometer mirrors; in essence a 2Dversion of the scanner described in [33]. The beamreflected from the sensor is directed via a polarizingbeam splitter onto a 50 MHz InGaS photodiode–transimpedance amplifier configuration with dc- andac-coupled outputs. The dc-coupled output is con-nected to a 200 Ks�s 16-bit analog-to-digital (A�D)card within the PC and used to record the ITF asrequired for the phase bias control procedure de-scribed in Subsection 2.C.3. The ac-coupled output(�3 dB cutoff frequency: 100 kHz) is connected to a300 MHz digitizing oscilloscope (DSO) and used torecord the time-varying reflected optical power mod-ulation produced by the incident acoustic wave. Thereason the photodiode output is ac coupled is to re-move the large dc optical component reflected fromthe sensor and low-frequency fluctuations in the out-put power of the interrogation laser. Once the photo-acoustic signal has been acquired by the DSO it isdownloaded to the PC via an IEEE 488 general pur-pose interface bus (GPIB).
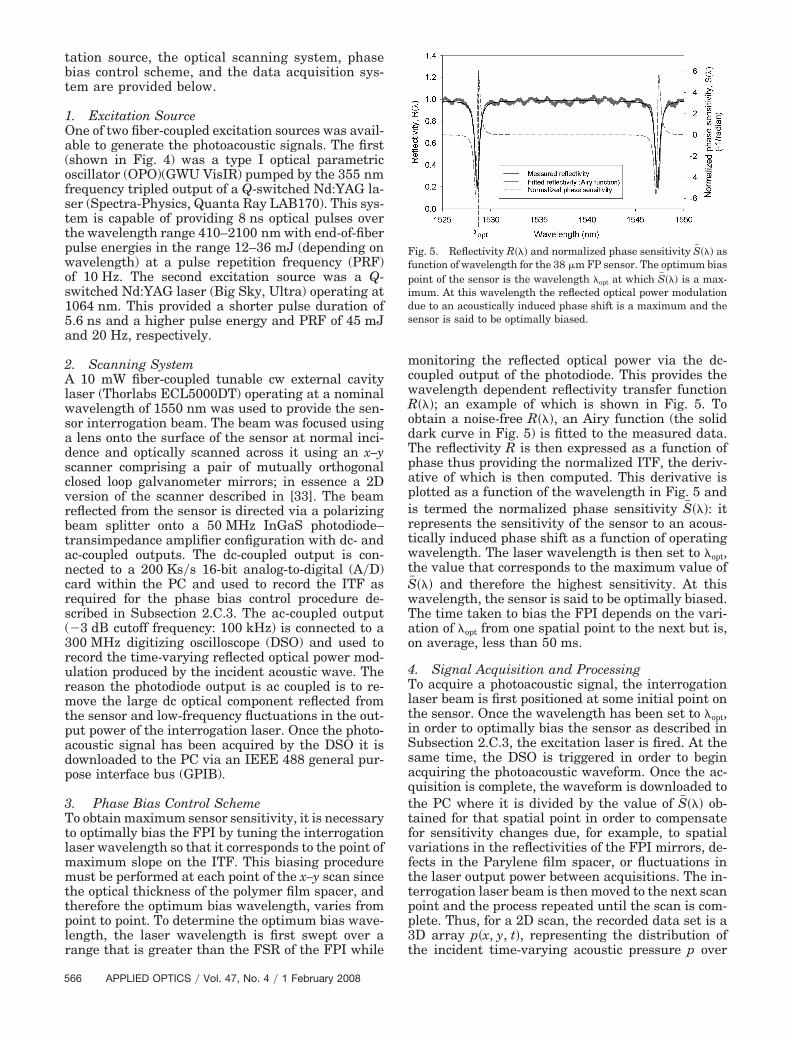
3. Phase Bias Control SchemeTo obtain maximum sensor sensitivity, it is necessaryto optimally bias the FPI by tuning the interrogationlaser wavelength so that it corresponds to the point ofmaximum slope on the ITF. This biasing proceduremust be performed at each point of the x–y scan sincethe optical thickness of the polymer film spacer, andtherefore the optimum bias wavelength, varies frompoint to point. To determine the optimum bias wave-length, the laser wavelength is first swept over arange that is greater than the FSR of the FPI while
monitoring the reflected optical power via the dc-coupled output of the photodiode. This provides thewavelength dependent reflectivity transfer functionR���; an example of which is shown in Fig. 5. Toobtain a noise-free R���, an Airy function (the soliddark curve in Fig. 5) is fitted to the measured data.The reflectivity R is then expressed as a function ofphase thus providing the normalized ITF, the deriv-ative of which is then computed. This derivative isplotted as a function of the wavelength in Fig. 5 andis termed the normalized phase sensitivity S� ���: itrepresents the sensitivity of the sensor to an acous-tically induced phase shift as a function of operatingwavelength. The laser wavelength is then set to �opt,the value that corresponds to the maximum value ofS� ��� and therefore the highest sensitivity. At thiswavelength, the sensor is said to be optimally biased.The time taken to bias the FPI depends on the vari-ation of �opt from one spatial point to the next but is,on average, less than 50 ms.
4. Signal Acquisition and ProcessingTo acquire a photoacoustic signal, the interrogationlaser beam is first positioned at some initial point onthe sensor. Once the wavelength has been set to �opt,in order to optimally bias the sensor as described inSubsection 2.C.3, the excitation laser is fired. At thesame time, the DSO is triggered in order to beginacquiring the photoacoustic waveform. Once the ac-quisition is complete, the waveform is downloaded tothe PC where it is divided by the value of S� ��� ob-tained for that spatial point in order to compensatefor sensitivity changes due, for example, to spatialvariations in the reflectivities of the FPI mirrors, de-fects in the Parylene film spacer, or fluctuations inthe laser output power between acquisitions. The in-terrogation laser beam is then moved to the next scanpoint and the process repeated until the scan is com-plete. Thus, for a 2D scan, the recorded data set is a3D array p�x, y, t�, representing the distribution ofthe incident time-varying acoustic pressure p over
Fig. 5. Reflectivity R��� and normalized phase sensitivity S� ��� asfunction of wavelength for the 38 �m FP sensor. The optimum biaspoint of the sensor is the wavelength �opt at which S� ��� is a max-imum. At this wavelength the reflected optical power modulationdue to an acoustically induced phase shift is a maximum and thesensor is said to be optimally biased.
566 APPLIED OPTICS � Vol. 47, No. 4 � 1 February 2008
the x–y detection plane. This data set is then used toreconstruct a 3D image as described in Subsection2.E.
D. System Performance
In Subsections 2.D.1–2.D.6 the performance of thedetection system is described in terms of the essentialparameters required to specify an ultrasound fieldmapping system: namely, the dimensions and spatialsampling intervals of the acoustic aperture, acquisi-tion speed, and the acoustic performance in terms ofdetection sensitivity, linearity, frequency response,and effective element size.
1. Scan Parameters: Scan Area, Step Size, andSpot SizeThe maximum dimensions over which the interroga-tion laser beam can be scanned over the sensor isdefined by a circle of diameter 50 mm—that is to saythe area over which the photoacoustic signals are tobe mapped must lie within this circle. The diameter ofthe laser beam at its focus, the 1�e2 spot size, is 64 �mand the minimum step size (limited by the 12-bitresolution of the PC digital-to-analog conversion(D�A) card that controls the optical scanner) is10 �m.
2. Acquisition SpeedThe acquisition time per scan step is approximately1 s. This is dominated by a combination of the timetaken to rearm the DSO between acquisitions and thedownload time from the DSO to the PC via the GPIBinterface for each acquisition. As described further inSection 4, this could be significantly reduced throughthe use of an alternative acquisition scheme in whichall of the waveforms acquired over the scan are storedwithin the on-board memory of the digitizer (in thiscase the DSO) and downloaded in a single step to thePC hard drive. This would offer the prospect ofachieving an acquisition speed limited by the PRF ofthe excitation laser.
3. Detection SensitivityThe detection sensitivity or noise-equivalent pres-sure (NEP) is defined as the acoustic pressure thatprovides a system SNR of unity in the low-frequencylimit [25] �a �� l where �a is the acoustic wavelengthand l is the FPI thickness. The NEP therefore repre-sents the minimum detectable acoustic pressure andis given by
NEP �NSo
,
where So is the sensor sensitivity and is defined as thereflected optical power modulation per unit acousticpressure (�W�MPa) at the optimum bias point of theFPI [25]. So is proportional to the phase sensitivity(as defined in Subsection 2.C.3) and therefore de-pends on the incident optical power and the shape ofthe ITF, which in turn depends on the reflectivitiesof the FPI mirrors and the phase dispersion imposed
by the geometry of the laser beam and nonuniformi-ties in the thickness of the polymer film spacer. So
also depends on the thickness and elastic and pho-toelastic properties of the polymer film and the acous-tic impedance of the backing stub [25]. N is theminimum detectable optical power modulation re-flected from the sensor over a specified measurementbandwidth and is a function of the noise character-istics of the laser source and the photodiode–transimpedance amplifier configuration. For thespecific system reported in this paper, the noise isdominated by the latter.
To determine So, the reflected optical power mod-ulation produced by the output of a pulsed 3.5 MHzPZT ultrasound source that had been previously cal-ibrated using a PVDF membrane hydrophone wasmeasured. To obtain N, the peak output noise voltageof the photodiode was measured over a 20 MHz band-width and converted to an equivalent optical power.Note that peak rather than rms noise figures arequoted as the former provides a more realistic indi-cation of the smallest signal that can be detectedwhen measuring broadband signals in the time do-main. From the measurements of N and So, the peakNEP was found to be 0.21 kPa for the 38 �m sensorand 0.31 kPa for the 22 �m sensor. In both cases themeasurement bandwidth was 20 MHz. Note that inthis case the NEP of the two sensors is not in directproportion to their thicknesses as might be expectedbecause the 22 �m sensor has a higher visibility andfinesse compared to the 38 �m sensor as noted inSubsection 2.B.
Although it has been suggested that optical ultra-sound sensors are, in general, significantly less sen-sitive than conventional piezoelectric transducers[37], this is not the case with the FP sensor. Itdepends critically upon the element size under con-sideration. The NEP values quoted above are compa-rable to that of a 1 mm diameter piezoelectric PVDFreceiver [29] terminated with a high-quality pream-plifier. Indeed, if the more appropriate comparison ismade between a PVDF receiver of similar elementsize to that of the FP sensor, it becomes evident thatthe latter is much more sensitive. For example, a75 �m diameter PVDF receiver can be expected tohave a typical NEP of around 50 kPa [28] and istherefore more than 2 orders of magnitude less sen-sitive than the FP sensor that, in this study, has anoptically defined active diameter of 64 �m.
4. LinearityAssuming the elastic limits of the polymer film arenot exceeded, the upper limit of linear acoustic detec-tion is determined by the phase range over which theITF is linear and the acoustic phase sensitivity. Thelater is defined as the magnitude of the optical phaseshift produced per unit acoustic pressure [25]. Forthe 38 �m sensor, the linear phase range (to within10%) around the optimum bias point was measuredto be 0.039 rad. Using a value for the acoustic phasesensitivity of 0.03 rad�MPa (based on a previouslyreported value of 0.15 rad�MPa for a 50 �m thick
1 February 2008 � Vol. 47, No. 4 � APPLIED OPTICS 567
rigid-backed Parylene sensor film illuminated withlight at 850 nm [28]), this corresponds to an upperlimit of linear detection of 1.3 MPa. The correspond-ing value for the 22 �m sensor is 1.8 MPa. In general,the peak pressures of photoacoustic signals gener-ated in tissues are of the order of kilopascals andtherefore well within the linear operating range ofboth sensors.
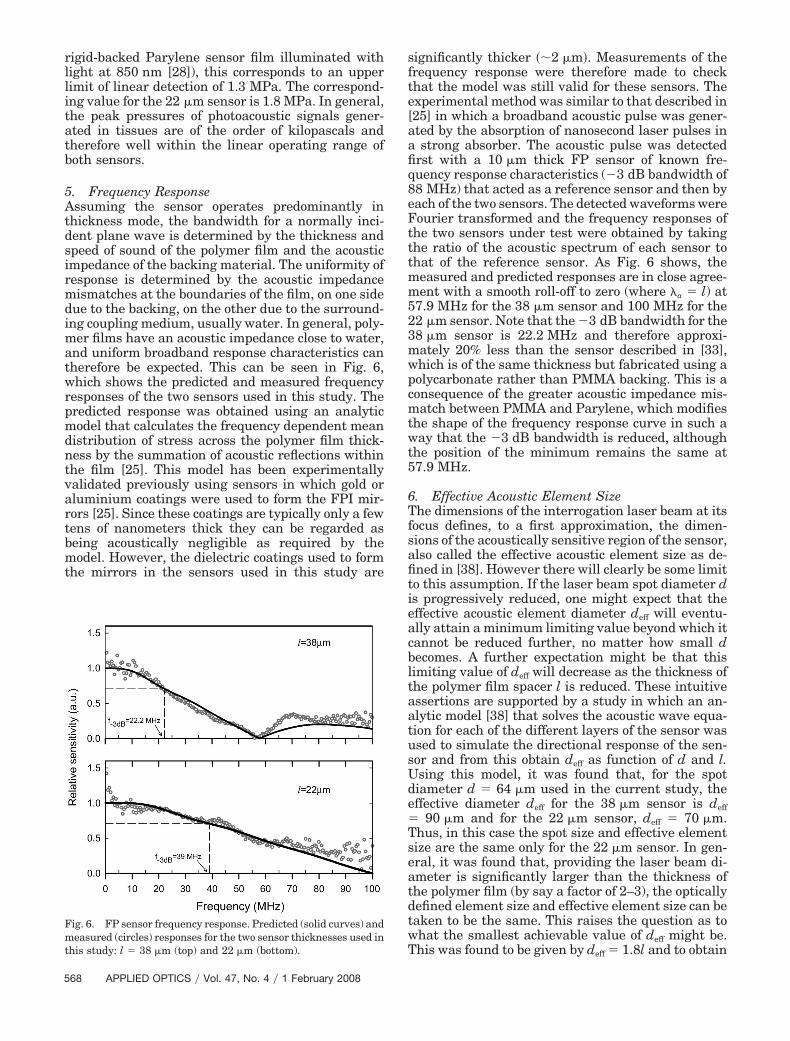
5. Frequency ResponseAssuming the sensor operates predominantly inthickness mode, the bandwidth for a normally inci-dent plane wave is determined by the thickness andspeed of sound of the polymer film and the acousticimpedance of the backing material. The uniformity ofresponse is determined by the acoustic impedancemismatches at the boundaries of the film, on one sidedue to the backing, on the other due to the surround-ing coupling medium, usually water. In general, poly-mer films have an acoustic impedance close to water,and uniform broadband response characteristics cantherefore be expected. This can be seen in Fig. 6,which shows the predicted and measured frequencyresponses of the two sensors used in this study. Thepredicted response was obtained using an analyticmodel that calculates the frequency dependent meandistribution of stress across the polymer film thick-ness by the summation of acoustic reflections withinthe film [25]. This model has been experimentallyvalidated previously using sensors in which gold oraluminium coatings were used to form the FPI mir-rors [25]. Since these coatings are typically only a fewtens of nanometers thick they can be regarded asbeing acoustically negligible as required by themodel. However, the dielectric coatings used to formthe mirrors in the sensors used in this study are
significantly thicker ��2 �m�. Measurements of thefrequency response were therefore made to checkthat the model was still valid for these sensors. Theexperimental method was similar to that described in[25] in which a broadband acoustic pulse was gener-ated by the absorption of nanosecond laser pulses ina strong absorber. The acoustic pulse was detectedfirst with a 10 �m thick FP sensor of known fre-quency response characteristics (�3 dB bandwidth of88 MHz) that acted as a reference sensor and then byeach of the two sensors. The detected waveforms wereFourier transformed and the frequency responses ofthe two sensors under test were obtained by takingthe ratio of the acoustic spectrum of each sensor tothat of the reference sensor. As Fig. 6 shows, themeasured and predicted responses are in close agree-ment with a smooth roll-off to zero (where �a � l) at57.9 MHz for the 38 �m sensor and 100 MHz for the22 �m sensor. Note that the �3 dB bandwidth for the38 �m sensor is 22.2 MHz and therefore approxi-mately 20% less than the sensor described in [33],which is of the same thickness but fabricated using apolycarbonate rather than PMMA backing. This is aconsequence of the greater acoustic impedance mis-match between PMMA and Parylene, which modifiesthe shape of the frequency response curve in such away that the �3 dB bandwidth is reduced, althoughthe position of the minimum remains the same at57.9 MHz.
6. Effective Acoustic Element SizeThe dimensions of the interrogation laser beam at itsfocus defines, to a first approximation, the dimen-sions of the acoustically sensitive region of the sensor,also called the effective acoustic element size as de-fined in [38]. However there will clearly be some limitto this assumption. If the laser beam spot diameter dis progressively reduced, one might expect that theeffective acoustic element diameter deff will eventu-ally attain a minimum limiting value beyond which itcannot be reduced further, no matter how small dbecomes. A further expectation might be that thislimiting value of deff will decrease as the thickness ofthe polymer film spacer l is reduced. These intuitiveassertions are supported by a study in which an an-alytic model [38] that solves the acoustic wave equa-tion for each of the different layers of the sensor wasused to simulate the directional response of the sen-sor and from this obtain deff as function of d and l.Using this model, it was found that, for the spotdiameter d � 64 �m used in the current study, theeffective diameter deff for the 38 �m sensor is deff� 90 �m and for the 22 �m sensor, deff � 70 �m.Thus, in this case the spot size and effective elementsize are the same only for the 22 �m sensor. In gen-eral, it was found that, providing the laser beam di-ameter is significantly larger than the thickness ofthe polymer film (by say a factor of 2–3), the opticallydefined element size and effective element size can betaken to be the same. This raises the question as towhat the smallest achievable value of deff might be.This was found to be given by deff � 1.8l and to obtain
Fig. 6. FP sensor frequency response. Predicted (solid curves) andmeasured (circles) responses for the two sensor thicknesses used inthis study: l � 38 �m (top) and 22 �m (bottom).
568 APPLIED OPTICS � Vol. 47, No. 4 � 1 February 2008
this limiting value it is required that d � l�2. So, forthe 38 �m sensor it would be possible to achieve aminimum value of deff � 68.4 �m by illuminatingwith a spot diameter of 19 �m. For the 22 �m sensor,the minimum deff � 39.6 �m and would require illu-minating with an 11 �m spot diameter. To achieve asmaller deff would require reducing l. All of this sug-gests that while it is often reasonable to assume thatthe optically defined element size and effective ele-ment size are the same, it is not always so, particu-larly when the interrogation laser beam dimensionsbegin to approach the sensor thickness.
E. Image Reconstruction Algorithm
The image reconstruction algorithm recovers a 3Dimage of the initial pressure distribution po�x, y, z�,from the time-resolved photoacoustic signals p�x, y, t�recorded over the surface of the sensor. The assump-tion then is that po�x, y, z� can be taken to be pro-portional to the absorbed optical energy densityassuming impulsive deposition of the laser energy.
The reconstruction algorithm is based on an ana-lytic inverse k-space method that is applicable to pla-nar [39] and linear detection geometries [40]. Thisapproach is based upon the premise that the spatialfrequency components of po�x, y, z� are directlymapped on to, and can therefore be recovered from,the spatial and temporal frequency components of theset of detected pressure signals p�x, y, t�. The deri-vation and computational implementation of thismethod is described in detail for 2D and 3D domainsin references [40] and [39], respectively. In brief how-ever, for a 3D reconstruction, it requires (1) taking a3D Fourier transform of the detected photoacousticsignals p�x, y, t� to obtain p�kx, ky, ��, where kx and ky
are the x and y spatial frequencies in the sensor planeand � is the temporal frequency; (2) mapping � to thevertical spatial frequency kz using the dispersion re-lationship � � c�kx
2 � ky2 � kz
2 to obtain the spatialfrequency components of the initial pressure distri-bution po�kx, ky, kz�; and (3) inverse Fourier trans-forming po�kx, ky, kz� to obtain the required initialpressure distribution po�x, y, z�. The advantage of thisapproach over time domain back projection methodsfor planar detection geometries is that it is signifi-cantly faster, typically by several orders of magnitudedue to the computational efficiencies gained throughthe use of the fast Fourier transform (FFT).
3. System Evaluation
The system has been evaluated by imaging variousabsorbing structures immersed in a scattering liquid.The purpose of these experiments was threefold: (1)to estimate the spatial resolution that the systemcould provide, (2) to show that the system can provideaccurate 3D images of arbitrarily shaped absorbers,and (3) to demonstrate that a physiologically realistictissue phantom designed to represent a network ofblood vessels could be imaged. All experiments wereundertaken in backward mode, no signal averagingwas used, and the incident fluence of the excitation
laser pulses was always less than 15 mJ�cm2 andthus below the maximum permitted exposure (MPE)for skin [41]. No filtering or processing of the recon-structed images was undertaken.
A. Instrument Line-Spread Function
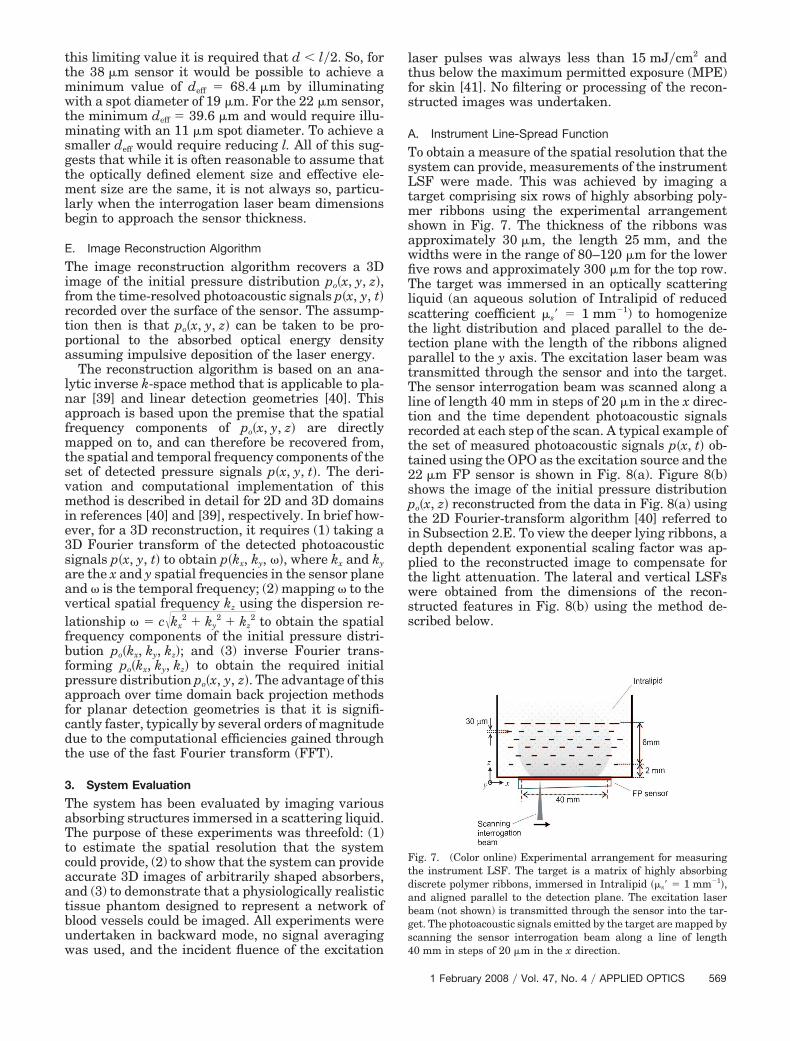
To obtain a measure of the spatial resolution that thesystem can provide, measurements of the instrumentLSF were made. This was achieved by imaging atarget comprising six rows of highly absorbing poly-mer ribbons using the experimental arrangementshown in Fig. 7. The thickness of the ribbons wasapproximately 30 �m, the length 25 mm, and thewidths were in the range of 80–120 �m for the lowerfive rows and approximately 300 �m for the top row.The target was immersed in an optically scatteringliquid (an aqueous solution of Intralipid of reducedscattering coefficient �s� � 1 mm�1) to homogenizethe light distribution and placed parallel to the de-tection plane with the length of the ribbons alignedparallel to the y axis. The excitation laser beam wastransmitted through the sensor and into the target.The sensor interrogation beam was scanned along aline of length 40 mm in steps of 20 �m in the x direc-tion and the time dependent photoacoustic signalsrecorded at each step of the scan. A typical example ofthe set of measured photoacoustic signals p�x, t� ob-tained using the OPO as the excitation source and the22 �m FP sensor is shown in Fig. 8(a). Figure 8(b)shows the image of the initial pressure distributionpo�x, z� reconstructed from the data in Fig. 8(a) usingthe 2D Fourier-transform algorithm [40] referred toin Subsection 2.E. To view the deeper lying ribbons, adepth dependent exponential scaling factor was ap-plied to the reconstructed image to compensate forthe light attenuation. The lateral and vertical LSFswere obtained from the dimensions of the recon-structed features in Fig. 8(b) using the method de-scribed below.
Fig. 7. (Color online) Experimental arrangement for measuringthe instrument LSF. The target is a matrix of highly absorbingdiscrete polymer ribbons, immersed in Intralipid ��s� � 1 mm�1�,and aligned parallel to the detection plane. The excitation laserbeam (not shown) is transmitted through the sensor into the tar-get. The photoacoustic signals emitted by the target are mapped byscanning the sensor interrogation beam along a line of length40 mm in steps of 20 �m in the x direction.
1 February 2008 � Vol. 47, No. 4 � APPLIED OPTICS 569
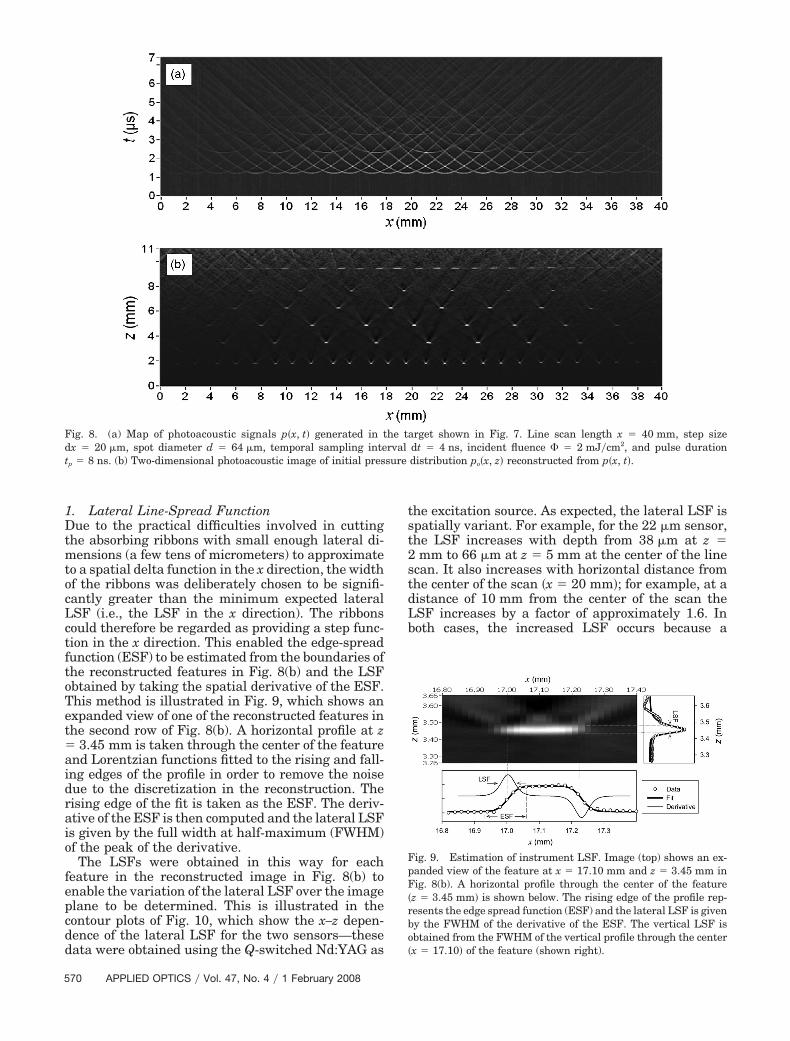
1. Lateral Line-Spread FunctionDue to the practical difficulties involved in cuttingthe absorbing ribbons with small enough lateral di-mensions (a few tens of micrometers) to approximateto a spatial delta function in the x direction, the widthof the ribbons was deliberately chosen to be signifi-cantly greater than the minimum expected lateralLSF (i.e., the LSF in the x direction). The ribbonscould therefore be regarded as providing a step func-tion in the x direction. This enabled the edge-spreadfunction (ESF) to be estimated from the boundaries ofthe reconstructed features in Fig. 8(b) and the LSFobtained by taking the spatial derivative of the ESF.This method is illustrated in Fig. 9, which shows anexpanded view of one of the reconstructed features inthe second row of Fig. 8(b). A horizontal profile at z� 3.45 mm is taken through the center of the featureand Lorentzian functions fitted to the rising and fall-ing edges of the profile in order to remove the noisedue to the discretization in the reconstruction. Therising edge of the fit is taken as the ESF. The deriv-ative of the ESF is then computed and the lateral LSFis given by the full width at half-maximum (FWHM)of the peak of the derivative.
The LSFs were obtained in this way for eachfeature in the reconstructed image in Fig. 8(b) toenable the variation of the lateral LSF over the imageplane to be determined. This is illustrated in thecontour plots of Fig. 10, which show the x–z depen-dence of the lateral LSF for the two sensors—thesedata were obtained using the Q-switched Nd:YAG as
the excitation source. As expected, the lateral LSF isspatially variant. For example, for the 22 �m sensor,the LSF increases with depth from 38 �m at z �2 mm to 66 �m at z � 5 mm at the center of the linescan. It also increases with horizontal distance fromthe center of the scan �x � 20 mm�; for example, at adistance of 10 mm from the center of the scan theLSF increases by a factor of approximately 1.6. Inboth cases, the increased LSF occurs because a
Fig. 8. (a) Map of photoacoustic signals p�x, t� generated in the target shown in Fig. 7. Line scan length x � 40 mm, step sizedx � 20 �m, spot diameter d � 64 �m, temporal sampling interval dt � 4 ns, incident fluence � 2 mJ�cm2, and pulse durationtp � 8 ns. (b) Two-dimensional photoacoustic image of initial pressure distribution po�x, z� reconstructed from p�x, t�.
Fig. 9. Estimation of instrument LSF. Image (top) shows an ex-panded view of the feature at x � 17.10 mm and z � 3.45 mm inFig. 8(b). A horizontal profile through the center of the feature�z � 3.45 mm� is shown below. The rising edge of the profile rep-resents the edge spread function (ESF) and the lateral LSF is givenby the FWHM of the derivative of the ESF. The vertical LSF isobtained from the FWHM of the vertical profile through the center�x � 17.10� of the feature (shown right).
570 APPLIED OPTICS � Vol. 47, No. 4 � 1 February 2008
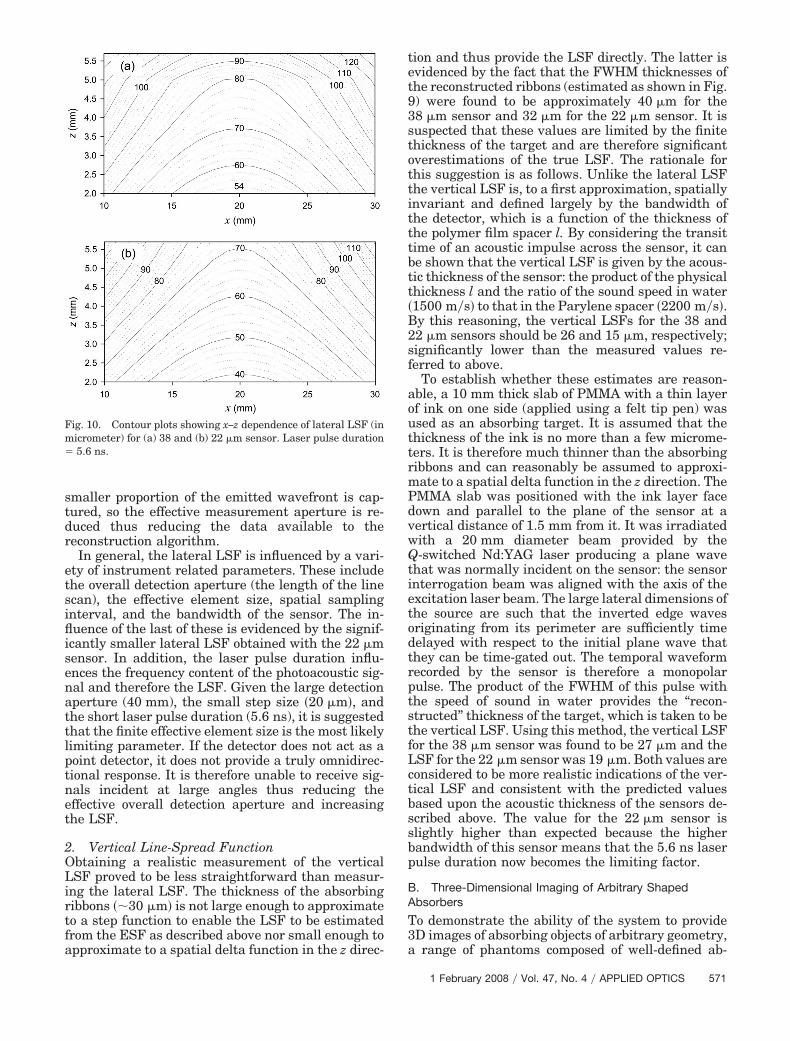
smaller proportion of the emitted wavefront is cap-tured, so the effective measurement aperture is re-duced thus reducing the data available to thereconstruction algorithm.
In general, the lateral LSF is influenced by a vari-ety of instrument related parameters. These includethe overall detection aperture (the length of the linescan), the effective element size, spatial samplinginterval, and the bandwidth of the sensor. The in-fluence of the last of these is evidenced by the signif-icantly smaller lateral LSF obtained with the 22 �msensor. In addition, the laser pulse duration influ-ences the frequency content of the photoacoustic sig-nal and therefore the LSF. Given the large detectionaperture (40 mm), the small step size �20 �m�, andthe short laser pulse duration (5.6 ns), it is suggestedthat the finite effective element size is the most likelylimiting parameter. If the detector does not act as apoint detector, it does not provide a truly omnidirec-tional response. It is therefore unable to receive sig-nals incident at large angles thus reducing theeffective overall detection aperture and increasingthe LSF.
2. Vertical Line-Spread FunctionObtaining a realistic measurement of the verticalLSF proved to be less straightforward than measur-ing the lateral LSF. The thickness of the absorbingribbons ��30 �m� is not large enough to approximateto a step function to enable the LSF to be estimatedfrom the ESF as described above nor small enough toapproximate to a spatial delta function in the z direc-
tion and thus provide the LSF directly. The latter isevidenced by the fact that the FWHM thicknesses ofthe reconstructed ribbons (estimated as shown in Fig.9) were found to be approximately 40 �m for the38 �m sensor and 32 �m for the 22 �m sensor. It issuspected that these values are limited by the finitethickness of the target and are therefore significantoverestimations of the true LSF. The rationale forthis suggestion is as follows. Unlike the lateral LSFthe vertical LSF is, to a first approximation, spatiallyinvariant and defined largely by the bandwidth ofthe detector, which is a function of the thickness ofthe polymer film spacer l. By considering the transittime of an acoustic impulse across the sensor, it canbe shown that the vertical LSF is given by the acous-tic thickness of the sensor: the product of the physicalthickness l and the ratio of the sound speed in water�1500 m�s� to that in the Parylene spacer �2200 m�s�.By this reasoning, the vertical LSFs for the 38 and22 �m sensors should be 26 and 15 �m, respectively;significantly lower than the measured values re-ferred to above.
To establish whether these estimates are reason-able, a 10 mm thick slab of PMMA with a thin layerof ink on one side (applied using a felt tip pen) wasused as an absorbing target. It is assumed that thethickness of the ink is no more than a few microme-ters. It is therefore much thinner than the absorbingribbons and can reasonably be assumed to approxi-mate to a spatial delta function in the z direction. ThePMMA slab was positioned with the ink layer facedown and parallel to the plane of the sensor at avertical distance of 1.5 mm from it. It was irradiatedwith a 20 mm diameter beam provided by theQ-switched Nd:YAG laser producing a plane wavethat was normally incident on the sensor: the sensorinterrogation beam was aligned with the axis of theexcitation laser beam. The large lateral dimensions ofthe source are such that the inverted edge wavesoriginating from its perimeter are sufficiently timedelayed with respect to the initial plane wave thatthey can be time-gated out. The temporal waveformrecorded by the sensor is therefore a monopolarpulse. The product of the FWHM of this pulse withthe speed of sound in water provides the “recon-structed” thickness of the target, which is taken to bethe vertical LSF. Using this method, the vertical LSFfor the 38 �m sensor was found to be 27 �m and theLSF for the 22 �m sensor was 19 �m. Both values areconsidered to be more realistic indications of the ver-tical LSF and consistent with the predicted valuesbased upon the acoustic thickness of the sensors de-scribed above. The value for the 22 �m sensor isslightly higher than expected because the higherbandwidth of this sensor means that the 5.6 ns laserpulse duration now becomes the limiting factor.
B. Three-Dimensional Imaging of Arbitrary ShapedAbsorbers
To demonstrate the ability of the system to provide3D images of absorbing objects of arbitrary geometry,a range of phantoms composed of well-defined ab-
Fig. 10. Contour plots showing x–z dependence of lateral LSF (inmicrometer) for (a) 38 and (b) 22 �m sensor. Laser pulse duration� 5.6 ns.
1 February 2008 � Vol. 47, No. 4 � APPLIED OPTICS 571
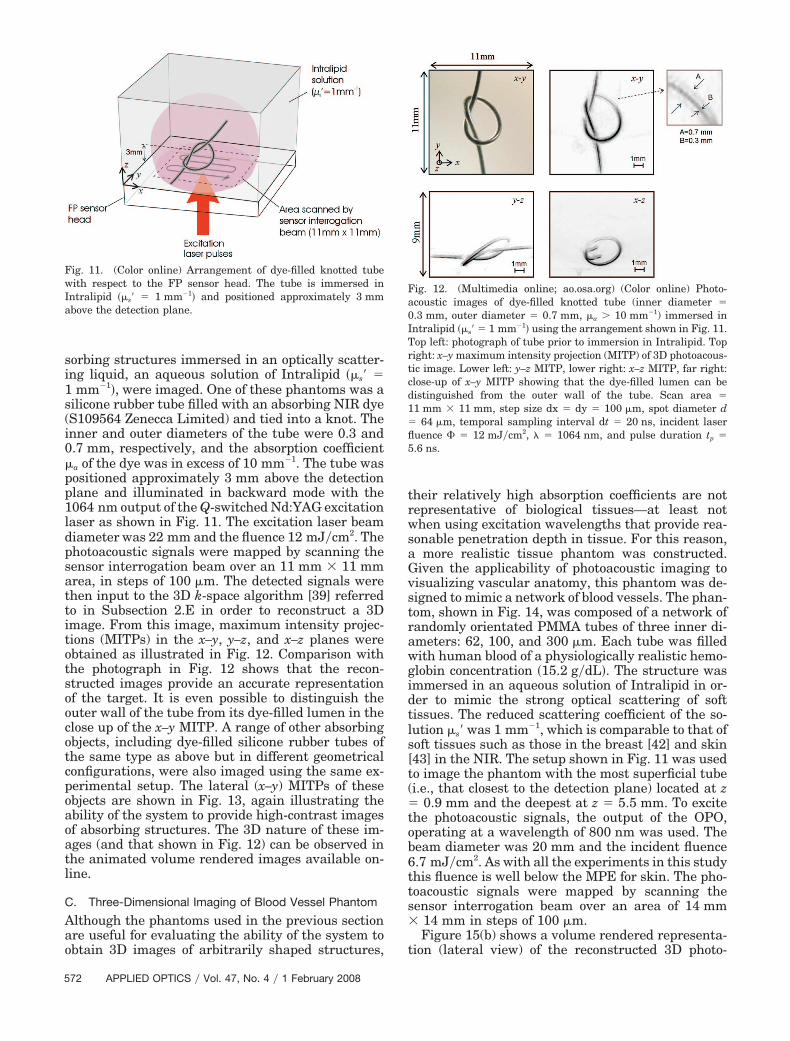
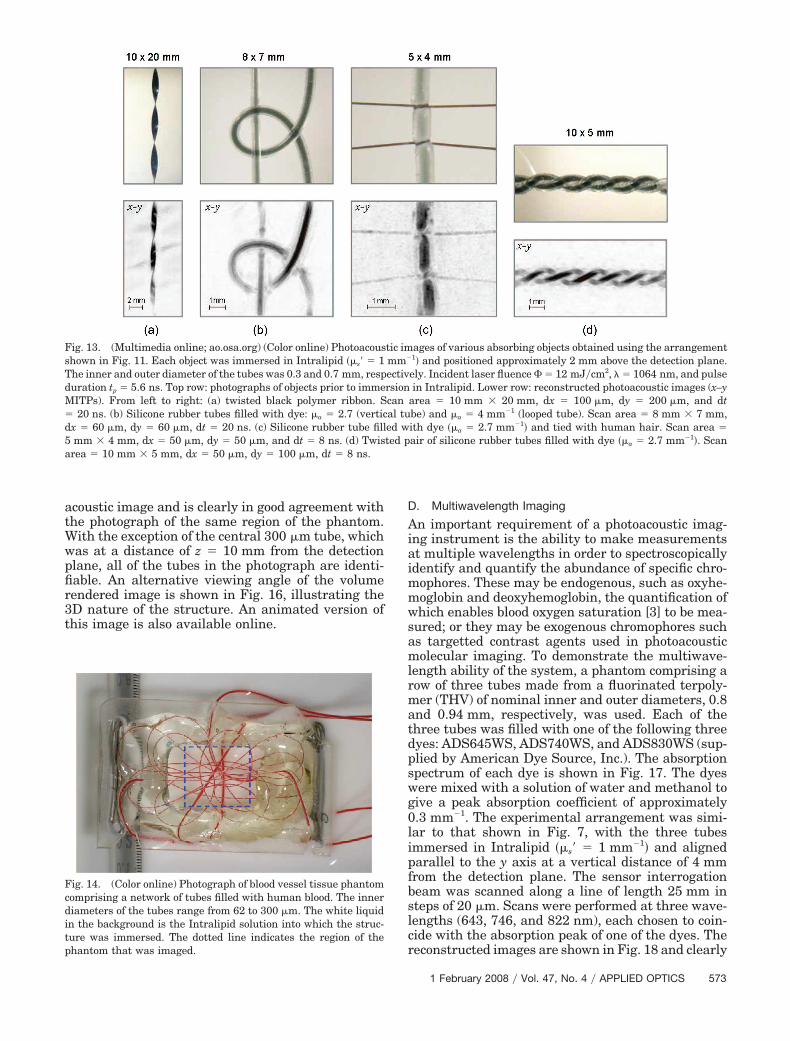
sorbing structures immersed in an optically scatter-ing liquid, an aqueous solution of Intralipid ��s� �1 mm�1�, were imaged. One of these phantoms was asilicone rubber tube filled with an absorbing NIR dye(S109564 Zenecca Limited) and tied into a knot. Theinner and outer diameters of the tube were 0.3 and0.7 mm, respectively, and the absorption coefficient�a of the dye was in excess of 10 mm�1. The tube waspositioned approximately 3 mm above the detectionplane and illuminated in backward mode with the1064 nm output of the Q-switched Nd:YAG excitationlaser as shown in Fig. 11. The excitation laser beamdiameter was 22 mm and the fluence 12 mJ�cm2. Thephotoacoustic signals were mapped by scanning thesensor interrogation beam over an 11 mm 11 mmarea, in steps of 100 �m. The detected signals werethen input to the 3D k-space algorithm [39] referredto in Subsection 2.E in order to reconstruct a 3Dimage. From this image, maximum intensity projec-tions (MITPs) in the x–y, y–z, and x–z planes wereobtained as illustrated in Fig. 12. Comparison withthe photograph in Fig. 12 shows that the recon-structed images provide an accurate representationof the target. It is even possible to distinguish theouter wall of the tube from its dye-filled lumen in theclose up of the x–y MITP. A range of other absorbingobjects, including dye-filled silicone rubber tubes ofthe same type as above but in different geometricalconfigurations, were also imaged using the same ex-perimental setup. The lateral (x–y) MITPs of theseobjects are shown in Fig. 13, again illustrating theability of the system to provide high-contrast imagesof absorbing structures. The 3D nature of these im-ages (and that shown in Fig. 12) can be observed inthe animated volume rendered images available on-line.
C. Three-Dimensional Imaging of Blood Vessel Phantom
Although the phantoms used in the previous sectionare useful for evaluating the ability of the system toobtain 3D images of arbitrarily shaped structures,
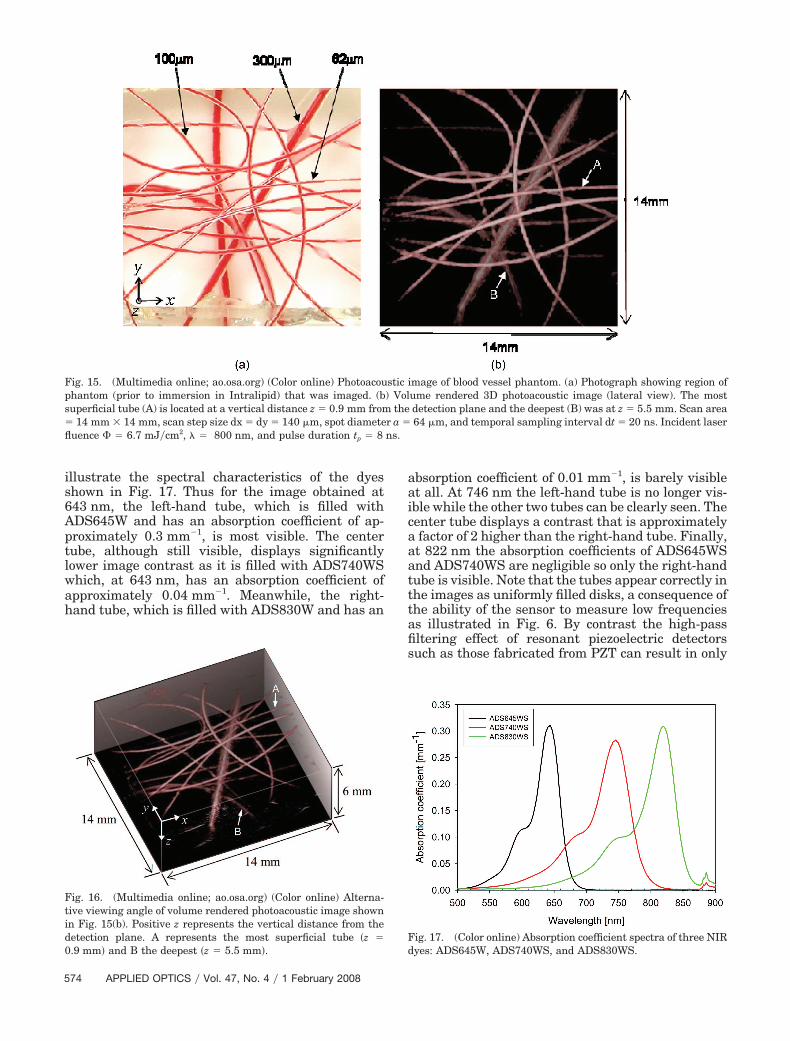
their relatively high absorption coefficients are notrepresentative of biological tissues—at least notwhen using excitation wavelengths that provide rea-sonable penetration depth in tissue. For this reason,a more realistic tissue phantom was constructed.Given the applicability of photoacoustic imaging tovisualizing vascular anatomy, this phantom was de-signed to mimic a network of blood vessels. The phan-tom, shown in Fig. 14, was composed of a network ofrandomly orientated PMMA tubes of three inner di-ameters: 62, 100, and 300 �m. Each tube was filledwith human blood of a physiologically realistic hemo-globin concentration �15.2 g�dL�. The structure wasimmersed in an aqueous solution of Intralipid in or-der to mimic the strong optical scattering of softtissues. The reduced scattering coefficient of the so-lution �s� was 1 mm�1, which is comparable to that ofsoft tissues such as those in the breast [42] and skin[43] in the NIR. The setup shown in Fig. 11 was usedto image the phantom with the most superficial tube(i.e., that closest to the detection plane) located at z� 0.9 mm and the deepest at z � 5.5 mm. To excitethe photoacoustic signals, the output of the OPO,operating at a wavelength of 800 nm was used. Thebeam diameter was 20 mm and the incident fluence6.7 mJ�cm2. As with all the experiments in this studythis fluence is well below the MPE for skin. The pho-toacoustic signals were mapped by scanning thesensor interrogation beam over an area of 14 mm 14 mm in steps of 100 �m.
Figure 15(b) shows a volume rendered representa-tion (lateral view) of the reconstructed 3D photo-
Fig. 11. (Color online) Arrangement of dye-filled knotted tubewith respect to the FP sensor head. The tube is immersed inIntralipid ��s� � 1 mm�1� and positioned approximately 3 mmabove the detection plane.
Fig. 12. (Multimedia online; ao.osa.org) (Color online) Photo-acoustic images of dye-filled knotted tube (inner diameter �0.3 mm, outer diameter � 0.7 mm, �a � 10 mm�1) immersed inIntralipid ��s� � 1 mm�1� using the arrangement shown in Fig. 11.Top left: photograph of tube prior to immersion in Intralipid. Topright: x–y maximum intensity projection (MITP) of 3D photoacous-tic image. Lower left: y–z MITP, lower right: x–z MITP, far right:close-up of x–y MITP showing that the dye-filled lumen can bedistinguished from the outer wall of the tube. Scan area �11 mm 11 mm, step size dx � dy � 100 �m, spot diameter d� 64 �m, temporal sampling interval dt � 20 ns, incident laserfluence � 12 mJ�cm2, � � 1064 nm, and pulse duration tp �
5.6 ns.
572 APPLIED OPTICS � Vol. 47, No. 4 � 1 February 2008
acoustic image and is clearly in good agreement withthe photograph of the same region of the phantom.With the exception of the central 300 �m tube, whichwas at a distance of z � 10 mm from the detectionplane, all of the tubes in the photograph are identi-fiable. An alternative viewing angle of the volumerendered image is shown in Fig. 16, illustrating the3D nature of the structure. An animated version ofthis image is also available online.
D. Multiwavelength Imaging
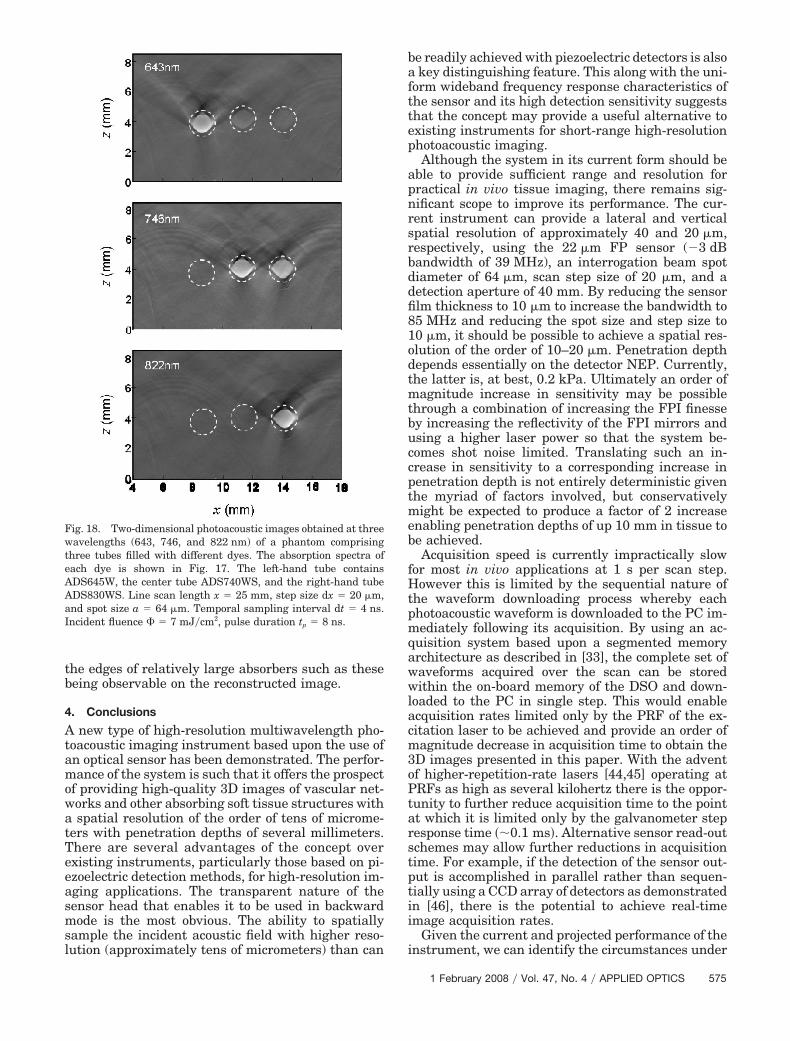
An important requirement of a photoacoustic imag-ing instrument is the ability to make measurementsat multiple wavelengths in order to spectroscopicallyidentify and quantify the abundance of specific chro-mophores. These may be endogenous, such as oxyhe-moglobin and deoxyhemoglobin, the quantification ofwhich enables blood oxygen saturation [3] to be mea-sured; or they may be exogenous chromophores suchas targetted contrast agents used in photoacousticmolecular imaging. To demonstrate the multiwave-length ability of the system, a phantom comprising arow of three tubes made from a fluorinated terpoly-mer (THV) of nominal inner and outer diameters, 0.8and 0.94 mm, respectively, was used. Each of thethree tubes was filled with one of the following threedyes: ADS645WS, ADS740WS, and ADS830WS (sup-plied by American Dye Source, Inc.). The absorptionspectrum of each dye is shown in Fig. 17. The dyeswere mixed with a solution of water and methanol togive a peak absorption coefficient of approximately0.3 mm�1. The experimental arrangement was simi-lar to that shown in Fig. 7, with the three tubesimmersed in Intralipid ��s� � 1 mm�1� and alignedparallel to the y axis at a vertical distance of 4 mmfrom the detection plane. The sensor interrogationbeam was scanned along a line of length 25 mm insteps of 20 �m. Scans were performed at three wave-lengths (643, 746, and 822 nm), each chosen to coin-cide with the absorption peak of one of the dyes. Thereconstructed images are shown in Fig. 18 and clearly
Fig. 13. (Multimedia online; ao.osa.org) (Color online) Photoacoustic images of various absorbing objects obtained using the arrangementshown in Fig. 11. Each object was immersed in Intralipid ��s� � 1 mm�1� and positioned approximately 2 mm above the detection plane.The inner and outer diameter of the tubes was 0.3 and 0.7 mm, respectively. Incident laser fluence � 12 mJ�cm2, � � 1064 nm, and pulseduration tp � 5.6 ns. Top row: photographs of objects prior to immersion in Intralipid. Lower row: reconstructed photoacoustic images (x–yMITPs). From left to right: (a) twisted black polymer ribbon. Scan area � 10 mm 20 mm, dx � 100 �m, dy � 200 �m, and dt� 20 ns. (b) Silicone rubber tubes filled with dye: �a � 2.7 (vertical tube) and �a � 4 mm�1 (looped tube). Scan area � 8 mm 7 mm,dx � 60 �m, dy � 60 �m, dt � 20 ns. (c) Silicone rubber tube filled with dye ��a � 2.7 mm�1� and tied with human hair. Scan area �5 mm 4 mm, dx � 50 �m, dy � 50 �m, and dt � 8 ns. (d) Twisted pair of silicone rubber tubes filled with dye ��a � 2.7 mm�1�. Scanarea � 10 mm 5 mm, dx � 50 �m, dy � 100 �m, dt � 8 ns.
Fig. 14. (Color online) Photograph of blood vessel tissue phantomcomprising a network of tubes filled with human blood. The innerdiameters of the tubes range from 62 to 300 �m. The white liquidin the background is the Intralipid solution into which the struc-ture was immersed. The dotted line indicates the region of thephantom that was imaged.
1 February 2008 � Vol. 47, No. 4 � APPLIED OPTICS 573
illustrate the spectral characteristics of the dyesshown in Fig. 17. Thus for the image obtained at643 nm, the left-hand tube, which is filled withADS645W and has an absorption coefficient of ap-proximately 0.3 mm�1, is most visible. The centertube, although still visible, displays significantlylower image contrast as it is filled with ADS740WSwhich, at 643 nm, has an absorption coefficient ofapproximately 0.04 mm�1. Meanwhile, the right-hand tube, which is filled with ADS830W and has an
absorption coefficient of 0.01 mm�1, is barely visibleat all. At 746 nm the left-hand tube is no longer vis-ible while the other two tubes can be clearly seen. Thecenter tube displays a contrast that is approximatelya factor of 2 higher than the right-hand tube. Finally,at 822 nm the absorption coefficients of ADS645WSand ADS740WS are negligible so only the right-handtube is visible. Note that the tubes appear correctly inthe images as uniformly filled disks, a consequence ofthe ability of the sensor to measure low frequenciesas illustrated in Fig. 6. By contrast the high-passfiltering effect of resonant piezoelectric detectorssuch as those fabricated from PZT can result in only
Fig. 15. (Multimedia online; ao.osa.org) (Color online) Photoacoustic image of blood vessel phantom. (a) Photograph showing region ofphantom (prior to immersion in Intralipid) that was imaged. (b) Volume rendered 3D photoacoustic image (lateral view). The mostsuperficial tube (A) is located at a vertical distance z � 0.9 mm from the detection plane and the deepest (B) was at z � 5.5 mm. Scan area� 14 mm 14 mm, scan step size dx � dy � 140 �m, spot diameter a � 64 �m, and temporal sampling interval dt � 20 ns. Incident laserfluence � 6.7 mJ�cm2, � � 800 nm, and pulse duration tp � 8 ns.
Fig. 16. (Multimedia online; ao.osa.org) (Color online) Alterna-tive viewing angle of volume rendered photoacoustic image shownin Fig. 15(b). Positive z represents the vertical distance from thedetection plane. A represents the most superficial tube �z �
0.9 mm� and B the deepest �z � 5.5 mm�.Fig. 17. (Color online) Absorption coefficient spectra of three NIRdyes: ADS645W, ADS740WS, and ADS830WS.
574 APPLIED OPTICS � Vol. 47, No. 4 � 1 February 2008
the edges of relatively large absorbers such as thesebeing observable on the reconstructed image.
4. Conclusions
A new type of high-resolution multiwavelength pho-toacoustic imaging instrument based upon the use ofan optical sensor has been demonstrated. The perfor-mance of the system is such that it offers the prospectof providing high-quality 3D images of vascular net-works and other absorbing soft tissue structures witha spatial resolution of the order of tens of microme-ters with penetration depths of several millimeters.There are several advantages of the concept overexisting instruments, particularly those based on pi-ezoelectric detection methods, for high-resolution im-aging applications. The transparent nature of thesensor head that enables it to be used in backwardmode is the most obvious. The ability to spatiallysample the incident acoustic field with higher reso-lution (approximately tens of micrometers) than can
be readily achieved with piezoelectric detectors is alsoa key distinguishing feature. This along with the uni-form wideband frequency response characteristics ofthe sensor and its high detection sensitivity suggeststhat the concept may provide a useful alternative toexisting instruments for short-range high-resolutionphotoacoustic imaging.
Although the system in its current form should beable to provide sufficient range and resolution forpractical in vivo tissue imaging, there remains sig-nificant scope to improve its performance. The cur-rent instrument can provide a lateral and verticalspatial resolution of approximately 40 and 20 �m,respectively, using the 22 �m FP sensor (�3 dBbandwidth of 39 MHz), an interrogation beam spotdiameter of 64 �m, scan step size of 20 �m, and adetection aperture of 40 mm. By reducing the sensorfilm thickness to 10 �m to increase the bandwidth to85 MHz and reducing the spot size and step size to10 �m, it should be possible to achieve a spatial res-olution of the order of 10–20 �m. Penetration depthdepends essentially on the detector NEP. Currently,the latter is, at best, 0.2 kPa. Ultimately an order ofmagnitude increase in sensitivity may be possiblethrough a combination of increasing the FPI finesseby increasing the reflectivity of the FPI mirrors andusing a higher laser power so that the system be-comes shot noise limited. Translating such an in-crease in sensitivity to a corresponding increase inpenetration depth is not entirely deterministic giventhe myriad of factors involved, but conservativelymight be expected to produce a factor of 2 increaseenabling penetration depths of up 10 mm in tissue tobe achieved.
Acquisition speed is currently impractically slowfor most in vivo applications at 1 s per scan step.However this is limited by the sequential nature ofthe waveform downloading process whereby eachphotoacoustic waveform is downloaded to the PC im-mediately following its acquisition. By using an ac-quisition system based upon a segmented memoryarchitecture as described in [33], the complete set ofwaveforms acquired over the scan can be storedwithin the on-board memory of the DSO and down-loaded to the PC in single step. This would enableacquisition rates limited only by the PRF of the ex-citation laser to be achieved and provide an order ofmagnitude decrease in acquisition time to obtain the3D images presented in this paper. With the adventof higher-repetition-rate lasers [44,45] operating atPRFs as high as several kilohertz there is the oppor-tunity to further reduce acquisition time to the pointat which it is limited only by the galvanometer stepresponse time ��0.1 ms�. Alternative sensor read-outschemes may allow further reductions in acquisitiontime. For example, if the detection of the sensor out-put is accomplished in parallel rather than sequen-tially using a CCD array of detectors as demonstratedin [46], there is the potential to achieve real-timeimage acquisition rates.
Given the current and projected performance of theinstrument, we can identify the circumstances under
Fig. 18. Two-dimensional photoacoustic images obtained at threewavelengths (643, 746, and 822 nm) of a phantom comprisingthree tubes filled with different dyes. The absorption spectra ofeach dye is shown in Fig. 17. The left-hand tube containsADS645W, the center tube ADS740WS, and the right-hand tubeADS830WS. Line scan length x � 25 mm, step size dx � 20 �m,and spot size a � 64 �m. Temporal sampling interval dt � 4 ns.Incident fluence � 7 mJ�cm2, pulse duration tp � 8 ns.
1 February 2008 � Vol. 47, No. 4 � APPLIED OPTICS 575
which the FP sensor might be used in preferenceto conventional piezoelectric receivers. Clearly, thetransparent nature of the FP sensor head is a featurethat most piezoelectric receivers cannot provide andis of critical importance for imaging superficial tar-gets. However for other applications, such as deeptissue imaging or imaging in transmission mode, thisfeature is not so important. The choice of detector isthen determined largely by acoustic performance con-siderations. When comparing the FP sensor with pi-ezoelectric receivers, the critical issue in this respectis the relationship between detection sensitivity andelement size. With piezoelectric receivers, the sensi-tivity falls off with decreasing element size but withthe FP sensor the two are largely independent. Asnoted in Subsection 2.D.3 this means that once theelement size is below a certain threshold then the FPsensor provides higher sensitivity. This threshold de-pends on a variety of factors such as the NEP of theFP sensor and the material that the piezoelectricreceiver is fabricated from. However, given the NEPsreported in this paper and considering piezoelectricPVDF transducers, which, being fabricated from apolymer film have similar broadband frequency re-sponse characteristics to the FP sensor and thereforeprovide a fair comparison, it appears that the thresh-old lies at a diameter of 1 mm. That is to say a circularPVDF element of smaller diameter will provide alower sensitivity than the FP sensor. Thus for shortrange imaging applications (e.g., visualizing the skinmicrovasculature) where the high-frequency contentof the photoacoustic signal (tens of megahertz) de-mands element sizes on a scale of tens to hundreds ofmicrometers (this requirement is so that the detectorapproximates to a pointlike receiver and provides anear omnidirectional response) the FP sensor is likelyto be the detector of choice. For longer range appli-cations where penetration depths on a centimeterscale are required (e.g., imaging the breast), the lowerfrequency content of the signal (�5 MHz) meanslarger element sizes (millimeter to centimeter dimen-sions) can be tolerated. For these element dimen-sions, piezoelectric transducers are more suitable asthey will provide higher sensitivity and therefore bebetter suited to detecting the very weak signals gen-erated at these depths.
One further point to note in relation to the perfor-mance of the FP sensor is that, unlike receivers fabri-cated from piezoceramic materials such as PZT, whichtend to be resonant even when heavily damped, the FPsensor provides a truly broadband frequency responsedown to dc. This ability to measure the-low-frequencycontent of a photoacoustic signal is important whenimaging relatively large or spatially diffuse absorbers.If a resonant detector is used, its high-pass filteringeffect can result in only the edges of a large absorbingobject appearing on the reconstructed image. If theedges of the object are only weakly defined it may notbe visible at all. Apart from the obvious implications ofnot being able to visualize certain anatomical targets,this can seriously compromise spectroscopic [3] andother techniques [47] that seek to extract quantitative
information from the reconstructed image as the latterno longer accurately represents the absorbed opticalenergy distribution.
In summary, the backward-mode nature of the FPsensor and the high spatial resolution it can providesuggests that it will find a role for high-resolution softtissue imaging applications. These could includecharacterizing the structure and function of superfi-cial vascular networks for the assessment of skintumours, vascular lesions, soft tissue damage such asburns and wounds, and other superficial tissue ab-normalities characterized by changes in tissue perfu-sion.
This work was supported by the UK Engineeringand Physical Sciences Research Council (EPSRC).
References1. M. Xu and L. V. Wang, “Photoacoustic imaging in biomedi-
cine,” Rev. Sci. Instrum. 77, 041101 (2006).2. J. Laufer, C. E. Elwell, D. T. Delpy, and P. C. Beard, “In vitro
measurements of absolute blood oxygen saturation usingpulsed near-infrared photoacoustic spectroscopy: accuracy andresolution,” Phys. Med. Biol. 50, 4409–4428 (2005).
3. J. G. Laufer, D. T. Delpy, C. E. Elwell, and P. C. Beard, “Quan-titative spatially resolved measurement of tissue chromophoreconcentrations using photoacoustic spectroscopy: applicationto the measurement of blood oxygenation and haemoglobinconcentration,” Phys. Med. Biol. 52, 141–168 (2007).
4. A. A. Oraevsky, E. V. Savateeva, S. V. Solomatin, A. Karabu-tov, V. G. Andreev, Z. Gatalica, T. Khamapirad, and P. M.Henrichs, “Optoacoustic imaging of blood for visualization anddiagnostics of breast cancer,” Proc. SPIE 4618, 81–94 (2002).
5. S. Manohar, A. Kharine, J. C. G. van Hespen, W. Steenbergen,and T. G. van Leeuwen, “The Twente photoacoustic mammo-scope: system overview and performance,” Phys. Med. Biol. 50,2543–2557 (2005).
6. H. F. Zhang, K. Maslov, G. Stoica, and L. V. Wang, “Functionalphotoacoustic microscopy for high-resolution and noninvasivein vivo imaging,” Nat. Biotechnol. 24, 848–850 (2006).
7. J. T. Oh, M. L. Li, H. F. Zhang, K. Maslov, G. Stoica, and L. V.Wang, “Three-dimensional imaging of skin melanoma in vivoby dual-wavelength photoacoustic microscopy,” J. Biomed.Opt. 11, 034032 (2006).
8. J. A. Viator, G. Au, G. Paltauf, S. L. Jacques, S. A. Prahl, H.Ren, Z. Chen, and J. S. Nelson, “Clinical testing of a photo-acoustic probe for port wine stain depth determination,” La-sers Surg. Med. 30, 141–148 (2002).
9. H. F. Zhang, K. Maslov, G. Soica, and L. V. Wang, “Imagingaccute thermal burns by photoacoustic microscopy,” J. Biomed.Opt. 11, 054033 (2006).
10. X. Wang, Y. Pang, G. Ku, X. Xie, G. Stoica, and L. V. Wang,“Noninvasive laser-induced photoacoustic tomography forstructural and functional in vivo imaging of the brain,” Nat.Biotechnol. 21, 803–806 (2003).
11. E. Z. Zhang, J. Laufer, and P. C. Beard, “Three dimensionalphotoacoustic imaging of vascular anatomy in small animalsusing an optical detection system,” Proc SPIE 6437, 643710S(2007).
12. R. A. Kruger, W. L. Kiser, Jr., D. R. Reinecke, G. A. Kruger,and K. D. Miller, “Thermoacoustic optical molecular imaging ofsmall animals,” Molecular Imaging 2, 113–123 (2003).
13. L. Li, R. J. Zemp, L. Gina, G. Stoica, and L. V. Wang, “Photo-acoustic imaging of lacZ gene expression in vivo,” J. Biomed.Opt. 12, 020504 (2007).
14. X. Xie, M.-L. Li, J.-T. Oh, G. Ku, C. Wang, C. Li, S. Similache,G. F. Lungu, G. Stoica, and L. V. Wang, “Photoacoustic mo-
576 APPLIED OPTICS � Vol. 47, No. 4 � 1 February 2008

lecular imaging of small animals in vivo,” Proc. SPIE 6086608606 (2006).
15. X. Wang, Y. Pang, and G. Ku, “Three-dimensional laser-induced photoacoustic tomography of mouse brain with theskin and skull intact,” Opt. Lett. 28, 1739–1741 (2003).
16. R. A. Kruger, K. K. Kopecky, A. M. Aisen, D. R. Reinecke, G. A.Kruger, and W. L. Kiser, “Thermoacoustic CT with radiowaves: a medical imaging paradigm,” Radiology 211, 275–278(1999).
17. J. J. Niederhauser, M. Jaeger, M. Hejazi, H. Keppner, and M.Frenz, “Transparent ITO coated PVDF transducer for opto-acoustic depth profiling,” Opt. Commun. 253, 401–406 (2005).
18. R. G. Kolkmann, E. Hondebrink, W. Steenbergen, and F. F. DeMul, “In vivo photoacoustic imaging of blood vessels using anextreme-narrow aperture sensor,” IEEE J. Sel. Top. QuantumElectron. 9, 343–346 (2003).
19. P. Burgholzer, C. Hoffer, G. Paltauf, M. Haltmeier, and O.Scherzer, “Thermoacoustic tomography with integrating andarea and line detectors,” IEEE Trans. Ultrason. Ferroelectr.Freq. Control 52, 1577–1583 (2005).
20. K. Koestli, M. Frenz, H. P. Weber, G. Paltauf, and H. Schmidt-Kloiber, “Optoacoustic tomography: time-gated measurementof pressure distributions and image reconstruction,” Appl. Opt.40, 3800–3809 (2001).
21. B. P. Payne, V. Venugopalan, B. B. Mikc, and N. S. Nishioka,“Optoacoustic tomography using time resolved interferometricdetection of surface displacement,” J. Biomed. Opt. 8, 273–280(2003).
22. J. D. Hamilton and M. O’Donnell, “High frequency ultrasoundimaging with optical arrays,” IEEE Trans. Ultrason. Ferro-electr. Freq. Control 45, 216–235 (1998).
23. V. Wilkens and Ch. Koch, “Optical multilayer detection arrayfor fast ultrasonic field mapping,” Opt. Lett. 24, 1026–1028(1999).
24. P. C. Beard and T. N. Mills, “An optical fibre sensor for thedetection of laser generated ultrasound in arterial tissues,”Proc. SPIE 2331, 112–122 (1994).
25. P. C. Beard, F. Perennes, and T. N. Mills, “Transduction mech-anisms of the Fabry Perot polymer film sensing concept forwideband ultrasound detection,” IEEE Trans. Ultrason. Fer-roelectr. Freq. Control 46, 1575–1582 (1999).
26. Y. Uno and K. Nakamura, “Pressure sensitivity of a fibre-opticmicroprobe for high frequency ultrasonic field,” Jpn. J. Appl.Phys., Part 1 38, 3120–3123 (1999).
27. S. Askenazi, R. Witte, and M. O’Donnell, “High frequency ul-trasound imaging using a Fabry–Perot etalon,” Proc. SPIE5697, 243–250 (2005).
28. P. C. Beard, A. Hurrell, and T. N. Mills, “Characterisation of apolymer film optical fibre hydrophone for the measurement ofultrasound fields for use in the range 1–30 MHz: a comparisonwith PVDF needle and membrane hydrophones,” IEEE Trans.Ultrason. Ferroelectr. Freq. Control 47, 256–264 (2000).
29. E. Z. Zhang, B. T. Cox, and P. C. Beard, “Ultra high sensitivity,wideband Fabry Perot ultrasound sensors as an alternative topiezoelectric PVDF transducers for biomedical photoacousticdetection,” Proc. SPIE 5320, 222–229 (2004).
30. P. C. Beard, E. Z. Zhang, and B. T. Cox, “Transparent Fabry–Perot polymer film ultrasound array for backward-mode pho-toacoustic imaging,” Proc. SPIE 5320, 230–237 (2004).
31. P. C. Beard, “2D ultrasound receive array using an angle-tuned Fabry Perot polymer film sensor for transducer fieldcharacterisation and transmission ultrasound imaging,” IEEETrans. Ultrason. Ferroelectr. Freq. Control 52, 1002–1012(2005).
32. P. C. Beard, “Photoacoustic imaging of blood vessel equivalentphantoms,” Proc. SPIE 4618, 54–62 (2002).
33. E. Zhang and P. C. Beard, “Broadband ultrasound field map-ping system using a wavelength tuned, optically scanned fo-cussed beam to interrogate a Fabry Perot polymer film sensor,”IEEE Trans. Ultrason. Ferroelectr. Freq. Control 53, 1330–1338 (2006).
34. E. Z. Zhang and P. C. Beard, “2D backward-mode photoacous-tic imaging system for NIR (650–1200 nm) spectroscopic bio-medical applications,” Proc. SPIE 6086, 60860H (2006).
35. E. Z. Zhang, J. Laufer, and P. C. Beard, “Three dimensionalphotoacoustic imaging of vascular anatomy in small animalsusing an optical detection system,” Proc. SPIE 6437, 643710S(2007).
36. H. Yasuda, Plasma Polymerisation (Academic, 1985).37. V. Kozhushko, T. Kholkhlova, A. Zharinov, I. Pelivanov, V.
Solomatin, and A. Karabutov, “Focused array transducer fortwo dimensional optoacoustic tomography,” J. Acoust. Soc.Am. 116, 1498–1506 (2004).
38. B. T. Cox and P. C. Beard, “Frequency dependent directivity ofa planar Fabry Perot polymer film ultrasound sensor,” IEEETrans. Ultrason. Ferroelectr. Freq. Control 54, 394–404(2007).
39. K. Koestli, M. Frenz, H. Bebie, and H. Weber, “Temporal back-ward projection of optoacoustic pressure transients using Fou-rier transform methods,” Phys. Med. Biol. 46, 1863–1872(2001).
40. K. P. Köstli and P. C. Beard, “Two-dimensional photoacousticimaging by use of Fourier-transform image reconstruction anda detector with an anisotropic response,” Appl. Opt. 42, 1899–1908 (2003).
41. British Standard, “Safety of laser products. Equipment classi-fication, requirements and user’s guide,” BS EN60825-1 (TheBritish Standard Institute, 1994).
42. T. A. Troy, D. L. Page, and E. M. Sevic-Mucraca, “Opticalproperties of normal and diseased breast tissues: prognosis foroptical mammography,” J. Biomed Opt. 1, 342–355 (1996).
43. C. R. Simpson, M. Kohl, M. Essenpreis, and M. Cope, “Near-infrared optical properties of ex vivo human skin and subcu-taneous tissues measured using the Monte Carlo inversiontechnique,” Phys. Med. Biol. 43, 2465–2478 (1998).
44. K. Mazlov, H. F. Zhang, and L. V. Wang, “Portable real-timephotoacoustic microscopy,” Proc. SPIE 6437, 643727 (2007).
45. T. J. Allen and P. C. Beard, “Pulsed NIR laser diode excitationsystem for biomedical photoacoustic imaging,” Opt. Lett. 31,3462–3464 (2006).
46. M. Lamont and P. C. Beard, “2D imaging of ultrasound fieldsusing a CCD array to detect the output of a Fabry Perot poly-mer film sensor,” Electron. Lett. 42, 187–189 (2006).
47. B. T. Cox, S. R. Arridge, K. P. Kostli, and P. C. Beard, “2Dquantitative photoacoustic image reconstruction of absorptiondistributions in scattering media using a simple recursivemethod,” Appl. Opt. 45, 1866–1875 (2006).
1 February 2008 � Vol. 47, No. 4 � APPLIED OPTICS 577