Embed Size (px)
Citation preview
WESTERN CENTRAL ATLANTIC FISHERY COMMISSION
BACKGROUND DOCUMENTS FOR THE WORKSHOP ON INVESTING IN ECOSYSTEM-BASED SHRIMP AND GROUNDFISH FISHERIES MANAGEMENT OF THE GUIANAS – BRAZIL SHELF Barbados, 7–8 September 2015
FAO Fisheries and
Aquaculture Circular
SLC/FIAF/C1120 (En)
ISSN 2070-6065

FAO Fisheries and Aquaculture Circular No. 1120 SLC/FIAF/C1120 (En)
FOOD AND AGRICULTURE ORGANIZATION OF THE UNITED NATIONS Rome, 2017
BACKGROUND DOCUMENTS FOR THE WORKSHOP ON INVESTING IN ECOSYSTEM-BASED SHRIMP AND GROUNDFISH FISHERIES MANAGEMENT OF THE GUIANAS – BRAZIL SHELF Barbados, 7–8 September 2015
WESTERN CENTRAL ATLANTIC FISHERY COMMISSION

The designations employed and the presentation of material in this information product do not imply the expression of any opinion whatsoever on the part of the Food and Agriculture Organization of the United Nations (FAO) concerning the legal or development status of any country, territory, city or area or of its authorities, or concerning the delimitation of its frontiers or boundaries. The mention of specific companies or products of manufacturers, whether or not these have been patented, does not imply that these have been endorsed or recommended by FAO in preference to others of a similar nature that are not mentioned. The views expressed in this information product are those of the author(s) and do not necessarily reflect the views or policies of FAO. ISBN 978-92-5-109226-2 © FAO, 2017 FAO encourages the use, reproduction and dissemination of material in this information product. Except where otherwise indicated, material may be copied, downloaded and printed for private study, research and teaching purposes, or for use in non-commercial products or services, provided that appropriate acknowledgement of FAO as the source and copyright holder is given and that FAO’s endorsement of users’ views, products or services is not implied in any way. All requests for translation and adaptation rights, and for resale and other commercial use rights should be made via www.fao.org/contact-us/licence-request or addressed to [email protected]. FAO information products are available on the FAO website (www.fao.org/publications) and can be purchased through [email protected]

iii
PREPARATION OF THE DOCUMENT
This Circular presents the three background papers that were used as supporting documentation for the Workshop on investing in ecosystem-based shrimp and groundfish fisheries management of the Guianas – Brazil shelf, which was held in Barbados, from 7 to 8 September 2015 (Report available at www.fao.org/3/a-i5513b.pdf). The documents in this Circular are reproduced as submitted.
FAO. 2017. Background documents for the Workshop on investing in ecosystem-based shrimp and groundfish fisheries management of the Guianas – Brazil shelf, Barbados, 7–8 September 2015. FAO Fisheries and Aquaculture Circular No. 1120. Rome, Italy.
ABSTRACT
The Workshop on Investing in Ecosystem-based shrimp and groundfish fisheries management of the Guianas –Brazil shelf, was held in Barbados, on 7-8 September 2015. The Workshop was the 1st meeting of the joint Working Group on Shrimp and Groundfish of the Western Central Atlantic Fisheries Commission (WECAFC), Caribbean Regional Fisheries Mechanism (CRFM), and the French Research Institute for Exploitation of the Seas (IFREMER). The workshop discussed the status of the shrimp and groundfish stocks, investment options for shrimp and groundfish fisheries in the sub-region - which comprises Brazil, Venezuela, French Guiana, Guyana, Trinidad and Tobago and Suriname - and opportunities to harmonize fisheries management measures that would increase financial and environmental sustainability of the sector. The experts attending the workshop discussed three background documents on bioeconomic analysis of the fisheries, the current management arrangements as well as a proposal of investment plan for the shrimp and groundfish fisheries in the sub-region; all three documents are included in this volume. Based on these discussions, recommendations were made to increase collaboration in stock assessments of the fish and shrimp resources between the countries, to build capacity to carry out the necessary analyses in support of fisheries management decision making, to develop a regional plan of action to combat illegal, unreported and unregulated (IUU) fishing as well as a sub-regional shrimp and groundfish fishery management plan for the Northern Brazil-Guianas Shelf countries, to finalize a general investment plan and to assist the countries in conducting the necessary feasibility studies for the preparation of full-fledged, location specific fisheries investment proposals. The implementation of these recommendations are in line with the outcomes of the CLME+ project on “Catalysing Implementation of the Strategic Action Programme for the Sustainable Management of shared Living Marine Resources in the Caribbean and North Brazil Shelf Large Marine Ecosystems”. As a result, the CLME+ is an adequate support for the execution of a number of management and investment measures that were identified by the regional experts.

v
CONTENTS
CHAPTER I – BIOECONOMICS OF SHRIMP AND GROUNDFISH FISHERIES OF THE BRAZIL-GUIANAS SHELF 1
1. INTRODUCTION 1
2. REVIEW OF PREVIOUS BIOECONOMIC STUDIES 5
3. FISHERIES OF NORTHERN BRAZIL-GUIANAS SHELF ECOSYSTEM: TRENDS IN FLEET SIZES,CATCH AND CPUES 7
4. RESOURCE RENT OF FISHERIES OF NORTHERN BRAZIL-GUIANAS SHELF ECOSYSTEM 11
5. STOCK ASSESSMENT OF F. SUBTILIS AS SEPARATE AND SHARED STOCKS 21
6. BIOECONOMIC ANALYSIS OF THE MULTI-SPECIES SHRIMP FISHERY OFTHE BRAZIL-GUIANAS SHELF 25
CONCLUSIONS 30
RECOMMENDATIONS 32
REFERENCES 33
ANNEX I CATCH AND EFFORT DATA FOR THE SHRIMP FISHERY IN NBSLME 36
ANNEX II CATCH AND EFFORT DATA FOR THE SEABOB FISHERY IN NBSLME 44
ANNEX III CATCH AND EFFORT DATA FOR THE GROUNDFISH FISHERY IN SURINAME 48
CHAPTER II – REVIEW OF MANAGEMENT CONTROLS USED IN SHRIMP AND GROUNDFISH FISHERIES OPERATING ON THE BRAZIL-GUIANAS SHELF 49
1. INTRODUCTION 49
2. CONTROLS BEING APPLIED 49
3. CONTROLS NOT USED 52
4. CONTROL EFFECTIVENESS 54
5. DEVELOPING APPROPRIATE MANAGEMENT CONTROLS 55
6. MANAGEMENT STRATEGIES 56
APPENDIX 1 62
CHAPTER III – INVESTING IN ECOSYSTEM-BASED SHRIMP AND GROUNDFISH FISHERIES MANAGEMENT OF THE GUIANAS-NORTH BRAZIL CONTINENTAL SHELF 76
1. JUSTIFICATION AND OVERALL OBJECTIVE OF INVESTMENT COMPONENTS 76
2. KEY INVESTMENT COMPONENTS 77
3. CASE STUDIES 78
4. COUNTRY FISHERIES CHARACTERISTICS AND INVESTMENT NEEDS 78
5. THE WAY FORWARD 87
vi
ACKNOWLEDGEMENTS
We wish to express our gratitude to Dr Elizabeth Mohammed, Dr Loïc Baulier, Dr Fabian Blanchard, Ms Lara Ferreira and Ms Yolanda Babb-Echteld for their valuable comments and information to improve the draft version of the report. The authors wish to thank Mr Seion Richardson, Ms Dawn Maison, Mr Denzil Roberts and personnel of the fisheries departments from Guyana, Suriname, French Guiana and Brazil for their kind support in providing fisheries data and publications relevant to this study. We also appreciate the orientation and support of Mr Raymon Van Anrooy, and Mr Carlos Fuentevilla from FAO.
This Circular is a collation of background documents presented at the Workshop on investing in ecosystem-based shrimp and groundfish fisheries management of the Guianas - Brazil shelf, held in Barbados on 7–8 September 2015 (FAO Fisheries and Aquaculture Report No. 1125) in the framework of the Inter American Development Bank project on “Investing in ecosystem-based shrimp and groundfish fisheries management of the Guianas -Brazil Shelf”.

CHAPTER 1
BIOECONOMICS OF SHRIMP AND GROUNDFISH FISHERIES OF THE BRAZIL-GUIANAS SHELF
by
Juan Carlos Seijo, Alvaro Hernández, José Augusto Negreiros Aragão, Miguel A. Cabrera and Mario Yspol
1. INTRODUCTION
The valuable shrimp and groundfish resources of the study region are comprised within the highly productive North Brazil Shelf Large Marine Ecosystem (NBSLME) and the adjacent Gulf of Paria. The NBSLME extends along northeastern South America from the Parnaíba River estuary in Brazil to the boundary with the Caribbean Sea, and has a surface area of about 1.1 million km2. The North Brazil Shelf Large Marine Ecosystem owes its ecological identity to the hydrodynamics of this region driven by the North Brazilian Current, which is an extension of the South Equatorial Current and its prolongation, the Guyana Current. The shelf topography and external sources of material, particularly the Amazon River with its average discharge of 180 000 m3s-1, exert a significant influence on the marine ecosystem. This productivity is enriched by the discharge from other rivers such as Tocantins, Maroni, Corentyne, and Essequibo. The North Brazil Shelf LME is considered a Class I, highly productive ecosystem (>300 gCm-2yr-1) (Phillips 2007).
The shrimp resources in the Guianas–Brazil sub-region support one of the most important export oriented shrimp fisheries in the world. These resources include four of the larger penaeids (southern brown shrimp Farfantepenaeus subtilis, pink spotted shrimp F. brasiliensis, southern pink shrimp F. notialis and southern white shrimp L. schmitti) and the smaller seabob shrimp (Xiphopenaeus kroyeri), with their distribution and abundance differing amongst the countries in the region. In general, the brown shrimp, F. subtilis, is the more abundant species in the NBSLME (Ehrhardt 2001).
The groundfish resources such as red snapper (Lutjanus purpureus), weakfish (Cynoscion sp.), whitemouth croaker or corvine (Micropogonias furnieri) and sea catfish (Aridae) in the Guianas-Brazil shelf region are important for commercial and social reasons, with the red snapper probably being the most important groundfish in the region as its distribution range is throughout the region and it is mainly exported. The fisheries are multi-fleet, multi-gear, multispecies and multinational, using fishing methods that can be classified as industrial or artisanal depending on the level of mechanization (Booth et al. 2001).
On the other hand, the Gulf of Paria, is a 7 800 km2 inlet of the Caribbean Sea lying between the Venezuelan coast and Trinidad. One of the main fisheries in the area is the multi-species and multi-fleet shrimp fishery of the Gulf of Paria and Orinoco river delta, where Trinidad and Tobago and Venezuela share the stocks.
Responsible use of these resources requires an ecosystem approach to fisheries management to deal with the complexities of heterogeneous fleets harvesting shared stocks of a diversity of species (Phillips et al. 2009).
2
Shrimp and groundfish Fisheries of the North Brazil Shelf Large Marine Ecosystem (NBSLME)
The North Brazil Shelf Large Marine Ecosystem hosts the Exclusive Economic Zones (EEZ) of Guyana, Suriname, French Guiana and Northern Brazil. These countries harvest the main shrimp and groundfish species mentioned above with a diversity of fleet sizes. Characteristics of their main fisheries are summarized as follows (FAO 2000, 2001)
Guyana
Guyana has a coastline of 432 km and a continental shelf area of 48 665 km2. The average width of the continental shelf is 112.6 km, while the area of the EEZ is 138 240 km2. The living marine resources being exploited within the EEZ are mainly the demersal resources (shrimp and finfish) and to a limited extent, the pelagic resources over the continental shelf and towards the continental slope. The offshore industrial shrimp trawl fleet exploits mainly penaeids (F. subtilis, F. brasiliensis, F. notialis, L. schmitti). On the other hand, seabob Xiphopenaeus kroyeri is caught by the seabob/finfish trawl fleet. Nematopalaemon schmitti is also caught seasonally to a lesser extent as incidental catch in the seabob/finfish fishery. The Chinese seine vessels of the inshore artisanal fleet exploit both X. kroyeri and N. schmitti. Concerning crew sizes, penaeid shrimp trawl vessels usually have a crew of 5, while seabob vessels and finfish vessels carry 5 to 6 and 4 to 5 crewmembers respectively. Chinese seine vessels carry 2 to 4 crew. More than 95 percent of the penaeids shrimp harvested are exported, primarily to the U.S.A. and smaller amounts to Japan, Canada and CARICOM countries. Approximately 90 percent of the seabob is exported, primarily to the U.S.A. and smaller amounts to CARICOM countries.
Suriname
Suriname has a coastline of 380 km and a continental shelf area of 54 550 km2. Suriname shrimp stock is exploited over the entire EEZ (an area of 128 318 km2) in the depth range from 20 to 90 m. There are three main fishing areas, namely, the “Western Grounds” between 40 to 90 m in the western part of the EEZ; the “Middle Grounds” between 25 and 40 m off the central EEZ; and the “Puw Patch” between 30 and 80 m in the eastern part of the EEZ. The catch per unit of effort of Farfantepenaeus spp., for the period 1998-2013, shows a slight decrease in stock abundance. For the same period, mean CPUE was 19.8 ton with a corresponding standard deviation of 4.3 ton. This situation seems to indicate that the expected stock recovery from systematic reduction in fishing effort of the industrial Surinamese shrimp fleet (from 119 shrimp trawlers in 1994 to 30 in 2012) is not occurring, and is likely of being offset either by: (a) increasing fishing mortality by other shrimp fleets in the region harvesting the spawning stock of main species harvested (F. subtilis, F. brasiliensis, F. notialis, and L. schmitti) in the Brazil-Guianas shelf, (b) increasing fishing mortality of juveniles of these species caught in estuaries and coastal lagoons by artisanal boats in Suriname and neighboring countries, and (c) changes in the carrying capacity of the benthic habitat of these species (Seijo 2013).
Concerning Suriname groundfish fishery, in 2011 this multi-species fishery harvested 45 finfish species and mollusks like squids. From these, 10 species accounted for 80 percent of the harvest in order of their contribution: green weakfish (Cynoscion virescens), grey snapper (Lutjanus griseus), whitemouth croaker (Micropogonias furnieri), grunts (Haemulon spp.), lane snapper (Lutjanus synagris), barracuda (Sphyraena barracuda), jamaica weakfish (Cynoscion jamaicensis), largehead hairtail (Trichiurus lepturus), mackerel (Scomberomorus spp.), king weakfish (Macrodon ancylodon). An analysis of this fishery, indicates that overall CPUE for this fishery is fairly stable with a mean of 1.73 ton/day at sea for the 1998-2011 period. However, looking at species specific CPUE, lane
3
snapper (Lutjanus synagris) which provided the largest catch per day at sea in 1998 (498 kg/day) is currently yielding 103 kg/day. This indicates a reduction of 79 percent in its CPUE index of abundance. It should be mentioned that the species non-discriminatory nature of trawling gear could also have serious effects of less resilient species and therefore their indices of abundance (CPUE) should be monitored over time (Seijo 2013). Concerning the seabob Xiphopenaeus kroyeri fishery,
catch per unit of effort (catch per trawler per day at sea) seem to be gradually declining from 3.21 ton
per day at sea in 1998 to 1.84 ton per day at sea in 2012, and a signal of stock recovery in 2013 with 2.25 ton per day at sea. Current catch per unit of effort is above the trigger CPUE point of 1.48 ton per day at sea. In this Marine Stewardship Council (MSC) certified fishery, effort restrictions are managed through a Harvest Control Rule (HCR).
On the other hand, catch per unit of effort of the main species harvested by the Venezuelan fleet
indicates that the most abundant of the species (Lutjanus purpureus) shows a reduction of 35 percent
in CPUE in the last five years. This signal calls for detailed follow up of this fishery to avoid over-exploitation of the snapper stocks of Suriname.
French Guiana
French Guiana has a 130 000 km² Exclusive Economic Zone (EEZ) with a 350 km coastline, including 50 000 km² of continental shelf. It borders in the west Suriname and in the east Brazil. The continental shelf of French Guiana is a tropical ecosystem under the influence of the Amazon estuary, as is the entire North Brazil Shelf Large Marine Ecosystem (LME), which has a high level of biodiversity (Cissé et al. 2014).
The entire shelf of French Guiana is exploited for shrimp, using various fishing strategies. The area most exploited is between the 30m and 90m isobaths. A regulation forbids trawling within 30m. The main shrimp species exploited on the continental shelf is F. subtilis, with its landings representing nearly 95 percent of the total shrimp landings of the area. The other species landed is F. brasiliensis, which is not separated in landings, but its proportion is estimated from market samples. The abundance of F. subtilis in French Guiana is significant relative to the abundance estimated in Guyana and Suriname (Erhardt 2001). Seasonally, the best catches occur from December to May during the wet season. From 1979 to 1990, the fishery was exploited by French, US and Japanese companies. The landings of the various species of shrimps were exported head-less to US and Japan. Following the naturalisation of the fishery under the French flag due to the extension of the EEZ area, the new market in European mainland was mainly for small shrimp as well as the larger sizes, but always whole. All the shrimps are processed at sea and packaged frozen. There is no targeted fishery for X. kroyeri, which is still landed as by-catch of the larger penaeid shrimps fishery. Besides, some fixed gear operations in the estuaries catch this shrimp and sell the landings on the local market. The trawl fishery has been controlled by a total allowable catch (TAC) system implemented by the European Union (EU) and since 1992, by a local license system fixing the maximum number of trawlers allowed to exploit the stock. French Guiana fishing firms enter a period of economic difficulties in 1990´s with a total debt up to 195 million French francs in 1990 (Béné and Moguedet 1996). In 1993 three fishing firms were closed, and from 1993 to 2006 the fleet followed a decreasing trend, due to ecological, economic and institutional factors (Chaboud 2008).
4
Northern Brazil
The Exclusive Economic Zone of Brazil in the Northern Brazil Shelf Large Marine Ecosystem (NBSLME) covers an area of 992 523 km2, and the shelf area of 466 907 km2 (Sea Around Us 2015). The shrimp fishery in northern Brazil is one of the most important fisheries in the country. The main fishing area is located between the mouth of the Parnaiba River and the border of French Guiana, along the coast of the States of Maranhão, Pará and Amapá. Fishers use artisanal, small-scale and industrial vessels, outfitted with trawls (puca-de-arrastro or guizo), cast nets (tarrafa) and fixed traps (zangaria). The main species caught are Farfantepenaues subtilis, L. schmitti and Xiphopenaeus kroyeri. The small-scale fishery is concentrated in the Maranhão area, where small, motorised trawlers (7 to 11 m) are commonly used to catch X. kroyeri and L. schmitti (Aragão and Silva 2000). The products from these fisheries are sold locally or exported to other States in Brazil. In the past, many foreign trawlers have operated in Brazilian waters under international fishing agreements, but this ended in 1978. Since then, only national vessels or Brazilian flag vessels under leasing agreements have operated in the area. From 1985, the Brazilian government has been doing away with the leasing agreements, which led to some vessels being incorporated into the national fleet. The leasing agreement arrangements ceased before the end of the 1980s. Most of the industrial vessels operating in the shrimp fisheries in the north coast of Brazil are based in Belem/Macapa (159), in the States of Pará/Amapá. Some vessels are based in Fortaleza and Camocim, in the State of Ceará and others in Parnaiba, State of Piaui. In general, the trawlers are the Tampa/Florida type, made of steel and ranging from 19 to 25m. They are powered by 235 to 540HP engines and operate double rigged trawls. In 1994, using data from the States of Pará and Ceará, an average of six trips per vessel per year was determined, with each trip lasting about 36 days. The crew is generally made up of 5 fishers, but a few larger vessels may have a crew of 6. The best shrimp yields used to be obtained from February to November, but over the last two years the trawlers have been getting good catches all year round. The shrimp caught by the industrial fishery are frozen mainly with head-off, with some processed as whole shrimp on-board vessel. Most of the processed shrimp tails are exported to the USA and Japan, with the whole shrimp being exported mainly to Japan. A study in 2009 (Paiva et al. 2009), showed that for the shrimp fishery in northern Brazil the bycatch had a ratio of 4.1 kg of total bycatch or 2.1 kg bycatch usable per one kg of head on shrimp.
This study reviews the existing contributions to bioeconomic analysis of the shrimp and ground fisheries of the Brazil-Guianas shelf, updates a recent shrimp study of the Gulf of Paria and Orinoco river delta (Seijo and Ferreira 2013) and assess the bioeconomic performance of shrimp fisheries of Guyana, Suriname, French Guiana and Brazil. Five research/management questions were addressed in this study: (i) what is the landed value and resource rent generated by shrimp, seabob and groundfish fisheries of the Brazil-Guianas shelf ecosystem? (ii) are stocks of the main species harvested (F. subtilis) shared by countries with EEZ´s in the NBSLME?, (iii) what is the current bioeconomic performance of fisheries targeting shrimp resources in the Brazil-Guianas shelf?, and (iv) what are the levels of effort required to operate in maximum economic yield and maximum sustainable yield of shrimp fisheries?, and (v) what is the biomass level at which shrimp fleets of specific countries would have exhausted the economic rent generated by the resource?
To answer the above mentioned questions, within a data limited situation, the following steps were undertaken: (i) a characterization of the NBSLME shrimp, seabob and groundfish fisheries and review of existing bioeconomic studies in the region, (ii) a review of available data to estimate biologic and economic parameters for the shrimp Farfantepenaeus spp. and seabob (Xiphopenaeus kroyeri) fisheries of the NBSLME, (iii) testing of the shared shrimp stocks (i.e. F. subtilis) hypothesis based on index of abundance, (iv) calculation of landed value of shrimp, seabob and groundfish fisheries of the
5
Brazil-Guianas shelf ecosystem, (v) calculation of resource rent for the shrimp, seabob, and groundfish fisheries, (vi) analytic calculation of equations for determining bioeconomic reference points of single and the shared stock fisheries in the region including their bycatch, (vii) current bioeconomic performance of fleets targeting shrimp stocks in the study region with respect to target reference points, and (viii) conclusions and recommendations emerging from this study.
2. REVIEW OF PREVIOUS BIOECONOMIC STUDIES
Since 1986, four workshops on the Biological and Economic Modeling of the Shrimp Resources of the Guiana-Brazil Shelf have been organized by the Food and Agriculture Organization of the United Nations (FAO) under the Western Central Atlantic Fishery Commission (WECAFC), as well as the four annual Stock Assessment Workshops on the Shrimp and Groundfish Resources of the Guiana-Brazil Shelf organized by FAO, DANIDA, NORAD and CFRAMP since 1997. The initial focus was on biological assessments of the shrimp and groundfish fisheries, and in the 1999 and 2000 workshops bioeconomic analyses were conducted to address specific management issues regarding these fisheries. Studies conducted up to 2012, including those completed under the FAO/WECAFC Shrimp and Groundfish Working Group, indicate full or over-exploitation of targeted species as well as incidental captures (Alió et al. 1999a,b; Soomai et al. 1999; Lum Young et al. 1992; Manickchand-Heileman and Kenny 1990). Over-capitalization is also evident in the trawl fishery (Ferreira 1998; Ferreira and Maharaj 1993; Seijo et al. 2000; Soomai and Seijo 2000). Recent bioeconomic studies were undertaken, within the CLME/FAO project, for the shrimp fishery of Northern Brazil (Aragão et al. 2013), and the shared shrimp stock between Trinidad and Tobago and Venezuela in Gulf of Paria (Seijo and Ferreira 2013).
2.1 Main conclusions and recommendations of recent bioeconomic studies in the region:
The northern Brazil bioeconomic study for the shrimp (F. subtilis) fishery (Aragão et al. 2013)
The study reports the results of the evaluation of different scenarios on the "status" of the population estimated from the length composition of the population in the year 2000. The results refer to the yield in weight (catches) and “present value” of the fishery (net income) in the three years following the year of reference. The results present projections of the bioeconomic performance (yield, profits, net present value) for recruitment levels of 50, 80 and 110 million as possible states of nature. The authors found that the yield in weight of the fishery increases were more related to higher level of recruitment than to increases in the level of fishing effort. For the same level of recruitment, significant increases of the yield of the fishery in weight are not observed for levels of fishing effort beyond 18 thousand days at sea. The authors show that profits are obtained in the fishery, even if small, for the three years, for any level of recruitment, only for a level of fishing effort corresponding to 8 thousand days at sea. For moderate recruitment levels (R-80 and R-110) the profitability of the fishery is positive up to the level of fishing effort of 18 to 20 thousand days at sea. However, even for very high recruitment levels (R-140) fishery income becomes negative in the case of fishing effort levels above 28 thousand days at sea. The results obtained here are somewhat consistent with the estimated maximum sustainable effort obtained by the biomass dynamic model. It is, therefore, recommended that the maximum fishing effort being applied should not exceed 18 000 days at sea (das), therefore lower than the level estimated (30 567 days at sea) in the previous bioeconomic analysis carried out by Aragão and Silva (2000).
6
The Gulf of Paria shrimp fishery shared by Trinidad y Tobago and Venezuela (Seijo and Ferreira 2013)
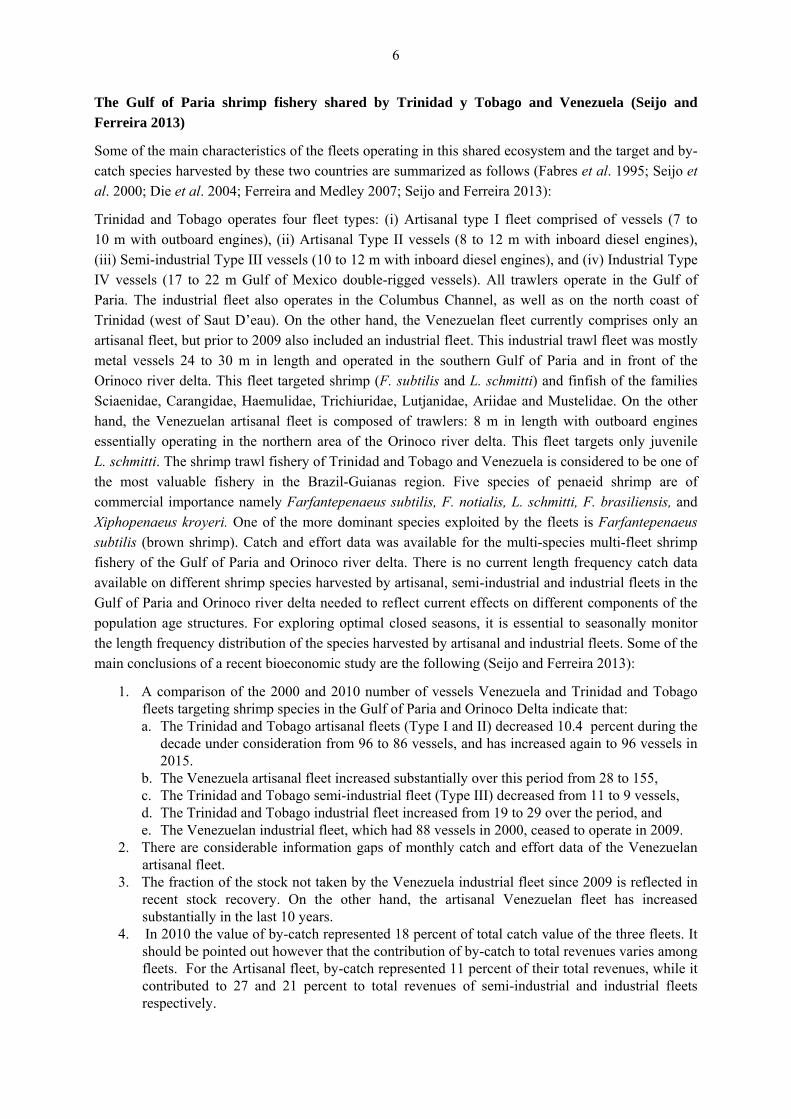
Some of the main characteristics of the fleets operating in this shared ecosystem and the target and by-catch species harvested by these two countries are summarized as follows (Fabres et al. 1995; Seijo et al. 2000; Die et al. 2004; Ferreira and Medley 2007; Seijo and Ferreira 2013):
Trinidad and Tobago operates four fleet types: (i) Artisanal type I fleet comprised of vessels (7 to 10 m with outboard engines), (ii) Artisanal Type II vessels (8 to 12 m with inboard diesel engines), (iii) Semi-industrial Type III vessels (10 to 12 m with inboard diesel engines), and (iv) Industrial Type IV vessels (17 to 22 m Gulf of Mexico double-rigged vessels). All trawlers operate in the Gulf of Paria. The industrial fleet also operates in the Columbus Channel, as well as on the north coast of Trinidad (west of Saut D’eau). On the other hand, the Venezuelan fleet currently comprises only an artisanal fleet, but prior to 2009 also included an industrial fleet. This industrial trawl fleet was mostly metal vessels 24 to 30 m in length and operated in the southern Gulf of Paria and in front of the Orinoco river delta. This fleet targeted shrimp (F. subtilis and L. schmitti) and finfish of the families Sciaenidae, Carangidae, Haemulidae, Trichiuridae, Lutjanidae, Ariidae and Mustelidae. On the other hand, the Venezuelan artisanal fleet is composed of trawlers: 8 m in length with outboard engines essentially operating in the northern area of the Orinoco river delta. This fleet targets only juvenile L. schmitti. The shrimp trawl fishery of Trinidad and Tobago and Venezuela is considered to be one of the most valuable fishery in the Brazil-Guianas region. Five species of penaeid shrimp are of commercial importance namely Farfantepenaeus subtilis, F. notialis, L. schmitti, F. brasiliensis, and Xiphopenaeus kroyeri. One of the more dominant species exploited by the fleets is Farfantepenaeus subtilis (brown shrimp). Catch and effort data was available for the multi-species multi-fleet shrimp fishery of the Gulf of Paria and Orinoco river delta. There is no current length frequency catch data available on different shrimp species harvested by artisanal, semi-industrial and industrial fleets in the Gulf of Paria and Orinoco river delta needed to reflect current effects on different components of the population age structures. For exploring optimal closed seasons, it is essential to seasonally monitor the length frequency distribution of the species harvested by artisanal and industrial fleets. Some of the main conclusions of a recent bioeconomic study are the following (Seijo and Ferreira 2013):
1. A comparison of the 2000 and 2010 number of vessels Venezuela and Trinidad and Tobago fleets targeting shrimp species in the Gulf of Paria and Orinoco Delta indicate that: a. The Trinidad and Tobago artisanal fleets (Type I and II) decreased 10.4 percent during the
decade under consideration from 96 to 86 vessels, and has increased again to 96 vessels in 2015.
b. The Venezuela artisanal fleet increased substantially over this period from 28 to 155, c. The Trinidad and Tobago semi-industrial fleet (Type III) decreased from 11 to 9 vessels, d. The Trinidad and Tobago industrial fleet increased from 19 to 29 over the period, and e. The Venezuelan industrial fleet, which had 88 vessels in 2000, ceased to operate in 2009.
2. There are considerable information gaps of monthly catch and effort data of the Venezuelan artisanal fleet.
3. The fraction of the stock not taken by the Venezuela industrial fleet since 2009 is reflected in recent stock recovery. On the other hand, the artisanal Venezuelan fleet has increased substantially in the last 10 years.
4. In 2010 the value of by-catch represented 18 percent of total catch value of the three fleets. It should be pointed out however that the contribution of by-catch to total revenues varies among fleets. For the Artisanal fleet, by-catch represented 11 percent of their total revenues, while it contributed to 27 and 21 percent to total revenues of semi-industrial and industrial fleets respectively.
7
5. In 2010, calculated total value of shrimp catch and by-catch of the artisanal, semi-industrial and industrial fleets of Trinidad and Tobago was 5.7 million US$.
6. Concerning seasonal and annual profits of the Trinidad and Tobago fleets, a significant difference is observed between the month where highest profits are obtained by the artisanal fleet (mode: August) against the month of highest profits of the semi-industrial and industrial fleets (mode: March). The intra-annual profits distributions tend to express the sequential nature of artisanal/industrial shrimp fisheries.
7. Results from the bioeconomic model built for the multi-species multi-fleet shrimp fishery of Venezuela and Trinidad and Tobago and the decision table analysis indicate that effort of each of the fleets should not be expanded further.
8. With the absence of the Venezuela industrial fleet, the fishery seems to be operating in the neighborhood of Bmsy, in spite of substantial increase in the Venezuelan artisanal fleet in recent years.
9. Decision tables applying risk averse criteria indicate that to cope with climate change, effort levels of artisanal fleets should be reduced towards maximum economic yield levels to maintain biomass and profits away from risky levels which could result from the effects of climate change and other possible natural and anthropogenic activities, affecting population growth parameters.
3. FISHERIES OF NORTHERN BRAZIL-GUIANAS SHELF ECOSYSTEM: TRENDS IN FLEET SIZES, CATCH AND CPUES
In order to undertake the bioeconomic analysis of the Brazil-Guianas fisheries it is necessary to review the trend in catch and catch per unit of effort of main species harvested in this ecosystem. Catch and effort data for the shrimp, seabob and groundfish fisheries in the region were obtained from reported country fisheries statistics, and updated to 2013 by fisheries scientists and officers of the participating countries of the FAO-WECAFC shrimp (Annex I, tables 12-19), seabob (Annex II, tables 20-23) and groundfish fisheries (Annex III, tables 25-25) working group.
3.1 Catch and CPUE of shrimp species caught in the NBSLME
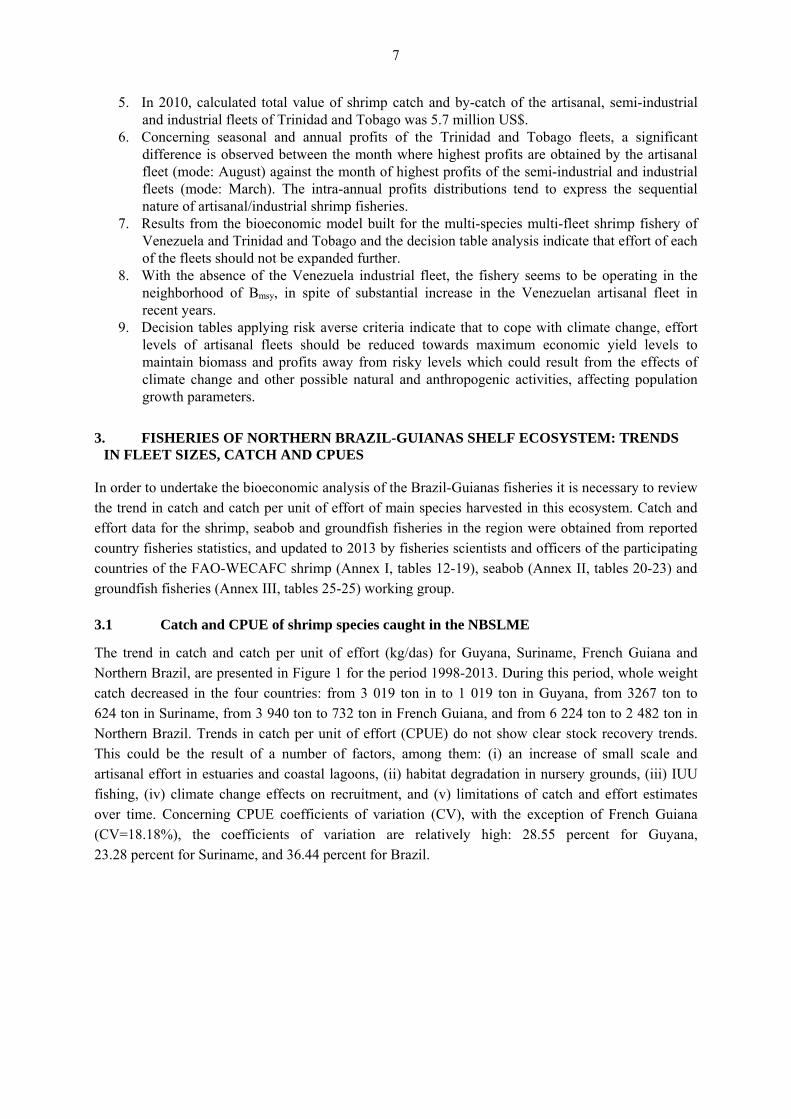
The trend in catch and catch per unit of effort (kg/das) for Guyana, Suriname, French Guiana and Northern Brazil, are presented in Figure 1 for the period 1998-2013. During this period, whole weight catch decreased in the four countries: from 3 019 ton in to 1 019 ton in Guyana, from 3267 ton to 624 ton in Suriname, from 3 940 ton to 732 ton in French Guiana, and from 6 224 ton to 2 482 ton in Northern Brazil. Trends in catch per unit of effort (CPUE) do not show clear stock recovery trends. This could be the result of a number of factors, among them: (i) an increase of small scale and artisanal effort in estuaries and coastal lagoons, (ii) habitat degradation in nursery grounds, (iii) IUU fishing, (iv) climate change effects on recruitment, and (v) limitations of catch and effort estimates over time. Concerning CPUE coefficients of variation (CV), with the exception of French Guiana (CV=18.18%), the coefficients of variation are relatively high: 28.55 percent for Guyana, 23.28 percent for Suriname, and 36.44 percent for Brazil.
8
FIGURE 1
Whole weight catch (ton), and catch per unit of effort (CPUE) of shrimp Fisheries of Guyana, Suriname, French Guiana and Northern Brazil.
Catch (ton) CPUE (kg/das)

9
Trends in the number of shrimp trawlers in the study region.
One of the main factors of this reduction in catch has been the deliberate exit of vessels in all four countries during this period. Exit of vessels could have been the result of the fact that the cost of fishing has been affected in the region, like in many areas of the world, by increasing oil and gas prices for the period of consideration in this study. In addition, the decreasing international shrimp prices during the 2000-2007 period (MSU 2015) contributed also to low or negative resource rents contributing to foster vessel exit from the fisheries.
Figure 2, shows the trend in the number of trawlers participating in the shrimp fishery. The number of trawlers in Northern of Brazil was 135 in 1998 and have decreased to 60 in 2013, a reduction of 56 percent. Suriname from 109 to 23 trawlers in the same period, a reduction of 79 percent. Guyana from 73 to 30, a reduction of 59 percent, and French Guiana from 58 to 12 in the same period, a reduction of 79 percent of their trawlers (Figure 3).
FIGURE 2
Trends in the number of shrimp trawlers in the study region.
FIGURE 3
Trends in the number of shrimp trawlers in the study region (1998-2013)
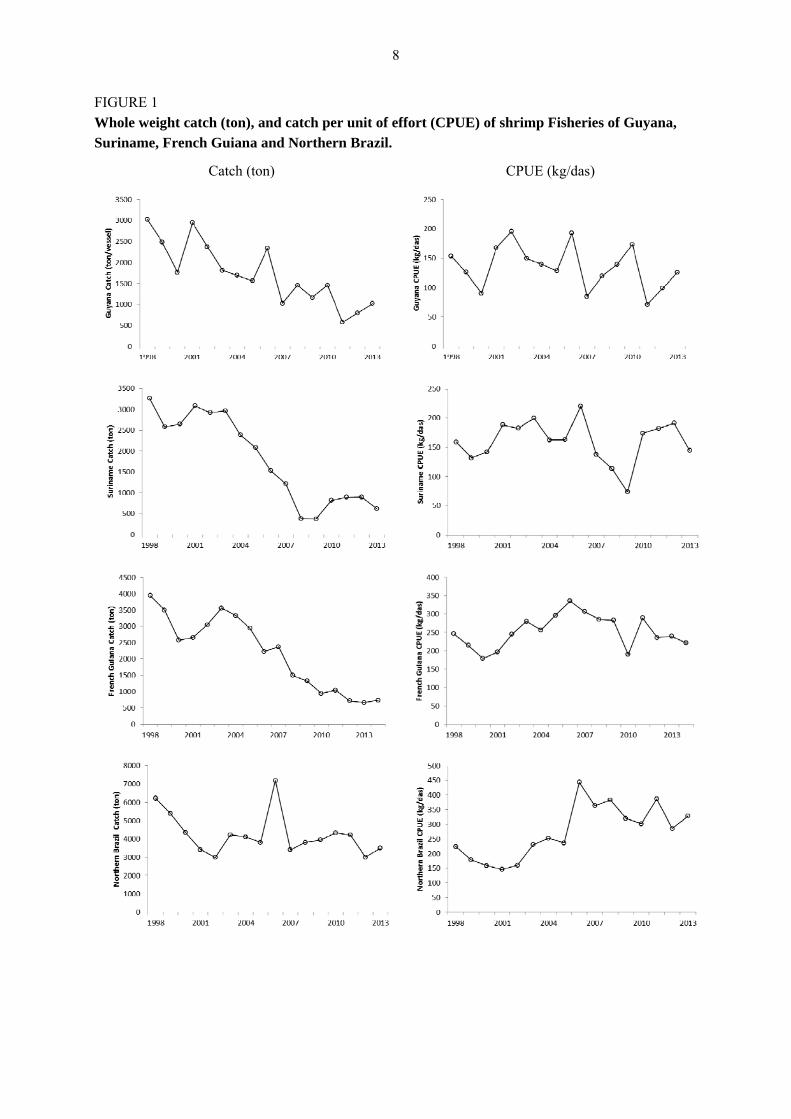
Concerning whole weight catch per unit of effort (kg/das), of vessels targeting shrimp fisheries in the four countries sharing the NBSLME, Figure 4 show similar values for Guyana and Suriname on one hand and similar orders of magnitude for the fleets of French Guiana and Northern Brazil.
10
FIGURE 4
Comparison of CPUE of the four fleets targeting shrimp species: index of relative abundance.
3.2 Value of shrimp species and bycatch landed in the Northern Brazil-Guianas shelf ecosystem
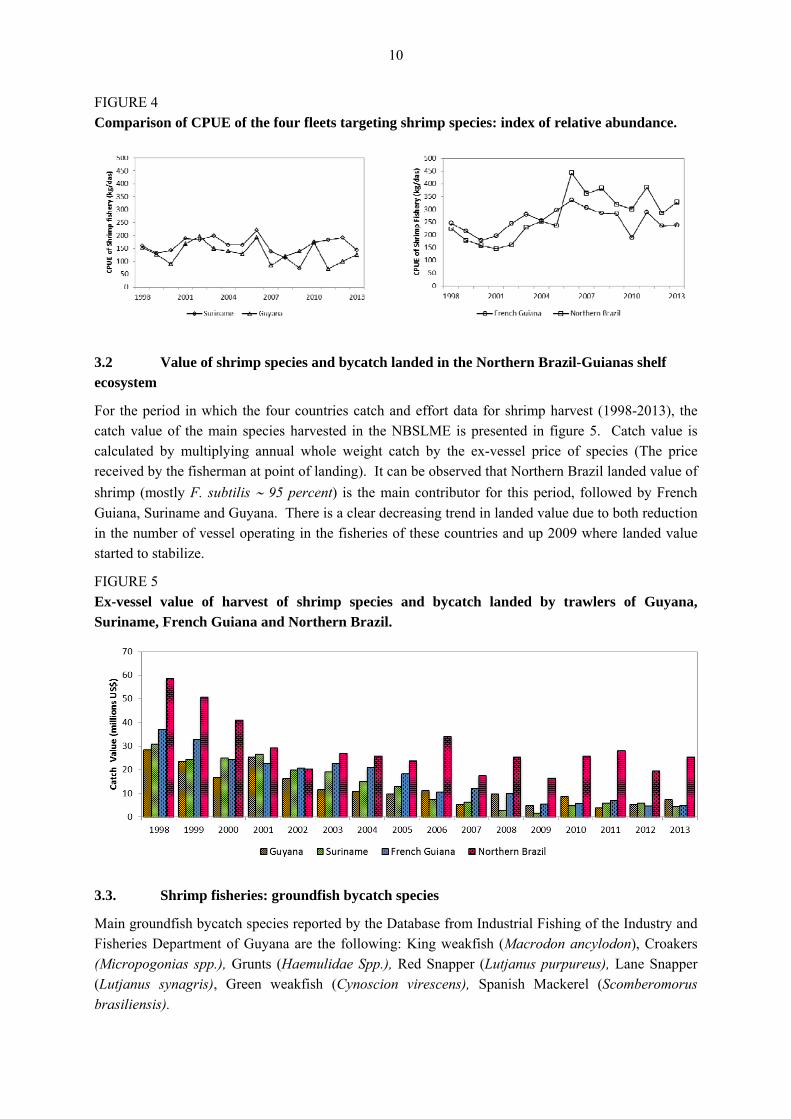
For the period in which the four countries catch and effort data for shrimp harvest (1998-2013), the catch value of the main species harvested in the NBSLME is presented in figure 5. Catch value is calculated by multiplying annual whole weight catch by the ex-vessel price of species (The price received by the fisherman at point of landing). It can be observed that Northern Brazil landed value of
shrimp (mostly F. subtilis 95 percent) is the main contributor for this period, followed by French
Guiana, Suriname and Guyana. There is a clear decreasing trend in landed value due to both reduction in the number of vessel operating in the fisheries of these countries and up 2009 where landed value started to stabilize.
FIGURE 5
Ex-vessel value of harvest of shrimp species and bycatch landed by trawlers of Guyana, Suriname, French Guiana and Northern Brazil.
3.3. Shrimp fisheries: groundfish bycatch species
Main groundfish bycatch species reported by the Database from Industrial Fishing of the Industry and Fisheries Department of Guyana are the following: King weakfish (Macrodon ancylodon), Croakers (Micropogonias spp.), Grunts (Haemulidae Spp.), Red Snapper (Lutjanus purpureus), Lane Snapper (Lutjanus synagris), Green weakfish (Cynoscion virescens), Spanish Mackerel (Scomberomorus
brasiliensis).
11
Main groundfish bycatch species reported by the Fisheries Department of Suriname include the following: Tonkin weakfish (Cynoscion similis), Southern Red Snapper (Lutjanus purpureus), Vermilion snapper (Rhomboplites aurorubens), White mullet (Mugil curema), Lebranche mullet (M. liza), Bonnetmouths (Inermiidae spp), Sea bream (Bramidae spp), Flounder (Apionichthys
dumerili).
Main groundfish bycatch species reported for northern Brazil by Paiva et al. (2009) include the following: King weakfish (Macrodon ancylodon), Croakers (Cynoscion striatus, Micropogonias furnieri, M. undulates, Nebris microps), look down (Selene vomer), Caribbean moonfish (Selene brownie), Sea catfish (Arius spp.), Spanish mackerel (Scomberomorus brasiliensis), Lane snapper (Lutjanus Synagris), seabob (Xiphopenaeus kroyeri), Snappers (Lutjanus spp.), horse eye jack (Caranx latus), Mullets (Mullus spp.)
3.4 Seabob fisheries of Guyana and Suriname: groundfish bycatch species
Main bycatch species reported by the Database from Industrial Fishing of the Industry and Fisheries Department of Guyana are the following: King weakfish (Macrodon ancylodon), Croakers (Micropogonias spp.), Smalleye croaker (Nebris Microps), Green weakfish (Cynoscion virescens), Grey Snapper (Centropomus spp.).
Main bycatch species reported by the Fisheries Department of Suriname include the following: Smalleye croaker (Nebris microps), King weakfish (Macrodon ancylodon), Green weakfish (Cynoscion virescens), Shorthead drum (Larimus breviceps), Bressou sea catfish (Aspistor quadriscutis), Coco sea catfish (Bagre bagre), Atlantic tripletail (Lobotes surinamensis), Whitemouth croaker (Micropogonias furnieri), Rake stardrum (Stellifer rastrifer/S. microps), Blackfin croaker (Lonchurus elegans).
4. RESOURCE RENT OF FISHERIES OF NORTHERN BRAZIL-GUIANAS SHELF ECOSYSTEM
For the same period of time (1998-2013), the resource rent generated by shrimps species in the Guianas-Brazil ecosystem, was calculated by multiplying the catch (whole weight) by an ex-vessel average price (MSU, 2015), plus the ex-vessel value of groundfish landed minus the annual operating cost of shrimp trawlers of each of the countries, minus the opportunity cost of capital of each trawler.
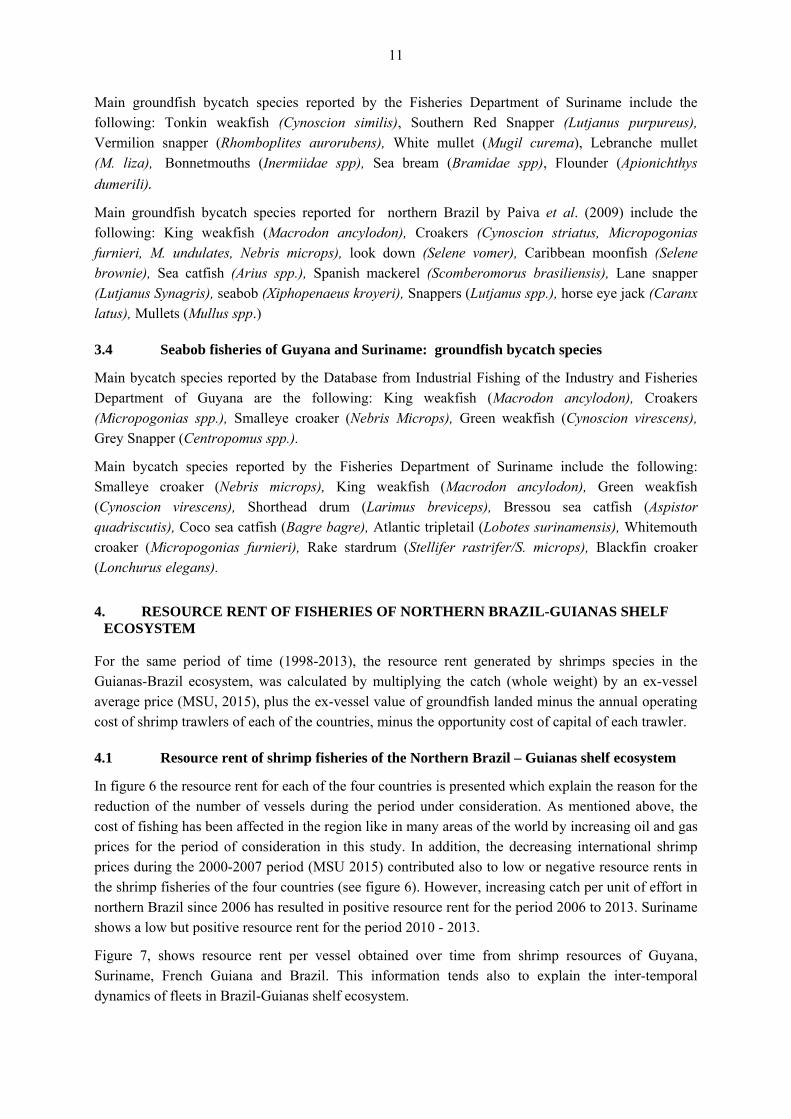
4.1 Resource rent of shrimp fisheries of the Northern Brazil – Guianas shelf ecosystem
In figure 6 the resource rent for each of the four countries is presented which explain the reason for the reduction of the number of vessels during the period under consideration. As mentioned above, the cost of fishing has been affected in the region like in many areas of the world by increasing oil and gas prices for the period of consideration in this study. In addition, the decreasing international shrimp prices during the 2000-2007 period (MSU 2015) contributed also to low or negative resource rents in the shrimp fisheries of the four countries (see figure 6). However, increasing catch per unit of effort in northern Brazil since 2006 has resulted in positive resource rent for the period 2006 to 2013. Suriname shows a low but positive resource rent for the period 2010 - 2013.
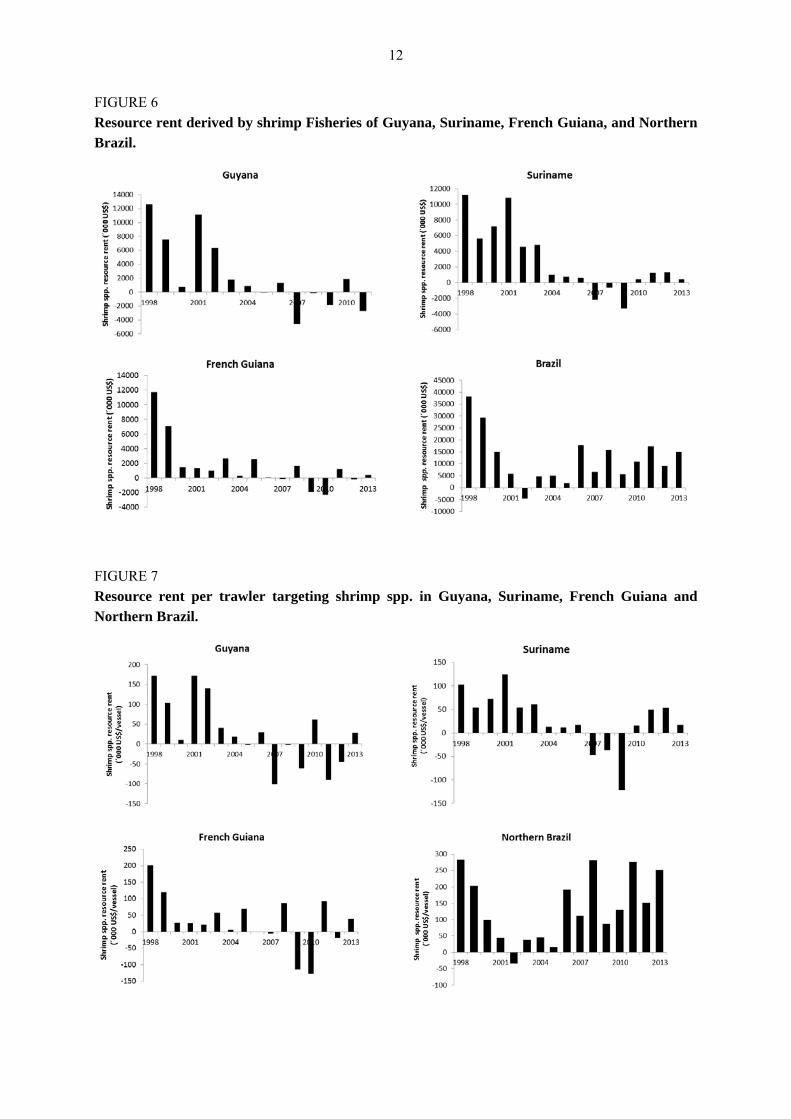
Figure 7, shows resource rent per vessel obtained over time from shrimp resources of Guyana, Suriname, French Guiana and Brazil. This information tends also to explain the inter-temporal dynamics of fleets in Brazil-Guianas shelf ecosystem.
12
FIGURE 6
Resource rent derived by shrimp Fisheries of Guyana, Suriname, French Guiana, and Northern Brazil.
FIGURE 7
Resource rent per trawler targeting shrimp spp. in Guyana, Suriname, French Guiana and Northern Brazil.
13
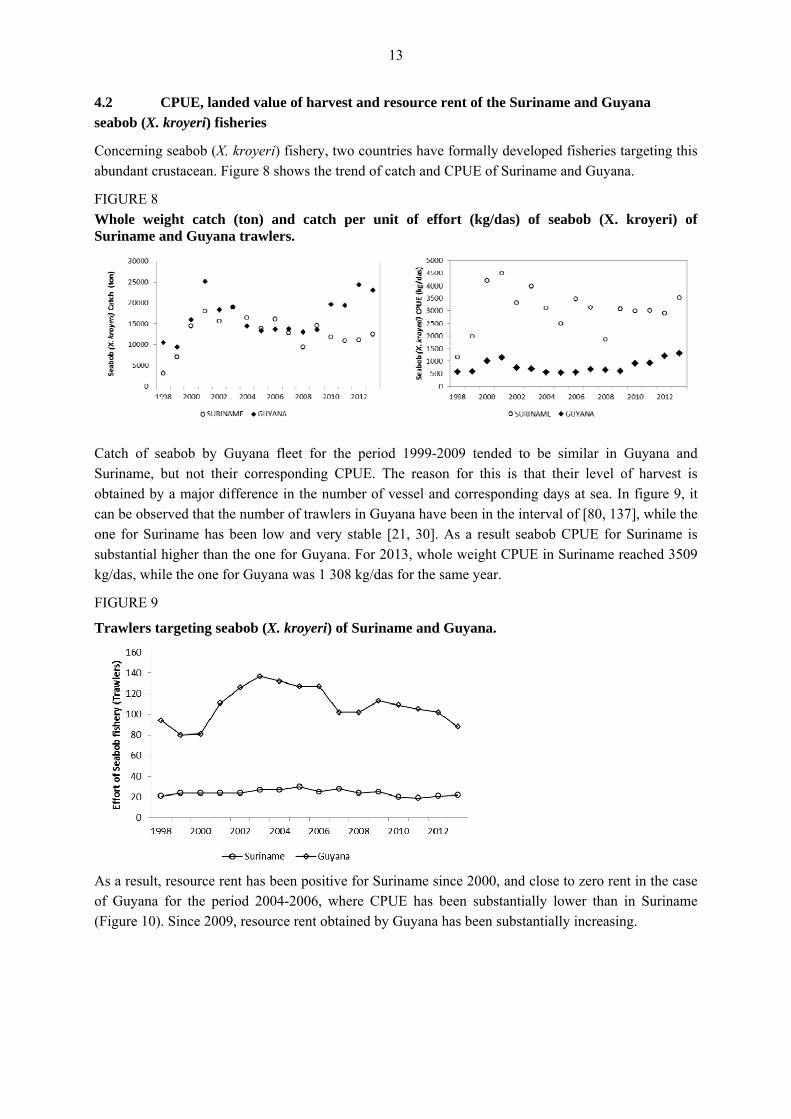
4.2 CPUE, landed value of harvest and resource rent of the Suriname and Guyana seabob (X. kroyeri) fisheries
Concerning seabob (X. kroyeri) fishery, two countries have formally developed fisheries targeting this abundant crustacean. Figure 8 shows the trend of catch and CPUE of Suriname and Guyana.
FIGURE 8
Whole weight catch (ton) and catch per unit of effort (kg/das) of seabob (X. kroyeri) of Suriname and Guyana trawlers.
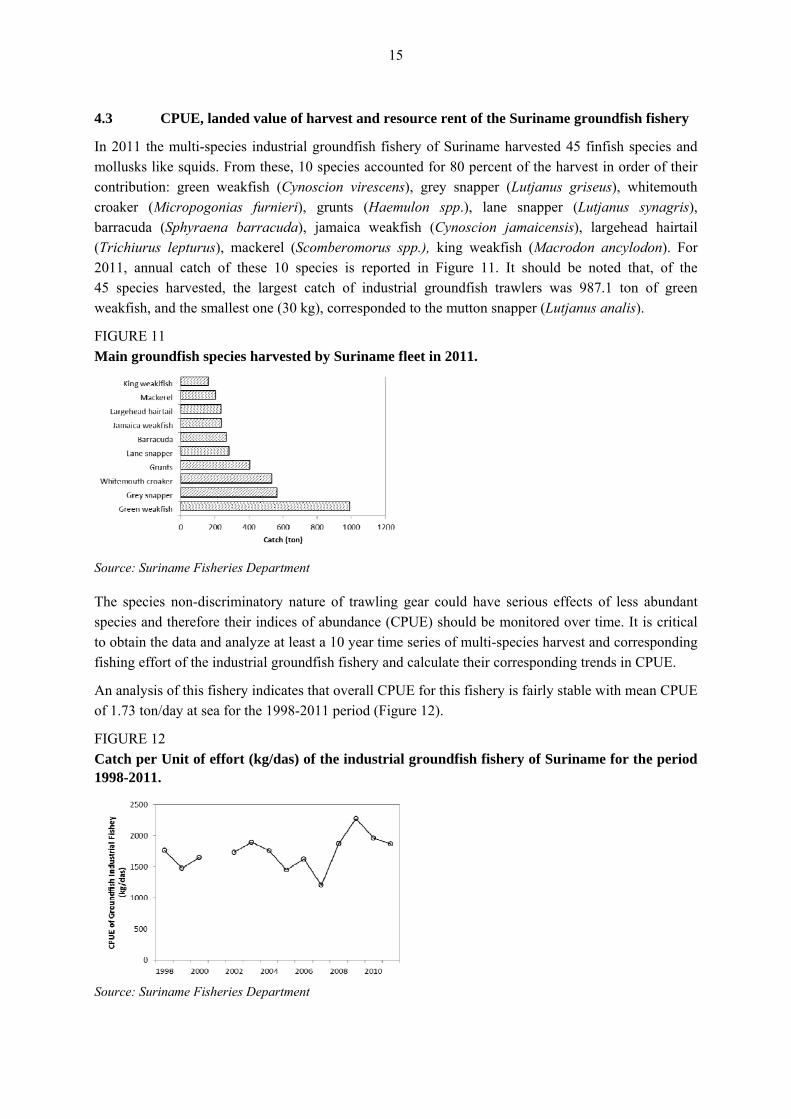
Catch of seabob by Guyana fleet for the period 1999-2009 tended to be similar in Guyana and Suriname, but not their corresponding CPUE. The reason for this is that their level of harvest is obtained by a major difference in the number of vessel and corresponding days at sea. In figure 9, it can be observed that the number of trawlers in Guyana have been in the interval of [80, 137], while the one for Suriname has been low and very stable [21, 30]. As a result seabob CPUE for Suriname is substantial higher than the one for Guyana. For 2013, whole weight CPUE in Suriname reached 3509 kg/das, while the one for Guyana was 1 308 kg/das for the same year.
FIGURE 9
Trawlers targeting seabob (X. kroyeri) of Suriname and Guyana.
As a result, resource rent has been positive for Suriname since 2000, and close to zero rent in the case of Guyana for the period 2004-2006, where CPUE has been substantially lower than in Suriname (Figure 10). Since 2009, resource rent obtained by Guyana has been substantially increasing.

14
FIGURE 10
Landed value and resource rent generated by seabob (X. kroyeri) to fleets of Suriname and Guyana during the period 1998-2013.
In this Marine Stewardship Council (MSC) certified fishery (Southall et al. 2011), effort restrictions are managed through a Harvest Control Rule (HCR). With the current management strategy, catch per unit of effort in Suriname is above the trigger CPUE point of 1.48 ton per day at sea. The HCR is aimed at the target species and it is part of a dual strategy in relation with the multi species character of the fishery. With the current HCR strategy, the number of days at sea is determined as follows (Southall et al. 2011):
‐ 5100 days-at-sea in case the current CPUE equals or is above the trigger CPUE. The trigger CPUE shall be determined on 1.48 ton per day-at-sea.
‐ A linear decreasing number of day at sea on the basis of the formula: Number of days at sea = (current CPUE – Limit CPUE)×8.625
‐ Zero (the fishery is closed) in case the current CPUE equals or is below the Limit Reference Point (LRP) for CPUE set to 0.89t per day at sea.
The current CPUE for each year shall be calculated as the average of the year prior to the current year. The CPUE shall be calculated as the total landing divided by the total number of days-at-sea of the fleet. The total landing shall be expressed in kilogram full weight; the catch that is immediately unloaded upon landing of the vessel. The number of days-at-sea per fishing trip shall be calculated as follows: (date of arrival – date of departure) + 1. According to MSC (2011), the Target Reference Point (TRP) for CPUE shall be set to 1.65 ton per day-at-sea (head-off) and the limit CPUE shall be 0.89 ton per day-at-sea.
15
4.3 CPUE, landed value of harvest and resource rent of the Suriname groundfish fishery
In 2011 the multi-species industrial groundfish fishery of Suriname harvested 45 finfish species and mollusks like squids. From these, 10 species accounted for 80 percent of the harvest in order of their contribution: green weakfish (Cynoscion virescens), grey snapper (Lutjanus griseus), whitemouth croaker (Micropogonias furnieri), grunts (Haemulon spp.), lane snapper (Lutjanus synagris), barracuda (Sphyraena barracuda), jamaica weakfish (Cynoscion jamaicensis), largehead hairtail (Trichiurus lepturus), mackerel (Scomberomorus spp.), king weakfish (Macrodon ancylodon). For 2011, annual catch of these 10 species is reported in Figure 11. It should be noted that, of the 45 species harvested, the largest catch of industrial groundfish trawlers was 987.1 ton of green weakfish, and the smallest one (30 kg), corresponded to the mutton snapper (Lutjanus analis).
FIGURE 11
Main groundfish species harvested by Suriname fleet in 2011.
Source: Suriname Fisheries Department
The species non-discriminatory nature of trawling gear could have serious effects of less abundant species and therefore their indices of abundance (CPUE) should be monitored over time. It is critical to obtain the data and analyze at least a 10 year time series of multi-species harvest and corresponding fishing effort of the industrial groundfish fishery and calculate their corresponding trends in CPUE.
An analysis of this fishery indicates that overall CPUE for this fishery is fairly stable with mean CPUE of 1.73 ton/day at sea for the 1998-2011 period (Figure 12).
FIGURE 12
Catch per Unit of effort (kg/das) of the industrial groundfish fishery of Suriname for the period 1998-2011.
Source: Suriname Fisheries Department

16
However, looking at species specific CPUE, lane snapper (Lutjanus synagris) which provided the largest catch per day at sea in 1998 (498 kg/day) is currently yielding 103 kg/day (Figure 13). This indicates a reduction of 79 percent in its CPUE index of abundance. Therefore in multispecies fisheries it is essential to be aware of the resilience of different species (renewing capacity) especially for those species like L. synagris which has a relatively low rate of population growth (usually higher longevity) with respect to other currently more abundant groundfish species in the ecosystem being harvested.
FIGURE 13 Catch per unit of effort of lane snapper (Lutjanus synagris) harvested by the groundfish industrial fishery of Suriname.
Source: Suriname Fisheries Department
The value of groundfish species targeted by bottom fish trawlers is presented in Figure 14. The value has an increasing trend since 2008. It will be very useful to update both the multispecies harvest and CPUE and the corresponding landed value for 2012-2013. Data was not available in the information system for 2001.
FIGURE 14
Value of groundfish harvest of Suriname fleet
The resource rent obtained by industrial bottom trawlers was calculated for the fishery and per trawler as shown in Figures 15 and 16. Calculated resource rent has been positive since 2005.

17
FIGURE 15
Resource rent of the groundfish fishery of Suriname for the period 1998-2011.
FIGURE 16
Resource rent per trawler of the groundfish fishery of Suriname for the period 1998-2011.
4.4 Landed value and resource rent of shrimp (Farfantepenaeus spp.), seabob (X. kroyeri) and groundfish species of the Brazil-Guianas shelf.
Adding up the ex-vessel values of shrimp species (Farfantepenaeus spp.), seabob (X. kroyeri) and groundfish species (bycatch and targeted), we obtain a landed value of these species caught by industrial fleet in the NBSLME for the period 1998-2013 of 2576 million US$ (Figure 17).

18
FIGURE 17
Landed ex-vessel value of shrimp (Farfantepenaeus spp, seabob (X, kroyeri) and groundfish species of the four countries harvesting in the Brazil-Guianas shelf ecosystem.
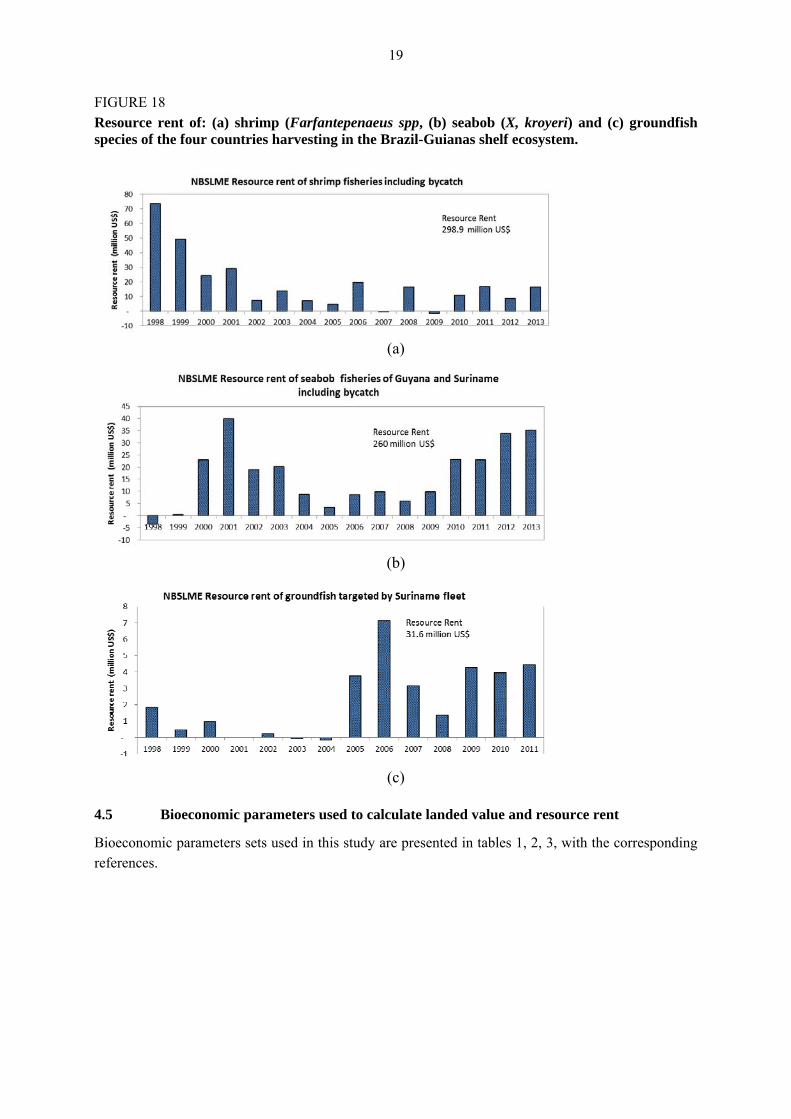
The corresponding resource rent generated by the same species of the NBSLME to industrial fleets of Guyana, Suriname, French Guiana and Brazil is 590.9 million US$ (Figure 18a,b,c). It represents 23 percent of value landed for the same period 1998-2013. The shrimp fishery including its bycatch contributed with 298.9 million US$ (Figure 18a). In addition, the seabob fisheries of Guyana and Suriname contributed with 260 million US$ during the same period (Figure 18b). Finally, the Suriname groundfish fishery generated a resource rent of 31.6 million US$ (Figure 18c).
19
FIGURE 18
Resource rent of: (a) shrimp (Farfantepenaeus spp, (b) seabob (X, kroyeri) and (c) groundfish species of the four countries harvesting in the Brazil-Guianas shelf ecosystem.
(a)
(b)
(c)
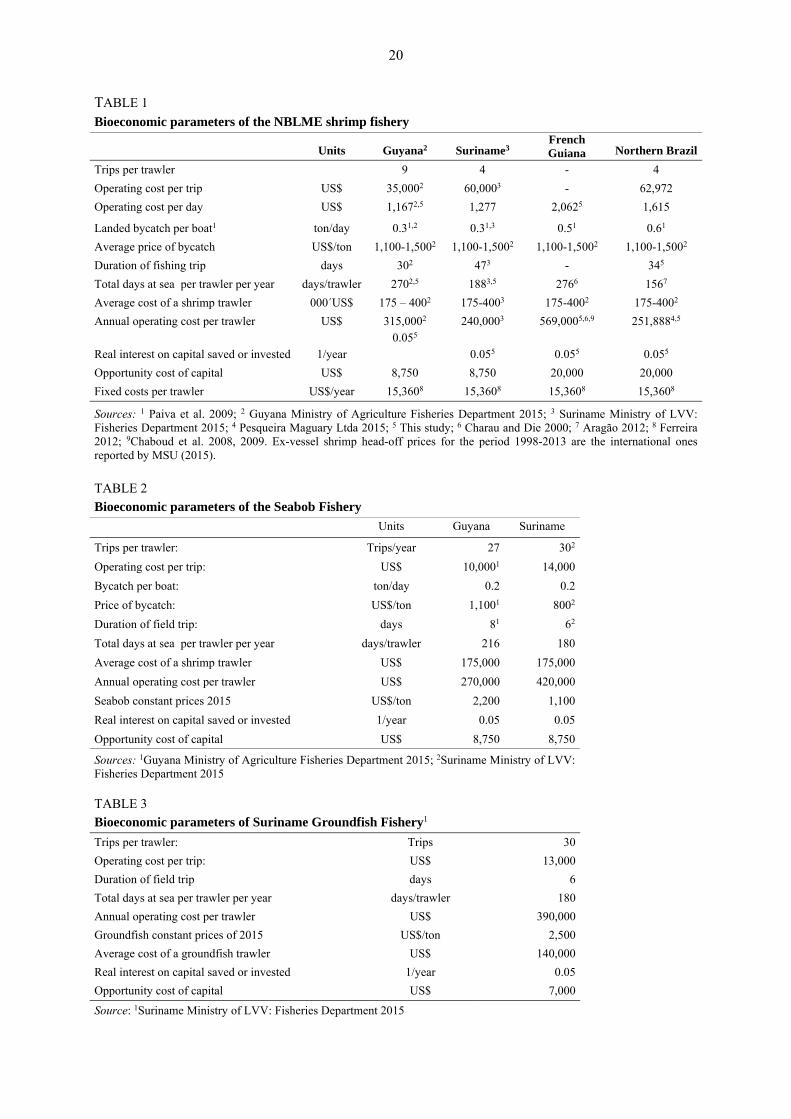
4.5 Bioeconomic parameters used to calculate landed value and resource rent
Bioeconomic parameters sets used in this study are presented in tables 1, 2, 3, with the corresponding references.
20
TABLE 1
Bioeconomic parameters of the NBLME shrimp fishery
Units Guyana2 Suriname3 French Guiana Northern Brazil
Trips per trawler 9 4 - 4
Operating cost per trip US$ 35,0002 60,0003 - 62,972
Operating cost per day US$ 1,1672,5 1,277 2,0625 1,615
Landed bycatch per boat1 ton/day 0.31,2 0.31,3 0.51 0.61
Average price of bycatch US$/ton 1,100-1,5002 1,100-1,5002 1,100-1,5002 1,100-1,5002
Duration of fishing trip days 302 473 - 345
Total days at sea per trawler per year days/trawler 2702,5 1883,5 2766 1567
Average cost of a shrimp trawler 000´US$ 175 – 4002 175-4003 175-4002 175-4002
Annual operating cost per trawler US$ 315,0002 240,0003 569,0005,6,9 251,8884,5
Real interest on capital saved or invested 1/year 0.055
0.055 0.055 0.055
Opportunity cost of capital US$ 8,750 8,750 20,000 20,000
Fixed costs per trawler US$/year 15,3608 15,3608 15,3608 15,3608
Sources: 1 Paiva et al. 2009; 2 Guyana Ministry of Agriculture Fisheries Department 2015; 3 Suriname Ministry of LVV: Fisheries Department 2015; 4 Pesqueira Maguary Ltda 2015; 5 This study; 6 Charau and Die 2000; 7 Aragão 2012; 8 Ferreira 2012; 9Chaboud et al. 2008, 2009. Ex-vessel shrimp head-off prices for the period 1998-2013 are the international ones reported by MSU (2015). TABLE 2
Bioeconomic parameters of the Seabob Fishery Units Guyana Suriname
Trips per trawler: Trips/year 27 302
Operating cost per trip: US$ 10,0001 14,000
Bycatch per boat: ton/day 0.2 0.2
Price of bycatch: US$/ton 1,1001 8002
Duration of field trip: days 81 62
Total days at sea per trawler per year days/trawler 216 180
Average cost of a shrimp trawler US$ 175,000 175,000
Annual operating cost per trawler US$ 270,000 420,000
Seabob constant prices 2015 US$/ton 2,200 1,100
Real interest on capital saved or invested 1/year 0.05 0.05
Opportunity cost of capital US$ 8,750 8,750
Sources: 1Guyana Ministry of Agriculture Fisheries Department 2015; 2Suriname Ministry of LVV: Fisheries Department 2015 TABLE 3 Bioeconomic parameters of Suriname Groundfish Fishery1
Trips per trawler: Trips 30
Operating cost per trip: US$ 13,000
Duration of field trip days 6
Total days at sea per trawler per year days/trawler 180
Annual operating cost per trawler US$ 390,000
Groundfish constant prices of 2015 US$/ton 2,500
Average cost of a groundfish trawler US$ 140,000
Real interest on capital saved or invested 1/year 0.05
Opportunity cost of capital US$ 7,000
Source: 1Suriname Ministry of LVV: Fisheries Department 2015
21
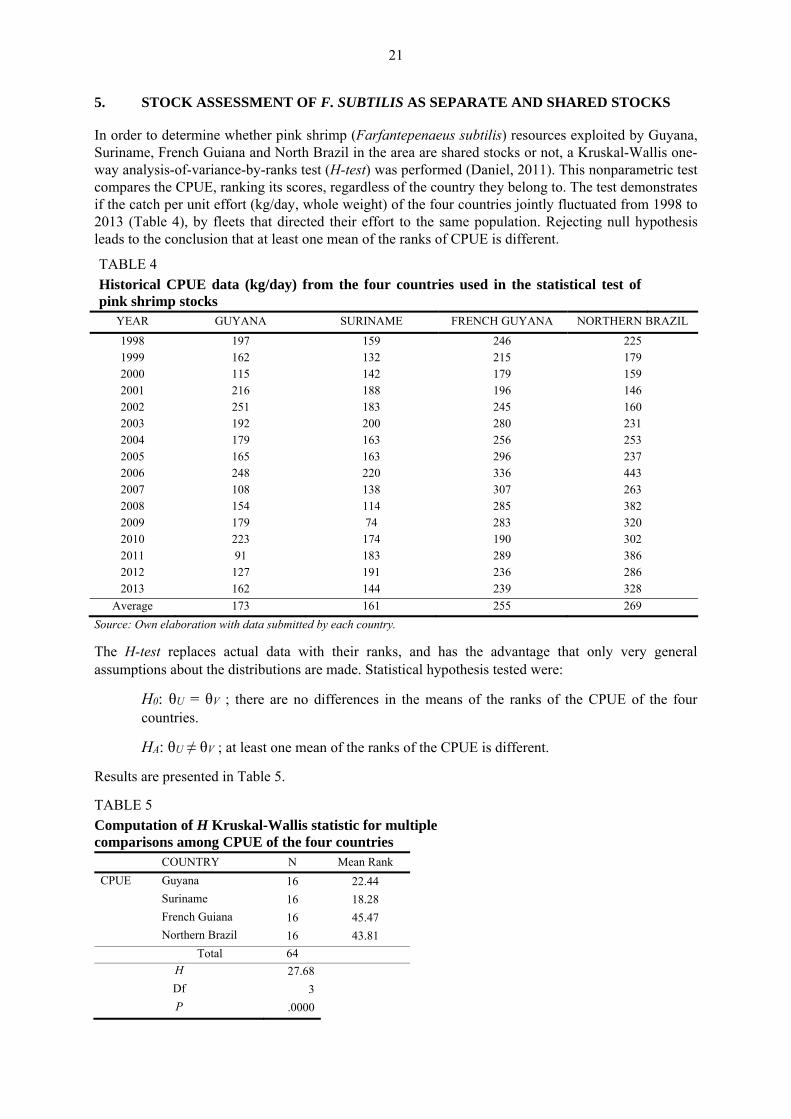
5. STOCK ASSESSMENT OF F. SUBTILIS AS SEPARATE AND SHARED STOCKS
In order to determine whether pink shrimp (Farfantepenaeus subtilis) resources exploited by Guyana, Suriname, French Guiana and North Brazil in the area are shared stocks or not, a Kruskal-Wallis one-way analysis-of-variance-by-ranks test (H-test) was performed (Daniel, 2011). This nonparametric test compares the CPUE, ranking its scores, regardless of the country they belong to. The test demonstrates if the catch per unit effort (kg/day, whole weight) of the four countries jointly fluctuated from 1998 to 2013 (Table 4), by fleets that directed their effort to the same population. Rejecting null hypothesis leads to the conclusion that at least one mean of the ranks of CPUE is different.
TABLE 4
Historical CPUE data (kg/day) from the four countries used in the statistical test of pink shrimp stocks
YEAR GUYANA SURINAME FRENCH GUYANA NORTHERN BRAZIL
1998 197 159 246 225 1999 162 132 215 179 2000 115 142 179 159 2001 216 188 196 146 2002 251 183 245 160 2003 192 200 280 231 2004 179 163 256 253 2005 165 163 296 237 2006 248 220 336 443 2007 108 138 307 263 2008 154 114 285 382 2009 179 74 283 320 2010 223 174 190 302 2011 91 183 289 386 2012 127 191 236 286 2013 162 144 239 328
Average 173 161 255 269
Source: Own elaboration with data submitted by each country.
The H-test replaces actual data with their ranks, and has the advantage that only very general assumptions about the distributions are made. Statistical hypothesis tested were:
H0: θU = θV ; there are no differences in the means of the ranks of the CPUE of the four countries.
HA: θU ≠ θV ; at least one mean of the ranks of the CPUE is different.
Results are presented in Table 5.
TABLE 5
Computation of H Kruskal-Wallis statistic for multiple comparisons among CPUE of the four countries
COUNTRY N Mean Rank
CPUE Guyana 16 22.44
Suriname 16 18.28
French Guiana 16 45.47
Northern Brazil 16 43.81
Total 64
H 27.68
Df 3
P .0000

22
Because the observed value of the H statistic (27.68) exceeds the tabled value (X2 = 16.226), the null hypothesis is rejected, and we conclude that at least one mean of the ranks of the CPUE is different. The overall conclusion is that based on the CPUE data the four countries do not share the same stock. It is noteworthy that, in general, the CPUE of North Brazil and French Guiana exceed that of Suriname and Guyana. For that reason, a subsequent analysis was to demonstrate if North Brazil and French Guiana, and Suriname and Guyana shared the same stocks, using the same rational.
The first set of statistical hypothesis was:
H0: θU = θV ; there are no differences in the means of the CPUE ranks between North Brazil and French Guiana.
HA: θU ≠ θV ; the mean of the ranks of the CPUE is different.
The results are presented in Table 6.
TABLE 6
Computation of H Kruskal-Wallis statistic for multiple comparisons among CPUE of North Brazil and French Guiana. COUNTRY N Mean Rank
CPUE French Guiana 16 16.09 North Brazil 16 16.91
Total 32
H 0.06Df 1
P 0.807
The X2 value with D.F. = 1 has a probability of occurrence when H0 is true (P=0.807). The null hypothesis cannot be rejected, and we conclude that there are not significant differences between CPUE of both countries. The overall conclusion is that probably North Brazil and French Guiana are sharing the same stock.
The second set of statistical hypothesis was:
H0: θU = θV ; there are no differences in the means of the ranks of the CPUE of Suriname and Guyana.
HA: θU ≠ θV ; the mean of the ranks of the CPUE is different.
The results are presented in Table 7.
TABLE 7
Computation of H Kruskal-Wallis statistic for multiple comparisons among CPUE of Suriname and Guyana. COUNTRY N Mean Rank
CPUE Suriname 16 15.38 Guyana 16 17.63
Total 32
H 0.460 Df 1
P 0.497
23
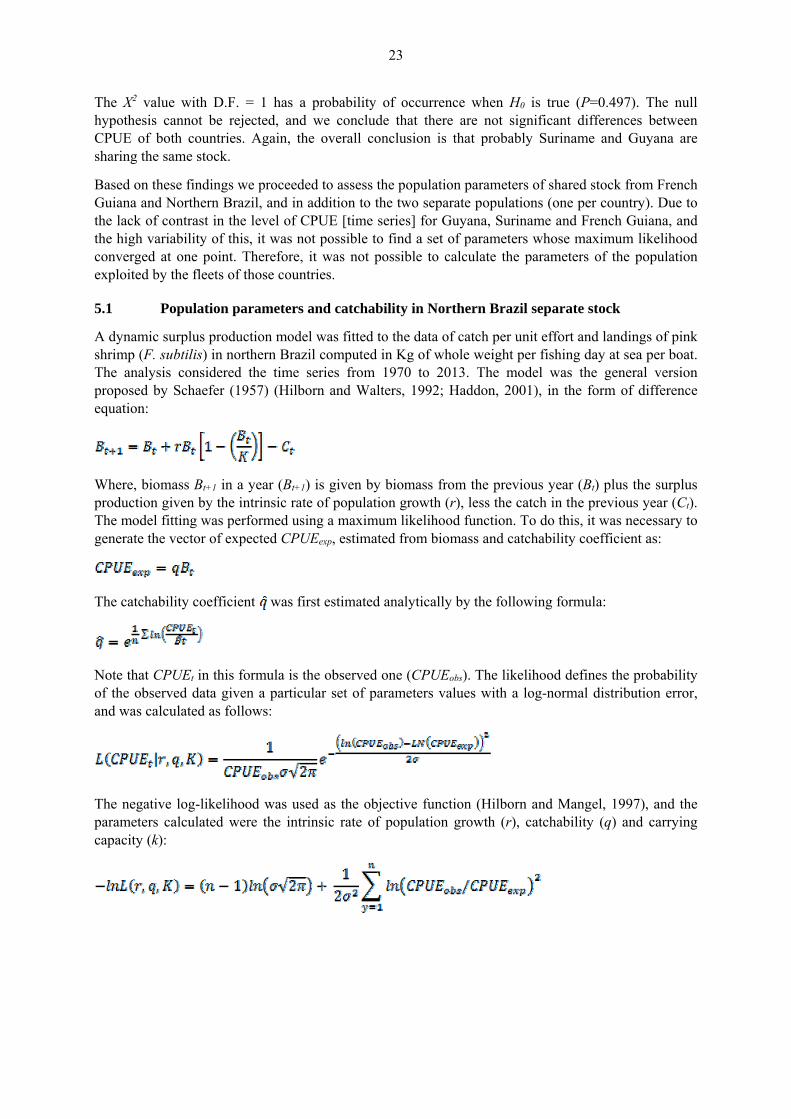
The X2 value with D.F. = 1 has a probability of occurrence when H0 is true (P=0.497). The null hypothesis cannot be rejected, and we conclude that there are not significant differences between CPUE of both countries. Again, the overall conclusion is that probably Suriname and Guyana are sharing the same stock.
Based on these findings we proceeded to assess the population parameters of shared stock from French Guiana and Northern Brazil, and in addition to the two separate populations (one per country). Due to the lack of contrast in the level of CPUE [time series] for Guyana, Suriname and French Guiana, and the high variability of this, it was not possible to find a set of parameters whose maximum likelihood converged at one point. Therefore, it was not possible to calculate the parameters of the population exploited by the fleets of those countries.
5.1 Population parameters and catchability in Northern Brazil separate stock
A dynamic surplus production model was fitted to the data of catch per unit effort and landings of pink shrimp (F. subtilis) in northern Brazil computed in Kg of whole weight per fishing day at sea per boat. The analysis considered the time series from 1970 to 2013. The model was the general version proposed by Schaefer (1957) (Hilborn and Walters, 1992; Haddon, 2001), in the form of difference equation:
Where, biomass Bt+1 in a year (Bt+1) is given by biomass from the previous year (Bt) plus the surplus production given by the intrinsic rate of population growth (r), less the catch in the previous year (Ct). The model fitting was performed using a maximum likelihood function. To do this, it was necessary to generate the vector of expected CPUEexp, estimated from biomass and catchability coefficient as:
The catchability coefficient was first estimated analytically by the following formula:
Note that CPUEt in this formula is the observed one (CPUEobs). The likelihood defines the probability of the observed data given a particular set of parameters values with a log-normal distribution error, and was calculated as follows:
The negative log-likelihood was used as the objective function (Hilborn and Mangel, 1997), and the parameters calculated were the intrinsic rate of population growth (r), catchability (q) and carrying capacity (k):
24
The standard deviation σ for this equation was calculated with the formula:
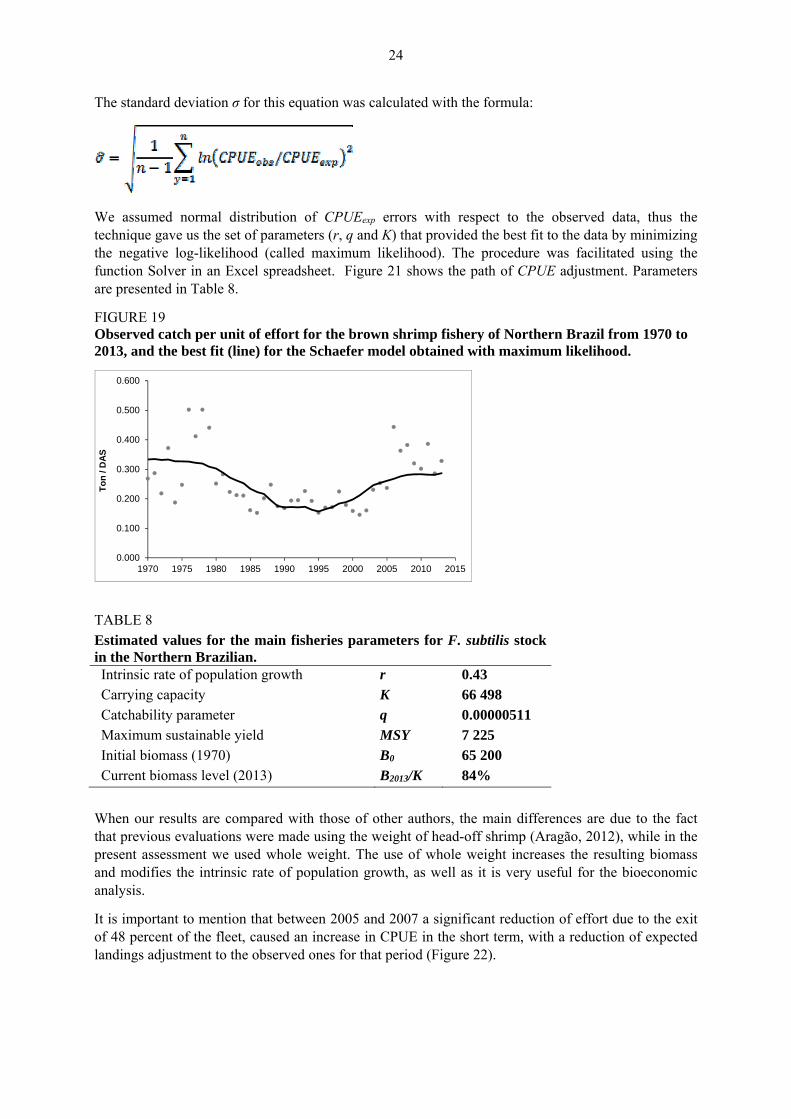
We assumed normal distribution of CPUEexp errors with respect to the observed data, thus the technique gave us the set of parameters (r, q and K) that provided the best fit to the data by minimizing the negative log-likelihood (called maximum likelihood). The procedure was facilitated using the function Solver in an Excel spreadsheet. Figure 21 shows the path of CPUE adjustment. Parameters are presented in Table 8.
FIGURE 19 Observed catch per unit of effort for the brown shrimp fishery of Northern Brazil from 1970 to 2013, and the best fit (line) for the Schaefer model obtained with maximum likelihood.
TABLE 8
Estimated values for the main fisheries parameters for F. subtilis stock in the Northern Brazilian. Intrinsic rate of population growth r 0.43 Carrying capacity K 66 498 Catchability parameter q 0.00000511 Maximum sustainable yield MSY 7 225 Initial biomass (1970) B0 65 200 Current biomass level (2013) B2013/K 84%
When our results are compared with those of other authors, the main differences are due to the fact that previous evaluations were made using the weight of head-off shrimp (Aragão, 2012), while in the present assessment we used whole weight. The use of whole weight increases the resulting biomass and modifies the intrinsic rate of population growth, as well as it is very useful for the bioeconomic analysis.
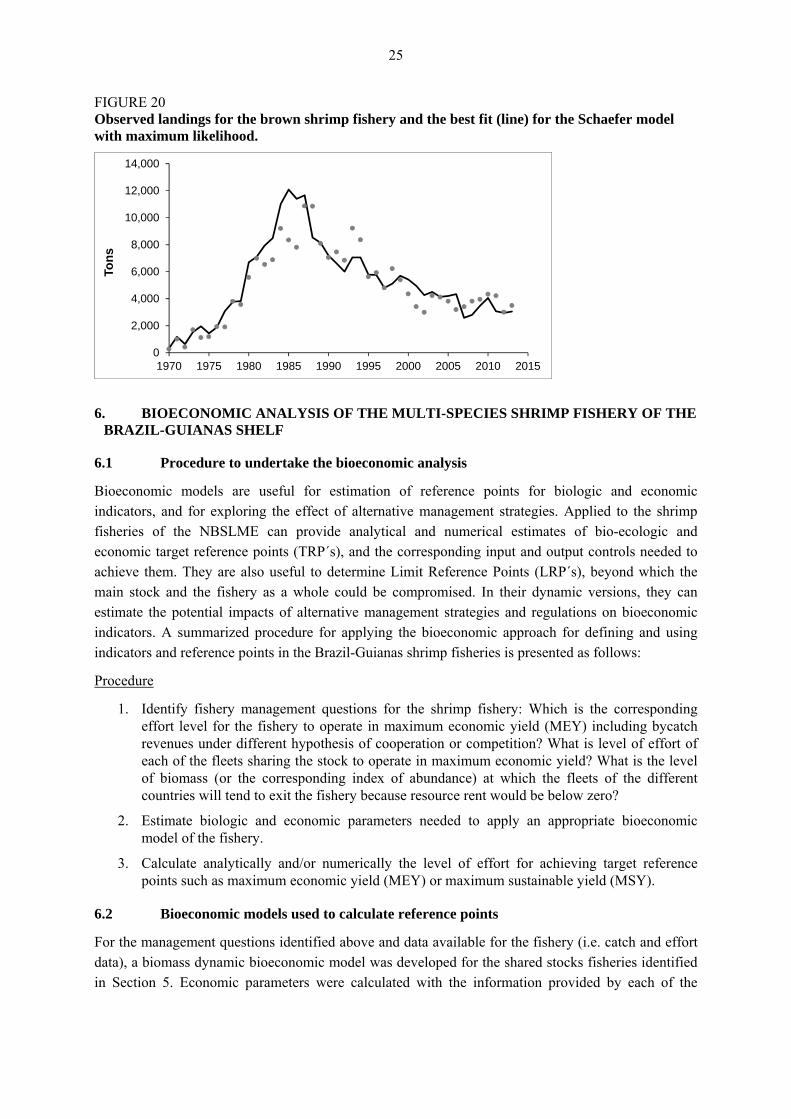
It is important to mention that between 2005 and 2007 a significant reduction of effort due to the exit of 48 percent of the fleet, caused an increase in CPUE in the short term, with a reduction of expected landings adjustment to the observed ones for that period (Figure 22).
0.000
0.100
0.200
0.300
0.400
0.500
0.600
1970 1975 1980 1985 1990 1995 2000 2005 2010 2015
To
n /
DA
S
25
FIGURE 20 Observed landings for the brown shrimp fishery and the best fit (line) for the Schaefer model with maximum likelihood.
0
2,000
4,000
6,000
8,000
10,000
12,000
14,000
1970 1975 1980 1985 1990 1995 2000 2005 2010 2015
Ton
s
6. BIOECONOMIC ANALYSIS OF THE MULTI-SPECIES SHRIMP FISHERY OF THE BRAZIL-GUIANAS SHELF
6.1 Procedure to undertake the bioeconomic analysis
Bioeconomic models are useful for estimation of reference points for biologic and economic indicators, and for exploring the effect of alternative management strategies. Applied to the shrimp fisheries of the NBSLME can provide analytical and numerical estimates of bio-ecologic and economic target reference points (TRP´s), and the corresponding input and output controls needed to achieve them. They are also useful to determine Limit Reference Points (LRP´s), beyond which the main stock and the fishery as a whole could be compromised. In their dynamic versions, they can estimate the potential impacts of alternative management strategies and regulations on bioeconomic indicators. A summarized procedure for applying the bioeconomic approach for defining and using indicators and reference points in the Brazil-Guianas shrimp fisheries is presented as follows:
Procedure
1. Identify fishery management questions for the shrimp fishery: Which is the corresponding effort level for the fishery to operate in maximum economic yield (MEY) including bycatch revenues under different hypothesis of cooperation or competition? What is level of effort of each of the fleets sharing the stock to operate in maximum economic yield? What is the level of biomass (or the corresponding index of abundance) at which the fleets of the different countries will tend to exit the fishery because resource rent would be below zero?
2. Estimate biologic and economic parameters needed to apply an appropriate bioeconomic model of the fishery.
3. Calculate analytically and/or numerically the level of effort for achieving target reference points such as maximum economic yield (MEY) or maximum sustainable yield (MSY).
6.2 Bioeconomic models used to calculate reference points
For the management questions identified above and data available for the fishery (i.e. catch and effort data), a biomass dynamic bioeconomic model was developed for the shared stocks fisheries identified in Section 5. Economic parameters were calculated with the information provided by each of the
26
participant countries and the published statistics of shrimp catch and effort for the above mentioned period (See tables in Annex I).
6.2.1 Bioeconomic model developed for the independent stocks hypothesis considering bycatch analytically.
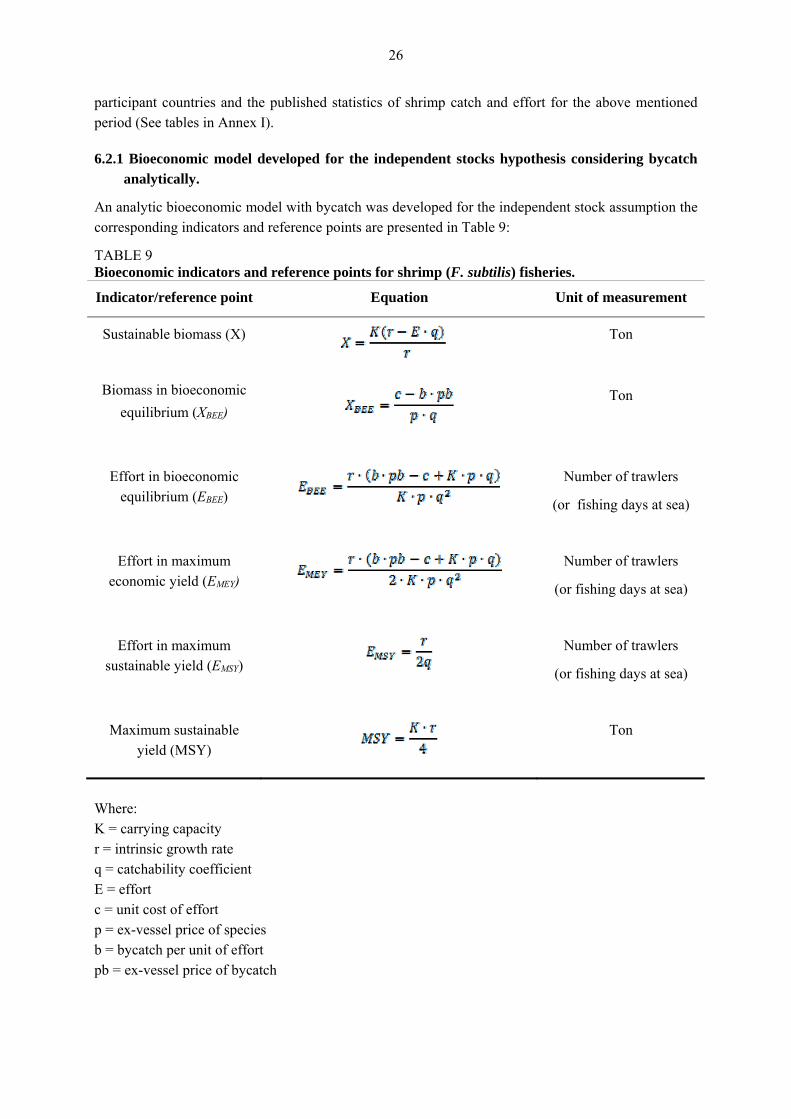
An analytic bioeconomic model with bycatch was developed for the independent stock assumption the corresponding indicators and reference points are presented in Table 9:
TABLE 9 Bioeconomic indicators and reference points for shrimp (F. subtilis) fisheries.
Indicator/reference point Equation Unit of measurement
Sustainable biomass (X)
Ton
Biomass in bioeconomic
equilibrium (XBEE)
Ton
Effort in bioeconomic equilibrium (EBEE)
Number of trawlers
(or fishing days at sea)
Effort in maximum economic yield (EMEY)
Number of trawlers
(or fishing days at sea)
Effort in maximum sustainable yield (EMSY)
Number of trawlers
(or fishing days at sea)
Maximum sustainable yield (MSY)
Ton
Where: K = carrying capacity r = intrinsic growth rate q = catchability coefficient E = effort c = unit cost of effort p = ex-vessel price of species b = bycatch per unit of effort pb = ex-vessel price of bycatch

27
6.2.2 Bioeconomic model with bycatch developed for the shared stock hypothesis
In case genetic studies, undertaken to determine the existence or not of shared shrimp stocks in the NBSLME, corroborate the results of the preliminary statistical test of this study using CPUE, the shared-stock bioeconomic model with bycatch developed below could be applied to aid the design of research and management strategies for this important fishery.
The shared stock of biomass
The dynamic shared stock of F. subtilis biomass (Xt) is calculated for two countries through the following equation:
(1)
Where Ev is the effort in number of shrimp trawlers of country fleet v, qv is the catchability coefficient of country fleet v, r is the intrinsic growth rate of population, and K is the corresponding carrying capacity for F. subtilis in the North Brazil Shelf Large Marine Ecosystem (NBSLME).
Sustainable biomass X for the shared stock of F. subtilis harvested by fleets of the two countries (E1
and E2 respectively) is calculated by making as follows:
(2)
Biomass in bioeconomic equilibrium for each of the fleets sharing the stock
The biomass at which bioeconomic equilibrium occurs (i.e. level of biomass below which fleet v will exit the fishery) for the industrial shrimp fleets of the two countries (XBEE,v) is calculated by making
the profit function for each country fleet equal to zero and solving for biomass X as follows:
(3)
(4)
Where cv is the annual cost of effort per shrimp trawlers v, p is the ex-vessel price of shrimp, bv is the average annual bycatch per vessel v, and pbv the average price of bycatch landed.
The fishing effort (number of trawlers) for each country to operate in bioeconomic equilibrium is calculated as a function of number of trawlers in the fishery from the other country, their shrimp catch value, the average value of bycatch landed, the annual cost of effort, the catchability coefficients of the two fleets, and the r and K biological parameters. The explicit form equations for each the two countries fleets are the following:
(5)
(6)
28
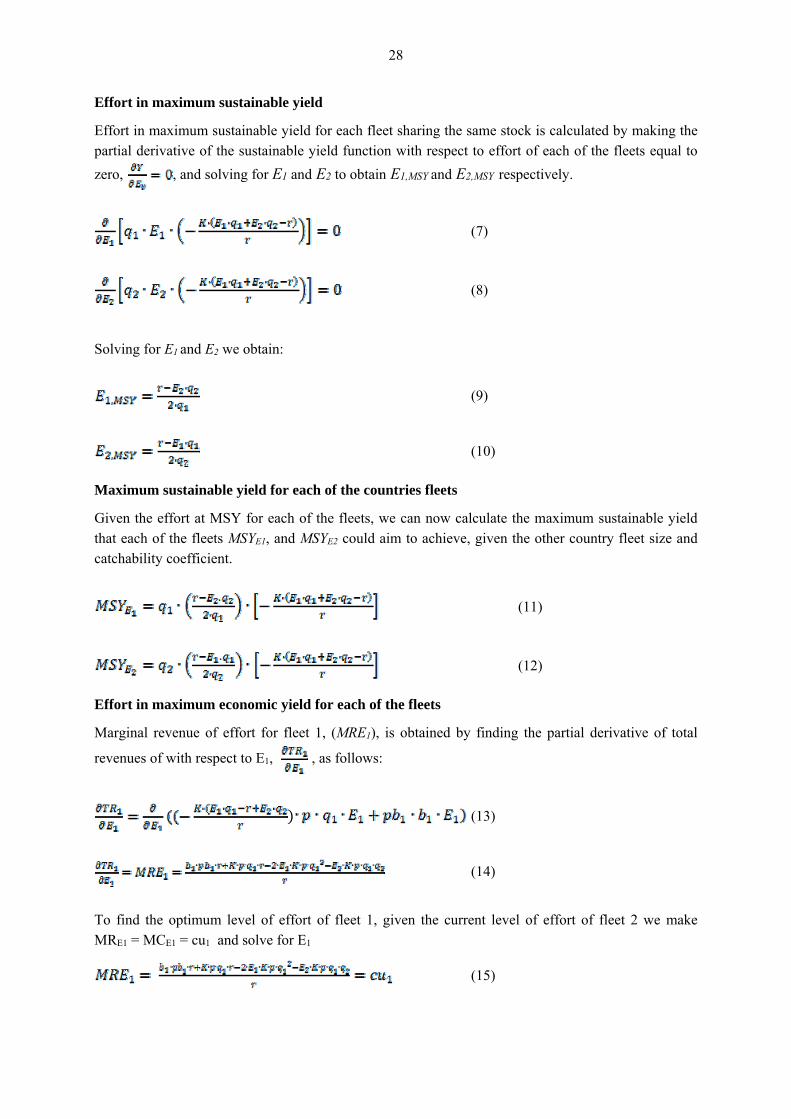
Effort in maximum sustainable yield
Effort in maximum sustainable yield for each fleet sharing the same stock is calculated by making the partial derivative of the sustainable yield function with respect to effort of each of the fleets equal to
zero, , and solving for E1 and E2 to obtain E1,MSY and E2,MSY respectively.
(7)
(8)
Solving for E1 and E2 we obtain:
(9)
(10)
Maximum sustainable yield for each of the countries fleets
Given the effort at MSY for each of the fleets, we can now calculate the maximum sustainable yield that each of the fleets MSYE1, and MSYE2 could aim to achieve, given the other country fleet size and catchability coefficient.
(11)
(12)
Effort in maximum economic yield for each of the fleets
Marginal revenue of effort for fleet 1, (MRE1), is obtained by finding the partial derivative of total
revenues of with respect to E1, , as follows:
(13)
(14)
To find the optimum level of effort of fleet 1, given the current level of effort of fleet 2 we make MRE1 = MCE1 = cu1 and solve for E1
(15)
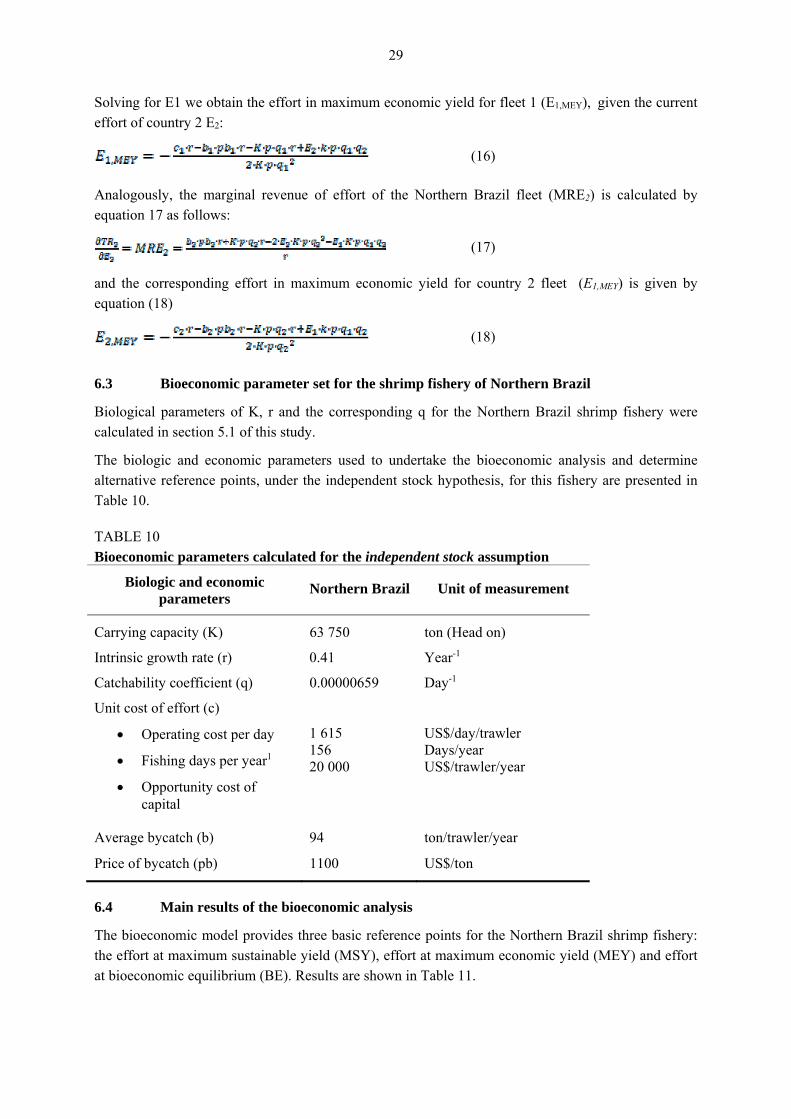
29
Solving for E1 we obtain the effort in maximum economic yield for fleet 1 (E1,MEY), given the current effort of country 2 E2:
(16)
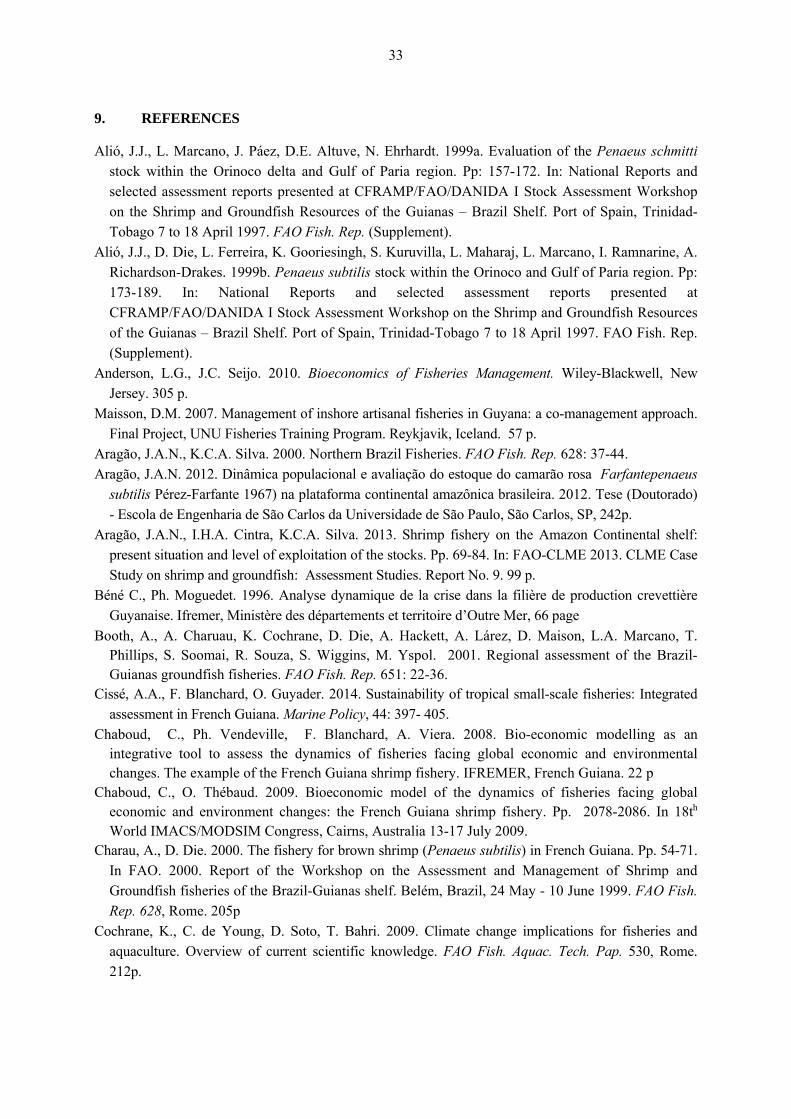
Analogously, the marginal revenue of effort of the Northern Brazil fleet (MRE2) is calculated by equation 17 as follows:
(17)
and the corresponding effort in maximum economic yield for country 2 fleet (E1,MEY) is given by equation (18)
(18)
6.3 Bioeconomic parameter set for the shrimp fishery of Northern Brazil
Biological parameters of K, r and the corresponding q for the Northern Brazil shrimp fishery were calculated in section 5.1 of this study.
The biologic and economic parameters used to undertake the bioeconomic analysis and determine alternative reference points, under the independent stock hypothesis, for this fishery are presented in Table 10.
TABLE 10
Bioeconomic parameters calculated for the independent stock assumption
Biologic and economic parameters
Northern Brazil Unit of measurement
Carrying capacity (K) 63 750 ton (Head on)
Intrinsic growth rate (r) 0.41 Year-1
Catchability coefficient (q) 0.00000659 Day-1
Unit cost of effort (c)
Operating cost per day
Fishing days per year1
Opportunity cost of capital
1 615 156 20 000
US$/day/trawler Days/year US$/trawler/year
Average bycatch (b) 94 ton/trawler/year
Price of bycatch (pb) 1100 US$/ton
6.4 Main results of the bioeconomic analysis
The bioeconomic model provides three basic reference points for the Northern Brazil shrimp fishery: the effort at maximum sustainable yield (MSY), effort at maximum economic yield (MEY) and effort at bioeconomic equilibrium (BE). Results are shown in Table 11.

30
TABLE 11 Fishing effort and fishing mortality at different reference points for the Northern Brazil shrimp fishery. Current (2013) fishing effort for Northern Brazil is 60 vessels.
Reference point Number of vessels Fishing mortality (F)
Effort and fishing mortality at Bio-Economic Equilibrium (EBEE)
Vessels=235 F=0.24
Effort and fishing mortality at MSY (EMSY)
Vessels=199 F=0.20
Effort and fishing mortality at MEY (EMEY)
Vessels=118 F=0.16
The optimal effort (EMEY) calculation for the Northern Brazil fleet is an important aspect to note, because the assessment reported in section 5 of this study, which is consistent with results reported by Aragão (2013), shows that currently the fleet is operating at low level relative to the productivity of the stock (F2013 < FMSY). Then, the effort at MEY could become a target reference point in this fishery, provided that the increase in the number of vessels is done with caution.
7. CONCLUSIONS
a. In the last 15 years, the trend of whole weight catch for Guyana, Suriname, French Guiana and Northern Brazil decreased in the four countries: from 3 019 ton to 1 019 ton in Guyana, from 3 267 ton to 624 ton in Suriname, from 3 940 ton to 732 ton in French Guiana, and from 6 224 ton to 2 482 ton in Northern Brazil.
b. One of the main factors of this reduction has been the deliberate exit of vessels in all four countries during this period. The number of trawlers in Northern Brazil was 135 in 1998 and has decreased to 60 in 2013, a reduction of 56 percent. Suriname from 109 to 23 trawlers in the same period, a reduction of 79 percent. Guyana from 73 to 30, a reduction of 59 percent, and French Guiana from 58 to 12 in the same period, a reduction of 79 percent of their trawlers.
c. The calculated resource rent for the four countries explains the reduction of the number of vessels during the period under consideration. The cost of fishing has been affected in the region as in many other regions of the world, mainly by increasing oil and gas prices during the study period. In addition, the ex-vessel price of the shrimp strongly decreased between 2000 and 2009. Recently, increasing abundance as indicated by the catch per unit of effort in Brazil and Surinam, has resulted in positive resource rent for the period 2010 to 2013.
d. Catch of seabob by Guyana fleet for the period 1999-2009 tended to be similar in Suriname, but not their respective CPUE. The reason for this is that their level of harvest is obtained by a major difference in the number of vessel and corresponding days at sea. The number of seabob trawlers in Guyana have been in the interval of [80, 137], while the one for Suriname has been low and very stable [21, 30]. As a result, CPUE for Suriname is substantial higher than the one for Guyana. For 2013, whole weight CPUE in Suriname reached 3 509 kg/das, while the one for Guyana was 1 308 kg/das for the same year.
e. In 2011 the multi-species industrial groundfish fishery of Suriname harvested 45 finfish species and mollusks like squids. From these, 10 species accounted for 80 percent of the harvest in order of their contribution: green weakfish (Cynoscion virescens), grey snapper (Lutjanus griseus),

31
whitemouth croaker (Micropogonias furnieri), grunts (Haemulon spp.), lane snapper (Lutjanus synagris), barracuda (Sphyraena barracuda), jamaica weakfish (Cynoscion jamaicensis), largehead hairtail (Trichiurus lepturus), mackerel (Scomberomorus spp.), king weakfish (Macrodon ancylodon). It should be noted that, of the 45 species harvested, the largest catch of industrial groundfish trawlers was 987.1 ton of green weakfish (Cynoscion virescens), and the smallest one (30 kg), corresponded to the mutton snapper (Lutjanus analis).
f. The species non-discriminatory nature of trawling gear could have serious effects of less abundant species and therefore their indices of abundance (CPUE) should be monitored over time. It is critical to obtain the data and analyze at least a 10 year time series of multi-species harvest and corresponding fishing effort of the industrial groundfish fishery and calculate their corresponding trends in CPUE.
g. An analysis of this fishery indicates that overall CPUE for the groundfish fishery of Suriname is fairly stable with mean CPUE of 1.73 ton/day at sea for the 1998-2011 period. However looking at species specific CPUE, lane snapper (Lutjanus synagris) which provided the largest catch per day at sea in 1998 (498 kg/day) is currently yielding 103 kg/day. This indicates a reduction of 79 percent in its CPUE index of abundance. Therefore in multispecies fisheries it is essential to be aware of the resilience of different species (renewability capacity) especially for those species like L. synagris which has a relatively lower rate of population growth (usually higher longevity) with respect to other currently more abundant groundfish species in the ecosystem being harvested.
h. It is recommended that standardization of CPUE of alternative fleet types be undertaken including small scale and artisanal effort harvesting shrimp species in estuaries and coastal lagoons.
i. Adding up the ex-vessel values of shrimp species (Farfantepenaeus spp.), seabob (X. kroyeri) and groundfish species, we obtain a landed value of these species caught by industrial fleet in the NBSLME for the period 1998-2013 of 2576 million US$.
j. The corresponding resource rent generated by the same species of the NBSLME to industrial fleets of Guyana, Suriname, French Guiana and Brazil is 590.9 million US$. It represents 23 percent of value landed for the same period 1998-2013.
k. The results of a preliminary statistical test suggest that pink shrimp (Farfantepenaeus subtilis) resources exploited by French Guiana and Northern Brazil could be a shared stock in the area, as well as the stocks harvested by Guyana and Suriname. The hypothesis of all four countries sharing the same stock in the NBSLME was rejected. It should be pointed out however, that it is essential to undertake genetic studies to have the appropriate certainty for the share stock hypotheses for Brazil and French Guiana on the one hand, and Guyana and Suriname on the other.

32
8. RECOMMENDATIONS
Some of the main recommendations of this study are the following:
1. It seems essential to improve fisheries data quality for bioeconomic assessment an management.
2. Future work in this field should consider sequential interdependencies between small-scale fisheries targeting or incidentally harvesting, in coastal lagoons, estuaries and nearby marine coastal areas, the most important species reported in this study.
3. Capacity building is needed for periodic fisheries data collection and analysis of: (i) catch, catch composition (i.e. species and sizes), fishing effort (fleet specific, gear specific), costs and earnings of different fisheries of interest in the country/region, (ii) alternative bioeconomic models for different species (i.e. species with different degrees of mobility) being targeted, (iii) bioeconomic modelling of technologically interdependent fisheries (e.g. shrimp and snapper fisheries), and (iv) joint capacity building of fishers and vessel owners, fisheries officers, scientists, processing sector decision-makers, for understanding the ecosystems approach to fisheries (EAF) management.
4. It is suggested that topics of capacity building efforts for EAF may include: (a) oceanographic pattern of the ecosystem where the fishery is taking place, (b) ecological/technological interdependencies of fisheries, (c) dynamics of space-time of stocks and fishing effort, and (d) cooperation for governance and conservation of fish resources and the ecosystems sustaining them.
5. Capacity building should be tied up with the necessary resources and means to actually use the knowledge, abilities, and approaches to fisheries bioeconomic analysis and management.
6. It is recommended accounting for IUU fishing associated to shrimp and groundfish fisheries take place with the best available information and procedures in each of the NBSLME countries.
7. It is recommended to periodically collect and analyze environmental and oceanographic information of the NBSLME that may affect abundance and distribution of shrimp and groundfish fisheries in the region.
8. To assess the status of nursery habitats for shrimp and groundfish species that spend part of their life cycle in coastal lagoons and estuaries, and assess possible impacts of human activities on these critical habitats.
33
9. REFERENCES
Alió, J.J., L. Marcano, J. Páez, D.E. Altuve, N. Ehrhardt. 1999a. Evaluation of the Penaeus schmitti stock within the Orinoco delta and Gulf of Paria region. Pp: 157-172. In: National Reports and selected assessment reports presented at CFRAMP/FAO/DANIDA I Stock Assessment Workshop on the Shrimp and Groundfish Resources of the Guianas – Brazil Shelf. Port of Spain, Trinidad-Tobago 7 to 18 April 1997. FAO Fish. Rep. (Supplement).
Alió, J.J., D. Die, L. Ferreira, K. Gooriesingh, S. Kuruvilla, L. Maharaj, L. Marcano, I. Ramnarine, A. Richardson-Drakes. 1999b. Penaeus subtilis stock within the Orinoco and Gulf of Paria region. Pp: 173-189. In: National Reports and selected assessment reports presented at CFRAMP/FAO/DANIDA I Stock Assessment Workshop on the Shrimp and Groundfish Resources of the Guianas – Brazil Shelf. Port of Spain, Trinidad-Tobago 7 to 18 April 1997. FAO Fish. Rep. (Supplement).
Anderson, L.G., J.C. Seijo. 2010. Bioeconomics of Fisheries Management. Wiley-Blackwell, New Jersey. 305 p.
Maisson, D.M. 2007. Management of inshore artisanal fisheries in Guyana: a co-management approach. Final Project, UNU Fisheries Training Program. Reykjavik, Iceland. 57 p.
Aragão, J.A.N., K.C.A. Silva. 2000. Northern Brazil Fisheries. FAO Fish. Rep. 628: 37-44. Aragão, J.A.N. 2012. Dinâmica populacional e avaliação do estoque do camarão rosa Farfantepenaeus
subtilis Pérez-Farfante 1967) na plataforma continental amazônica brasileira. 2012. Tese (Doutorado) - Escola de Engenharia de São Carlos da Universidade de São Paulo, São Carlos, SP, 242p.
Aragão, J.A.N., I.H.A. Cintra, K.C.A. Silva. 2013. Shrimp fishery on the Amazon Continental shelf: present situation and level of exploitation of the stocks. Pp. 69-84. In: FAO-CLME 2013. CLME Case Study on shrimp and groundfish: Assessment Studies. Report No. 9. 99 p.
Béné C., Ph. Moguedet. 1996. Analyse dynamique de la crise dans la filière de production crevettière Guyanaise. Ifremer, Ministère des départements et territoire d’Outre Mer, 66 page
Booth, A., A. Charuau, K. Cochrane, D. Die, A. Hackett, A. Lárez, D. Maison, L.A. Marcano, T. Phillips, S. Soomai, R. Souza, S. Wiggins, M. Yspol. 2001. Regional assessment of the Brazil-Guianas groundfish fisheries. FAO Fish. Rep. 651: 22-36.
Cissé, A.A., F. Blanchard, O. Guyader. 2014. Sustainability of tropical small-scale fisheries: Integrated assessment in French Guiana. Marine Policy, 44: 397- 405.
Chaboud, C., Ph. Vendeville, F. Blanchard, A. Viera. 2008. Bio-economic modelling as an integrative tool to assess the dynamics of fisheries facing global economic and environmental changes. The example of the French Guiana shrimp fishery. IFREMER, French Guiana. 22 p
Chaboud, C., O. Thébaud. 2009. Bioeconomic model of the dynamics of fisheries facing global economic and environment changes: the French Guiana shrimp fishery. Pp. 2078-2086. In 18th
World IMACS/MODSIM Congress, Cairns, Australia 13-17 July 2009. Charau, A., D. Die. 2000. The fishery for brown shrimp (Penaeus subtilis) in French Guiana. Pp. 54-71.
In FAO. 2000. Report of the Workshop on the Assessment and Management of Shrimp and Groundfish fisheries of the Brazil-Guianas shelf. Belém, Brazil, 24 May - 10 June 1999. FAO Fish. Rep. 628, Rome. 205p
Cochrane, K., C. de Young, D. Soto, T. Bahri. 2009. Climate change implications for fisheries and aquaculture. Overview of current scientific knowledge. FAO Fish. Aquac. Tech. Pap. 530, Rome. 212p.
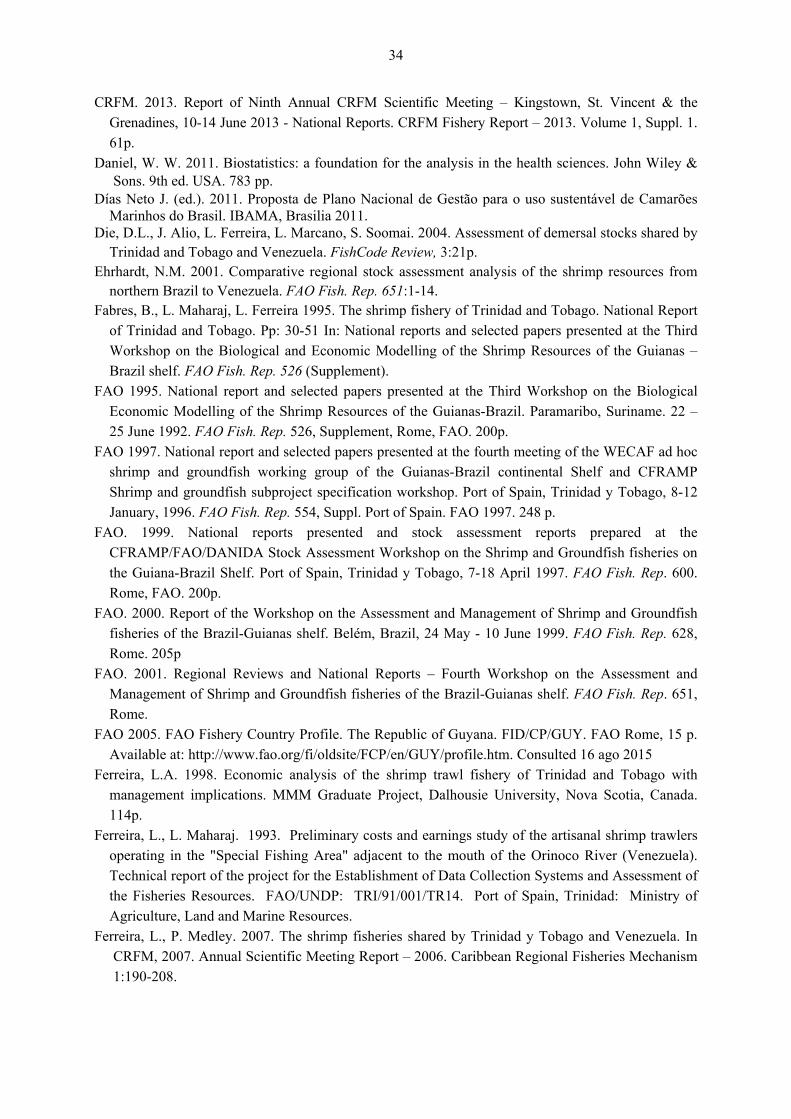
34
CRFM. 2013. Report of Ninth Annual CRFM Scientific Meeting – Kingstown, St. Vincent & the Grenadines, 10-14 June 2013 - National Reports. CRFM Fishery Report – 2013. Volume 1, Suppl. 1. 61p.
Daniel, W. W. 2011. Biostatistics: a foundation for the analysis in the health sciences. John Wiley & Sons. 9th ed. USA. 783 pp.
Días Neto J. (ed.). 2011. Proposta de Plano Nacional de Gestão para o uso sustentável de Camarões Marinhos do Brasil. IBAMA, Brasilia 2011.
Die, D.L., J. Alio, L. Ferreira, L. Marcano, S. Soomai. 2004. Assessment of demersal stocks shared by Trinidad and Tobago and Venezuela. FishCode Review, 3:21p.
Ehrhardt, N.M. 2001. Comparative regional stock assessment analysis of the shrimp resources from northern Brazil to Venezuela. FAO Fish. Rep. 651:1-14.
Fabres, B., L. Maharaj, L. Ferreira 1995. The shrimp fishery of Trinidad and Tobago. National Report of Trinidad and Tobago. Pp: 30-51 In: National reports and selected papers presented at the Third Workshop on the Biological and Economic Modelling of the Shrimp Resources of the Guianas – Brazil shelf. FAO Fish. Rep. 526 (Supplement).
FAO 1995. National report and selected papers presented at the Third Workshop on the Biological Economic Modelling of the Shrimp Resources of the Guianas-Brazil. Paramaribo, Suriname. 22 – 25 June 1992. FAO Fish. Rep. 526, Supplement, Rome, FAO. 200p.
FAO 1997. National report and selected papers presented at the fourth meeting of the WECAF ad hoc shrimp and groundfish working group of the Guianas-Brazil continental Shelf and CFRAMP Shrimp and groundfish subproject specification workshop. Port of Spain, Trinidad y Tobago, 8-12 January, 1996. FAO Fish. Rep. 554, Suppl. Port of Spain. FAO 1997. 248 p.
FAO. 1999. National reports presented and stock assessment reports prepared at the CFRAMP/FAO/DANIDA Stock Assessment Workshop on the Shrimp and Groundfish fisheries on the Guiana-Brazil Shelf. Port of Spain, Trinidad y Tobago, 7-18 April 1997. FAO Fish. Rep. 600. Rome, FAO. 200p.
FAO. 2000. Report of the Workshop on the Assessment and Management of Shrimp and Groundfish fisheries of the Brazil-Guianas shelf. Belém, Brazil, 24 May - 10 June 1999. FAO Fish. Rep. 628, Rome. 205p
FAO. 2001. Regional Reviews and National Reports – Fourth Workshop on the Assessment and Management of Shrimp and Groundfish fisheries of the Brazil-Guianas shelf. FAO Fish. Rep. 651, Rome.
FAO 2005. FAO Fishery Country Profile. The Republic of Guyana. FID/CP/GUY. FAO Rome, 15 p. Available at: http://www.fao.org/fi/oldsite/FCP/en/GUY/profile.htm. Consulted 16 ago 2015
Ferreira, L.A. 1998. Economic analysis of the shrimp trawl fishery of Trinidad and Tobago with management implications. MMM Graduate Project, Dalhousie University, Nova Scotia, Canada. 114p.
Ferreira, L., L. Maharaj. 1993. Preliminary costs and earnings study of the artisanal shrimp trawlers operating in the "Special Fishing Area" adjacent to the mouth of the Orinoco River (Venezuela). Technical report of the project for the Establishment of Data Collection Systems and Assessment of the Fisheries Resources. FAO/UNDP: TRI/91/001/TR14. Port of Spain, Trinidad: Ministry of Agriculture, Land and Marine Resources.
Ferreira, L., P. Medley. 2007. The shrimp fisheries shared by Trinidad y Tobago and Venezuela. In CRFM, 2007. Annual Scientific Meeting Report – 2006. Caribbean Regional Fisheries Mechanism 1:190-208.
35
Haddon, M. 2001. Modelling and quantitative methods in fisheries. CRC Press, Chapman and Hall/CRC Press, Boca Raton, FL. 406 pp.
Hilborn, R., C. Walters. 1992. Quantitative fisheries stock assessment: Choice, dynamics and uncertainty. Chapman-Hall, New York. 570 p.
Hilborn, R., M. Mangel. 1997. The ecological detective. Confronting models with data. Monographs in population biology. Princeton Academic Press, New Jersey. 330 pp.
Lum Young, P., L. Ferreira, L. Maharaj 1992. Stock assessment parameters for five species of Western Atlantic tropical shrimp. Technical Report of the Project for the Establishment of Data Collection Systems and Assessment of the Fisheries Resources. FAO/UNDP:TRI/91/001/TR1. Port of Spain (Trinidad). 48 p.
Manickchand-Heileman, S.C., J.S. Kenny. 1990. Reproduction, age, and growth of the Whitemouth Croaker, Micropogonias furnieri (Desmarest 1823) in Trinidad Waters. Fish. Bull., 88(3): 523-529.
MSU. 2015. Shrimp price analysis. Coastal Research and Extension Center. Mississippi State University Extension Services. Available in: http://msucares.com/crec/shrimpprices.html
Paiva, K., J.A. Aragão, K.C. Silva, I.H. Cintra. 2009. Fauna acompanhante da pesca industrial do camarão-rosa na plataforma continental norte brasileira. Bol. Téc. Cient. Cepnor, Belém, 9: 25-42.
Phillips, T. 2007. Thematic report for the Guianas–Brazil sub-region: A discussion paper for the CLME Synthesis Workshop. CLME-TT/4 Prov Barbados. 30 p.
Phillips, T., B. Chakalall, L. Romahlo. 2009. Management of the shrimp and groundfish fisheries of the North Brazil Shelf: An ecosystem approach. In: L. Fanning, R. Mahon, P. McConney. (eds.). Towards Marine Ecosystem Based Management in the Wider Caribbean. Amsterdam University Press, The Netherlands. Pp. 213-226.
Seijo, J.C., L. Ferreira, J.J. Alió, L.A. Marcano. 2000. Bio-economics of shrimp fisheries of the Brazil-Guiana Shelf: dealing with seasonality, risk and uncertainty. FAO Fish. Rep. 628: 173-178.
Seijo, J.C. 2013. Suriname: Sustainable Management of Fisheries. Interamerican Development Bank (IDB), Washington, D.C. 25 p.
Seijo, J.C., L. Ferreira. 2013. Case study of shared stocks of the shrimp and groundfish fishery of the Guianas-Brazil Shelf. Pp. 49-68. In: FAO-CLME 2013. CLME Case Study on shrimp and groundfish: Assessment Studies. Report No. 9. 99 p.
Sibeni, F., F. Calderini. 2015. FishStatJ, a tool for fishery statistics analysis. Release: 2.1.0. http://www.fao.org/fishery/statistics/software/fishstatj/en Soomai, S., N. Ehrhardt, K. Cochrane, T. Phillip. 1999. Stock assessment of two sciaenid fisheries in
the West coast of Trinidad and Tobago. Pp. 124-137. In Report of the Third Workshop on the Assessment of the Shrimp and Groundfish Fisheries of the Brazil-Guianas Shelf. Belém, Brazil, 24 May- 10 June, 1999. FAO Fish. Rep. 628. Rome, FAO.
Soomai, S., J.C. Seijo. 2000. Case study for a technologically interdependent groundfish fishery: the artisanal multi-species, multi-fleet groundfish fishery of Trinidad. Draft Working Group Report: Fourth FAO/CFRAMP Stock Assessment and Management Workshop on the Shrimp and Groundfish Resources of the Guianas-Brazil Shelf, Cumana´, Venezuela, 2-13 October, 2000.
Southall, T., N. Pfeiffer, S. Singh-Renton, M. Gill. 2011. MSC Sustainable Fisheries Certification: Suriname Atlantic Seabob Shrimp. Final Report. Food Certification International Ltd. 198 p.

36
ANNEX I
CATCH AND EFFORT DATA FOR THE SHRIMP FISHERY IN NBSLME
TABLE 12
Catch, effort, and CPUE of Guyana shrimp fishery
Year Catch Tails1
(ton) Catch Whole2
(ton) Trawlers
Fishing Effort (das)
CPUE (kg/das)
CPUE (ton/trawler)
1998 1935 3019 73 19,710 153 411999 1595 2488 73 19,710 126 342000 1132 1766 73 19,710 90 242001 1888 2945 65 17,550 168 452002 1522 2374 45 12,150 195 532003 1161 1811 45 12,150 149 402004 1086 1694 45 12,150 139 382005 1000 1560 45 12,150 128 352006 1500 2340 45 12,150 193 522007 657 1025 45 12,150 84 232008 931 1452 45 12,150 120 322009 747 1165 31 8,370 139 382010 931 1452 31 8,370 174 472011 368 574 30 8,100 71 192012 512 799 30 8,100 99 272013 653 1019 30 8,100 126 34
1 Source: 1998-2004: FAO 2005; 2005-2006: Maison D. 2007; 2007-2009: Sibeni and Calderini 2015; 2010-2013: CRFM 2013. 2 Conversion factor from whole weight to tail weight: 0.641
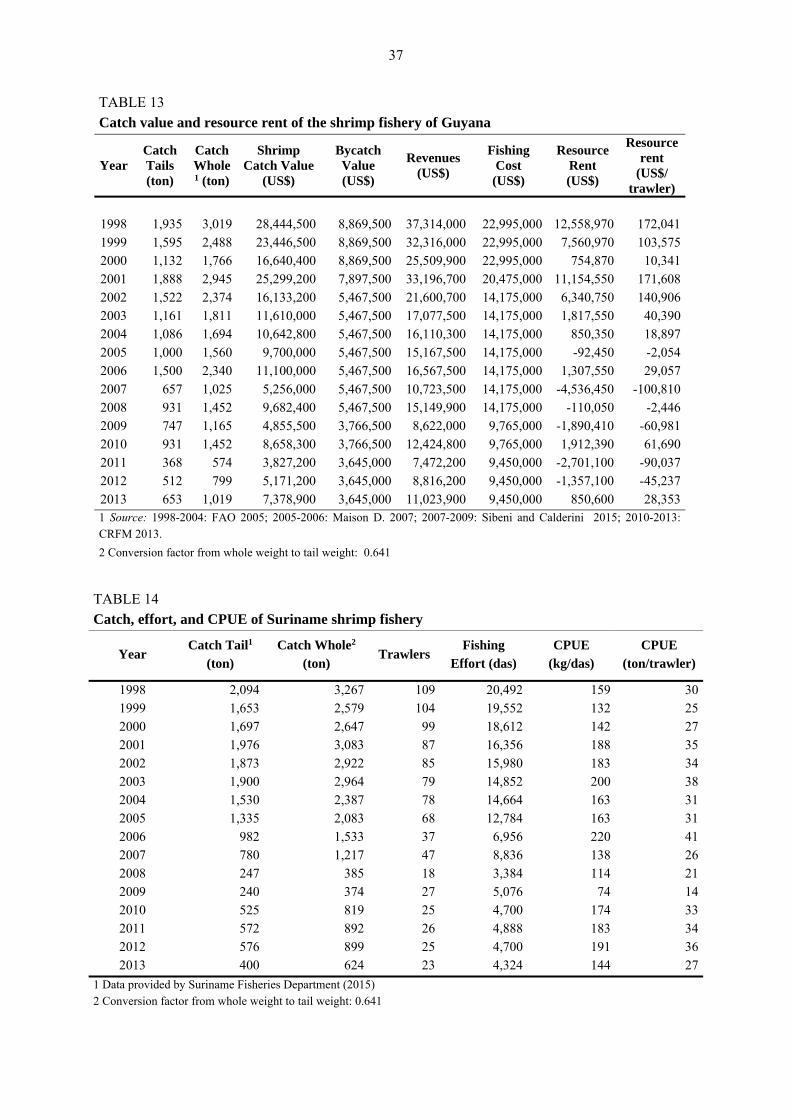
37
TABLE 13
Catch value and resource rent of the shrimp fishery of Guyana
Year Catch Tails (ton)
Catch Whole1 (ton)
Shrimp Catch Value
(US$)
Bycatch Value (US$)
Revenues (US$)
Fishing Cost (US$)
Resource Rent (US$)
Resource rent
(US$/ trawler)
1998 1,935 3,019 28,444,500 8,869,500 37,314,000 22,995,000
12,558,970 172,041 1999 1,595 2,488 23,446,500 8,869,500 32,316,000 22,995,000 7,560,970 103,575 2000 1,132 1,766 16,640,400 8,869,500 25,509,900 22,995,000 754,870 10,341 2001 1,888 2,945 25,299,200 7,897,500 33,196,700 20,475,000 11,154,550 171,608 2002 1,522 2,374 16,133,200 5,467,500 21,600,700 14,175,000 6,340,750 140,906 2003 1,161 1,811 11,610,000 5,467,500 17,077,500 14,175,000 1,817,550 40,390 2004 1,086 1,694 10,642,800 5,467,500 16,110,300 14,175,000 850,350 18,897 2005 1,000 1,560 9,700,000 5,467,500 15,167,500 14,175,000 -92,450 -2,054 2006 1,500 2,340 11,100,000 5,467,500 16,567,500 14,175,000 1,307,550 29,057 2007 657 1,025 5,256,000 5,467,500 10,723,500 14,175,000 -4,536,450 -100,810 2008 931 1,452 9,682,400 5,467,500 15,149,900 14,175,000 -110,050 -2,446 2009 747 1,165 4,855,500 3,766,500 8,622,000 9,765,000 -1,890,410 -60,981 2010 931 1,452 8,658,300 3,766,500 12,424,800 9,765,000 1,912,390 61,690 2011 368 574 3,827,200 3,645,000 7,472,200 9,450,000 -2,701,100 -90,037 2012 512 799 5,171,200 3,645,000 8,816,200 9,450,000 -1,357,100 -45,237 2013 653 1,019 7,378,900 3,645,000 11,023,900 9,450,000 850,600 28,353 1 Source: 1998-2004: FAO 2005; 2005-2006: Maison D. 2007; 2007-2009: Sibeni and Calderini 2015; 2010-2013: CRFM 2013.
2 Conversion factor from whole weight to tail weight: 0.641
TABLE 14
Catch, effort, and CPUE of Suriname shrimp fishery
Year Catch Tail1
(ton) Catch Whole2
(ton) Trawlers
Fishing Effort (das)
CPUE (kg/das)
CPUE (ton/trawler)
1998 2,094 3,267 109 20,492 159 301999 1,653 2,579 104 19,552 132 252000 1,697 2,647 99 18,612 142 272001 1,976 3,083 87 16,356 188 352002 1,873 2,922 85 15,980 183 342003 1,900 2,964 79 14,852 200 382004 1,530 2,387 78 14,664 163 312005 1,335 2,083 68 12,784 163 312006 982 1,533 37 6,956 220 412007 780 1,217 47 8,836 138 262008 247 385 18 3,384 114 212009 240 374 27 5,076 74 142010 525 819 25 4,700 174 332011 572 892 26 4,888 183 342012 576 899 25 4,700 191 362013 400 624 23 4,324 144 27
1 Data provided by Suriname Fisheries Department (2015) 2 Conversion factor from whole weight to tail weight: 0.641
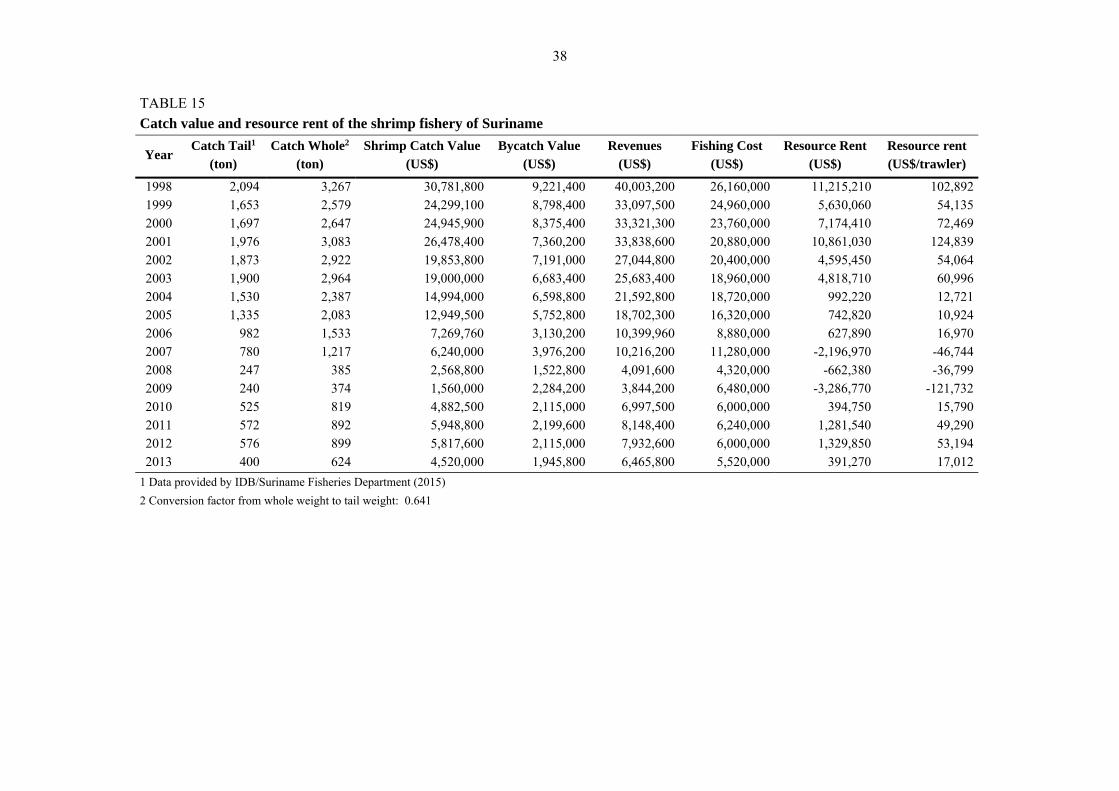
38
TABLE 15
Catch value and resource rent of the shrimp fishery of Suriname
Year Catch Tail1
(ton) Catch Whole2
(ton) Shrimp Catch Value
(US$) Bycatch Value
(US$) Revenues
(US$) Fishing Cost
(US$) Resource Rent
(US$) Resource rent (US$/trawler)
1998 2,094 3,267 30,781,800 9,221,400 40,003,200 26,160,000 11,215,210 102,892 1999 1,653 2,579 24,299,100 8,798,400 33,097,500 24,960,000 5,630,060 54,135 2000 1,697 2,647 24,945,900 8,375,400 33,321,300 23,760,000 7,174,410 72,469 2001 1,976 3,083 26,478,400 7,360,200 33,838,600 20,880,000 10,861,030 124,839 2002 1,873 2,922 19,853,800 7,191,000 27,044,800 20,400,000 4,595,450 54,064 2003 1,900 2,964 19,000,000 6,683,400 25,683,400 18,960,000 4,818,710 60,996 2004 1,530 2,387 14,994,000 6,598,800 21,592,800 18,720,000 992,220 12,721 2005 1,335 2,083 12,949,500 5,752,800 18,702,300 16,320,000 742,820 10,924 2006 982 1,533 7,269,760 3,130,200 10,399,960 8,880,000 627,890 16,970 2007 780 1,217 6,240,000 3,976,200 10,216,200 11,280,000 -2,196,970 -46,744 2008 247 385 2,568,800 1,522,800 4,091,600 4,320,000 -662,380 -36,799 2009 240 374 1,560,000 2,284,200 3,844,200 6,480,000 -3,286,770 -121,732 2010 525 819 4,882,500 2,115,000 6,997,500 6,000,000 394,750 15,790 2011 572 892 5,948,800 2,199,600 8,148,400 6,240,000 1,281,540 49,290 2012 576 899 5,817,600 2,115,000 7,932,600 6,000,000 1,329,850 53,194 2013 400 624 4,520,000 1,945,800 6,465,800 5,520,000 391,270 17,012
1 Data provided by IDB/Suriname Fisheries Department (2015)
2 Conversion factor from whole weight to tail weight: 0.641
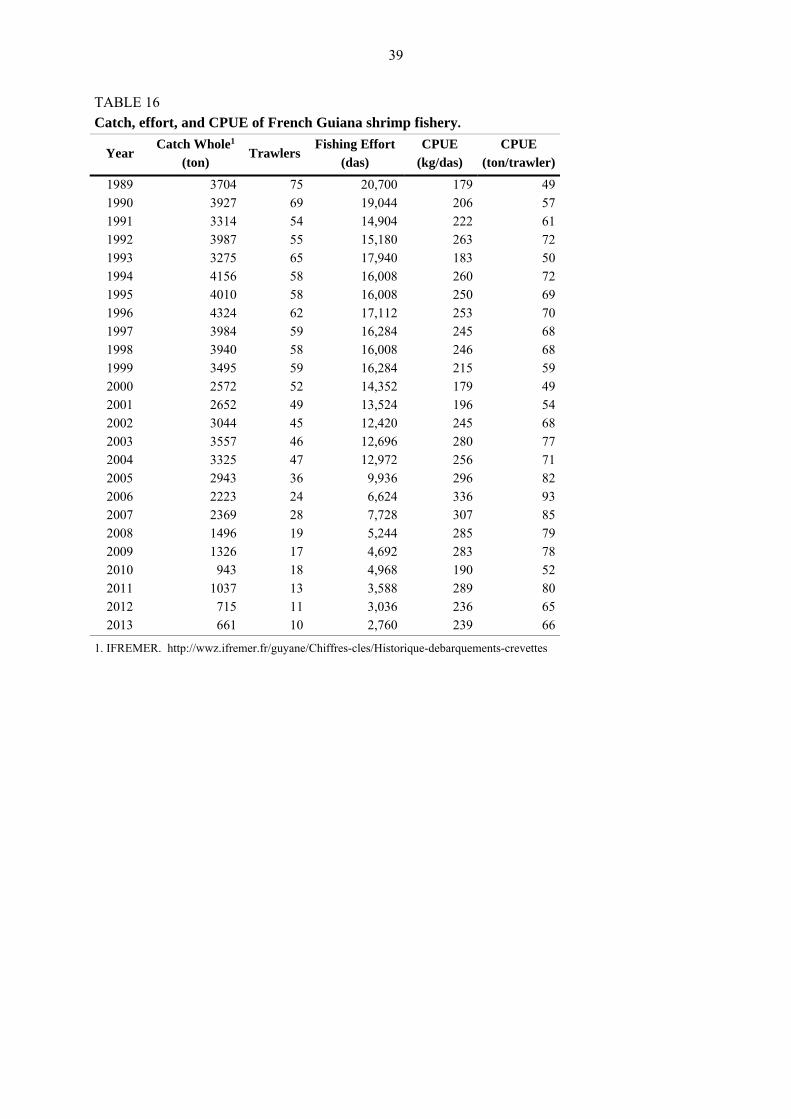
39
TABLE 16
Catch, effort, and CPUE of French Guiana shrimp fishery.
Year Catch Whole1
(ton) Trawlers
Fishing Effort(das)
CPUE (kg/das)
CPUE (ton/trawler)
1989 3704 75 20,700 179 491990 3927 69 19,044 206 571991 3314 54 14,904 222 611992 3987 55 15,180 263 721993 3275 65 17,940 183 501994 4156 58 16,008 260 721995 4010 58 16,008 250 691996 4324 62 17,112 253 701997 3984 59 16,284 245 681998 3940 58 16,008 246 681999 3495 59 16,284 215 592000 2572 52 14,352 179 492001 2652 49 13,524 196 542002 3044 45 12,420 245 682003 3557 46 12,696 280 772004 3325 47 12,972 256 712005 2943 36 9,936 296 822006 2223 24 6,624 336 932007 2369 28 7,728 307 852008 1496 19 5,244 285 792009 1326 17 4,692 283 782010 943 18 4,968 190 522011 1037 13 3,588 289 802012 715 11 3,036 236 652013 661 10 2,760 239 66
1. IFREMER. http://wwz.ifremer.fr/guyane/Chiffres-cles/Historique-debarquements-crevettes

40
TABLE 17
Catch value and resource rent of the shrimp fishery of French Guiana
Year Catch Whole1
(ton) Shrimp Catch Value
(US$) Bycatch Value
(US$) Revenues
(US$) Fishing Cost
(US$) Resource Rent
(US$) Resource rent (US$/trawler)
1989 3,704 24,076,000 11,360,250 11,360,250 43,827,000 -33,966,750 -452,890 1990 3,927 25,525,500 10,451,430 10,451,430 40,320,840 -31,249,410 -452,890 1991 3,314 21,541,000 8,179,380 8,179,380 31,555,440 -24,456,060 -452,890 1992 3,987 25,915,500 8,330,850 8,330,850 32,139,800 -24,908,950 -452,890 1993 3,275 21,287,500 9,845,550 9,845,550 37,983,400 -29,437,850 -452,890 1994 4,156 27,014,000 8,785,260 8,785,260 33,892,880 -26,267,620 -452,890 1995 4,010 26,065,000 8,785,260 8,785,260 33,892,880 -26,267,620 -452,890 1996 4,324 28,106,000 9,391,140 9,391,140 36,230,320 -28,079,180 -452,890 1997 3,984 25,896,000 8,936,730 8,936,730 34,477,240 -26,720,510 -452,890 1998 3,940 25,610,000 8,785,260 45,910,698 33,022,000 11,728,698 202,219 1999 3,495 22,717,500 8,936,730 41,869,067 33,591,000 7,098,067 120,306 2000 2,572 16,718,000 7,876,440 32,111,624 29,608,000 1,463,624 28,147 2001 2,652 17,238,000 7,422,030 30,201,119 27,901,000 1,320,119 26,941 2002 3,044 19,786,000 6,816,150 27,498,912 25,625,000 973,912 21,642 2003 3,557 23,120,500 6,967,620 29,767,990 26,194,000 2,653,990 57,695 2004 3,325 21,612,500 7,119,090 28,006,075 26,763,000 303,075 6,448 2005 2,943 19,129,500 5,452,920 23,751,611 20,504,000 2,527,611 70,211 2006 2,223 14,449,500 3,635,280 14,179,858 13,676,000 23,858 994 2007 2,369 15,398,500 4,241,160 16,389,392 15,952,000 -122,608 -4,379 2008 1,496 9,724,000 2,877,930 12,850,864 10,831,000 1,639,864 86,309 2009 1,326 8,619,000 2,574,990 8,099,769 9,693,000 -1,933,231 -113,719 2010 943 6,129,500 2,726,460 8,347,966 10,262,000 -2,274,034 -126,335 2011 1,037 6,740,500 1,969,110 8,882,167 7,417,000 1,205,167 92,705 2012 715 4,647,500 1,666,170 6,295,152 6,279,000 -203,849 -18,532 2013 661 4,296,500 1,514,700 6,302,521 5,710,000 392,521 39,252
2014 732 4,758,000 1,817,640 1,817,640 6,848,000 -5,270,360 -439,197
1. IFREMER. http://wwz.ifremer.fr/guyane/Chiffres-cles/Historique-debarquements-crevettes
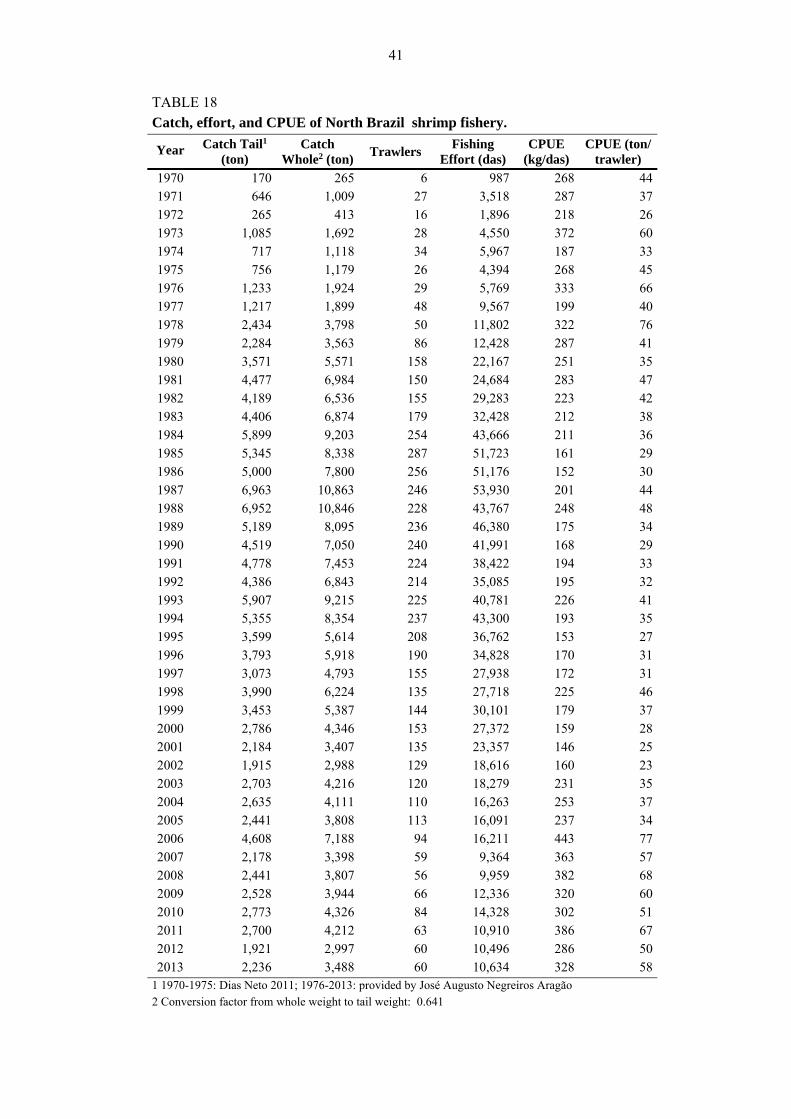
41
TABLE 18
Catch, effort, and CPUE of North Brazil shrimp fishery.
Year Catch Tail1 (ton)
Catch Whole2 (ton)
Trawlers Fishing
Effort (das) CPUE
(kg/das) CPUE (ton/
trawler)
1970 170 265 6 987 268 44 1971 646 1,009 27 3,518 287 37 1972 265 413 16 1,896 218 26 1973 1,085 1,692 28 4,550 372 60 1974 717 1,118 34 5,967 187 33 1975 756 1,179 26 4,394 268 45 1976 1,233 1,924 29 5,769 333 66 1977 1,217 1,899 48 9,567 199 40 1978 2,434 3,798 50 11,802 322 76 1979 2,284 3,563 86 12,428 287 41 1980 3,571 5,571 158 22,167 251 35 1981 4,477 6,984 150 24,684 283 47 1982 4,189 6,536 155 29,283 223 42 1983 4,406 6,874 179 32,428 212 38 1984 5,899 9,203 254 43,666 211 36 1985 5,345 8,338 287 51,723 161 29 1986 5,000 7,800 256 51,176 152 30 1987 6,963 10,863 246 53,930 201 44 1988 6,952 10,846 228 43,767 248 48 1989 5,189 8,095 236 46,380 175 34 1990 4,519 7,050 240 41,991 168 29 1991 4,778 7,453 224 38,422 194 33 1992 4,386 6,843 214 35,085 195 32 1993 5,907 9,215 225 40,781 226 41 1994 5,355 8,354 237 43,300 193 35 1995 3,599 5,614 208 36,762 153 27 1996 3,793 5,918 190 34,828 170 31 1997 3,073 4,793 155 27,938 172 31 1998 3,990 6,224 135 27,718 225 46 1999 3,453 5,387 144 30,101 179 37 2000 2,786 4,346 153 27,372 159 28 2001 2,184 3,407 135 23,357 146 25 2002 1,915 2,988 129 18,616 160 23 2003 2,703 4,216 120 18,279 231 35 2004 2,635 4,111 110 16,263 253 37 2005 2,441 3,808 113 16,091 237 34 2006 4,608 7,188 94 16,211 443 77 2007 2,178 3,398 59 9,364 363 57 2008 2,441 3,807 56 9,959 382 68 2009 2,528 3,944 66 12,336 320 60 2010 2,773 4,326 84 14,328 302 51 2011 2,700 4,212 63 10,910 386 67 2012 1,921 2,997 60 10,496 286 50 2013 2,236 3,488 60 10,634 328 58
1 1970-1975: Dias Neto 2011; 1976-2013: provided by José Augusto Negreiros Aragão 2 Conversion factor from whole weight to tail weight: 0.641
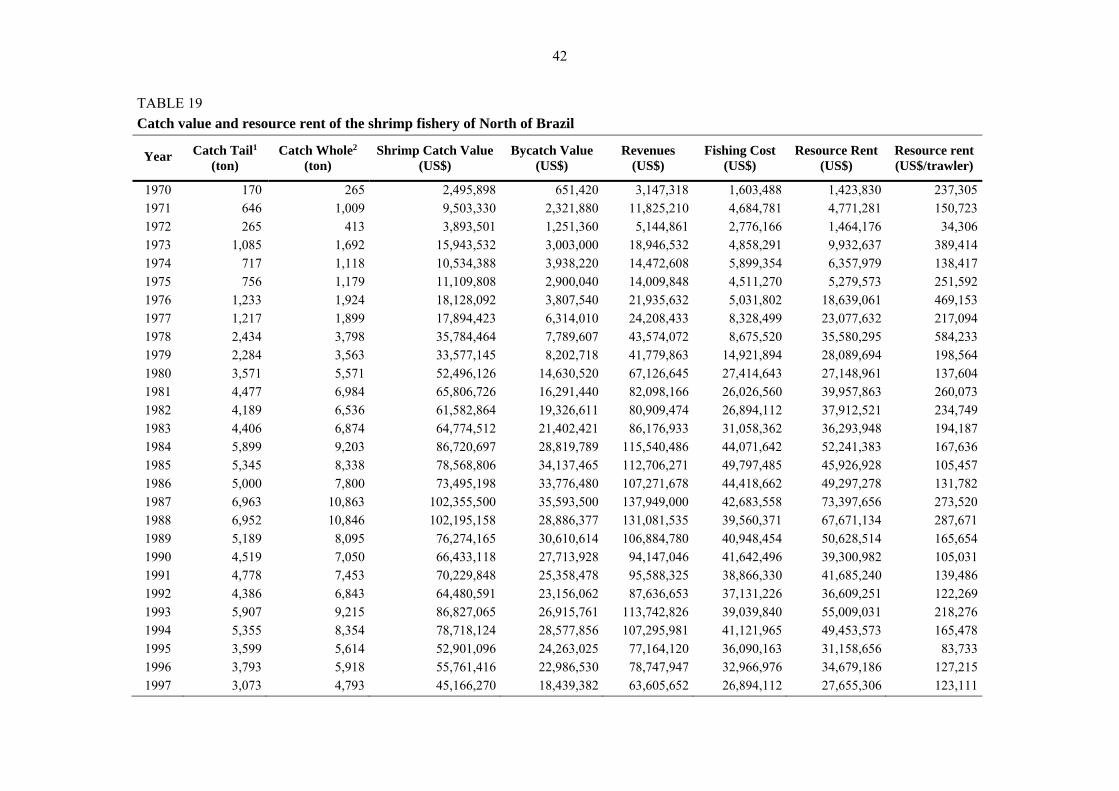
42
TABLE 19
Catch value and resource rent of the shrimp fishery of North of Brazil
Year Catch Tail1 (ton)
Catch Whole2 (ton)
Shrimp Catch Value (US$)
Bycatch Value (US$)
Revenues (US$)
Fishing Cost (US$)
Resource Rent (US$)
Resource rent (US$/trawler)
1970 170 265 2,495,898 651,420 3,147,318 1,603,488 1,423,830 237,305 1971 646 1,009 9,503,330 2,321,880 11,825,210 4,684,781 4,771,281 150,723 1972 265 413 3,893,501 1,251,360 5,144,861 2,776,166 1,464,176 34,306 1973 1,085 1,692 15,943,532 3,003,000 18,946,532 4,858,291 9,932,637 389,414 1974 717 1,118 10,534,388 3,938,220 14,472,608 5,899,354 6,357,979 138,417 1975 756 1,179 11,109,808 2,900,040 14,009,848 4,511,270 5,279,573 251,592 1976 1,233 1,924 18,128,092 3,807,540 21,935,632 5,031,802 18,639,061 469,153 1977 1,217 1,899 17,894,423 6,314,010 24,208,433 8,328,499 23,077,632 217,094 1978 2,434 3,798 35,784,464 7,789,607 43,574,072 8,675,520 35,580,295 584,233 1979 2,284 3,563 33,577,145 8,202,718 41,779,863 14,921,894 28,089,694 198,564 1980 3,571 5,571 52,496,126 14,630,520 67,126,645 27,414,643 27,148,961 137,604 1981 4,477 6,984 65,806,726 16,291,440 82,098,166 26,026,560 39,957,863 260,073 1982 4,189 6,536 61,582,864 19,326,611 80,909,474 26,894,112 37,912,521 234,749 1983 4,406 6,874 64,774,512 21,402,421 86,176,933 31,058,362 36,293,948 194,187 1984 5,899 9,203 86,720,697 28,819,789 115,540,486 44,071,642 52,241,383 167,636 1985 5,345 8,338 78,568,806 34,137,465 112,706,271 49,797,485 45,926,928 105,457 1986 5,000 7,800 73,495,198 33,776,480 107,271,678 44,418,662 49,297,278 131,782 1987 6,963 10,863 102,355,500 35,593,500 137,949,000 42,683,558 73,397,656 273,520 1988 6,952 10,846 102,195,158 28,886,377 131,081,535 39,560,371 67,671,134 287,671 1989 5,189 8,095 76,274,165 30,610,614 106,884,780 40,948,454 50,628,514 165,654 1990 4,519 7,050 66,433,118 27,713,928 94,147,046 41,642,496 39,300,982 105,031 1991 4,778 7,453 70,229,848 25,358,478 95,588,325 38,866,330 41,685,240 139,486 1992 4,386 6,843 64,480,591 23,156,062 87,636,653 37,131,226 36,609,251 122,269 1993 5,907 9,215 86,827,065 26,915,761 113,742,826 39,039,840 55,009,031 218,276 1994 5,355 8,354 78,718,124 28,577,856 107,295,981 41,121,965 49,453,573 165,478 1995 3,599 5,614 52,901,096 24,263,025 77,164,120 36,090,163 31,158,656 83,733 1996 3,793 5,918 55,761,416 22,986,530 78,747,947 32,966,976 34,679,186 127,215 1997 3,073 4,793 45,166,270 18,439,382 63,605,652 26,894,112 27,655,306 123,111
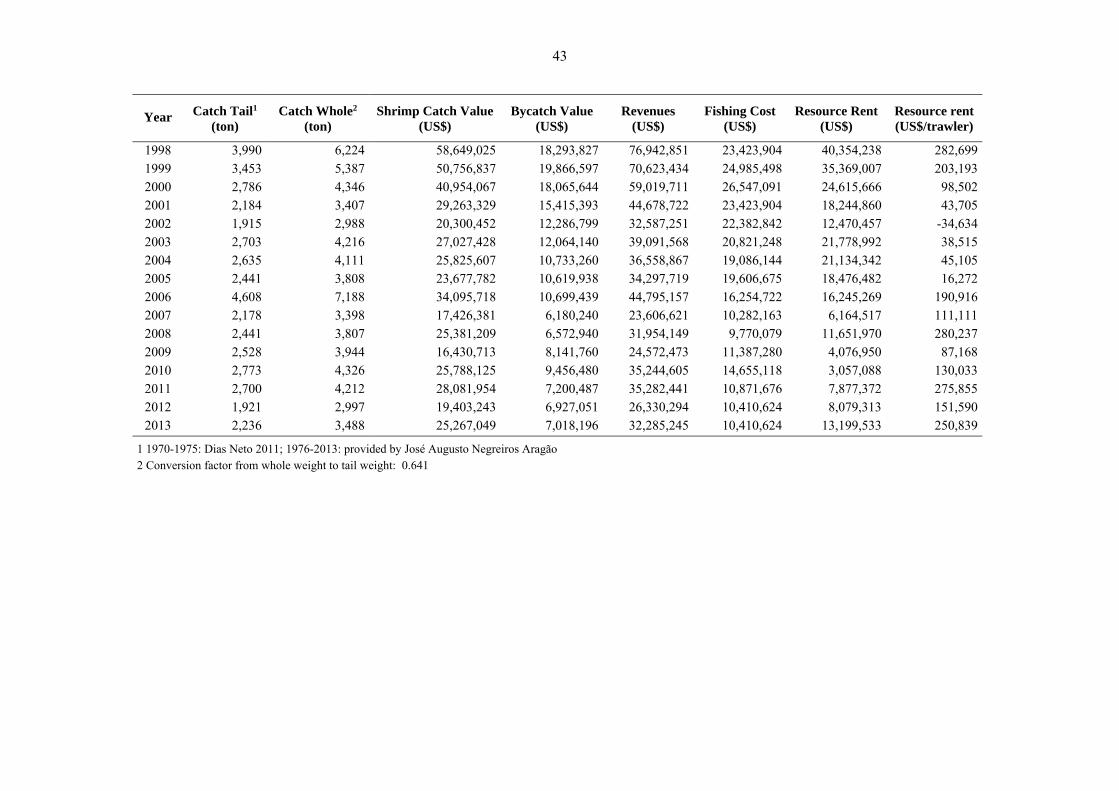
43
Year Catch Tail1 (ton)
Catch Whole2 (ton)
Shrimp Catch Value (US$)
Bycatch Value (US$)
Revenues (US$)
Fishing Cost (US$)
Resource Rent (US$)
Resource rent (US$/trawler)
1998 3,990 6,224 58,649,025 18,293,827 76,942,851 23,423,904 40,354,238 282,699 1999 3,453 5,387 50,756,837 19,866,597 70,623,434 24,985,498 35,369,007 203,193 2000 2,786 4,346 40,954,067 18,065,644 59,019,711 26,547,091 24,615,666 98,502 2001 2,184 3,407 29,263,329 15,415,393 44,678,722 23,423,904 18,244,860 43,705 2002 1,915 2,988 20,300,452 12,286,799 32,587,251 22,382,842 12,470,457 -34,634 2003 2,703 4,216 27,027,428 12,064,140 39,091,568 20,821,248 21,778,992 38,515 2004 2,635 4,111 25,825,607 10,733,260 36,558,867 19,086,144 21,134,342 45,105 2005 2,441 3,808 23,677,782 10,619,938 34,297,719 19,606,675 18,476,482 16,272 2006 4,608 7,188 34,095,718 10,699,439 44,795,157 16,254,722 16,245,269 190,916 2007 2,178 3,398 17,426,381 6,180,240 23,606,621 10,282,163 6,164,517 111,111 2008 2,441 3,807 25,381,209 6,572,940 31,954,149 9,770,079 11,651,970 280,237 2009 2,528 3,944 16,430,713 8,141,760 24,572,473 11,387,280 4,076,950 87,168 2010 2,773 4,326 25,788,125 9,456,480 35,244,605 14,655,118 3,057,088 130,033 2011 2,700 4,212 28,081,954 7,200,487 35,282,441 10,871,676 7,877,372 275,855 2012 1,921 2,997 19,403,243 6,927,051 26,330,294 10,410,624 8,079,313 151,590 2013 2,236 3,488 25,267,049 7,018,196 32,285,245 10,410,624 13,199,533 250,839
1 1970-1975: Dias Neto 2011; 1976-2013: provided by José Augusto Negreiros Aragão 2 Conversion factor from whole weight to tail weight: 0.641
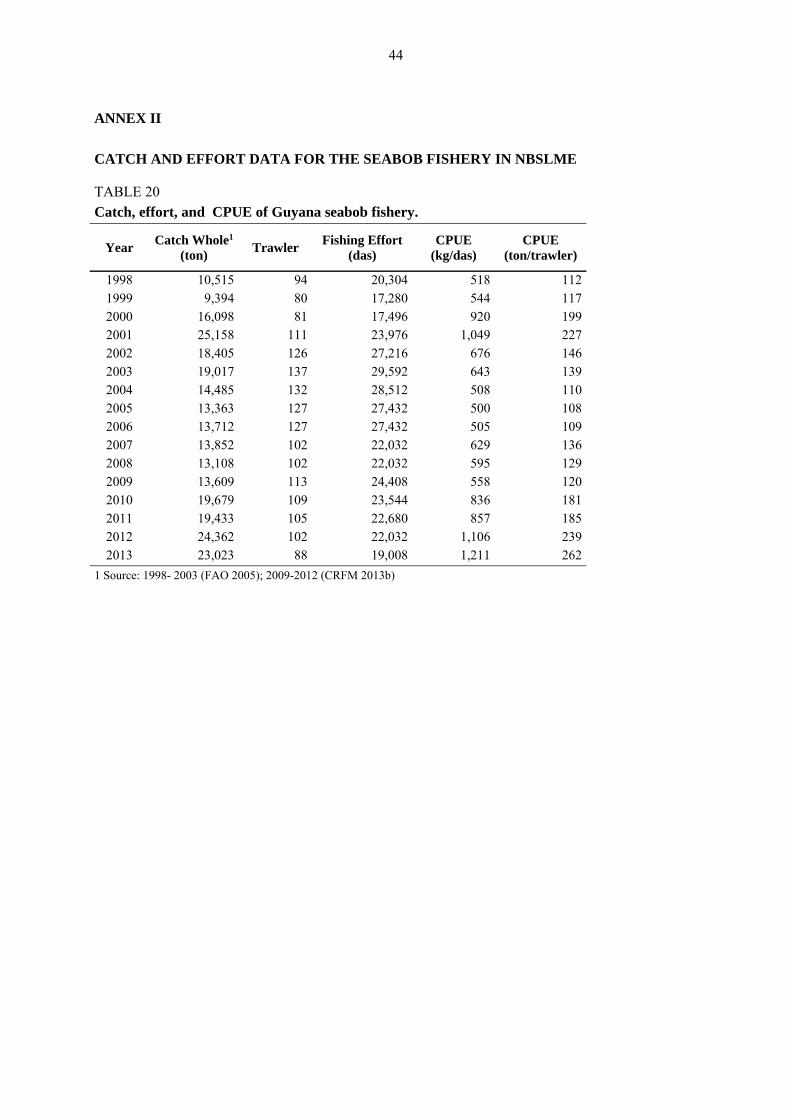
44
ANNEX II
CATCH AND EFFORT DATA FOR THE SEABOB FISHERY IN NBSLME
TABLE 20
Catch, effort, and CPUE of Guyana seabob fishery.
Year Catch Whole1
(ton) Trawler
Fishing Effort (das)
CPUE (kg/das)
CPUE (ton/trawler)
1998 10,515 94 20,304 518 112 1999 9,394 80 17,280 544 117 2000 16,098 81 17,496 920 199 2001 25,158 111 23,976 1,049 227 2002 18,405 126 27,216 676 146 2003 19,017 137 29,592 643 139 2004 14,485 132 28,512 508 110 2005 13,363 127 27,432 500 108 2006 13,712 127 27,432 505 109 2007 13,852 102 22,032 629 136 2008 13,108 102 22,032 595 129 2009 13,609 113 24,408 558 120 2010 19,679 109 23,544 836 181 2011 19,433 105 22,680 857 185 2012 24,362 102 22,032 1,106 239 2013 23,023 88 19,008 1,211 262
1 Source: 1998- 2003 (FAO 2005); 2009-2012 (CRFM 2013b)

45
TABLE 21
Catch value and resource rent of the seabob fishery of Guyana
Year Catch Whole1 (ton)
Seabob Catch Value (US$)
Bycatch Value (US$)
Revenues (US$)
Fishing Cost (US$)
Resource Rent (US$)
Resource Rent (US$/trawler)
1998 10,515 23,133,000 6,566,314 29,699,314 25,380,000 3,755,314 39,950 1999 9,394 20,666,800 5,588,352 26,255,152 21,600,000 4,175,152 52,189 2000 16,098 35,415,600 5,658,206 41,073,806 21,870,000 18,717,806 231,084 2001 25,158 55,347,600 7,753,838 63,101,438 29,970,000 32,465,438 292,481 2002 18,405 40,491,000 8,801,654 49,292,654 34,020,000 14,516,654 115,212 2003 19,017 41,837,400 9,570,053 51,407,453 36,990,000 13,595,453 99,237 2004 14,485 31,867,000 9,220,781 41,087,781 35,640,000 4,655,781 35,271 2005 13,363 29,398,600 8,871,509 38,270,109 34,290,000 3,218,109 25,339 2006 13,712 30,166,400 8,871,509 39,037,909 34,290,000 3,985,909 31,385 2007 13,852 30,474,400 7,125,149 37,599,549 27,540,000 9,447,549 92,623 2008 13,108 28,837,600 7,125,149 35,962,749 27,540,000 7,810,749 76,576 2009 13,609 29,939,800 7,893,547 37,833,347 30,510,000 6,645,347 58,808 2010 19,679 43,293,800 7,614,130 50,907,930 29,430,000 20,823,930 191,045 2011 19,433 42,752,600 7,334,712 50,087,312 28,350,000 21,107,312 201,022 2012 24,362 53,596,400 7,125,149 60,721,549 27,540,000 32,569,549 319,309 2013 23,023 50,650,600 6,147,187 56,797,787 23,760,000 32,509,787 369,429
1 Source: 1998- 2003 (FAO 2005); 2009-2012 (CRFM 2013b)

46
TABLE 22
Catch, effort, and CPUE of Suriname seabob fishery
Year Catch Whole1,2 (ton)
Trawler Fishing Effort
(das) CPUE
(kg/das) CPUE
(ton/trawler)
1998 3,192 21 2,772 1,151 152 1999 7,078 24 3,588 1,973 295 2000 14,509 24 3,456 4,198 605 2001 18,034 24 4,020 4,486 751 2002 15,641 24 4,716 3,317 652 2003 18,924 27 4,764 3,972 701 2004 16,485 27 5,292 3,115 611 2005 13,927 30 5,592 2,490 464 2006 16,131 25 4,656 3,465 645 2007 12,844 28 4,116 3,121 459 2008 9,396 24 5,064 1,856 392 2009 14,563 25 4,755 3,063 583 2010 11,856 20 3,969 2,987 593 2011 10,969 19 3,649 3,006 577 2012 11,222 21 3,882 2,891 534 2013 12,532 22 3,571 3,509 570
1 Source: Suriname Fisheries Department (2013) 2 Conversion from tail weight to whole weight using a conversion factor = 0.641
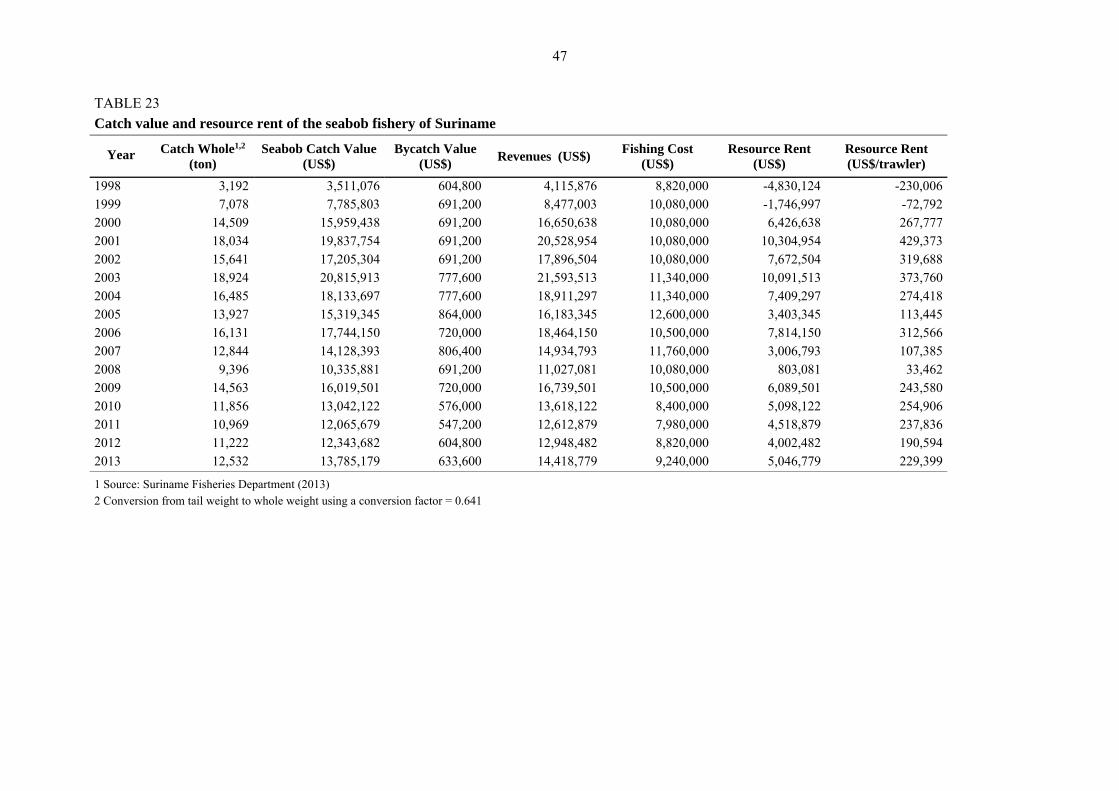
47
TABLE 23
Catch value and resource rent of the seabob fishery of Suriname
Year Catch Whole1,2 (ton)
Seabob Catch Value (US$)
Bycatch Value (US$)
Revenues (US$) Fishing Cost
(US$) Resource Rent
(US$) Resource Rent (US$/trawler)
1998 3,192 3,511,076 604,800 4,115,876 8,820,000 -4,830,124 -230,006 1999 7,078 7,785,803 691,200 8,477,003 10,080,000 -1,746,997 -72,792 2000 14,509 15,959,438 691,200 16,650,638 10,080,000 6,426,638 267,777 2001 18,034 19,837,754 691,200 20,528,954 10,080,000 10,304,954 429,373 2002 15,641 17,205,304 691,200 17,896,504 10,080,000 7,672,504 319,688 2003 18,924 20,815,913 777,600 21,593,513 11,340,000 10,091,513 373,760 2004 16,485 18,133,697 777,600 18,911,297 11,340,000 7,409,297 274,418 2005 13,927 15,319,345 864,000 16,183,345 12,600,000 3,403,345 113,445 2006 16,131 17,744,150 720,000 18,464,150 10,500,000 7,814,150 312,566 2007 12,844 14,128,393 806,400 14,934,793 11,760,000 3,006,793 107,385 2008 9,396 10,335,881 691,200 11,027,081 10,080,000 803,081 33,462 2009 14,563 16,019,501 720,000 16,739,501 10,500,000 6,089,501 243,580 2010 11,856 13,042,122 576,000 13,618,122 8,400,000 5,098,122 254,906 2011 10,969 12,065,679 547,200 12,612,879 7,980,000 4,518,879 237,836 2012 11,222 12,343,682 604,800 12,948,482 8,820,000 4,002,482 190,594 2013 12,532 13,785,179 633,600 14,418,779 9,240,000 5,046,779 229,399
1 Source: Suriname Fisheries Department (2013) 2 Conversion from tail weight to whole weight using a conversion factor = 0.641
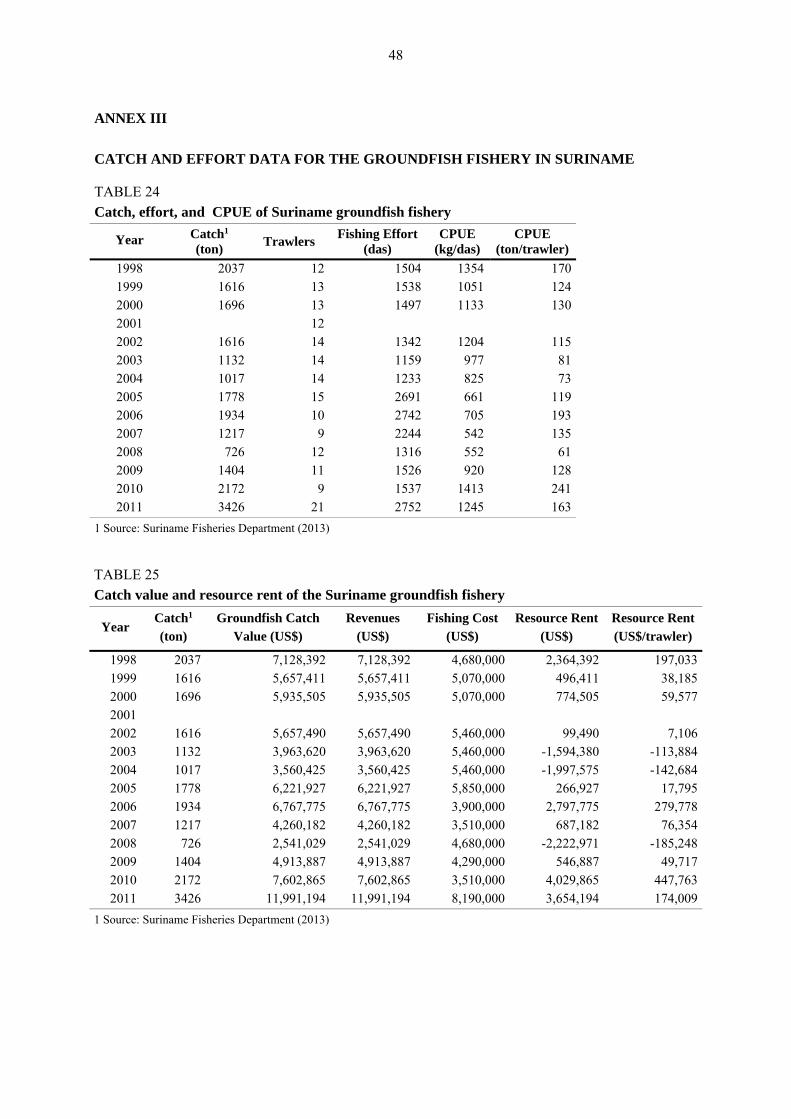
48
ANNEX III
CATCH AND EFFORT DATA FOR THE GROUNDFISH FISHERY IN SURINAME
TABLE 24
Catch, effort, and CPUE of Suriname groundfish fishery
Year Catch1 (ton)
Trawlers Fishing Effort
(das) CPUE
(kg/das) CPUE
(ton/trawler)
1998 2037 12 1504 1354 170 1999 1616 13 1538 1051 124 2000 1696 13 1497 1133 130 2001 12 2002 1616 14 1342 1204 115 2003 1132 14 1159 977 81 2004 1017 14 1233 825 73 2005 1778 15 2691 661 119 2006 1934 10 2742 705 193 2007 1217 9 2244 542 135 2008 726 12 1316 552 61 2009 1404 11 1526 920 128 2010 2172 9 1537 1413 241 2011 3426 21 2752 1245 163
1 Source: Suriname Fisheries Department (2013)
TABLE 25
Catch value and resource rent of the Suriname groundfish fishery
Year Catch1 (ton)
Groundfish Catch Value (US$)
Revenues (US$)
Fishing Cost (US$)
Resource Rent (US$)
Resource Rent (US$/trawler)
1998 2037 7,128,392 7,128,392 4,680,000 2,364,392 197,0331999 1616 5,657,411 5,657,411 5,070,000 496,411 38,1852000 1696 5,935,505 5,935,505 5,070,000 774,505 59,5772001 2002 1616 5,657,490 5,657,490 5,460,000 99,490 7,1062003 1132 3,963,620 3,963,620 5,460,000 -1,594,380 -113,8842004 1017 3,560,425 3,560,425 5,460,000 -1,997,575 -142,6842005 1778 6,221,927 6,221,927 5,850,000 266,927 17,7952006 1934 6,767,775 6,767,775 3,900,000 2,797,775 279,7782007 1217 4,260,182 4,260,182 3,510,000 687,182 76,3542008 726 2,541,029 2,541,029 4,680,000 -2,222,971 -185,2482009 1404 4,913,887 4,913,887 4,290,000 546,887 49,7172010 2172 7,602,865 7,602,865 3,510,000 4,029,865 447,7632011 3426 11,991,194 11,991,194 8,190,000 3,654,194 174,009
1 Source: Suriname Fisheries Department (2013)
49
CHAPTER II
REVIEW OF MANAGEMENT CONTROLS USED IN SHRIMP AND GROUNDFISH FISHERIES OPERATING ON THE BRAZIL-GUIANAS SHELF
by
Paul Medley
Review of Management Controls Used in Shrimp and Groundfish Fisheries Operating on the Brazil-Guianas Shelf
1. INTRODUCTION
This report is a comparative analysis of management measures based on the variety of input and output controls used in shrimp and groundfish fisheries in Brazil, French Guiana, Surinam, Guyana, Trinidad and Tobago and Venezuela. The report also outlines management options that might be taken at the national and regional levels to address weaknesses in the current arrangements.
The stated goal of all controls used in the region is to achieve sustainable fisheries, while meeting socio-economic objectives of employment, income and food security. Management controls are designed to achieve this by limiting fishing mortality to sustainable levels as well as adjusting selectivity so that the value of the landings are maximised, while waste and unnecessary impacts on the ecosystem are reduced. In some cases, controls have been directed at protecting employment and income in the poorer artisanal fisheries. Most fisheries have policy and management plans, at least in draft form, which state goals consistent with FAO Code of Conduct and the Ecosystem Approach to Fisheries1 (EAF.) However, applying appropriate controls over fishing to achieve these goals appears to be challenging.
2. CONTROLS BEING APPLIED
2.1 Overview
All controls that are being applied by Brazil, French Guiana, Suriname, Guyana, Trinidad and Tobago and Venezuela are listed in Appendix 1. Most controls are input controls that limit fishing power and alter gear selectivity to improve outcomes for the fishery. Output controls such as catch limits and minimum sizes are less common.
The most widely used controls are limited licensing for industrial fisheries, mesh or hook size limits and zones where only particular types of fishing are allowed. Precise reasons for each of these controls are rarely given, but they appear to aim to limit fishing mortality to sustainable levels, improve gear selectivity and reduce conflict between different gears and fleets, as suggested below.
Recent changes include banning of all industrial shrimp trawling in Venezuela waters in 2009, implementation of a harvest control rule in Suriname in 2010, and an expansion in the requirement for larger vessels to carry a satellite-based Vessel Monitoring System that allows vessel activities to be
1 An ecosystem approach to fisheries (EAF) balances diverse objectives, by taking into account the knowledge and uncertainties about all ecosystem components and their interactions, and applying an integrated approach to fisheries within ecologically meaningful boundaries.

50
tracked remotely. Likely changes to be introduced shortly include a closed season for shrimp trawling in Trinidad and a harvest control rule in Guyana similar to that used in Suriname. These initiatives illustrate what is possible within the region to help fisheries meet their overall objectives.
The current set of controls applied in these fisheries appear to be reactive rather than pro-active in that they have been implemented to resolve specific problems rather than as part of a plan to minimise risks and optimise benefits from these resources.
2.2 Capacity Controls
Controls on overall fishing capacity are the most widely used controls in shrimp and groundfish fisheries in the Brazil-Guianas shelf. This is the most basic control on the maximum fishing mortality that might be applied, as well as a limit on investment into the fishery, which can lead to an incentive to overfish. As such, it is an input control, as it sets a maximum level for fishing effort and is related to direct controls on fishing effort (see Fishing Effort Controls).
Implemented controls primarily limit the number of vessels and vessel fishing power through licensing and regulation. All industrial (mainly shrimp) fisheries apply some sort of licence regime with a limit on engine power. Other fisheries limit entry and net dimensions, for example.
The pin seine fishery in Suriname limits the density of the seines over the available fishing locations. This in essence limits capacity and overall fishing mortality for this gear.
2.3 Fishing Effort Controls
Fishing effort controls are a direct control on the amount of effort by a vessel or a fleet. These controls are either the amount of gear deployed for passive gears (e.g. longline or gillnets) or the amount of fishing for active gears (e.g. trawls). There is a direct control on total fishing effort (days-at-sea) in the Guyana and Suriname seabob fisheries. Limits on fishing capacity have been assumed to provide an adequate limit on fishing effort, so direct controls are not widely used. Capacity limits are static and difficult to adjust and therefore they are vulnerable to error (being set too low or too high) or changes in productivity. Direct controls on fishing effort are able to adjust to errors more precisely and therefore should be able to exploit resources more safely at higher fishing mortality levels.
2.4 Landings Controls
In many countries outside the region, landings quotas are the most important controls on fishing mortality. They are output controls in that they limit what the fishery produces. Usually they are set as an overall total allowable catch (TAC) for each stock, but to be effective very often individual quotas are set which can be bought and sold by fishers. These controls have been found difficult to set and administer if they are to be effective, but can lead to very economically efficient fisheries.
The only TAC set in the region is for the French Guiana penaeid shrimp fishery. This fishery is under the jurisdiction of France, which applies the EU fisheries policy. In practice, catches have not reached the TAC, which has been fixed since 1983. The number of vessel licences that have been issued has been reduced over time, and this seems to be the limiting factor on the catches of shrimp in this fishery.
51
2.5 Gear Controls
Gear controls are widely applied. These include mesh size, prohibition of particular gears and disallowing some materials in net construction. The primary aim of these controls is to improve gear selectivity to reduce unintended fishing mortality and increase the value of the catch.
Gear controls have generally not been evaluated quantitatively, but have been set based on qualitative considerations of catches being landed and reported levels of discarding. It is therefore not clear that current regulation is optimised.
Discarding bycatch is a particular problem in shrimp trawling. Two initiatives have been introduced to reduce bycatch. Turtle Excluder Devices (TED) must be used where shrimp are subsequently exported to the USA. Therefore, a number of countries have a requirement for TED to be fitted, mainly in larger demersal trawl vessels. Compliance is likely inconsistent across the different fleets, but on the whole use of TEDs will have decreased mortality not only of turtles, but also all larger sea animals, such as sharks, rays, sawfish and sea mammals. TEDs are required on all industrial and semi-industrial shrimp trawl vessels of Brazil, Trinidad and Tobago, Suriname and Guyana.
Another gear adaptation that has recently been introduced is the bycatch reduction device (BRD). This has been introduced into seabob trawls in Suriname and Guyana, and reduces the discarded catch of small fish.
In both cases of bycatch reduction, the main complaint from fishers has been that they tend to reduce their shrimp catch rates for various reasons. For example, a complaint in Trinidad has been that fish, such as rays, can get jammed in the TED, significantly reducing the effectiveness of the gear. On the positive side, fishers report that sorting catch on deck takes less time. There is also an argument that the quality of the catch may improve through use of these devices (less damage in the net, and the catch is processed and stored more quickly).
2.6 Season Controls
Closed seasons have been introduced in a number of fisheries. These have had three purposes. The primary effect has been to reduce fishing mortality, so effectively they are a control on fishing effort or capacity (see Capacity Controls and Fishing Effort Controls). A second reason has been to protect recruits or spawning stock from fishing. Protecting recruits so that they can grow a little more before capture is justified for fast growing species, such as tropical shrimp. Protecting the spawning stock, when used as an argument for seasonal closure, is more vague, but there is a strong argument to protect spawning aggregations from excessive fishing.
2.7 Area Controls
Area-based controls are very widely used. Most area controls are zones for different fishing activity, primary set to avoid conflict between fleets – for example, industrial demersal trawl is not compatible with artisanal gillnets, so areas need to be demarked where different fleets are allowed to operate without interference. In many cases, separation is achieved by defining distance from the coast or by bathymetric isoclines. Shallower areas are usually allocated to artisanal fisheries often operating passive gears, which may have a lower habitat impact. It is therefore fortunate that coastal areas also often have more vulnerable habitat, such as seagrass, which may have thereby received some, albeit limited, protection because heavier active gears (e.g. trawl) are forced to operate outside these

52
areas.However, such protection may still not be enough depending on the extent of fishing activity in sensitive areas.
“No take” zones where no fishing is allowed do exist, but are often limited in extent. They are usually justified based on qualitative considerations, and are difficult to assess quantitatively. The usual justification, protection of vulnerable habitat, has not been used in this region. Many no-take zones exist focused on protecting habitat (e.g. coral reefs and vulnerable species) beyond the scope of this report (i.e. are beyond the Brazil Guianas continental shelf region). Much of the relevant habitat in Brazil-Guianas coastal areas may not be vulnerable to fishing activity, but may face greater threats from other human activities. Habitats which are subject to greater natural disturbance, such as sedimentation from rivers, may tolerate greater physical disturbance from fishing activities. However, “no take” areas have been justified based on capture of juveniles and high discard rates. The largest of these is in Brazil around the mouths of the Amazonas and Pará Rivers. Such no take zones could, where they can be enforced, provide a valuable tool to rebuild and buffer fish stocks against overfishing particularly in the absence of more precise tools.
3. CONTROLS NOT USED
Although a wide number of measures to limit fishing mortality and prevent the dissipation of economic benefits exist, a number of other measures used in other fisheries are not applied in the Brazil-Guianas shrimp and groundfish fisheries. On the whole, these are probably not used with good reason, but it is worth identifying all possible controls in case, at some future date, they become more appropriate at improving fisheries.
3.1 Individual Transferable Quotas
Individual Transferable Quotas (ITQ) are used to allocate a TAC to individuals by dividing the maximum catch into smaller quotas. The arguments for this are that ITQs develop an incentive to sustain a fishery and improve a fishery’s economic efficiency. However, they can lead to greater inequality with a smaller number of individuals controlling the majority of the quota. To avoid the various problems and ensure enforcement, very sophisticated administration systems are required that are difficult to implement. Although a TAC is set for one fishery, it is not set at a low enough value to limit fishing. Given the difficulties with implementing a TAC let alone ITQs, it is unlikely that a catch based ITQ would be appropriate.
ITQs could have a role, however, in input controls and specifically fishing effort. The Suriname seabob trawl fishery runs a total annual quota for days-at-sea which is adjusted according to a harvest control rule. This has not been allocated to individual vessels, but could be. A similar proposal has been made for Guyana seabob, but it has been proposed to allocate the quota as days-at-sea to each licenced vessel, where the number of vessels have been limited. As all vessels must carry VMS, the quota should be easy to enforce. However, there has been no discussion yet about whether such days-at-sea are owned or transferable.
3.2 Vessel Decision Rules
Some fisheries in the region, such as the Suriname seabob fishery, have a written “code of conduct” for the fishers, covering vessel operations. This is a useful approach to explicitly address what is best practice on board vessels, and provides a focus for training as well as a definition of fishers’ responsibilities in maintaining their right to fish. Making any code of conduct at sea binding would be

53
difficult, particularly for artisanal fishers. However, a code of conduct would provide a useful definition of good practice and any increase in compliance with good practice at sea, even if not 100 percent, should be beneficial. A fisher code of conduct would set a standard which could be promoted through outreach programmes, for example. Separate, but consistent, codes of conduct for artisanal and industrial trawlers, liners, and gillnetters could be developed for the region.
Move-on Rules are used in a number of fisheries, primarily to reduce bycatch, but also where there is evidence of excessive impact on vulnerable marine habitat. In some cases they rely on fishers complying with simple rules, but they are most likely to work where scientific observers are available to check that rules are being complied with. The rules themselves are straight-forward. They generally consist of simple criteria that can be ascertained while at sea before action is taken - for example, more than 50 percent of the catch weight in a location has been discarded. The action then requires a simple operation, for example that the vessel moves 10km from where the high discard rate occurred before re-setting the gear. A more sophisticated form of the rule would be the area is temporarily closed to all fishing. These sorts of controls can be achieved with VMS and good communications among vessels and managers while vessels are at sea.
Move-on rules provide a good way to reduce and avoid unwanted bycatch and habitat damage. They are highly adaptive and require little baseline knowledge. Fishers will learn to avoid areas with high probability of bycatch and if such areas shift, the response will automatically update based on the experience of the skippers. However, such rules are difficult to enforce without observers and if not well designed, difficult to implement at sea.
For the Brazil-Guianas fisheries without scientific observers on board vessels, it will be difficult to get this sort of system to work. However, with increasing use of VMS, it may still become possible to develop a more adaptive system than fixed closed areas, for example, so the approach should be considered in some fisheries.
A number of fisheries within the Brazil Guianas region are beginning to use VMS coupled with other monitoring devices, such as video cameras, on board vessels as a cheaper and safer way to observe fishing operations without putting on board a scientific observer. These systems are sophisticated and still in development, making them probably too expensive to apply routinely. However, they could in the foreseeable future form part of a research project as a way to gather information to design better controls.
3.3 Taxation and Fees
Taxation and fees are used in fisheries, but to a limited extent. They are useful in artificially raising fishing costs so that even if fishing is uncontrolled in other ways, not all economic rent is dissipated. Taxes are most useful when linked to fishing effort, which for active gears, would be a tax on fuel.
Taxation and fees are, not surprisingly, unpopular among fishers. For many fisheries, taxes, if not fuel, are waived as a way to promote fishing as historically this is seen as a sector to be developed. It would make sense to remove such waivers gradually, perhaps replacing this with support in other areas, such as providing inexpensive ice or better facilities to reduce post-harvest losses or support the introduction of effective bycatch-reduction devices.
54
4. CONTROL EFFECTIVENESS
Most management controls within the region have not been evaluated to determine whether they are effective. In some cases, the objectives of the control are unclear. How effectiveness should be judged depends on the management control. Any control limiting total mortality can be assessed through stock assessment. While full stock assessment can be the ultimate test for most management controls, simpler assessments, based on monitoring simple indicators before and after new controls have been implemented, can be used to test efficacy. Data are often insufficient for reliable stock assessments, and stock assessments have often been limited to target species.
Recent stock assessments have been conducted on Guyana and Suriname seabob, suggesting that current controls are effective at limiting fishing mortality to sustainable levels in these fisheries. Stock assessments have been conducted on other penaeid shrimp, but, except for Trinidad, these assessments have not been recent. In many cases, available information suggested that there was a high probability these stocks were being over-exploited. There have been attempts at evaluations of groundfish species, but in most cases full stock assessments are not possible because data are insufficient. As a result, it must be concluded that fisheries targeting groundfish have a significant risk of overfishing since it is unclear what current mortality levels are.
Evaluations of other management measures are limited. Recent work conducted on Suriname TED and BRD use suggested that they reduce risks significantly for some, but not all, species of ray. This has led to on-going work on adaptation of the TED to improve its performance, which represents “best practice” for this type of control, and the results from this work should perhaps lead to taking up BRD and TED for all shrimp trawls across the region.
There have been muted management responses to evaluations that have been conducted, but some adjustments have been carried out, such as reductions in trawl licences in French Guiana, Guyana and Suriname, the prohibition of industrial shrimp trawling in Venezuela and introduction of a closed season for shrimp trawl in Trinidad. However, such adjustments are generally very slow, in part probably because of the need for consultation with fishers and fishing communities during the decision-making process.
An important reason a control might fail is a lack of compliance. Most fisheries report problems of compliance with the various fisheries rules and regulations. Reported compliance issues across the region include: TEDs not being used in trawl nets where they are required, gillnets and trawl using lower than the minimum mesh size, and fishing using gears within zones where those gears are prohibited.
Zones may be monitored by the fleets permitted to operate within them. Clear marking of all fishing vessels and improved communications should lead to identifying vessels that routinely fish in prohibited areas. No take zones may be more problematic, and where they are costly or cannot be enforced, they may well be ineffective.
For larger vessels, VMS has an important role in monitoring fishing activity, where appropriate technology is already available. VMS would also be very useful for small-scale fishery vessels and inexpensive VMS based on mobile phone technology could help considerably in monitoring some vessels behaviour in the absence of an observer programme.
Knowledge of which controls apply as well as simple, clear explanations for why each control is being applied, should help with compliance. Most countries have some form of outreach programme to fishers, which can be used for this purpose.
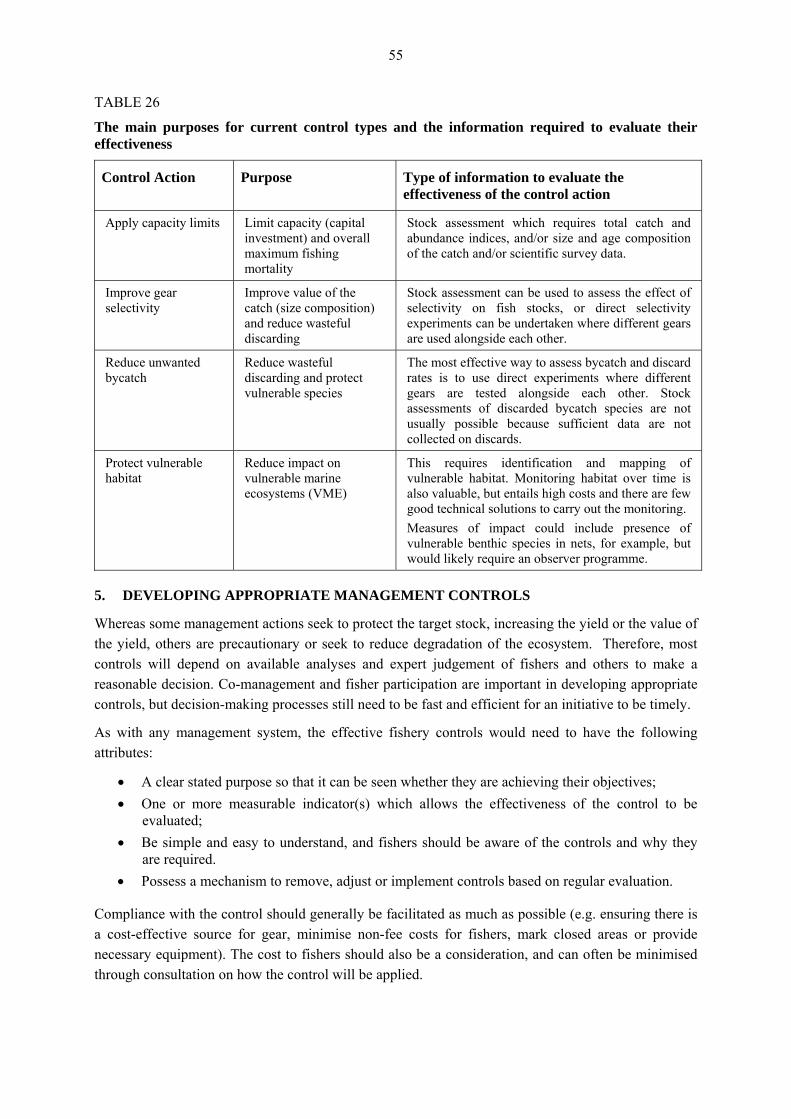
55
TABLE 26
The main purposes for current control types and the information required to evaluate their effectiveness
Control Action Purpose Type of information to evaluate the effectiveness of the control action
Apply capacity limits Limit capacity (capital investment) and overall maximum fishing mortality
Stock assessment which requires total catch and abundance indices, and/or size and age composition of the catch and/or scientific survey data.
Improve gear selectivity
Improve value of the catch (size composition) and reduce wasteful discarding
Stock assessment can be used to assess the effect of selectivity on fish stocks, or direct selectivity experiments can be undertaken where different gears are used alongside each other.
Reduce unwanted bycatch
Reduce wasteful discarding and protect vulnerable species
The most effective way to assess bycatch and discard rates is to use direct experiments where different gears are tested alongside each other. Stock assessments of discarded bycatch species are not usually possible because sufficient data are not collected on discards.
Protect vulnerable habitat
Reduce impact on vulnerable marine ecosystems (VME)
This requires identification and mapping of vulnerable habitat. Monitoring habitat over time is also valuable, but entails high costs and there are few good technical solutions to carry out the monitoring.
Measures of impact could include presence of vulnerable benthic species in nets, for example, but would likely require an observer programme.
5. DEVELOPING APPROPRIATE MANAGEMENT CONTROLS
Whereas some management actions seek to protect the target stock, increasing the yield or the value of the yield, others are precautionary or seek to reduce degradation of the ecosystem. Therefore, most controls will depend on available analyses and expert judgement of fishers and others to make a reasonable decision. Co-management and fisher participation are important in developing appropriate controls, but decision-making processes still need to be fast and efficient for an initiative to be timely.
As with any management system, the effective fishery controls would need to have the following attributes:
A clear stated purpose so that it can be seen whether they are achieving their objectives;
One or more measurable indicator(s) which allows the effectiveness of the control to be evaluated;
Be simple and easy to understand, and fishers should be aware of the controls and why they are required.
Possess a mechanism to remove, adjust or implement controls based on regular evaluation.
Compliance with the control should generally be facilitated as much as possible (e.g. ensuring there is a cost-effective source for gear, minimise non-fee costs for fishers, mark closed areas or provide necessary equipment). The cost to fishers should also be a consideration, and can often be minimised through consultation on how the control will be applied.
56
The majority of controls that have been implemented within the region are input controls. That is, they control what is being applied in the fishery, such as limiting fishing effort, number of vessels, gear used and where fishing is allowed to occur. Output controls, which control what the fishery produces, such as total catch or minimum sizes, are rarely used.
The advantage of input controls is that they are usually easier to administrate and enforce, but they need to be set correctly to be effective. Input controls particularly require careful evaluation to ensure they work. For example, mesh sizes set too low may provide little protection to the juveniles of a target stock.
The advantage of output controls is they leave how the controls are achieved up to the fishers themselves. On the positive side, as the fishers are most knowledgeable about fishing operations, this can result in very efficient and effective responses. For example, a fishery may wish to achieve capture of fish above a particular size, and therefore sets a minimum landing size. How this size is achieved is up to the fishers, and may include changing fishing location, gear configurations and times of fishing. The disadvantage is the response may not align with the objective, so fishers may simply discard dead fish which are below the minimum instead of avoiding their capture.
With current systems in the North Brazil-Guianas shelf fisheries, it makes sense to continue focus on input controls to achieve objectives. This can best be achieved with good co-management arrangements, which many fisheries report that they have. Involving fishers in decision-making and helping to design controls is more likely not only to ensure measures achieve their purpose, but also to make measures more acceptable with fewer negative side-effects for fishers.
Perhaps the main weakness in current controls is it is unclear how well many of them are achieving their objectives. Clearer objectives and planning for the evaluation of controls would lead to a significant improvement in current practice.
6. MANAGEMENT STRATEGIES
6.1 Overview
Current fisheries management in the Brazil-Guianas region applies a range of measures, which have probably avoided the worst outcomes for their fisheries. Fishing levels have, to a large extent, been sustained, although some fisheries may be harvested at levels which may not be sustained in the long term. Furthermore, the region has been slow to adopt controls which may protect the ecosystem from significant risks. TEDs were introduced, for example, because of the need to export to the USA, not because they reduce ecosystem risks.
The lack of evaluation of the various management controls creates a problem in adjusting or proposing new controls, as there is inadequate information to assess what options might lead to improvement. This implies that a more basic strategy must be implemented that will lead to strong effective measures achieving EAF compatible objectives in the long term (TABLE 27).
Historically, management has been promoting fishery development in the region, which has encouraged entrants to the fishery and reduced costs of operation through various incentives to encourage fishing. The current state of the resources indicates that this is no longer an appropriate management response, but that there should be no new entrants to fisheries and no expansion in fishing activity for those resources that are fully or over-exploited. However, this does not mean that development is not required, but it should be redirected to making better use of the resources that are
57
being harvested. This would include eliminating wasteful discarding, improving value-added to the landed catch, decreasing post-harvest losses and reducing unnecessary input costs for current fishing and processing activities.
One of the important considerations in developing appropriate management controls is stock structure, and particularly whether stocks may be shared between countries. In these cases, management controls will ultimately need to be agreed at the sub-regional level. Without co-ordination, it is possible to have inconsistent controls applied to a fishery. As well as putting the fishery at risk of overexploitation, uncoordinated management makes enforcement and evaluation of controls more difficult.
6.2 Evaluations and Reviews
In general, controls will need more regular evaluation and review. To achieve this, countries will need to institute sustainable monitoring systems to evaluate controls and fishery performance. This is the same as recommendations made previously, and improvements have been achieved.
More efficient use of information might be achieved by greater co-operation and data sharing. It will be useful to carry out a regular review of methods in region to reduce bycatch, for example. As methods are developed, these can be promulgated across the region. Similarly, support should be given to joint stock assessments, not only because stocks are shared, but this makes better use of the regions limited capacity for technical work and improves the quality of scientific advice.
6.3 Fishery Management Plans
Although there are management plans for many fisheries, they appear to have limited use and in most cases are still considered “draft”. This has been mainly because they are viewed as policy documents, were not developed in consultation with relevant stakeholders and are being used to develop policy for fisheries rather than describe the current management being implemented. Generally, the plans are long, complicated with large descriptive sections which are costly to write, read and maintain. While they would be valuable if they were to develop and update how fisheries are managed, this has proved too unwieldy an approach and most plans have not been ratified by the relevant politicians.
It would be most valuable to finalise Fishery Management Plans across region for every fishery, in line with EAF principles, so that there is a clear description of how they are actually being managed. Instead of treating such plans as though they are setting regulations and controls, they should perhaps be simplified into documents describing how a fishery is to be managed now, where the target readership for the document are current stakeholders, including decision-makers. This would not necessarily require political agreement because it is limited to describing current implementation, with no new policy that has to be agreed.
6.4 Marine Security and Improvements in Compliance
Improving compliance with regulations is always a general objective for fisheries management. Improving enforcement is one, but not the only way, to increase compliance.
Generally, controls are easier to enforce if harmonised within the region. Standard mesh sizes and hook sizes for the same fisheries based on shared knowledge of resources could help many fisheries improve immediately. There is little reason to change gear selectivity across the same fisheries, unless there is clear difference in growth among stocks. As well as hook sizes, alternative hook styles might be considered to reduce bycatch on longlines. For example, circle hooks could reduce turtle bycatch and may be more effective at retaining target catch.
58
A common theme among all countries was the need to deal with piracy and improve maritime security. Clearly, more patrols by a maritime coast guard are desirable, but expensive, and therefore not likely to be the only solution. Improved monitoring and communications at sea and better international co-operation will also help reduce threats, as will VMS routinely required for all larger vessels.
Other suggested management actions could include:
No take zones around international boundaries could aid enforcement and discourage other types of IUU fishing.
Sharing data on vessels, such as VMS records or information to create lists similar to those maintained by RFMOs on vessel standing (“blacklists” with suspected infringements) could help deal with maritime security, discourage IUU and acts of piracy. This could be linked to the FAO Global Record of Fishing Vessels.
A requirement to clearly visually mark all vessels in the region with an identifier.
6.5 Monitoring artisanal fisheries
There is a clear need to develop better monitoring systems for artisanal fisheries, so that these fisheries can be protected and improved. Artisanal fisheries are given precedence in much of the region as they are important for socio-economic reasons, providing income to some of the poorest people in society. Artisanal vessels are less likely to be involved in serious international IUU fishing because their range and capacity is limited. Artisanal fisheries also have less ecological impact per vessel, but usually have many more vessels so the cumulative impact may still be significant. However, there is a general lack of information on artisanal vessel operations and their impacts. In contrast, industrial fisheries usually provide better information and should be easier to control, because there are fewer, larger vessels that can afford to carry equipment such as VMS.
Appropriate monitoring techniques still need to be developed for artisanal fleets. These would likely revolve around sampling, but should use latest technology such as GPS and mobile phone links. Systems are in use elsewhere for artisanal fisheries (e.g. Poland), which could be modified and transferred in order to provide information on impacts and appropriate controls which might limit those impacts.
6.6 Zonation and MPAs
Most zonation appears to have reduced gear conflicts, so any risk reduction to habitat has probably been coincidental. There is a general lack of habitat information. It has not been possible to map habitat using remote sensing due to low water clarity, so any mapping has depended on a very limited number of vessel surveys. Decisions on zones specifically to reduce gear impact on the seabed may require use of other criteria to decide what and where to exclude gears.
Other criteria might be used to define protected areas. River mouths and coastal regions are important parts of the Brazil-Guianas ecosystem, forming important habitat particularly for juvenile life stages for many species, including main target species. Protection for key areas supports productivity across the region, so developing appropriate fishing zones with the explicit intention to minimise dead discards (“trash” fish) should be a regional objective.
Local fisher knowledge perhaps should form the initial basis for proposing zones to protect habitat and ecosystems. Not only are fishers familiar with ecology of areas where they fish, but they also possess
59
historical knowledge of past status of these areas which might be used to determine controls to promote ecosystem recovery as well as protect what is currently there.
6.7 Fixed Effort Limits
Fishing effort control is particularly important in small-scale fisheries, where there is a lack of scientific capacity for rapid stock assessment and response. Controlling fishing effort results in an automatic and appropriate response in the catch as long as the catch rate depends on stock abundance. This is particularly important in short-lived species, such as shrimp, where abundance changes within a time frame of months rather than years. Finally, limiting fishing effort reduces risks not only to the target species, but non-target bycatch and habitat. Impacts are generally proportional to fishing effort, so any limit of effort limits the risks for all components of the ecosystem.
All fisheries should apply principles of limited licensing with appropriate license provision limiting fishing power for each unit licenced. All countries operate some sort of permit system which should allow them to limit access to marine resources in this way.
Closed seasons can be used to apply limits and reductions to total fishing mortality equitably, and can provide some special benefits where there are strong annual recruitment or spawning events. However, closed seasons cannot optimise fishing mortality and are generally used where other more precise controls are unavailable. For the Brazil-Guianas fisheries, there appears to be no strong reason to make closed seasons universal, and they should only be implemented on a case-by-case basis.
Across the region, except for seabob, many penaeid shrimp stocks are most likely fully or over-exploited, and therefore capacity levels may be too high. Where capacity limits exceed sustainability limits on effort, effort is only limited by economic factors, so the fishery is not economically efficient, socio-economic objectives are not being met and food supplies are not secured. Further action to reduce fishing mortality, at least in the short term, may be required. Whether and by how much capacity may need to be reduced would need to be determined by stock assessments.
6.8 Dynamic Effort Limits (Harvest Control Rule)
For most Brazil-Guianas shelf fisheries, the only data available, if any, are catch and effort data, so the fishery’s catch-per-unit-effort (CPUE) is the main indicator of stock status. It is also an important indicator of the economic performance as it relates directly to fisher income. Where CPUE is the only indicator of stock size, a stock assessment can be used to provide appropriate reference points for a CPUE index, rather than stock biomass. The indicators and reference points are cast in a form that fishers can easily understand which makes their participation in designing the harvest control rule (HCR) easier. Also, calculating an index each month or year is considerably easier than trying to conduct a full stock assessment, and should be within the capacity of most government fisheries departments.
The effective target of this type of HCR is to maintain catch rates at acceptable levels for the fishery. This clarifies the simple link between ecosystem productivity and fishery earnings, showing that conservation objectives are aligned to a large extent with fishing community objectives.
It may also be possible to develop a harvest control rule based on fish size. Given maximum size and/or a growth model, size indicators such as mean length can be used to monitor the fishery performance, as well as evaluate controls designed to improve selectivity. While simple, this approach
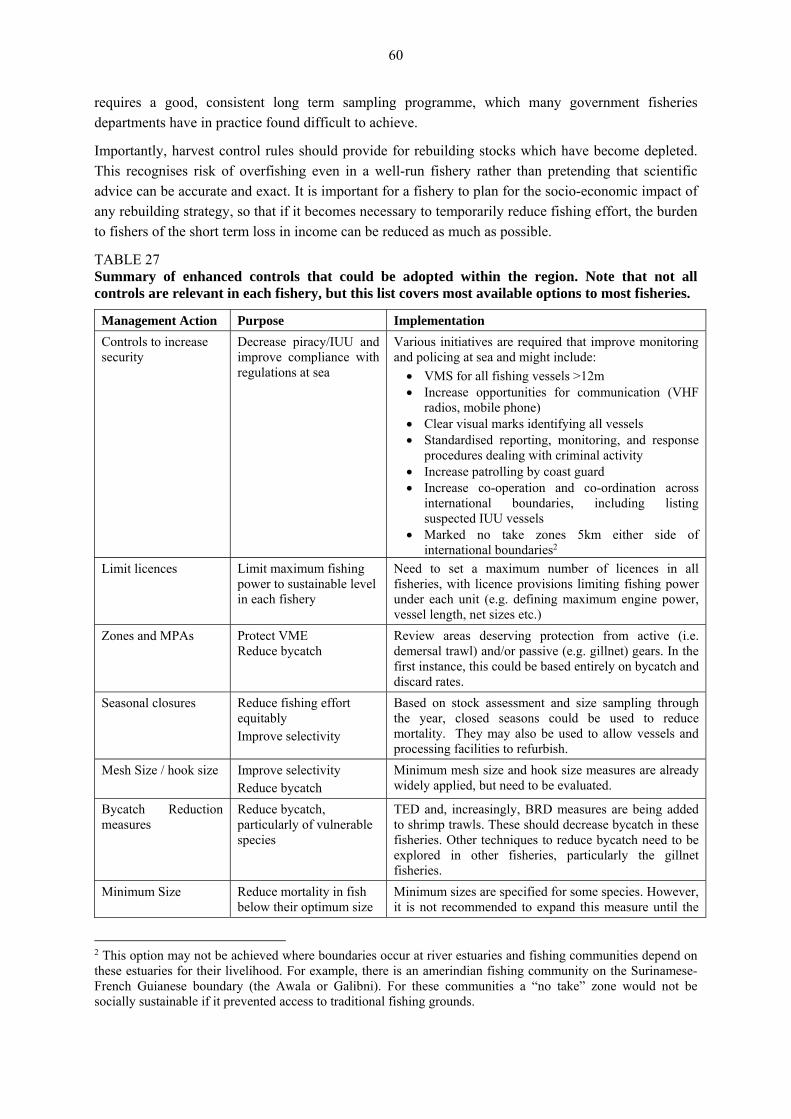
60
requires a good, consistent long term sampling programme, which many government fisheries departments have in practice found difficult to achieve.
Importantly, harvest control rules should provide for rebuilding stocks which have become depleted. This recognises risk of overfishing even in a well-run fishery rather than pretending that scientific advice can be accurate and exact. It is important for a fishery to plan for the socio-economic impact of any rebuilding strategy, so that if it becomes necessary to temporarily reduce fishing effort, the burden to fishers of the short term loss in income can be reduced as much as possible.
TABLE 27 Summary of enhanced controls that could be adopted within the region. Note that not all controls are relevant in each fishery, but this list covers most available options to most fisheries.
Management Action Purpose Implementation
Controls to increase security
Decrease piracy/IUU and improve compliance with regulations at sea
Various initiatives are required that improve monitoring and policing at sea and might include:
VMS for all fishing vessels >12m Increase opportunities for communication (VHF
radios, mobile phone) Clear visual marks identifying all vessels Standardised reporting, monitoring, and response
procedures dealing with criminal activity Increase patrolling by coast guard Increase co-operation and co-ordination across
international boundaries, including listing suspected IUU vessels
Marked no take zones 5km either side of international boundaries2
Limit licences Limit maximum fishing power to sustainable level in each fishery
Need to set a maximum number of licences in all fisheries, with licence provisions limiting fishing power under each unit (e.g. defining maximum engine power, vessel length, net sizes etc.)
Zones and MPAs Protect VME Reduce bycatch
Review areas deserving protection from active (i.e. demersal trawl) and/or passive (e.g. gillnet) gears. In the first instance, this could be based entirely on bycatch and discard rates.
Seasonal closures Reduce fishing effort equitably Improve selectivity
Based on stock assessment and size sampling through the year, closed seasons could be used to reduce mortality. They may also be used to allow vessels and processing facilities to refurbish.
Mesh Size / hook size Improve selectivity Reduce bycatch
Minimum mesh size and hook size measures are already widely applied, but need to be evaluated.
Bycatch Reduction measures
Reduce bycatch, particularly of vulnerable species
TED and, increasingly, BRD measures are being added to shrimp trawls. These should decrease bycatch in these fisheries. Other techniques to reduce bycatch need to be explored in other fisheries, particularly the gillnet fisheries.
Minimum Size Reduce mortality in fish below their optimum size
Minimum sizes are specified for some species. However, it is not recommended to expand this measure until the
2 This option may not be achieved where boundaries occur at river estuaries and fishing communities depend on these estuaries for their livelihood. For example, there is an amerindian fishing community on the Surinamese-French Guianese boundary (the Awala or Galibni). For these communities a “no take” zone would not be socially sustainable if it prevented access to traditional fishing grounds.

61
Management Action Purpose Implementation impact of the current control can be assessed.
Effort based HCR Limit effort to MSY levels with an automatic rebuilding strategy
To optimise fisheries in meeting their socio-economic objectives, more sophisticated management systems should be developed. These can be based on simple monitoring systems in the first instance, and gradually develop more complex procedures to maintain more precise control, as required.
Outreach Fishers understand the need for measures applied
As well as completing FMPs, it is always useful to inform and explain management controls to fishing communities. These are on-going activities in the region.

62
APPENDIX 1
Class Type Proposed or implemented
Country Fishery Gear Description Purpose
Permanent Area Limits
EEZ Implemented ALL All All EEZ defined and accepted. 200nm, but coastal stocks shared among bordering countries.
Allow single management control and national rights/responsibility over resources.
Permanent Area Closures
Bathymetry / Coastline
Implemented Brazil All All Fishing prohibited up to a limit of 10 nm for motorized boats.
Reduce conflict between gears
Permanent Area Closures
Specified Areas
Implemented Brazil All All Protection of natural habitats of aquatic species of estuarine areas of the Amazon River and the State of Pará and Amapá.
VME Protection
Permanent Area Closures
Specified Areas
Implemented Brazil All All It is prohibited to fish with any fishing gear in area between longitudes 46°50'W and 48º00'W and parallel 0°00 and 1º30'N-mouth of the Amazonas and Pará Rivers ("trash" area)
Minimise discard and unwanted mortality on juveniles etc.
Capacity Limits
Licences Implemented Brazil All All Increase in any fleet size and capacity is prohibited Limit max fishing mortality
Objective Size Proposed Brazil All All Studies indicate the management measure needed to ensure that species being fished are above the size at first maturation
Improve selectivity
Time Area Closures
Season/ Area
Implemented Brazil Catfish (Gurijuba) fishery
Hand line Gurijuba (Tachysurus spp.), annually, from 1 November 1 to 31 March established within 3 nautical miles from the island of Maracá and Jipioca (where is allowed only hand-line fishing).
?
Time Area Closures
Season/ Area
Implemented Brazil Catfish (Gurijuba) fishery
All Fishery closed from 1 November to 31 March within 3 nautical miles mouths of the Araguari and Cunani rivers
?

63
Class Type Proposed or implemented
Country Fishery Gear Description Purpose
Time Closures
Season Implemented Brazil Catfish (Piramutaba) fishery
All Catfish piramutaba (Brachyplatistoma vaillanti) fishery closed from 15 September to 30 November
Protect recruits
Permanent Area Closures
Specified Areas
Implemented Brazil Catfish (Piramutaba) fishery
Demersal Trawl
Prohibit trawling, under any system, in a natural habitat of aquatic species in estuarine areas of the Amazon River and the State of Pará, in the area within the limits defined by the parallel 00°05'N and meridian 048°00'W
Protect habitat / juveniles?
Capacity Limits
Licences Implemented Brazil Catfish (Piramutaba) fishery
Demersal Trawl
Limit trawling fleet to 48 vessels targeting piramutaba and other catfish (order Siluriforme)
Limit max fishing mortality
Capacity Limits
Licences Implemented Brazil Catfish (Piramutaba) fishery
Gillnet / Hand line
Limit of fleet size to 48 boats targeting catfish (piramutaba)
Limit max fishing mortality
Gear Controls
Gear Limit Implemented Brazil Catfish fishery Gillnet Gillnet length limits Limit fishing mortality / fishing unit
Gear Controls
Mesh size Implemented Brazil Catfish fishery Gillnet Gillnet mesh size limits Improve selectivity
Time Closures
Season Implemented Brazil Pink shrimp fishery
Demersal Trawl
Closed from 15 October to 15 February Protect recruits
Gear Controls
Bycatch reduction
Implemented Brazil Pink shrimp fishery
Demersal Trawl
Nets should be equipped with an approved Turtle Excluder Device (TED).
Reduce bycatch / ETP
Capacity Limits
Licences Implemented Brazil Pink shrimp fishery
Demersal Trawl
Limit of fleet size to 110 boats targeting pink shrimp
Limit max fishing mortality
Permanent Area Closures
Bathymetry / Coastline
Implemented Brazil Red snapper fishery
Longline / Trap
Red snapper is only allowed to be fished beyond 50 m isobath in the area between the northern boundary of the State of Amapá and the border between the states of Alagoas and Sergipe
Improve selectivity
Gear Controls
Gear Type Implemented Brazil Red snapper fishery
Longline / Trap
Red snapper (Lutjanus purpureus) can be only be fished by longlines and traps
?
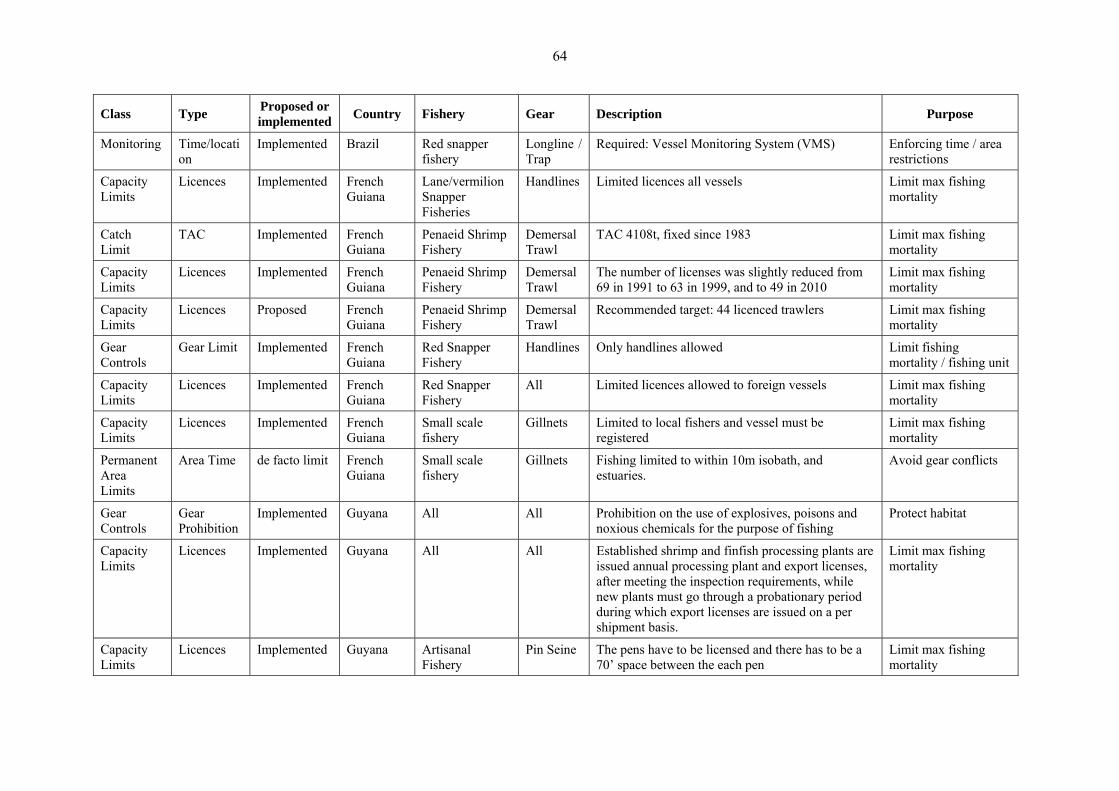
64
Class Type Proposed or implemented
Country Fishery Gear Description Purpose
Monitoring Time/location
Implemented Brazil Red snapper fishery
Longline / Trap
Required: Vessel Monitoring System (VMS) Enforcing time / area restrictions
Capacity Limits
Licences Implemented French Guiana
Lane/vermilion Snapper Fisheries
Handlines Limited licences all vessels Limit max fishing mortality
Catch Limit
TAC Implemented French Guiana
Penaeid Shrimp Fishery
Demersal Trawl
TAC 4108t, fixed since 1983 Limit max fishing mortality
Capacity Limits
Licences Implemented French Guiana
Penaeid Shrimp Fishery
Demersal Trawl
The number of licenses was slightly reduced from 69 in 1991 to 63 in 1999, and to 49 in 2010
Limit max fishing mortality
Capacity Limits
Licences Proposed French Guiana
Penaeid Shrimp Fishery
Demersal Trawl
Recommended target: 44 licenced trawlers Limit max fishing mortality
Gear Controls
Gear Limit Implemented French Guiana
Red Snapper Fishery
Handlines Only handlines allowed Limit fishing mortality / fishing unit
Capacity Limits
Licences Implemented French Guiana
Red Snapper Fishery
All Limited licences allowed to foreign vessels Limit max fishing mortality
Capacity Limits
Licences Implemented French Guiana
Small scale fishery
Gillnets Limited to local fishers and vessel must be registered
Limit max fishing mortality
Permanent Area Limits
Area Time de facto limit French Guiana
Small scale fishery
Gillnets Fishing limited to within 10m isobath, and estuaries.
Avoid gear conflicts
Gear Controls
Gear Prohibition
Implemented Guyana All All Prohibition on the use of explosives, poisons and noxious chemicals for the purpose of fishing
Protect habitat
Capacity Limits
Licences Implemented Guyana All All Established shrimp and finfish processing plants are issued annual processing plant and export licenses, after meeting the inspection requirements, while new plants must go through a probationary period during which export licenses are issued on a per shipment basis.
Limit max fishing mortality
Capacity Limits
Licences Implemented Guyana Artisanal Fishery
Pin Seine The pens have to be licensed and there has to be a 70’ space between the each pen
Limit max fishing mortality
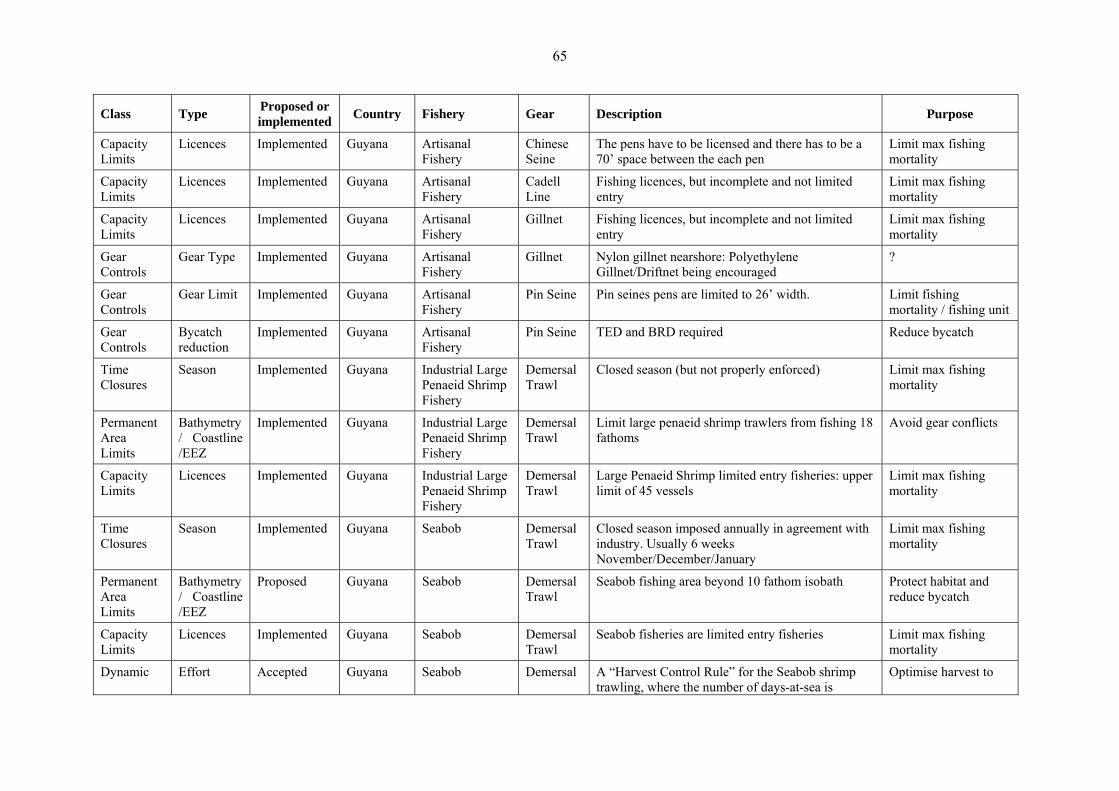
65
Class Type Proposed or implemented
Country Fishery Gear Description Purpose
Capacity Limits
Licences Implemented Guyana Artisanal Fishery
Chinese Seine
The pens have to be licensed and there has to be a 70’ space between the each pen
Limit max fishing mortality
Capacity Limits
Licences Implemented Guyana Artisanal Fishery
Cadell Line
Fishing licences, but incomplete and not limited entry
Limit max fishing mortality
Capacity Limits
Licences Implemented Guyana Artisanal Fishery
Gillnet Fishing licences, but incomplete and not limited entry
Limit max fishing mortality
Gear Controls
Gear Type Implemented Guyana Artisanal Fishery
Gillnet Nylon gillnet nearshore: Polyethylene Gillnet/Driftnet being encouraged
?
Gear Controls
Gear Limit Implemented Guyana Artisanal Fishery
Pin Seine Pin seines pens are limited to 26’ width. Limit fishing mortality / fishing unit
Gear Controls
Bycatch reduction
Implemented Guyana Artisanal Fishery
Pin Seine TED and BRD required Reduce bycatch
Time Closures
Season Implemented Guyana Industrial Large Penaeid Shrimp Fishery
Demersal Trawl
Closed season (but not properly enforced) Limit max fishing mortality
Permanent Area Limits
Bathymetry / Coastline /EEZ
Implemented Guyana Industrial Large Penaeid Shrimp Fishery
Demersal Trawl
Limit large penaeid shrimp trawlers from fishing 18 fathoms
Avoid gear conflicts
Capacity Limits
Licences Implemented Guyana Industrial Large Penaeid Shrimp Fishery
Demersal Trawl
Large Penaeid Shrimp limited entry fisheries: upper limit of 45 vessels
Limit max fishing mortality
Time Closures
Season Implemented Guyana Seabob Demersal Trawl
Closed season imposed annually in agreement with industry. Usually 6 weeks November/December/January
Limit max fishing mortality
Permanent Area Limits
Bathymetry / Coastline /EEZ
Proposed Guyana Seabob Demersal Trawl
Seabob fishing area beyond 10 fathom isobath Protect habitat and reduce bycatch
Capacity Limits
Licences Implemented Guyana Seabob Demersal Trawl
Seabob fisheries are limited entry fisheries Limit max fishing mortality
Dynamic Effort Accepted Guyana Seabob Demersal A “Harvest Control Rule” for the Seabob shrimp trawling, where the number of days-at-sea is
Optimise harvest to
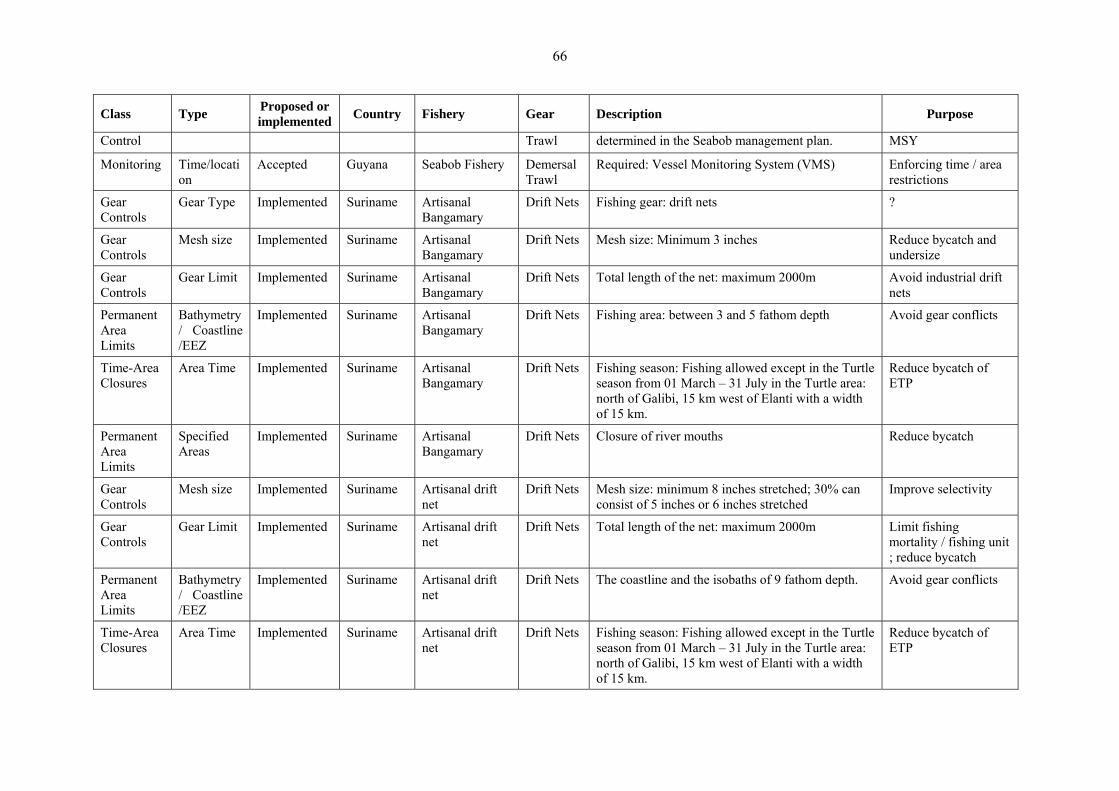
66
Class Type Proposed or implemented
Country Fishery Gear Description Purpose
Control Trawl determined in the Seabob management plan. MSY
Monitoring Time/location
Accepted Guyana Seabob Fishery Demersal Trawl
Required: Vessel Monitoring System (VMS) Enforcing time / area restrictions
Gear Controls
Gear Type Implemented Suriname Artisanal Bangamary
Drift Nets Fishing gear: drift nets ?
Gear Controls
Mesh size Implemented Suriname Artisanal Bangamary
Drift Nets Mesh size: Minimum 3 inches Reduce bycatch and undersize
Gear Controls
Gear Limit Implemented Suriname Artisanal Bangamary
Drift Nets Total length of the net: maximum 2000m Avoid industrial drift nets
Permanent Area Limits
Bathymetry / Coastline /EEZ
Implemented Suriname Artisanal Bangamary
Drift Nets Fishing area: between 3 and 5 fathom depth Avoid gear conflicts
Time-Area Closures
Area Time Implemented Suriname Artisanal Bangamary
Drift Nets Fishing season: Fishing allowed except in the Turtle season from 01 March – 31 July in the Turtle area: north of Galibi, 15 km west of Elanti with a width of 15 km.
Reduce bycatch of ETP
Permanent Area Limits
Specified Areas
Implemented Suriname Artisanal Bangamary
Drift Nets Closure of river mouths Reduce bycatch
Gear Controls
Mesh size Implemented Suriname Artisanal drift net
Drift Nets Mesh size: minimum 8 inches stretched; 30% can consist of 5 inches or 6 inches stretched
Improve selectivity
Gear Controls
Gear Limit Implemented Suriname Artisanal drift net
Drift Nets Total length of the net: maximum 2000m Limit fishing mortality / fishing unit ; reduce bycatch
Permanent Area Limits
Bathymetry / Coastline /EEZ
Implemented Suriname Artisanal drift net
Drift Nets The coastline and the isobaths of 9 fathom depth. Avoid gear conflicts
Time-Area Closures
Area Time Implemented Suriname Artisanal drift net
Drift Nets Fishing season: Fishing allowed except in the Turtle season from 01 March – 31 July in the Turtle area: north of Galibi, 15 km west of Elanti with a width of 15 km.
Reduce bycatch of ETP
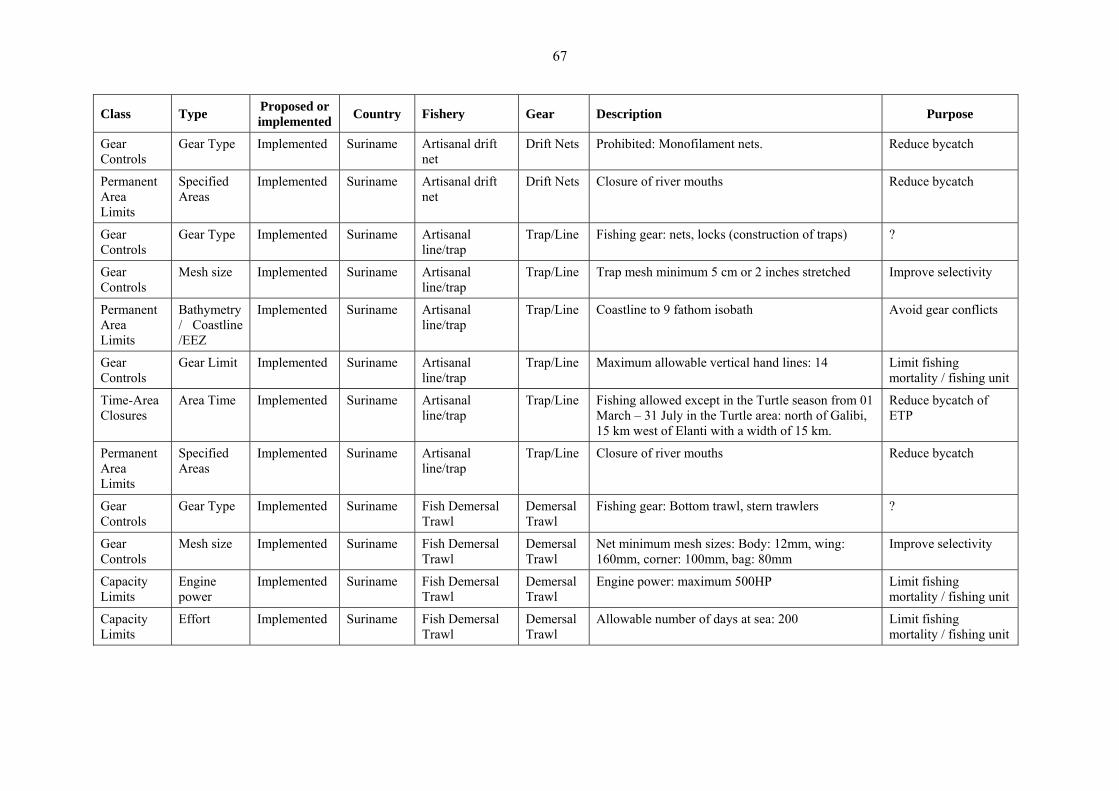
67
Class Type Proposed or implemented
Country Fishery Gear Description Purpose
Gear Controls
Gear Type Implemented Suriname Artisanal drift net
Drift Nets Prohibited: Monofilament nets. Reduce bycatch
Permanent Area Limits
Specified Areas
Implemented Suriname Artisanal drift net
Drift Nets Closure of river mouths Reduce bycatch
Gear Controls
Gear Type Implemented Suriname Artisanal line/trap
Trap/Line Fishing gear: nets, locks (construction of traps) ?
Gear Controls
Mesh size Implemented Suriname Artisanal line/trap
Trap/Line Trap mesh minimum 5 cm or 2 inches stretched Improve selectivity
Permanent Area Limits
Bathymetry / Coastline /EEZ
Implemented Suriname Artisanal line/trap
Trap/Line Coastline to 9 fathom isobath Avoid gear conflicts
Gear Controls
Gear Limit Implemented Suriname Artisanal line/trap
Trap/Line Maximum allowable vertical hand lines: 14 Limit fishing mortality / fishing unit
Time-Area Closures
Area Time Implemented Suriname Artisanal line/trap
Trap/Line Fishing allowed except in the Turtle season from 01 March – 31 July in the Turtle area: north of Galibi, 15 km west of Elanti with a width of 15 km.
Reduce bycatch of ETP
Permanent Area Limits
Specified Areas
Implemented Suriname Artisanal line/trap
Trap/Line Closure of river mouths Reduce bycatch
Gear Controls
Gear Type Implemented Suriname Fish Demersal Trawl
Demersal Trawl
Fishing gear: Bottom trawl, stern trawlers ?
Gear Controls
Mesh size Implemented Suriname Fish Demersal Trawl
Demersal Trawl
Net minimum mesh sizes: Body: 12mm, wing: 160mm, corner: 100mm, bag: 80mm
Improve selectivity
Capacity Limits
Engine power
Implemented Suriname Fish Demersal Trawl
Demersal Trawl
Engine power: maximum 500HP Limit fishing mortality / fishing unit
Capacity Limits
Effort Implemented Suriname Fish Demersal Trawl
Demersal Trawl
Allowable number of days at sea: 200 Limit fishing mortality / fishing unit

68
Class Type Proposed or implemented
Country Fishery Gear Description Purpose
Permanent Area Limits
Bathymetry / Coastline /EEZ
Implemented Suriname Fish Demersal Trawl
Demersal Trawl
Fishing Area: from 15 fathom isobath to line nominal
Avoid gear conflicts
Gear Controls
Gear Limit Implemented Suriname Large Pelagic Line Fishery
Longlines / Vertical Lines
Maximum 2000 horizontal lines allowed Limit fishing mortality / fishing unit
Gear Controls
Hook size Implemented Suriname Large Pelagic Line Fishery
Longlines / Vertical Lines
Hook size: 5 Improve selectivity
Capacity Limits
Engine power
Implemented Suriname Large Pelagic Line Fishery
Longlines / Vertical Lines
Maximum engine power: 1000HP Limit fishing mortality / fishing unit
Permanent Area Limits
Bathymetry / Coastline /EEZ
Implemented Suriname Large Pelagic Line Fishery
Longlines / Vertical Lines
From the line nominal to 28 fathom depth Avoid gear conflicts
Capacity Limits
Licences Implemented Suriname Mackerel Fishery
Longlines / Vertical Lines
Venezuelan licenced vessels Limit max fishing mortality
Gear Controls
Gear Type Implemented Suriname Mackerel Fishery
Longlines / Vertical Lines
Allowable fishing gear: horizontal long lines and hand lines
?
Gear Controls
Gear Limit Implemented Suriname Mackerel Fishery
Longlines / Vertical Lines
Maximum number of vertical hand lines: 14 Limit fishing mortality / fishing unit
Gear Controls
Gear Limit Implemented Suriname Mackerel Fishery
Longlines / Vertical Lines
Maximum number of hooks: 2000 on the horizontal long lines and 20 on the vertical hand lines.
Limit fishing mortality / fishing unit
Gear Controls
Hook size Implemented Suriname Mackerel Fishery
Longlines / Vertical Lines
Allowable hook size: 3, 4, 5, 6 and 7 Improve selectivity
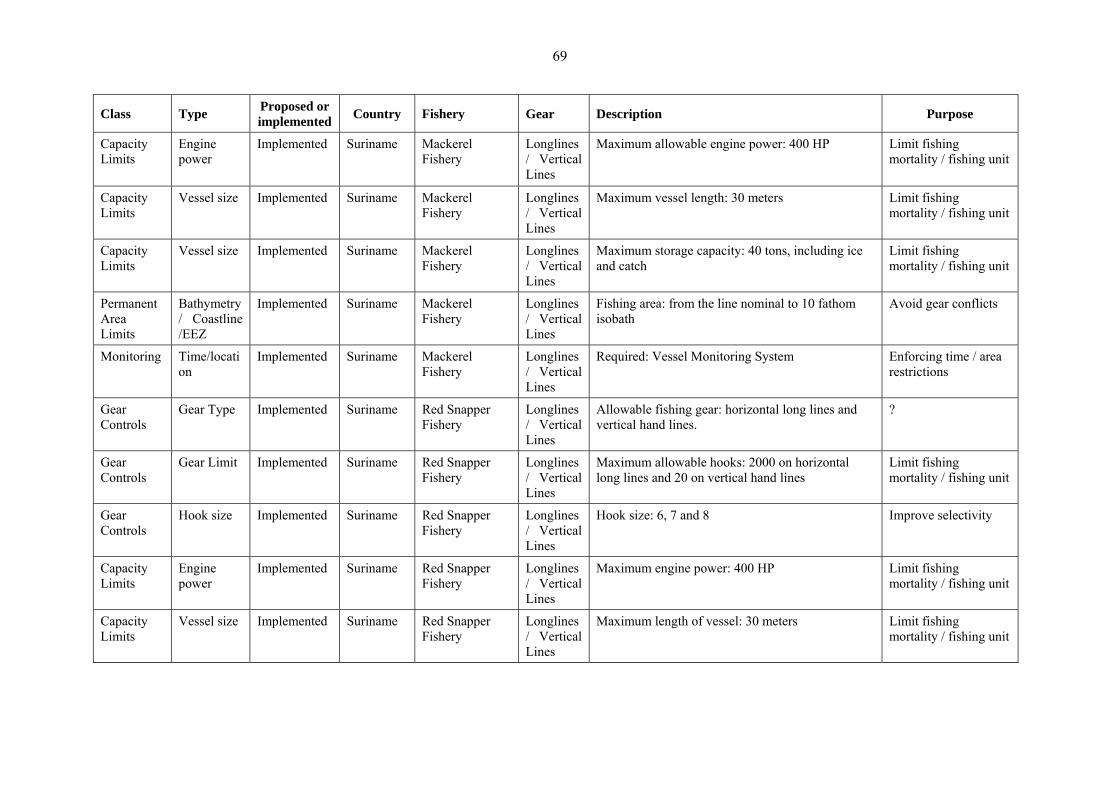
69
Class Type Proposed or implemented
Country Fishery Gear Description Purpose
Capacity Limits
Engine power
Implemented Suriname Mackerel Fishery
Longlines / Vertical Lines
Maximum allowable engine power: 400 HP Limit fishing mortality / fishing unit
Capacity Limits
Vessel size Implemented Suriname Mackerel Fishery
Longlines / Vertical Lines
Maximum vessel length: 30 meters Limit fishing mortality / fishing unit
Capacity Limits
Vessel size Implemented Suriname Mackerel Fishery
Longlines / Vertical Lines
Maximum storage capacity: 40 tons, including ice and catch
Limit fishing mortality / fishing unit
Permanent Area Limits
Bathymetry / Coastline /EEZ
Implemented Suriname Mackerel Fishery
Longlines / Vertical Lines
Fishing area: from the line nominal to 10 fathom isobath
Avoid gear conflicts
Monitoring Time/location
Implemented Suriname Mackerel Fishery
Longlines / Vertical Lines
Required: Vessel Monitoring System Enforcing time / area restrictions
Gear Controls
Gear Type Implemented Suriname Red Snapper Fishery
Longlines / Vertical Lines
Allowable fishing gear: horizontal long lines and vertical hand lines.
?
Gear Controls
Gear Limit Implemented Suriname Red Snapper Fishery
Longlines / Vertical Lines
Maximum allowable hooks: 2000 on horizontal long lines and 20 on vertical hand lines
Limit fishing mortality / fishing unit
Gear Controls
Hook size Implemented Suriname Red Snapper Fishery
Longlines / Vertical Lines
Hook size: 6, 7 and 8 Improve selectivity
Capacity Limits
Engine power
Implemented Suriname Red Snapper Fishery
Longlines / Vertical Lines
Maximum engine power: 400 HP Limit fishing mortality / fishing unit
Capacity Limits
Vessel size Implemented Suriname Red Snapper Fishery
Longlines / Vertical Lines
Maximum length of vessel: 30 meters Limit fishing mortality / fishing unit

70
Class Type Proposed or implemented
Country Fishery Gear Description Purpose
Capacity Limits
Vessel size Implemented Suriname Red Snapper Fishery
Longlines / Vertical Lines
Maximum storage capacity: 40 tons, including ice and catch
Limit fishing mortality / fishing unit
Permanent Area Limits
Bathymetry / Coastline /EEZ
Implemented Suriname Red Snapper Fishery
Longlines / Vertical Lines
Fishing area: from the line nominal to 15 fathom depth
Avoid gear conflicts
Monitoring Time/location
Implemented Suriname Red Snapper Fishery
Longlines / Vertical Lines
Required: Vessel Monitoring System (VMS) Enforcing time / area restrictions
Capacity Limits
Licences Implemented Suriname Red Snapper Fishery
Longlines / Vertical Lines
Venezuelan licenced vessels Limit max fishing mortality
Permanent Area Limits
Bathymetry / Coastline /EEZ
Implemented Suriname Seabob Demersal Trawl
Western fishing grounds: minimum 10 fathom depth to maximum 15 fathom depth.
Reduce bycatch / gear conflict
Permanent Area Limits
Bathymetry / Coastline /EEZ
Implemented Suriname Seabob Demersal Trawl
Eastern fishing grounds: minimum 10 fathom depth to 18 fathom depth.
Reduce bycatch / gear conflict
Dynamic Control
Effort Implemented Suriname Seabob Demersal Trawl
A “Harvest Control Rule” for the Seabob shrimp trawling, where the number of days-at-sea is determined in the Seabob management plan.
Optimise harvest to MSY
Capacity Limits
Engine power
Implemented Suriname Seabob Demersal Trawl
Maximum engine power: 500 HP Limit fishing mortality / fishing unit
Gear Controls
Mesh size Implemented Suriname Seabob Demersal Trawl
Non-cod end stretched minimum 57 mm; Cod end stretched minimum 45 mm
Improve selectivity
Gear Controls
Bycatch reduction
Implemented Suriname Seabob Demersal Trawl
Nets should be equipped with an approved Turtle Excluder Device (TED).
Reduce bycatch / ETP
Monitoring Time/location
Implemented Suriname Seabob Demersal Trawl
Required: Vessel Monitoring System (VMS) Enforcing time / area restrictions
Gear Controls
Bycatch reduction
Implemented Suriname Seabob Demersal Trawl
Nets should be equipped with an approved bycatch reduction device (BRD)
Reduce bycatch
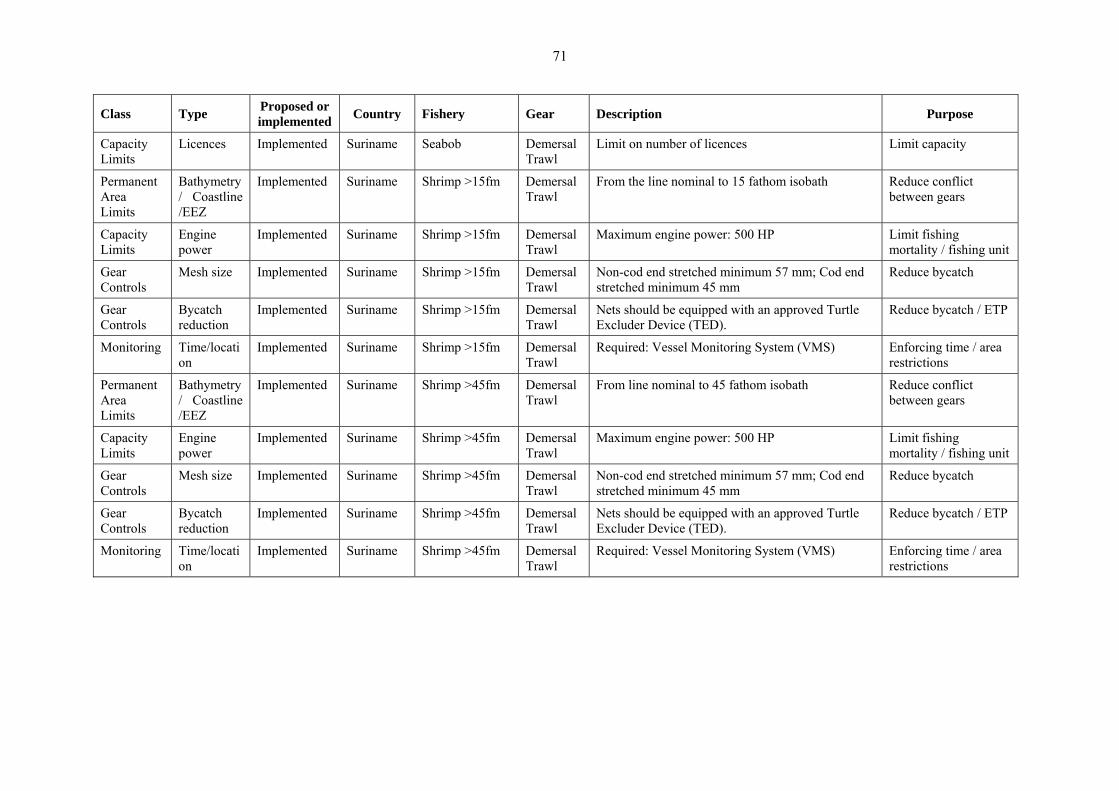
71
Class Type Proposed or implemented
Country Fishery Gear Description Purpose
Capacity Limits
Licences Implemented Suriname Seabob Demersal Trawl
Limit on number of licences Limit capacity
Permanent Area Limits
Bathymetry / Coastline /EEZ
Implemented Suriname Shrimp >15fm Demersal Trawl
From the line nominal to 15 fathom isobath Reduce conflict between gears
Capacity Limits
Engine power
Implemented Suriname Shrimp >15fm Demersal Trawl
Maximum engine power: 500 HP Limit fishing mortality / fishing unit
Gear Controls
Mesh size Implemented Suriname Shrimp >15fm Demersal Trawl
Non-cod end stretched minimum 57 mm; Cod end stretched minimum 45 mm
Reduce bycatch
Gear Controls
Bycatch reduction
Implemented Suriname Shrimp >15fm Demersal Trawl
Nets should be equipped with an approved Turtle Excluder Device (TED).
Reduce bycatch / ETP
Monitoring Time/location
Implemented Suriname Shrimp >15fm Demersal Trawl
Required: Vessel Monitoring System (VMS) Enforcing time / area restrictions
Permanent Area Limits
Bathymetry / Coastline /EEZ
Implemented Suriname Shrimp >45fm Demersal Trawl
From line nominal to 45 fathom isobath Reduce conflict between gears
Capacity Limits
Engine power
Implemented Suriname Shrimp >45fm Demersal Trawl
Maximum engine power: 500 HP Limit fishing mortality / fishing unit
Gear Controls
Mesh size Implemented Suriname Shrimp >45fm Demersal Trawl
Non-cod end stretched minimum 57 mm; Cod end stretched minimum 45 mm
Reduce bycatch
Gear Controls
Bycatch reduction
Implemented Suriname Shrimp >45fm Demersal Trawl
Nets should be equipped with an approved Turtle Excluder Device (TED).
Reduce bycatch / ETP
Monitoring Time/location
Implemented Suriname Shrimp >45fm Demersal Trawl
Required: Vessel Monitoring System (VMS) Enforcing time / area restrictions

72
Class Type Proposed or implemented
Country Fishery Gear Description Purpose
Landings Limit
Minimum Size
Implemented Trinidad All All No carite (Spanish mackerel, Scomberomorus brasiliensis), kingfish (king mackerel, Scomberomorus cavalla), grouper (Serranidae), codfish (cobia, Rachycentron canadum), sorb (Mutton snapper, Lutjanus analis), pargue (snapper, Lutjanidae), or zeblan (Palometa pompano, Trachinotus goodei) less than 12 inches (30.5 cm) in length shall be taken, sold, or exposed for sale
Improve selectivity
Landings Limit
Minimum Size
Implemented Trinidad All All No salmon (weakfish), redfish (vivanot, Lutjanus vivanus; walliacke, L. synagris), tête-ronde (Atlantic bigeye, Priacanthus arenatus), pomfano (Carangidae, Selene sp. or Trachinotus sp.), or cola (L. purpureus, L. vivanus, or Ocyurus chrysurus) under 8 inches (20.3 cm) in length shall be taken or sold or exposed for sale
Improve selectivity
Permanent Area Limits
No Take Zones
Implemented Trinidad All All Several areas are demarcated where the taking of fish and shellfish is prohibited
Protect habitat
Time-Area Closures
Bathymetry / Coastline /EEZ
Implemented Trinidad All Trawl Demersal Trawl
Trawling is permitted on the north coast of Trinidad outside of 2 nautical miles from the coast in the area west of Saut D’eau from November 15 to January 15, between 6am and 6pm
Avoid gear conflicts
Permanent Area Limits
Bathymetry / Coastline /EEZ
Implemented Trinidad All Trawl Demersal Trawl
Trawling is permitted on the south coast of Trinidad outside of 2 nautical miles from the coast
Avoid gear conflicts
Permanent Area Limits
Bathymetry / Coastline /EEZ
Implemented Trinidad All Trawl Demersal Trawl
Trawling is prohibited on the east coast of Trinidad and within 12 nautical miles of the coast of Tobago
Avoid gear conflicts
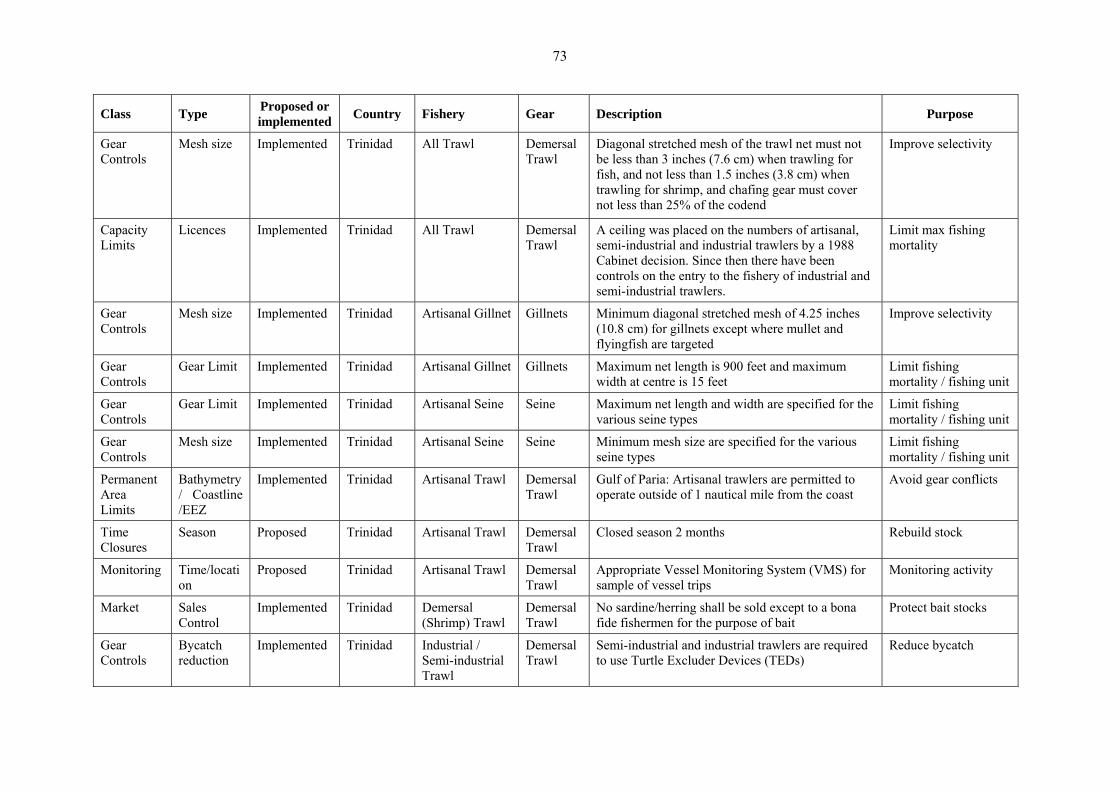
73
Class Type Proposed or implemented
Country Fishery Gear Description Purpose
Gear Controls
Mesh size Implemented Trinidad All Trawl Demersal Trawl
Diagonal stretched mesh of the trawl net must not be less than 3 inches (7.6 cm) when trawling for fish, and not less than 1.5 inches (3.8 cm) when trawling for shrimp, and chafing gear must cover not less than 25% of the codend
Improve selectivity
Capacity Limits
Licences Implemented Trinidad All Trawl Demersal Trawl
A ceiling was placed on the numbers of artisanal, semi-industrial and industrial trawlers by a 1988 Cabinet decision. Since then there have been controls on the entry to the fishery of industrial and semi-industrial trawlers.
Limit max fishing mortality
Gear Controls
Mesh size Implemented Trinidad Artisanal Gillnet Gillnets Minimum diagonal stretched mesh of 4.25 inches (10.8 cm) for gillnets except where mullet and flyingfish are targeted
Improve selectivity
Gear Controls
Gear Limit Implemented Trinidad Artisanal Gillnet Gillnets Maximum net length is 900 feet and maximum width at centre is 15 feet
Limit fishing mortality / fishing unit
Gear Controls
Gear Limit Implemented Trinidad Artisanal Seine Seine Maximum net length and width are specified for the various seine types
Limit fishing mortality / fishing unit
Gear Controls
Mesh size Implemented Trinidad Artisanal Seine Seine Minimum mesh size are specified for the various seine types
Limit fishing mortality / fishing unit
Permanent Area Limits
Bathymetry / Coastline /EEZ
Implemented Trinidad Artisanal Trawl Demersal Trawl
Gulf of Paria: Artisanal trawlers are permitted to operate outside of 1 nautical mile from the coast
Avoid gear conflicts
Time Closures
Season Proposed Trinidad Artisanal Trawl Demersal Trawl
Closed season 2 months Rebuild stock
Monitoring Time/location
Proposed Trinidad Artisanal Trawl Demersal Trawl
Appropriate Vessel Monitoring System (VMS) for sample of vessel trips
Monitoring activity
Market Sales Control
Implemented Trinidad Demersal (Shrimp) Trawl
Demersal Trawl
No sardine/herring shall be sold except to a bona fide fishermen for the purpose of bait
Protect bait stocks
Gear Controls
Bycatch reduction
Implemented Trinidad Industrial / Semi-industrial Trawl
Demersal Trawl
Semi-industrial and industrial trawlers are required to use Turtle Excluder Devices (TEDs)
Reduce bycatch
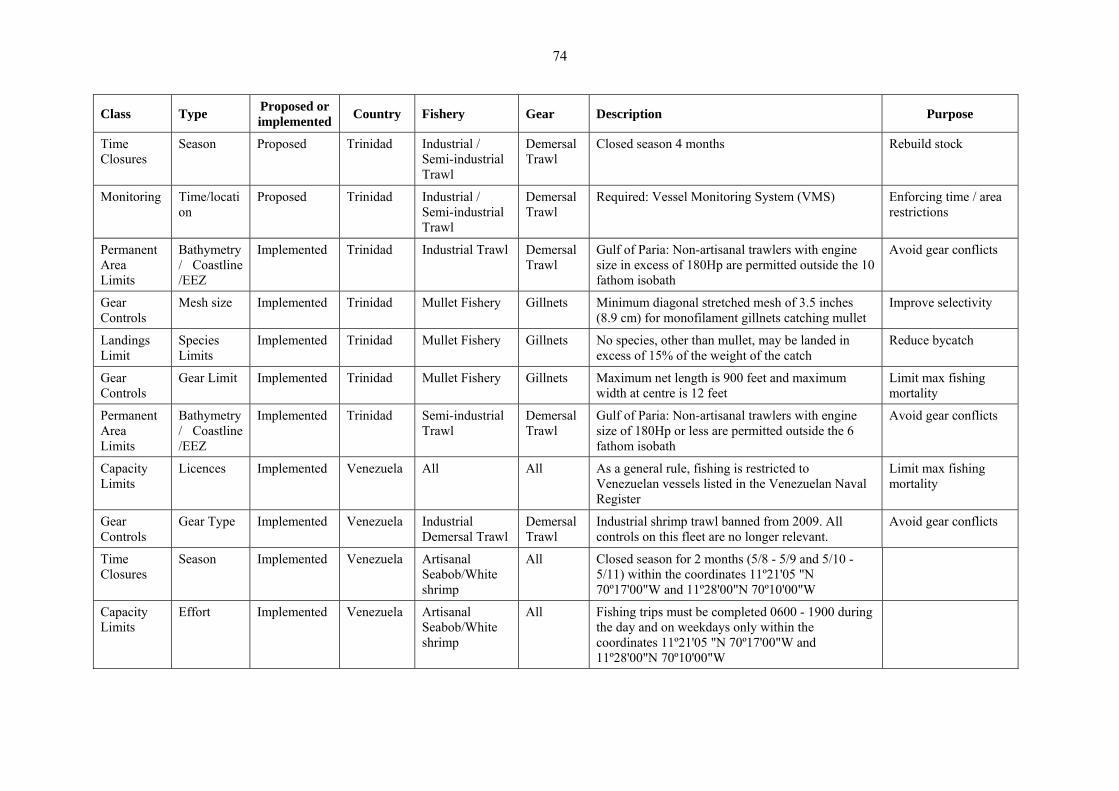
74
Class Type Proposed or implemented
Country Fishery Gear Description Purpose
Time Closures
Season Proposed Trinidad Industrial / Semi-industrial Trawl
Demersal Trawl
Closed season 4 months Rebuild stock
Monitoring Time/location
Proposed Trinidad Industrial / Semi-industrial Trawl
Demersal Trawl
Required: Vessel Monitoring System (VMS) Enforcing time / area restrictions
Permanent Area Limits
Bathymetry / Coastline /EEZ
Implemented Trinidad Industrial Trawl Demersal Trawl
Gulf of Paria: Non-artisanal trawlers with engine size in excess of 180Hp are permitted outside the 10 fathom isobath
Avoid gear conflicts
Gear Controls
Mesh size Implemented Trinidad Mullet Fishery Gillnets Minimum diagonal stretched mesh of 3.5 inches (8.9 cm) for monofilament gillnets catching mullet
Improve selectivity
Landings Limit
Species Limits
Implemented Trinidad Mullet Fishery Gillnets No species, other than mullet, may be landed in excess of 15% of the weight of the catch
Reduce bycatch
Gear Controls
Gear Limit Implemented Trinidad Mullet Fishery Gillnets Maximum net length is 900 feet and maximum width at centre is 12 feet
Limit max fishing mortality
Permanent Area Limits
Bathymetry / Coastline /EEZ
Implemented Trinidad Semi-industrial Trawl
Demersal Trawl
Gulf of Paria: Non-artisanal trawlers with engine size of 180Hp or less are permitted outside the 6 fathom isobath
Avoid gear conflicts
Capacity Limits
Licences Implemented Venezuela All All As a general rule, fishing is restricted to Venezuelan vessels listed in the Venezuelan Naval Register
Limit max fishing mortality
Gear Controls
Gear Type Implemented Venezuela Industrial Demersal Trawl
Demersal Trawl
Industrial shrimp trawl banned from 2009. All controls on this fleet are no longer relevant.
Avoid gear conflicts
Time Closures
Season Implemented Venezuela Artisanal Seabob/White shrimp
All Closed season for 2 months (5/8 - 5/9 and 5/10 -5/11) within the coordinates 11º21'05 "N 70º17'00"W and 11º28'00"N 70º10'00"W
Capacity Limits
Effort Implemented Venezuela Artisanal Seabob/White shrimp
All Fishing trips must be completed 0600 - 1900 during the day and on weekdays only within the coordinates 11º21'05 "N 70º17'00"W and 11º28'00"N 70º10'00"W
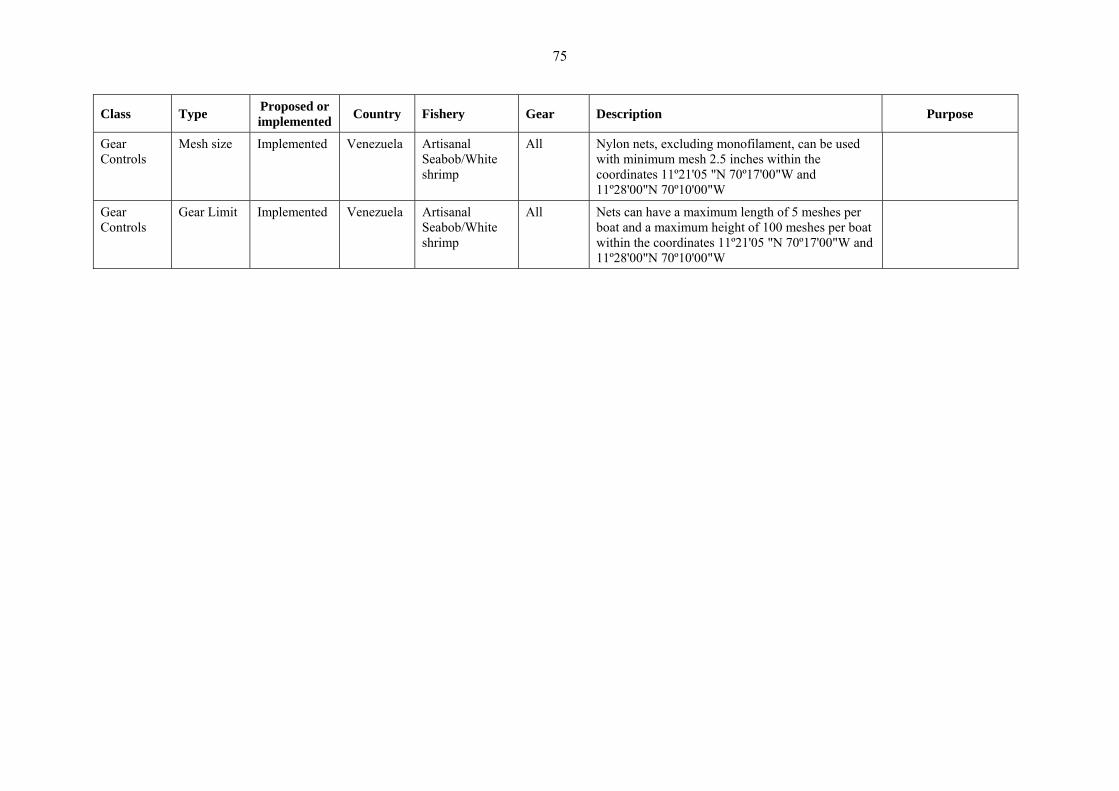
75
Class Type Proposed or implemented
Country Fishery Gear Description Purpose
Gear Controls
Mesh size Implemented Venezuela Artisanal Seabob/White shrimp
All Nylon nets, excluding monofilament, can be used with minimum mesh 2.5 inches within the coordinates 11º21'05 "N 70º17'00"W and 11º28'00"N 70º10'00"W
Gear Controls
Gear Limit Implemented Venezuela Artisanal Seabob/White shrimp
All Nets can have a maximum length of 5 meshes per boat and a maximum height of 100 meshes per boat within the coordinates 11º21'05 "N 70º17'00"W and 11º28'00"N 70º10'00"W
76
CHAPTER III
INVESTING IN ECOSYSTEM-BASED SHRIMP AND GROUNDFISH FISHERIES MANAGEMENT OF THE GUIANAS-NORTH BRAZIL CONTINENTAL SHELF
Investment Planning Report
by
Dr. Uwe Tietze, International Consultant
EXTENDED EXECUTIVE SUMMARY3
1. JUSTIFICATION AND OVERALL OBJECTIVE OF INVESTMENT COMPONENTS
While the Latin America and Caribbean Region accounts for 16 percent of the planet’s land mass, it holds 40 percent of the world’s biological diversity. The biodiversity includes seven of the world’s 25 biodiversity hotspots and six of the 17 “megadiverse” countries. The coastal and marine areas of the region are also rich in biodiversity. This includes several Large Marine Ecosystems (LMEs) including the North Brazil–Guianas Shelf LME. The North Brazil-Guianas Shelf LME displays very high levels of marine productivity and endemism. Marine and aquatic ecosystems make an important contribution to national GDPs in the Region. Many communities are highly dependent on small-scale fisheries as a source of protein and livelihoods (Chapter 3).
The outstanding biodiversity and productive waters of the region, however, face significant resource management challenges. The greatest of these challenges to marine ecosystems come from overfishing and from fishing practices which damage or degrade habitats as well as from the impact of non-selective fishing gears on non-target species. Because of these impacts and challenges, high value and “keystone” ecosystem regulating species are seriously depleted in many places. The loss of these species causes cascading effects that negatively affect fisheries productivity and may ultimately reduce jobs, incomes, and food supplies.
Despite of these challenges prevailing in the CLME, marine capture fisheries are still generating positive economic and financial returns and benefits. Bio-economic analysis and valuations of the benefits of the groundfish and shrimp fisheries of the North Brazil-Guianas Continental Shelf and their ecosystems clearly demonstrate that the economic benefits that can be derived from these fisheries and their ecosystems cannot only be sustained but will considerably increase if the fisheries and their ecosystems are exploited and managed in a sustainable and ecosystem based manner.
The CLME project has developed a Strategic Action Programme (SAP), which has been endorsed by the countries of the region as well as by regional bodies and organizations. The CLME SAP clearly identifies the key strategies and actions to be pursued for a sustainable exploitation and management of the groundfish and shrimp fisheries of the North Brazil-Guianas Continental Shelf and the entire CLME region.
Within this framework, the report lays out the conceptual framework for the investment planning process in support of an ecosystem-based shrimp and groundfish fisheries management of the Guianas-North Brazil Continental Shelf (Chapter 2, Figure 1). This framework includes components such as the synergy of sustainable livelihoods and ecosystem approaches to fisheries; fisheries investment, credit and microfinance; criteria for assessing performance and success of fishery enterprises and investments and steps of the investment planning process.
3 Full references and a list of abbreviations and acronyms are available in the main report.

77
This report then analyses the investment implications of the key strategies and actions of the SAP in relation to the SAP Ecosystem Quality Objectives (EcoQOs) and Societal Benefit Objectives (SBOs) (Chapter 4). In addition, the report presents investment preferences from countries in the region that were solicited by means of a questionnaire (Chapter 5, Annex II). Based on these analyses and country inputs, the report identifies and specifies the investment components and sub-components that are needed in support of a sustainable resource exploitation and management (Chapter 6, Table 22).
The proposed investment components in support of an ecosystem-based management of the shrimp and groundfish fisheries of the Guianas-Brazil Shelf aim to achieve the following objectives:
Poverty reduction and equity enhancement; Food security; Environmental sustainability within marine and aquatic ecosystems; Protection of the environment, response/adaptation to climate change, promotion of renewable
energy; Mainstreaming of biodiversity and ecosystem services into key productive sectors and infrastructure.
2. KEY INVESTMENT COMPONENTS
The following key investment components have been identified.
A. Investments to achieve Ecosystem Quality Objectives (EcoQOs)
A. 1 Investments in water treatment infrastructure
A.2 Investments in support of conservation of natural and aquatic resources and habitat restoration
A.3 Investments in support of regional coordination and capacity building
B. Investments to achieve Societal Benefit Objectives (SBOs)
B.1 Investments in support of livelihoods and fulfillment of basic need
B.2 Investments in fishing community infrastructure
B.3 Investments in sustainable, economically efficient and safe capture fishery technology4including those that reduce carbon emissions, promote the use of renewable energies and the use of overall more energy efficient technologies.
B.4 Investments in community-level financial intermediation and associations5
C. Investments in regional cooperation, management and capacity building
C.1 Investments in establishing a regional capacity to coordinate the development and implementation of regional, sub-regional and national initiatives to enhance safety and reduce risk factors including safety- at- sea for fishers, with particular focus on risk management
C.2 Investment in national and regional fisheries institutional capacity building including research, modernization and harmonization of fisheries acts and regulations and capacity building programmes
C.3 Investment in the development and implementation of a regional fisheries management organization (RFMO
4 Annex 1, case study 1 shows the economic and financial performance of selected Caribbean small-scale fishing vessels. 5 Case studies of successful microfinance investments are shown in Annex 1, case studies 6, 7 and 9.
78
C.4 Investment in collection, analysis and sharing of data and information on shrimp and groundfish resources/shared stocks and related fisheries, as well as their ecosystem services, though regional databases and capacity building efforts.
C.5 Investment in long-term market access and sustainable coordination mechanism at regional and international level, through joint programmes to combat IUU fishing in the shrimp and groundfish sector along with building capacity to implement international binding fisheries instruments (FAO Compliance Agreement, UN Fish Stocks Agreement, FAO Port State Measures Agreement).
The report also identifies the envisaged benefits of above investments; the beneficiaries/recipients of investment/finance; financial intermediary/source of finance/investment; term/maturity of investment; source of revenue for repayment of investment/finance as well as the risks of achieving the investments objective and financial/economic viability.
3. CASE STUDIES
The report also includes case studies and references from the region and around the world that demonstrate how some of the types of investments envisaged have been successfully implemented elsewhere with detailed and complete references which allows for replication and adaptation (Annex I). These case studies include the following:
Economic and financial performance of selected small-scale fishing vessels in the Caribbean; ecolabelling, the Marine Stewardship Council and fisheries improvement projects; successful and ongoing marine habitat restoration and conservation projects on the Gulf of Mexico,
west coast of Florida, U.S.A.; benefits from Marine Protected Areas (MPAs) and benefits generated by marine ecosystem services
in Zanzibar; microcredit in support of empowerment of women and poverty alleviation in Vietnam, the
Philippines and India; livelihoods diversification and micro-enterprise development in Philippines and India; case studies and guidelines for microfinance in fisheries and aquaculture and on the management of
revolving funds and credit programmes for fishing communities based on reviews of successes and failures of fisheries credit and investment projects.
Annex III of the report shows the typical format of an agricultural project identification report used by the FAO/World Bank Investment Centre. Annex IV shows an example of a suggested format for an agricultural investment project brief used by the FAO/World Bank Investment Centre.
4. COUNTRY FISHERIES CHARACTERISTICS AND INVESTMENT NEEDS
4.1 Brazil
Fisheries characteristics
The North Brazil Shelf abuts the shorelines of the North Region and the northernmost part of the Northeast Region of Brazil. Nearly three quarters of the population of 53.6 million people of the Northeast region live in urban areas clustered along the Atlantic coast. The northeast region is also an impoverished region. 58 percent of the population lives in poverty and have an income of the equivalent of less than USD$2 per day6.
6 See: http://en.wikipedia.org/wiki/Northeast_Region,_Brazil
79
Current government policies towards the fisheries sector are based on sustainability, social inclusion, adequate structuring of production chains, strengthening of the domestic market, territorial approaches for management and development programmes, increased competitiveness and the sector's organizations and consolidation of state policies
More than 60 percent of the total fish landings, including inland fisheries, originate from artisanal, small-scale fisheries, which represent more than 90 percent of the employment in the capture fisheries sector. Total marine landings in the North Region and Northeast Region of Brazil was 227 663 tonnes in 2007. The value of this production was USD 590.9 million. As far as the total fisheries production of Brazil is concerned, according to FAO statistics, Brazil’s capture fisheries production in 2013 was 786 874 tonnes. The shrimp and groundfish production was 301 503 tonnes.
Most officially registered Brazilian fishermen and women are active in the north of the country. The Northeast and North Regions together represent over three fourth of the professionals in this sector. Women play an important role in Brazilian fisheries. The total numbers of fishers in Brazil was 877 000 in 2012. 561 000 of these fishers were employed in marine fisheries while 316 000 were employed in inland fisheries.
As far as shrimp and groundfish fisheries are concerned, in the northern part of Brazil, artisanal fishermen and women use mainly gillnets, while most industrial vessels use trawls. In the Northeast Region, fishing for crustaceans (lobster) is done with traps. Tunas and similar species are caught by pelagic longlines, trawls are used in shrimp fisheries and gill nets for finfish.
Several coastal fishery resources are fully exploited or over-exploited, as a result of excessive fishing effort, generally exerted by industrial fisheries. Excessive fishing effort has caused productivity to fall, and is often the reason for conflicts over access to resources. These occur between artisanal and industrial fishermen and also among fishing communities.
Brazil is the largest importer of fish in the Latin American region. Since 2003, imports have increased regularly, reaching nearly USD 1.3 billion in 2011. Exports have declined from USD 427 million in 2004 to USD 73.9 million in 2014, due an increase in domestic demand and the strengthening of the national currency against the US dollar.
Investment needs
An urgent need for investment is perceived for sustainable fisheries development and management, including aspects of environmental protection and restoration fisheries institutional capacity; protection and restoration of habitat including spawning and nursery grounds, national and regional fisheries management planning and implementation; monitoring programmes; rehabilitation and construction of landing site infrastructure as well as for fisheries enforcement and MCS.
Investment is also perceived to be required for improvement/diversification of livelihoods of fishing communities including microfinance support for fishers and women in fishing communities, reduction of by-catch and/or better use of by-catch and by-products of the fishery industry, fisheries institutional capacity building as well as for treatment of waste water and improvement of water quality.
Low investment priority is perceived for value addition through improved handling, utilization and marketing of fishery products.
4.2 Guyane (France)
Fisheries Characteristics
Guyane has three key fisheries, which are all exploiting groundfish and shrimp, i.e.: red snapper (1 600 tonnes in 2010), shrimp (900 tonnes in 2010) and artisanal fisheries (200 boats, with a production of
80
700 tonnes in 2010). To improve sustainability, turtle excluding devices (TEDs) and buycatch reducing devices (BRDs) are used to reduce bycatch. Shrimp and red snapper vessels are licensed (31 licensed boats by the EU). The total number of fishing vessels in Guyane (France) was 177 in 2013. The total number of fishers was 420 in the same year. According to FAO statistics, the total capture fisheries production in 2013 was 3 850 tonnes. The shrimp and groundfish production was 3 706 tonnes. The value of exports of fishery products from Guyane to Switzerland amounted to USD 8 394 in 2014.
In Guyane, fisheries management and services programmes are implemented to ensure that publicly-owned fisheries resources are appropriately managed and that regulations are enforced. Marine Protected Areas include the Wetlands of International Importance under the Ramsar convention on wetlands i.e. Basse-Mana and Les Marais de Kaw and the nature reserve of Ile du Grand Connetable. Two more MPAs have been proposed as nature reserves, i.e. Mana and the Centre Nature de Sinnamary.
Financial incentives and subsidies are provided for boat construction, renewal and modernization, fishery development and support services, fishing port construction and renovation, marketing support and storage infrastructure, tax exemptions, foreign access agreements and fuel subsidies.
Fishery development and support services are geared towards fisheries enterprise development. They include programmes such as the provision of institutional support and services, the provision of baits as well as search and rescue programs. The nature and sources for such programmes are diverse and include development grants and concession credit either from national sources or through bilateral and multilateral assistance programmes.
Public funds are used for the construction and maintenance of fish landing site infrastructures, port improvements for fishing fleets, harbour maintenance, jetty and landing facilities and low priced or free moorage for fishing fleets. Marketing support and storage infrastructure programmes are geared towards export promotion, value addition and price support. They also include infrastructure investment programmes supported by use of public funds for processing and storage of fishery products and fish auction facilities.
Investment needs
An urgent need for investment is perceived for fisheries institutional capacity, monitoring programmes, value addition as well as fisheries enforcement and MCS.
Investment is also perceived to be required for improvement/diversification of livelihoods of fishing communities including microfinance support for fishers and women in fishing communities, reduction of by-catch and/or better use of by-catch and by-products of the fishery industry, national/regional fisheries management planning and implementation as well as fisheries legislation, i.e. modernization of fisheries acts and regulations.
Low investment priority is perceived for environmental protection, restoration and sustainable fisheries development and management; prevention and treatment of waste water and improvement/restoration of water quality; protection and restoration of habitat including spawning and nursery grounds as well as the establishment of and improvements in the management of marine protected areas (MPAs).
4.3 Suriname
Fisheries characteristics
In 2010, 4 908 fishers were directly employed in Suriname’s fisheries sector while 1 043 people were indirectly employed. Fishing vessels operating in Suriname waters are multi-species and multi-gear. They include trawlers, snapper boats, open or decked wooden vessels and canoes. Suriname has an artisanal and industrial fishery. Before the 1980s the small-scale/artisanal fisheries sector was not well developed, and the
81
focus was on the commercial shrimp fishery industry. With the decline of the shrimp production in the 1980s, the finfish fishery industry started to develop.
The artisanal fleet is divided into coastal and inland fleets. It is estimated that the target resource, large demersal finfish, is already overfished. It is therefore necessary to restrict access, both by limiting the number of licenses and by curbing illegal fishing.
In the case of marine fisheries, the majority of the landing sites are in the capital and all processing plants are located there. Other landing places are in the four estuaries of the country: from east to west they are the Marowijne estuary, the Suriname-Commewijne estuary, the Coppename-Saramacca estuary and the Corantijne-Nickerie estuary.
As far as the level of exploitation of fishery resources are concerned, catches of Penaeid shrimp, large demersal fish and red snapper are believed to be reaching or have exceeded the maximum sustainable yield.
The fish processing industry in Suriname can be divided into artisanal and industrial processing plants.
According to FAO statistics, the total capture fisheries production of Suriname was 39 669 tonnes in 2013.
The value of fish products exports in 2013 was USD 23.1 million. The value of fish imports in 2006 was USD 5.9 million. The main destination of exported marine fish products was Japan followed by France. The main destination of seabob shrimp caught by trawlers is the USA.
In terms of quantity, exports of shrimp accounted for about 31 percent of all exports of fish and shrimp products. In terms of value, however, exports of shrimp accounted for about 70 percent of the value of all exports of fish and shrimp products from Suriname.
The industrial processing plants process the fish into various products, mainly for export. Products include frozen headless and head-on shrimps and prawns and whole, gutted fish, fish fillets and steaks, which are exported in frozen, salted, smoked or fresh-on-ice form.
Investment needs
Prevention and treatment of waste water and improvement are seen as low priority. Areas that are perceived to already receive adequate investment include national/regional fisheries management planning and implementation as well as fisheries legislation such as the modernization of acts and regulations. All other areas, i.e. institutional capacity, monitoring programmes, value addition as well as fisheries enforcement and MCS, improvement/diversification of livelihoods of fishing communities including microfinance support for fishers and women in fishing communities, reduction of by-catch and/or better use of by-catch and by-products of the fishery industry, environmental protection, restoration and sustainable fisheries development and management; protection and restoration of habitat including spawning and nursery grounds as well as the establishment of and improvements in the management of marine protected areas (MPAs) are perceived as in need of investment support.
4.4 Guyana
Fisheries characteristics
A diagnostic study to determine poverty levels in fishing communities of the Caribbean Community (CARICOM) carried out by CRFM found that Belize and Guyana were the countries with the highest percentage of poor and vulnerable households of all countries in the CLME studied. In Guyana coastal regions, 25 percent of fisherfolk households were classified as being vulnerable; which means on the verge of falling into poverty, and 24 percent of all households were classified as living in poverty.

82
The total number of fishers was 9 138 in 2013. The fishing industry employs 6 000 in processing and marketing. Thus more than 15 000 livelihoods depend directly on fishery, and many more benefit indirectly from fishing-related occupations, such as boat building, gear supply and repair. The total number of fishing vessels in Guyana was 1 402 in 2013. The following fishing fleets can be distinguished in Guyana: (1) Industrial Shrimp Fishery (2) Semi- Industrial Fishery which includes Deep Slope Fishery (3) Artisanal Fishery
The shrimp and groundfish fisheries represent the major fisheries sub-sector in Guyana and account for all the marine fisheries, operating in the areas around the continental shelf. Industrial fishers target mainly prawns and seabob shrimp, semi-industrial fishers target red/lane snappers and grunt species and the artisanal fishers target groundfish. Groundfish are also caught by the industrial fleets.
In 2010, production of the fishery industry reached 45 072 tonnes; of which 16 038 tonnes were exported at a value of approximately 9 billion Guyana dollars. According to FAO statistics, the total capture fisheries production of Guyana was 60 886 tonnes in 2013. Ninety-five percent of prawn is exported. The rest is sold to restaurants. Most seabob shrimps are also exported. The industrial finfish production is split more evenly between export and domestic markets. Exports of fishery products were valued at USD 36 439 million in 2013.
There has been a steady decline in prawn total landings and a dramatic increase in seabob total landings, particularly in the late 1990s. A shift in the fleet effort from prawn to seabob could explain the increasing seabob catches, but the fall in prawn catches is considered to be a direct result of reduced resource.
Investment needs
While the need for investments for the prevention and treatment of waste water and improvement/ restoration of water quality is not known, all other investments are perceived to be either urgently needed or needed. This includes national/regional fisheries management planning and implementation as well as fisheries legislation such as the modernization of acts and regulations, institutional capacity, monitoring programmes, value addition as well as fisheries enforcement and MCS, improvement/diversification of livelihoods of fishing communities including microfinance support for fishers and women in fishing communities, reduction of by-catch and/or better use of by-catch and by-products of the fishery industry, environmental protection, restoration and sustainable fisheries development and management; protection and restoration of habitat including spawning and nursery grounds as well as the establishment of and improvements in the management of marine protected areas (MPAs).
4.5 Venezuela
Fisheries characteristics
Fisheries legislation was updated in 2008 to acknowledge that the social role of fisheries prevails over economic and environmental aspects. Food security is a guiding principle as well as sustainable development.
In 2001, Venezuela’s total fisheries production for human consumption was 434 569 tonnes. 6 000 tonnes were produced for other purposes. Imports of fishery products amounted to 78 416 tonnes and 65 975 tonnes were exported. In 2003, the gross value of the fishery production was USD 142 113 000. According to FAO statistics, the total capture fisheries production was only 200 011 tonnes in 2013. The value of fishery exports was USD 46.9 million in 2013. In 2003, the primary fishery sector employed 95 600 people, while 691 000 people were employed in the secondary sector.
The total number of fishers in Venezuela was 77 346 in 2012. It is estimated that 691 000 people are employed in the secondary sector.
83
There are numerous fishing communities or fishing settlements established along the Venezuelan coast. In some areas fishing communities are grouped in associations that represent them. The number of coastal fishing communities identified thus far amounts to 390. They are located in the following regions/states:
The following fishing fleets can be distinguished, the industrial tuna fleet, the industrial trawl fleet and the industrial longline fleet. The artisanal, small-scale fishing fleet consists of a number of different small-scale fleets. The snapper and grouper fleet: the fleet consists of 553 vessels. The fleet targets high value groundfish/demersal species. The vessels are equipped with fishfinders, GPS, navigational and communication equipment.
There are other coastal artisanal fleets and types of fishing vessels as well as fishery supply and transport vessels, which operate in different regions, use a variety of fishing gear including gillnets, sourrounding nets, lines, dragnets, pots and traps etc. and target both demersal and pelagic resources. Their numbers are large and often not entirely known. They are locally referred to as the flota artesanal costera a distancia; the flota artesanal costera de orilla; los peñeros; las lanchas; la piragua and la chalana.
Investment needs
Urgently needed investments include investments in sustainable fisheries development and management, environmental protection and restauration; waste water treatment and improvement of water quality; modernization of fisheries acts and regulations; fishery institutions capacity building; monitoring of fish abundance and habitat changes; rehabilitation of infrastructure at landing sites and MCS. Other perceived investment needs include value addition as well as fisheries enforcement and MCS, improvement/diversification of livelihoods of fishing communities including microfinance support for fishers and women in fishing communities, reduction of by-catch and/or better use of by-catch and by-products of the fishery industry, environmental protection, restoration and sustainable fisheries development and management; protection and restoration of habitat including spawning and nursery grounds as well as the establishment of and improvements in the management of marine protected areas (MPAs).
4.6 Trinidad and Tobago
Fisheries characteristics
In Trinidad and Tobago, the general fisheries policy direction is the full utilisation of the resource consistent with ecological sustainability and minimal conflict between the artisanal and non-artisanal components of the fishery, to maximize contribution of the fishery sector to food security, employment with an emphasis on rural communities, and national maximum contribution to the GDP.
The shrimp trawl fisheries in Trinidad and Tobago is governed by Management Plan for the Trinidad and Tobago Shrimp Trawl Fishery, Version: 18 November 2014. The management plan aims to prevent new artisanal and non-artisanal trawlers from entering the shrimp fishery, to define the areas, in which the two groups of trawlers may operate, and to specify the mesh sizes to be used in the cod-ends of the trawl nets.
Regarding financial assistance to the fishery industry, future discretionary assistance will only be provided to encourage sustainable practices and support initiatives within the harvest strategy. These include supporting vessels in purchasing new equipment required under licenses, such as appropriate vessel monitoring system, and turtle excluder devices or by-catch reduction devices. Other assistance could include initiatives to reduce capacity in the fishery (possibly through buy-out schemes), training in handling catch and reducing post-harvest losses and small business management for fishers, incentives for installing devices in nets to improve selectivity or development of alternate livelihood opportunities.
As far as the development prospects of the fisheries sector are concerned, the artisanal inshore fishery resources are considered to be overfished. Further development should therefore be focused on the offshore
84
resources in the Exclusive Economic Zone of Trinidad and Tobago, especially on pelagic and deep sea demersal species.
The fisheries of Trinidad and Tobago are largely artisanal, with some semi-industrial multi-gear boats, semi-industrial and industrial trawlers. The total number of fishers in Trinidad and Tobago was 10 715 in 2012.
With respect to the social and economic importance of the shrimp and groundfish fisheries, trawl landings were estimated at 1 681 tonnes (12 percent of total landings) and valued at USD 5.05 million (18 percent of total landings) in 2009, with the artisanal landings being about 475 tonnes, semi-industrial about 194 tonnes, and industrial 1 012 tonnes. There are about 131 trawlers (95 artisanal, 10 semi-industrial, 26 industrial) and about 300 trawl fishers.
The fisheries contributed USD 13.513 million to the GDP in 2010 (9.8 percent of agriculture GDP, 0.06 percent of national GDP), with total annual fish landings estimated at about 13 942 tonnes valued at USD 29.4 million in 2010. According to FAO statistics, the total capture fisheries production in 2013 was 13 199 tonnes Trinidad and Tobago is a net importer of fish, both in terms of quantity and value. Fish exports were valued at USD 17 million in 2013. USD 10.1 million in 2009, and fish imports at 5 740 tonnes valued at USD 18.6 million.
Fish imports consist mainly of lower value salted, smoked and dried products to compensate for the availability of fresh products in short supply because of reduced production or increased exports. The export market is predominantly shrimp and other high-value species such as tunas, snappers, kingfish, dolphin fish and flying fish, in both fresh and frozen forms to the markets of North America (Canada and U.S.A) and the Caribbean.
In 2011, the number of commercial fishermen was estimated at about 3 414 and the number of fishing vessels at about 1 906.
The shrimp species were found to be fully exploited with analyses using data up to 2009 showing the overall stock biomass to be likely stable or increasing, though local depletion could still be taking place. The croaker (Micropogonias furnieri) stock (using 2006 data) as well as the weakfish (Cynoscion jamaicensis) stock were found to be fully exploited to overexploited. With regard to the Lane Snapper (Lutjanus synagris) (using data up to 2004), the overall stock biomass does not appear to be affected by the high local fishing mortality.
Investment needs
An urgent need for investment is perceived for improvement/diversification of livelihoods of fishing communities including microfinance support for fishers and women in fishing communities; prevention and treatment of waste water and improvement/restoration of water quality; protection and restoration of habitat including spawning and nursery grounds, establishment of and improvements in the management of marine protected areas (MPAs), artificial reefs; national/regional fisheries management planning and implementation as well as for modernization of fisheries acts and regulations.
Investment is also perceived to be required for sustainable fisheries management and environmental protection and restoration; fisheries institutional capacity building; fishery resources and habitat monitoring programmes as well as for rehabilitation/construction of infrastructure at landing sites.
4.7 Further prioritization of investment needs during the FAO/WECAFC Workshop on Investing in Ecosystem-based shrimp and groundfish fisheries management of the Guianas –Brazil shelf, held in Barbados on 7-8 September 2015
85
The national level investment needs of the countries had been further prioritized as follows (reference is made to the numbering in table 22 of the investment planning report):
Venezuela
1. B.1 Investments in support of livelihoods and basic needs. 2. C.2 Investments in national capacity building including research and modernization of fisheries acts and regulations. 3. C.4 Investment in the collection, analysis and sharing of data on groundfish and shrimp fisheries and resources, through regional data bases and capacity building.
86
French Guyana (Guyane)
1. B.2.1 Investments in rehabilitation/construction of landing sites. 2. B.4.2 Investment for establishment/expansion of fisheries cooperatives and associations. 3. C.4 Investment in collection, analysis and sharing of data on groundfish and shrimp fisheries and resources, through regional data bases and capacity building.
Trinidad and Tobago
1. B.1.1 Investments in identification and promotion of alternative livelihoods for small-scale fisherfolk with a focus on women in fishing communities, combined with B.3.2, i.e. investment in fishing vesselbuy-back and compensation schemes, which are both considered as ways of reducing capacity in the fishery. It was noted that B2.1 was important in the context of empowering fisherfolk. 2. C.2 Investments in national fisheries institutional capacity building including research and modernization of fisheries acts and regulations. Modernization of the structure of the Fisheries Division to more efficiently deal with fisheries management in the current global environment is required as well. 3. B.4.2. Investments for establishment/expansion of cooperatives/associations that would facilitate the participation of fisherfolk in fisheries management as well as economically empower them by providing services to their members. This would include investments in capacity building and training, including in the context of empowering fisherfolk to undertake the maintenance and management of infrastructure and facilities at landing sites, as mentioned in B.2.1. 4. B 4.1 Investments in the establishment of local financial intermediaries and/or expansion of existing financial services to rural fishing communities and tailoring these to their needs including the encouragement of savings. Also considered important here is the issue of insurance for fishers.
Guyana
1. A.2 Investments in research projects on gathering of data on fisheries ecosystem and subsequent analysis. Capacity building on Ecosystem management 2. B.2 Investments in the development and better management of landing sites and accompanying infrastructure i.e. ice facilities, marketing structures, fuel and other resource availability to improve self-sufficiency. 3. B.3.1 Investments in small scale aquaculture. 4. B.3.3 Investments in gathering of sufficient data to assess artisanal fishery, e.g. Chinese seine fishery. It was further noted that investments in cost effective communication systems for artisanal fisheries to address issues of piracy and improve MCS are required.
Suriname
1. B2 Investments in fishing Community Infrastructure, particularly storage, jetty and Ice production facilities. 2. A 2.1 Investments in monitoring facilities of protected areas and no fishing zones. 3. A 3.1 Investments in regional coordination of reef fishery, specifically the snapper fisheries in the region, operating from Venezuela 4. B 1.1 Investments in the identification and promotion of alternative livelihoods for small small-scale fisherfolk in three fishing communities
Brazil
1. A.2 Investment in environmental protection and restoration of habitat including spawning and nursery grounds. Also, A.2.2 was considered important, in view of the need to implement a project on mangrove rehabilitation.
87
2. C.1 and C.2 Investment in fisheries institutional capacity, national and regional fisheries management planning and implementation; MCS and enforcement programmes. 3. B.2.1 Investments in the rehabilitation and construction of fisheries landing site infrastructure.
5. THE WAY FORWARD
When it comes to identifying potential investments as laid out in table 22 above, these should be framed as far as possible within existing marine and coastal zoning processes. Examples are the National Plan for Integrated Coastal Zone Management (NPICZM) of Venezuela or “plan de ordenación y gestión integrada de las zonas costeras de Venezuela”, POGIZC, and the integrated coastal zone management plan of Brazil, i.e. the “plano nacional de gerenciamento costeiro” within Federal law No. 7.661/88.
If investments such as investments in water treatment infrastructure, in support of conservation of natural and aquatic resources and habitat restoration, in support of regional coordination and capacity building, in support of livelihoods and fulfillment of basic needs and similar incestments are envisaged in the framework of integrated coastal and marine management plans, it may be possible to mitigate investment risks and enhance both the effectiveness and the efficiency of potential investments. It may further strengthen an ecosystem approach to fisheries as well as adherence to the precautionary principle assuming that zoning plans are effectively implemented and are compatible with an ecosystem approach to fisheries as well as conservation and restoration efforts.
This way, investments may be identified that directly support ongoing zoning efforts and are therefore feasible in the short term. Likewise, other investments can be envisaged in the longer term contingent on the availability of human and financial resources, and even contingent on specific institutional reforms for which the longer term must be considered.
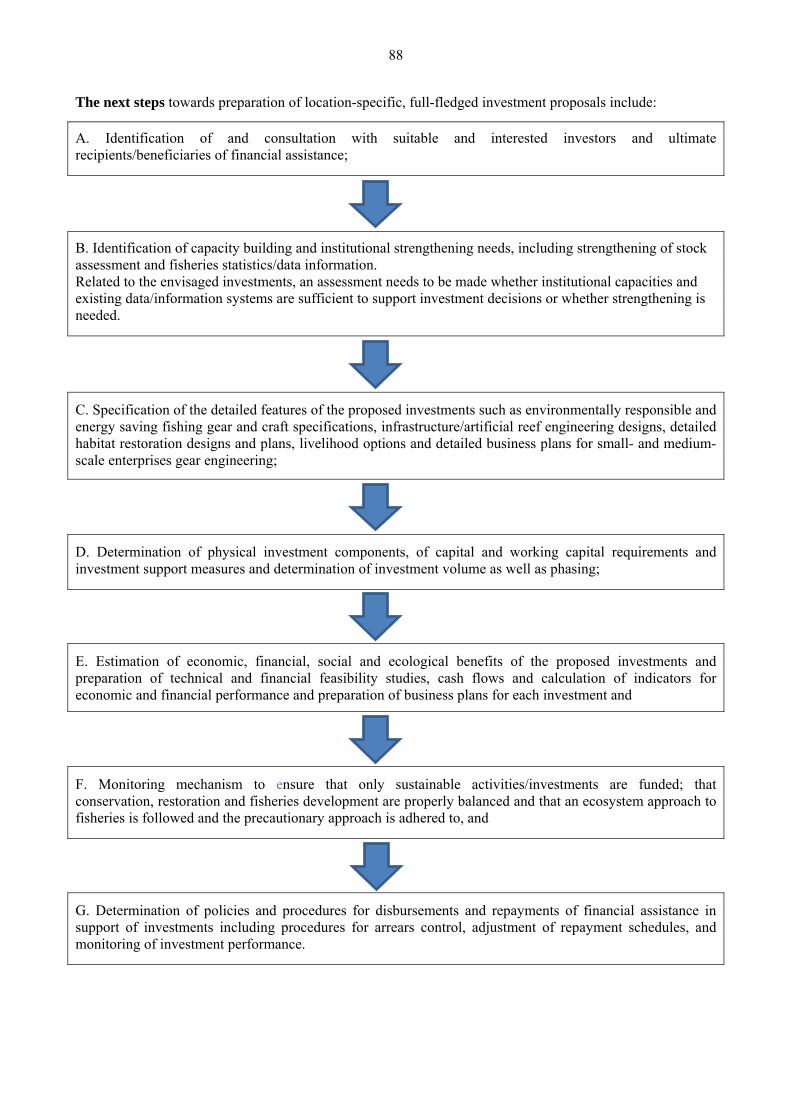
88
The next steps towards preparation of location-specific, full-fledged investment proposals include:
A. Identification of and consultation with suitable and interested investors and ultimate recipients/beneficiaries of financial assistance;
B. Identification of capacity building and institutional strengthening needs, including strengthening of stock assessment and fisheries statistics/data information. Related to the envisaged investments, an assessment needs to be made whether institutional capacities and existing data/information systems are sufficient to support investment decisions or whether strengthening is needed.
C. Specification of the detailed features of the proposed investments such as environmentally responsible and energy saving fishing gear and craft specifications, infrastructure/artificial reef engineering designs, detailed habitat restoration designs and plans, livelihood options and detailed business plans for small- and medium-scale enterprises gear engineering;
D. Determination of physical investment components, of capital and working capital requirements and investment support measures and determination of investment volume as well as phasing;
E. Estimation of economic, financial, social and ecological benefits of the proposed investments and preparation of technical and financial feasibility studies, cash flows and calculation of indicators for economic and financial performance and preparation of business plans for each investment and
F. Monitoring mechanism to ensure that only sustainable activities/investments are funded; that conservation, restoration and fisheries development are properly balanced and that an ecosystem approach to fisheries is followed and the precautionary approach is adhered to, and
G. Determination of policies and procedures for disbursements and repayments of financial assistance in support of investments including procedures for arrears control, adjustment of repayment schedules, and monitoring of investment performance.
The Workshop on investing in ecosystem-based shrimp and groundfish fisheries management of the Guianas –Brazil shelf, was held in Barbados, from 7 to 8 September 2015. The Workshop was the First meeting of the
joint Working Group on Shrimp and Groundfish. The experts attending the workshop discussed three background documents on bioeconomic
analysis of the fisheries, the current management arrangements as well as a proposal of investment plan for the shrimp and groundfish fisheries in
the sub-region; all three documents are included in this volume. The sub-regional shrimp and groundfish management and investment
recommendations are in line with the outcomes of the CLME+ project on “Catalysing Implementation of the Strategic Action Programme for the
Sustainable Management of shared Living Marine Resources in the Caribbean and North Brazil Shelf Large Marine Ecosystems”, and this
project will support regional adaptation and implementation of the
recommendations in the near future.
I5648EN/1/10.17
ISBN 978-92-5-109226-2
9 7 8 9 2 5 1 0 9 2 2 6 2
ISSN 2070-6065


![Ch. 10—South America. A. 2 Divisions of South America=Spanish- Speaking South America (exceptions: Suriname [Dutch Speaking] and French Guiana [Territory](https://img.pdfslide.us/doc/110x75/5697bf711a28abf838c7e0e4/ch-10south-america-a-2-divisions-of-south-americaspanish-speaking-south.jpg)