Embed Size (px)
Citation preview
For additional information, please contact Karen Humelbaugh, Workforce Division Director for the Dept. of Community Colleges and Workforce Development, at 503-947-2404 or [email protected].
Back to Work Oregon
Background
In the fall of 2011, Oregon’s unemployment rate was 9.3 percent. There were 30,400 job openings in Oregon and 175,100 Oregonians looking for work. At the same time, many companies indicated they had a hard time finding workers with the right skills. The Back to Work Oregon program was one of Governor Kitzhaber’s first five job creation strategies, launched in 2011, to get Oregon’s economy back on track. The program consists of two components:
• On-the-Job Training (OJT): A “hire-first” program that reimburses a company for the cost of training a new employee. A rigorous training plan is put in place by the company which leads to employee retention in the job. The employee becomes a taxpayer by drawing a paycheck during training and beyond.
• Oregon’s National Career Readiness Certificate (NCRC): Certification that demonstrates an individual has the foundational workplace skills necessary to succeed in the training plan and on the job, and provides the individual with a national portable credential for future career growth.
Since its inception, the program has been resourced with $9.2 million from the Oregon Legislature, matched by Oregon’s Local Workforce Investment Boards (LWIBs), and supported by the Oregon Employment Department. For every OJT opportunity funded with state general funds, the LWIBs have leveraged funds to contribute a one-to-one match.
Results to Date To date, 1,713 state funded OJTs have been completed which has been matched by the LWIBs with an additional 1,251 OJTs. This is a total of 2,964 Oregonians into OJTs. It is anticipated that additional 923 state funded and locally matched OJTs will be completed by June 2015. Of the total OJTs completed, more than 65% of participants have earned a National Career Readiness Certificate. This program is not successful without the 1,973 Oregon businesses that have provided OJT opportunities for Oregonians. Manufacturing firms have provides the largest number of OJTs, representing about a third of total participating businesses. Other top industries providing OJT opportunities include Health Care and Social Assistance, Construction, and Administrative, Support, Waste Management and Remediation Services. For the first 1,279 participants who completed the program, the average hourly wage earned was $17.25 (about $29,400 annually). In one year, this resulted in earnings of approximately $37.6 million. There is a lag in time wage data for those participants who exited after January or are still participating. Staff will continue to track data participant wages and earnings to see how this changes over time.
"Back to Work Oregon has helped us
find the right workers, with the right
attitudes to fit our work culture, for
the right positions with our
company!"
Steve Cary, Employer
Vice President for Feeney Wireless
Eugene, Oregon

HECC/OWIB Taskforce
1
OWIB September 12, 2014

Taskforce Charter
• Identify a set of common goals for achievement of the middle 40 with common measurable outcomes.
• Clarify the roles and responsibilities of the two boards as well as the roles of the education and workforce partners to achieve middle 40 and workforce goals.
• Identify the policy areas where there is overlap between the work of the two boards related to common goals, and recommend a mechanism for managing this “shared space” in order to achieve common outcomes.
• Clarify the relationship and accountability between workforce and education partners for the achievement of common goals, outcomes, and metrics.
2

Membership
• Two members of HECC • Three members of OWIB • Director of the HECC • Director of OED • Deputy Commissioner of CCWD • Ex-Officio Members ▫ Two representatives from the Oregon Community
College President’s Council ▫ Two representatives from the Oregon Workforce
Partnership 3

Mission Statement To share responsibility for achievement of the
middle 40 goal.
4

Definition of Shared Space Joint ownership at the state level for the
development of aligned policies, outcome measures, guidance, resources, communications, data and evaluation necessary to achieve Oregon’s middle 40 education and workforce goals.
5

Recommendations What Counts for the Middle 40 • Recommendation 1: Cast a wide net when
considering what counts for the middle 40. • Recommendation 2: Count the number of
Oregonians with credentials, but track all middle 40 credentials earned.
6

Recommendations Cont. Investments • Recommendation 3: Make strategic investments
to align middle 40 goal with economic success for Oregonians.
7

Recommendations Cont.
Data • Recommendation 4: Collect/share student level
data in order to track/count degrees, certificates and credentials.
• Recommendation 5: Use data developed by the
HECC, Oregon Employment Department and ECONorthwest as a first step to identify middle 40 goal for those not currently in the education pipeline (e.g. adults not currently in school).
8

Recommendations Cont. Common Outcomes • Recommendation 6: Adopt common outcomes for the
education and workforce systems. ▫ Skill gain/credential rate ▫ Entered employment ▫ Employment Retention ▫ Earnings from Employment ▫ Wage gain
• Recommendation 7: Use Oregon’s Performance Reporting
Information System (PRISM) as the foundation for reporting on outcome measures and ensure that PRISM links seamlessly to the education system’s State Longitudinal Database.
• Recommendation 8: Co-enroll postsecondary and
WorkSource participants for common ownership and outcomes.
9

Recommendations Cont. Mechanisms for Managing Shared Space • Recommendation 9: Adopt mechanism to
support the achievement of the OWIB and HECC common goal – achieving the middle 40. ▫ Annual OWIB/HECC Talent Summit
▫ Biennial policy summit to focus on joint strategies
▫ Joint development of investment priorities once a biennium
10
Discussion Questions ▫ Do you support the general approach?
▫ Is something missing or need further clarification?
▫ Any other feedback?
11
Measure CurrentChange from Prior
YearTrend
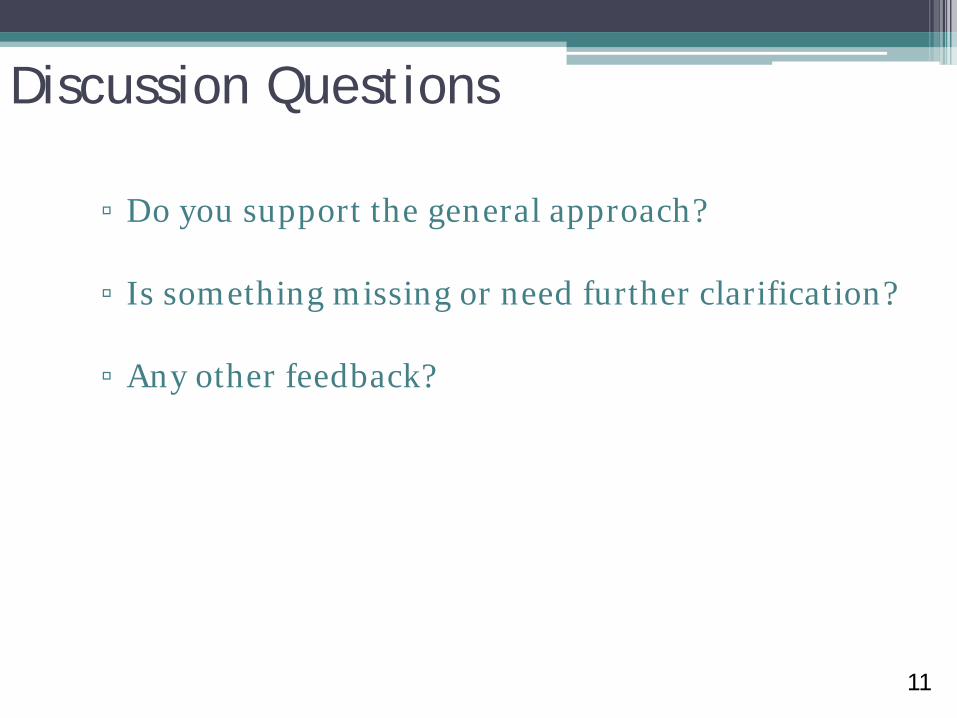
BTWO Employment Rate
data Q42012 through 4Q201392.76% 5.3
PRISM Employment Rate
data 4Q2012 through 4Q2013
includes BTWO
72.04% 2.3
BTWO Retention Rate
data 1Q2012 through 1Q201372.39% -4.9
PRISM Retention Rate
data 1Q2012 through 1Q2013
includes BTWO
62.96% -1.4
BTWO Wage Gain
data 4Q2011 through 4Q2012$1.92 $0.68
PRISM Wage Gain
data 4Q2011 through 4Q2012
includes BTWO
$0.76 $0.01
Quarterly BTWO Report - Statewide
U.S.
Oregon
55.00%
70.00%
85.00%
BTWO Retention
PRISM Retention
65.00%
80.00%
95.00%
BTWO Employment
PRISM Employment
$0.00
$2.00
$4.00
BTWO Wage Gain
PRISM Wage Gain
Source: PRISMUpdated 9/11/14

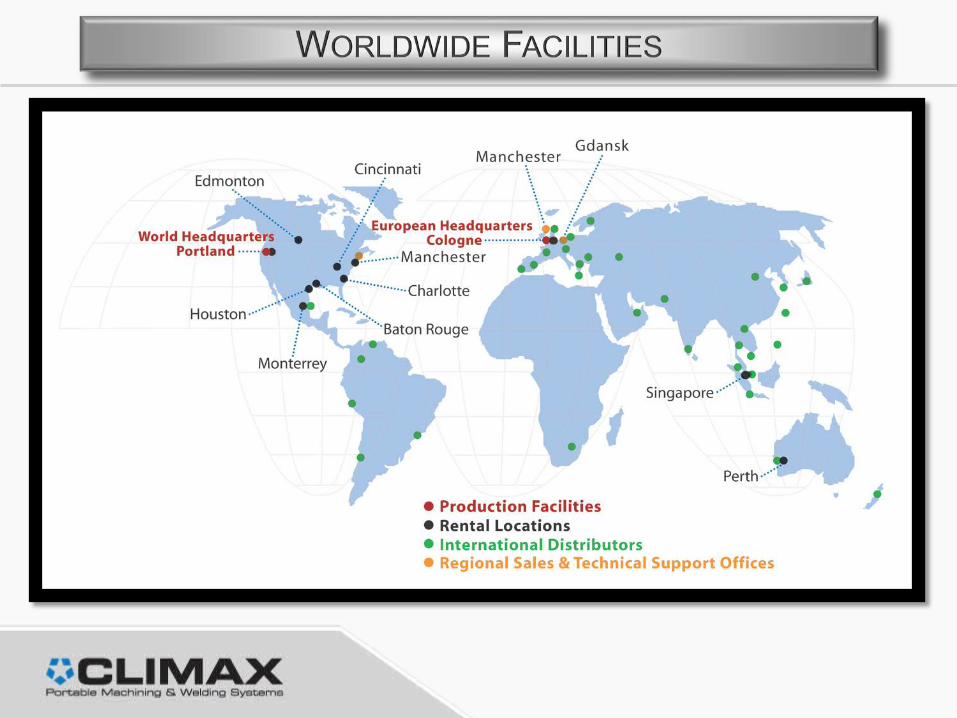
How a Community Campus Solves the Workforce Shortage
Colleen Winkler
Talent Scout


Newport News
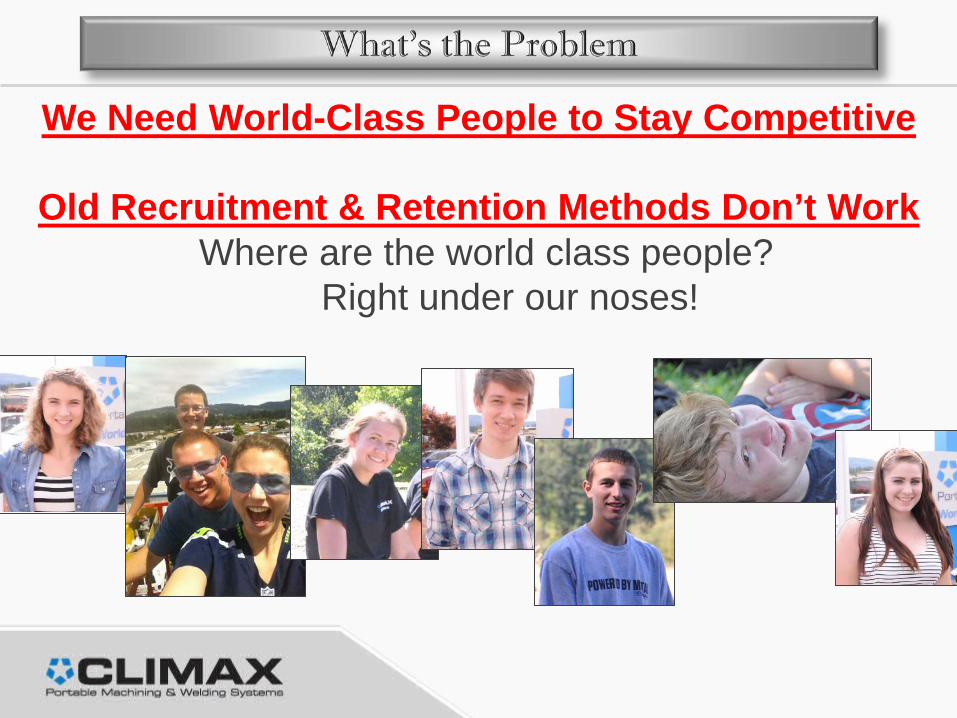
We Need World-Class People to Stay Competitive
Old Recruitment & Retention Methods Don’t Work Where are the world class people?
Right under our noses!

Inspiring Passionate
Ambassadors who are Committed to Change in
Our World
Employees
Leaders
Retirees High School
3rd Graders
Graduated Retirement
Community Impact
PARENTS
Volunteer

• New Employee Orientation • Employer Expectations 3X ROI • History/Journey of Climax
• Quality • Department Overviews • HR / Benefits • Business Finance • Project Management • Principles of Lean • Problem Solving • DiCor (Creativity/Innovation) • Presentation Skills • Quarterly Business Review
• Personal Finance • Auto Purchasing / Maintenance • Insurance / Risk Management • Resumes / Cover Letters/ Job Search • Mock Interviews • Community College Overview • Etiquette • Children’s Hope & Sustainability • Medical Teams International • 1st Aid/CPR/AED/BBP
• Community Service Project • Work Project • School Work

William C. Kutz & Associates
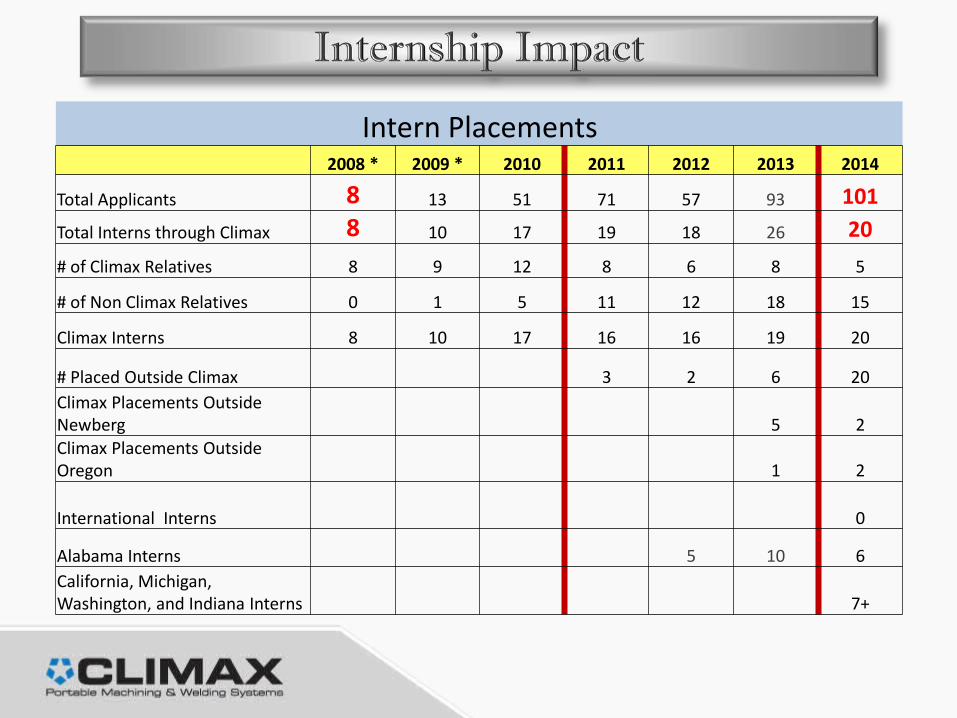
Intern Placements 2008 * 2009 * 2010 2011 2012 2013 2014
Total Applicants 8 13 51 71 57 93 101 Total Interns through Climax 8 10 17 19 18 26 20 # of Climax Relatives 8 9 12 8 6 8 5
# of Non Climax Relatives 0 1 5 11 12 18 15
Climax Interns 8 10 17 16 16 19 20
# Placed Outside Climax 3 2 6 20 Climax Placements Outside Newberg 5 2 Climax Placements Outside Oregon 1 2
International Interns 0
Alabama Interns 5 10 6 California, Michigan, Washington, and Indiana Interns 7+

2008 2009 2010 2011 2012 2013 2014 Project
Community Food Drive
Community Food Drive
Community Book Drive
Sr. Citizen Prom; Love Inc.; Good Neighbor Center
Medical Teams Int'l, Love Inc., Five Rock Ranch, Burgerville Fundraising
Community Park Clean Up, Habitat for Humanity, Five Rock Ranch, Sr. Citizen Prom
Diaper Drive, Tilikum Workday, Climax Family Game Night, Blanket Fundraiser
Goal
500 lbs 20,000 lbs / 30,000 lbs
1,500 books
Community Impact
Local and Global Impact (Work locally, raise $2,000 for Haiti)
Local Community Impact
1000 Diapers 36 Blankets Climax and Local Community Impact Results
12,000 lbs 42,500 lbs & 17 organizations
4,500 books donated to hospitals and libraries
Helped 3 local families with house/yard work; renovated 1 room at the Good Neighbor Center; Danced the night away with the Astor House Residents
Built Dance floor; Cleaned/Organized Sheds; Cleaned/ renovated Tack Room; Helped 6 local families with house/yard work; Raised $2,250 for Haiti
Pulled weeds/ landscaped, 35 seniors from around the community attended the dance, painted 8 rooms
5,340 Diapers 50 blankets (raised $280 dollars through a can drive, $300 of community donations) Brought Climax community together for a night of fun and games Smashed concrete ($3000 worth of retaining wall) and organized a shed

Expected (3X) Actual % 2008 not tracked 2009 not tracked
2010 $ 73,000 $199,757 115%
2011 $ 183,600 $298,872 163% 2012 $ 144,000 $289,515 201%
2013 $ 288,600 $664,864 230% 2014 $222,000 $500,084 225%

118 Interns 35 Schools 21 Partner Companies HS & CC Credit Reverse Mentoring
Results Learning's School Year Interns Interns bring a fresh
perspective Safety Generational Technology
Retire the idea that Interns do busy work!
Interns add significant value (ROI)

2008 & 2009 Intern 2013 Tool Crib Attendant 2014 Returning to College! 2009 Intern 2010 Director of Social Media 2010 Intern 2012 Entry Level Machinist
2011 Intern 2012 Machine Tool Builder 2014 Machinist Apprentice
2012 Intern 2014 Industrial Maintenance Apprentice 2013 Intern 2014 Machinist Apprentice
Jordan
Kendra
Logan
Nic
Grady
Kyle


• AME Presentations in
• Chicago • Kentucky • Toronto • Jacksonville • Cincinnati • Denver • Winnipeg
• International • Intern Alumni Build
Your Program?!

September 12, 2014
Oregon Workforce Investment Board
Salem, OR
A State Model for Promoting Work-Based Learning
1
Brent Parton, Policy Analyst
Economic and Workforce
Development

A “Workforce Moment”
Skills increasingly matter to…
Individuals States
Income, economic security and mobility
Productivity and profits
Economic competitiveness and growth
Firms

The importance of skills within….
Skills and Workforce Development Roles
Workplace flexibility reflects the value of workers skills vs. their “seat time”
Technology serving job-seekers and employers through skills matching
Work-based learning opportunities to bridge the classroom and the workplace
Labor standards and safety
Education and training opportunities
Labor exchange and employment services

Work-based Learning to Bridge Two Worlds
EDUCATION AND TRAINING PROVIDERS:• Accountable for
employment outcomes• Competition for
resources
EMPLOYERS:• Demand for foundational
and technical skills • Competition for skilled
workers
Apprenticeship
Off Campus Work Study
Corporate Colleges
Contract Training
On the Job Training
Student Friendly
Professional Education
Co-ops
On Campus Work Study
Internships
Working Student Friendly
Adapted from National Network of Business and Industry Associations, 2014
Apprenticeship
On-the-Job Training
Internships
Youth Work Experience
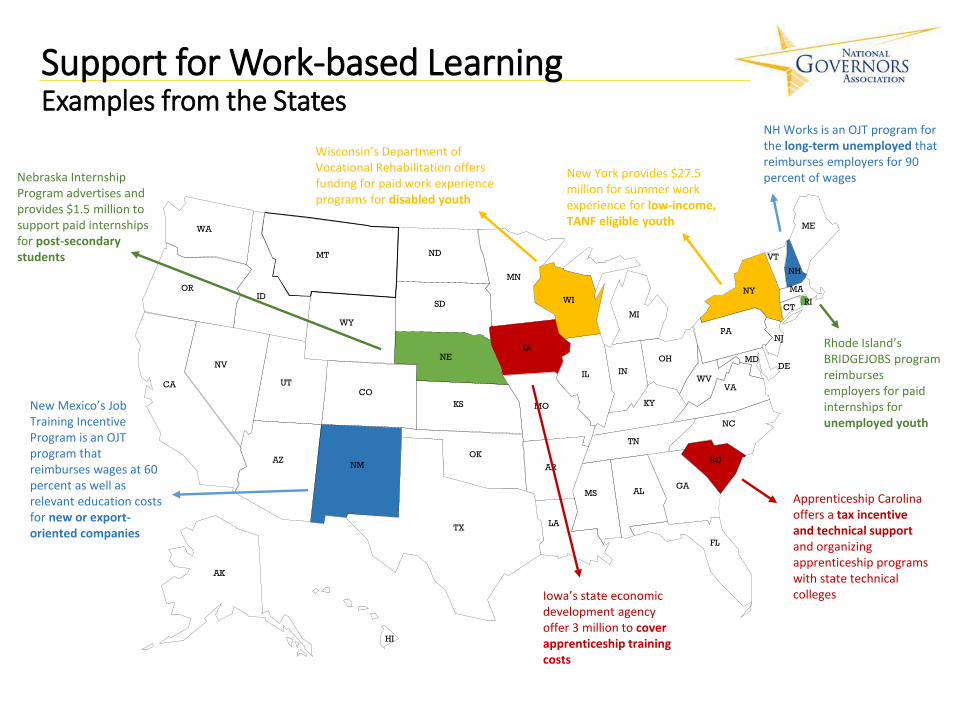
Support for Work-based LearningExamples from the States
WA
OR
CA
AK
NV
MT
CO
OK
WI
NE
HI
ID
WY
AZ
KS
ND
IA
AR
UT
NM
TX
MN
MO
LA
SD
MS
KY
IL
MI
NY
GA
SC
VA
AL
TN
IN
OH
PA
FL
NC
WV
DE
NJ
ME
VT
NH
MA
RICT
MD
New York provides $27.5 million for summer work experience for low-income, TANF eligible youth
Nebraska Internship Program advertises and provides $1.5 million to support paid internships for post-secondary students
NH Works is an OJT program for the long-term unemployed that reimburses employers for 90 percent of wages
Rhode Island’s BRIDGEJOBS program reimburses employers for paid internships for unemployed youth
Wisconsin’s Department of Vocational Rehabilitation offers funding for paid work experience programs for disabled youth
Iowa’s state economic development agency offer 3 million to cover apprenticeship training costs
New Mexico’s Job Training Incentive Program is an OJT program that reimburses wages at 60 percent as well as relevant education costs for new or export-oriented companies
Apprenticeship Carolina offers a tax incentive and technical support and organizing apprenticeship programs with state technical colleges
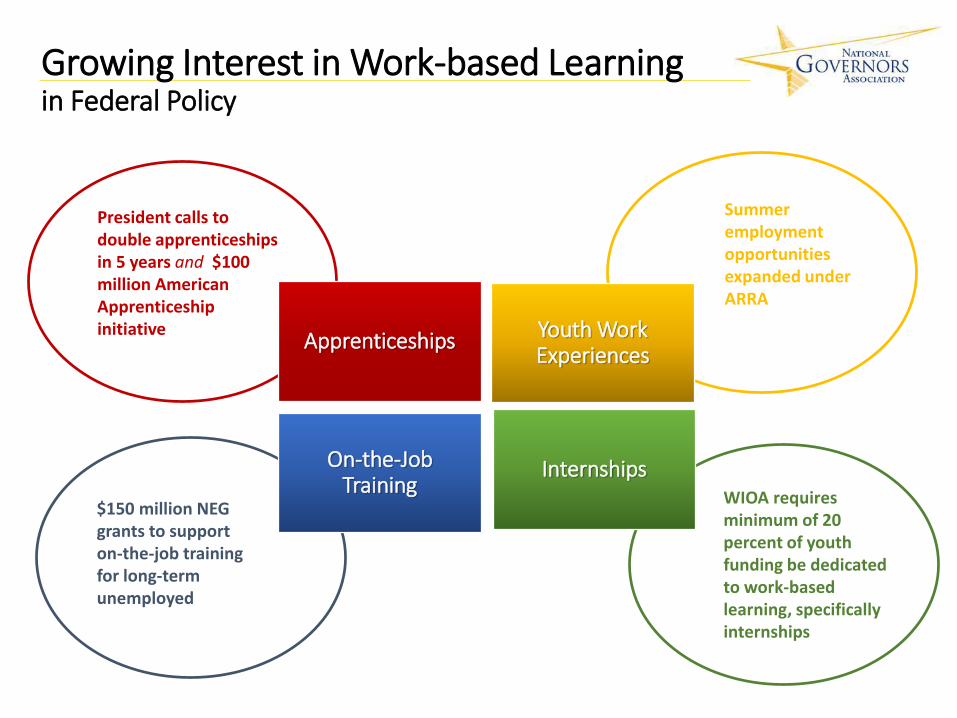
Growing Interest in Work-based Learningin Federal Policy
President calls to double apprenticeships in 5 years and $100 million American Apprenticeship initiative
Summer employment opportunities expanded under ARRA
On-the-Job Training
Youth Work Experiences
Internships
Apprenticeships
$150 million NEG grants to support on-the-job training for long-term unemployed
WIOA requires minimum of 20 percent of youth funding be dedicated to work-based learning, specifically internships
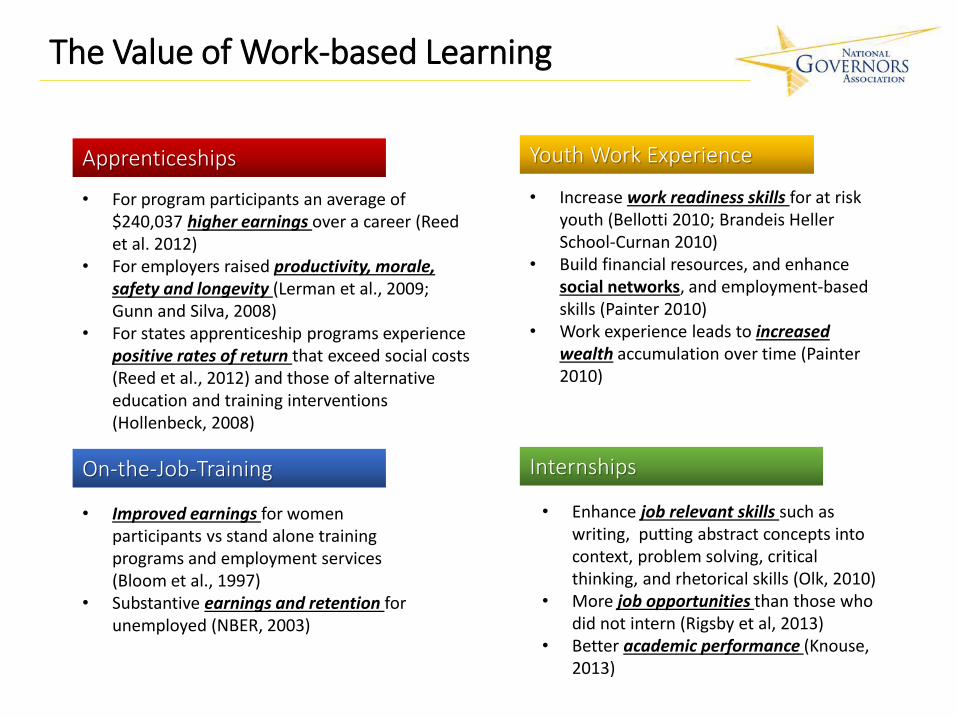
The Value of Work-based Learning
Apprenticeships Youth Work Experience
On-the-Job-Training Internships
• For program participants an average of $240,037 higher earnings over a career (Reed et al. 2012)
• For employers raised productivity, morale, safety and longevity (Lerman et al., 2009; Gunn and Silva, 2008)
• For states apprenticeship programs experience positive rates of return that exceed social costs (Reed et al., 2012) and those of alternative education and training interventions (Hollenbeck, 2008)
• Increase work readiness skills for at risk youth (Bellotti 2010; Brandeis Heller School-Curnan 2010)
• Build financial resources, and enhance social networks, and employment-based skills (Painter 2010)
• Work experience leads to increased wealth accumulation over time (Painter 2010)
• Enhance job relevant skills such as writing, putting abstract concepts into context, problem solving, critical thinking, and rhetorical skills (Olk, 2010)
• More job opportunities than those who did not intern (Rigsby et al, 2013)
• Better academic performance (Knouse, 2013)
• Improved earnings for womenparticipants vs stand alone training programs and employment services (Bloom et al., 1997)
• Substantive earnings and retention for unemployed (NBER, 2003)

Toward an integrated understanding...
Interest in work-based learning driven by potential to benefit….
Individuals States
• Higher earnings • Networks for job
opportunities• Relevant skills• Academic
achievement
• Productivity• Employee morale• Retention• Pool of candidates
• Cost-effective education and training
• Economic and social impacts
Firms
….but programs vary within and across models

Concerns Over Quality
Work-based learning…. in name only?

States Striking the Right Balance
Flexibility to scale and meet specific industry and/or
population needs
Program quality to realize benefits and value
of work based learning

An Integrated Understanding Work-Based Learning
What are the core elements that may make these models work?
Apprenticeships
On-the-Job Training
Youth Work Experiences
Internships

A Conceptual ModelWork-Based Learning
Four Core Elements Element Enhancements
1. AGREEMENTFormal articulation of terms (plan, length) and compensation (wage, credit) between participant and employer
WAGES: Participant is paid a wage
PRE-ASSESSMENT: Agreement informed by customized
assessment of participant learning objectives/needs
2. ONSITE WORK COMPONENTParticipant engages in supervised work of value to host organization
HIGH-DEMAND INDUSTRY: Host organization
represents a high demand sector/industry with sound career/employment prospects
MENTORSHIP: Structured mentorship opportunity
3. LEARNING COMPONENTParticipant engages in structured learning activities to enhance existing knowledge, skills and abilities
CREDENTIAL: Learning acquired over the course of the
experience is certified and/or can be articulated for academic credit
COHORT LEARNING: Learning experience is provided by
a professional instructor in an environment with peers
4. PERFORMANCE ASSESSMENTUpon conclusion, employer assesses performance and provides feedback directly to participant
WORK & LEARNING ASSESSMENT: Employer
assessment and feedback is integrated with additional learning outcomes to provide an overall review of the experience
INTERMEDIARY FEEDBACK: Feedback goes to
intermediary that organizes work-base-learning

Four Core Elements
Agreement
Onsite Work
Component
Learning
Component
Performance
Assessment
A Model for Work-Based Learning
Increasing Strategic Importance of Work-Based Learning:
• Business Engagement
• Various Demographic Groups
• Career Pathways
• Sector strategies

Four Core Elements
Agreement
Onsite Work
Component
Learning
Component
Performance
Assessment
A Model for Work-Based Learning
An adaptive model based upon:
• The economic and workforce development objectives of the state
• The needs of an employer, industry or sector and/or specific demographic groups
How does a state facilitate and support the partnerships needed to make the most of work-based learning investments?

Four Core Elements
Agreement
Onsite Work
Component
Learning
Component
Performance
Assessment
A Model for Work-Based Learning
Steps for Interested StatesStates interested in making the most of their investments in work-based learning will need more information, including:
• Who ParticipatesWhat is the current level of business and participant engagement in WBL, and where should these be increased?
• Who BenefitsWhat are the measurable impacts of WBL, where are they the greatest, and what can be learned to bring to scale?
• Why is it WorkingBeyond the core elements, which element enhancements are most important for different populations and industries? How can the use of those enhancements be further supported?

Four Core Elements
Agreement
Onsite Work
Component
Learning
Component
Performance
Assessment
A Model for Work-Based Learning
Steps for Interested StatesStates interested in expanding work-based learning opportunities can consider ideas for action across three areas:
• Policy and program alignment Making partnerships among stakeholders easier to establish and sustain
• Metrics for success Clarity around goals and ensuring capacity to measure progress and success
• Right mix of incentives, support and outreach The tools the state has at its disposal to support these opportunities
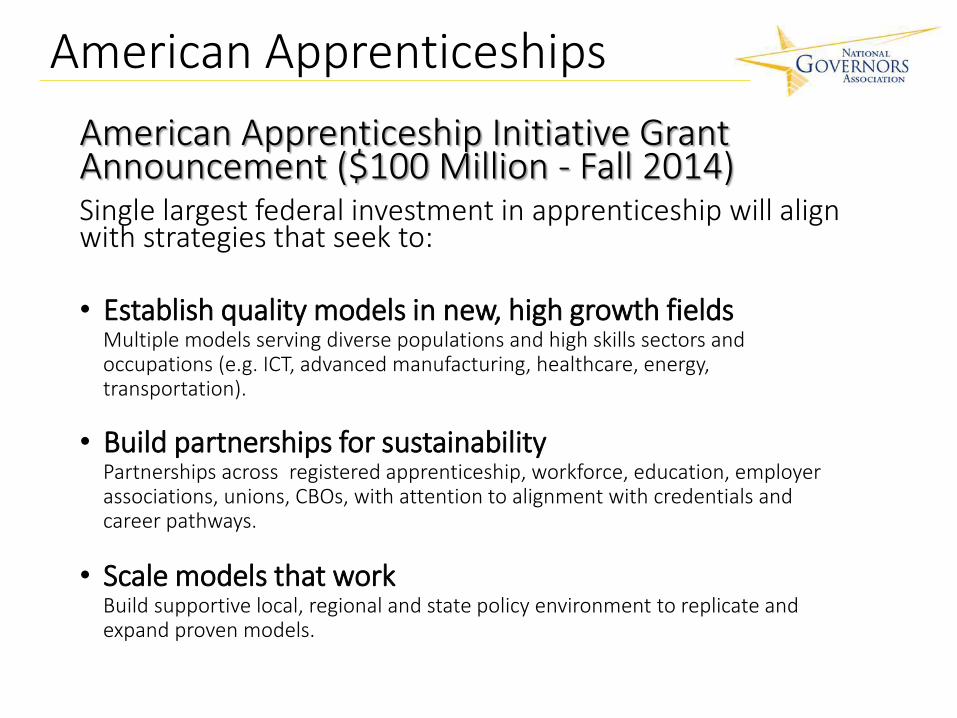
American Apprenticeships
American Apprenticeship Initiative Grant Announcement ($100 Million - Fall 2014)Single largest federal investment in apprenticeship will align with strategies that seek to:
• Establish quality models in new, high growth fieldsMultiple models serving diverse populations and high skills sectors and occupations (e.g. ICT, advanced manufacturing, healthcare, energy, transportation).
• Build partnerships for sustainability Partnerships across registered apprenticeship, workforce, education, employer associations, unions, CBOs, with attention to alignment with credentials and career pathways.
• Scale models that work Build supportive local, regional and state policy environment to replicate and expand proven models.
Thank You!
Brent Parton
Policy Analyst, Economic and Workforce Development, National Governors Association Center for Best Practices
202.624.5332