Embed Size (px)
Citation preview
Bachelor Thesis
Analytical Method Validation within the Implementation of a Monitoring Concept for Waste Water
in the Industrial Zone of Tra Noc, Vietnam
Course of Studies: Environmental Engineering
submitted by Maike Ladehoff
Matriculation Number 1935747
Hamburg, 21. September 2012
First examiner: Prof. Dr. habil. Gesine Witt Second examiner: Dr. Ing. Dr. rer. nat. Wolfgang Genthe
This bachelor thesis was overseen by LAR Project Analysers AG, Berlin

I
Preposition The constantly changing demand and supply of the resource water is influenced by climate
change, the rise of the global populate, urbanization as well as the increase of consumption
and affluence. The availability of clean, non-hazardous water is often not ensured as well
as sufficiently protected in threshold and developing countries.
Since the last two decades Vietnam’s economy has experiences huge growth and as a
result the number of Industrial Zones is constantly increasing. Currently there are more
than 200 registered Industrial Zones and even though it is mandatory, most of them don’t
possess sustainable waste water treatment. This naturally leads to severe environmental
pollution, the decrease in life quality and health of the people as well as the flora and
fauna.
In the context of a joint German-Vietnamese Cooperation, called AKIZ, a pilot project is
currently being developed in the Mekong Delta Region. The project started in 2010 and
takes place in the industrial zone of Tra Noc which is located just south of the city of Can
Tho. In addition to the planning of a centralized waste water treatment plant, the project
partners are compiling an integrated concept for waste water treatment in industrial zones.
This is to guarantee the efficient, economical and ecological sustainable operation of the
whole waste water system.
One of the main objectives of this project is the development of a monitoring program to
observe and monitor the content of industrial waste water, particularly with regards to
toxicity and pollution. The collected information will then be used to create a database to
enable and support the decision making process on waste water treatment related
questions.

II
Table of Content
1 INTRODUCTION ________________________________________________ 1
1.1 Assignment __________________________________________________________ 1
1.2 Structure of this Work ________________________________________________ 2
2 FRAMEWORK __________________________________________________ 3
2.1 Geography and Climate _______________________________________________ 3
2.2 Tra Noc und its Industries _____________________________________________ 3
2.3 Environmental Guidelines and Limiting Values ___________________________ 5
3 IMPLEMENTATION OF THE MONITORING CONCEPT _________________ 7
3.1 Objective of the Monitoring Concept_____________________________________ 7
3.2 Planning Criteria _____________________________________________________ 7 3.2.1 Timeline _________________________________________________________ 7 3.2.2 Locations_________________________________________________________ 8
4 FUNDAMENTALS _______________________________________________ 9
4.1 Sample Taking _______________________________________________________ 9
4.2 Relevant Parameter to Evaluate Industrial Waste Water 6 9__________________ 9 4.2.1 Chemical Parameters ______________________________________________ 10 4.2.2 Physical Parameters _______________________________________________ 14
5 ANALYTICAL METHODS AND MONITORING RESULTS ______________ 16
5.1 Materials___________________________________________________________ 17
5.2 Tube Tests__________________________________________________________ 18
5.3 Devices and Software_________________________________________________ 18
5.4 General on Measurement Proceeding ___________________________________ 18 5.4.1 Preparation Materials and Devices ____________________________________ 18 5.4.2 Preparation of Sample, Reagents and Solutions __________________________ 19 5.4.3 Calibration ______________________________________________________ 20 5.4.4 Evaluation of Concentration _________________________________________ 20
III
5.5 Method Principles and Presentation of Results ___________________________ 21 5.5.1 Method Description - Ammonium ____________________________________ 21 5.5.2 Ammonium Results of Monitoring Activity_____________________________ 24 5.5.3 Method Description - Nitrate ________________________________________ 27 5.5.4 Nitrate Results of Monitoring Activity_________________________________ 29 5.5.5 Method Description - Nitrite ________________________________________ 31 5.5.6 Nitrite Results of Monitoring Activity _________________________________ 33 5.5.7 Method Description - Total Nitrogen _________________________________ 34 5.5.8 Total Nitrogen Results of Monitoring Activity __________________________ 34 5.5.9 Method Description - Orthophosphate and Total Phosphorus _______________ 37 5.5.10 Orthophosphate Results of Monitoring Activity ________________________ 39 5.5.11 Total Phosphorus Results of Monitoring Activity _______________________ 42
5.6 Quality Assurance ___________________________________________________ 44 5.6.1 Reference Values _________________________________________________ 44 5.6.2 Plausibility for Results of Nitrogen Compounds _________________________ 47 5.6.3 Plausibility for Results of Phosphorus Compounds _______________________ 50 5.6.4 Practical Experience _______________________________________________ 52
6 ANALYTICAL METHOD VALIDATION______________________________ 53
6.1 Objective of Validating Methods _______________________________________ 53
6.2 Method Validation in the LAR Laboratory in Tra Noc_____________________ 53
6.3 Comparison with the Ion Selective Electrode (ISE) ________________________ 54 6.3.1 Objective________________________________________________________ 54 6.3.2 Layout and operation mode of an ion selective electrode __________________ 54 6.3.3 Calibration Curve and Evaluation of Concentration_______________________ 55 6.3.4 Preparation and Measurement with the NH4
+-ISE ________________________ 56 6.3.5 Results for NH4
+-ISE Measurement ___________________________________ 57 6.3.6 Discussion of the NH4
+-ISE Results___________________________________ 59 6.3.7 Preparation and Measurement with the NO3
--ISE ________________________ 60 6.3.8 Results for NO3
--ISE Measurement ___________________________________ 61 6.3.9 Discussion of NO3
--ISE Results ______________________________________ 62
6.4 Comparison of filtered and unfiltered samples____________________________ 62 6.4.1 Ammonium Results of filtered and unfiltered Samples ____________________ 64 6.4.2 Discussion Ammonium Results of filtered and unfiltered Samples___________ 65 6.4.3 Nitrate Results of filtered and unfiltered Samples ________________________ 66 6.4.4 Discussion Nitrate Results of filtered and unfiltered Samples _______________ 66 5.4.5 Nitrite Results of filtered and unfiltered Samples ________________________ 67 6.4.6 Discussion Nitrite Results of filtered and unfiltered Samples _______________ 68 6.4.7 Total Nitrogen Results of filtered and unfiltered Samples __________________ 69 6.4.8 Discussion Total Nitrogen Results of filtered and unfiltered Samples_________ 70 6.4.9 Orthophosphate Results of filtered and unfiltered Samples _________________ 71 6.4.10 Discussion Orthophosphate Results of filtered and unfiltered Samples_______ 71 6.4.11 Total Phosphorus Results of filtered and unfiltered Samples_______________ 72 6.4.12 Discussion Total Phosphorus Results of filtered and unfiltered Samples _____ 72

IV
6.5. Evaluation of Methods to Preserve Analytes in Samples ___________________ 73 6.5.1 Ammonium Results for Preservation Methods___________________________ 75 6.5.2 Discussion of Preservation Results for Ammonium_______________________ 75 6.5.3 Nitrate Results for Preservation Methods_______________________________ 76 6.5.4 Discussion of Preservation Results for Nitrate___________________________ 76 6.5.5 Nitrite Results for Preservation Methods _______________________________ 77 6.5.6 Discussion of Preservation Results for Nitrite ___________________________ 77 6.5.7 Total Nitrogen Results for Preservation Methods ________________________ 78 6.5.8 Phosphorus Results for Preservation Methods ___________________________ 78
7 CONCLUSION _________________________________________________ 80
APPENDIX (see CD-ROM)_________________________________________ 88

V
List of abbreviations
abs. absolute
ATU Allylthiourea
BMBF Bundesministerium für Bildung and Forschung (engl.: Federal Ministry of
Education and Research)
BOD Biochemical Oxygen Demand
CEPIZA Can Tho Export Processing and Industrial Zones Authority
COD Chemical Oxygen Demand
DO Dissolved Oxygen
DONRE Department of Natural Resources and Environment
Fig. Figure
ICP Inductively Coupled Plasma
IEEM Institute of Environmental Engineering and Management (University of
Witten, Germany)
ISE Ion Selective Electrode
IZ Industrial Zone
LAR LAR Process Analysers AG, Berlin, Germany
NTRIW National Technical Regulation on Industrial Wastewater
PE Population Equivalent
PM Photometric Method
rel. relative
TN Total Nitrogen
TOC Total Organic Carbon
TP Total Phosphorus
WWTP Waste Water Treatment Plant
VI
List of Figures
Fig. 1 Location of Tra Noc in the Mekong Delta Region (Lampstand Press, 2012; Google Maps, 2012) .................................... 3
Fig. 2. Layout of Waste Water Drainage System for Industrial Zone 1 and 2 of Tra Noc (IEEM, 2011)............................... 4
Fig. 3. Technical Drawing of Drainage System of Tra Noc 2 and magnified Node 5 (IEEM, 2011) ........................................ 8
Fig. 4. Oxygen Saturation at Total Pressure of 1013 bar in Water Vapour Saturated Atmosphere .................................................. 11
Fig. 5. Ligated Nitrogen in Waste Water......................................................... 12
Fig. 6. Monochloramine reacts with Thymol to N-chloro-2-isopropyl-5-methylchinon-monoimine ............................. 21
Fig. 7. N-chloro-2-isopropyl-5-methylchinon- monoimine reacts to Indephenol ......................................................... 22
Fig. 8. Calibration Curve for Ammonium, 19.12.2012 ................................... 23
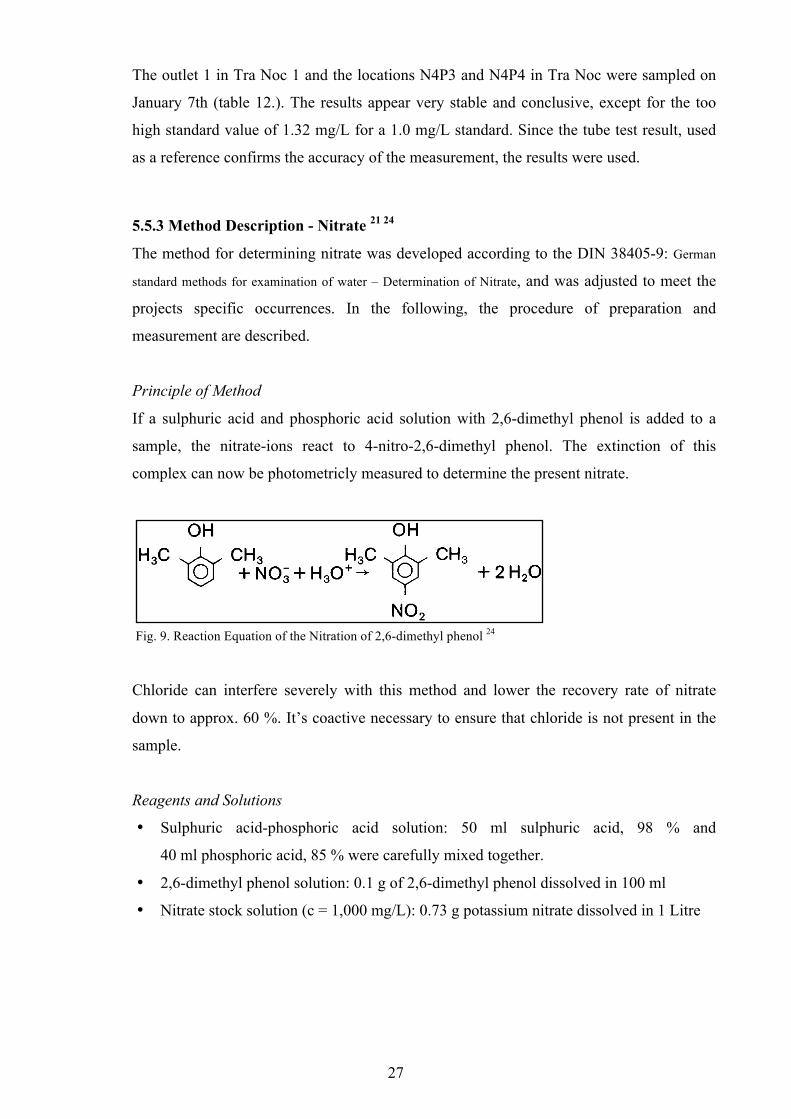
Fig. 9. Reaction Equation of the Nitration of 2,6-dimethyl phenol................. 27
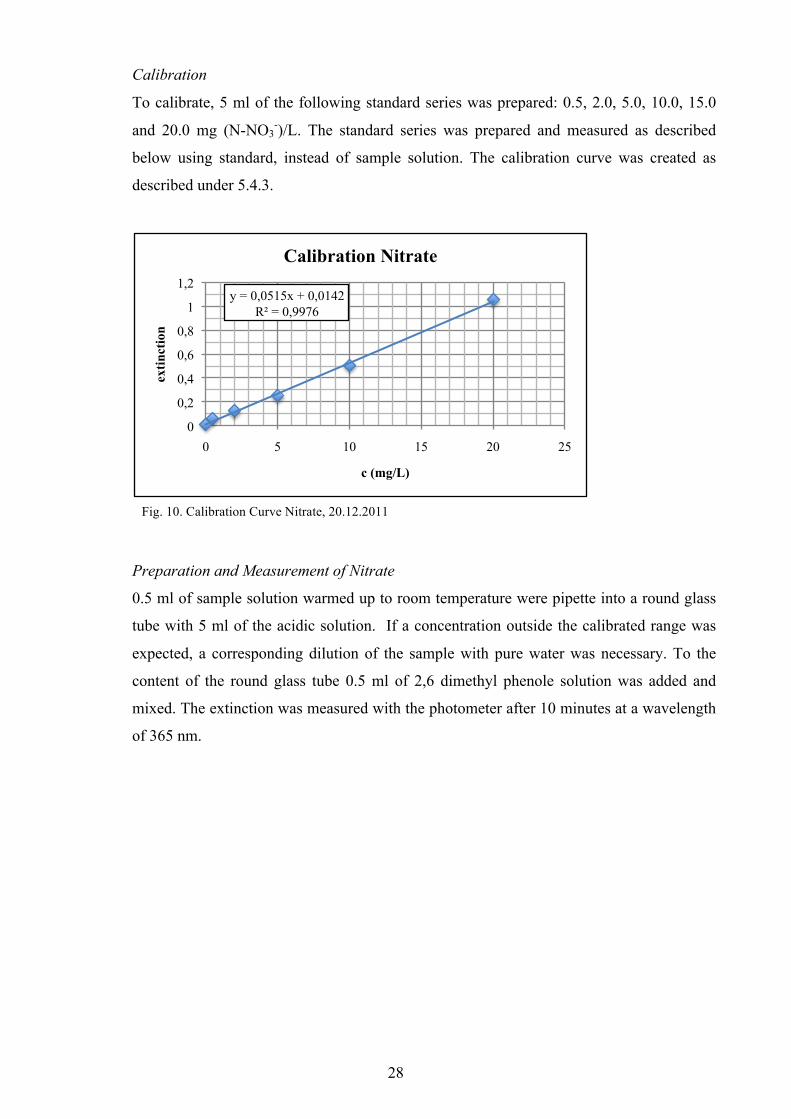
Fig. 10. Calibration Curve Nitrate, 20.12.2011 ................................................. 28
Fig. 11. Calibration Curve Nitrite, 02.11.2011.................................................. 32
Fig. 12. Calibration Curve Orthophosphate, 13.11.2012................................... 38
Fig. 13. Schematic Layout of an ISE................................................................. 55
Fig. 14. Calibration Curve for NH4+ - ISE, 08.02.2012 .................................... 56
Fig. 15. Calibration Curve for NO3- - ISE ......................................................... 60

VII
List of Tables
Table 1. Estimation of Waste Water Load for Tra Noc IZ ................................... 4
Table 2. Limit Values for indirect Discharge into Sewerage Systems in Vietnam (proposed by GIZ) ................................................. 6
Table 3. Limit Value for direct Discharge of Waste Water in Germany .............. 6
Table 4. Meaning of Ration BOD5 and COD....................................................... 11
Table 5. Dependency of the Nitrification Process on pH ..................................... 15
Table 6. List of Chemicals .................................................................................... 17
Table 7. List of Materials...................................................................................... 18
Table 8. List of Devices and Software.................................................................. 18
Table 9. Ammonium Results, Locations N7P2, N8P3 and Outlet N6OL1, N4OL7 and N4OL6 in Tra Noc 1............................................. 24
Table 10. Ammonium Results, Locations N1P1, N2P1 and N2P2 in Tra Noc 1 ............................................................................................ 25
Table 11. Ammonium Results, Locations N3P3, N8P1 and N8P2 in Tra Noc 1; Location N5P1 in Tra Noc 2 ................................................ 25
Table 12. Ammonium Results; Outlet N7OL1 in Tra Noc 1; Location N4P3 and N4P4 in Tra Noc 2 .................................................. 26
Table 13. Nitrate Results, Locations N7P2, N8P3 and Outlet N6OL1, N4OL7 and N4OL6 in Tra Noc 1 ........................................................... 29
Table 14. Nitrate Results, Locations N1P1, N2P1 and N2P2 in Tra Noc 1 ........... 30
Table 15. Nitrate Results, Locations N3P3, N8P1 and N8P2 in Tra Noc 1; Location N5P1 in Tra Noc 2 ....................................................... 30
Table 16. Nitrate Results; Outlet N7OL1 in Tra Noc 1; Locations N4P3 and N4P4 in Tra Noc 2 ................................................................. 31
Table 17. Nitrite Results; Monitoring February 2012 ............................................ 33
Table 18. Total Nitrogen Results, Locations N7P2, N8P3 and Outlet N6OL1, N4OL7 and N4OL6 in Tra Noc 1............................................. 34
Table 19. Total Nitrogen Results, Locations N1P1, N2P1 and N2P2 in Tra Noc 1 ............................................................................................ 35
Table 20. Total Nitrogen Results, Locations N3P3, N8P1 and N8P2 in Tra Noc 1; Location N5P1 in Tra Noc 2 ............................................ 36
Table 21. Total Nitrogen Results; Outlet N7OL1 in Tra Noc 1; Locations N4P3 and N4P4 in Tra Noc 2 ................................................ 36
Table 22. Orthophosphate Results, Locations N7P2, N8P3 and outlet N6OL1, N4OL7 and N4OL6 in Tra Noc 1................................... 39
Table 23. Orthophosphate Results, Locations N1P1, N2P1 and N2P2 in Tra Noc 1 .................................................................................. 40
VIII
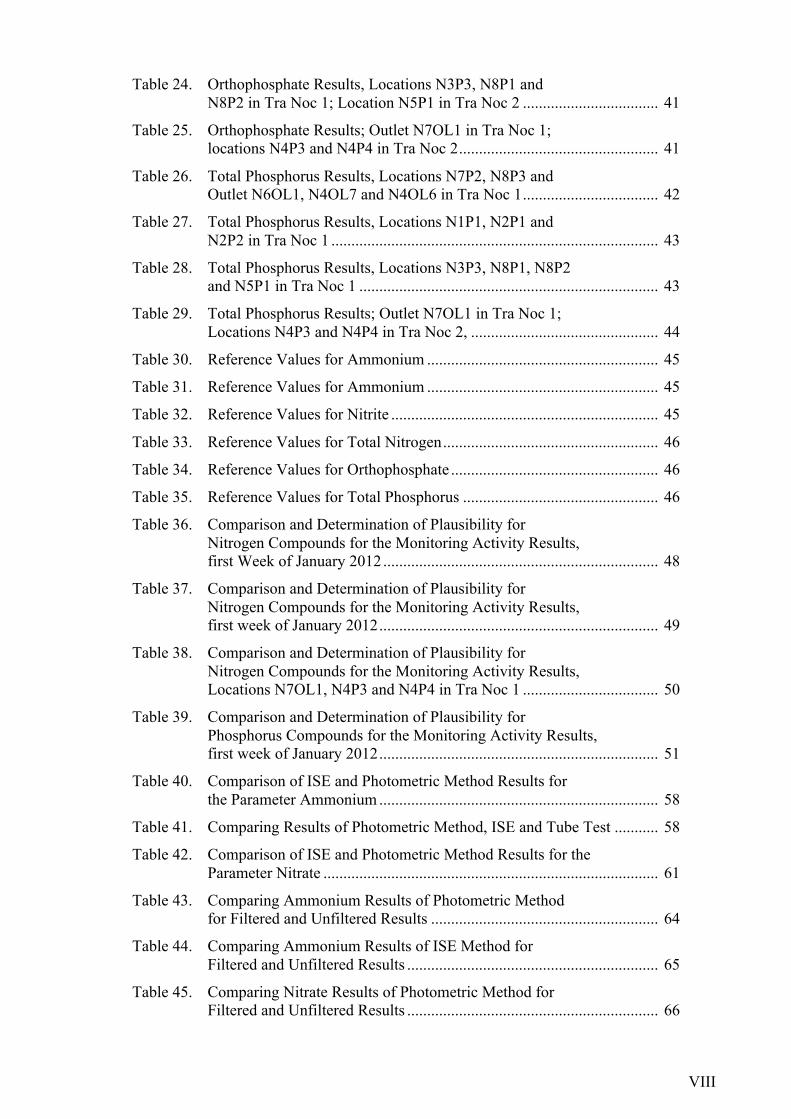
Table 24. Orthophosphate Results, Locations N3P3, N8P1 and N8P2 in Tra Noc 1; Location N5P1 in Tra Noc 2 .................................. 41
Table 25. Orthophosphate Results; Outlet N7OL1 in Tra Noc 1; locations N4P3 and N4P4 in Tra Noc 2.................................................. 41
Table 26. Total Phosphorus Results, Locations N7P2, N8P3 and Outlet N6OL1, N4OL7 and N4OL6 in Tra Noc 1.................................. 42
Table 27. Total Phosphorus Results, Locations N1P1, N2P1 and N2P2 in Tra Noc 1 .................................................................................. 43
Table 28. Total Phosphorus Results, Locations N3P3, N8P1, N8P2 and N5P1 in Tra Noc 1 ........................................................................... 43
Table 29. Total Phosphorus Results; Outlet N7OL1 in Tra Noc 1; Locations N4P3 and N4P4 in Tra Noc 2, ............................................... 44
Table 30. Reference Values for Ammonium .......................................................... 45
Table 31. Reference Values for Ammonium .......................................................... 45
Table 32. Reference Values for Nitrite ................................................................... 45
Table 33. Reference Values for Total Nitrogen...................................................... 46
Table 34. Reference Values for Orthophosphate .................................................... 46
Table 35. Reference Values for Total Phosphorus ................................................. 46
Table 36. Comparison and Determination of Plausibility for Nitrogen Compounds for the Monitoring Activity Results, first Week of January 2012..................................................................... 48
Table 37. Comparison and Determination of Plausibility for Nitrogen Compounds for the Monitoring Activity Results, first week of January 2012...................................................................... 49
Table 38. Comparison and Determination of Plausibility for Nitrogen Compounds for the Monitoring Activity Results, Locations N7OL1, N4P3 and N4P4 in Tra Noc 1 .................................. 50
Table 39. Comparison and Determination of Plausibility for Phosphorus Compounds for the Monitoring Activity Results, first week of January 2012...................................................................... 51
Table 40. Comparison of ISE and Photometric Method Results for the Parameter Ammonium ...................................................................... 58
Table 41. Comparing Results of Photometric Method, ISE and Tube Test ........... 58
Table 42. Comparison of ISE and Photometric Method Results for the Parameter Nitrate .................................................................................... 61
Table 43. Comparing Ammonium Results of Photometric Method for Filtered and Unfiltered Results ......................................................... 64
Table 44. Comparing Ammonium Results of ISE Method for Filtered and Unfiltered Results ............................................................... 65
Table 45. Comparing Nitrate Results of Photometric Method for Filtered and Unfiltered Results ............................................................... 66

IX
Table 46. Comparing Nitrite Results of Photometric Method for Filtered and Unfiltered Results ............................................................... 67
Table 47. Comparing Total Nitrogen Results of Photometric Method for Filtered and Unfiltered Results ......................................................... 69
Table 48. Comparing Orthophosphate Results of Photometric Method for Filtered and Unfiltered Results ......................................................... 71
Table 49. Comparing Total Phosphorus Results of Photometric Method for Filtered and Unfiltered Results ......................................................... 72
Table 50. Comparison of Ammonium Results for Preservation Methods.............. 75
Table 51. Comparison of Nitrate Results for Preservation Methods ...................... 76
Table 52. Comparison of Nitrite Results for Preservation Methods....................... 77
Table 53. Comparison of Orthophosphate Results for Preservation Methods........ 78
1
1 Introduction
The AKIZ project is divided into six subprojects. The task of subproject 5 is the
development and implementation of a monitoring concept for industrial waste water which
is adapted to the specific local conditions, such as ecological and legal requirements, in
Vietnam. It also has the ability to be expanded to other threshold and developing countries
with similar framework. For the analysis of the waste water a containerized state of the art
laboratory has been developed in Germany and adapted to the local conditions. At the end
of 2010, it was then shipped and installed in the Industrial Zone (IZ) of Tra Noc. During
the last year the relevant sampling locations and parameters were identified and analytical
methods, such as photometric methods and COD, toxicity and inductively coupled plasma
(ICP) measurement methods have been developed and evaluated.
1.1 Assignment
To dimension a Waste Water Treatment System based on European or North American
Standards would most likely not lead to acceptable results as the water usage and waste
water compounds can not be compared. Climate conditions, in this case particularly the
temperature, are additionally influencing the waste water treatment. On these grounds, a
reliable database filled with the analysed results of the compounds of the waste water, is
indispensable for the technical and economical planning of sustainable treatment systems.
The containerized laboratory in Tra Noc has the responsibility to build such a database
which can be seen as the heart of the monitoring concept. It is the objective of this work to
evaluate the results of the monitoring activities 2012 and to validate the photometric
methods used to analyze ammonium, nitrate, nitrite, total nitrogen, orthophosphate and
total phosphorus in order to confirm the accuracy and measurement trueness of the
monitoring results. It also aims to determine whether or not method modifications might be
necessary and if samples can be preserved for some time to have a larger time frame to put
the laboratory capacity most efficiently to work. Three different experiments were set up
for this reason:
Experiment 1
Currently the parameters are measured with samples that have been prepared by filtering
them with a membrane filter. Samples were measured for all parameters with filtered, as
well as unfiltered samples, to verify that the filtering doesn’t result in any loss of the
analytes.
2
Experiment 2
Ammonium and nitrate were measured with two different methods; the current
photometric method and with an ion selective electrode (ISE). The aim here was to have a
means of confirming the current results and to maybe even have a second, more time and
fund efficient method for the measurement of those two parameters.
Experiment 3
The third experiment is about keeping the analyte concentration in the samples over a
longer period of time constant in the sample and to find out if it is possible to preserve the
sample. The preservation was done by acidifying one part of the sample and to freeze
another part. The samples were then repeatedly measured over the course of two weeks
and were compared with the current methods results.
1.2 Structure of this Work
This work at hand is divided into 4 parts. After the introduction the frame work is laid out,
giving information on Tra Noc, the current Waste Water Treatment Situation as well as
Environmental Guidelines. This is meant to get an understanding about the context of this
study. The second part is about the monitoring activities which have taken place in Tra
Noc beginning of the year 2012. The objective and planning criteria including the analysed
parameter are described and the results are presented. The plausibility and accuracy of
those results were then determined and discussed.
The following section engages in the improvement of the workflow in the laboratory and
the validation of the current sample preparation. It would support the workflow and the
efficient use of the limited personnel and monetary capacity of the laboratory if alternative
methods such as an ion sensitive electrode would proof to be as accurate as the current
method or, if the samples could be preserved without any loss of the analyte. Those options
were revised and then validated. As part of validating the current methods the sample
preparation was surveyed to ensure that the filtering of the sample doesn’t result in loss of
the analyte.
The last part summarises everything that was presented and concluded in the other sections
as well as gives recommendations and an outlook on future opportunities to ensure the
quality standard of the analysis in the laboratory.

3
2 Framework
2.1 Geography and Climate 1
The city of Can Tho is located in the Mekong
Delta Region (South Vietnam), south of one of
the arms of the Mekong River called Hau
Giang and about 150 km south-west of Ho Chi
Minh City. With an area of approx. 1,400 km2
and about 1.2 million habitants (2004) Can
Tho is one of the five biggest cities in Vietnam
and the biggest of the Mekong Delta.
The Industrial Zone of Tra Noc is located about 12 km north of Can Tho bordering the Hau
Giang at the north-east. In the west it is bordered by the Cai Chom channel and in the south
by the National Route No. 91 which connects Can Tho with the south-western provinces of
Hau Giang. The total area of the Industrial Zones amount to about 300 ha and is divided by
the Sang Trang channel into Industrial Zone 1 and 2.
As part of South-East Asia, the Mekong Delta Region is part of an Earth Zone with a
tropical climate and with two separate seasons. The monsoon season lasts from May to
November and the dry season from December to April. The average temperature is about
27 0C with approx. 2,300 – 2,400 hours of sunshine per year and an average humidity of
about 83 %.
2.2 Tra Noc und its Industries 2 3
The Industrial Zone of Tra Noc founded in 1998 is divided into two Industrial Parks. Tra
Noc 1 covers an area of about 135 ha with 131 industries. Tra Noc 2 covers about 165 ha
with 33 enterprises.
Those enterprises operate mainly in the field of seafood and food processing (e.g. fish,
shrimp, rice or fruit), beverages (e.g. Saigon Bia or Pepsi Co.), garments, chemicals (e.g.
pharmaceuticals) and fertilizer production.
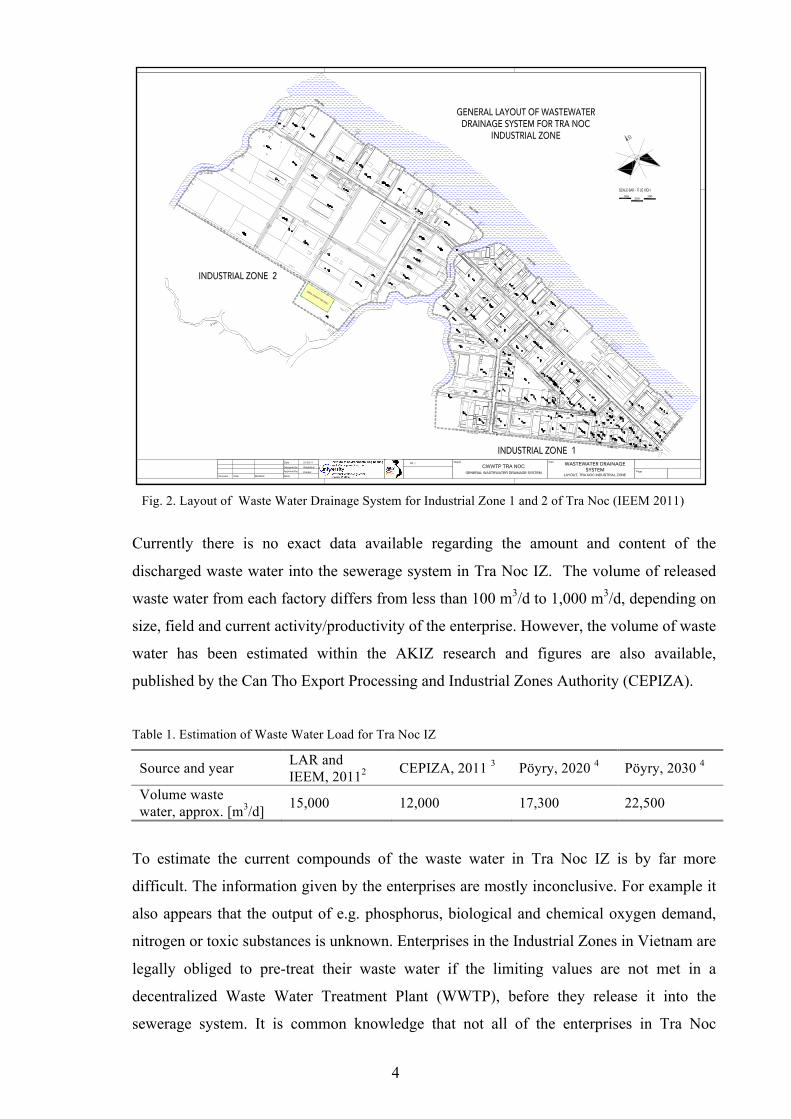
Fig. 1. Location of Tra Noc in the Mekong Delta Region
4
Fig. 2. Layout of Waste Water Drainage System for Industrial Zone 1 and 2 of Tra Noc (IEEM 2011)
Currently there is no exact data available regarding the amount and content of the
discharged waste water into the sewerage system in Tra Noc IZ. The volume of released
waste water from each factory differs from less than 100 m3/d to 1,000 m3/d, depending on
size, field and current activity/productivity of the enterprise. However, the volume of waste
water has been estimated within the AKIZ research and figures are also available,
published by the Can Tho Export Processing and Industrial Zones Authority (CEPIZA).
Table 1. Estimation of Waste Water Load for Tra Noc IZ
Source and year LAR and IEEM, 20112 CEPIZA, 2011 3 Pöyry, 2020 4 Pöyry, 2030 4
Volume waste water, approx. [m3/d] 15,000 12,000 17,300 22,500
To estimate the current compounds of the waste water in Tra Noc IZ is by far more
difficult. The information given by the enterprises are mostly inconclusive. For example it
also appears that the output of e.g. phosphorus, biological and chemical oxygen demand,
nitrogen or toxic substances is unknown. Enterprises in the Industrial Zones in Vietnam are
legally obliged to pre-treat their waste water if the limiting values are not met in a
decentralized Waste Water Treatment Plant (WWTP), before they release it into the
sewerage system. It is common knowledge that not all of the enterprises in Tra Noc
5
operate such a pre-treatment plant and that many of the existing plants are not functioning
properly.
A grab sample measurement was made by AKIZ and the Department of Natural Resources
and Environment (DONRE) where waste water of a fish processing company was
measured before and after the treatment. The results showed an increase in concentration
of ammonium and orthophosphate after the treatment. The nitrite and nitrate levels
remained stable. Even though it is not a representative measurement it does support the
supposition of the currently poor treatment situation.
2.3 Environmental Guidelines and Limiting Values 5 6
Especially in Developing Countries the necessity of sustainable development in the field of
waste water treatment und the protection of water quality of the receiving water facilities is
of great importance. Referring to the Industrial Zones of Vietnam the sewerage systems
and the pre-treatment plants are either in very poor condition or do not even exist. The
highly polluted industrial waste water is released with very little or no treatment into the
nearest body of water or coastal water area. In the case of Tra Noc, the waste water is
released into the Hau Giang river or one of it’s smaller anabranches.
Legally every Industrial Zone is bound to operate a centralized WWTP and to meet the
National Technical Regulation on Industrial Wastewater (NTRIW). The allowed maximum
concentration for each pollutant to be released, depends on the volume and the type of the
receiving facility as well as the load of waste water. It is calculated as follows 5:
(1) cmax = c * Kq * Kf
cmax maximum concentration allowed to be released
c concentration as found in table 1, NTRIW
Kq coefficient, depending on volume of receiving water facility distinct by type
(between 0.6 and 1.3), table 2 and 3, NTRIW
Kf coefficient, depending on volume of discharged waste waster (between 0.9
and 1.2), table 4, NTRIW
The German Gesellschaft für Internationale Zusammenarbeit (GIZ) has proposed the
following effluent standards for indirect discharge into the public drainage or sewerage
systems in Vietnam.
6
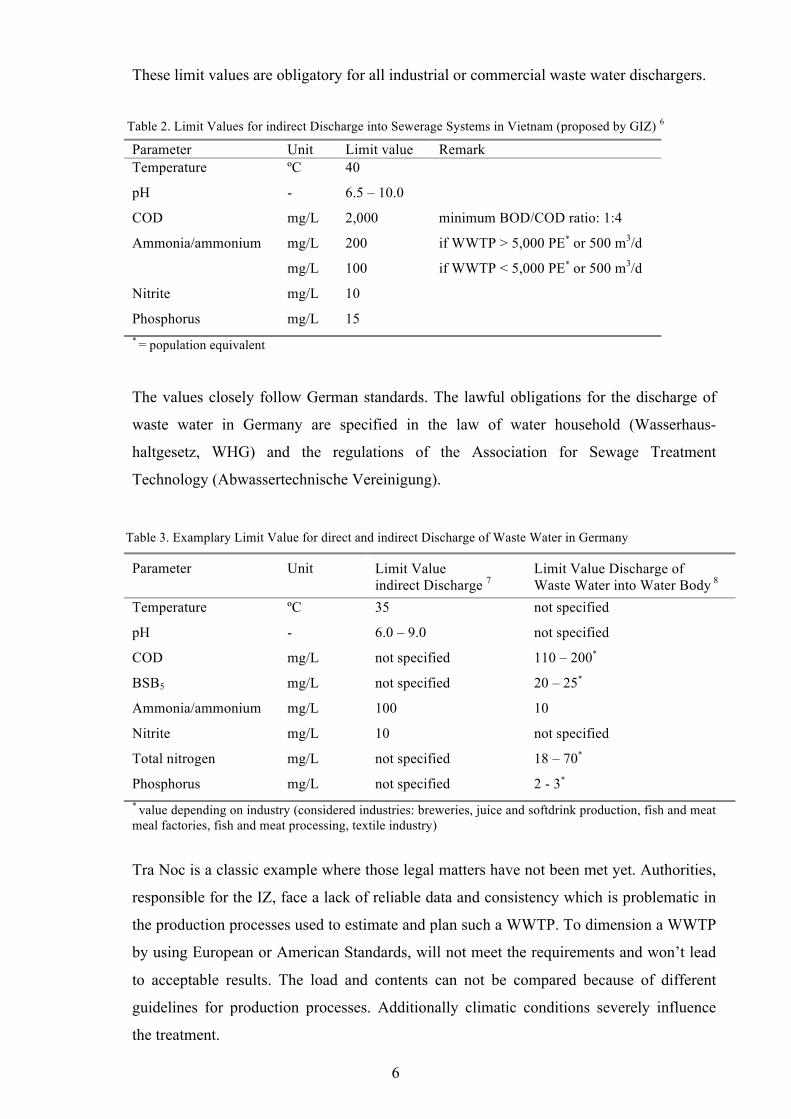
Table 2. Limit Values for indirect Discharge into Sewerage Systems in Vietnam (proposed by GIZ) 6
Table 3. Examplary Limit Value for direct and indirect Discharge of Waste Water in Germany
These limit values are obligatory for all industrial or commercial waste water dischargers.
Parameter Unit Limit value Remark Temperature ºC 40
pH - 6.5 – 10.0
COD mg/L 2,000 minimum BOD/COD ratio: 1:4
Ammonia/ammonium mg/L
mg/L
200
100
if WWTP > 5,000 PE* or 500 m3/d
if WWTP < 5,000 PE* or 500 m3/d
Nitrite mg/L 10
Phosphorus mg/L 15 * = population equivalent
The values closely follow German standards. The lawful obligations for the discharge of
waste water in Germany are specified in the law of water household (Wasserhaus-
haltgesetz, WHG) and the regulations of the Association for Sewage Treatment
Technology (Abwassertechnische Vereinigung).
Parameter Unit Limit Value indirect Discharge 7
Limit Value Discharge of Waste Water into Water Body 8
Temperature ºC 35 not specified
pH - 6.0 – 9.0 not specified
COD
BSB5
mg/L
mg/L
not specified
not specified
110 – 200*
20 – 25*
Ammonia/ammonium mg/L 100 10
Nitrite mg/L 10 not specified
Total nitrogen mg/L not specified 18 – 70*
Phosphorus mg/L not specified 2 - 3* * value depending on industry (considered industries: breweries, juice and softdrink production, fish and meat meal factories, fish and meat processing, textile industry)
Tra Noc is a classic example where those legal matters have not been met yet. Authorities,
responsible for the IZ, face a lack of reliable data and consistency which is problematic in
the production processes used to estimate and plan such a WWTP. To dimension a WWTP
by using European or American Standards, will not meet the requirements and won’t lead
to acceptable results. The load and contents can not be compared because of different
guidelines for production processes. Additionally climatic conditions severely influence
the treatment.

7
3 Implementation of the Monitoring Concept
3.1 Objective of the Monitoring Concept
It can no longer be ignored that water resources are limited and need to be protected. The
need for Environmental Data Management is obvious, especially in Developing Countries
where the population and technologies are continuously growing, the requirements are
subject to constant changes.
The many complex substances that are discharged through industrial waste water have a
direct impact on the sewerage system, the treatment process, facilities and outflow. If the
content and load of waste water in a WWTP is neglected it can’t be expected that the
effluent quality meets the legal value limits. Surveying and monitoring waste water is
therefore necessary for an effective treatment process and hence for the sake of the public
health and the environmental protection.
In the case of the IZ of Tra Noc the centralized WWTP and the new, closed sewerage
system has not yet been built, but modelled by Vietnamese local authorities. The collected
data during the initial concept development is also used to confirm or negate the estimated
dimension of the planned centralized WWTP.
3.2 Planning Criteria
3.2.1 Timeline The containerized laboratory of LAR Process Analysers AG has arrived at the end of 2010
in Tra Noc 1 at the premises of the water plant responsible for the water supply of Can
Tho. Once the container and equipment was set up, the development of methods and the
verification of results then took place in the first half of the year 2011. During this time
sporadic collecting of data of various sampling points was done.
At the end of October 2011, the first interval of monitoring, two fixed nodes in Tra Noc 1
was carried out. From January to end of February 2012 the second interval of monitoring
was accomplished. This data was evaluated and is now presented and discussed in this
work.
The monitoring work in Tra Noc is ongoing, presumably until 2014.
8
3.2.2 Locations
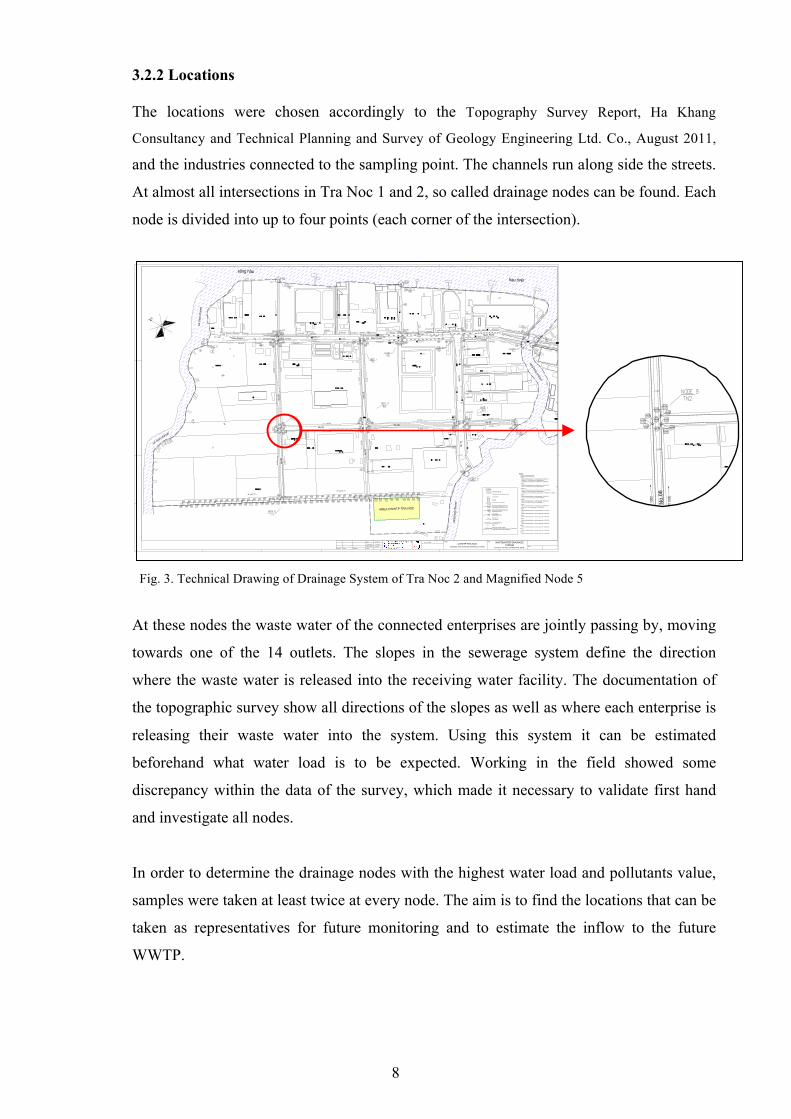
The locations were chosen accordingly to the Topography Survey Report, Ha Khang
Consultancy and Technical Planning and Survey of Geology Engineering Ltd. Co., August 2011,
and the industries connected to the sampling point. The channels run along side the streets.
At almost all intersections in Tra Noc 1 and 2, so called drainage nodes can be found. Each
node is divided into up to four points (each corner of the intersection).
At these nodes the waste water of the connected enterprises are jointly passing by, moving
towards one of the 14 outlets. The slopes in the sewerage system define the direction
where the waste water is released into the receiving water facility. The documentation of
the topographic survey show all directions of the slopes as well as where each enterprise is
releasing their waste water into the system. Using this system it can be estimated
beforehand what water load is to be expected. Working in the field showed some
discrepancy within the data of the survey, which made it necessary to validate first hand
and investigate all nodes.
In order to determine the drainage nodes with the highest water load and pollutants value,
samples were taken at least twice at every node. The aim is to find the locations that can be
taken as representatives for future monitoring and to estimate the inflow to the future
WWTP.
Fig. 3. Technical Drawing of Drainage System of Tra Noc 2 and Magnified Node 5
9
4 Fundamentals
4.1 Sample Taking
To implement the Monitoring Concept, a suitable course of action for the sample taking
needed to be developed. Besides locations, a sample taking interval and the type of sample
taking needed to be ascertained. Furthermore, capacity, such as man power and costs, and
also very importantly the tidal influence of the Hau Giang river, were main factors that
needed to be taken into consideration.
The topographic data was used to decide at which times of day and where the samples
needed to be taken. It’s been important to rule out a dilution of the waste water in the
sewerage system from the inwards pushing water from the Hau Giang River. Therefore the
depth of a fixed point (Outlet 1 in Tra Noc 1) was always measured as well as the depth at
each sampling point. This data was used to evaluate the results considering a possible
dilution.
The priority for the monitoring done in the beginning of 2012, was to get information from
as many different nodes as possible. The strategy was to take samples at one or maybe two
locations with an expected high load of pollutants four times per sampling day. In addition,
two to three extra locations were chosen where samples were taken two times per sampling
day. At those locations lower results were to be expected. Since the development is an
ongoing process the sample taking strategy is continuously evaluated and adjusted.
4.2 Relevant Parameter to Evaluate Industrial Waste Water 6 9
Industrial waste water is defined as the water which was used for any producing or
processing operation and which is afterwards released directly into a body of water or
indirectly into a sewerage system by an enterprise.
The degree of the impurity of waste water is defined by the extent of different measureable
parameters. They represent pollutants and are referred to as the quality or characteristics of
waste water. Those characteristics are described by chemical, biological and physical
parameters and are chosen because of their validity on the impact on the Environment. The
extent of those parameters is used to design and operate pre-treatment plants, sewerage
systems and WWTP. The following is an introduction of the parameters used for
10
the development of the monitoring concept in Tra Noc and is not a complete list of
parameters that is or can be used to reveal the quality of industrial waste water.
The parameters are divided into physical and chemical parameters. The BOD is described
within the chemical parameters because of its close relation to the COD and because it is
determined by measuring oxygen concentration which is a chemical parameter. Within this
work no biological parameters were examined and are therefore left out.
4.2.1 Chemical Parameters
Biochemical Oxygen Demand 10 11
The biochemical oxygen demand (BOD) is the amount of oxygen needed by
microorganism for the aerobic decomposition of the organic substances in a water body.
Over a certain period, commonly 5 days (n = days, BODn) at 20 ºC the oxygen that is used
by a mirco-organism for the oxidation of organic substances is measured. The result is the
sum of all biologically degradable compounds in the water and it is not conclusive
regarding the composition of single bonds and is therefore called a sum parameter. The
BOD result does allow a prediction of the state of pollution of water. Unpolluted water has
a BOD5 of 5 mg/L or less.
It is common practice especially in the treatment of industrial waste water to only measure
the BOD of the decomposition of carbons. The oxygen demand of the biological oxidation
of ammonia, ammonium and nitrite into nitrate is not taken into account. The nitrification
where oxygen is used for the oxidation of ammonia to nitrite and then nitrate is suppressed
by adding allylthiourea (ATU) as an inhibitant.
Chemical Oxygen Demand 11
Similar to the BOD is the chemical oxygen demand (COD) a sum parameter to quantify
the amount of oxidable substances in water. The COD clearly specifies the amount of
oxygen that is needed to oxidize those substances as if oxygen were the oxidizing agent.
The biological degradable as well as the non degradable organic compounds and some
inorganic substances are determined. Therefore the COD is always higher than the BOD.
The ratio of BOD5 and COD gives information about the kind of compounds in the waste
water and about the ability of decomposition.
11
Table 4. Meaning of Ration BOD5 and COD 12
BOD5 ≙ 50 -100 % COD The substances are easily biodegrated
BOD5 ≙ 25 - 50 % COD Decomposition of substances is difficult
BOD5 ≙ 12 - 25 % COD Usually the ratio after the biological treatment
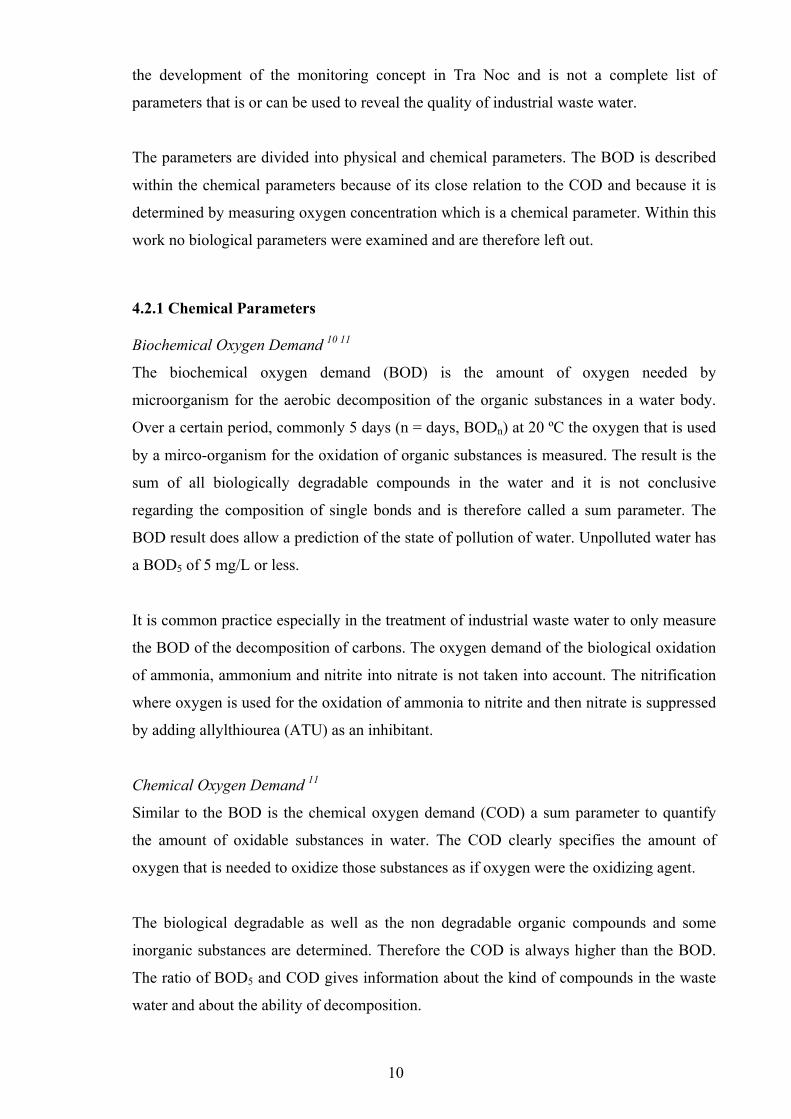
Dissolved Oxygen 13 14
The dissolved oxygen (DO) content is the concentration of dissolved oxygen in a liquid
and is limited by physical conditions such as temperature and partial pressure. There are
two main sources of dissolved oxygen in running or surface waters - the atmosphere and
aquatic, phototrophic organism (e.g. algae). The atmospheric oxygen is mixed into the
water through movement such as wind but mostly conditioned by Dalton’s Law of partial
pressures, where the sum of all partial pressures pi within ideal gases equals the total
pressure Ptotal of the mixture.
(2)
€
Ptotal = pii=1
n
∑
An equilibrium between the gas in the liquid and the gas in the atmosphere is set up. In
pure water the ratio of gases in the atmosphere is equal to the ratio of gases in the water.
The ability of oxygen to dissolve in water decreases with increasing temperature and the
increasing content of other dissolved substances such as salts and other dissolved gases.
0 2 4 6 8
10 12 14 16
0 3 6 9 12 15 18 21 24 27 30 33 36 39 42
Oxy
gen
satu
ratio
n va
lue
[mg/
L]
Water temperature [ºC]
Saturation
Fig. 4. Oxygen Saturation at Total Pressure of 1013 bar in Water Vapour Saturated Atmosphere 14
12
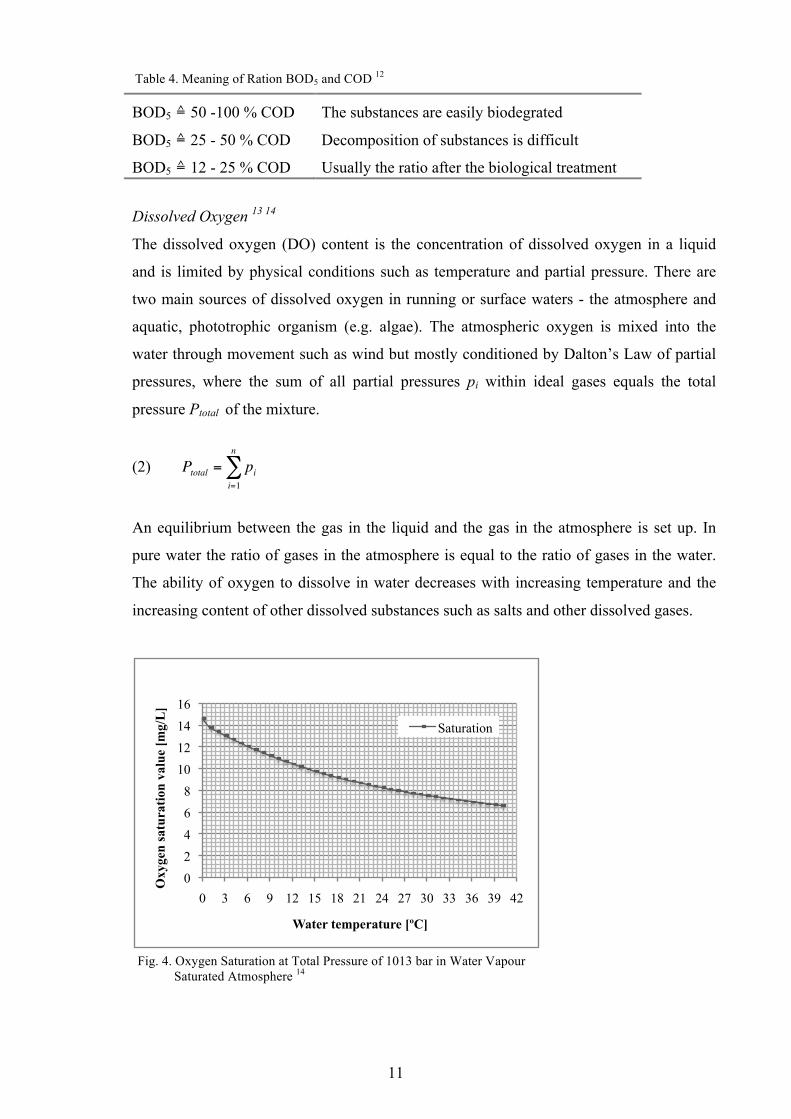
Fig. 5. Ligated Nitrogen in Waste Water
Since most aquatic organism need oxygen for respiration a fish-critical concentration of
about 3 mg O2/L has been defined.
The parameter of DO is a measured variable for the regulation of Waste Water Treatment.
Oxygen is essential for the aerobic metabolic activity of the nitrifying bacteria during
nitrification to oxidize ammonia to nitrate. For this part of the biological treatment, oxygen
is inserted into the aeration tank where an oxygen concentration of 3 mg/L is sufficient.
Nitrogen 15 16
Nitrogen is an essential nutrient and required by plants and animals for the building of
amino acids. If there is a surplus supply in a water body it will lead to severe
environmental problems such as eutrophication. A small amount of molecular nitrogen is
soluble in water but it is of no importance for the determination of pollution or for water
treatment. More important is total bounded nitrogen which is composed of all inorganic
and organic nitrogen bounds such as ammonia (NH3)/ammonium (NH4+), nitrate (NO3
-),
nitrite (NO2-) and organic bounded nitrogen (proteins, amino acids, urea, etc.).
Within the Waste Water Treatment the elimination of nitrogen is an essential element,
because of its high impact on the Environment. The elimination is done through the
microbiological process of nitrification and denitrification. Nitrification is the oxidation of
ammonium (nitrogen valency of -3) through nitrate to nitrite (nitrogen valency of +5).
Autotrophic organisms called nitrificants use the ammonium nitrogen as hydrogen-donator
and dissolved carbon dioxide as carbon source.
13
The following reaction equation is underlying the nitrification process:
NH4+ + 1,5 O2 NO2
- + 2 H+ + H2O + 230 kJ Nitritation
NO2- + 0,5 O2 NO3
- + 75 kJ Nitratation
NH4+ + 2 O2 NO3
- + 2 H+ + H2O + 305 kJ Nitrification
The denitrification is a reduction process and can be seen as the inversive process of the
nitrification. The significant difference is that the reduction process does not take place at
the stage of ammonium but at the stage of elemental nitrogen. This way, the unwanted
nutrient nitrogen in the treated waste water is eliminated by being released into the
atmosphere as a gas.
2 NO3- + H2O N2 + 2,5 O2
+ 2 OH- Denitrification
Under anoxic conditions, certain heterotrophic organisms such as pseudomonas and
microoccus are able to use the bonded oxygen of nitrate and/or nitrite for the
decomposition of organic compounds. In this case both compounds are taking over the role
of the molecular oxygen as hydrogen-donator.
Phosphorus 15 16
Phosphorus is an essential nutrient for the metabolic reaction in the cells of organism. The
element phosphorus can be found in the inorganic and organic ligated state. Substances
containing phosphorus can be dissolved, polymer chained and particulate. Most of the
phosphorus is inorganic and dissolved as orthophosphate (PO43-). Orthophosphates are the
salts of phosphoric acids (H3PO4) and can be divided into three groups:
Primary orthophosphate: NaH2PO4 (Sodium dihydrogen phosphate)
Secondary orthophosphate: Na2HPO4 (Disodium hydrogen phosphate)
Tertiary orthophosphate: Na3PO4 (Trisodium phosphate)
Orthophosphate is the only form available for living organisms but otherwise ligated
phosphorus can be transformed into orthophosphate. Therefore total phophorus is generally
measured in addition to orthophosphate. Digestion is necessary for measurement, where all
polymer phosphates and organic phosphates are converted into orthophosphates which can
be then again be measured with the same analytical method.

14
Total phosphorus is composed of all inorganic and organic phosphorus compounds and
provides an estimate of the amount of potentially available phosphorus
4.2.2 Physical Parameters
Temperature 17
As already shown, many parameters are influenced by temperature (cf. conductivity,
dissolved oxygen) and the temperature is needed for a correct evaluation and in order to
get comparable results when a reference temperature is used.
As for the treatment in WWTP temperature is an even more important factor since the
biological decomposition of the aerobic and anaerobic treatment depends highly on
temperature. If the temperature is very high, the construction material of the sewerage
system can be damaged.
Almost all found ammonia and nitrite oxidazing organism are mesophil and have their
optimum temperature sitting between 25 ºC und 30 ºC. The optimum temperature for
activated sludge in WWTP that can be found in literature, lies between about 25-35 ºC 16.
Nitrification will slow down at about 12 ºC and the bacteria growth will stop at below 8 ºC.
pH 18
pH is the measurement of the activity of hydrogen-ions (H+) in a liquid solution. It is an
important parameter for the efficiency of the treatment process in a WWTP, because the
biological as well as the chemical treatment are very sensitive to changes of the pH. The
pH is defined as the negative logarithm to the base 10 of the hydrogen-ion activity in
mol/L. It ranges in from 0 to 14 where pH 7 is the value for neutral water. At the value of
pH 7 the activity of hydrogen-ions cp equals 10-7.
The change of pH is not only governed by what is added to it but also by the buffer
capacity of the liquid. In Waste Water Treatment, the term acid capacity or alkalinity has
been established even though acid capacity is normally used for waters with little or no
buffering substances. It is defined as the specific amount of chloric acid (HCl) that can be
added to the waste water until the pH of 4.3 is reached (KS 4.3). Acid capacity indicates the
presence of alcalinic substances such as phosphate, ammonia, sulphide-ions, organic
substances, carbonates and bicarbonates.
15
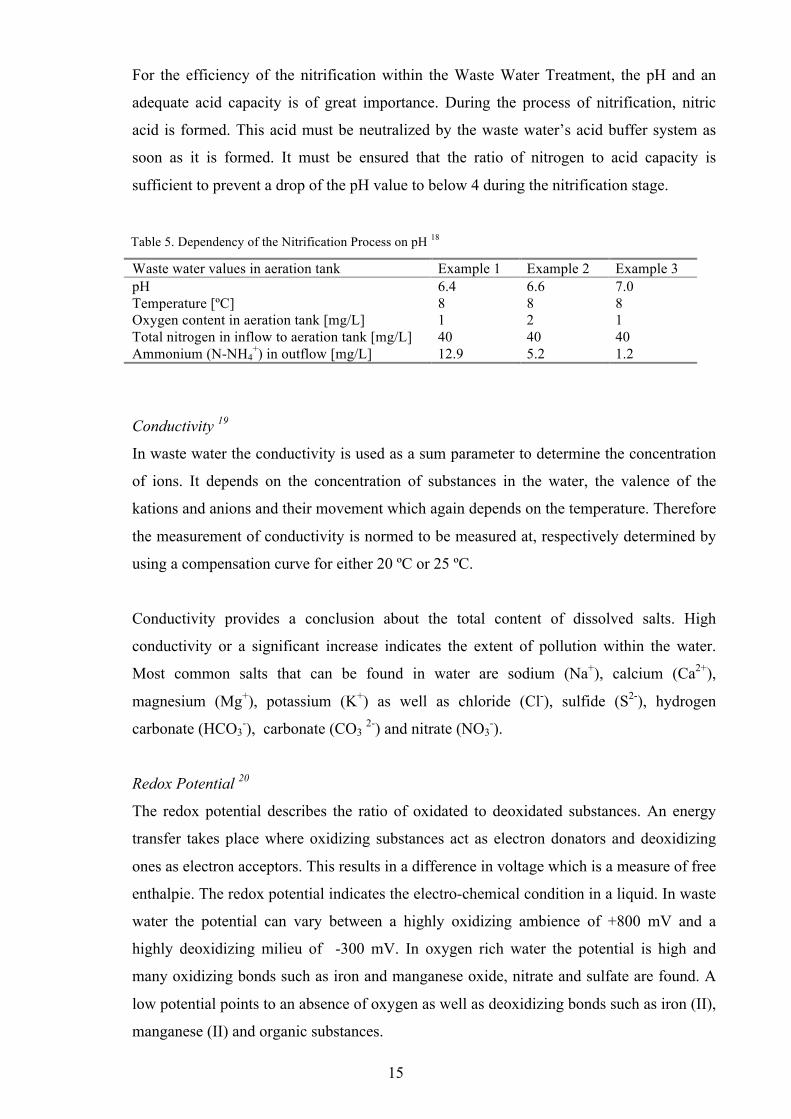
For the efficiency of the nitrification within the Waste Water Treatment, the pH and an
adequate acid capacity is of great importance. During the process of nitrification, nitric
acid is formed. This acid must be neutralized by the waste water’s acid buffer system as
soon as it is formed. It must be ensured that the ratio of nitrogen to acid capacity is
sufficient to prevent a drop of the pH value to below 4 during the nitrification stage.
Waste water values in aeration tank Example 1 Example 2 Example 3 pH 6.4 6.6 7.0 Temperature [ºC] 8 8 8 Oxygen content in aeration tank [mg/L] 1 2 1 Total nitrogen in inflow to aeration tank [mg/L] 40 40 40 Ammonium (N-NH4
+) in outflow [mg/L] 12.9 5.2 1.2
Conductivity 19
In waste water the conductivity is used as a sum parameter to determine the concentration
of ions. It depends on the concentration of substances in the water, the valence of the
kations and anions and their movement which again depends on the temperature. Therefore
the measurement of conductivity is normed to be measured at, respectively determined by
using a compensation curve for either 20 ºC or 25 ºC.
Conductivity provides a conclusion about the total content of dissolved salts. High
conductivity or a significant increase indicates the extent of pollution within the water.
Most common salts that can be found in water are sodium (Na+), calcium (Ca2+),
magnesium (Mg+), potassium (K+) as well as chloride (Cl-), sulfide (S2-), hydrogen
carbonate (HCO3-), carbonate (CO3 2-) and nitrate (NO3
-).
Redox Potential 20
The redox potential describes the ratio of oxidated to deoxidated substances. An energy
transfer takes place where oxidizing substances act as electron donators and deoxidizing
ones as electron acceptors. This results in a difference in voltage which is a measure of free
enthalpie. The redox potential indicates the electro-chemical condition in a liquid. In waste
water the potential can vary between a highly oxidizing ambience of +800 mV and a
highly deoxidizing milieu of -300 mV. In oxygen rich water the potential is high and
many oxidizing bonds such as iron and manganese oxide, nitrate and sulfate are found. A
low potential points to an absence of oxygen as well as deoxidizing bonds such as iron (II),
manganese (II) and organic substances.
Table 5. Dependency of the Nitrification Process on pH 18
16
Most substances that are found in the intake of WWTP’s are in their deoxidized form.
They will be oxidized through the aerobic decomposition which then leads to an
increase of the redox potential. After the aeriated phase of the biological treatment the
redox potential decreases because of incoming waste water and even more because of the
beginning denitrification. During the anaerobic phase of denitrification the oxidizing
substance nitrate is decomposed.
The measurement of redox potential is used to regulate the process of nitrification and can
as well be used for the regulation of phosphorus elimination.
5 Analytical Methods and Monitoring Results
This section details the principle of operation and clarifies the analytical methods.
After the general outline, the principle and procedure of each method is described.
Furthermore, within the parameter, the results of the monitoring activities of January and
February 2012 are presented.
The sampling took place between one and two times per week. Each sample contained 2 to
3 Litre of water in a plastic canister. Starting at 9.00 am with an interval of two hours, four
samples were taken at two to four different locations. The sample name is chosen
accordingly and contains the location and time. For example the sample TN1_N2P1_1100
is taken in Tra Noc 1 at node 2 point 1 at 11.00 am. For the experimental part other
information was added:
_F filtered
_uF unfiltered
_H2SO4 approx. 0.5 % sulphuric acid was added after sample taking
_fr sample was kept in a freezer after sample taking
Experience showed that owing to capacity insufficiency more than one time per week and
ten to twelve samples each time, were not manageable.
17
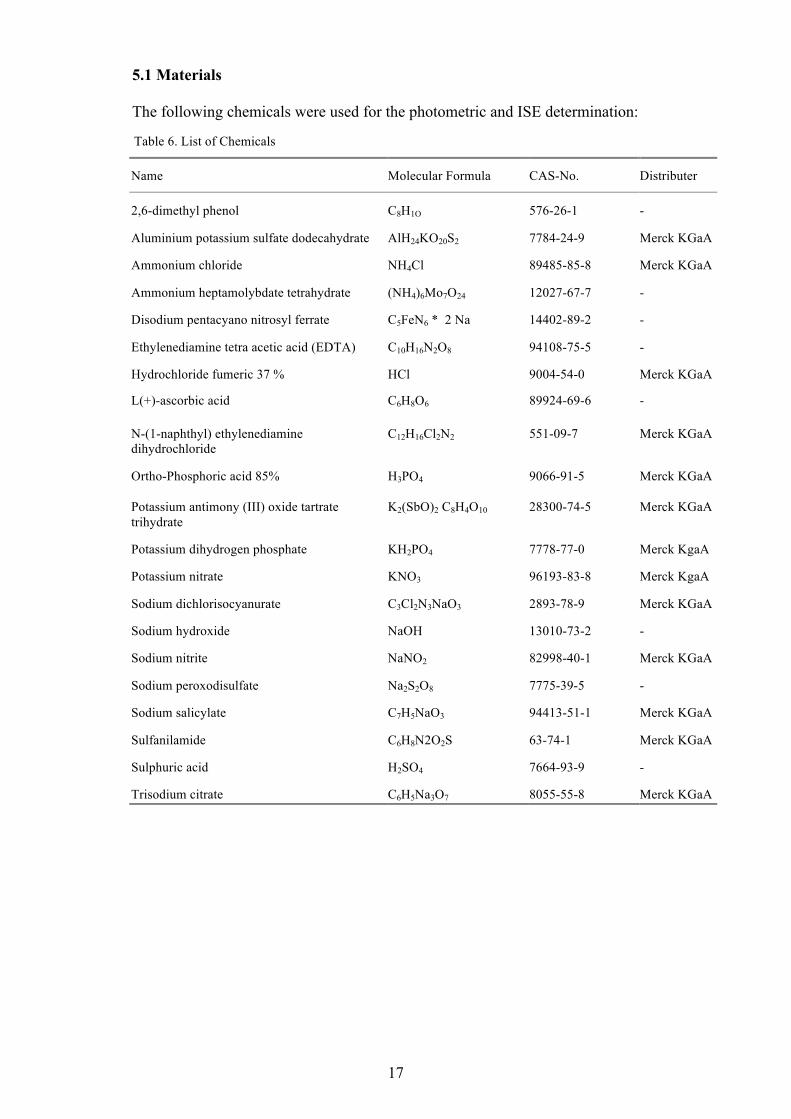
Table 6. List of Chemicals
5.1 Materials
The following chemicals were used for the photometric and ISE determination:
Name Molecular Formula CAS-No. Distributer
2,6-dimethyl phenol C8H1O 576-26-1 -
Aluminium potassium sulfate dodecahydrate AlH24KO20S2 7784-24-9 Merck KGaA
Ammonium chloride NH4Cl 89485-85-8 Merck KGaA
Ammonium heptamolybdate tetrahydrate (NH4)6Mo7O24 12027-67-7 -
Disodium pentacyano nitrosyl ferrate C5FeN6 * 2 Na 14402-89-2 -
Ethylenediamine tetra acetic acid (EDTA) C10H16N2O8 94108-75-5 -
Hydrochloride fumeric 37 % HCl 9004-54-0 Merck KGaA
L(+)-ascorbic acid C6H8O6 89924-69-6 -
N-(1-naphthyl) ethylenediamine dihydrochloride
C12H16Cl2N2 551-09-7 Merck KGaA
Ortho-Phosphoric acid 85% H3PO4 9066-91-5 Merck KGaA
Potassium antimony (III) oxide tartrate trihydrate
K2(SbO)2 C8H4O10 28300-74-5 Merck KGaA
Potassium dihydrogen phosphate KH2PO4 7778-77-0 Merck KgaA
Potassium nitrate KNO3 96193-83-8 Merck KgaA
Sodium dichlorisocyanurate C3Cl2N3NaO3 2893-78-9 Merck KGaA
Sodium hydroxide NaOH 13010-73-2 -
Sodium nitrite NaNO2 82998-40-1 Merck KGaA
Sodium peroxodisulfate Na2S2O8 7775-39-5 -
Sodium salicylate C7H5NaO3 94413-51-1 Merck KGaA
Sulfanilamide C6H8N2O2S 63-74-1 Merck KGaA
Sulphuric acid H2SO4 7664-93-9 -
Trisodium citrate C6H5Na3O7 8055-55-8 Merck KGaA
18
Table 7. List of Materials
Table 8. List of Devices and Software
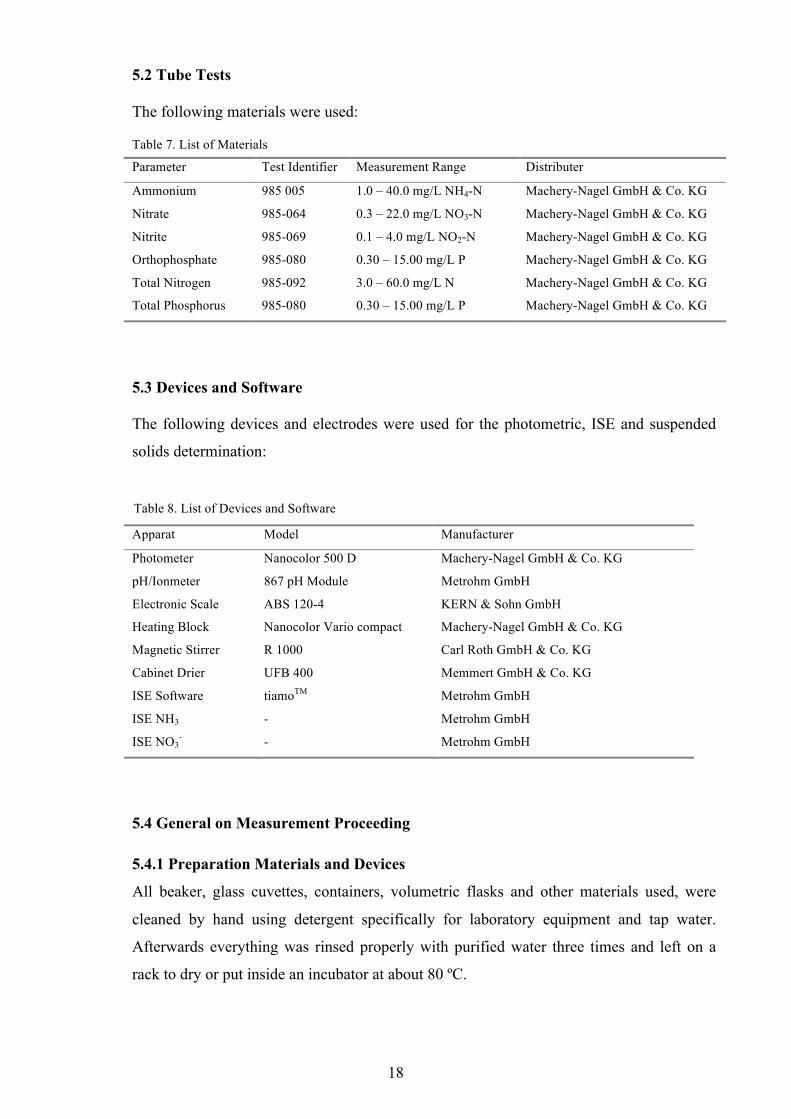
5.2 Tube Tests
The following materials were used:
Parameter Test Identifier Measurement Range Distributer
Ammonium 985 005 1.0 – 40.0 mg/L NH4-N Machery-Nagel GmbH & Co. KG
Nitrate 985-064 0.3 – 22.0 mg/L NO3-N Machery-Nagel GmbH & Co. KG
Nitrite 985-069 0.1 – 4.0 mg/L NO2-N Machery-Nagel GmbH & Co. KG
Orthophosphate 985-080 0.30 – 15.00 mg/L P Machery-Nagel GmbH & Co. KG
Total Nitrogen 985-092 3.0 – 60.0 mg/L N Machery-Nagel GmbH & Co. KG
Total Phosphorus 985-080 0.30 – 15.00 mg/L P Machery-Nagel GmbH & Co. KG
5.3 Devices and Software
The following devices and electrodes were used for the photometric, ISE and suspended
solids determination:
Apparat Model Manufacturer
Photometer Nanocolor 500 D Machery-Nagel GmbH & Co. KG
pH/Ionmeter 867 pH Module Metrohm GmbH
Electronic Scale ABS 120-4 KERN & Sohn GmbH
Heating Block Nanocolor Vario compact Machery-Nagel GmbH & Co. KG
Magnetic Stirrer R 1000 Carl Roth GmbH & Co. KG
Cabinet Drier UFB 400 Memmert GmbH & Co. KG
ISE Software tiamoTM Metrohm GmbH
ISE NH3 - Metrohm GmbH
ISE NO3- - Metrohm GmbH
5.4 General on Measurement Proceeding
5.4.1 Preparation Materials and Devices
All beaker, glass cuvettes, containers, volumetric flasks and other materials used, were
cleaned by hand using detergent specifically for laboratory equipment and tap water.
Afterwards everything was rinsed properly with purified water three times and left on a
rack to dry or put inside an incubator at about 80 ºC.

19
The pipettes and the electrodes for pH, DO, redox potential and conductivity were checked
on a regular bases and calibrated if necessary and possible. The photometer used for all
measurements was a single beam filter photometer with an silicone photo element. The
wavelength ranges from 340 to 860 nm and the samples were measured in round glass
tubes. The photometer is designed for round glass tubes of 16 mm optical depth. Before
each measurement series, a blank value was measured and automatically subtracted by the
photometer software.
All reagents, stock and standard solutions have been stored in a refrigerator at about
6-8 ºC. They were stored in glass bottles, and where necessary owing to light sensitivity in
brown bottles.
With every measurement series a blank solution (purified water) and a standard solution
was prepared and measured. The reagents and the standards respectively the stock
solutions were renewed when the measuring results weren’t plausible anymore (cf. 4.3).
For example if:
• the findings in the blank solution were too high
• within the recovery rate of the standard solution a deviation of more than 10 %
• the results between the nanocolor tube test (used as reference) and the measured result
significantly differed.
A new calibration was made every time the reagents and solutions were newly prepared.
5.4.2 Preparation of Sample, Reagents and Solutions
After sample taking, they were stored in a 2 L PE canister and brought back to the
laboratory. About 200 ml was then immediately filtered with a 45 µl membrane filter. The
filtered samples were filled into another PE or glass bottle and stored in a refrigerator at
about 6-8 ºC. The samples in the 2 L canister were brought to an external laboratory at the
University of Can Tho to measure BOD5. The reagents and stock solutions were all
prepared by filling the designated amount of the specific chemical into a volumetric flasks.
The flask was filled up to three-fourth and shaken carefully until the solids were dissolved.
The volumetric flask was then filled up to the calibration mark. If an acidic solution e.g.
sulphuric acid needed to be added, it was added last.
20
Most of the stock solutions had a concentration of 1,000 mg/L. The needed standard
solutions range between 0,01 and 20 mg/L. To prepare the standard solution series, the
stock solution was diluted in steps of the factor 10. 10 ml stock solution were pipetted into
a 100 ml volumetric flask and filled to the calibration mark.
5.4.3 Calibration
The obtained standard solution was used to prepare the standard solution series for the
calibration. The measurement of each standard solution is conducted the same way
samples were measured as described under chapter 5 for each method.
After the measurement the calibration curve was created. The measured value of the
solution was plotted on the y-axis and mass concentration in milligram per Litre was
plotted on the x-axis. The blank value was then calculated and equivalents the y-axis
intercept. The equation describing the regression curve as well as the coefficient of
determination (R2) were determined. Only calibration curves with a R2 > 0.995 were used.
5.4.4 Evaluation of Concentration
The calibration curve for the photometric methods show a linear behaviour in the
calibrated range. The equation received from the linear regression is in the form of:
(3)
The equation converts for the concentration c in mg/L, including the dilution factor to:
(4)
€
c =A − bm
⋅ d
A measured extinction
b y-axis intercept, extinction of calculated blank solution value
m accent of the calibration curve, in milligram per Litre (mg/L)
d dilution factor
!
A = m " c + b
21
!
loga NH4
+( )a NH3( )
= logK " pH
Fig. 6. Monochloramine reacts with Thymol to 2 N-chloro-2-isopropyl-5- methylchinon-monoimine 23
5.5 Method Principles and Presentation of Results
5.5.1 Method Description - Ammonium 21 22
The method for determining ammonium was developed according to the DIN 38406-5:
German standard methods for examination of water – Determination of Ammonium, and it was adjusted
to meet the projects specific occurrences. The proceeding of preparation and measurement
is described as follows:
Principle of Method
Ammonia reacts in water to ammonium ions:
NH3 + H2O NH4
+ + OH-
The equilibrium of this reaction is determined by the pH of the solution. In acidic solutions
ammonia almost completely reacts to ammonia-ions. At a pH value of 9.2 the ratio is 1:1.
The equilibrium can be calculated as follows:
(5)
The equilibrium constant K is also depending on the temperature, e.g. for the temperature
of 25 ºC, in Litreature can be found the value 4.78 for the negative log(K).
The ammonia-ions react at a pH of about 12.6 with hypochlorite-ions to monochloramine
NH3 + OCl- NH2Cl + OH-
In the next step the monochloramine reacts with thymol to 2 N-chloro-2-isopropyl-5-
methylchinon-monoimine:
22
Fig. 7. N-chloro-2-isopropyl-5-methylchinon-monoimine reacts to Indephenol 23
In the last step N-chloro-2-isopropyl-5-methylchinon-monoimine reacts with another
thymol molecule to indephenol which in an alcalinic medium will show a blue coloration.
Preparation Reagents and Solutions
• Buffer solution: 32.5 g trisodium citrate, 32.5 g sodium salicylate and 0.242 g
disodium pentacyano nitrosyl ferrate dissolved in 250 ml
• Reagent solution: 3.2 g tri sodium hydroxide dissolved in 50 ml by stirring and
warming up. At room temperature, 0.2 g sodium dichloroisocyanurate was added and
filled up to 100 ml
• Ammonium stock solution (c = 1,000 mg/L): 1.91 g ammonium chloride dissolved in
500 ml
Calibration
5 ml of the following standard series was prepared: 0.5, 1.0, 2.0, 5.0 and 10.0 mg
(N-NH4+)/L. The standard series has been prepared and measured just as the samples,
using standard solution instead of sample. The calibration curve was created as previously
described under 5.4.3.

23
Fig. 8. Calibration Curve for Ammonium, 19.12.2011
Preparation and Measurement of Ammonium
5 ml of sample solution was warmed up to room temperature and pipetted into a round
glass tube. If a concentration outside the calibrated range was expected, a corresponding
dilution of the sample with pure water was necessary. To the content of the round glass
tube, 0.5 ml of buffer solution and 0.5 ml of reagent solution were added and mixed
properly. The extinction was measured with the photometer after 15 minutes at a
wavelength of 690 nm.
y = 0,853x + 0,214 R² = 0,99858
0
0,5
1
1,5
2
2,5
0 0,5 1 1,5 2 2,5
extin
ctio
n
c (mg/L)
Calibration Ammonium
24
Table 9. Ammonium Results, Locations N7P2, N8P3 and Outlet N6OL1, N4OL7 and N4OL6 in Tra Noc 1
5.5.2 Ammonium Results of Monitoring Activity
In the first week of January samples were taken twice at node 7 point 2, node 8 point 3 and at three different outlets (OL) in Tra Noc 1.
* dilution factor 50
During the course of the day the ammonium concentration was rather stable (table 9.). A
comparison between the two days shows similar results for all locations. A single result,
N8P3_1300 was slightly noticeable because of it’s significantly higher value. This sample
of January 5th was measured two times. The first time it was diluted 1:20 and the
extinction was just out of the calibrated range. This indicates a concentration between 40
and 45 mg/L which complies with the received value of 42.6 mg/L.
Sample Dilution Results 03.01.2012 c [mg/L]
Results 05.01.2012 c [mg/L]
Standard 1 mg/L 1 1.01 0.94
TN1_N7P2_0900 20 20.30 22.09
TN1_N7P2_1100 20 24.20 9.99
TN1_N7P2_1300 20 14.87 22.23
TN1_N7P2_1500 20 24.45 19.30
TN1_N8P3_0900 20 27.55 16.04
TN1_N8P3_1100 20 18.97 21.03
TN1_N8P3_1300 20 19.34 42.61*
TN1_N8P3_1500 20 18.76 22.06
TN1_N6OL1_1100 20 32.12 34.77
TN1_N6OL1_1500 20 22.44 16.83
TN1_N4OL7_1100 5 2.47 1.17
TN1_N4OL7_1500 5 2.91 1.33
TN1_N4OL6_1100 20 8.30 14.56
TN1_N4OL6_1500 20 10.43 9.12
25
Table 10. Ammonium Results, Locations N1P1, N2P1 and N2P2 in Tra Noc 1
Table 11. Ammonium Results, Locations N3P3, N8P1 and N8P2 in Tra Noc 1; Location N5P1 in Tra Noc 2
The sampling dates of the locations N1P2, N2P2 and N2P2 in Tra Noc 1 (table 10.) were
about six weeks apart. Here it becomes apparent that the concentrations of the analytes are
underlying grave changes not only over the course of a day but also over time. The
ammonium concentration for N2P1 on the second date, 20th of February, is between 2.4
and 2.9 times higher than what was previously on the 10th of January recorded. For sample
N1P1 the course of concentration is very different between the two days. In January the
values stay constant whereas in February the value reaches a peak of 19.40 mg/L around
noon and subsequently decreases to below 2 mg/L in the afternoon. It is obvious that the
production mode of the enterprises can’t be assumed to be constant and therefore
predictable.
* tube test: 2.1 mg/L
Sample Dilution Results 10.01.2012 c [mg/L]
Dilution Results 20.02.2012 c [mg/L]
Standard 1 mg/L 1 1.00 1 1.12
TN1_N1P1_0900 20 9.61 10 8.42
TN1_N1P1_1100 20 8.23 10 13.24
TN1_N1P1_1300 20 5.74 10 19.40
TN1_N1P1_1500 20 8.96 10 < 2
TN1_N2P1_1100 20 6.89 10 16.78
TN1_N2P1_1500 20 6.78 10 19.33
TN1_N2P2_1100 20 2.60 50 31.54
TN1_N2P2_1500 20 5.46 10 7.21
Sample Dilution Results 12.01.2012 c [mg/L]
Dilution Results 13.02.2012 c [mg/L]
Standard 1 mg/L 1 1.02 1 1.31
TN1_N3P3_0900 5 2.36 1 0.27
TN1_N3P3_1100 50 50.59 1 1.95*
TN1_N3P3_1300 50 44.08 20 3.47
TN1_N3P3_1500 50 53.58 20 3.54
TN1_N8P1_1100 5 3.60 1 1.43
TN1_N8P1_1500 5 3.51 1 4.98
TN1_N8P2_1100 20 10.41 - -
TN1_N8P2_1500 20 7.88 - -
TN2_N5P1_1100 - - 50 (80.9)
TN2_N5P1_1500 - - 50 52.2
26
Table 12. Ammonium Results; Outlet N7OL1 in Tra Noc 1; Location N4P3 and N4P4 in Tra Noc 2
The samples taken at locations N3P3 and N8P1 (table 11.) were taken one month apart.
Additionally, on both dates in each case, one other location was visited. On first sight the
values from locations N3P3 at 11.00, 13.00 and 15.00 and the values of location N5P1 are
noticeable, because of their much higher values. Most of the ammonium concentrations in
Tra Noc that were detected so far range between 1.0 and 15.0 mg/L. A few times the
concentration came up to 30 mg/L, but anything above seemed unusual. Therefore the
results of location N3P3 and N5P5 were re-evaluated.
The three ammonium values from January 12th for location N3P3 were measured 4 days
after sample taking with a dilution of 1:20. Those first measurement results were outside
the calibration range but still indicated that the concentrations probably lie closely in the
range of the concentrations that were determined with the dilution of 1:50.
The value 80.9 mg/L of the sample N5P1_1100 is higher than the total nitrogen (76.32
mg/L) concentration which means either the ammonium value is too high or the total
nitrogen is too low, since the total nitrogen is the accumulation of all nitrogen compounds
contained in the sample. After re-evaluation, the total nitrogen result was assumed accurate
which means the ammonium value was false. It is suspected that a measurement error
occurred (also cf. 6.3.1 Ammonium Results of ISE Measurement).
The other results appear conclusive, except for the too high standard value of 1.31 mg/L.
Since the tube test result which was used as a reference confirms the accuracy of the
measurement, the results were used and the standard solution was renewed.
* tube test: 2.9 mg/L
Sample Dilution Results 07.02.2012 c [mg/L]
Standard 1 mg/L 1 1.32
TN1_N7OL1_0900 25 30.19
TN1_N7OL1_1100 25 17.91
TN1_N7OL1_1300 25 27.49
TN1_N7OL1_1500 25 29.98
TN2_N4P3_1100 25 21.80
TN2_N4P3_1500 25 22.0
TN2_N4P4_1100 10 3.3*
TN2_N4P4_1500 10 5.70
27
Fig. 9. Reaction Equation of the Nitration of 2,6-dimethyl phenol 24
The outlet 1 in Tra Noc 1 and the locations N4P3 and N4P4 in Tra Noc were sampled on
January 7th (table 12.). The results appear very stable and conclusive, except for the too
high standard value of 1.32 mg/L for a 1.0 mg/L standard. Since the tube test result, used
as a reference confirms the accuracy of the measurement, the results were used.
5.5.3 Method Description - Nitrate 21 24
The method for determining nitrate was developed according to the DIN 38405-9: German
standard methods for examination of water – Determination of Nitrate, and was adjusted to meet the
projects specific occurrences. In the following, the procedure of preparation and
measurement are described.
Principle of Method
If a sulphuric acid and phosphoric acid solution with 2,6-dimethyl phenol is added to a
sample, the nitrate-ions react to 4-nitro-2,6-dimethyl phenol. The extinction of this
complex can now be photometricly measured to determine the present nitrate.
Chloride can interfere severely with this method and lower the recovery rate of nitrate
down to approx. 60 %. It’s coactive necessary to ensure that chloride is not present in the
sample.
Reagents and Solutions
• Sulphuric acid-phosphoric acid solution: 50 ml sulphuric acid, 98 % and
40 ml phosphoric acid, 85 % were carefully mixed together.
• 2,6-dimethyl phenol solution: 0.1 g of 2,6-dimethyl phenol dissolved in 100 ml
• Nitrate stock solution (c = 1,000 mg/L): 0.73 g potassium nitrate dissolved in 1 Litre
28
Fig. 10. Calibration Curve Nitrate, 20.12.2011
Calibration
To calibrate, 5 ml of the following standard series was prepared: 0.5, 2.0, 5.0, 10.0, 15.0
and 20.0 mg (N-NO3-)/L. The standard series was prepared and measured as described
below using standard, instead of sample solution. The calibration curve was created as
described under 5.4.3.
Preparation and Measurement of Nitrate
0.5 ml of sample solution warmed up to room temperature were pipette into a round glass
tube with 5 ml of the acidic solution. If a concentration outside the calibrated range was
expected, a corresponding dilution of the sample with pure water was necessary. To the
content of the round glass tube 0.5 ml of 2,6 dimethyl phenole solution was added and
mixed. The extinction was measured with the photometer after 10 minutes at a wavelength
of 365 nm.
y = 0,0515x + 0,0142 R² = 0,9976
0
0,2
0,4
0,6
0,8
1
1,2
0 5 10 15 20 25
extin
ctio
n
c (mg/L)
Calibration Nitrate

29
Table 13. Nitrate Results, Locations N7P2, N8P3 and Outlet N6OL1, N4OL7 and N4OL6 in Tra Noc 1
5.5.4 Nitrate Results of Monitoring Activity
In the first week of January samples were taken twice at node 7 point 2, node 8 point 3 and
at three different outlets (OL) in Tra Noc 1.
According to table 13 and analogical to ammonium the nitrate concentration was quite
constant during the course of the day for each location.
The comparison between the two days show also similar results, except at location N8P3.
Here, at the 3rd of January, the value increases after 9.00 am from 1.1 mg/L to a maximum
of 10.4 mg/L. Two days later on the same location the concentration stays in lower range
between 2.4 and 3.4 mg/L.
Sample Dilution Results 03.01.2012 c [mg/L]
Results 05.01.2012 c [mg/L]
Standard 10 mg/L 1 10.00 9.83
TN1_N7P2_0900 1 1.92 1.38
TN1_N7P2_1100 1 1.80 1.39
TN1_N7P2_1300 1 2.23 4.39
TN1_N7P2_1500 1 2.23 0.87
TN1_N8P3_0900 1 1.05 2.76
TN1_N8P3_1100 1 10.35 3.38
TN1_N8P3_1300 1 9.07 2.37
TN1_N8P3_1500 1 8.93 2.35
TN1_N6OL1_1100 1 1.12 1.10
TN1_N6OL1_1500 1 1.24 1.03
TN1_N4OL7_1100 1 < 0.5 1.34
TN1_N4OL7_1500 1 < 0.5 1.03
TN1_N4OL6_1100 1 2.78 4.76
TN1_N4OL6_1500 1 1.88 0.95

30
Table 15. Nitrate Results, Locations N3P3, N8P1 and N8P2 in Tra Noc 1; Location N5P1 in Tra Noc 2
Table 14. Nitrate Results, Location N1P1, N2P1 and N2P2 in Tra Noc 1
The sampling dates of the three locations in table 14 were about six weeks apart. At N1P1
the concentration of nitrate appears to be generally low (between 0.87 and 2.74 mg/L) and
unlike ammonium, there isn’t a significant difference between the two sampling dates.
However, what is different, is the unusually high concentration at location N2P1 (up to
26.31 mg/L) on the 10th of January. It is much higher than the ammonium concentration
(6.9 and 6.8 mg/L) on this location. So far ammonium had always been higher than nitrate
and nitrite. Therefore, the results were re-evaluated. The samples N2P1 of January 10th
were first measured undiluted and the concentration was above the calibration range. The
extinctions still indicate a concentration between 20 and 25 mg/L which confirms the
obtained results.
Sample Dilution Results 10.01.2012 c [mg/L]
Dilution Results 20.02.2012 c [mg/L]
Standard 10mg/L 1 10.02 1 10.61
TN1_N1P1_0900 1 1.03 1 1.96
TN1_N1P1_1100 1 0.87 1 1.22
TN1_N1P1_1300 1 0.95 1 2.74
TN1_N1P1_1500 1 0.77 2 1.70
TN1_N2P1_1100 5 19.90 1 11.19
TN1_N2P1_1500 5 26.31 2 7.18
TN1_N2P2_1100 1 0.83 1 13.09
TN1_N2P2_1500 1 1.24 2 3.80
Sample Dilution Results 1 12.01.2012 c [mg/L]
Dilution Results 13.02.2012 c [mg/L]
Standard 10 mg/L 1 9.42 1 9.30
TN1_N3P3_0900 1 < 0.5 1 0.95
TN1_N3P3_1100 1 < 0.5 1 1.71
TN1_N3P3_1300 1 < 0.5 2 22.57
TN1_N3P3_1500 1 < 0.5 2 15.73
TN1_N8P1_1100 1 6.04 2 26.49
TN1_N8P1_1500 1 15.37 2 13.40
TN1_N8P2_1100 1 3.84 - - TN1_N8P2_1500 1 < 0.5 - - TN2_N5P1_1100 - - 1 1.42 TN2_N5P1_1500 - - 1 < 0.5
31
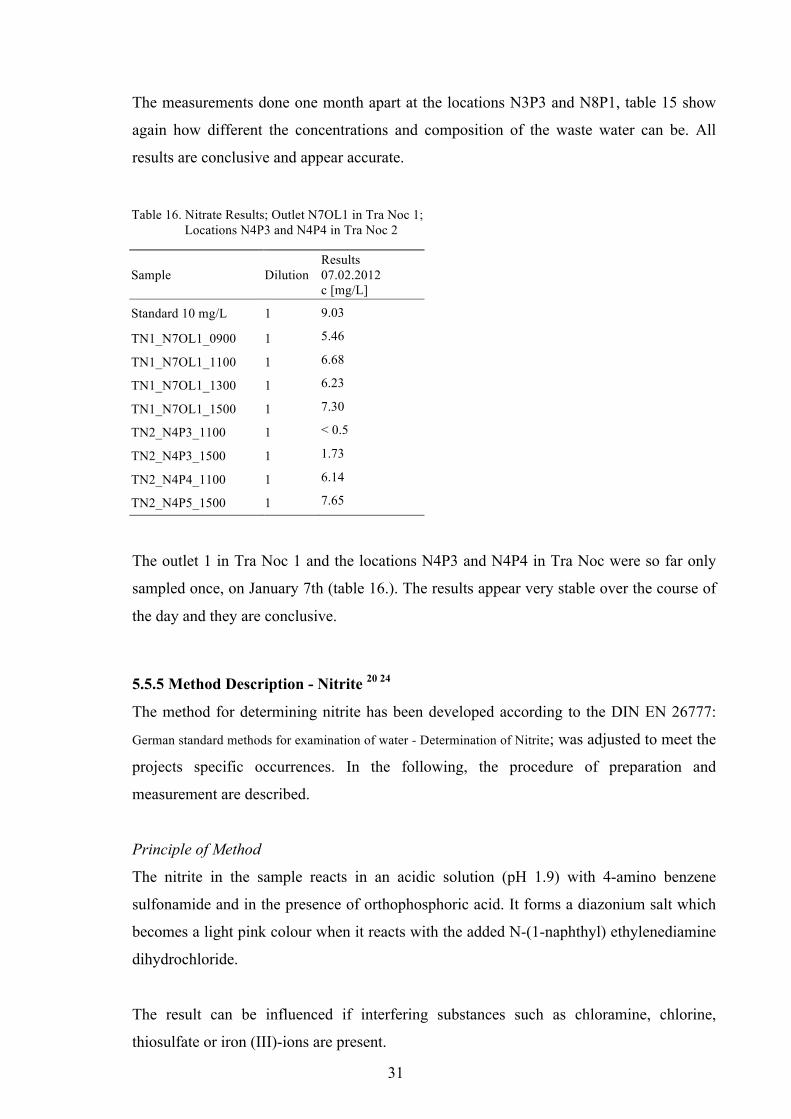
Table 16. Nitrate Results; Outlet N7OL1 in Tra Noc 1; Locations N4P3 and N4P4 in Tra Noc 2
The measurements done one month apart at the locations N3P3 and N8P1, table 15 show
again how different the concentrations and composition of the waste water can be. All
results are conclusive and appear accurate.
The outlet 1 in Tra Noc 1 and the locations N4P3 and N4P4 in Tra Noc were so far only
sampled once, on January 7th (table 16.). The results appear very stable over the course of
the day and they are conclusive.
5.5.5 Method Description - Nitrite 20 24
The method for determining nitrite has been developed according to the DIN EN 26777:
German standard methods for examination of water - Determination of Nitrite; was adjusted to meet the
projects specific occurrences. In the following, the procedure of preparation and
measurement are described.
Principle of Method
The nitrite in the sample reacts in an acidic solution (pH 1.9) with 4-amino benzene
sulfonamide and in the presence of orthophosphoric acid. It forms a diazonium salt which
becomes a light pink colour when it reacts with the added N-(1-naphthyl) ethylenediamine
dihydrochloride.
The result can be influenced if interfering substances such as chloramine, chlorine,
thiosulfate or iron (III)-ions are present.
Sample Dilution Results 07.02.2012 c [mg/L]
Standard 10 mg/L 1 9.03
TN1_N7OL1_0900 1 5.46
TN1_N7OL1_1100 1 6.68
TN1_N7OL1_1300 1 6.23
TN1_N7OL1_1500 1 7.30
TN2_N4P3_1100 1 < 0.5
TN2_N4P3_1500 1 1.73
TN2_N4P4_1100 1 6.14
TN2_N4P5_1500 1 7.65
32
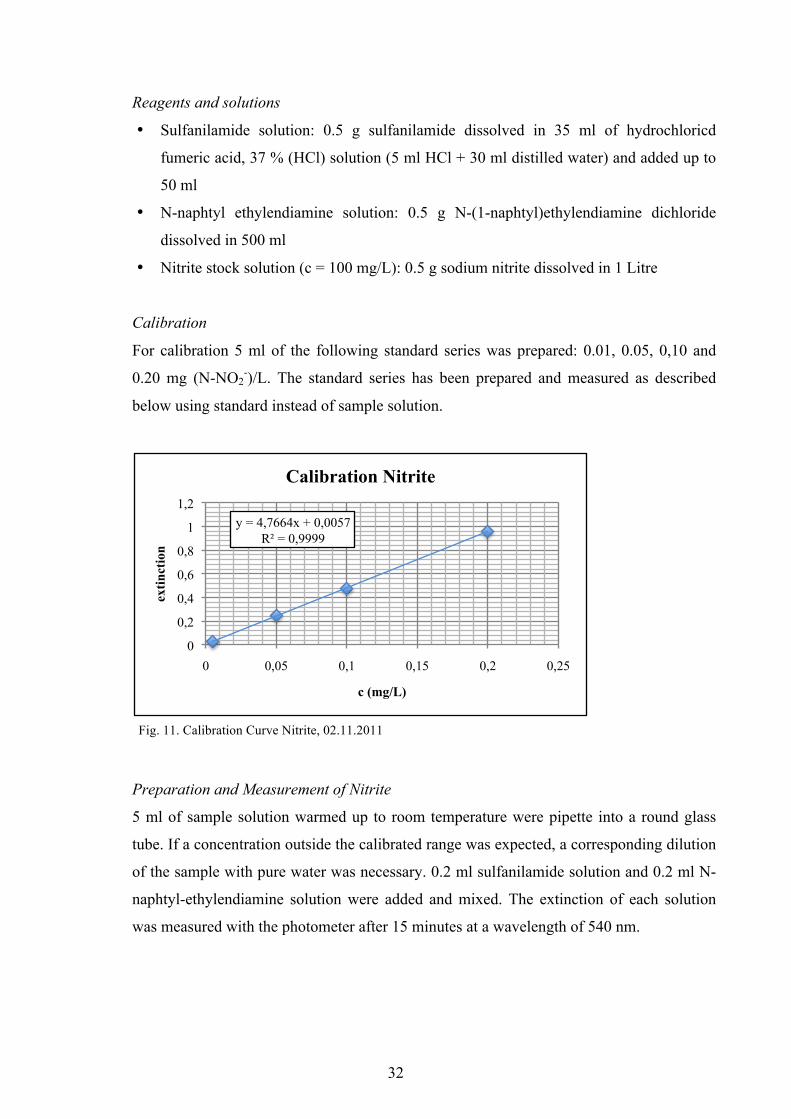
Fig. 11. Calibration Curve Nitrite, 02.11.2011
Reagents and solutions • Sulfanilamide solution: 0.5 g sulfanilamide dissolved in 35 ml of hydrochloricd
fumeric acid, 37 % (HCl) solution (5 ml HCl + 30 ml distilled water) and added up to
50 ml
• N-naphtyl ethylendiamine solution: 0.5 g N-(1-naphtyl)ethylendiamine dichloride
dissolved in 500 ml
• Nitrite stock solution (c = 100 mg/L): 0.5 g sodium nitrite dissolved in 1 Litre
Calibration
For calibration 5 ml of the following standard series was prepared: 0.01, 0.05, 0,10 and
0.20 mg (N-NO2-)/L. The standard series has been prepared and measured as described
below using standard instead of sample solution.
Preparation and Measurement of Nitrite
5 ml of sample solution warmed up to room temperature were pipette into a round glass
tube. If a concentration outside the calibrated range was expected, a corresponding dilution
of the sample with pure water was necessary. 0.2 ml sulfanilamide solution and 0.2 ml N-
naphtyl-ethylendiamine solution were added and mixed. The extinction of each solution
was measured with the photometer after 15 minutes at a wavelength of 540 nm.
y = 4,7664x + 0,0057 R² = 0,9999
0
0,2
0,4
0,6
0,8
1
1,2
0 0,05 0,1 0,15 0,2 0,25
extin
ctio
n
c (mg/L)
Calibration Nitrite
33
Table 17. Nitrite Results; Monitoring February 2012
5.5.6 Nitrite Results of Monitoring Activity
The parameter nitrite could not be measured in January owing to logistical difficulties i.e.
the ordering of missing chemicals. Fortunately the nitrite results of February (table 17.) as
well as the results of former monitoring activities in 2011 were constant and always very
low, between 0.01 and 1.26 mg/L, as would be suspected for this parameter. The
concentrations were mostly significantly below 1 mg/L, only three results were between
1.1 and 1.3 mg/L. Without any exception the results were plausible and appear fully
reliable. It is suspected that it can be taken for granted that the concentration of the samples
from January are all below 1.5 mg/L as well.
Sample Dilution Results 07.02.2012 c [mg/L]
Results 13.02.2012 c [mg/L]
Results 20.02.2012 c [mg/L]
Standard 0.1 mg/L 1 0.10 0.11 0.11
TN1_N7OL1_0900 10 0.31 - -
TN1_N7OL1_1100 20 1.26 - -
TN1_N7OL1_1300 20 0.59 - -
TN1_N7OL1_1500 20 0.84 - -
TN2_N4P3_1100 1 0.02 - -
TN2_N4P3_1500 1 0.02 - -
TN2_N4P4_1100 10 0.30 - -
TN2_N4P5_1500 10 0.33 - -
TN1_N3P3_0900 1 - 0.11 -
TN1_N3P3_1100 1 - 0.07 -
TN1_N3P3_1300 20 - 0.89 -
TN1_N3P3_1500 20 - 0.90 -
TN1_N8P1_1100 10 - 0.43 -
TN1_N8P1_1500 10 - 0.39 -
TN1_N1P1_0900 10 - - 0.36
TN1_N1P1_1100 10 - - 0.11
TN1_N1P1_1300 10 - - 0.16
TN1_N1P1_1500 1 - - 0.16
TN1_N2P1_1100 20 - - 1.16
TN1_N2P1_1500 20 - - 1.26
TN1_N2P2_1100 10 - - 0.30
TN1_N2P2_1500 5 - - 0.26
TN2_N5P1_1100 1 - - 0.01
TN2_N5P1_1500 10 - - 0.16

34
Table 18. Total Nitrogen Results, Locations N7P2, N8P3 and Outlet N6OL1, N4OL7 and N4OL6 in Tra Noc 1
5.5.7 Method Description - Total Nitrogen 21
The total nitrogen measurement follows the same principle as the nitrate measurement and
the same calibration as for nitrate is used. Before the measurement of total nitrogen a
digestion of the sample is necessary where all the nitrogen is dissolved.
Reagent for digestion
• Sodium hydroxide solution (1.5 Mol): 30 g of sodium hydroxide dissolved in
500 ml
Preparation and Measurement of Total Nitrogen
5 ml of sample solution warmed up to room temperature were pipette into a round glass
tube. 0.5 ml of sodium hydroxide and approximately 50 mg of sodium peroxodisulfate
were added and mixed. The round glass tube was then headed up for one hour at 100 ºC.
After the glass tube had cooled down to room temperature (about 30 minutes) the
measurement proceeded as described for nitrate (cf. 5.5.3).
5.5.8 Total Nitrogen Results of Monitoring Activity
Sample Dilution Results 03.01.2012 c [mg/L]
Dilution Results 05.01.2012 c [mg/L]
Standard 10 mg/L 1 10.00 1 9.83
TN1_N7P2_0900 5 45.93 5 50.01
TN1_N7P2_1100 5 75.37 5 69.54
TN1_N7P2_1300 5 84.60 5 42.05
TN1_N7P2_1500 5 58.17 5 59.05
TN1_N8P3_0900 5 73.62 5 57.01
TN1_N8P3_1100 10 122.56 5 66.04
TN1_N8P3_1300 10 103.72 5 73.72
TN1_N8P3_1500 5 66.24 5 37.00
TN1_N6OL1_1100 1 (4.54) 12.5 125.76
TN1_N6OL1_1500 5 97.81 12.5 112.76
TN1_N4OL7_1100 1 8.84 5 68.76
TN1_N4OL7_1500 1 6.04 5 85.37
TN1_N4OL6_1100 1 10.80 5 40.98
TN1_N4OL6_1500 1 16.41 5 52.54
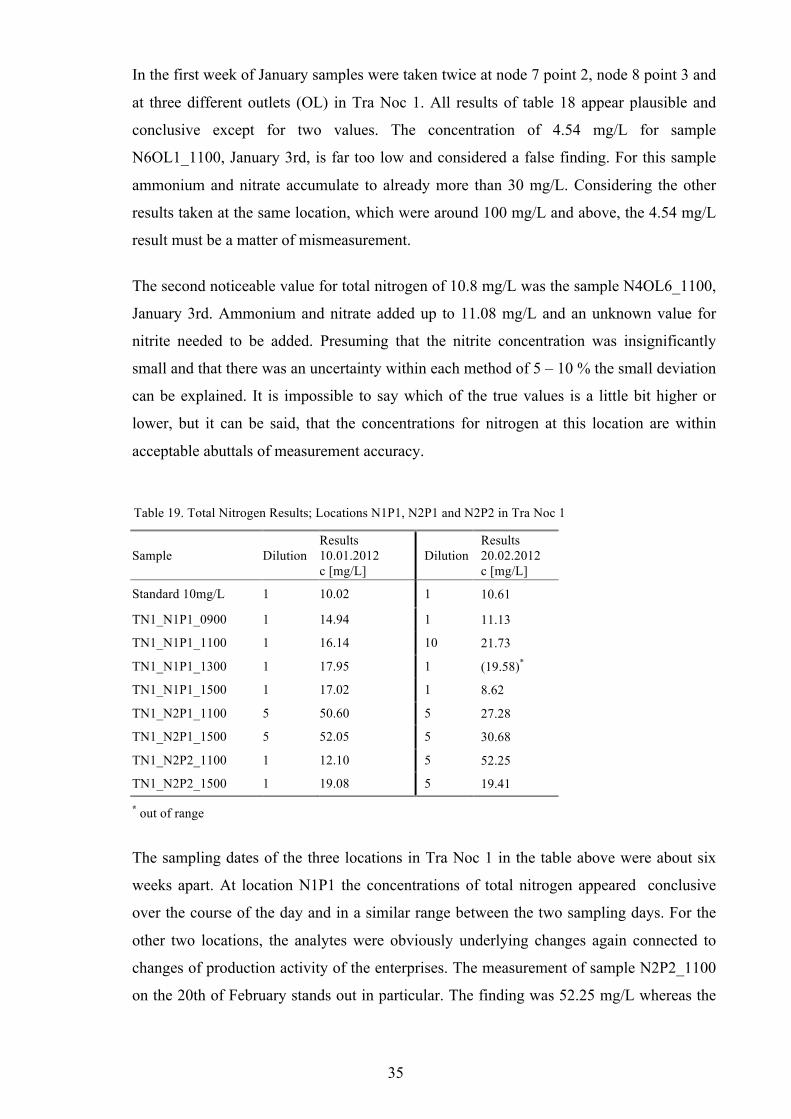
35
Table 19. Total Nitrogen Results; Locations N1P1, N2P1 and N2P2 in Tra Noc 1
In the first week of January samples were taken twice at node 7 point 2, node 8 point 3 and
at three different outlets (OL) in Tra Noc 1. All results of table 18 appear plausible and
conclusive except for two values. The concentration of 4.54 mg/L for sample
N6OL1_1100, January 3rd, is far too low and considered a false finding. For this sample
ammonium and nitrate accumulate to already more than 30 mg/L. Considering the other
results taken at the same location, which were around 100 mg/L and above, the 4.54 mg/L
result must be a matter of mismeasurement.
The second noticeable value for total nitrogen of 10.8 mg/L was the sample N4OL6_1100,
January 3rd. Ammonium and nitrate added up to 11.08 mg/L and an unknown value for
nitrite needed to be added. Presuming that the nitrite concentration was insignificantly
small and that there was an uncertainty within each method of 5 – 10 % the small deviation
can be explained. It is impossible to say which of the true values is a little bit higher or
lower, but it can be said, that the concentrations for nitrogen at this location are within
acceptable abuttals of measurement accuracy.
* out of range
The sampling dates of the three locations in Tra Noc 1 in the table above were about six
weeks apart. At location N1P1 the concentrations of total nitrogen appeared conclusive
over the course of the day and in a similar range between the two sampling days. For the
other two locations, the analytes were obviously underlying changes again connected to
changes of production activity of the enterprises. The measurement of sample N2P2_1100
on the 20th of February stands out in particular. The finding was 52.25 mg/L whereas the
Sample Dilution Results 10.01.2012 c [mg/L]
Dilution Results 20.02.2012 c [mg/L]
Standard 10mg/L 1 10.02 1 10.61
TN1_N1P1_0900 1 14.94 1 11.13
TN1_N1P1_1100 1 16.14 10 21.73
TN1_N1P1_1300 1 17.95 1 (19.58)*
TN1_N1P1_1500 1 17.02 1 8.62
TN1_N2P1_1100 5 50.60 5 27.28
TN1_N2P1_1500 5 52.05 5 30.68
TN1_N2P2_1100 1 12.10 5 52.25
TN1_N2P2_1500 1 19.08 5 19.41

36
Table 20. Total Nitrogen Results, Locations N3P3, N8P1 and N8P2 in Tra Noc 1; Location N5P1 in Tra Noc 2
Table 21. Total Nitrogen Results; Outlet N7OL1 in Tra Noc 1; Location N4P3 and N4P4 in Tra Noc 2
other samples of the same location on two different days lied between 12.10 and
19.41 mg/L. This result was re-evaluated and no reason could be found as to why the value
should be false.
At the two locations N3P3 and N8P1 the samples were taken one month apart (table 20.).
As expected the results comply with the results of the other nitrogen compounds. The
indifferent values between the two days on each location mirror the unpredictable changes
in the composition of waste water.
Sample Dilution Results 12.01.2012 c [mg/L]
Dilution Results 13.02.2012 c [mg/L]
Standard 10mg/L 1 9.41 1 9.05
TN1_N3P3_0900 1 8.80 5 17.76
TN1_N3P3_1100 5 68.08 10 17.07
TN1_N3P3_1300 5 67.31 10 31.85
TN1_N3P3_1500 5 76.56 10 51.84
TN1_N8P1_1100 5 19.61 10 67.78
TN1_N8P1_1500 5 24.95 10 90.31
TN1_N8P2_1100 5 38.65 - -
TN1_N8P2_1500 5 19.80 - -
TN2_N5P1_1100 - - 5 76.32
TN2_N5P1_1500 - - 10 98.28
Sample Dilution Results 07.02.2012 c [mg/L]
Standard 10 mg/L 1 9.02
TN1_N7OL1_0900 5 35.64
TN1_N7OL1_1100 5 30.68
TN1_N7OL1_1300 5 34.57
TN1_N7OL1_1500 5 40.88
TN2_N4P3_1100 5 17.96
TN2_N4P3_1500 5 22.33
TN2_N4P4_1100 5 15.24
TN2_N4P4_1500 5 15.62
37
The results of outlet 1 in Tra Noc 1 and the locations N4P3 and N4P4 in Tra Noc 2
sampled January 7th were very stable over the course of the day and the results could be
confirmed as being reliable (table 21.).
5.5.9 Method Description - Orthophosphate and Total Phosphorus 21 26
The methods for determining phosphorus were developed according to the DIN EN ISO
6878: German standard methods for examination of water - Determination of Phosphorus, and were
adjusted to meet the projects specific occurrences. In the following, preparation and
measurement procedures are described.
Principle of Method
The orthophosphate-ions react in an acidic solution with molybdate and antimony-ions and
form an antimony-phosphorus molybdate-complex. This complex is reduced with ascorbic
acid to a new, highly coloured molybdenum blue complex. The extinction of this complex
can now be photometricly measured to determine the present orthophosphates.
Considering the equilibrium of heptamolybdate in watery solutions 27
Mo7O246- + 4 H2O 7 MoO4
2- + 8 H+
the following equation arises:
PO43- + 12 MoO4
2 + 24 H+ + 3 NH4+ (NH4)3[P(Mo3O10)4] + 12 H2O
For the total phosphate measurement a thermal digestion with peroxosulfate is necessary.
Polyphosphates and organic phosphorus bondings can be determined after they are
hydrolized with sulphuric acid to molybdate-reactive orthophosphate. For substances
which are difficult to decompose a nitric acid/sulphuric acid - digestion is needed.

38
Fig. 12. Calibration Curve for Orthophosphate, 13.01.2012
Reagents and solutions
• Sodium peroxodisulfate solution: 15 g sodium peroxodisulfate
and 7 ml sulphuric acid, 98 % dissolved in 1 Litre
• Acidic molybdate solution: 6 g ammonium heptamolybdate tetrahydrate, 0.14 g
potassium antimony (III) oxide tartrate trihydrate and 50 ml sulphuric acid, 98 %
dissolved in 1 Litre
• Ascorbic acid solution: 50 g L(+)-ascorbic acid dissolved in 1 Litre
• Phosphorus stock solution (c = 1,000 mg/L): 4.39 g potassium hydrogen phosphate
dissolved in 1 Litre
Calibration
To calibrate, 4 ml of the following standard series was prepared: 0.5, 1.0, 2.0, 2.5 and
3.0 mg (P-PO43-)/L. The standard series was prepared and measured as described below
using standard instead of sample solution. The calibration curve was created as described
under 5.4.3.
Preparation and Measurement of Orthophosphate
4 ml of sample solution, warmed up to room temperature were pipetted into a round glass
tube. If a concentration outside the calibrated range was expected, a corresponding dilution
of the sample with pure water was necessary. To the content of the round glass tube 0.3 ml
sodium peroxodisulfate, 0.2 ml ascorbic acid and 0.2 ml acidic molydbate solution were
added and mixed. The extinction was measured with the photometer after 10 minutes at a
wavelength of 585 nm.
y = 0,1025x + 0,1267 R² = 0,998
0
0,2
0,4
0,6
0 0,5 1 1,5 2 2,5 3 3,5
extin
ctio
n
c (mg/L)
Calibration Orthophosphate

39
Table 22. Orthophosphate Results, Locations N7P2, N8P3 and Outlet N6OL1, N4OL7 and N4OL6 in Tra Noc 1
Preparation and Measurement of Total Phosphorus
4 ml of sample solution, warmed up to room temperature were pipette into a round glass
tube. 0,3 ml of sodium peroxodisulfate were added and the tube was heated up for one
hour at 100 ºC. After the digestion 0.2 ml of each molybdate- and ascorbic acid solution
were added and mixed. After 10 minutes the extinction was measured at a wavelength of
585 nm.
5.5.10 Orthophosphate Results of Monitoring Activity
In the first week of January samples were taken twice at node 7 point 2, node 8 point 3 and
at three different outlets (OL) in Tra Noc 1.
For the three locations N7P2, N8P3 and N8P4 the concentrations vary during the course of
the day as well as within the two dates of sample taking, even though the dates were only
two days apart. The two values of table 22 in brackets needed to be re-evaluated because
they were higher than the total phosphorus values (cf. 5.5.11).
The sample N6OL1_1100 was measured with a lower dilution factor the first time and the
extinction was above the calibrated range. Still, the result of this measurement indicated a
Sample Dilution Results 03.01.2012 c [mg/L]
Results 05.01.2012 c [mg/L]
Standard 1 mg/L 1 0.95 0.92
TN1_N7P2_0900 10 8.11 2.89
TN1_N7P2_1100 10 3.84 0.76
TN1_N7P2_1300 5 3.47 1.44
TN1_N7P2_1500 1 0.97 2.10
TN1_N8P3_0900 5 3.09 6.83
TN1_N8P3_1100 10 19.68 (11.61)
TN1_N8P3_1300 10 18.03 5.10
TN1_N8P3_1500 10 21.14 12.78
TN1_N6OL1_1100 20 (45.98) 10.04
TN1_N6OL1_1500 5 2.89 10.77
TN1_N4OL7_1100 1 n.d. n.d.
TN1_N4OL7_1500 1 n.d. n.d.
TN1_N4OL6_1100 2.5 2.17 3.56
TN1_N4OL6_1500 2.5 2.05 1.69
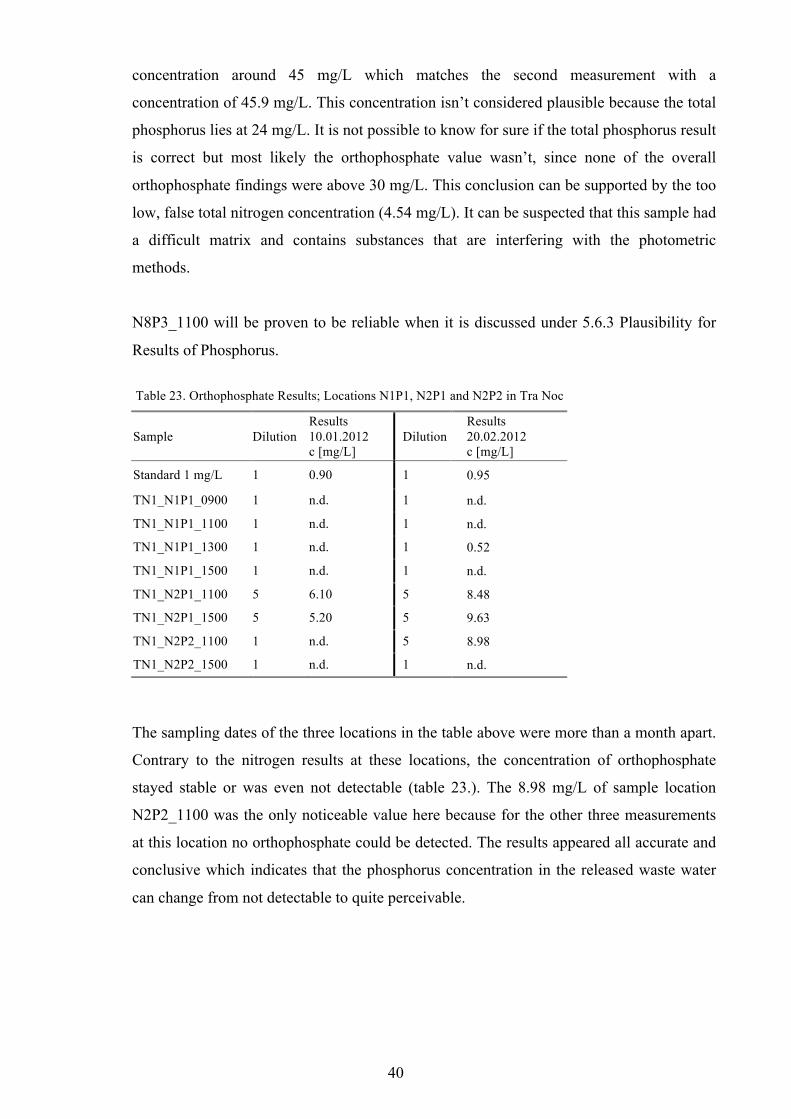
40
Table 23. Orthophosphate Results; Locations N1P1, N2P1 and N2P2 in Tra Noc 1
concentration around 45 mg/L which matches the second measurement with a
concentration of 45.9 mg/L. This concentration isn’t considered plausible because the total
phosphorus lies at 24 mg/L. It is not possible to know for sure if the total phosphorus result
is correct but most likely the orthophosphate value wasn’t, since none of the overall
orthophosphate findings were above 30 mg/L. This conclusion can be supported by the too
low, false total nitrogen concentration (4.54 mg/L). It can be suspected that this sample had
a difficult matrix and contains substances that are interfering with the photometric
methods.
N8P3_1100 will be proven to be reliable when it is discussed under 5.6.3 Plausibility for
Results of Phosphorus.
The sampling dates of the three locations in the table above were more than a month apart.
Contrary to the nitrogen results at these locations, the concentration of orthophosphate
stayed stable or was even not detectable (table 23.). The 8.98 mg/L of sample location
N2P2_1100 was the only noticeable value here because for the other three measurements
at this location no orthophosphate could be detected. The results appeared all accurate and
conclusive which indicates that the phosphorus concentration in the released waste water
can change from not detectable to quite perceivable.
Sample Dilution Results 10.01.2012 c [mg/L]
Dilution Results 20.02.2012 c [mg/L]
Standard 1 mg/L 1 0.90 1 0.95
TN1_N1P1_0900 1 n.d. 1 n.d.
TN1_N1P1_1100 1 n.d. 1 n.d.
TN1_N1P1_1300 1 n.d. 1 0.52
TN1_N1P1_1500 1 n.d. 1 n.d.
TN1_N2P1_1100 5 6.10 5 8.48
TN1_N2P1_1500 5 5.20 5 9.63
TN1_N2P2_1100 1 n.d. 5 8.98
TN1_N2P2_1500 1 n.d. 1 n.d.
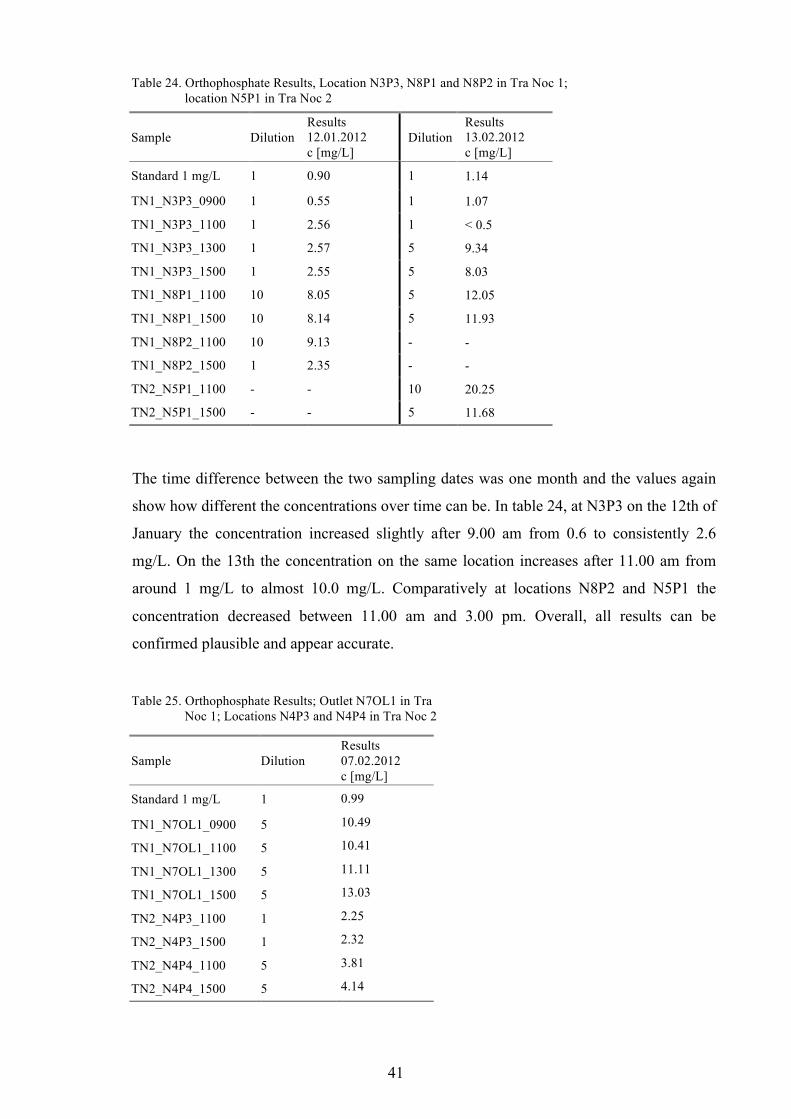
41
Table 24. Orthophosphate Results, Location N3P3, N8P1 and N8P2 in Tra Noc 1; location N5P1 in Tra Noc 2
Table 25. Orthophosphate Results; Outlet N7OL1 in Tra Noc 1; Locations N4P3 and N4P4 in Tra Noc 2
The time difference between the two sampling dates was one month and the values again
show how different the concentrations over time can be. In table 24, at N3P3 on the 12th of
January the concentration increased slightly after 9.00 am from 0.6 to consistently 2.6
mg/L. On the 13th the concentration on the same location increases after 11.00 am from
around 1 mg/L to almost 10.0 mg/L. Comparatively at locations N8P2 and N5P1 the
concentration decreased between 11.00 am and 3.00 pm. Overall, all results can be
confirmed plausible and appear accurate.
Sample Dilution Results 12.01.2012 c [mg/L]
Dilution Results 13.02.2012 c [mg/L]
Standard 1 mg/L 1 0.90 1 1.14
TN1_N3P3_0900 1 0.55 1 1.07
TN1_N3P3_1100 1 2.56 1 < 0.5
TN1_N3P3_1300 1 2.57 5 9.34
TN1_N3P3_1500 1 2.55 5 8.03
TN1_N8P1_1100 10 8.05 5 12.05
TN1_N8P1_1500 10 8.14 5 11.93
TN1_N8P2_1100 10 9.13 - -
TN1_N8P2_1500 1 2.35 - -
TN2_N5P1_1100 - - 10 20.25
TN2_N5P1_1500 - - 5 11.68
Sample Dilution Results 07.02.2012 c [mg/L]
Standard 1 mg/L 1 0.99
TN1_N7OL1_0900 5 10.49
TN1_N7OL1_1100 5 10.41
TN1_N7OL1_1300 5 11.11
TN1_N7OL1_1500 5 13.03
TN2_N4P3_1100 1 2.25
TN2_N4P3_1500 1 2.32
TN2_N4P4_1100 5 3.81
TN2_N4P4_1500 5 4.14
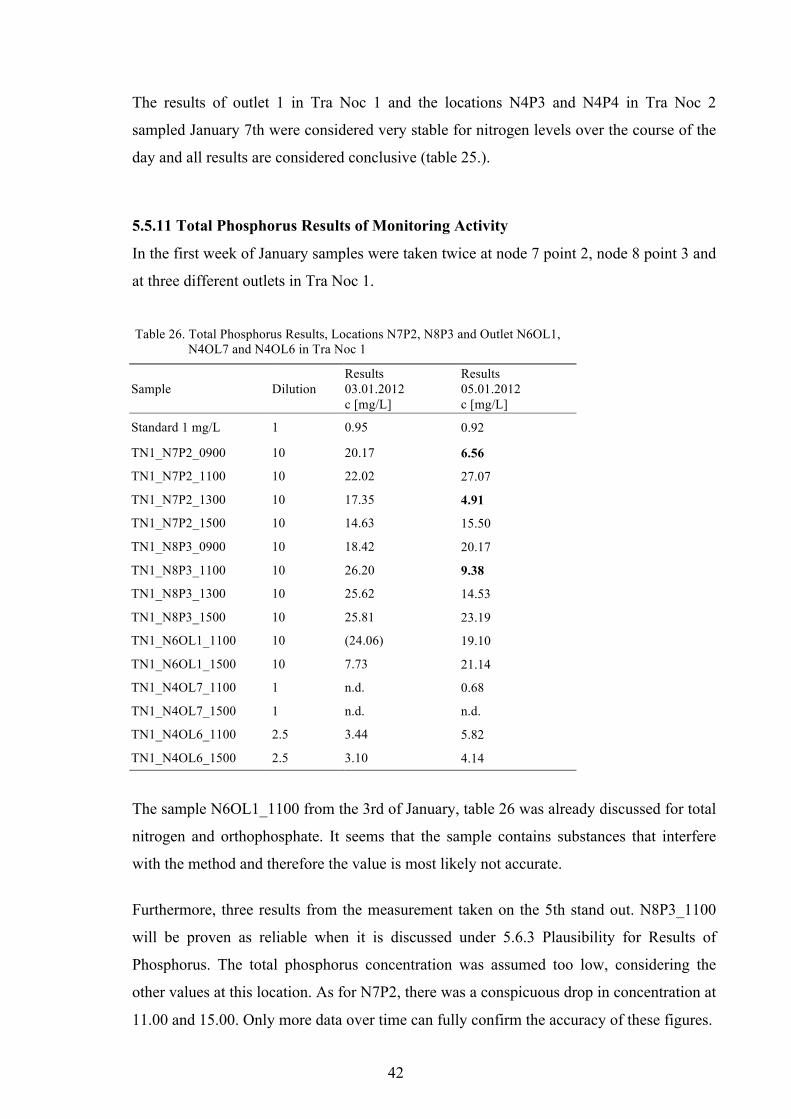
42
Table 26. Total Phosphorus Results, Locations N7P2, N8P3 and Outlet N6OL1, N4OL7 and N4OL6 in Tra Noc 1
The results of outlet 1 in Tra Noc 1 and the locations N4P3 and N4P4 in Tra Noc 2
sampled January 7th were considered very stable for nitrogen levels over the course of the
day and all results are considered conclusive (table 25.).
5.5.11 Total Phosphorus Results of Monitoring Activity
In the first week of January samples were taken twice at node 7 point 2, node 8 point 3 and
at three different outlets in Tra Noc 1.
The sample N6OL1_1100 from the 3rd of January, table 26 was already discussed for total
nitrogen and orthophosphate. It seems that the sample contains substances that interfere
with the method and therefore the value is most likely not accurate.
Furthermore, three results from the measurement taken on the 5th stand out. N8P3_1100
will be proven as reliable when it is discussed under 5.6.3 Plausibility for Results of
Phosphorus. The total phosphorus concentration was assumed too low, considering the
other values at this location. As for N7P2, there was a conspicuous drop in concentration at
11.00 and 15.00. Only more data over time can fully confirm the accuracy of these figures.
Sample Dilution Results 03.01.2012 c [mg/L]
Results 05.01.2012 c [mg/L]
Standard 1 mg/L 1 0.95 0.92
TN1_N7P2_0900 10 20.17 6.56
TN1_N7P2_1100 10 22.02 27.07
TN1_N7P2_1300 10 17.35 4.91
TN1_N7P2_1500 10 14.63 15.50
TN1_N8P3_0900 10 18.42 20.17
TN1_N8P3_1100 10 26.20 9.38
TN1_N8P3_1300 10 25.62 14.53
TN1_N8P3_1500 10 25.81 23.19
TN1_N6OL1_1100 10 (24.06) 19.10
TN1_N6OL1_1500 10 7.73 21.14
TN1_N4OL7_1100 1 n.d. 0.68
TN1_N4OL7_1500 1 n.d. n.d.
TN1_N4OL6_1100 2.5 3.44 5.82
TN1_N4OL6_1500 2.5 3.10 4.14

43
Table 28. Total Phosphorus Results; Location N3P3, N8P1, N8P2 and N5P1 in Tra Noc 1
Table 27. Total Phosphorus Results; Locations N1P1, N2P1 and N2P2 in Tra Noc 1
The samples from the 10th of January were measured with a dilution 1:10 and the
extinction of six samples was below the lowest calibrated concentration of 0.5 mg/L. Since
no undiluted measurement was made, it stays unknown if the concentrations of total
phosphorus on the 10th of January were as low as they were six weeks later.
* measurement was out of range
All results at all four locations in the table above appeared conclusive and plausible.
Comparing the results it becomes apparent that the phosphorus concentration was not
underlying as significant changes as the nitrogen compounds.
Sample Dilution Results 10.01.2012 c [mg/L]
Dilution Results 20.02.2012 c [mg/L]
Standard 1 mg/L 1 0.90 1 0.95
TN1_N1P1_0900 10 < 5.0 1 < 0.5
TN1_N1P1_1100 10 < 5.0 1 < 0.5
TN1_N1P1_1300 10 < 5.0 1 1.52
TN1_N1P1_1500 10 < 5.0 1 < 0.5
TN1_N2P1_1100 10 18.97 10 18.44
TN1_N2P1_1500 10 17.17 10 22.95
TN1_N2P2_1100 10 < 5.00 20 15.90
TN1_N2P2_1500 10 < 5.00 1 0.87
Sample Dilution Results 12.01.2012 c [mg/L]
Dilution Results 13.02.2012 c [mg/L]
Standard 1 mg/L 1 0.90 1 1.14
TN1_N3P3_0900 1 3.21 1 1.70
TN1_N3P3_1100 20 11.59 1 1.32
TN1_N3P3_1300 10 17.53 10 12.38
TN1_N3P3_1500 10 13.65 10 11.64
TN1_N8P1_1100 16 15.91 5 (16.93)*
TN1_N8P1_1500 16 12.45 10 16.48
TN1_N8P2_1100 20 12.13 - -
TN1_N8P2_1500 5 6.10 - -
TN2_N5P1_1100 - - 40 34.10
TN2_N5P1_1500 - - 40 22.95
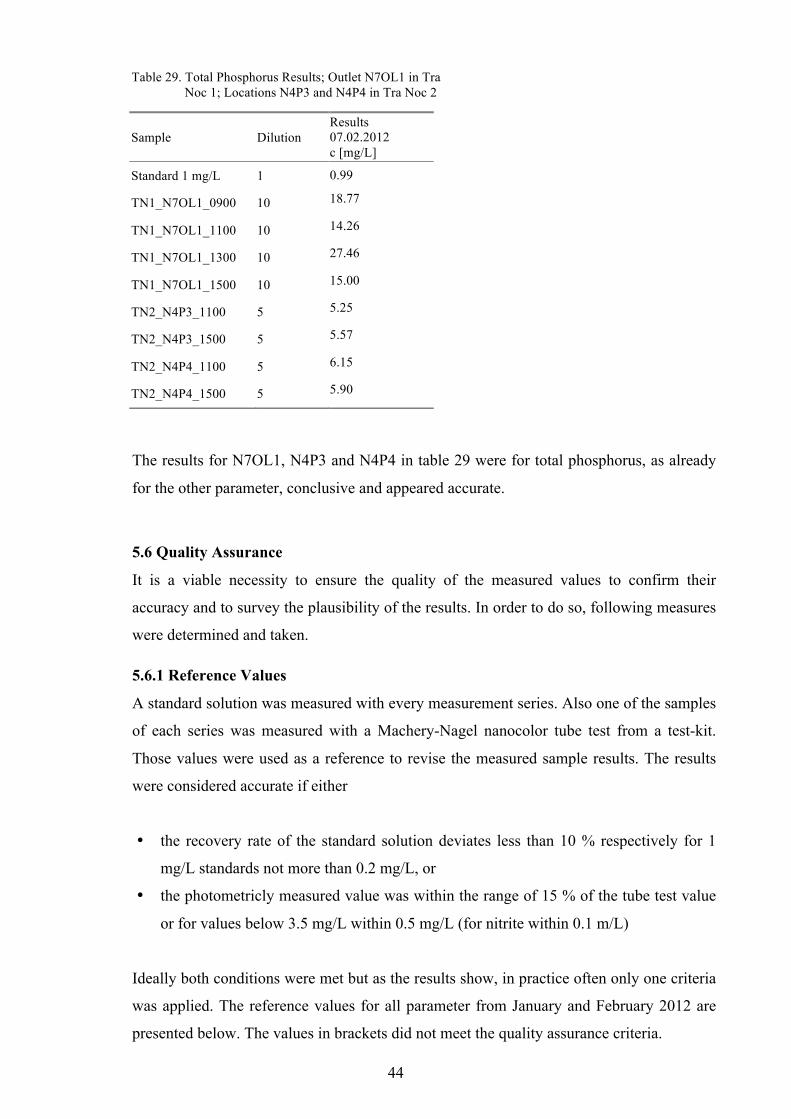
44
Table 29. Total Phosphorus Results; Outlet N7OL1 in Tra Noc 1; Locations N4P3 and N4P4 in Tra Noc 2
The results for N7OL1, N4P3 and N4P4 in table 29 were for total phosphorus, as already
for the other parameter, conclusive and appeared accurate.
5.6 Quality Assurance
It is a viable necessity to ensure the quality of the measured values to confirm their
accuracy and to survey the plausibility of the results. In order to do so, following measures
were determined and taken.
5.6.1 Reference Values
A standard solution was measured with every measurement series. Also one of the samples
of each series was measured with a Machery-Nagel nanocolor tube test from a test-kit.
Those values were used as a reference to revise the measured sample results. The results
were considered accurate if either
• the recovery rate of the standard solution deviates less than 10 % respectively for 1
mg/L standards not more than 0.2 mg/L, or
• the photometricly measured value was within the range of 15 % of the tube test value
or for values below 3.5 mg/L within 0.5 mg/L (for nitrite within 0.1 m/L)
Ideally both conditions were met but as the results show, in practice often only one criteria
was applied. The reference values for all parameter from January and February 2012 are
presented below. The values in brackets did not meet the quality assurance criteria.
Sample Dilution Results 07.02.2012 c [mg/L]
Standard 1 mg/L 1 0.99
TN1_N7OL1_0900 10 18.77
TN1_N7OL1_1100 10 14.26
TN1_N7OL1_1300 10 27.46
TN1_N7OL1_1500 10 15.00
TN2_N4P3_1100 5 5.25
TN2_N4P3_1500 5 5.57
TN2_N4P4_1100 5 6.15
TN2_N4P4_1500 5 5.90

45
Table 30. Reference Values for Ammonium
Table 32. Reference Values for Nitrite
Table 31. Reference Values for Nitrite
Date Standard 1 mg/L [mg/L]
Deviation relative [%]
Photometric result [mg/L]
Tube test result [mg/L]
Deviation relative [%]
03.01.2012 1.01 1.0 27.6 24.5 14.8 05.01.2012 0.94 - 6.0 - - - 10.01.2012 1.0 0 - - - 12.01.2012 1.02 2.0 - - - 07.02.2012 (1.32) 32.0 3.3 2.9 13.8 13.02.2012 (1.31) 31.0 2.0 2.1 -4.8 20.02.2012 1.10 10.0 13.2 (9.4) 40.4
For each measurement series for the parameter ammonia one of the two criteria were met
(table 30.) and for the 3rd of January both criteria were met. Three times in January no
tube test result were determined.
Date Standard 10 mg/L [mg/L]
Deviation relative [%]
Photometric result [mg/L]
Tube test result [mg/L]
Deviation absolute [mg/L]
03.01.2012 10 0 1.9 1.6 0.3 05.01.2012 9.83 - 1.7 - - - 10.01.2012 10.02 0.2 - - - 12.01.2012 9.42 - 5.8 - - - 07.02.2012 9.03 - 9.7 - - - 13.02.2012 9.30 - 7.0 - - - 20.02.2012 10.61 3.9 - - -
No tube test kits for nitrate were available after the 3rd of January but the all standard
measurement met the quality assurance criteria (table 31.).
Date Standard 0.1 mg/L [mg/L]
Deviation relative [%]
photometric result [mg/L]
tube test result [mg/L]
Deviation absolute [mg/L]
07.02.2012 0.10 0 0.30 0.20 0.10 13.02.2012 0.11 10.0 - - - 20.02.2012 0.11 10.0 0.26 0.2 0.06
In January no nitrite was measured. The measurement of the reference values in February
complied with the quality assurance criteria (table 32.).
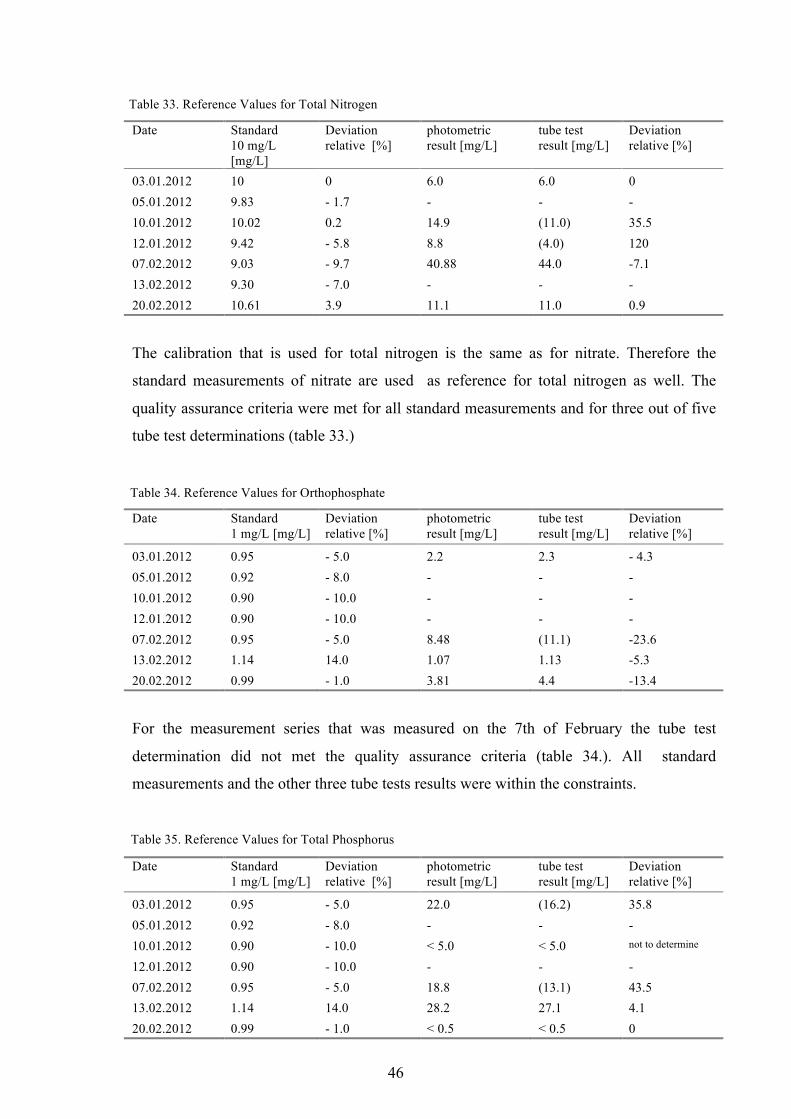
46
Table 34. Reference Values for Orthophosphate
Table 33. Reference Values for Total Nitrogen
Table 35. Reference Values for Total Phosphorus
Date Standard 10 mg/L [mg/L]
Deviation relative [%]
photometric result [mg/L]
tube test result [mg/L]
Deviation relative [%]
03.01.2012 10 0 6.0 6.0 0 05.01.2012 9.83 - 1.7 - - - 10.01.2012 10.02 0.2 14.9 (11.0) 35.5 12.01.2012 9.42 - 5.8 8.8 (4.0) 120 07.02.2012 9.03 - 9.7 40.88 44.0 -7.1 13.02.2012 9.30 - 7.0 - - - 20.02.2012 10.61 3.9 11.1 11.0 0.9
The calibration that is used for total nitrogen is the same as for nitrate. Therefore the
standard measurements of nitrate are used as reference for total nitrogen as well. The
quality assurance criteria were met for all standard measurements and for three out of five
tube test determinations (table 33.)
Date Standard 1 mg/L [mg/L]
Deviation relative [%]
photometric result [mg/L]
tube test result [mg/L]
Deviation relative [%]
03.01.2012 0.95 - 5.0 2.2 2.3 - 4.3 05.01.2012 0.92 - 8.0 - - - 10.01.2012 0.90 - 10.0 - - - 12.01.2012 0.90 - 10.0 - - - 07.02.2012 0.95 - 5.0 8.48 (11.1) -23.6 13.02.2012 1.14 14.0 1.07 1.13 -5.3 20.02.2012 0.99 - 1.0 3.81 4.4 -13.4
For the measurement series that was measured on the 7th of February the tube test
determination did not met the quality assurance criteria (table 34.). All standard
measurements and the other three tube tests results were within the constraints.
Date Standard
1 mg/L [mg/L] Deviation relative [%]
photometric result [mg/L]
tube test result [mg/L]
Deviation relative [%]
03.01.2012 0.95 - 5.0 22.0 (16.2) 35.8 05.01.2012 0.92 - 8.0 - - - 10.01.2012 0.90 - 10.0 < 5.0 < 5.0 not to determine
12.01.2012 0.90 - 10.0 - - - 07.02.2012 0.95 - 5.0 18.8 (13.1) 43.5 13.02.2012 1.14 14.0 28.2 27.1 4.1 20.02.2012 0.99 - 1.0 < 0.5 < 0.5 0
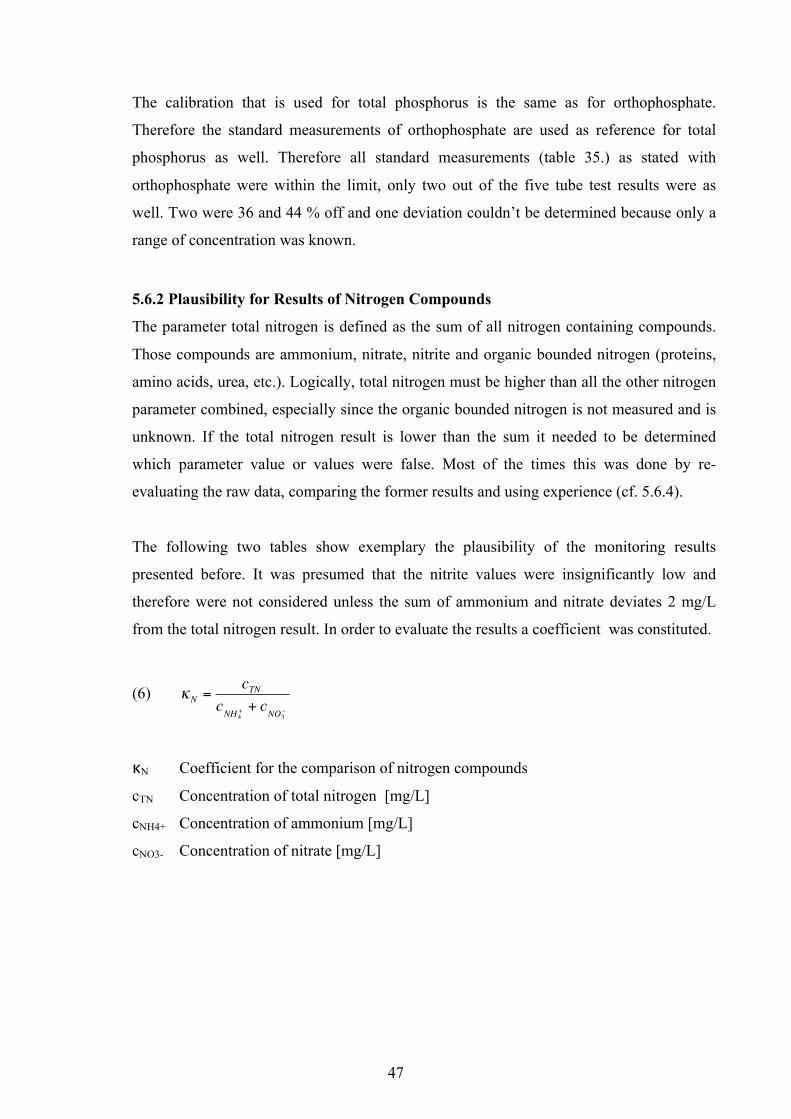
47
The calibration that is used for total phosphorus is the same as for orthophosphate.
Therefore the standard measurements of orthophosphate are used as reference for total
phosphorus as well. Therefore all standard measurements (table 35.) as stated with
orthophosphate were within the limit, only two out of the five tube test results were as
well. Two were 36 and 44 % off and one deviation couldn’t be determined because only a
range of concentration was known.
5.6.2 Plausibility for Results of Nitrogen Compounds
The parameter total nitrogen is defined as the sum of all nitrogen containing compounds.
Those compounds are ammonium, nitrate, nitrite and organic bounded nitrogen (proteins,
amino acids, urea, etc.). Logically, total nitrogen must be higher than all the other nitrogen
parameter combined, especially since the organic bounded nitrogen is not measured and is
unknown. If the total nitrogen result is lower than the sum it needed to be determined
which parameter value or values were false. Most of the times this was done by re-
evaluating the raw data, comparing the former results and using experience (cf. 5.6.4).
The following two tables show exemplary the plausibility of the monitoring results
presented before. It was presumed that the nitrite values were insignificantly low and
therefore were not considered unless the sum of ammonium and nitrate deviates 2 mg/L
from the total nitrogen result. In order to evaluate the results a coefficient was constituted.
(6)
€
κN =cTN
cNH4
+ + cNO3
−
κN Coefficient for the comparison of nitrogen compounds
cTN Concentration of total nitrogen [mg/L]
cNH4+ Concentration of ammonium [mg/L]
cNO3- Concentration of nitrate [mg/L]
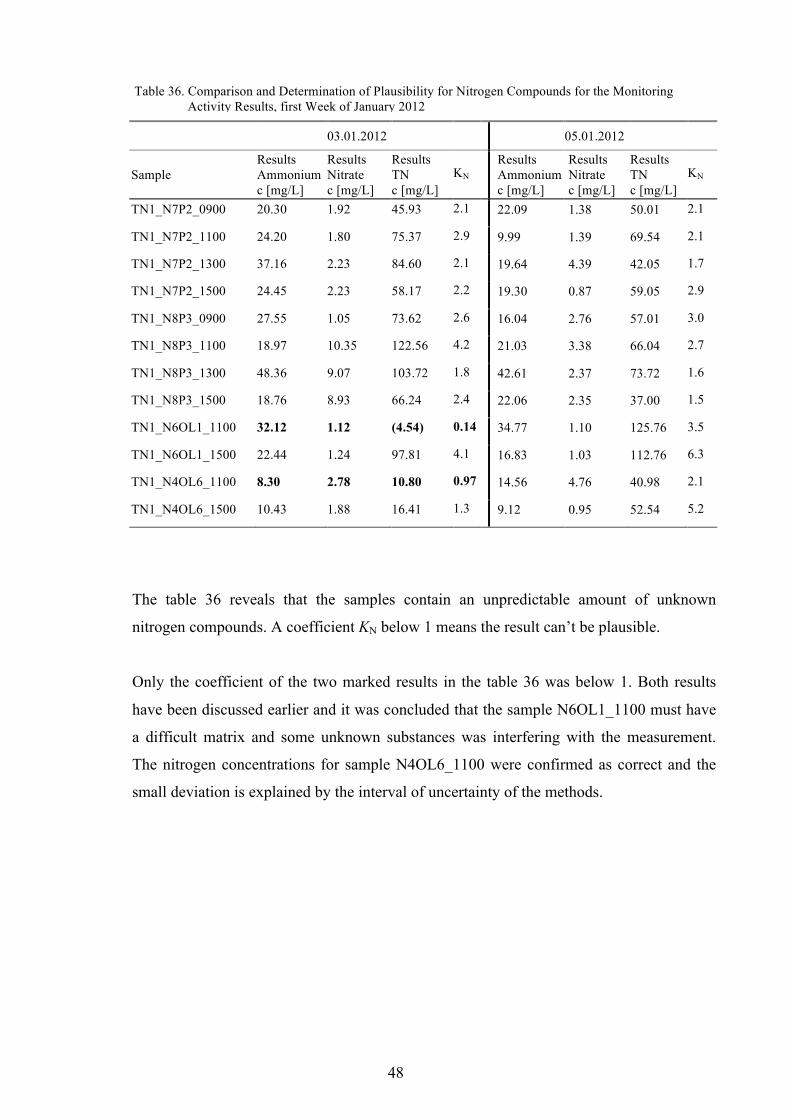
48
Table 36. Comparison and Determination of Plausibility for Nitrogen Compounds for the Monitoring Activity Results, first Week of January 2012
The table 36 reveals that the samples contain an unpredictable amount of unknown
nitrogen compounds. A coefficient KN below 1 means the result can’t be plausible.
Only the coefficient of the two marked results in the table 36 was below 1. Both results
have been discussed earlier and it was concluded that the sample N6OL1_1100 must have
a difficult matrix and some unknown substances was interfering with the measurement.
The nitrogen concentrations for sample N4OL6_1100 were confirmed as correct and the
small deviation is explained by the interval of uncertainty of the methods.
03.01.2012 05.01.2012
Sample Results Ammonium c [mg/L]
Results Nitrate c [mg/L]
Results TN c [mg/L]
KN Results
Ammonium c [mg/L]
Results Nitrate c [mg/L]
Results TN c [mg/L]
KN
TN1_N7P2_0900 20.30 1.92 45.93 2.1 22.09 1.38 50.01 2.1
TN1_N7P2_1100 24.20 1.80 75.37 2.9 9.99 1.39 69.54 2.1
TN1_N7P2_1300 37.16 2.23 84.60 2.1 19.64 4.39 42.05 1.7
TN1_N7P2_1500 24.45 2.23 58.17 2.2 19.30 0.87 59.05 2.9
TN1_N8P3_0900 27.55 1.05 73.62 2.6 16.04 2.76 57.01 3.0
TN1_N8P3_1100 18.97 10.35 122.56 4.2 21.03 3.38 66.04 2.7
TN1_N8P3_1300 48.36 9.07 103.72 1.8 42.61 2.37 73.72 1.6
TN1_N8P3_1500 18.76 8.93 66.24 2.4 22.06 2.35 37.00 1.5
TN1_N6OL1_1100 32.12 1.12 (4.54) 0.14 34.77 1.10 125.76 3.5
TN1_N6OL1_1500 22.44 1.24 97.81 4.1 16.83 1.03 112.76 6.3
TN1_N4OL6_1100 8.30 2.78 10.80 0.97 14.56 4.76 40.98 2.1
TN1_N4OL6_1500 10.43 1.88 16.41 1.3 9.12 0.95 52.54 5.2
49
Table 37. Comparison and Determination of Plausibility for Nitrogen Compounds for the Monitoring Activity Results, Locations N1P1, N2P1 and N2P2 in Tra Noc 1
10.01.2012 20.01.2012
Sample Results Ammonium c [mg/L]
Results Nitrate c [mg/L]
Results TN c [mg/L]
KN Results
Ammonium c [mg/L]
Results Nitrate c [mg/L]
Results TN c [mg/L]
KN
TN1_N1P1_0900 9.61 1.03 14.94 1.4 8.42 1.96 11.13 1.1
TN1_N1P1_1100 8.23 0.87 16.14 1.8 13.24 1.22 21.73 1.5
TN1_N1P1_1300 5.74 0.95 17.95 2.7 19.40 2.74 (19.58)** 0.88
TN1_N1P1_1500 8.96 0.77 17.02 1.7 < 2 1.70 8.62 3.2
TN1_N2P1_1100 6.89 19.90 50.60 1.9 16.78 11.19 27.28 0.98
TN1_N2P1_1500 6.78 26.31 52.05 1.6 19.33 7.18 30.68 1.2
TN1_N2P2_1100 2.60 0.83 12.10 3.5 31.54 13.09 52.25 1.2
TN1_N2P2_1500 5.46 1.24 19.08 2.8 7.21 3.80 19.41 1.8 ** out of range
The two marked results in the table above, sample N1P1_1300 and N2P2_1100 show total
nitrogen values that were just slightly smaller than the sum of the compounds ammonium
and nitrate. For sample N1P1 it can be explained by the total nitrogen measurement where
the extinction was out of the calibrated range. A second measurement with a higher
dilution most likely would have been a little higher. It naturally can only be speculated, but
experience thus far showed that the measurements out of range came very close to the
actual value of the second measurement within the calibrated range.
The other marked row of sample N2P1 in table 36 has a total nitrogen concentration 0.69
mg/L lower than the sum of ammonium and nitrate. Supposably a very small nitrite value
and an unknown organic bound nitrogen value need to be considered as well. Therefore the
results were re-evaluated. The re-evaluation wasn’t conclusive and all measurements
appeared accurate. In those cases, where the difference between the sum of nitrogen
compounds and total nitrogen was very small it can presumably explained by the
uncertainty of measurement. The same is true for the four marked values in table 38 where
the sum of ammonium and nitrate is in very close range to the total nitrogen values.
50
Table 38. Comparison and Determination of Plausibility for Nitrogen Compounds for the Monitoring Activity Results, Locations N7OL1, N4P3 and N4P4 in Tra Noc 1
The other results which are not presented above have been evaluated and were confirmed
as plausible. In total, out of all measurements from January and February eight results
reviewed for plausibility were standing out. Seven results were confirmed to be still
reliable because the absolute deviation did not exceed the sum of 10 % from each sample
which can be explained by the uncertainty of measurement. Only one sample
N6OL1_1100, as repeatedly discussed for several parameter, was detected to be not
plausible.
5.6.3 Plausibility for Results of Phosphorus
The parameter total phosphorus is defined as the sum of all phosphorus containing
compounds. Logically, total phosphorus must be higher than orthophosphate. If the total
phosphorus concentration is lower than the orthophosphate’s, it needed to be determined
which of the two parameter values was false. This was done by re-evaluating the raw data,
comparing the former results and using experience (cf. 5.6.4).
The following table shows exemplary the plausibility of the monitoring results presented
before.
07.02.2012
Sample Results Ammonium c [mg/L]
Results Nitrate c [mg/L]
Results TN c [mg/L]
KN
TN1_N7OL1_0900 30.19 5.46 35.64 1.0
TN1_N7OL1_1100 17.91 6.68 30.68 1.2
TN1_N7OL1_1300 27.49 6.23 34.57 1.0
TN1_N7OL1_1500 29.98 7.30 40.88 1.1
TN2_N4P3_1100 21.80 < 0.5 17.96 0.8
TN2_N4P3_1500 22.0 1.73 22.33 0.9
TN2_N4P4_1100 3.3 6.14 15.24 1.6
TN2_N4P4_1500 5.70 7.65 15.62 1.2
51
Table 39. Comparison and Determination of Plausibility for Phosphorus Compounds for the Monitoring Activity Results, first Week of January 2012
* KPh = Coefficient for phosphorus: ratio of TP and orthophosphate result
Just us for the plausibility check of the nitrogen compounds, a coefficient KPh was
determined to investigate if there is a dependency between total phosphorus and
orthophosphate. If the coefficient were in similar for all samples it could be concluded in
which concentration range the other parameter would be found. Apparently there is no
pattern to be found, the coefficients vary significantly, even for one location on the same
day. But the coefficient allows a statement about the plausibility because a KPh below 1
means at least one of the results can’t be accurate. Of all the results presented before, only
the two marked ones in the table above (table 39.) are inconclusive. The results needed to
be re-evaluated.
The re-evaluation for sample N8P3 wasn’t conclusive and all measurements appeared
accurate. In those cases, where the difference between the phosphorus and orthophosphate
is very small it can presumably explained by the uncertainty of measurement (cf. 5.7
Uncertainty of the Methods).
03.01.2012 05.01.2012
Sample Results Orthophosphate c [mg/L]
Results TP c [mg/L]
KPh*
Results Orthophosphate c [mg/L]
Results TP c [mg/L]
KPh*
TN1_N7P2_0900 8.11 20.17 2.5 2.89 6.56 2.3
TN1_N7P2_1100 3.84 22.02 5.7 0.76 27.07 35.6
TN1_N7P2_1300 3.47 17.35 5.0 1.44 4.91 3.4
TN1_N7P2_1500 0.97 14.63 15.1 2.10 15.50 7.4
TN1_N8P3_0900 3.09 18.42 6.0 6.83 20.17 3.0
TN1_N8P3_1100 19.68 26.20 1.3 11.61 9.38 0.8
TN1_N8P3_1300 18.03 25.62 1.4 5.10 14.53 2.8
TN1_N8P3_1500 21.14 25.81 1.2 12.78 23.19 1.8
TN1_N6OL1_1100 45.98 24.06 0.5 10.04 19.10 1.9
TN1_N6OL1_1500 2.89 7.73 2.7 10.77 21.14 2.0
TN1_N4OL7_1100 n.d. n.d. - n.d. 0.68 -
TN1_N4OL7_1500 n.d. n.d. - n.d. n.d. -
TN1_N4OL6_1100 2.17 3.44 1.6 3.56 5.82 1.6
TN1_N4OL6_1500 2.05 3.10 1.5 1.69 4.14 2.4

52
The sample of location N6OL1 was already discussed in the last section about the
plausibility of nitrogen and the re-evaluation lead to the conclusion that none of the
parameter results for this sample can be trusted because there seemed to be substances in
the sample which have influenced the measurement.
5.6.4 Practical Experience
Another less scientific but valuable means of quality assurance is the use of practical
experience. Waste water, as pointed out before, is often underlying severe change when it
comes to its composition. If one value of one parameter stands out for one location because
it is significantly higher or lower than all other results determined for this location, it can
not be concluded that the value must be false. But, as more data available for one location
as higher the likelihood to pick out those results that don’t match former results. That way
suspicious samples can be repeatedly measured or re-evaluate.
Contrariwise if the concentrations of one location and day respectively days, were in the
same range, it can be concluded that the results have a high possibility of being accurate.
5.7 Uncertainty of the Methods 28 29
A true value, in the case of this work a true concentration value, can never be determined
because all measurements are afflicted with uncertainties. This means that every
measurement result can only be seen as an estimated value for the true value respectively
an expected value of the measurand. The uncertainty is divided into the systematic
measurement deviation and the random deviation. The sum of both defines the interval in
which the true value can be found. In addition the expanded uncertainty can be determined
by stating the level of confidence. The level of confidence provides the probability of
finding the true value within a certain interval. For the expanded uncertainty the standard
uncertainty is multiplied by a coverage factor k. The choice of the factor k is based on the
level of confidence desired.
For the photometric methods used in the laboratory of Tra Noc the measurement
uncertainty hasn’t been determined at this point but estimated. The uncertainty of the
methods in this work are estimated with 10 % with a level of confidence of 95 % (k = 2).

53
6 Analytical Method Validation
6.1 Objective of Validating Methods 30
The results of analytical measurements are the foundation for decision-making, often with
consequences on a large scale for the environment and economic processes. It is therefore
of great importance to be able to judge and guarantee the reliability, quality and
consistency of analyteical results. Method validation is the process used to confirm that the
analytical procedure employed for a specific analysis is suitable. The validation of methods
is an integral, essential part of any good analytical practice.
Analytical methods need to be validated or re-validated: 31
• before their introduction into routine use;
• whenever the conditions change for which the method has been validated (e.g. an
instrument with different characteristics or samples with a different matrix); and
• whenever the method is changed and the change is outside the original scope of the
method
6.2 Method Validation in the LAR Laboratory in Tra Noc
The status quo in January 2012 of the photometric methods which are used to determine
ammonium, nitrate, nitrite, total nitrogen, orthophosphate and total phosphorus and are the
use of a normative document where the developed methods are described. The alignment
of plausibility is found in chapter 5.
Generally the attained results with the developed methods were plausible and appeared
accurate at the time of measurement. Still, there are discrepancies e. g. about whether or
not some parameter should be measured unfiltered in order to not result in the loss of
analyte. Also it was often challenging or even impossible to measure all parameters in an
acceptable timeframe. Therefore methods of sample preservation were tried out. Now, in
order to validate the accuracy of the results and to improve the workflow in the laboratory
the following experiments have taken place.
54
6.3 Comparison with the Ion Selective Electrode (ISE)
6.3.1 Objective
The measurement with an ISE is a faster and cheaper procedure to measure certain
parameter such as ammonium and nitrate than the photometric methods. It has the
advantage that the colouration or turbidity is not effecting the measurement as well as a
wider measurement range. The calibration ranges from 0.5 to 10 mg/L whereas the
calibration of the photometric method is only linear for up to 2 mg/L. The experiment was
set up in order to find an alternative, more efficient method and to be able to have another
means of reference to evaluate the results.
6.3.2 Layout and operation mode of an ion selective electrode 32 33
An ion selective electrode belongs to the potentiometric measurement procedures. The
layout includes two electrodes: the ISE, specific to one kind of ion and a reference
electrode (either build into one element or as a separate electrode), which are connected
through a volt meter. The potential of the reference electrode stays constant whereas the
electrochemical potential of the ISE is influenced by the activity of the specific ion. The
outcome of this is a change of voltage between the two electrodes and this difference is
used as the measurand to evaluate the concentration. The relation between the
concentration of ions to be measured and the measured voltage is described by the Nernst
equation:
(7)
€
Uion =Uion0 ±
RTzF
⋅ ln(aion )
Uion Potential of the electrode
U0ion Standard potential of the electrode at point of reference
± algebraic sign, + for positive charged ions and – for negative charged ions
R universal gas constant, R= 8.314472 J K-1 mol-1
T absolute temperature
F Faraday constant, F = 9.64853399 104 C mol-1
z number of moles of electrons transferred in the cell reaction
aion activity of the relevant ion
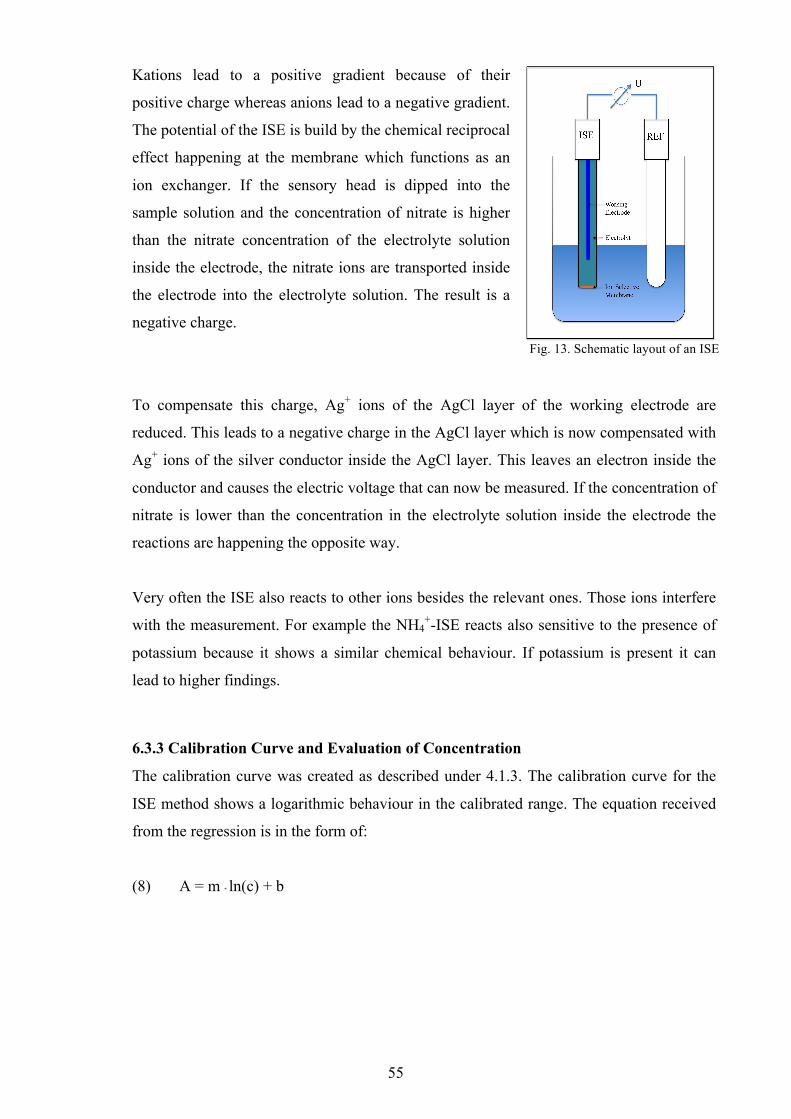
55
Fig. 13. Schematic layout of an ISE
Kations lead to a positive gradient because of their
positive charge whereas anions lead to a negative gradient.
The potential of the ISE is build by the chemical reciprocal
effect happening at the membrane which functions as an
ion exchanger. If the sensory head is dipped into the
sample solution and the concentration of nitrate is higher
than the nitrate concentration of the electrolyte solution
inside the electrode, the nitrate ions are transported inside
the electrode into the electrolyte solution. The result is a
negative charge.
To compensate this charge, Ag+ ions of the AgCl layer of the working electrode are
reduced. This leads to a negative charge in the AgCl layer which is now compensated with
Ag+ ions of the silver conductor inside the AgCl layer. This leaves an electron inside the
conductor and causes the electric voltage that can now be measured. If the concentration of
nitrate is lower than the concentration in the electrolyte solution inside the electrode the
reactions are happening the opposite way.
Very often the ISE also reacts to other ions besides the relevant ones. Those ions interfere
with the measurement. For example the NH4+-ISE reacts also sensitive to the presence of
potassium because it shows a similar chemical behaviour. If potassium is present it can
lead to higher findings.
6.3.3 Calibration Curve and Evaluation of Concentration
The calibration curve was created as described under 4.1.3. The calibration curve for the
ISE method shows a logarithmic behaviour in the calibrated range. The equation received
from the regression is in the form of:
(8) A = m * ln(c) + b

56
Fig 14. Calibration curve for NH4+ - ISE, 08.02.2012
The equation converts for the concentration c in mg/L including the dilution factor to:
(9)
€
c = eA−bm ⋅ d
A measured voltage (mV)
b y-axis intercept, extinction of calculated blank solution value
m accent of the calibration curve, in milligram per Litre [mg/L]
d dilution factor
6.3.4 Preparation and Measurement with the NH4+-ISE
Reagents and Solutions
• Buffer solution: 100 g sodium hydroxid (NaOH) and 16 g EDTA dissolved in 1 Litre
• Ammonia stock solution (c = 1,000 mg/L): 1.91 g ammonium chloride (NH4Cl)
dissolved in 500 ml
Calibration
20 ml of the following standard series was prepared: 0.5, 1.0, 2.0, 5.0 and 10.0 mg
(N-NH4+)/L. The standard series has been prepared and measured as described below using
standard instead of sample solution.
y = -23,8ln(x) + 20,419 R² = 0,99962
-40
-30
-20
-10
0
10
20
30
40
50
0 2 4 6 8 10 12
mV
c (mg/L)
Calibration ISE Ammonium

57
!
"M
=M
P
MISE
ISE Measurement of Ammonium
20 ml of sample solution warmed up to room temperature were pipetted into a small
beaker. If a concentration outside the calibrated range was expected, a corresponding
dilution of the sample with pure water was necessary. 1 ml of buffer solution is added as
well as a magnetic stirrer. While the solution is stirred at a low to medium speed the ISE
and the reference electrode were dipped into the beaker and the voltage (mV) is measured
until the value is stable.
6.3.5 Results for NH4+-ISE Measurement
In total 18 measurements were made, each for ISE and with the photometric method. The
samples were taken on three different days on nine different locations. All samples were
measured filtered and unfiltered. In order to evaluate the results a coefficient for
photometricly measured and the ISE values was constituted.
(10)
κM Coefficient of method comparison
MP Concentration of photometric measurement [mg/L]
MISE Concentration of ISE measurement [mg/L]

58
Table 41. Comparing Results of Photometric Method, ISE and Tube Test
Table 40. Comparison of ISE and Photometric Method Results for the Parameter Ammonium
Sample ISE Result [mg/L]
PM* Result [mg/L]
Deviation absolute [mg/L]
Deviation relative [%] kM
TN2_N7OL1_1100_F 13.75 17.91 4.16 -23.2 1.3
TN2_N7OL1_1100_uF 13.41 21.95 8.54 -38.9 1.6
TN2_N4P3_1100_F 16.20 21.83 5.63 -25.8 1.3
TN2_N4P3_1100_uF 14.18 20.77 6.59 -31.7 1.5
TN2_N4P4_1100_F 4.26 3.34 0.92 27.5 0.8 07.0
2.20
12
TN2_N4P4_1100_uF 1.94 (28.55) - - -
TN2_N3P3_1100_F 1.18 1.95 0.77 -39.5 1.7
TN2_N3P3_1100_uF 1.01 1.71 0.70 -40.9 1.7
TN2_N5P1_1100_F (4.25) (80.89) - - -
TN2_N5P1_1100_uF (4.12) (85.11) - - -
TN2_N8P1_1100_F 0.88 1.43 0.55 -38.5 1.6 13.0
2.20
12
TN2_N8P1_1100_uF 0.77 1.28 0.51 -39.8 1.7
TN1_N1P1_1100_F 9.34 13.24 3.90 -29.5 1.4
TN1_N1P1_1100_uF 9.81 12.49 2.28 -21.5 1.3
TN1_N2P1_1100_F 11.97 16.78 4.81 -28.7 1.4
TN1_N2P1_1100_uF 11.55 14.82 3.27 -22.1 1.3
TN1_N2P2_1100_F 39.46 31.54 7.92 25.1 0.8 20.0
2.20
12
TN1_N2P2_1100_uF 38.77 (49.77) - - - * PM = photometric method
The values of N4P4 and N2P2, table 40 measured unfiltered with the photometric method
are not plausible and are discussed in the next section 6.4.2. These two samples were taken
out of the evaluation. The results for location N5P1 needed to be re-evaluated and are
discussed below.
For each measuring row one sample has been measured with a tube test as a reference
value:
Sample Result [mg/L] Result ISE [mg/L] Tube Test [mg/L]
TN2_N4P4_1100_F 1.1 4.4 2.9
TN2_N3P3_1100_F 1.7 1.2 2.1
TN1_N1P1_1100_F 11.8 9.3 9.4

59
6.3.6 Discussion of the NH4+-ISE Results
Both methods show constant, plausible results. The relative deviation lies between 21 and
40 % and all values came out in the same measurement range of each other except for the
samples of location N5P1. All concentrations measured with the ISE were lower than with
the photometric method, except for two values of two different locations. A reason for the
consistent lower results could be the interference of amine or present metals. Mercury and
silver interfere by complexing with ammonia This can happen if the amount of EDTA that
was added wasn’t sufficient.34
A coefficient was formed to investigate the relation between the methods and support the
conclusion of a good compliance. The two times were the ISE value came out higher, the
coefficients were 0.8 and for all other plausible results it lied between 1.3 and 1.7.
It seems now that both methods deliver accurate results and it needs to be determined
which one is assumed closer the true value. The results of sample N5P1 are the ones that
stand out the most. Obviously one of the methods must have been influenced by
something. Assuming that the concentration of the filtered and unfiltered sample are
identical (cf. 6.4), the results can be seen as a repeat determination. Looking at both
methods separately the results were in a close range of each other which supports the
assumption. But the results of both methods for sample N5P1 were outstanding far from
each other and at least one of them must be completely false. After investigating both
values for plausibility the only reference point left was experience. All ammonium values
in Tra Noc so far have been far below 80 mg/L. Also the total nitrogen results are an
indicator that the photometric method was disturbed. The total nitrogen results lie between
70 and 76 mg/L but the ammonium results could still be explained by the interval of
measurement uncertainty.
The tube test values have been defined as reference values but an examination of the tube
test values and the two methods (cf. table 39) didn’t lead to a conclusion, which of the
methods is more accurate. On the first measurement date the tube test result lies in the
middle of the two methods result. The second value complies better with the photometric
method and the third with the ISE measurement. In order to come to a finding which
method is delivering the more accurate results more data is necessary. It’s also
recommendable to determine the uncertainty of both methods.

60
Fig. 15 Calibration Curve for NO3- -ISE
Nevertheless, with the data at hand the ISE appears to be an alternative, maybe even more
accurate method in comparison to the photometric measurement. The results came out
stable and plausible and none of the measurements seemed to have been influenced by
other ions. The disadvantage of the ISE measurement is the new calibration which is
needed before every measurement, but leaves this method still as a faster alternative. It is
also less prone to measurement errors because the samples often don’t need any dilution
and less reagents are added.
6.3.7 Preparation and Measurement with the NO3--ISE
Reagents and Solutions
• Aluminium sulfate solution: 34.2 g aluminium sulfate (Al2(SO4)3) and 4.9 ml of
sulphuric acid dissolved in 1 Litre
• Nitrate stock solution (c = 1,000 mg/L): 0.73 g potassium nitrate (KNO3) dissolved in
1 Litre
Calibration
For calibration 20 ml of the following standard series was prepared: 0.5, 2.5, 5.0, 10.0 and
20.0 mg (N-NO3-)/L. The standard series has been prepared and measured as described
below using standard instead of sample solution.
y = -23,55ln(x) + 183,17 R² = 0,99716
0
50
100
150
200
250
0 5 10 15 20 25
mV
c (mg/L)
Calibration ISE Nitrate

61
Table 42. Comparison of ISE and Photometric Method Results for the Parameter Nitrate
Measurement of Nitrate
The measurement is exactly the same as with the NH4+-ISE (cf. 6.3.4), only the reagent
solution is different. Instead of buffer solution, 1 ml of aluminium sulfate solution is
added.
6.3.8 Results for NO3--ISE Measurement
In total 18 measurements were made, each for ISE and with the photometric method. The
samples were taken on three different days on nine different locations. All samples were
measured filtered and unfiltered.
Out of the 18 results 2 of ISE determinations could not be used because the results were
out of the calibration range. The remaining 16 results were evaluated.
Sample
ISE Result [mg/L]
PM Result [mg/L]
Deviation absolute [mg/L]
kM
TN2_N7OL1_1100_F 31.26 6.68 24.58 0.2
TN2_N7OL1_1100_uF 25.13 < 0.5 24.88 9.9 * 10 -3
TN2_N4P3_1100_F 12.47 < 0.5 12.22 0.02
TN2_N4P3_1100_uF 5.17 < 0.5 4.92 0.05
TN2_N4P4_1100_F 31.26 6.14 25.12 0.2 07.0
2.20
12
TN2_N4P4_1100_uF 27.97 5.83 22.14 0.2
TN2_N3P3_1100_F 0.74 1.71 0.97 2.3
TN2_N3P3_1100_uF 0.33 2.97 2.64 9
TN2_N5P1_1100_F 1.51 1.42 0.09 0.9
TN2_N5P1_1100_uF 1.40 < 0.5 1.15 0.2
TN2_N8P1_1100_F (37.86)* 26.49 - - 13.0
2.20
12
TN2_N8P1_1100_uF (39.17)* 29.25 - -
TN1_N1P1_1100_F 1.44 1.22 0.22 0.8
TN1_N1P1_1100_uF 1.43 0.93 0.50 0.7
TN1_N2P1_1100_F 17.20 11.19 6.01 0.7
TN1_N2P1_1100_uF 12.54 4.62 7.92 0.4
TN1_N2P2_1100_F 13.09 13.09 0 0.1 20.0
2.20
12
TN1_N2P2_1100_uF 12.37 13.91 1.54 1.1 * out of range
62
6.3.9 Discussion of NO3--ISE Results
Now, looking at the results of the nitrate measurement, the results show that the ISE is not
an alternative method for this parameter. The values of the ISE measurement are generally
higher, sometimes even up to a 100 times. There seemed to be no pattern to find a relation
between the two methods results and no systematic deviation could be found. The
coefficient varies from 0.009 and 9 which is a decimal power of 3. The only conclusion
possible is that at least one of the methods is not delivering reliable results. The
imprecision of the standard measurement is for both methods around 10 % and no tube
tests for a reference were made because at the time there was no test kit available.
This makes it difficult to confirm which results are correct, with only the results from this
experiment at hand. Still, it can be said that the correctness of the photometric method was
discussed and verified under 5.5.4.
Also experience from former monitoring activities in 2011 when the tube test kit was
available, confirmed the compliance between photometric results for nitrate with the
reference value of the test tube measurement. Comparing the ISE nitrate results with the
results of total nitrogen some of the nitrate results are even higher than the total nitrogen
which makes them not plausible.
It may be concluded that the ISE measurement was influenced and the results are incorrect.
The presence of chloride in a sample can lead to higher findings, but some of the results
are so significantly higher that there must be at least one other reason for the incorrect
results. The membrane of an ISE is very sensitive and if there were for example detergents
in waste water the NO3--ISE is prone to failure. To confirm or eliminate the influence of
chloride or detergents, further tests could be made to finally confirm, that the NO3- -ISE is
no alternative to the current method.
6.4 Comparison of filtered and unfiltered samples
So far all parameters were measured with samples that have been filtered with a
45 µm membrane filter. For the measurement of e.g. ammonium it should not make a
difference if the sample was filtered since all ammonium-ions are assumed to be
completely dissolved into the liquid phase. This is also expected for nitrate, nitrite and
orthophosphate. For other parameters such as phosphorus and total nitrogen it can be
suspected that the concentration in the unfiltered sample will be higher. Contrary to
63
!
kuF /F
=uF
F
ammonium, nitrate, nitrite and orthophosphate-ions, some nitrogen and phosphorus
bondings are not fully dissolved but can be found attached to the sedimentation material
and suspended particles.
Therefore all those parameter were measured filtered and unfiltered using the photometric
methods. The parameter ammonium and nitrate were also measured with the ISE as
described in the last experiment. The results of this experiment were also taken into
consideration to evaluate the two parameter. Furthermore, for validation a coefficient for
filtered and unfiltered samples was constituted:
(11)
κuF/F Coefficient for unfiltered and filtered sample results
uF Unfiltered sample concentration [mg/L]
F Filtered sample concentration [mg/L]
The suspended solids of each sample were as well determined to use as a reference on the
influence of particles on the photometric measurement.
The suspended solids were measured by filtering 100 ml of each sample through a glass
fibre membrane, using a closed system composition and a vacuum pump. The membrane
filter was first dried at 105 ºC in a cabinet drier for at least one hour and then the weight
was determined with a laboratory precision scale. After filtration the membrane filters
were again dried at 105 ºC for at least 12 hours and then weight again. The suspended
solids are calculated as follows:
(12)
css Concentration suspended solids [mg/L]
w1 Weight of membrane filter before filtering [mg/L]
w2 Weight of membrane filter after filtering [mg/L]
V Volume of filtered sample [ml]
€
css =w2 − w1V
⋅1,000
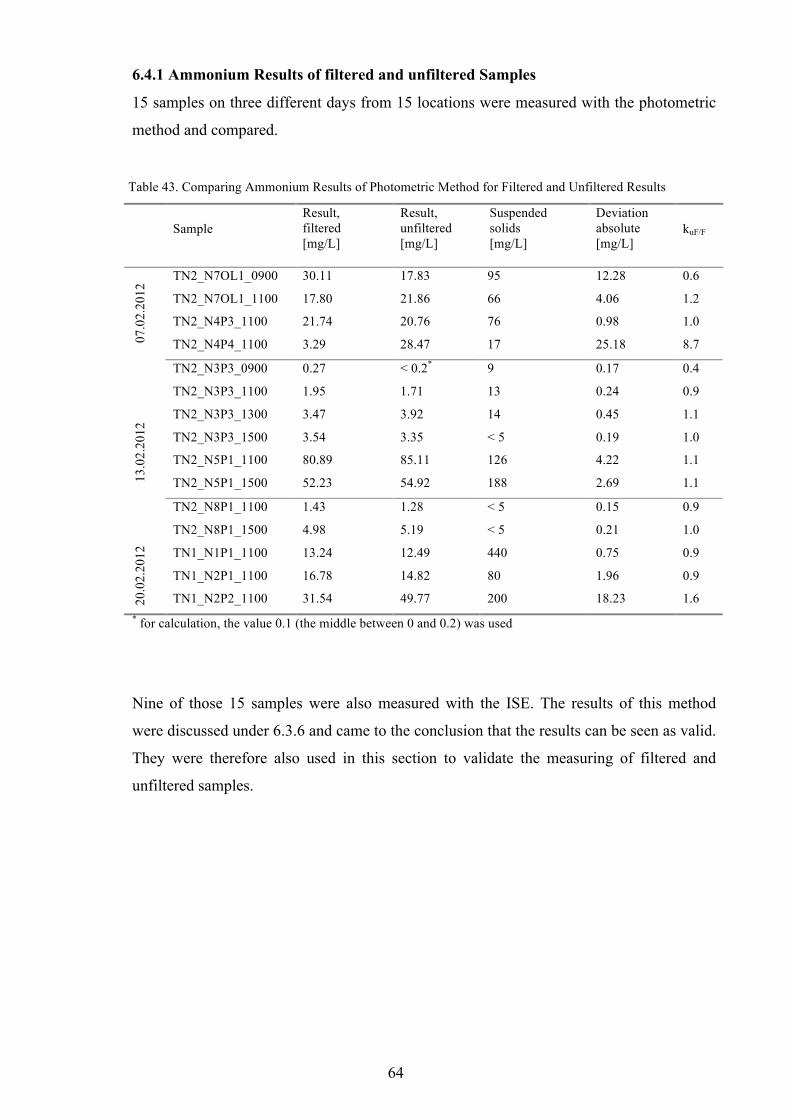
64
Table 43. Comparing Ammonium Results of Photometric Method for Filtered and Unfiltered Results
6.4.1 Ammonium Results of filtered and unfiltered Samples
15 samples on three different days from 15 locations were measured with the photometric
method and compared.
Sample Result, filtered [mg/L]
Result, unfiltered [mg/L]
Suspended solids [mg/L]
Deviation absolute [mg/L]
kuF/F
TN2_N7OL1_0900 30.11 17.83 95 12.28 0.6
TN2_N7OL1_1100 17.80 21.86 66 4.06 1.2
TN2_N4P3_1100 21.74 20.76 76 0.98 1.0
07.0
2.20
12
TN2_N4P4_1100 3.29 28.47 17 25.18 8.7
TN2_N3P3_0900 0.27 < 0.2* 9 0.17 0.4
TN2_N3P3_1100 1.95 1.71 13 0.24 0.9
TN2_N3P3_1300 3.47 3.92 14 0.45 1.1
TN2_N3P3_1500 3.54 3.35 < 5 0.19 1.0
TN2_N5P1_1100 80.89 85.11 126 4.22 1.1
TN2_N5P1_1500 52.23 54.92 188 2.69 1.1
TN2_N8P1_1100 1.43 1.28 < 5 0.15 0.9
13.0
2.20
12
TN2_N8P1_1500 4.98 5.19 < 5 0.21 1.0
TN1_N1P1_1100 13.24 12.49 440 0.75 0.9
TN1_N2P1_1100 16.78 14.82 80 1.96 0.9
20.0
2.20
12
TN1_N2P2_1100 31.54 49.77 200 18.23 1.6 * for calculation, the value 0.1 (the middle between 0 and 0.2) was used
Nine of those 15 samples were also measured with the ISE. The results of this method
were discussed under 6.3.6 and came to the conclusion that the results can be seen as valid.
They were therefore also used in this section to validate the measuring of filtered and
unfiltered samples.

65
Table 44. Comparing Ammonium Results of ISE Method for Filtered and Unfiltered Results
Sample
Result, filtered [mg/L]
Result, unfiltered [mg/L]
Suspended solids [mg/L]
Deviation absolute [mg/L]
kuF/F
TN2_N7OL1_1100 13.75 13.41 66 0.34 0.98
TN2_N4P3_1100 16.20 14.34 76 1.86 0.89
07.0
2.20
12
TN2_N4P4_1100 4.43 2.10 17 2.33 0.47
TN2_N3P3_0900 1.18 1.01 13 0.17 0.86
TN2_N5P1_1100 4.25 4.12 126 0.13 0.97
13.0
2.20
12
TN2_N8P1_1100 0.88 0.77 < 5 0.11 0.88
TN1_N1P1_1100 9.34 9.81 440 0.47 1.1
TN1_N2P1_1100 11.97 11.55 80 0.42 0.96
20.0
2.20
12
TN1_N2P2_1100 39.46 38.77 200 0.69 0.98
6.4.2 Discussion Ammonium Results of filtered and unfiltered Samples
The results for ammonium are very consistent and confirm the expectation that the
ammonia-ions are fully dissolved. Eleven out of the 15 photometricly measured values and
eight out of nine values measured with the ISE comply very well. The sample N3P3_0900
has a coefficient of 0.4 but still can be considered as complying because the values are in
such a low range and the absolute deviation of 0.17 mg/L is insignificantly small. The
small deviations between the filtered and unfiltered values can be explained by the
deviation that arises because of the method uncertainty which still needs to be determined.
As for the values that don’t comply, it is impossible the establish a connection between
suspended solids and the high deviations. As seen in table 41, the sample N1P1_1100 has
by far the highest concentration of suspended solids (440 mg/L) and the values of filtered
and unfiltered fully comply. Whereas the sample N4P4_1100 with a very low
concentration of suspended solids (17 mg/L) showed the highest deviation with 25 mg/L
apart from each other. If particles had influenced the measurement a lower concentration
for the unfiltered sample are to be expected, because the particles are responsible for
scattering the light which leads to incorrect results. The same is true for turbidity or
colouration of the sample which might absorb the light at a certain wavelength, leading to
lower findings. Nevertheless, the findings for ammonium are explicit as is also confirmed
by the ISE measurement. Ammonium can be measured filtered without any loss.
66
Table 45. Comparing Nitrate Results of Photometric Method for Filtered and Unfiltered Results
6.4.3 Nitrate Results of filtered and unfiltered Samples
14 samples on three different days from 14 locations were measured with the photometric
method and compared.
Sample
Result, filtered [mg/L]
Result, unfiltered [mg/L]
Suspended solids [mg/L]
Deviation absolute [mg/L]
kuF/F
TN2_N7OL1_1100 6.68 < 0.5* 66 6.43 0.04
TN2_N4P3_1100 < 0.5* < 0.5* 76 0 1.0
07.0
2.20
12
TN2_N4P4_1100 6.14 5.83 17 0.31 0.95
TN2_N3P3_0900 0.95 1.20 9 0.25 1.26
TN2_N3P3_1100 1.71 2.97 13 1.26 1.74
TN2_N3P3_1300 22.57 25.68 14 3.11 1.14
TN2_N3P3_1500 15.73 21.72 < 5 5.99 1.38
TN2_N5P1_1100 1.42 < 0.5* 126 1.17 0.18
TN2_N5P1_1500 < 0.5* < 0.5* 188 0 1.0
TN2_N8P1_1100 26.49 29.25 < 5 2.76 1.10
13.0
2.20
12
TN2_N8P1_1500 26.49 20.98 < 5 5.51 0.79
TN1_N1P1_1100 1.22 0.93 440 0.29 0.76
TN1_N2P1_1100 11.19 4.62 80 6.57 0.41
20.0
2.20
12
TN1_N2P2_1100 13.09 13.91 200 0.82 1.06 * for calculation, the value 0.25 (the middle between 0 and 0.5) was used
The ISE measurement for nitrate doesn’t show reliable results and can not be used to
support the evaluation of the photometric measurement.
6.4.4 Discussion Nitrate Results of filtered and unfiltered Samples
The comparison of filtered and unfiltered samples showed less consistent results compare
to ammonium and nitrite. Of the 14 measured samples in table 43, six values are having a
coefficient between 0.75 and 1.15 and have a high accordance between filtered and
unfiltered samples. The absolute deviation of sample N3P3_0900 and N1P1_1100 is so
insignificantly small (0.3 mg/L), they can be seen as compatible. Based on the assumption
that the measurement uncertainty of this measurement lies around 10 %, the deviation for
N8P1_1500 can be explained and is therefore considered compatible as well. That leaves
nine compatible results and five none compatible.
67
Table 46. Comparing Nitrite Results of Photometric Method for Filtered and Unfiltered Results
This means a general tendency that the filtered and unfiltered sample results are in
accordance. Out of the five incompatible results only the samples N7OL1_1100 and
N2P1_1100 showed a difference in concentration between filtered and unfiltered that can
not be considered the same measurement range anymore (coefficient of 0.04 and 0.4). The
two samples have a similar concentration of suspended solids (66 and 80 mg/L) and it is
possible that particles have influenced the measurement. But it can not be taken for certain
because other samples with a higher suspended solids concentration had very compatible
results. There is also a possibility that the method for nitrate measurement was impaired
and substances in the waste water effected the measurement which has lead to less accurate
results with a higher uncertainty.
Overall, the results substantiate that there is no difference in concentration for nitrate
between unfiltered and filtered results, because the deviations can be explained otherwise.
5.4.5 Nitrite Results of filtered and unfiltered Samples
14 samples on three different days from 14 locations were measured filtered and unfiltered
with the photometric method and compared.
Sample
Result, filtered [mg/L]
Result, unfiltered [mg/L]
Suspended solids [mg/L]
Deviation absolute [mg/L]
kuF/F
TN2_N7OL1_1100 1.26 0.04 66 1.24 0.03
TN2_N4P3_1100 0.02 0.08 76 0.06 4.0
03.0
2.20
12
TN2_N4P4_1100 0.30 0.29 17 0.01 0.97
TN2_N3P3_0900 0.11 0.11 9 0 1.0
TN2_N3P3_1100 0.07 0.07 13 0 1.0
TN2_N3P3_1300 0.89 0.89 14 0 1.0
TN2_N3P3_1500 0.90 0.89 < 5 0.01 0.99
TN2_N5P1_1100 0.01 0.09 126 0.08 9.0
TN2_N5P1_1500 0.16 0.13 188 0.03 0.81
TN2_N8P1_1100 0.43 0.43 < 5 0 1.0
13.0
2.20
12
TN2_N8P1_1500 0.39 0.38 < 5 0.01 0.97
TN1_N1P1_1100 0.11 0.11 440 0 1.0
TN1_N2P1_1100 1.16 0.06 80 1.10 0.05
20.0
2.20
12
TN1_N2P2_1100 0.30 0.36 200 0.06 1.2
68
6.4.6 Discussion Nitrite Results of filtered and unfiltered Samples
The findings for nitrite in Tra Noc are generally very low with almost all results far below
1.0 mg/L. This naturally leads to a high relative deviation with just small differences
between the absolute results.
Of the 14 measured samples, ten comparisons were in very high accordance between the
filtered and unfiltered sample with a coefficient between 0.8 and 1.2 and a absolute
deviation not more than 0.6 mg/L. As well as already for ammonium and nitrate, there
can’t be a connection established between the suspended solids and the deviating findings
of nitrite. The four values with higher deviations standing out, N7OL1_1100, N4P3_1100,
N5P1_1100 and N2P1_1100, were not the same that were standing out for ammonium.
This confirms the assumption that the measured suspended solid concentration can not be
used as a reference.
As for the results of the two samples N4P3 and N5P1, where the coefficients were 4.0 and
9.0, the nitrite concentration is in such a low range that the difference probably can be
explained by the inaccuracy of the method. The inaccuracy increases in the lower
calibration range. The absolute deviation is only 0.06 and 0.08 mg/L.
Looking at the two other results that were noticeable, N7OL1 and N2P1, the filtered values
are significantly higher than the unfiltered and the suspended solid concentration were still
rather low in concentration. The sample N2P1_1100 was measured twice for filtered and
unfiltered. The first time with a dilution factor 10 and the extinctions measured were out of
range. The extinction of the filtered sample was above the calibrated range and the
extinction of the unfiltered sample was below. That allows the assumption that the final
results measured with no dilution for the filtered and the dilution factor 20 for the
unfiltered sample are correct. It can only be speculated what has influenced the
measurement and had lead to the difference in concentration. It could have been the
particles, maybe in combination with a colouration of the sample.
At the end it is also questionable how important it is for the parameter nitrite to research
the reason for the deviations in the method as long as the results are coming out so low and
the values are not making any difference for the planning and maintaining a waste water
treatment system.
69
Table 47. Comparing Total Nitrogen Results of Photometric Method for Filtered and Unfiltered Results
The results for nitrite show a very high accordance between filtered and unfiltered
samples. It can be said that it is fully dissolved in the liquid phase and that there is no loss
if the sample is filtered before measurement.
6.4.7 Total Nitrogen Results of filtered and unfiltered Samples
24 samples on three different days from 24 locations were measured with the photometric
method and compared.
Sample
Result, filtered [mg/L]
Result, unfiltered [mg/L]
Suspended solids [mg/L]
Deviation absolute [mg/L]
kuF/F
TN2_N7OL1_0900 35.64 32.24 95 3.4 0.90
TN2_N7OL1_1100 30.68 26.31 66 4.37 0.86
TN2_N7OL1_1300 34.57 37.48 65 2.91 1.08
TN2_N7OL1_1500 40.88 33.60 93 7.28 0.82
TN2_N4P3_1100 17.96 25.63 76 7.67 1.43
TN2_N4P3_1500 22.33 27.67 80 5.34 1.24
TN2_N4P4_1100 15.24 13.97 17 1.27 0.92
07.0
2.20
12
TN2_N4P4_1500 15.62 45.84 16 30.22 2.93
TN2_N3P3_0900 17.76 13.56 9 4.20 0.76
TN2_N3P3_1100 17.07 19.18 13 2.11 1.12
TN2_N3P3_1300 31.85 50.50 14 18.65 1.59
TN2_N3P3_1500 51.84 98.08 < 5* 46.24 1.89
TN2_N5P1_1100 76.32 69.91 126 6.41 0.92
TN2_N5P1_1500 98.28 35.04 188 63.24 0.36
TN2_N8P1_1100 67.78 67.00 < 5* 0.78 0.99
13.0
2.20
12
TN2_N8P1_1500 90.31 61.75 < 5* 28.56 0.68
TN1_N1P1_0900 11.13 15.71 570 4.58 1.41
TN1_N1P1_1100 21.73 55.65 440 33.92 2.56
TN1_N1P1_1300 19.58 20.37 392 0.79 1.04
TN1_N1P1_1500 8.62 2.93 10 5.69 0.34
TN1_N2P1_1100 27.28 24.95 80 2.33 0.91
TN1_N2P1_1500 30.68 31.17 56 0.49 1.02
TN1_N2P2_1100 52.25 50.50 200 1.75 0.97
20.0
2.20
12
TN1_N2P2_1500 19.41 17.08 64 2.33 0.88
70
6.4.8 Discussion Total Nitrogen Results of filtered and unfiltered Samples
As stated before the unfiltered results for the parameter total nitrogen are expected to be
higher since it is suspected that the filtration results in a loss of organic nitrogen which is
bound within the particles. It’s the objective of this measurement to find out if the current
practiced measurement of filtered samples is actually delivering accurate results.
More than half (13 out of 24) of the filtered values found in table 45 were higher than the
unfiltered, which was not to be expected. Out of these 13 values, eight results are in a close
range to each other and show a high compliance (coefficient between 0.85 and 1.25). All
together 12 filtered and unfiltered samples comply very well. Which leaves the question
open, if there is a loss of total nitrogen after filtering. An investigation of the twelve less
complying values showed five results with a higher concentration for the filtered samples.
The contemplation of the suspended solids doesn’t lead to a relation that could confirm
with no doubt the loss of data because of particles that influence the photometric
measurement. It can also not be confirmed that there is a higher total nitrogen
concentration in the unfiltered sample if the suspended solids concentration is high (cf.
sample N3P3_1500 and N1P1_1100).
It can be speculated that about half of the time, depending on the location, the difference
between filtered and unfiltered sample for total nitrogen is insignificant and filtering
therefore doesn’t make a difference. In the other half of the measurements either the
digestion was insufficient and the particles in the sample resulted in a loss owed to the
photometric measurement; or the measurement was accurate and the concentration in the
unfiltered sample is truly by far higher than in the filtered. That would mean the filtered
sample result is not mirroring the actual concentration which is much higher. In that case
the photometric method could not be used. To come to a final conclusion more comparing
measurements are recommended.

71
Table 48. Comparing Orthophosphate Results of Photometric Method for Filtered and Unfiltered Results
6.4.9 Orthophosphate Results of filtered and unfiltered Samples
10 samples on three different days from 10 locations were measured with the photometric
method and compared.
Sample
Result, filtered [mg/L]
Result, unfiltered [mg/L]
Suspended solids [mg/L]
Deviation absolute [mg/L]
kuF/F
TN2_N7OL1_1100 10.41 9.96 66 0.45 0.96
TN2_N4P3_1100 2.25 4.96 76 2.71 2.20
07.0
2.20
12
TN2_N4P4_1100 3.81 2.91 17 0.90 0.76
TN2_N3P3_0900 1.07 < 0.5* 9 0.82 0.23
TN2_N3P3_1100 < 0.5* 0.58 13 0.33 2.32
TN2_N5P1_1100 20.25 21.23 188 0.98 0.95
13.0
2.20
12
TN2_N8P1_1100 12.05 11.60 < 5 0.45 0.96
TN1_N1P1_1100 < 0.5* 4.07 440 3.82 16.28
TN1_N2P1_1100 8.48 8.93 80 0.45 1.05
20.0
2.20
12
TN1_N2P2_1100 8.98 7.50 200 1.48 0.85 * for calculation the value 0.25 (the middle between 0 and 0.5) was used.
6.4.10 Discussion Orthophosphate Results of filtered and unfiltered Samples
The difference between filtered and unfiltered samples for the parameter orthophosphate is
expected to be insignificant. For 50 % of the ten measurements it can be easily confirmed
(table 46.) since the coefficient is lying between 0.85 and 1.05 which means deviations can
be explained with the interval of uncertainty for the measurements. The concentrations of
the samples N3P3_0900 and 1100 are in a low range (≤ 1 mg/L) and the inaccuracy of the
method increases towards the lower end of the calibration range. These two results are
therefore also seen as compatible. Sample N4P4_1100 has an absolute deviation of 0.9
mg/L which is considerably small. That makes it eight out of ten measurements where the
filtered and unfiltered concentrations comply.
Only the results for N4P3_1100 and N1P1_1100 are standing out and the reason for the
discrepancy can only be speculated. As a final conclusion it can be said that the
measurement of filtered samples for orthophosphate doesn’t underlie any loss in
concentration because of the filtration.
72
Table 49. Comparing Total Phosphorus Results of Photometric Method for Filtered and Unfiltered Results
6.4.11 Total Phosphorus Results of filtered and unfiltered Samples
24 samples on three different days from 24 locations were measured with the photometric
method and compared.
Sample
Result, filtered [mg/L]
Result, unfiltered [mg/L]
Suspended solids [mg/L]
Deviation absolute [mg/L]
kuF/F
TN2_N7OL1_0900 18.77 23.69 95 4.92 1.26
TN2_N7OL1_1100 14.26 15.66 66 1.40 1.10
TN2_N7OL1_1300 27.46 29.75 65 2.29 1.08
TN2_N7OL1_1500 15.00 21.64 93 6.64 1.44
TN2_N4P3_1100 5.25 7.21 76 1.96 1.37
TN2_N4P3_1500 5.57 6.97 80 1.40 1.25
TN2_N4P4_1100 6.15 14.43 17 8.28 2.35
07.0
2.20
12
TN2_N4P4_1500 5.90 7.62 16 1.72 1.29
TN2_N3P3_0900 1.70 0.94 9 0.76 0.55
TN2_N3P3_1100 1.32 1.17 13 0.15 0.89
TN2_N3P3_1300 12.38 12.79 14 0.41 1.03
TN2_N3P3_1500 11.64 12.13 < 5 0.49 1.04
TN2_N5P1_1100 34.10 35.08 126 0.98 1.03
TN2_N5P1_1500 22.95 21.97 188 0.98 0.96
TN2_N8P1_1100** (16.93) (16.52) < 5 (0.41) (0.98)
13.0
2.20
12
TN2_N8P1_1500 16.48 17.21 < 5 0.73 1.04
TN1_N1P1_0900 < 0.5* 1.74 570 1.49 6.96
TN1_N1P1_1100 < 0.5* 29.26 440 29.01 117.04
TN1_N1P1_1300 1.52 9.26 392 7.74 6.09
TN1_N1P1_1500 < 0.5* 24.02 10 23.77 96.08
TN1_N2P1_1100 18.44 19.26 80 0.82 1.04
TN1_N2P1_1500 22.95 19.67 56 3.69 0.86
TN1_N2P2_1100 15.90 27.05 200 11.15 1.70
20.0
2.20
12
TN1_N2P2_1500 0.87 2.01 64 1.14 2.31 * for calculation the value 0.25 (the middle value between 0.5 and 0) was used. **out of range
6.4.12 Discussion Total Phosphorus Results of filtered and unfiltered Samples
The parameter total phosphorus was expected to have higher findings in the unfiltered
samples. This can be confirmed for 19 out of the 24 measured samples (cf. table 47.). The
five samples, where the values for the unfiltered samples are lower, were having
compatible results with a coefficient close to 1 or, if in a lower concentration range, a
small absolute deviation.
73
In total there are eleven complying results within close range of each other and a
coefficient between 0.85 and 1.1. The other 13 samples showed anything from small (1.1
mg/L) to big differences (29 mg/L) in concentration between the filtered and unfiltered
measurement. As already for the other parameters concluded, no relation between
suspended solids and the measurement outcome for total phosphorus can be determined.
The difference between filtered and unfiltered sample was sometimes high and sometimes
low, independently of the suspended solids concentration. That makes it difficult to come
to any conclusion. The mostly higher unfiltered sample values indicated that the
photometric measurement was not impaired by particles. It additionally indicates that for
some samples there can be a significantly high and unpredictable loss of phosphorus
concentration if the sample is filtered. To come to a final conclusion more comparing
measurements are recommended.
6.5. Evaluation of Methods to Preserve Analytes in Samples
The composition of the waste water at the many sampling locations in Tra Noc during the
monitoring activities in 2011 and beginning 2012 was unknown and the concentration of
the different parameters could not be predicted. Hence, for every sample and every
parameter the right dilution needed to be determined. For many samples it meant at least
one repeated measurement. If the quality standards (standard and tube test measurement as
reference values) weren’t met, the complete measurement series needed to be repeated.
This was very time consuming and the measurements were time crucial because the
analytes in the sample can change quickly. Ideally the samples were analysed within hours
after sample taking. The amount of samples, the repetition measurements and the
personnel capacity made it impossible to get all results of all parameters within the same
day.
In order to find out if there could be a bigger time frame for the analysis, sample
preservation methods were tested. Currently all samples are preserved by filtering them
with a 45 µm membrane filter after sample taking and storing them in a refrigerator at
approximately 8 ºC. The samples were often measured after several days of sample taking.
In Literature it can be found that the preservation of samples is generally difficult and no
method has proven certain. It always depends on the circumstances which in the case of
the laboratory in Tra Noc are especially the climatic conditions.

74
According to the American Water Works Association the sample can be preserved as
follows: 34
Ammonium
Refrigerate at 4 ºC for 24 hours or preserve samples for up to 28 days by lowering the pH
to 2 or less with concentrated sulphuric acid.
Nitrate
Refrigerate at 4 ºC for 48 hours or preserve unchlorinated samples concentrated sulphuric
acid and store at 4 ºC. NOTE: When sample is preserved with acid, nitrate and nitrite can
not be determined as individual.
Nitrite
Never use acid preservation. Make the determination promptly on fresh samples to prevent
bacterial conversion of nitrite to nitrate or ammonium. For short-term preservation for 1 to
2 days, freeze the sample at −20°C or store at 4°C.
Orthophosphate
Never use acid preservation. Preserve sample by freeing at or below – 10 ºC.
Total Phosphorus
Preserve samples by lowering the pH to 2 or less with concentrated sulphuric or chloric
acid and store at 4 ºC, or freeze without any addition.
In this experiment the samples for the measurement of ammonium, nitrate, nitrite and
orthophosphate were first filtered and then divided into three parts. One part was kept
refrigerated at 6 to 8 ºC, a second part had approx. 0.5 % sulphuric acid added until a pH
value below 2 and was kept in the refrigerator as well. The third part was stored in a
freezer and defrosted just before measurement. The same was done for the total nitrogen
and the total phosphorus preparation only without the filtering. The samples for the
ammonium measurement were neutralized again before determination using a 1.5 molar
sodium hydroxide (NaOH) solution. Each sample was measured for each parameter at the
day of sample taking and the value of this measurement was referred to as T0. The
refrigerated samples were analysed again after 24 hours, 48 hours, 7 and 14 days. The
frozen samples were analysed after 48 hours and 7 days.
75
Table 50. Comparison of Ammonium Results for Preservation Methods
6.5.1 Ammonium Results for Preservation Methods
The samples were taken on the same day (07. Jan. 2012) at three different locations.
Owing to a capacity bottleneck the measurements started on the 08. Jan. which is when T0
was determined.
Sample T0 Result [mg/L]
T1d Result [mg/L]
T2d Result, [mg/L]
T7d Result [mg/L]
T14d Result, [mg/L]
TN2_N7OL1_1100 17.80 18.63 18.95 12.88 11.93
TN2_N7OL1_1100_H2SO4 - 10.02 23.44 17.15 13.80
TN2_N7OL1_1100_fr - - 21.80 10.43 -
TN2_N4P3_1100 21.74 25.21 15.04 - 3.51
TN2_N4P3_1100_H2SO4 - 10.84 27.67 21.25 15.51
TN2_N4P3_1100_fr - - 24.56 14.24 -
TN2_N4P4_1100 3.29 3.54 4.50 3.88 2.31
TN2_N4P4_1100_H2SO4 - 1.20 5.22 4.32 20.63
TN2_N4P4_1100_fr - - 4.28 2.51 -
6.5.2 Discussion of Preservation Results for Ammonium
The current method results showed for all three samples a small increase after the first day
and the tendency to decrease after 7 to 14 days (table 48.). For sample N4P3 the change in
concentration is not as significant as it is for the other two samples with higher
T0 concentration. The concentration in N4P3 decreases about 1 mg/L after two weeks with
a starting point of 3.3 mg/L. The sample N7OL1 started with 17.80 mg/L and decreased
after two weeks to 11.9 mg/L. The findings for sample N4P3 after 14 days are only a
fraction of the former concentration. The concentrations decreased from 21.7 to 3.5 mg/L.
But with only one measurement of a sample in a low range it can not be concluded that the
change in smaller concentration will be small, too.
The samples that had sulphuric acid added don’t show any consistency and the
concentrations were bouncing up and down over time. One problem that occurred and
could be partly responsible of the inconsistent results was the neutralisation of the sample.
Adding the sodium hydroxide solution resulted in a significant dilution of the sample (up
to the factor 2). The dilution factor was always a uneven number and not determined fully
accurate which probably lead to an unknown measurement error. This preservation method
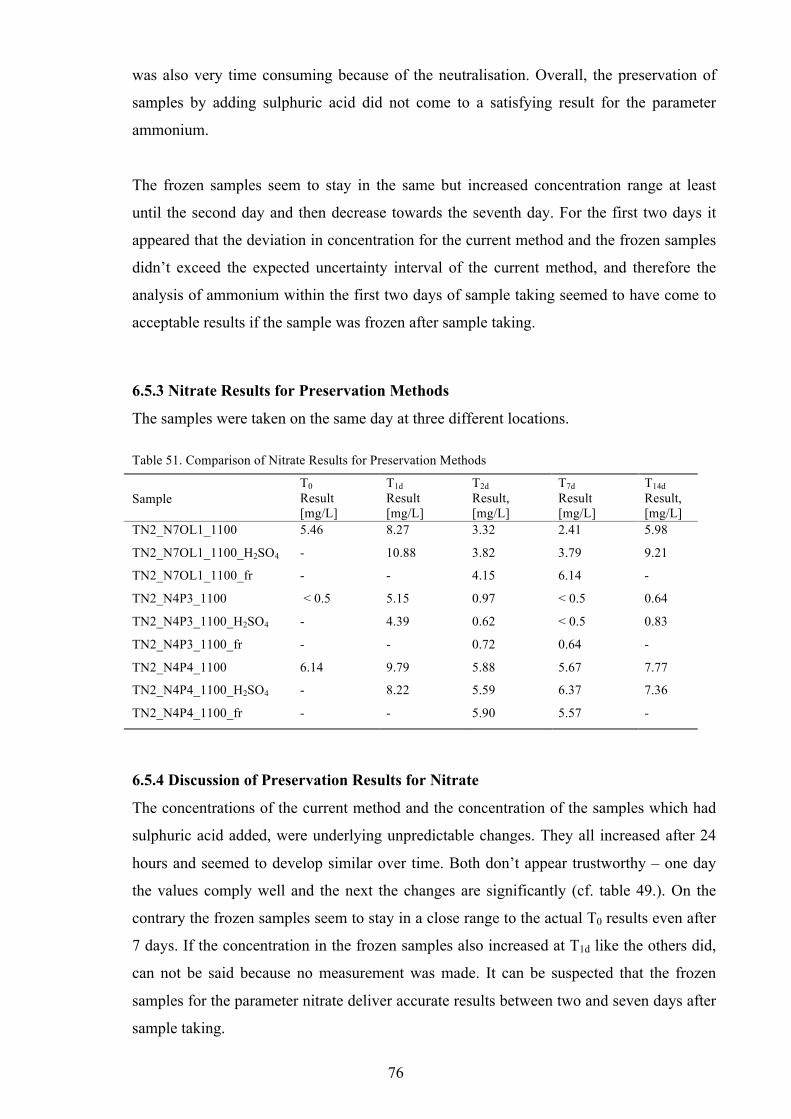
76
Table 51. Comparison of Nitrate Results for Preservation Methods
was also very time consuming because of the neutralisation. Overall, the preservation of
samples by adding sulphuric acid did not come to a satisfying result for the parameter
ammonium.
The frozen samples seem to stay in the same but increased concentration range at least
until the second day and then decrease towards the seventh day. For the first two days it
appeared that the deviation in concentration for the current method and the frozen samples
didn’t exceed the expected uncertainty interval of the current method, and therefore the
analysis of ammonium within the first two days of sample taking seemed to have come to
acceptable results if the sample was frozen after sample taking.
6.5.3 Nitrate Results for Preservation Methods
The samples were taken on the same day at three different locations.
Sample T0 Result [mg/L]
T1d Result [mg/L]
T2d Result, [mg/L]
T7d Result [mg/L]
T14d Result, [mg/L]
TN2_N7OL1_1100 5.46 8.27 3.32 2.41 5.98
TN2_N7OL1_1100_H2SO4 - 10.88 3.82 3.79 9.21
TN2_N7OL1_1100_fr - - 4.15 6.14 -
TN2_N4P3_1100 < 0.5 5.15 0.97 < 0.5 0.64
TN2_N4P3_1100_H2SO4 - 4.39 0.62 < 0.5 0.83
TN2_N4P3_1100_fr - - 0.72 0.64 -
TN2_N4P4_1100 6.14 9.79 5.88 5.67 7.77
TN2_N4P4_1100_H2SO4 - 8.22 5.59 6.37 7.36
TN2_N4P4_1100_fr - - 5.90 5.57 -
6.5.4 Discussion of Preservation Results for Nitrate
The concentrations of the current method and the concentration of the samples which had
sulphuric acid added, were underlying unpredictable changes. They all increased after 24
hours and seemed to develop similar over time. Both don’t appear trustworthy – one day
the values comply well and the next the changes are significantly (cf. table 49.). On the
contrary the frozen samples seem to stay in a close range to the actual T0 results even after
7 days. If the concentration in the frozen samples also increased at T1d like the others did,
can not be said because no measurement was made. It can be suspected that the frozen
samples for the parameter nitrate deliver accurate results between two and seven days after
sample taking.
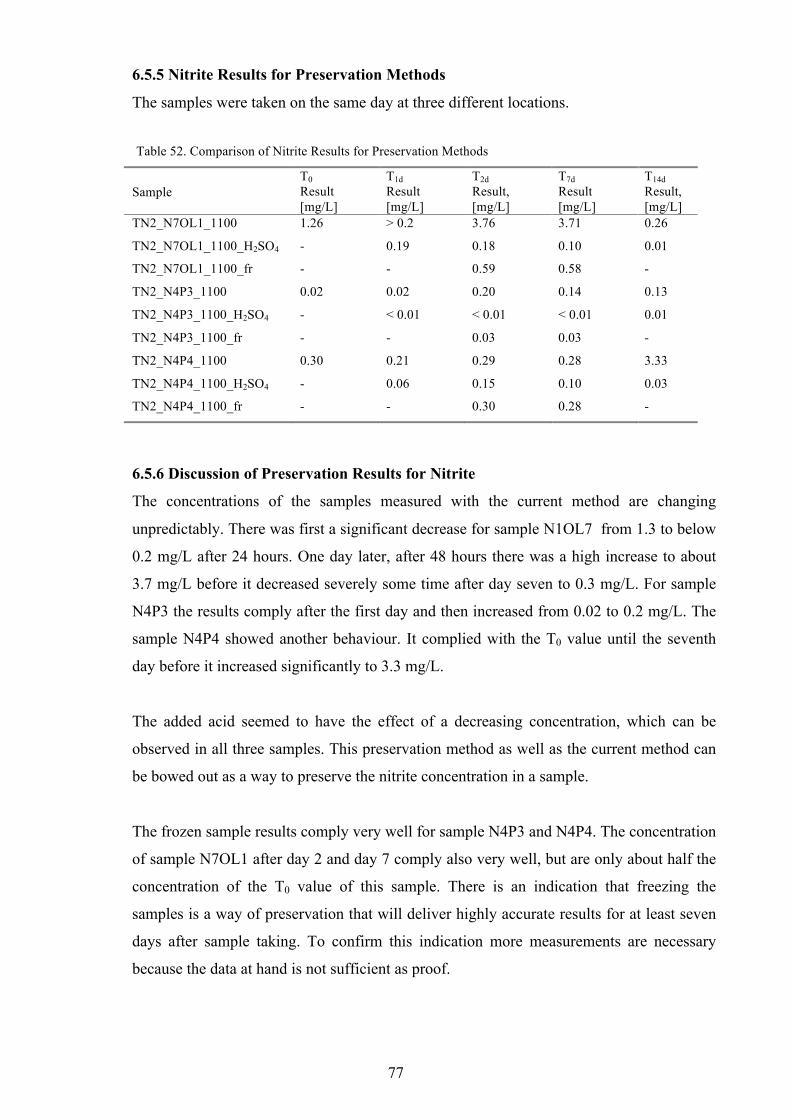
77
Table 52. Comparison of Nitrite Results for Preservation Methods
6.5.5 Nitrite Results for Preservation Methods
The samples were taken on the same day at three different locations.
Sample T0 Result [mg/L]
T1d Result [mg/L]
T2d Result, [mg/L]
T7d Result [mg/L]
T14d Result, [mg/L]
TN2_N7OL1_1100 1.26 > 0.2 3.76 3.71 0.26
TN2_N7OL1_1100_H2SO4 - 0.19 0.18 0.10 0.01
TN2_N7OL1_1100_fr - - 0.59 0.58 -
TN2_N4P3_1100 0.02 0.02 0.20 0.14 0.13
TN2_N4P3_1100_H2SO4 - < 0.01 < 0.01 < 0.01 0.01
TN2_N4P3_1100_fr - - 0.03 0.03 -
TN2_N4P4_1100 0.30 0.21 0.29 0.28 3.33
TN2_N4P4_1100_H2SO4 - 0.06 0.15 0.10 0.03
TN2_N4P4_1100_fr - - 0.30 0.28 -
6.5.6 Discussion of Preservation Results for Nitrite
The concentrations of the samples measured with the current method are changing
unpredictably. There was first a significant decrease for sample N1OL7 from 1.3 to below
0.2 mg/L after 24 hours. One day later, after 48 hours there was a high increase to about
3.7 mg/L before it decreased severely some time after day seven to 0.3 mg/L. For sample
N4P3 the results comply after the first day and then increased from 0.02 to 0.2 mg/L. The
sample N4P4 showed another behaviour. It complied with the T0 value until the seventh
day before it increased significantly to 3.3 mg/L.
The added acid seemed to have the effect of a decreasing concentration, which can be
observed in all three samples. This preservation method as well as the current method can
be bowed out as a way to preserve the nitrite concentration in a sample.
The frozen sample results comply very well for sample N4P3 and N4P4. The concentration
of sample N7OL1 after day 2 and day 7 comply also very well, but are only about half the
concentration of the T0 value of this sample. There is an indication that freezing the
samples is a way of preservation that will deliver highly accurate results for at least seven
days after sample taking. To confirm this indication more measurements are necessary
because the data at hand is not sufficient as proof.
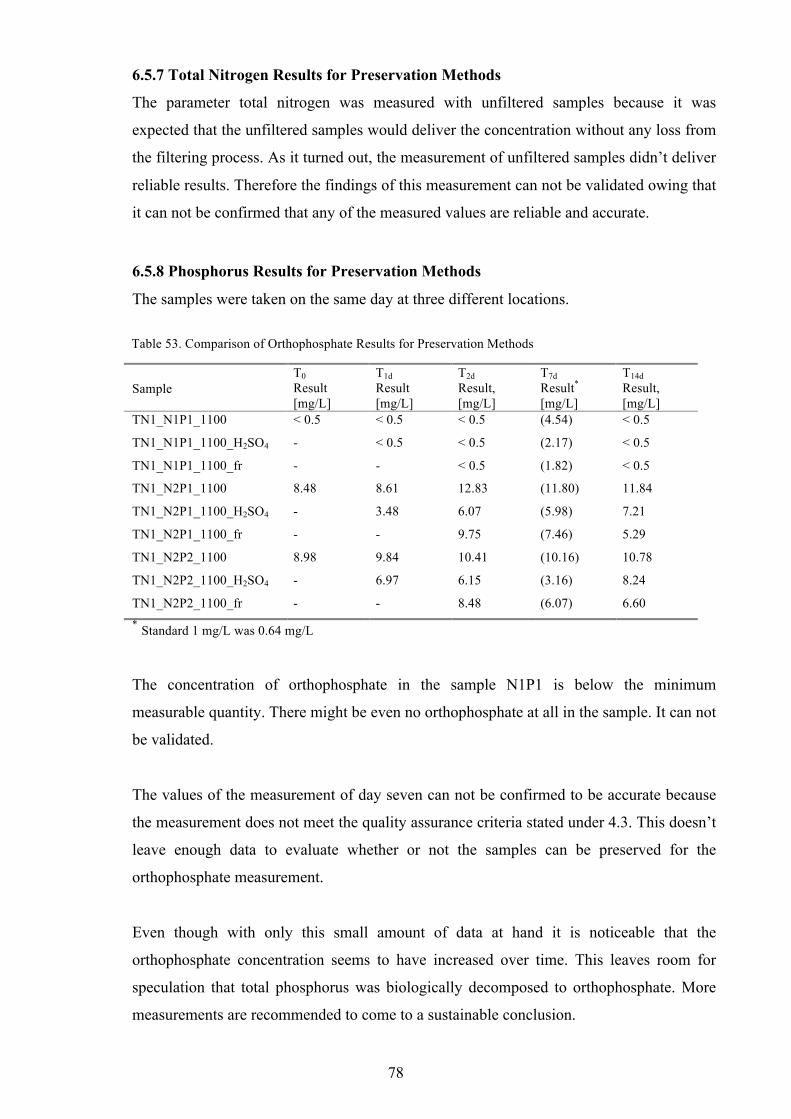
78
Table 53. Comparison of Orthophosphate Results for Preservation Methods
6.5.7 Total Nitrogen Results for Preservation Methods
The parameter total nitrogen was measured with unfiltered samples because it was
expected that the unfiltered samples would deliver the concentration without any loss from
the filtering process. As it turned out, the measurement of unfiltered samples didn’t deliver
reliable results. Therefore the findings of this measurement can not be validated owing that
it can not be confirmed that any of the measured values are reliable and accurate.
6.5.8 Phosphorus Results for Preservation Methods
The samples were taken on the same day at three different locations.
Sample T0 Result [mg/L]
T1d Result [mg/L]
T2d Result, [mg/L]
T7d Result* [mg/L]
T14d Result, [mg/L]
TN1_N1P1_1100 < 0.5 < 0.5 < 0.5 (4.54) < 0.5
TN1_N1P1_1100_H2SO4 - < 0.5 < 0.5 (2.17) < 0.5
TN1_N1P1_1100_fr - - < 0.5 (1.82) < 0.5
TN1_N2P1_1100 8.48 8.61 12.83 (11.80) 11.84
TN1_N2P1_1100_H2SO4 - 3.48 6.07 (5.98) 7.21
TN1_N2P1_1100_fr - - 9.75 (7.46) 5.29
TN1_N2P2_1100 8.98 9.84 10.41 (10.16) 10.78
TN1_N2P2_1100_H2SO4 - 6.97 6.15 (3.16) 8.24
TN1_N2P2_1100_fr - - 8.48 (6.07) 6.60 * Standard 1 mg/L was 0.64 mg/L
The concentration of orthophosphate in the sample N1P1 is below the minimum
measurable quantity. There might be even no orthophosphate at all in the sample. It can not
be validated.
The values of the measurement of day seven can not be confirmed to be accurate because
the measurement does not meet the quality assurance criteria stated under 4.3. This doesn’t
leave enough data to evaluate whether or not the samples can be preserved for the
orthophosphate measurement.
Even though with only this small amount of data at hand it is noticeable that the
orthophosphate concentration seems to have increased over time. This leaves room for
speculation that total phosphorus was biologically decomposed to orthophosphate. More
measurements are recommended to come to a sustainable conclusion.

79
The data available for the evaluation of total phosphorus is likewise not sufficient. The
samples were measured unfiltered. The result for N1P1 at T0 is assumed to be false which
leaves no reference to compare the following measurements with. The measurements on
day 7 and 14 can not be confirmed accurate either because they don’t meet the quality
assurance criteria. Two samples measured on two different days is not enough data to
come to any conclusion.

80
7 Conclusion
The evaluation and validation of the monitoring activity results confirmed all the current
photometric methods used in the laboratory in Tra Noc were suitable. Validating the
methods was problematic as the samples that were taken, can only be seen as grab samples.
No more than two samples from the same location were taken over a period of up to six
weeks. The findings for each parameter at the same locations were sometimes in a close
range to each other and other times, differed severely. The variation in results can be
attributed to various reasons namely:
• The waste water may have been diluted by either heavy rainfall or the tidal influence
of the receiving water bodies. At high tide the water from the Hau River or the
attached channels entered the drainage system.
• The composition of the waste water discharged by the enterprises could have changed
during the course of the day or over time owing to production processes and volume.
• Errors occurred in the analytical process e.g. interchanged samples or outlier
The effect on the concentration due to dilution can be mostly eliminated ase the samples
were taken during the dry season and sampling was postponed on days with heavy rainfall.
The days and times of sample taking were also pre-decided with the projects engineer, who
was monitoring the water levels in the drainage system to minimize tidal influence on the
samples. The change in composition of the waste water remained unknown and it is
therefore difficult to impossible to know whether the findings differed because of the
change in the enterprises discharge or owing to of errors made during analyses.
To ensure that no measurement errors occurred, the plausibility was investigated and
samples were re-evaluated if findings stood out, e.g.:
• significant changes in concentration for one location,
• unusual high or low findings based on experience and
• unplausible findings
The outcome of the investigation of plausibility was consistently positive. Out of the 68
samples measured, only two results of the nitrogen compounds were identified as
unplausible. This equates to 3 % of unplausible results. For the plausibility of phosphorus
compounds one result was confirmed as unplausible. Out of these three unplausible results
81
two were from the same sample N6OL1_1100 which was identified as unreliable. The
plausibility of the results was highly confirmed but doesn’t fully confirm good analytical
practice. The methods accuracy still needs to be investigated.
The problem verifying the accuracy of the methods was, that the samples used were real
samples with an unknown concentration of analyte, and that every sample was only
measured once i.e. no repeated measurements were made.
As a reference point, the coefficient of determination (R2) of the calibration function, as
well as the reference values of the standard and tube test measurements were used. The
coefficient of determination is a measure for the performance of adaptation. Since it is
known that the parameters show a linear behaviour within the calibrated ranges, it can be
said that a high coefficient verifies a high accordance with the regression curve. The
analytical practice aims for a coefficient of 0.999. The coefficients of determination never
fell below 0.995. This is generally a very good result but it can not be attached to much
importance to the coefficient of determination as it still doesn’t reveal the accuracy of the
method. However, it does prove the measurements were made with diligence.
Now, the very good accordant standard measurements also confirm the precise mode of
operation and that the methods, as developed, were delivering reliable results. The state of
accuracy can be investigated by using another already validated method. The nanocolor
tube test kits provided a validated method where the distributer declared an uncertainty of
± 3 %. The outcome of the comparison of the tube test and photometricly measured results
are as follows:
Ammonium: Four tube tests were made and three of them confirmed the photo-
metricly measured values. The fourth tube test result was 9.4 mg/L
compared to 13.2 mg/L.
Nitrate: Only one tube test was made and it confirmed the photometricly
measured value.
Nitrite: Two tube test and they confirmed the photometricly measured
value.
82
Total Nitrogen: Five tube tests were made and three of them confirmed the photo-
metricly measured values. The fourth tube test result was 11.0 mg/L
compare to 14.9 mg/L and the fifth was 4.0 to 8.8 mg/L.
Orthophosphate: Four tube tests were made where three confirmed the photometricly
measured values. The fourth tube test result was 11.1 mg/L
compared to 8.5 mg/L.
Total Phosphorus: Four tube tests were evaluated in which two of them confirmed the
photo- metricly measured values. The third tube test result was 16.2 mg/L
compared to 22.0 mg/L and the forth was 13.1 to 18.8 mg/L.
Between one and five data sets were available for each method to investigate the particular
accuracy. It needs to be mentioned that this was not enough data to allow a final statement.
However, what can be said is that most of the results showed a high accordance. The data
sets that didn’t meet the requirement of a deviation less than 15 % can nevertheless be
considered in the same measurement range. The uncertainty of the photometric methods is
an assumed 15 % but it is also possible that it may be higher, depending on the parameter,
which would explain most of the differing data sets. It is therefore recommended to collect
more data and establish the uncertainty and precision of the methods. More data sets of
tube test and photometric method results (at least 10 per method) including repeated
measurements also need to be compared.
Irrespective of the afore mentioned difficulties none of the measures taken to investigate
the accuracy and reliability of the methods has given reason to doubt that the methods are
nothing but suitable for their purpose. The Author believes if further investigations were
followed, the outcome would be in a good accordance between the validated tube test and
the current laboratory methods.
Within the validation process, the photometric method for the parameter ammonium and
nitrate was compared with ISE measurements. The ISE measurement is not a validated
method and for nitrate, the results of both methods didn’t comply at all. The evaluation
resulted in false ISE determinations because the values didn’t withstand the plausibility
check. For ammonium on the other hand, the results of both methods were in good
accordance, which supports the assumption of the suitability of the current methods.
83
Furthermore, the influence of the sample preparation on the concentration value for all
parameters were investigated. It was suspected that filtering the samples with a membrane
filter results in a loss of concentration for total nitrogen and total phosphorus but not for
ammonium, nitrate, nitrite and orthophosphate. The concentration of suspended solids was
used as a reference to investigate if part of the analyte is bound to particles in the sample
and would be eliminated by filtering.
The evaluation of the measurement of filtered and unfiltered samples showed no indication
that the concentration for ammonium, nitrate, nitrite and orthophosphate would result in a
lower, false concentration. The evaluation of total nitrogen and total phosphorus was
inconclusive. For none of the parameters a relation between the suspended solids and the
gained values could be established. The reason for this purpose might be incorrect
suspended solids results owing to measurement errors during the analysis e.g. the particles
sedimented on the bottom of the container and the sample wasn’t shaken before filtering.
Another reason which most likely has influenced many of the determinations was the
interference of particles with the photometric measurement. A repeated investigation is
recommended. It needs to be ensured that the suspended solids results are reliable by
validating the method and that no particles might influence the photometric measurement.
A suitable digestion for total nitrogen and total phosphorus needs to be determined which
can be found within the DIN norm of the parameter.
The last part that was investigated within the validation process, were preservation
methods, as immediate analysis of the samples wasn’t always possible. The specifics
published by the American Public Health Association, American Water Works Association
and the Water Environment Federation provided the basis for the experimental set up.
Each sample was acidified, kept frozen and refrigerated. It turned out that none of the
recommended preservation methods could be confirmed as reliable to contain any of the
analytes over a longer period of time unchanged in the sample. This does not mean that
preserving samples must be eliminated as invalid. The data determined in this work was
often inconclusive and mostly insufficient. Only three samples were investigated and for
total nitrogen and total phosphorus unfiltered samples were used. The experiments
comparing filtered and unfiltered samples as well as preserving samples took place at the
same time. At this point it was expected that the unfiltered samples would deliver the
correct concentration for total nitrogen and total phosphorus. Unfortunately this could not
84
be confirmed and the unfiltered sample results were proven unreliable. Therefore no
evaluable data was available for these two parameters.
Acidifying the samples appeared to not work for any of the other parameter. For nitrite and
orthophosphate, it confirms the information found in literature that added acid would lead
to changes in the sample. Ammonium and nitrate are supposed to be preservable with
sulphuric acid but this could not be confirmed as the data at hand also did not indicate that
it could. The best results were attained with freezing the samples. The results of
ammonium, nitrate, nitrite and orthophosphate indicated that freezing the sample might
preserve the analyte over days or maybe even weeks. It is recommended to set up a new
investigation using more samples, following meticulously the timeline of analysis and
meeting the refrigerator temperature requirements of 4 ºC instead of the current 6 – 8 ºC.
85
References
1 Can Tho City: http://cantho.gov.vn, 2007 [23.03.2012]
2 Rudolph, Karl-Ulrich; Genthe, Wolfgang; Dong, Pham Huy; Kreuter, Sandra;
Friedrichs, Ferdinand: TP 5 – Development and Operation of a Containerized
Laboratory and Monitoring Concept, Joint Report of the Framework of the Joint
Workshop in Can Tho (29 – 30 November 2011), November 2011
3 Can Tho Export Processing and Industrial Zone Authority (CEPIZA): Report
on Environmental Management of Export Processing and Industrial Zone in Can
Tho. Can Tho People’s Committee. Can Tho, Vietnam, January 2012
4 Pöyry: Program City Development 2008 – Can Tho Wastewater Disposal in
the Tra Noc Industrial Zone. Concept Study Report. Mannheim, Germany. Pöyry
Deutschland GmbH, June 2009
5 QCVN 24:2009/BTNMT: National Technical Regulation on Industrial Wastewater,
Ministry of Natural Resource and Environment, Socialist Republic of Vietnam, 2009
6 GTZ Project Document No. IM – 005: Guideline on Monitoring Indirect Waste
Water discharges into Public Sewer Systems, Ministry of Construction, Hanoi,
October 2011
7 AbwV – Abwasserverordnung: Verordnung über die Anforderungen an das
Einleiten in Gewässer, Bundesministerium für Umwelt, Naturschutz und
Reaktorsicherheit. 2005
8 DWA-M 115-2: Indirekteinleitung nicht häuslichen Wassers. Teil 2:
Anforderungen. DWA Deutsche Vereinigung für Wasserwirtschaft, Abwasser und
Abfall e.V., Germany, 2005
9 Senatsverwaltung für Stadtentwicklung und Umwelt: Hinweisblatt zur
Eigenüberwachung von Abwasseranlagendurch akkreditierte Laboratorien
(Direkteinleiter)
10 Klaus Riedel, Klaus; Kunze, Gotthard; König, Andreas: Biosensoren für die
Umweltkontrolle, Oldenbourg Industrieverlag, 2003
11 Jaeger, Dieter: Applied Limnology, Hamburg University of Applied Sciences, 2008
86
12 Kläranlagen Vergleich: http://www.klaeranlagenvergleich.de/wordpress
/2008/10/06/was-ist-der-bsb/ [29.04.2012]
13 Blohm, Werner: Physikalisch-chemische Messgrößen – Messung von gelöstem4
Sauerstoff, Hamburg University of Applied Sciences, 2012
14 Eduthek: http://www.chf.de/eduthek/chemischer-index5.html [05.05.2012]
15 Wheeling Jesuit University: http://www.cotf.edu/ete/modules/waterq3
/WQassess3e.html, [20.04.2012]
16 Hydrologie und Wasserwirtschaft: Eine Einführung für Ingenieure, Springer
Verlag, 6. Edition, 2010
17 Wiegel, Simone: Einfluss der Temperatur auf die Ammoniakoxidantenpopulation
eines Biofilmreaktors und auf Reinkulturen von Nitrosomonas Eutropha, 2002
18 Sölter, Kirsten; Weber Norbert: Die Bedeutung der Säurekapazität auf
Kläranlagen, August 2010
19 Wasser Wissen: http://www.wasser-wissen.de/abwasserlexikon/l/leitfaehigkeit.htm
[07.05.2012]
20 Universität Erlangen: http://www.angewandte-geologie.geol.uni
erlangen.de/paramete.htm [05.05.2012]
21 Normative Document: Standard Methods, LAR Laboratory, Tra Noc, Vietnam, 2011
22 DIN 38406-5: Deutsche Einheitsverfahren zur Wasser-, Abwasser- und
Schlammuntersuchung - Kationen (Gruppe E) - Bestimmung des Ammonium-
Stickstoffs (E5), DIN Deutsches Institut für Normung e.V. Berlin, Germany.
October 1983
23 Academic Dictionaries and Encyclopedia: http://de.academic.ru/dic.nsf/dewi
ki/162732 [05.09.2012]
24 DIN 38405-9: Deutsche Einheitsverfahren zur Wasser-, Abwasser- und
Schlammuntersuchung - Anionen (Gruppe D) - Photometrische Bestimmung von
Nitrat (D9), DIN Deutsches Institut für Normung e.V. Berlin, Germany. August 2010
25 DIN EN 26777: Wasserbeschaffenheit - Bestimmung von Nitrit -Spektrometrisches
Verfahren, DIN Deutsches Institut für Normung e.V. Berlin, Germany, April 1993
87
26 DIN EN ISO 6878: Wasserbeschaffenheit – Bestimmung von Phosphor –
Photometrisches Verfahren mittles Ammoniummolybdate, DIN Deutsches Institut
für Normung e.V. Berlin, Germany, September 2004
27 Academic Dictionaries and Encyclopedia: http://de.academic.ru/dic.nsf/de
wiki/1105839 [05.09.2012]
28 Lindner, Helmut: Physik für Ingenieure, Carl Hanser Verlag, 17. Edition, 2006
29 Ellison, S.; Rosslein, M.; Williams, A.: Quantifying Uncertainty in Analyteical
Measurement. Eurachem/Citac, 2000
30 Leiterer, Matthias: Validierung von Untersuchungsmethoden in der analyteischen
Praxis, Thüringer Landesanstalt für Landwirtschaft, June 2008
31 Huber, Ludwig: Validation and Qualification in Analyteical Laboratories, Informa,
2007
32 NH3 Selektive Elektroden: Methrom Handbuch 8.109.8031DE
33 Platen, Harald: Ionenselektive Elektroden, Fachhochschule Gießen-Friedberg, 2007
34 American Public Health Association, American Water Works Association
Water Environment Federation: Standard Methods for the Examination of
Water and Wastewater, 20. Edition, 1999

88
Appendix (see CD-ROM)
I. Calibrations
II. Evaluation Monitoring Activities 2012
III. Evaluation Experiment 1_ISE
IV. Evaluation Experiment 2_filtered/unfiltered Samples
V. Evaluation Experiment 3_Preservation Methods

89
Author’s Declaration of Originality I hereby certify that I am the sole author of this work. I certify that, to the best of my
knowledge, my work does not infringe upon anyone’s copyright nor violate any
proprietary rights and that any ideas, techniques, quotations, or any other material from the
work of other people included in my work, published or otherwise, are fully acknowledged
in accordance with the standard referencing practices.
Place, Date Signature