Embed Size (px)
Citation preview
Babayigit, S. (2015) The dimensions of written expression: Languagegroup and gender differences. Learning and Instruction, 35. pp. 33-41. ISSN 0959-4752 Available from: http://eprints.uwe.ac.uk/24435
We recommend you cite the published version.The publisher’s URL is:http://dx.doi.org/10.1016/j.learninstruc.2014.08.006
Refereed: Yes
NOTICE: this is the author?s version of a work that was accepted for publica-tion in Learning and Instruction. Changes resulting from the publishing process,such as peer review, editing, corrections, structural formatting, and other qual-ity control mechanisms may not be reflected in this document. Changes mayhave been made to this work since it was submitted for publication. A definitiveversion was subsequently published in Learning and Instruction, ?35, (February2015)? DOI: 10.1016/j.learninstruc.2014.08.006
Disclaimer
UWE has obtained warranties from all depositors as to their title in the materialdeposited and as to their right to deposit such material.
UWE makes no representation or warranties of commercial utility, title, or fit-ness for a particular purpose or any other warranty, express or implied in respectof any material deposited.
UWE makes no representation that the use of the materials will not infringeany patent, copyright, trademark or other property or proprietary rights.
UWE accepts no liability for any infringement of intellectual property rightsin any material deposited but will remove such material from public view pend-ing investigation in the event of an allegation of any such infringement.
PLEASE SCROLL DOWN FOR TEXT.
1
DIMENSIONS OF WRITTEN EXPRESSION
Published: Babayiğit, S. (2015). The dimensions of written expression: Language group and
gender differences. Learning and Instruction, 35(0), 33-41. doi:
http://dx.doi.org/10.1016/j.learninstruc.2014.08.006
The Dimensions of Written Expression: Language Group and Gender Differences
2
DIMENSIONS OF WRITTEN EXPRESSION
Abstract
This study compared the written expression of 159 English-speaking first (L1) and second
language (L2) learners (M age = 9; 7 years, SD = 3.63 months) in the UK. The L1 learners
outperformed their L2 peers on the four dimensions of written expression, namely holistic
quality, written vocabulary, organisational quality, and compositional fluency. Girls also
outperformed boys on all dimensions, except for organisation. The interaction between
language group and gender was nonsignificant, but there was a trend for the language group
differences to be larger for boys. Vocabulary, organisation, and compositional fluency made
unique contributions to holistic quality in both language groups and the strength of these
relations were relatively comparable across the L1 and L2 groups. Educational implications
are discussed.
Key words: English as a second language, text writing, compositional fluency, spelling,
multigroup path analysis
3
DIMENSIONS OF WRITTEN EXPRESSION
The Dimensions of Written Expression: Language Group and Gender Differences
1. Introduction
Meeting the needs of learners from diverse ethnic and language backgrounds remains
one of the major challenges facing education professionals today. This is perhaps most
clearly exemplified by reports indicating that minority language learners who speak a
language other than the instructional language at home are more at risk of underachievement
in reading comprehension and writing (National Assessment of Educational Progress
[NAEP], 2011; Statistical First Release [SFR], 2011). There are about one million (15%)
school age minority language learners in England (SFR, 2012c) and based on the current
trends, it can be projected that in ten years’ time almost one quarter of all school age children
will speak a language other than English. Thus far, most research on minority language
learners has focused on reading; with the exception of a notable few (e.g., Cameron &
Besser, 2004), there is a dearth of studies comparing first (L1) and second language (L2)
learners’ written expression. Hence, we lack an understanding of how L2 learners perform on
different dimensions of written expression and how aspects of their written expression
contribute to their overall writing quality. Additionally, there is some evidence that L2 boys
from low socioeconomic status (SES) backgrounds might be more at risk of
underachievement in writing skills (Cameron & Besser, 2004). However, the research
evidence on gender differences in writing is far from conclusive (Jones & Myhill, 2007;
Peterson & Parr, 2012), and it remains to be clarified whether L2 boys are more at risk of low
writing achievement. The primary goal of the current study is to address these gaps in the
literature by examining the written expression of both L1 and L2 learners.
1.1. Language group differences in written expression
4
DIMENSIONS OF WRITTEN EXPRESSION
Most research on L2 writing tends to focus on older age groups who speak English as
a foreign language and involves the psycholinguistic analysis of the writing processes of
students in their first and second languages (for an overview, see Wolff, 2000). There are also
others that have examined the cross-linguistic interactions in the written discourse of children
(Berman & Verhoeven, 2002; Fitzgerald, 2006; Zecker, 2004). However, research on
minority language learners, who tend to have little or no literacy skills in their home
languages and who are learning to write in a second language (e.g., English) which is also the
language of instruction, is highly limited at this time (Lesaux, Geva, Koda, Siegel, &
Shanahan, 2006).
Cameron and Besser’s (2004) seminal study remains the most comprehensive study
conducted on L2 learners’ writing in the UK. The authors examined two writings (one fiction
and one persuasive) of 138 L2 and 126 L1 learners produced for the national attainment tests
at the end of primary school (about 11 years of age). The L2 sample was very heterogeneous
and mostly composed of learners from Indian, Pakistani, Black African, Chinese, and
Bangladeshi heritage. Most L2 learners had been living in the UK for at least five years.
Cameron and Besser (2004) found that the L2 achievement gap on the national writing test
was nine percentage points. The follow-up analysis revealed no language group differences in
spelling accuracy levels. This was in accordance with the reports that L2 learners tend to
underperform on overall writing quality but their spelling accuracy level tends to be
comparable to that of their L1 peers (Babayiğit, 2013; Lesaux et al., 2006). Cameron and
Besser’s (2004) linguistic analysis of the scripts revealed that the L2 learners tended to make
more grammatical mistakes than their L1 peers (e.g., in the use of prepositions and articles)
and were less likely to use complex grammatical structures (e.g., adverbs, sentences with
multiple clauses). Similar findings have been reported with 8-10 year old Turkish-Dutch
speaking learners (Verheyden, Van den Branden, Rijlaarsdam, Van den Bergh, & De Maeyer,
5
DIMENSIONS OF WRITTEN EXPRESSION
2010). The children were asked to retell a comic strip story through writing in Dutch.
Relative to their monolingual Dutch speaking peers, the Turkish-Dutch speaking learners
were found to make more syntactic mistakes in their writings. Together these studies
highlight that weaknesses in sentence structure and grammatical accuracy may undermine the
L2 learners’ overall text quality.
The quality of written vocabulary, often assessed in terms of the appropriate choice of
words and diversity, is another important dimension of written expression that influences text
quality. Cameron and Besser (2004) did not find any language group differences in the
quality of written vocabulary and Verheyden et al. (2010) did not assess the vocabulary
dimension of children’s written text. Hence, given the paucity of studies, we do not know
whether L2 learners’ written vocabulary differs from that of their L1 peers. We also do not
know which dimensions of written expression contribute to the overall writing quality in L2
learners and whether the pattern of these relations is comparable across the L1 and L2 groups.
For instance, in a study with predominantly L1 learners, Olinghouse and Leaird (2009) found
that the diversity of written vocabulary along with compositional fluency (total number of
written words) were the strongest predictors of children’s overall writing quality. To date, no
study has examined these relationships with L2 learners.
1.2. Gender differences in written expression
The reports on the national attainment tests of writing achievement indicate a
relatively stable gender gap in favour of girls (NAEP, 2011; SFR, 2011, 2012b). By contrast,
the findings from research studies have been mixed (e.g., Jewell & Malecki, 2005; Jones &
Myhill, 2007; Malecki & Jewell, 2003; Olinghouse, 2008; Peterson & Parr, 2012; Stainthorp
& Rauf, 2009; Troia, Harbaugh, Shankland, Wolbers, & Lawrence, 2012; Williams & Larkin,
2012). For instance, Olinghouse (2008) found that girls outperformed boys on the measures
6
DIMENSIONS OF WRITTEN EXPRESSION
of both compositional fluency and quality. Likewise, Malecki and Jewell (2003) found that
girls outperformed boys on all dimensions of written expression including compositional
fluency and spelling accuracy among children from early to middle primary grade levels. Trio
et al. (2012) reported similar gender gaps in favour of girls with children from about 8 to 16
years of age. Cameron and Besser (2004) did not formally test gender differences in L1 and
L2 written expression. Nonetheless, their report also indicates a tendency of more girls to
obtain higher scores in writing in both L1 and L2 groups. Moreover, they found that the L2
achievement gap in writing was slightly larger for boys than girls: whereas the writing
achievement gap between L1 and L2 boys was 12 percentage points, that for L1 and L2 girls
was 9 percentage points. However, not all studies have found a gender difference in writing
quality (e.g., Jones & Myhill, 2007; Williams & Larkin, 2012). For instance, Myhill and
Jones (2007) tested adolescents between 11-18 years of age and found no evidence to suggest
that boys’ writing quality was poorer than that of their girl peers. Similar results were
reported by William and Larkin (2012) with younger children aged between 8 and 11 years.
Nonetheless, both studies reported that the girls wrote longer texts than the boys did.
Numerous explanations have been proffered for these seemingly contradictory
findings, including the large variation of performance within each gender group (Jones &
Myhill, 2007), a possible mismatch between the boys’ writing style and curricular
expectations that may put boys at a disadvantage in national attainment tests of writing (for
reviews, see Jones, 2012; Peterson & Parr, 2012), and gender differences in beliefs about
writing and motivations (Pajares & Valiante, 2001; Troia et al., 2012). Whatever the reasons
might be, the gender gap is not considered problematic, as it has not contributed to academic
underachievement or socioeconomic disadvantage for boys in general (Jones & Myhill,
2007). However, this is not the case for certain ethnic minority boys from low SES
backgrounds. For instance, Spanish-English speaking Hispanic children constitute the largest
7
DIMENSIONS OF WRITTEN EXPRESSION
group of L2 learners in the US who also tend to come from predominantly low SES
backgrounds (Wight, Chau, & Aratani, 2010). The low literacy achievement has been
implicated as one of the primary factors that put Hispanic boys more at risk of academic
underachievement and poor vocational prospects (for a review, see Goldenberg, Reese, &
Rezaei, 2011). Therefore, some have posited that the study of gender differences in literacy
levels should take place within the wider context of ethnic and SES group differences
(Hansen & Jones, 2011; Mead, 2006).
The gaps outlined in the literature provide the rationale for this study. The written
expression of L1 and L2 learners was examined at four levels: written vocabulary,
organisation, compositional fluency, and overall holistic quality. There were two main
research questions. The first research question concerned the extent to which the performance
on the dimensions of written expression was moderated by language group and gender. Here,
the main interest was to examine to what extent there was an L2 disadvantage in written
expression and to what extent L2 boys were more at risk of underperformance on writing.
The second question related to what degree the contributions of written vocabulary,
compositional fluency, and organisation to the overall writing quality were invariant
(equivalent) across the L1 and L2 learners. Thereby, the study sought to examine whether the
aspects of written expression played a comparable or differential role in the overall writing
quality of the two language groups.
2. Method
2.1. Participants
The participants were 89 L1 (42 males and 47 females; mean age = 115.4 months, SD
= 3.71 months, range = 109 - 122 months) and 70 L2 (35 males and 35 females; mean age =
115.4 months, SD = 3.55 months, range = 108 - 121 months) learners at Year 5. The L1 and
8
DIMENSIONS OF WRITTEN EXPRESSION
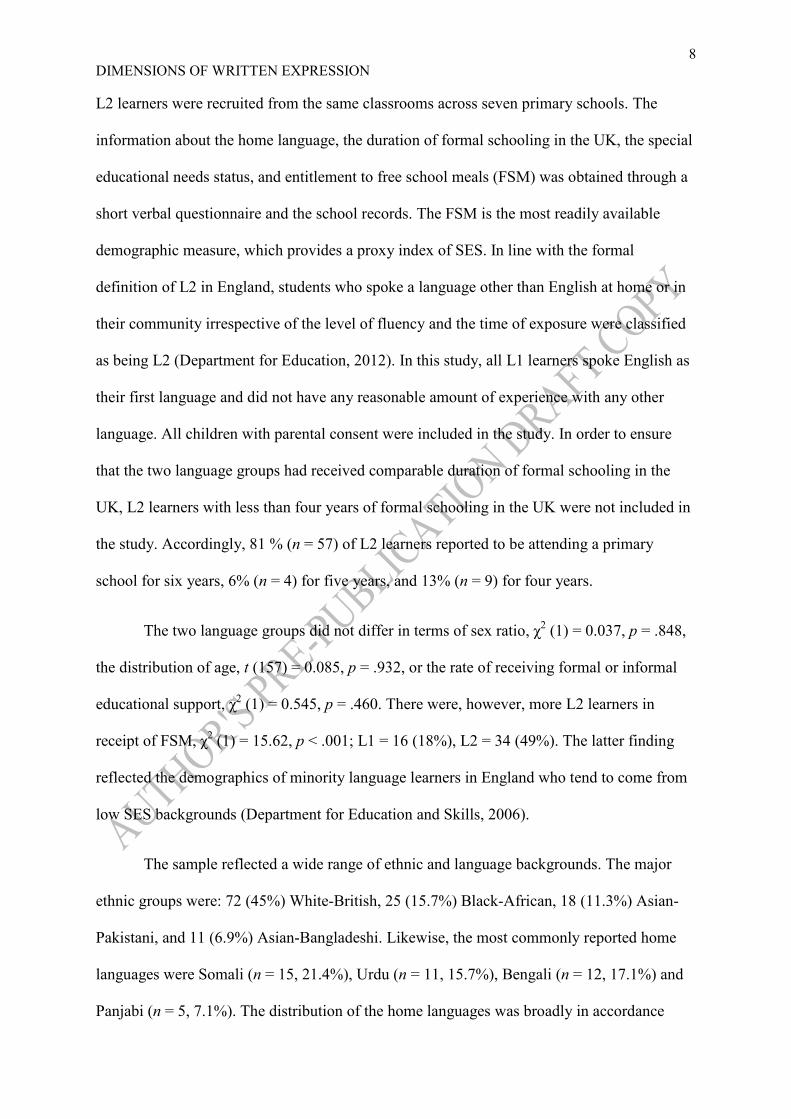
L2 learners were recruited from the same classrooms across seven primary schools. The
information about the home language, the duration of formal schooling in the UK, the special
educational needs status, and entitlement to free school meals (FSM) was obtained through a
short verbal questionnaire and the school records. The FSM is the most readily available
demographic measure, which provides a proxy index of SES. In line with the formal
definition of L2 in England, students who spoke a language other than English at home or in
their community irrespective of the level of fluency and the time of exposure were classified
as being L2 (Department for Education, 2012). In this study, all L1 learners spoke English as
their first language and did not have any reasonable amount of experience with any other
language. All children with parental consent were included in the study. In order to ensure
that the two language groups had received comparable duration of formal schooling in the
UK, L2 learners with less than four years of formal schooling in the UK were not included in
the study. Accordingly, 81 % (n = 57) of L2 learners reported to be attending a primary
school for six years, 6% (n = 4) for five years, and 13% (n = 9) for four years.
The two language groups did not differ in terms of sex ratio, χ2 (1) = 0.037, p = .848,
the distribution of age, t (157) = 0.085, p = .932, or the rate of receiving formal or informal
educational support, χ2 (1) = 0.545, p = .460. There were, however, more L2 learners in
receipt of FSM, χ2 (1) = 15.62, p < .001; L1 = 16 (18%), L2 = 34 (49%). The latter finding
reflected the demographics of minority language learners in England who tend to come from
low SES backgrounds (Department for Education and Skills, 2006).
The sample reflected a wide range of ethnic and language backgrounds. The major
ethnic groups were: 72 (45%) White-British, 25 (15.7%) Black-African, 18 (11.3%) Asian-
Pakistani, and 11 (6.9%) Asian-Bangladeshi. Likewise, the most commonly reported home
languages were Somali (n = 15, 21.4%), Urdu (n = 11, 15.7%), Bengali (n = 12, 17.1%) and
Panjabi (n = 5, 7.1%). The distribution of the home languages was broadly in accordance
9
DIMENSIONS OF WRITTEN EXPRESSION
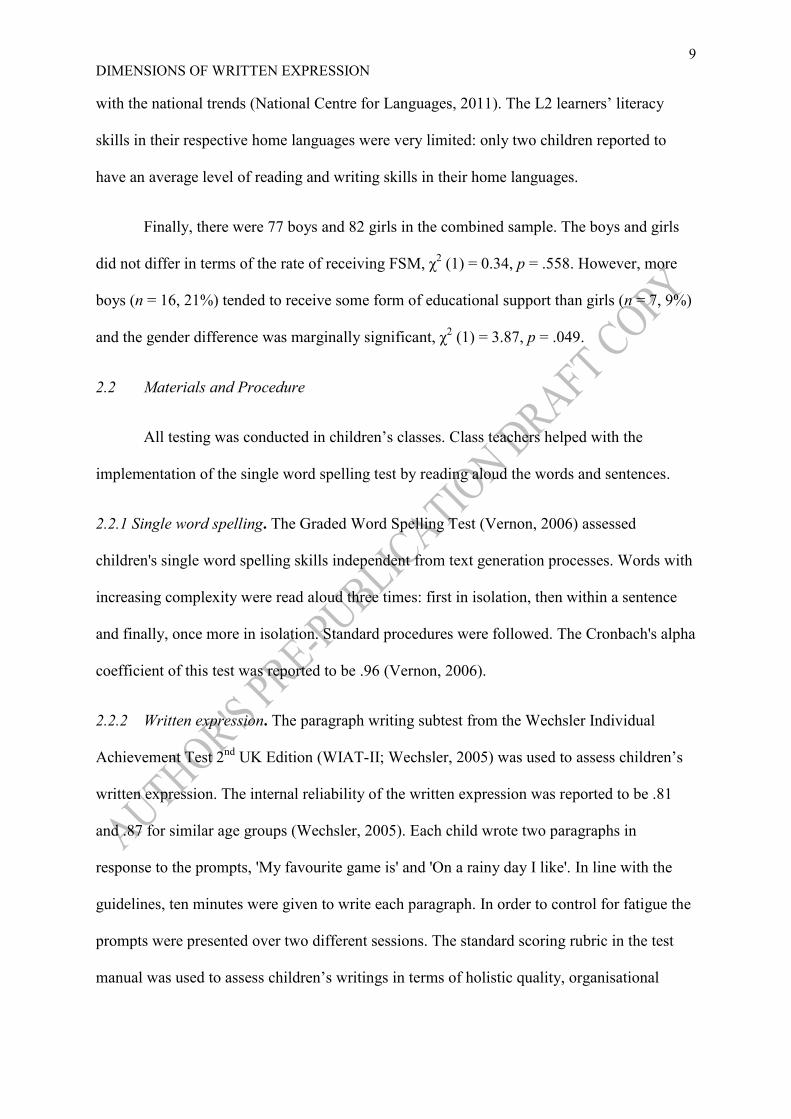
with the national trends (National Centre for Languages, 2011). The L2 learners’ literacy
skills in their respective home languages were very limited: only two children reported to
have an average level of reading and writing skills in their home languages.
Finally, there were 77 boys and 82 girls in the combined sample. The boys and girls
did not differ in terms of the rate of receiving FSM, χ2 (1) = 0.34, p = .558. However, more
boys (n = 16, 21%) tended to receive some form of educational support than girls (n = 7, 9%)
and the gender difference was marginally significant, χ2 (1) = 3.87, p = .049.
2.2 Materials and Procedure
All testing was conducted in children’s classes. Class teachers helped with the
implementation of the single word spelling test by reading aloud the words and sentences.
2.2.1 Single word spelling. The Graded Word Spelling Test (Vernon, 2006) assessed
children's single word spelling skills independent from text generation processes. Words with
increasing complexity were read aloud three times: first in isolation, then within a sentence
and finally, once more in isolation. Standard procedures were followed. The Cronbach's alpha
coefficient of this test was reported to be .96 (Vernon, 2006).
2.2.2 Written expression. The paragraph writing subtest from the Wechsler Individual
Achievement Test 2nd
UK Edition (WIAT-II; Wechsler, 2005) was used to assess children’s
written expression. The internal reliability of the written expression was reported to be .81
and .87 for similar age groups (Wechsler, 2005). Each child wrote two paragraphs in
response to the prompts, 'My favourite game is' and 'On a rainy day I like'. In line with the
guidelines, ten minutes were given to write each paragraph. In order to control for fatigue the
prompts were presented over two different sessions. The standard scoring rubric in the test
manual was used to assess children’s writings in terms of holistic quality, organisational
10
DIMENSIONS OF WRITTEN EXPRESSION
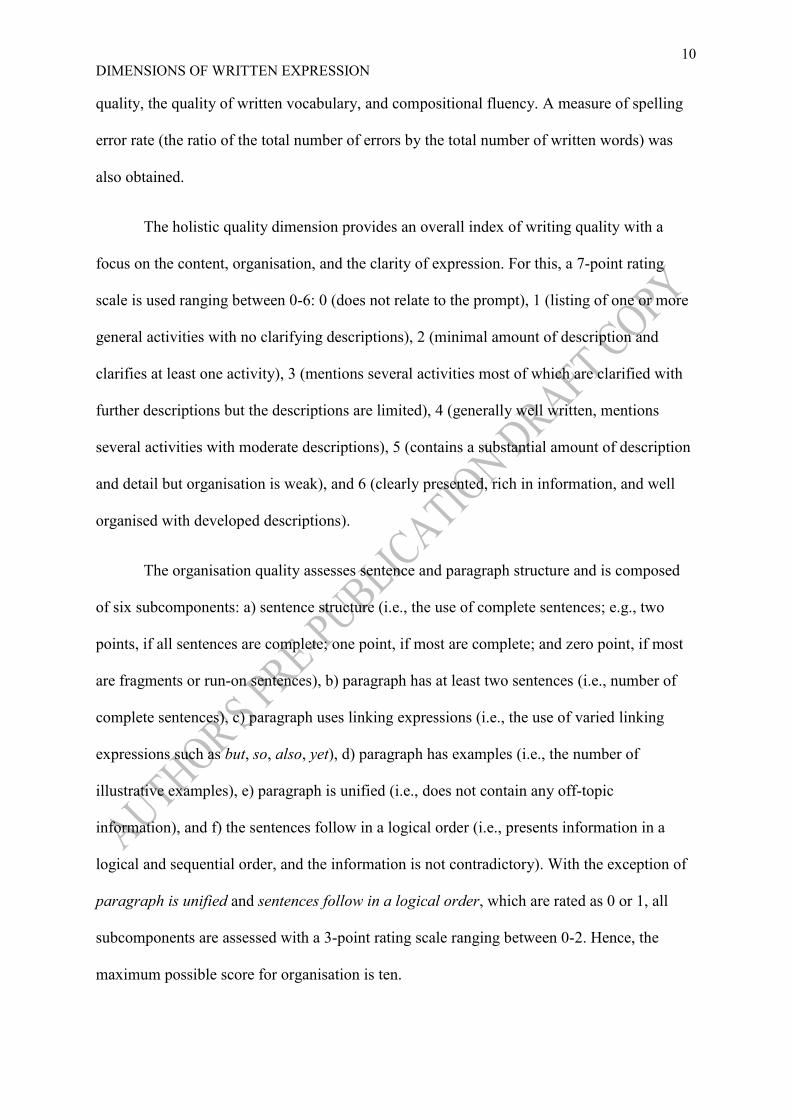
quality, the quality of written vocabulary, and compositional fluency. A measure of spelling
error rate (the ratio of the total number of errors by the total number of written words) was
also obtained.
The holistic quality dimension provides an overall index of writing quality with a
focus on the content, organisation, and the clarity of expression. For this, a 7-point rating
scale is used ranging between 0-6: 0 (does not relate to the prompt), 1 (listing of one or more
general activities with no clarifying descriptions), 2 (minimal amount of description and
clarifies at least one activity), 3 (mentions several activities most of which are clarified with
further descriptions but the descriptions are limited), 4 (generally well written, mentions
several activities with moderate descriptions), 5 (contains a substantial amount of description
and detail but organisation is weak), and 6 (clearly presented, rich in information, and well
organised with developed descriptions).
The organisation quality assesses sentence and paragraph structure and is composed
of six subcomponents: a) sentence structure (i.e., the use of complete sentences; e.g., two
points, if all sentences are complete; one point, if most are complete; and zero point, if most
are fragments or run-on sentences), b) paragraph has at least two sentences (i.e., number of
complete sentences), c) paragraph uses linking expressions (i.e., the use of varied linking
expressions such as but, so, also, yet), d) paragraph has examples (i.e., the number of
illustrative examples), e) paragraph is unified (i.e., does not contain any off-topic
information), and f) the sentences follow in a logical order (i.e., presents information in a
logical and sequential order, and the information is not contradictory). With the exception of
paragraph is unified and sentences follow in a logical order, which are rated as 0 or 1, all
subcomponents are assessed with a 3-point rating scale ranging between 0-2. Hence, the
maximum possible score for organisation is ten.
11
DIMENSIONS OF WRITTEN EXPRESSION
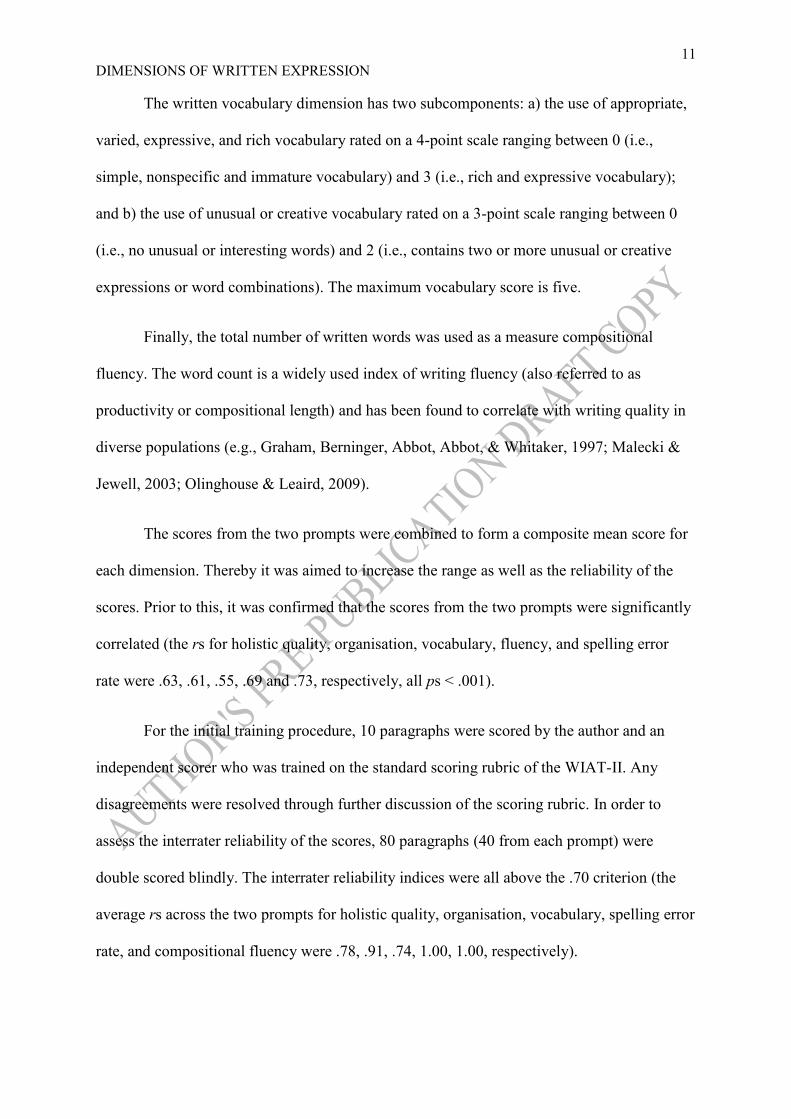
The written vocabulary dimension has two subcomponents: a) the use of appropriate,
varied, expressive, and rich vocabulary rated on a 4-point scale ranging between 0 (i.e.,
simple, nonspecific and immature vocabulary) and 3 (i.e., rich and expressive vocabulary);
and b) the use of unusual or creative vocabulary rated on a 3-point scale ranging between 0
(i.e., no unusual or interesting words) and 2 (i.e., contains two or more unusual or creative
expressions or word combinations). The maximum vocabulary score is five.
Finally, the total number of written words was used as a measure compositional
fluency. The word count is a widely used index of writing fluency (also referred to as
productivity or compositional length) and has been found to correlate with writing quality in
diverse populations (e.g., Graham, Berninger, Abbot, Abbot, & Whitaker, 1997; Malecki &
Jewell, 2003; Olinghouse & Leaird, 2009).
The scores from the two prompts were combined to form a composite mean score for
each dimension. Thereby it was aimed to increase the range as well as the reliability of the
scores. Prior to this, it was confirmed that the scores from the two prompts were significantly
correlated (the rs for holistic quality, organisation, vocabulary, fluency, and spelling error
rate were .63, .61, .55, .69 and .73, respectively, all ps < .001).
For the initial training procedure, 10 paragraphs were scored by the author and an
independent scorer who was trained on the standard scoring rubric of the WIAT-II. Any
disagreements were resolved through further discussion of the scoring rubric. In order to
assess the interrater reliability of the scores, 80 paragraphs (40 from each prompt) were
double scored blindly. The interrater reliability indices were all above the .70 criterion (the
average rs across the two prompts for holistic quality, organisation, vocabulary, spelling error
rate, and compositional fluency were .78, .91, .74, 1.00, 1.00, respectively).
12
DIMENSIONS OF WRITTEN EXPRESSION
Handwriting legibility as well as surface features of punctuation and capitalisation
errors may influence the content related quality ratings (i.e., holistic quality, vocabulary, and
organisation) of the written paragraph. Therefore, further checks were conducted by blind re-
marking of 44 of paragraphs, which were typed and corrected for any spelling or punctuation
errors, such as capitalisation. This gave an average interrater agreement of 98% on holistic
quality, organisation, and vocabulary. Together, these findings provided support for the
reliability of the writing scores.
3. Results
3.1 Descriptive statistics and preliminary considerations
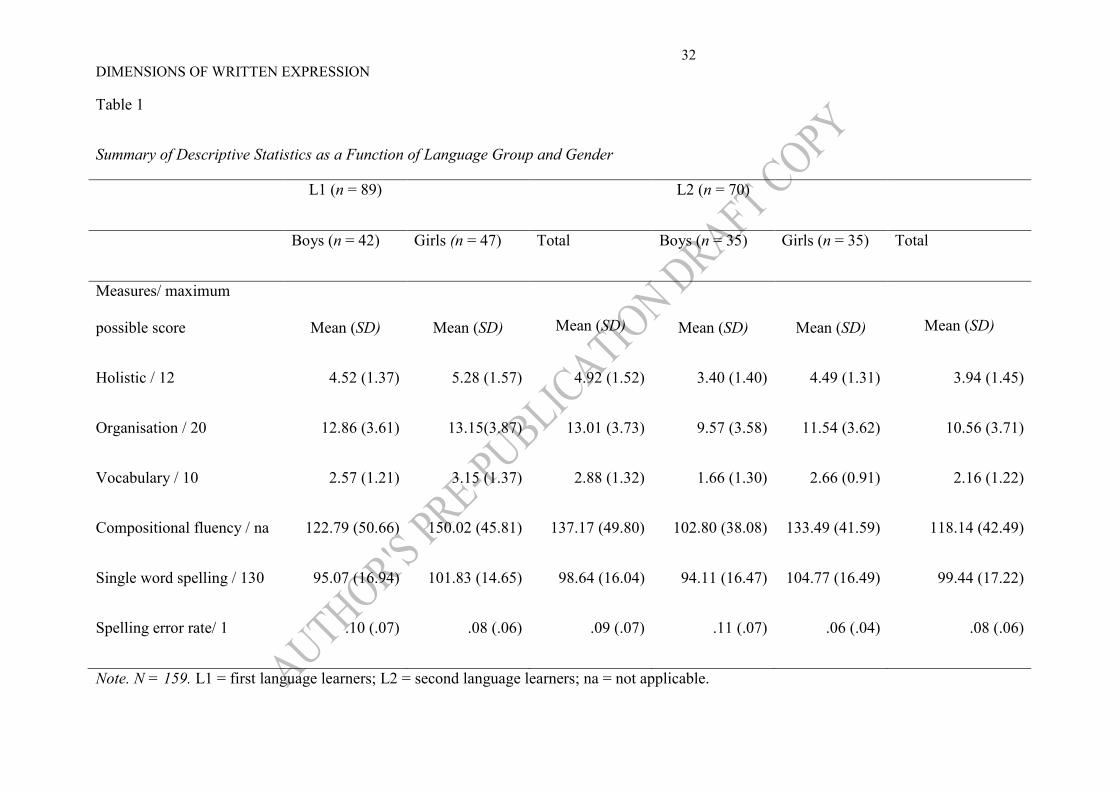
Table 1 shows a summary of the descriptive statistics as a function of language group
and gender. The diagnostic tests confirmed that there were no significant outliers or skews
and that the distribution of the scores was normal on all measures except those for spelling
error rate: L1 Z spelling error rate = 5.50 and L2 Z spelling error rate = 6.32, all ps < .001. A logarithm
10 transformation of the scores remedied the skewed distribution and the resultant spelling
error rate scores were multiplied by -1 to facilitate the interpretation of the results, such that
higher positive scores suggested better performance. Hence, hereafter, spelling error rate is
referred to as spelling accuracy rate. There was no violation of the assumptions of the
analysis of variance tests (e.g., the distributions of the scores on the dependent variables were
normal and the variances across the groups were homogeneous).
[Table 1 about here]
3.2 Language group and gender differences
Preliminary analysis indicated that including age and FSM in the analysis of variance
tests did not change any of the results. Therefore, these two measures were excluded to
simplify the reported results and improve the statistical power of the analysis. Likewise,
13
DIMENSIONS OF WRITTEN EXPRESSION
excluding children with special educational needs from the data analysis did not change the
reported gender differences confirming that the gender differences in the rate of special
educational needs did not bias the results. For this reason and to maintain the sample size,
learners with special educational needs were retained in the analyses. Finally, Cohen’s
criteria was employed to evaluate the effect sizes. Accordingly, the eta squared (η 2) values at
or above .01, .06 and .14 suggest small, medium, and large effect sizes, respectively (Cohen,
1988).
Spelling is a powerful predictor of writing quality in primary grades (Graham, et al.,
1997) and may have implications for the comparison of the language group and gender
differences on the dimensions of written expression. For this reason, the spelling accuracy
levels of the groups were examined first with a two-factor univariate analysis of variance test.
There was a significant main effect of gender in favour of girls on both spelling measures,
F(1, 155) single-word spelling = 11.47, MSE = 2966.87, p = .001, ηp 2 = .069 and F Spelling accuracy rate
(1, 155) = 9.46, MSE = 1.14, p = .002, ηp2 = .058. There was no statistically significant effect
of language group or interaction between language group and gender on either spelling
measures, all ps > .05.
Next, a 2 (language group) x 2 (gender) multivariate analysis of covariance was
conducted to examine the language group and gender differences on the dimensions of
written expression (viz., holistic quality, organisation, vocabulary, and compositional
fluency). The single word spelling accuracy, which examined spelling skills independent of
the writing processes, was included in the analysis as a covariate to control for gender
differences in spelling levels. The main effects of language group and gender were
statistically significant, Wilks' Λ = 0.833, F (4, 151) = 7.56, p < .001, multivariate ηp2 = .167
and Wilks' Λ = 0.894, F (4, 151) = 4.46, p = .002, multivariate ηp2 = .106, respectively. The
14
DIMENSIONS OF WRITTEN EXPRESSION
interaction between language group and gender was not significant, Wilks' Λ = 0.986, F (4,
151) = .553, p =.697, multivariate ηp2 = .014.
Follow-up analyses indicated that the L1 learners scored higher than their L2 peers on
the measures of holistic quality, organisation, vocabulary, and compositional fluency. The
magnitude of the language group differences was mostly within the medium range: F (1,154)
Holistic = 24.07, MSE= 39.61, p < .001, ηp2 = .135; F (1,154) Organisation = 23.45, MSE= 258.64, p
< .001, ηp2 = .132; F (1,154) Vocabulary = 16.33, MSE= 21.29, p = .001, ηp
2 = 096; F (1,153)
Compositional fluency = 7.84, MSE = 14493.90, p = .006, ηp2 = .048. Likewise, girls outperformed
boys on all dimensions of written expression, except for organisation. The effect sizes were
within the small-to-medium range, F (1,154) Holistic = 7.88, MSE= 12.96, p = .006, ηp2 = .049;
F (1,154) Organisation = 0.30, MSE= 3.26, p =.587, ηp2 = .002; F (1,154) Vocabulary = 8.75, MSE=
11.41, p = .004, ηp2 = .054; F (1,154) Compositional fluency = 9.95, MSE= 18402.67, p = .002, ηp
2 =
.061.
Although the interaction effect between the language group and gender was
nonsignificant, there was a consistent tendency of the language group gap to be larger for
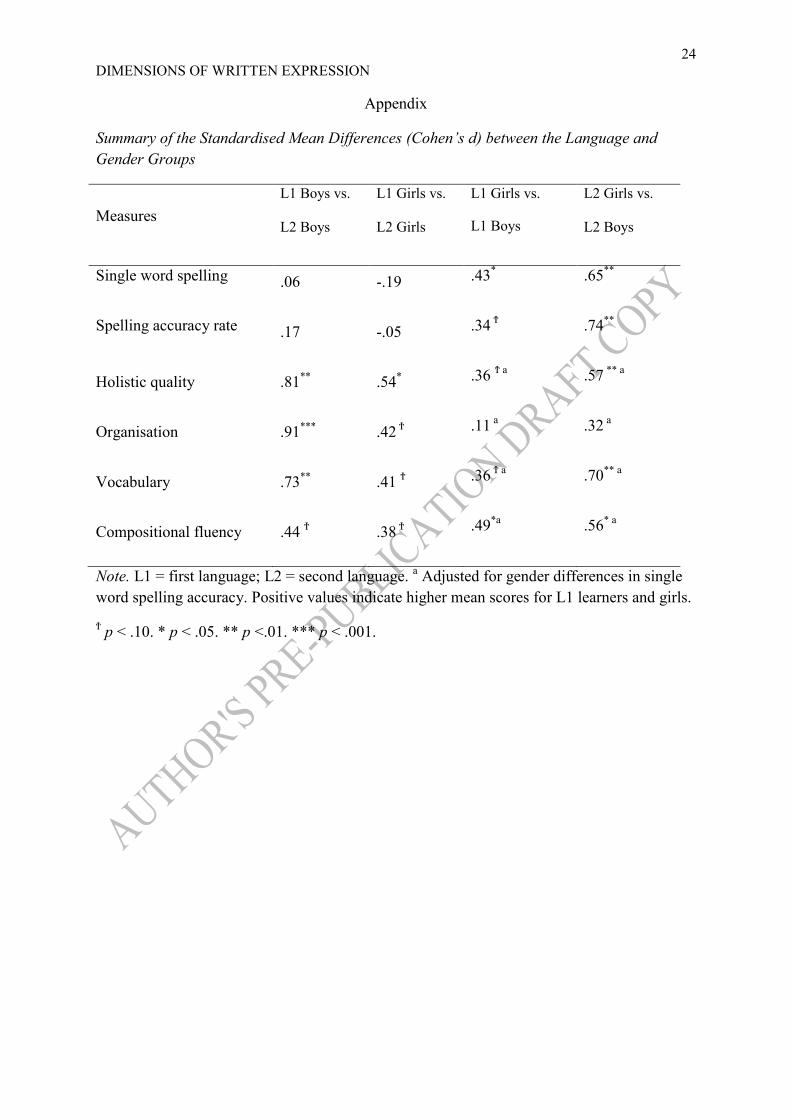
boys and the gender gap to be larger for the L2 group. A summary of the standardised mean
differences between the groups is presented in the Appendix. For instance, with the exception
of compositional fluency, the effect sizes for language group differences were all large for
boys but within the small-to-moderate range for girls. Likewise, whereas the effect sizes for
gender differences were all within the medium-to-large range in the L2 group, they were
small in the L1 group (except for compositional fluency and spelling). The lowest performing
group was the L2 boys (Table 1).
3.3 The contributions of vocabulary, compositional fluency, and organisation to overall
writing quality: Multigroup path analysis
15
DIMENSIONS OF WRITTEN EXPRESSION
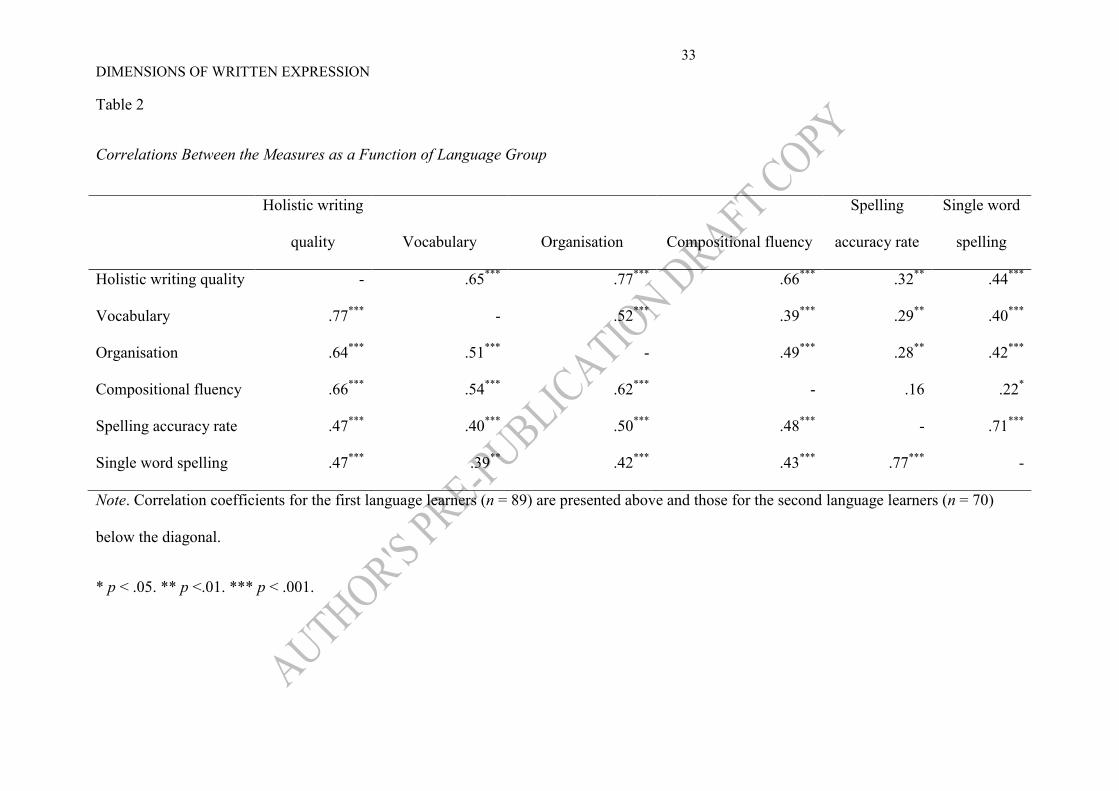
Next, a multigroup path analysis examined the contributions of written vocabulary,
compositional fluency, and organisation to overall writing quality over and above spelling
skills across the two language groups. Table 2 shows a summary of the correlations between
the measures by language group. Due to the large correlation coefficient between the two
spelling accuracy measures (rs = .71 in the L1 group and .77 in the L2 group), a composite
spelling accuracy measure was created using principal component analysis. The Analysis of
Moment Structures (AMOS 19; Arbuckle, 2010) programme was used for all the analysis. A
nonsignificant χ2
value, a CFI value at or above .95 and a RMSEA value below .05 indicated
an adequate model fit (Browne & Cudeck, 1993). The model was a very good fit to the data
from both language groups, L1, χ2 (1) = 0.813, p = .367, CFI = 1.000, RMSEA = .000, with
90% CI = .000 to .271; L2, χ2
(1) = 0.099, p = .753, CFI = 1.000, RMSEA = .000, with 90%
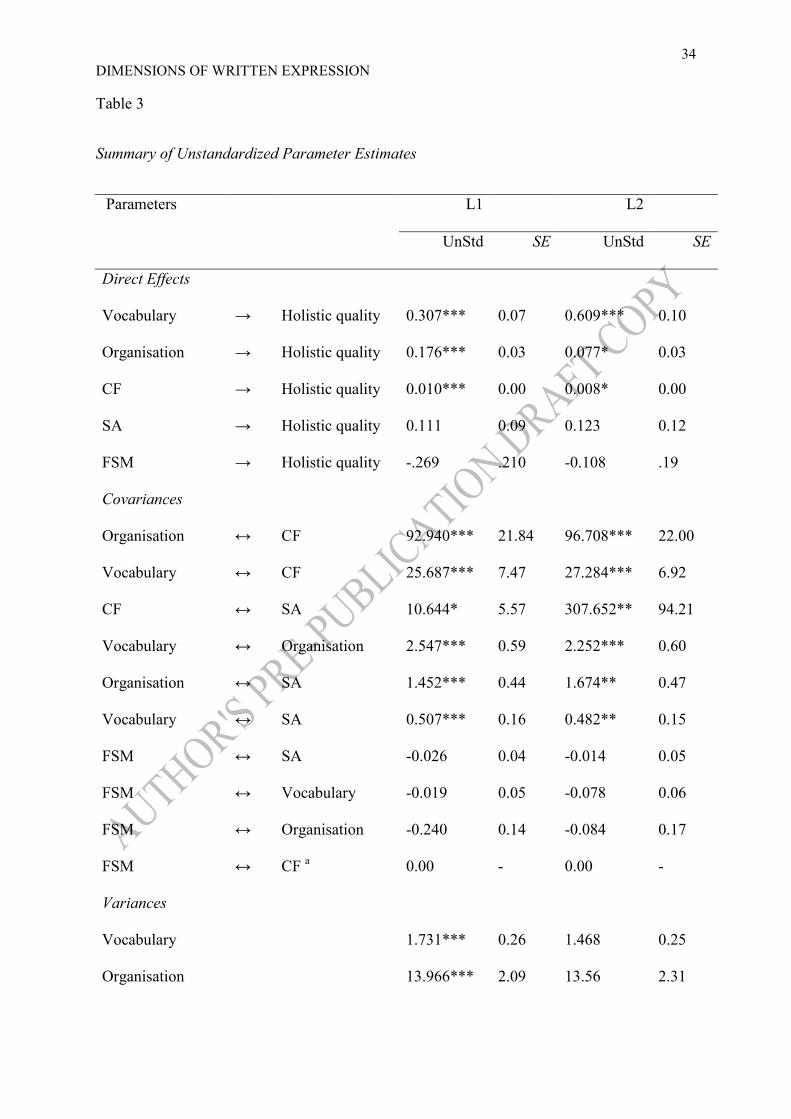
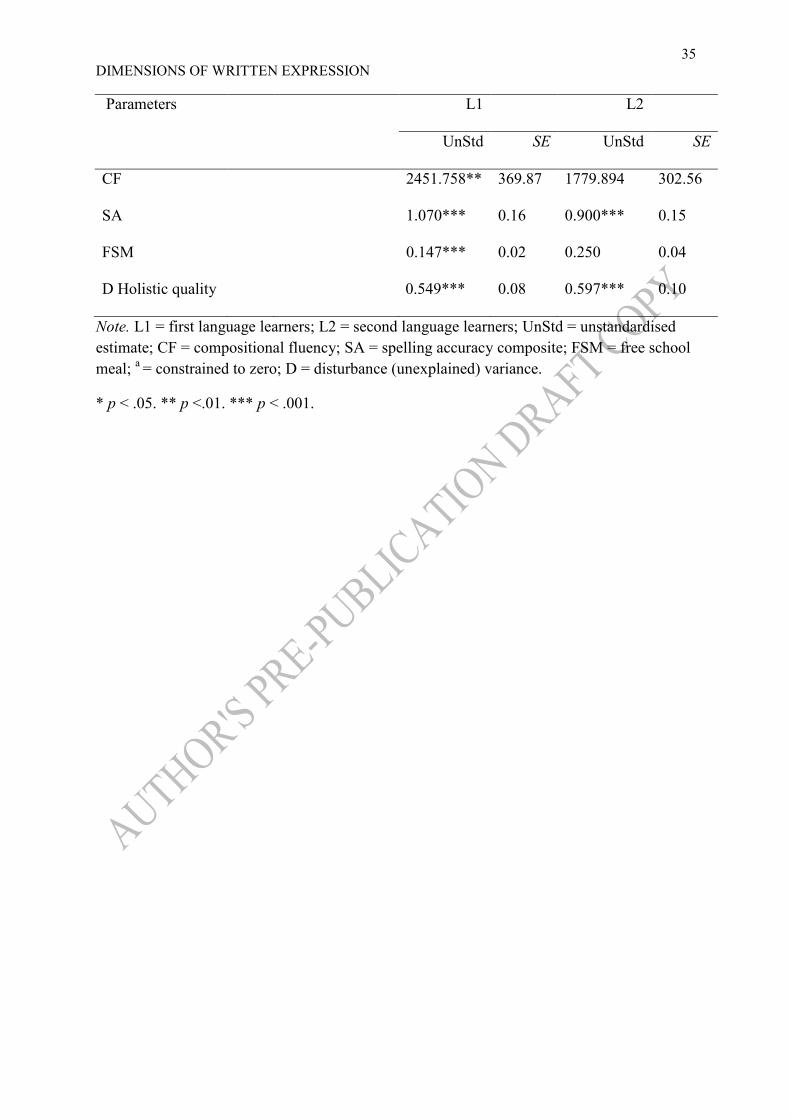
CI = .000 to .219. Figure 1 depicts the standardised path parameters for both language groups
and Table 3 shows the unstandardized parameter estimates. In both groups, the overall model
explained a large proportion of the variance in writing quality (76% in L1 and 71% in L2
group) and the effect of spelling accuracy on writing quality was indirect through its strong
relationships with the other dimensions of writing. The covariance between FSM and
compositional fluency was fixed to zero to release one df to calculate the model fit (see Kline,
2005).
[Table 2 about here]
[Figure 1 about here]
Having established that the model provided a very good fit to the data from each
language group, it was possible to proceed with the multigroup path analysis. The model fit
to the pooled data from the two language groups yielded excellent fit indices, χ2 (2) = 0.911,
p = .634, CFI = 1.000, RMSEA = .000, with 90% CI = .000 to .126. This was the
16
DIMENSIONS OF WRITTEN EXPRESSION
unconstrained model where the parameter values were estimated independently for each
language group. In order to test whether the contributions of written vocabulary,
compositional fluency, and organisation to overall writing quality were invariant across the
two language groups, the direct path parameter values were fixed to equality across the two
groups.
However, prior to this, it was important to confirm that the error variances were
homogenous across the groups (see Aguinis, Petersen, & Pierce, 1999). With the exception of
vocabulary, the requirement of homogeneity of error variances was met. The error variance
ratio of vocabulary was 1:1.56, hence just above the 1:1.5 threshold (i.e., DeShon and
Alexander’s rule of thumb for error variance homogeneity) and the Bartlett’s M was
marginally nonsignificant, M = 3.715, p = .054. Therefore, vocabulary was excluded from the
constrained model (though its inclusion in the analysis did not change the reported results)
and instead, alternative tests of moderation was computed, namely James’s and Alexander’s
tests, both of which yielded nonsignificant differential slopes for vocabulary, U = 1.61,
(Critical U) = 3.90, p > .05; A = 1.59, p = .207.
The constrained model remained a good fit to the data, χ2 (6) = 9.799, p = .133, CFI =
0.989, RMSEA = .064, with 90% CI = .000 to .132 but the Δ χ2 value was marginally
significant, Δ χ2 (4) = 8.888, p =.064. Hence, it was important to proceed with the analysis to
identify, which pairs of parameter values were substantially different between the two
language groups that contributed to the marginally significant model fit change (see Kline,
2011). The examination of the residual moments revealed that the direct path coefficient from
organisation to holistic quality was larger in the L1 group. Releasing the direct path
coefficient for organisation to be estimated independently for each group led to a
nonsignificant model fit change, Δ χ2 (3) = 0.733, p =.865 and improved the model fit
indices, χ2 (5) = 1.645 p = .896, CFI = 1.000, RMSEA = .000, with 90% CI = .000 to .049.
17
DIMENSIONS OF WRITTEN EXPRESSION
Note that the χ2
difference between the fully constrained model and the partially constrained
model with free organisation was significant, Δ χ2 (1) = 8.154, p = .004. Together these
results indicated that although there was a tendency of organisation and vocabulary to be
differentially related to L1 and L2 writing quality (Figure 1), the group differences were
nonsignificant suggesting invariant relations between the dimensions of writing and overall
holistic quality across the two language groups.
[Table 3 about here]
4. Discussion
The present study examined the written expression of L2 learners, which remains a
highly under-researched area. As anticipated, with the exception of spelling accuracy, there
was an L1 advantage on all dimensions of written expression. Girls outperformed boys on all
but the organisation dimension of written expression. The lowest performing group was L2
boys, hence there was a heightened risk for more L2 boys to underscore on writing. The
interaction between gender and language group was statistically nonsignificant. As for the
relative contributions of vocabulary, organisation, and compositional fluency to the overall
writing quality, all three dimensions made direct contributions to the prediction of holistic
quality scores over and above spelling skills and the strength of relationships was relatively
similar across the two language groups.
4.1 Language group and gender differences in written expression
In accordance with the previous reports, the L1 and L2 learners performed on par in
spelling (Cameron & Besser, 2004). Girls’ superior performance on spelling has also been
reported before (e.g., Malecki & Jewell, 2003). However, this result should be evaluated
cautiously. The magnitude of the gender differences in spelling tended to be larger in the L2
18
DIMENSIONS OF WRITTEN EXPRESSION
than the L1 group (Appendix). In addition, not all studies on L1 learners have found gender
differences in spelling accuracy (e.g., Stainthorp & Rauf, 2009; Williams & Larkin, 2012).
Therefore, further research is required to clarify the possible interaction between language
group and gender in spelling.
The L2 learners’ written expression tended to be weaker than that of their L1 peers on
all dimensions of written expression, and the largest language group differences were
observed in holistic quality, organisation, and vocabulary. Together, these results suggested
that the clarity of expression, the amount of information provided, the use of appropriate and
varied vocabulary, and sentence structure were important aspects of written expression that
differed across the two language groups. Hence, the present study confirmed the previous
findings, which reported an L2 disadvantage on the overall writing quality and grammatical
aspects of writings (Cameron & Besser, 2004; Verheyden et al., 2010).
As for the gender differences, girls’ written scripts were longer and received higher
scores than those of boys on vocabulary and holistic quality even when the gender differences
in spelling skills were taken into account. Although there was no statistically significant
interaction effect between gender and language group on any dimensions of written
expression, there was a consistent trend suggesting that the language group differences
tended to be larger for boys than for girls, and that the gender differences were larger for the
L2 group. In fact, with the exception of compositional fluency, L2 boys scored lower than L1
boys on all dimensions of written expression, and the magnitudes of language group
differences were about one-third larger than those for L1 and L2 girls. It is notable that
Cameron and Besser (2004) also reported a similar trend. Hence, it seems that the low
performance of the L2 boys was the major factor that contributed to the gender differences in
this study. Together, these results suggest that L2 boys were more at risk of
underperformance on the dimensions of written expression.
19
DIMENSIONS OF WRITTEN EXPRESSION
4.2 The contributions of written vocabulary, organisational quality, and compositional
fluency to holistic writing quality
The findings confirmed and extended the previous reports on the relations between
written vocabulary, compositional fluency, and writing quality (e.g., Olinghouse & Leaird,
2009). In this study, in addition to written vocabulary and compositional fluency,
organisational quality also made unique contributions to children’s writing quality over and
above spelling skills. The effect of spelling on writing quality was indirect through its
relationships with vocabulary, organisation, and compositional fluency. Broadly, the strength
of these relations was very similar across the L1 and L2 groups, but there were also
differences. The quality of written vocabulary tended to make the largest impact upon L2
learners’ overall writing quality scores. For L1 learners, however, it was the organisation
(i.e., sentence structure and the number of ideas) dimension which had the most impact upon
their overall writing quality scores. However, the group differences were marginally
significant for organisation and not significant for vocabulary. These nonsignificant results
might partly be due to the modest sample size, hence the low statistical power of the current
study (see Aguinis, Beaty, Boik, & Pierce, 2005). Nonetheless, a number of methodological
factors, including scoring procedures and task related factors, may also influence the scores
and thereby, the strength of relations between the predictor measures and writing quality (see
the section 4.4.). Therefore, research with larger sample sizes and multiple measures of
writing is essential to pursue the current findings and clarify whether the aspects of written
expression play a differential role in L1 and L2 writing quality. Without doubt, this line of
research has important implications for our understanding of the instructional needs of
learners from diverse language backgrounds, as discussed further in the next section (4.3.).
4.3. Educational implications
20
DIMENSIONS OF WRITTEN EXPRESSION
Future research is required to confirm the findings on boys’ written expression and
examine the factors, such as motivation, that may explain why boys tended to score lower
than their girl counterparts on writing. It is particularly vital to clarify why the L2 boys’
performance was lower than that of their peers on most of the dimensions of written
expression and whether the factors that may contribute to the observed gender differences
vary across the L1 and L2 learners.
The L2 learners’ low scores on the dimensions of vocabulary and organisational
quality suggested weakness in both the vocabulary and grammar domains of the English
language. This finding is in line with the previous research on similar groups of L2 learners
(Babayiğit, 2012, 2013; Cameron & Besser, 2004). Given the central role of grammar and
vocabulary in writing skills (Dockrell & Connelly, 2009; Jones, Myhill, & Bailey, 2012;
Olinghouse & Wilson, 2013), specific educational focus on vocabulary and grammatical
skills seems to be even more important for L2 learners.
The pre-writing activities that develop and strengthen the semantic representations
and thereby the background knowledge and vocabulary skills have been found to be among
the most effective means of supporting children’s writing skills (Graham & Perin, 2006).
Likewise, sentence-combining activities (Graham & Perin, 2007; Saddler, Behforooz, &
Asaro, 2008) and contextualised grammar teaching (Myhill, Jones, Lines, & Watson, 2012)
have been found to be an effective means of supporting writing development. Thus far,
however, the efficacy of these intervention programmes has been investigated predominantly
with L1 learners; it is vital that future research examines the most effective ways of
supporting the writing development of L2 learners (Graham & Perin, 2006). Finally, a
number of case studies indicate that close monitoring of the progress of L2 students as well as
sustaining both high expectations and well-informed leadership regarding the needs of L2
students may increase the writing achievement of L2 learners (Office for Standards in
21
DIMENSIONS OF WRITTEN EXPRESSION
Education, 2005). Without doubt, a concerted approach is required to address the needs of
minority language learners.
4.4 General limitations and further research
As with any correlational study on a highly heterogeneous population of L2 learners,
this study has several limitations. First, the reported relationships do not suggest causality and
the direction of effects might be reciprocal. Second, the aggregated findings from diverse
ethnic and language groups may not generalise to specific language groups. There are
significant variations in the literacy performance of different language groups (SFR, 2012a)
and the magnitude of gender differences across the ethnic groups (Strand, 2008). Likewise,
the composition of the L2 sample, including age and the distribution of the language groups
and SES background, might have influenced the results. In fact, the limited variation in the
SES backgrounds of the L2 learners may explain why FSM was not related to any of the
measures in this study. This is not an uncommon finding when studies are conducted on
minority language learners predominantly from low SES backgrounds (e.g., see Verheyden et
al., 2010). It is for these reasons that further research must employ larger samples of L2
learners from a broader range of age groups and SES backgrounds to develop a better
understanding of the writing development of L2 learners. It is also possible that FSM on its
own may not fully capture the individual differences in SES. Additional measures of SES,
particularly information on mother’s educational levels, are required to clarify the role of SES
in children’s writing development.
In this study, the use of two different prompts from a standardised test with a highly
structured scoring rubric yielded relatively high interrater reliability estimates, hence
addressed the reliability issues to some extent. However, the format of the two writing tasks
was the same. Given the reports that the performance on different writing tasks may vary
22
DIMENSIONS OF WRITTEN EXPRESSION
significantly (Schoonen, 2005, 2012), it is essential for future research to confirm the current
findings with a wide range of writing tasks and scoring procedures. In fact, the variations at
the level of writer, writing task, scoring rubric, and rater can all influence the pattern of
results and it remains a major challenge for writing research to address the multiple sources
of variations that influence writing performance (for a review, see Rijlaarsdam et al., 2012). It
is also noteworthy that studies with multiple writing measures would enable to examine
language group differences with a latent variable approach, which assesses measurement
bias, and therefore provides a more reliable method of group comparison (Kline, 2013;
Vandenberg, & Lance, 2000).
Finally, the findings from this study need to be pursued to refine our understanding of
the skills that underlie the performance on the dimensions of written expression. For instance,
Cameron and Besser (2004) found that L2 learners displayed particular weaknesses in the use
of formulaic sequences (e.g., idioms, sentence frames, collocations) and addressing the
demands of different genres that seemed to have undermined the overall quality of their
writings. The L2 learners may not have the opportunities to experience diverse text and
formulaic sequences. These are the aspects of a complex array of high-level oral language
and text processing skills that underpin text writing (for a review, see Hayes, 2012), the
educational implications of which remain to be fully examined in L2 learners.
4.5 Conclusion
In sum, the findings confirmed the previous reports of a tendency of more L2 learners
and particularly L2 boys to underperform on the key dimensions of written expression and
highlighted the importance of examining in tandem the gender and language group
differences in writing performance. Future research is required to confirm these findings as
well as elucidate the underlying reasons for the observed language group and gender
23
DIMENSIONS OF WRITTEN EXPRESSION
differences in writing. Nevertheless, it is clear that both L2 learners and boys would benefit
from close monitoring of their writing development and further research in this area is
imperative to inform the educational practice in our increasingly diverse classrooms.
24
DIMENSIONS OF WRITTEN EXPRESSION
Appendix
Summary of the Standardised Mean Differences (Cohen’s d) between the Language and
Gender Groups
Measures
L1 Boys vs.
L2 Boys
L1 Girls vs.
L2 Girls
L1 Girls vs.
L1 Boys
L2 Girls vs.
L2 Boys
Single word spelling .06 -.19 .43* .65
**
Spelling accuracy rate .17 -.05 .34
Ϯ .74
**
Holistic quality .81**
.54* .36
Ϯ a .57
** a
Organisation .91***
.42 Ϯ .11
a .32
a
Vocabulary .73**
.41 Ϯ .36
Ϯ a .70
** a
Compositional fluency .44 Ϯ .38
Ϯ .49
*a .56
* a
Note. L1 = first language; L2 = second language. a Adjusted for gender differences in single
word spelling accuracy. Positive values indicate higher mean scores for L1 learners and girls.
Ϯ p < .10. * p < .05. ** p <.01. *** p < .001.
25
DIMENSIONS OF WRITTEN EXPRESSION
References
Aguinis, H., Beaty, J. C., Boik, R. J., & Pierce, C. A. (2005). Effect size and power in
assessing moderating effects of categorical variables using multiple regression: A 30-
year review. The Journal of applied psychology, 90, 94-107. doi:10.1037/0021-
9010.90.1.94
Aguinis, H., Petersen, S. A., & Pierce, C. A. (1999). Appraisal of the homogeneity of error
variance assumption and alternatives to multiple regression for estimating moderating
effects of categorical variables. Organizational Research Methods, 2, 315-339.
doi:10.1177/109442819924001
Arbuckle, J. L. (2010). IBM SPSS Amos 19. Crawfordvile, FL, USA: Amos Development
Cooperation.
Babayiğit, S. (2012). The role of oral language skills in reading and listening comprehension
of text: A comparison of monolingual (L1) and bilingual (L2) speakers of English
language. Journal of Research in Reading, Advance online publication.
doi:10.1111/j.1467-9817.2012.01538.x
Babayiğit, S. (2013). Contributions of word-level and verbal skills to written expression:
Comparison of learners who speak English as a first (L1) and second language (L2).
Reading and Writing, Advance online publication. doi:10.1007/s11145-013-9482-z
Berman, R. A., & Verhoeven, L. (2002). Cross-linguistic perspectives on the development of
text-production abilities: Speech and writing. Written Language & Literacy, 5, 1- 43.
doi:10.1075/wll.5.1.02ber
Browne, M. W., & Cudeck, R. (1993). Alternative ways of assessing model fit. In K. A.
Bollen & J. S. Long (Eds.), Testing structural equation models (pp. 136-162).
Newbury Park, CA: Sage.
26
DIMENSIONS OF WRITTEN EXPRESSION
Cameron, L., & Besser, S. (2004). Writing in English as an additional language at Key Stage
2 (rep. No. 586) Retrieved from
https://www.education.gov.uk/publications/standard/publicationDetail/Page1/RR586.
National Centre for Languages (2011). National Centre for Languages (operating as part of
the CfBT education trust). Retrieved from
http://www.cilt.org.uk/home/research_and_statistics/statistics/languages_in_the_popu
lation/annual_school_census.aspx
Cohen, J. D. (1988). Statistical power analysis for the behavioural sciences (Second ed.).
Hillsdale, NJ: Erlbaum.
Department for Education (2012). Primary schools census guidance. Retrieved from
http://www.education.gov.uk/schools/adminandfinance/schooladmin/a0064400/schoo
l-census-2012.
Department for Education and Skills (2006). Ethnicity and education: The evidence on
minority ethnic pupils aged 5-16 2006 ed. (ref.: 0208-2006dom-en). Retrieved from
http://dera.ioe.ac.uk/6306/.
Dockrell, J., & Connelly, V. (2009). The impact of oral language skills on the production of
written text. Teaching and Learning, British Journal of Educational Psychology
Monographs Series II, 6, 45-62. doi:10.1348/978185409X421110
Fitzgerald, J. (2006). Multilingual writing in preschool through 12th grade. In A. MacArthur,
S. Graham & J. Fitzgerald (Eds.), Handbook of writing research (pp. 337-354).
London, UK:The Guilford Press.
Goldenberg, C., Reese, L., & Rezaei, A. (2011). Contexts for language and literacy
development among dual-language learners. In A. Durgunoğlu & C. Goldenberg
(Eds.), Language and literacy development in bilingual settings (pp. 3-25). New
York, USA: The Guildford Press
27
DIMENSIONS OF WRITTEN EXPRESSION
Graham, S., Berninger, V. W., Abbot, R. D., Abbot, S. P., & Whitaker, D. (1997). Role of
mechanics in composing of elementary school students: A new methodological
approach. Journal of Educational Psychology, 89, 170-182. doi:10.1037/0022-
0663.89.1.170
Graham, S., & Perin, D. (2006). Writing next: Effective strategies to improve writing of
adolescents in middle and high school. Washington, D.C: Alliance for Excellence in
Education. Retrieved from http://all4ed.org/wp-
content/uploads/2006/10/WritingNext.pdf
Graham, S., & Perin, D. (2007). A meta-analysis of writing instruction for adolescent
students. Journal of Educational Psychology, 99, 445-476.
Hansen, K., & Jones, E. M. (2011). Ethnicity and gender gaps in early childhood. British
Educational Research Journal, 37, 973-991. doi:10.1080/01411926.2010.515018
Hayes, J. R. (2012). Modeling and remodeling writing. Written Communication, 29, 369-388.
doi:10.1177/0741088312451260
Jewell, J., & Malecki, C. K. (2005). The utility of cbm written language indices: An
investigation of production-dependent, production-independent, and accurate-
production scores. School Psychology Review, 34, 27-44.
Jones, S. M. (2012). Mapping the landscape: Gender and the writing classroom. Journal of
Writing Research, 3, 161-179.
Jones, S. M., & Myhill, D. A. (2007). Discourses of difference? Examining gender difference
in linguistic characteristics of writing. Canadian Journal of Education, 30, 456-482.
Jones, S. M., Myhill, D. A., & Bailey, T. (2012). Grammar for writing? An investigation of
the effects of contextualised grammar teaching on students’ writing. Reading and
Writing, Advance online publication. doi:10.1007/s11145-012-9416-1
28
DIMENSIONS OF WRITTEN EXPRESSION
Kline, R. B. (2005). Principles and practice of structural equation modeling (2 ed.). London,
UK:The Guilford Press.
Kline, R. B. (2011). Principles and practice of structural equation modeling (3 ed.). London:
The Guildford Press.
Kline, R. B. (2013). Assessing statistical aspects of test fairness with structural equation
modelling. Educational Research and Evaluation, 19, 204-222.
Lesaux, N., Geva, E., Koda, K., Siegel, L., & Shanahan, T. (2006). Development of literacy.
In D. August & T. Shanahan (Eds.), Developing literacy in second-language learners
(pp. 75-122). NJ, USA: Erlbaum.
Malecki, C. K., & Jewell, J. (2003). Developmental, gender, and practical considerations in
scoring curriculum‐based measurement writing probes. Psychology in the Schools, 40,
379-390.
Mead, S. (2006). The evidence suggests otherwise: The truth about boys and girls. Retrieved
from http://www.educationsector.org/usr_doc/ESO_BoysAndGirls.pdf.
Myhill, D. A., Jones, S. M., Lines, H., & Watson, A. (2012). Re-thinking grammar: The
impact of embedded grammar teaching on students’ writing and students’
metalinguistic understanding. Research Papers in Education, 27, 139-166.
doi:http://dx.doi.org/10.1080/02671522.2011.637640
National Assessment of Educational Progres. (2011). National Assessment of Educational
Progress (NAEP): Writing assessment. Retrieved from
http://nationsreportcard.gov/writing_2011/.
Office for Standards in Education. (2005). Could they do even better? The writing of
advanced bilingual learners of English at Key Stage 2: Hmi survey of good practice
(2452) http://dera.Ioe.Ac.Uk/5384/. Retrieved.
29
DIMENSIONS OF WRITTEN EXPRESSION
Olinghouse, N. (2008). Student- and instruction-level predictors of narrative writing in third-
grade students. Reading and Writing, 21, 3-26. doi:10.1007/s11145-007-9062-1
Olinghouse, N., & Leaird, J. (2009). The relationship between measures of vocabulary and
narrative writing quality in second- and fourth-grade students. Reading and Writing,
22, 545-565. doi:10.1007/s11145-008-9124-z
Olinghouse, N., & Wilson, J. (2013). The relationship between vocabulary and writing
quality in three genres. Reading and Writing, 26, 45-65. doi:10.1007/s11145-012-
9392-5
Pajares, F., & Valiante, G. (2001). Gender differences in writing motivation and achievement
of middle school students: A function of gender orientation? Contemporary
Educational Psychology, 26, 366-381. doi:http://dx.doi.org/10.1006/ceps.2000.1069
Peterson, S. S., & Parr, J. M. (2012). Gender and literacy issues and research: Placing the
spotlight on writing. Journal of Writing Research, 3, 151-161.
doi:http://www.jowr.org/articles/vol3_3/JoWR_2012_vol3_nr3_Peterson_and_Parr.p
df
Rijlaarsdam, van den Bergh, Couzijn, Janssen, Braaksma, Tillema, … Raedts (2012).
Writing. In K.R. Harris, S. Graham & T. Urdan (Eds.), APA educational psychology
handbook. Vol. 3: Application to learning and teaching (APA handbooks in
psychology) (pp. 189-228). Washington, DC: American Psychological Association.
doi:10.1037/13275-001
Saddler, B., Behforooz, B., & Asaro, K. (2008). The effects of sentence-combining
instruction on the writing of fourth-grade students with writing difficulties. The
Journal of Special Education, 42, 79-90. doi:10.1177/0022466907310371
Schoonen, R. (2005). Generalizability of writing scores: an application of structural equation
modeling. Language Testing, 22, 1-30. doi:10.1191/0265532205lt295oa
30
DIMENSIONS OF WRITTEN EXPRESSION
Schoonen, R. (2012). The validity and generalizability of writing scores: The effect of rater,
task and language. In E. van Steendam, M. Tillema, G. Rijlaarsdam, & H. van den
Bergh (Eds.), Measuring Writing: Recent Insights into Theory, Methodology and
Practice (Vol. 27, pp. 1-24). Brill. doi:10.1108/S1572-6304(2012)0000027004
Statistics First Release (2011). National curriculum assessment at Key Stage 2 in England
2010/11 (SFR 31/2011) (revised), 15th december 2011. Retrieved from
http://www.education.gov.uk/rsgateway/DB/SFR/s001047/index.shtml.
Statistics First Release (2012a). GCSE and equivalent attainment by pupil characteristics in
England, 2010/11. Retrieved from
http://www.education.gov.uk/rsgateway/DB/SFR/s001057/index.shtml.
Statistics First Release (2012b). Phonics screening check and national curriculum
assessments at Key Stage 1 in England 2011/12. Retrieved from
http://www.education.gov.uk/rsgateway/DB/SFR/s001086/index.shtml.
Statistics First Release (2012c). Schools and pupils and their characteristics. Retrieved from
http://www.education.gov.uk/rsgateway/DB/SFR/s001071/index.shtml.
Stainthorp, R., & Rauf, N. (2009). An investigation of the influence of the transcription skills
of handwriting and spelling on the quality of text writing by girls and boys in Key
Stage 2. Handwriting Today, 8, 8-13. Retrieved from http://www.nha-
handwriting.org.uk/publications/annual-journal
Strand, S. (2008). Minority ethnic pupils in the longitudinal study of young people in England
extension report on performance in public examinations at age 16. Department for
Children, Schools, and Families- RR029.London: Institute of Education, University of
Warwick. Retrieved from http://www.dfes.gov.uk/research/data/uploadfiles/DCSF-
RR029.pdf.
31
DIMENSIONS OF WRITTEN EXPRESSION
Troia, G., Harbaugh, A., Shankland, R., Wolbers, K., & Lawrence, A. (2012). Relationships
between writing motivation, writing activity, and writing performance: Effects of
grade, sex, and ability. Reading and Writing, 1-28. doi:10.1007/s11145-012-9379-2
Vandenberg, R. J., & Lance, C. E. (2000). A review and synthesis of the measurement
invariance literature: Suggestions, practices, and recommendations for organizational
research. Organizational Research Methods, 3, 4-70. doi:10.1177/109442810031002
Verheyden, L., Van den Branden, K., Rijlaarsdam, G., Van den Bergh, H., & De Maeyer, S.
(2010). Written narrations by 8- to 10-year-old Turkish pupils in Flemish primary
education: A follow-up of seven text features. Journal of Research in Reading, 33,
20-38. doi:10.1111/j.1467-9817.2009.01430.x
Vernon, P. E. (2006). Graded word spelling test, third edition revised and restandardised by
Colin McCarty and Mary Crumpler. London: Hodder Education.
Wechsler, D. (2005). Wechsler individual achievement test (2nd
UK edition) London, UK:
Harcourt Publishers.
Wight, V. R., Chau, M., & Aratani, Y. (2010). Who are america’s poor children? The official
story (brief). Retrieved from http://www.nccp.org/publications/pdf/text_912.pdf.
Williams, G. J., & Larkin, R. F. (2012). Narrative writing, reading and cognitive processes in
middle childhood: What are the links? Learning and Individual Differences, Advance
online publication. doi:10.1016/j.lindif.2012.08.003
Wolff, D. (2000). Second language writing: A few remarks on psycholinguistic and
instructional issues. Learning and Instruction, 10, 107-112.
doi:http://dx.doi.org/10.1016/S0959-4752(99)00021-3
Zecker, L., B (2004). Learning to read and write in two languages. In C. A. Stone, E. R.
Silliman, B. J. Ehren & K. Apel (Eds.), Handbook of language and literacy:
Development and disorders (pp. 248-265). New York, USA: The Guildford Press.
32
DIMENSIONS OF WRITTEN EXPRESSION
Table 1
Summary of Descriptive Statistics as a Function of Language Group and Gender
L1 (n = 89) L2 (n = 70)
Boys (n = 42) Girls (n = 47) Total Boys (n = 35) Girls (n = 35) Total
Measures/ maximum
possible score Mean (SD) Mean (SD)
Mean (SD) Mean (SD) Mean (SD)
Mean (SD)
Holistic / 12 4.52 (1.37) 5.28 (1.57) 4.92 (1.52) 3.40 (1.40) 4.49 (1.31) 3.94 (1.45)
Organisation / 20 12.86 (3.61) 13.15(3.87) 13.01 (3.73) 9.57 (3.58) 11.54 (3.62) 10.56 (3.71)
Vocabulary / 10 2.57 (1.21) 3.15 (1.37) 2.88 (1.32) 1.66 (1.30) 2.66 (0.91) 2.16 (1.22)
Compositional fluency / na 122.79 (50.66) 150.02 (45.81) 137.17 (49.80) 102.80 (38.08) 133.49 (41.59) 118.14 (42.49)
Single word spelling / 130 95.07 (16.94) 101.83 (14.65) 98.64 (16.04) 94.11 (16.47) 104.77 (16.49) 99.44 (17.22)
Spelling error rate/ 1 .10 (.07) .08 (.06) .09 (.07) .11 (.07) .06 (.04) .08 (.06)
Note. N = 159. L1 = first language learners; L2 = second language learners; na = not applicable.
33
DIMENSIONS OF WRITTEN EXPRESSION
Table 2
Correlations Between the Measures as a Function of Language Group
Holistic writing
quality Vocabulary Organisation Compositional fluency
Spelling
accuracy rate
Single word
spelling
Holistic writing quality - .65***
.77***
.66***
.32**
.44***
Vocabulary .77***
- .52***
.39***
.29**
.40***
Organisation .64***
.51***
- .49***
.28**
.42***
Compositional fluency .66***
.54***
.62***
- .16 .22*
Spelling accuracy rate .47***
.40***
.50***
.48***
- .71***
Single word spelling .47***
.39**
.42***
.43***
.77***
-
Note. Correlation coefficients for the first language learners (n = 89) are presented above and those for the second language learners (n = 70)
below the diagonal.
* p < .05. ** p <.01. *** p < .001.
34
DIMENSIONS OF WRITTEN EXPRESSION
Table 3
Summary of Unstandardized Parameter Estimates
Parameters L1 L2
UnStd SE UnStd SE
Direct Effects
Vocabulary → Holistic quality 0.307*** 0.07 0.609*** 0.10
Organisation → Holistic quality 0.176*** 0.03 0.077* 0.03
CF → Holistic quality 0.010*** 0.00 0.008* 0.00
SA → Holistic quality 0.111 0.09 0.123 0.12
FSM → Holistic quality -.269 .210 -0.108 .19
Covariances
Organisation ↔ CF 92.940*** 21.84 96.708*** 22.00
Vocabulary ↔ CF 25.687*** 7.47 27.284*** 6.92
CF ↔ SA 10.644* 5.57 307.652** 94.21
Vocabulary ↔ Organisation 2.547*** 0.59 2.252*** 0.60
Organisation ↔ SA 1.452*** 0.44 1.674** 0.47
Vocabulary ↔ SA 0.507*** 0.16 0.482** 0.15
FSM ↔ SA -0.026 0.04 -0.014 0.05
FSM ↔ Vocabulary -0.019 0.05 -0.078 0.06
FSM ↔ Organisation -0.240 0.14 -0.084 0.17
FSM ↔ CF a 0.00 - 0.00 -
Variances
Vocabulary 1.731*** 0.26 1.468 0.25
Organisation 13.966*** 2.09 13.56 2.31
35
DIMENSIONS OF WRITTEN EXPRESSION
Parameters L1 L2
UnStd SE UnStd SE
CF 2451.758** 369.87 1779.894 302.56
SA 1.070*** 0.16 0.900*** 0.15
FSM 0.147*** 0.02 0.250 0.04
D Holistic quality 0.549*** 0.08 0.597*** 0.10
Note. L1 = first language learners; L2 = second language learners; UnStd = unstandardised
estimate; CF = compositional fluency; SA = spelling accuracy composite; FSM = free school
meal; a = constrained to zero; D = disturbance (unexplained) variance.
* p < .05. ** p <.01. *** p < .001.
36
DIMENSIONS OF WRITTEN EXPRESSION
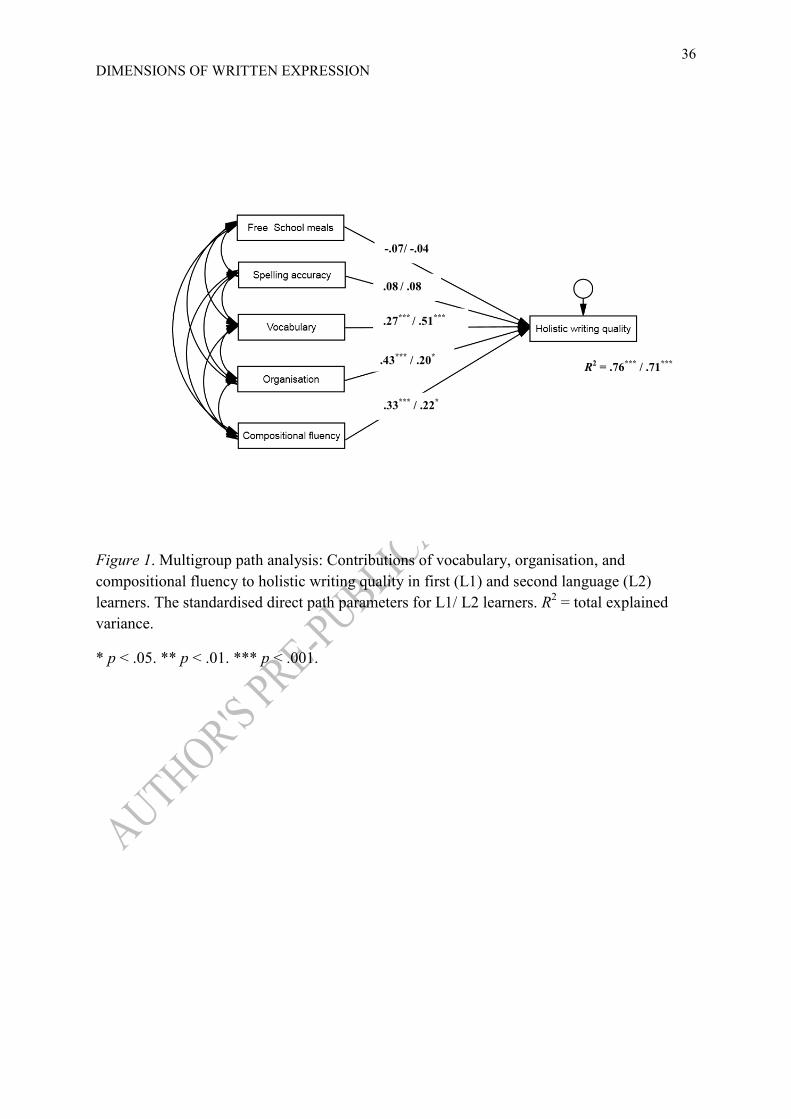
Figure 1. Multigroup path analysis: Contributions of vocabulary, organisation, and
compositional fluency to holistic writing quality in first (L1) and second language (L2)
learners. The standardised direct path parameters for L1/ L2 learners. R2 = total explained
variance.
* p < .05. ** p < .01. *** p < .001.
-.07/ -.04
.27*** / .51***
.43*** / .20*
.33*** / .22*
R2 = .76*** / .71***
.08 / .08