Embed Size (px)
Citation preview
99
ASSESSMENT OF WRITTEN EXPRESSION BY CURRICUlUM BASED MEASUREMENT AND TEACHERS’ RATING OF IDENTIFIED CRITICAl QUAlITY WRITING COMPONENTS
Max McFarland1, Danelle L. Wallace
University of Nebraska at Kearney, USA
Abstract. Background, purpose. The purposes of this study were (a) to identify common factors underlying several Curriculum Based Measurement (CBM) methods of asses-sing written expression among regular elementary school children, (b) to determine what quality writing components account most for ranking or rating of students’ overall writing competency, and (c) to determine which method(s) of scoring CBM Written Expression probes best predict students’ overall writing competency as rated by grade level (2nd through 5th grades) teachers. Material and methods. Two hundred seventy-four second-to-fifth grade students whose data on CBM written expression probes who were available served as subjects. Their teachers were asked to identify critical components of quality writing and to rate their students’ writing samples. Re-sults, conclusions. Results from factor analysis of CBM scoring metrics, confirming past research, revealed two factors – the production-dependent factor, and the production-independent factor. Multiple regression analyses indicated that the best CBM predictor of teachers’ holistic rating of student writing for second graders was percent correct let-ter sequence, but was total words spelled correctly for other grades. Multiple correlation between CBM scoring metrics and teacher rating was 0.67 in second grade, dropped to 0.50 in third grade, and then increased to 0.63 and 0.71 in later grades.
Key words: written expression, Curriculum Based Measurement (CBM) methods of asses-sing written expression, quality writing components.
There has been recent concern about higher education for its alle-ged failure to produce graduates who can write well (see, for example, Millard, 1997). The blame could be passed on to secondary education
1 Address for correspondence: Dept. Of Counseling and School Psychology, Univew-rsity of Nebraska at Kearney, College of Education Building, Rm B-148, Kearney, NE 68849, e-mail:[email protected]

Max McFarland, Danelle L. Wallace
100
and finally to elementary education for not preparing youngsters com-petent enough in writing to enter colleges. As a result, many colleges have started requiring writing samples from students to accompany their application materials for consideration of admission into their undergra-duate and graduate programs. At the pre-higher education level, several states have created “state curriculum content standards” which include “writing” as an important part. For example, in Nebraska, the Nebraska State Board of Education (1998) has required that students accomplish the following five writing standards by the end of the fourth grade:
1. Identify, describe, and apply knowledge of the structure of the En-glish language and standard English conventions for sentence structure, usage, punctuation, capitalization, and spelling.
2. Write compositions with a clear focus, logically related ideas, and adequate supporting detail.
3. Demonstrate improvement in organization, content, word choice (vocabulary), voice, sentence fluency and standard English conventions after revising and editing their compositions.
4. Use a variety of forms to write for different audiences and pur-poses.
5. Use self-generated questions, note taking, summarizing, and outlining to enhance learning.
It is then clear that improving writing competency has now become more urgent than ever at all levels of education. (The present study fo-cused on the elementary education level.) One of the first things to do in trying to improve students’ writing competency is to find valid ways to assess students’ written expression. Three approaches to the assessment of students’ written expression are currently available:
1. Standardized tests. See, for example, the Test of Written Language (Hammil & Larsen, 1978, 1988), and the Developmental Sentence Sco-ring System (Lee & Cantor, 1971).
2. Curriculum-Based Measurement (CBM). See, for example, Deno, Marston and Mirkin (1982).
3. Teacher-based Rating. See, for example, Videen, Deno and Mars-ton (1982), and Tindal and Parker (1991).
The present study focused on the latter two approaches for asses-sing students’ written expression. These two approaches could easily be
101
International Journal of Psychology: a Biopsychosocial ApproachTarptautinis psichologijos žurnalas: biopsichosocialinis požiūris
2008, 2, 99–119 p.
applied repeatedly and therefore are more practical to use than their standardized test counterpart.
CURRICUlUM-BASED MEASUREMENT (CBM) APPROACH TO THE ASSESSMENT OF WRITTEN EXPRESSION
Several CBM methods of assessing Written Expression have been used. The three most commonly used CBM scoring metrics are the num-ber of words written, the number of words spelled correctly, and the num-ber of correct word sequences (Shinn, 1998; Espin et al., 2000). The derived CBM scoring metric of correct minus incorrect word sequences has also been successfully tried (Espin et al. 2000). Other CBM scoring metrics identified are the number of mature words, the number of correct letter sequences, and Hunt’s T-Unit Length (Hunt et al., 1968; Deno, Marston & Mirkin, 1982; Pomplun, Sundbye & Kelley, 1999). Many of these CBM scoring metrics for written expression have been found to have predictive validity for student achievement (Tindal & Parker, 1991; Fewster & MacMillan, 2002). Many CBM scoring metrics for written expression have also been found to be predictive of teachers’ holistic rating of their students’ writing competency (Videen, Deno & Marston., 1982; Tindal & Parker, 1991; Espin et al. 2000). In addition, Malecki and Jewell (2003) found older students outperformed the younger ones on almost all scoring metrics and girls outperformed boys at all grade levels studies (1st-8th grades).
Intercorrelations among the CBM written expression scoring metrics have been studied (see for examples, Videen et al., 1982; Espin et al., 2000). There has also been attempts to group these metrics. For example, Tindall and Parker (1989) found from hierarchical cluster analysis and factor ana-lysis that eight CBM written expression scoring metrics form two clusters or factors – production-dependent and production-independent. The pro-duction dependent metrics include (a) total words written, (b) number of legible words, (c) number of correctly spelled words, and (d) number of cor-rect word sequences. These metrics are referred to as production-depen-dent because they reflect the student’s amount of writing. On the other hand, the production-independent metrics which are independent of the amount of writing, include (a) mean length of continuous word sequences, (b) percentage of legible words, (c) percentage of correctly spelled words, and

Max McFarland, Danelle L. Wallace
102
(d) percentage of correct word sequences. However, these two clusters were derived from 6th-8th grade middle school students in special education and remedial programs. The present study attempted to investigate the grou-ping of CBM written expression scoring metrics among 2nd-5th grade ele-mentary school students in regular education programs using the factor analytic technique—an extension of Tindal et al.’s 1989 study.
TEACHER-BASED MEASUREMENT APPROACH TO THE ASSESSMENT OF WRITTEN EXPRESSION
Who knows best about the writing skill of a student? The answer is probably the “teacher.” The teacher has seen and examined the writing samples of the students more than anyone else through the semesters and probably throughout many years. The holistic rating of a student’s writing competency should be taken seriously. However, because of the subjective nature of a rating scale, there have been doubts that teacher’s holistic rating of a student’s writing skills may be valid. Charney (1984) cautioned that teacher’s holistic evaluation of written expression is not absolutely valid. Moreover, consensus among professionals regarding which specific skills are needed for quality writing is lacking (Bradley-Johnson & Lesiak, 1989). Nevertheless, research studies have indicated that teacher’s holistic rating of student’s writing skills is, in fact, quite valid and reliable. Videen et al. (1982) reported a correlation of 0.85 be-tween the CBM metric of correct word sequences and teachers’ holistic rating of writing samples. Tindal and Parker (1991) reported similarly strong correlations between three CBM scoring metrics and teachers’ holistic judgments of students’ writing skills.
When teachers rate students’ writing quality, what criteria do they use? Quality writing can be illustrated through several components, although not everyone agrees as to what constitutes “quality” writing. Examples of those components include fluency, syntactic maturity, se-mantic maturity (vocabulary), content, and conventions (Howell, Fox & Morehead, 1993). When a teacher ranks or rates the students in class on their overall writing skills, which of these components (or which subset of these components) is most important in determining the overall ran-king or rating? The present study attempted to find possible answers to this question as well.
103
International Journal of Psychology: a Biopsychosocial ApproachTarptautinis psichologijos žurnalas: biopsichosocialinis požiūris
2008, 2, 99–119 p.
RElATIONSHIP BETWEEN CBM ASSESSMENT AND TEACHER-BASED ASSESSMENT OF STUDENTS’ WRITTEN EXPRESSION
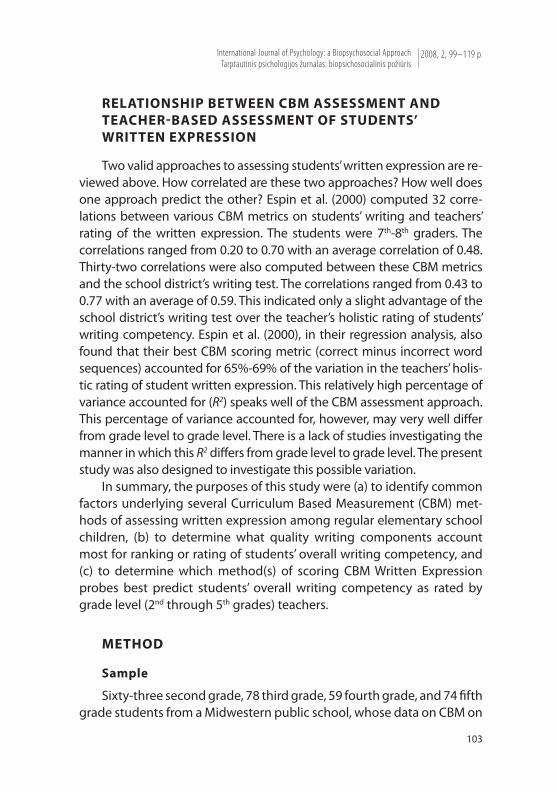
Two valid approaches to assessing students’ written expression are re-viewed above. How correlated are these two approaches? How well does one approach predict the other? Espin et al. (2000) computed 32 corre-lations between various CBM metrics on students’ writing and teachers’ rating of the written expression. The students were 7th-8th graders. The correlations ranged from 0.20 to 0.70 with an average correlation of 0.48. Thirty-two correlations were also computed between these CBM metrics and the school district’s writing test. The correlations ranged from 0.43 to 0.77 with an average of 0.59. This indicated only a slight advantage of the school district’s writing test over the teacher’s holistic rating of students’ writing competency. Espin et al. (2000), in their regression analysis, also found that their best CBM scoring metric (correct minus incorrect word sequences) accounted for 65%-69% of the variation in the teachers’ holis-tic rating of student written expression. This relatively high percentage of variance accounted for (R2) speaks well of the CBM assessment approach. This percentage of variance accounted for, however, may very well differ from grade level to grade level. There is a lack of studies investigating the manner in which this R2 differs from grade level to grade level. The present study was also designed to investigate this possible variation.
In summary, the purposes of this study were (a) to identify common factors underlying several Curriculum Based Measurement (CBM) met-hods of assessing written expression among regular elementary school children, (b) to determine what quality writing components account most for ranking or rating of students’ overall writing competency, and (c) to determine which method(s) of scoring CBM Written Expression probes best predict students’ overall writing competency as rated by grade level (2nd through 5th grades) teachers.
METHOD
Sample
Sixty-three second grade, 78 third grade, 59 fourth grade, and 74 fifth grade students from a Midwestern public school, whose data on CBM on

Max McFarland, Danelle L. Wallace
104
written expression probes were available, were the subjects included in the present study. These students’ teachers (two teachers from each of the four grades of the two elementary schools – a total of 16 teachers) were also asked to identify critical components of quality writing, to rate their students on each of those components, and to rank their students on holistic writing ability.
Instrumentation
A survey as shown in Appendix A was used in the present study. The survey included a list of the students for each individual classroom with a rating scale from 1 to 5 (1 = not highly developed to 5 = a highly deve-loped skill) for each of the three critical components of quality written expression (Conventions, Production, and Organization). Also provided on the survey was a place for each teacher to rank his or her students in order of overall written expression skill (1 = most skilled in writing and n = least skilled in writing).
Procedure
A Midwestern public school agreed to make CBM archival written expression data available to the researcher. Student examples of written expression were gathered through standard CBM probes as first iden-tified by Shinn (1989). The written expression probes had been scored by the school staff in two ways (total words written – TWW, and total words spelled correctly – TWS). One of the present study’s authors then scored the probes in additional four ways (percent of correct letter sequ-ence – PCLS, percent of total words spelled correctly – PTWSC, percent of correct word sequences – PCWS, and number of mature word choices – NMWC).
Secondly, the elementary teachers met as grade level groups to discuss and identify critical components at their grade level which best reflect quality writing. This information was then provided to one of the authors, who then designed a survey form to be completed by the tea-chers in order to quantify their perceptions (see Appendix A).
Thirdly, a cover letter was sent out with the surveys explaining the survey and the coding process as well as thanking the teachers for their cooperation. The surveys were coded to protect the individual teachers’

105
International Journal of Psychology: a Biopsychosocial ApproachTarptautinis psichologijos žurnalas: biopsichosocialinis požiūris
2008, 2, 99–119 p.
identity. Teachers then ranked their students based on overall writing skill and rated them for each critical component as previously identified (see Appendix A). Ranking was chosen over rating for assessing overall writing skill in each classroom because the teacher felt it was easier. Sur-veys were mailed to the school psychologist and the secretaries in each elementary school delivered the surveys to the teachers. Then the secre-taries collected the completed surveys and returned them to one of the present study’s authors. The survey return rate was 100%.
RESUlTS
Identification of common underlying factors among the several Curriculum Based Measurement (CBM) methods of assessing student written expression
Scores from the six methods of CBM written expression probes: (a) total words written (TWW), (b) total words spelled correctly (TWS), (c) percentage of correct letter sequence (PCLS), (d) percentage of total words spelled correctly (PTWSC), (e) percentage of correct word sequ-ences (PCWS), and (f ) number of mature word choices (NMWC), were correlated and their intercorrelations were as shown in Table 1. Next, these metrics of CBM written expression probes were subjected to a factor analysis using principal component analysis followed by varimax
table 1. Intercorrelations among Six Methods of CBM Assessment of Written Expression ( TWW, TWS, PCLS, PTWSC, PCWS, NMWC) among 274 Second through Fifth Graders
CBM probing methoda 1 2 3 4 5 61. TWW 0.98** 0.35** 0.38** 0.28** 0.88**2. TWS 0.45** 0.51** 0.30** 0.86**3. PCLS 0.89** 0.55** 0.34**4. PTWSC 0.43** 0.34**5. PCWS 0.33**
6. NMWC
Note. aTWW = Total Words Written; TWS = Total Words Spelled Correctly; PCLS = Percent of Correct Letter Sequence; PTWSC = Percent of Total Words Spelled Correctly; PCWS = Percent of Correct Word Sequences; NMWC = Number of Mature Word Choices.
** p < .01
Max McFarland, Danelle L. Wallace
106
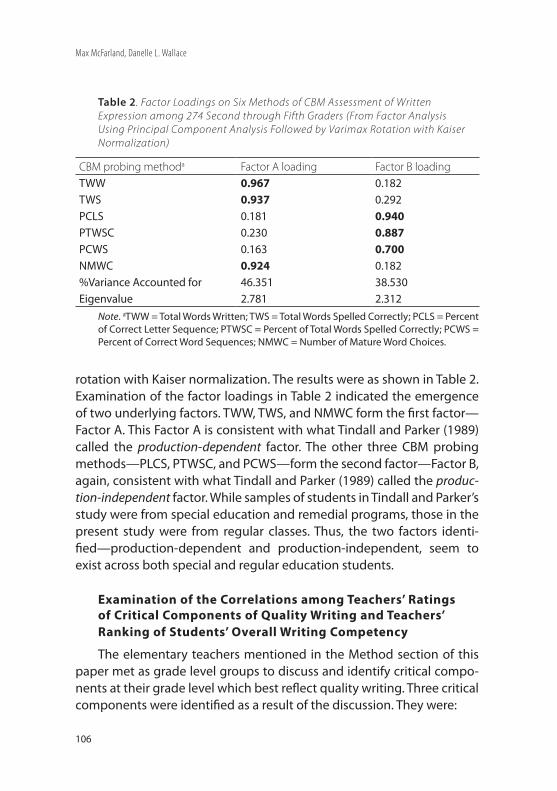
rotation with Kaiser normalization. The results were as shown in Table 2. Examination of the factor loadings in Table 2 indicated the emergence of two underlying factors. TWW, TWS, and NMWC form the first factor—Factor A. This Factor A is consistent with what Tindall and Parker (1989) called the production-dependent factor. The other three CBM probing methods—PLCS, PTWSC, and PCWS—form the second factor—Factor B, again, consistent with what Tindall and Parker (1989) called the produc-tion-independent factor. While samples of students in Tindall and Parker’s study were from special education and remedial programs, those in the present study were from regular classes. Thus, the two factors identi-fied—production-dependent and production-independent, seem to exist across both special and regular education students.
Examination of the Correlations among Teachers’ Ratings of Critical Components of Quality Writing and Teachers’ Ranking of Students’ Overall Writing Competency
The elementary teachers mentioned in the Method section of this paper met as grade level groups to discuss and identify critical compo-nents at their grade level which best reflect quality writing. Three critical components were identified as a result of the discussion. They were:
table 2. Factor Loadings on Six Methods of CBM Assessment of Written Expression among 274 Second through Fifth Graders (From Factor Analysis Using Principal Component Analysis Followed by Varimax Rotation with Kaiser Normalization)
CBM probing methoda Factor A loading Factor B loadingTWW 0.967 0.182TWS 0.937 0.292PCLS 0.181 0.940PTWSC 0.230 0.887PCWS 0.163 0.700NMWC 0.924 0.182%Variance Accounted for 46.351 38.530Eigenvalue 2.781 2.312
Note. aTWW = Total Words Written; TWS = Total Words Spelled Correctly; PCLS = Percent of Correct Letter Sequence; PTWSC = Percent of Total Words Spelled Correctly; PCWS = Percent of Correct Word Sequences; NMWC = Number of Mature Word Choices.

107
International Journal of Psychology: a Biopsychosocial ApproachTarptautinis psichologijos žurnalas: biopsichosocialinis požiūris
2008, 2, 99–119 p.
1. Conventions. This refers to the students’ skill to accurately use punctuation, spelling, and capitalization within their writing.
2. Production. This refers to the students’ skill to generate ideas and feelings with support within their writing.
3. Organization. This refers to the students’ skill to write in a logical, sequential and coherent manner.
This information was used in designing a survey form (see Appen-dix A) for each teacher mentioned in the Method section of this study to rate his/her students on their conventions, production, and organi-zation components of their writing competencies as well as to rank his/her students in terms of their overall writing skill. Thus, four measures of writing competency (three componential ratings, and one overall ran-king) emerged on the part of the teacher. The three componential rating scores were later added together to form a fifth measure of writing com-petency—the composite rating score (as opposed to the overall ranking in class) of writing skill. The Pearson correlation between the composite rating score and the overall ranking of writing skill for 236 students (not all 274 students, due to missing data) was -0.81, p < .001. The minus sign on the correlation is due to the fact that although high rating is indica-ted by a larger number, high ranking is indicated by a smaller number instead.
The intercorrelations among the three componential ratings of wri-ting skill for all students were as shown in Table 3. Note that production and organization correlate very highly with each other but each of them correlates to a lesser extent with conventions. This indicates that pro-duction and organization have more in common while the conventions component is somewhat more removed from them. A multiple regres-sion analysis was performed using these three components as predic-
table 3. Intercorrelations among the Three Components of Writing Skill among 236 Second through Fifth Graders
Writing skill component Conventions Production OrganizationConventions 0.79 *** 0.82 ***Production 0.90 ***Organization
*** p < .001
Max McFarland, Danelle L. Wallace
108
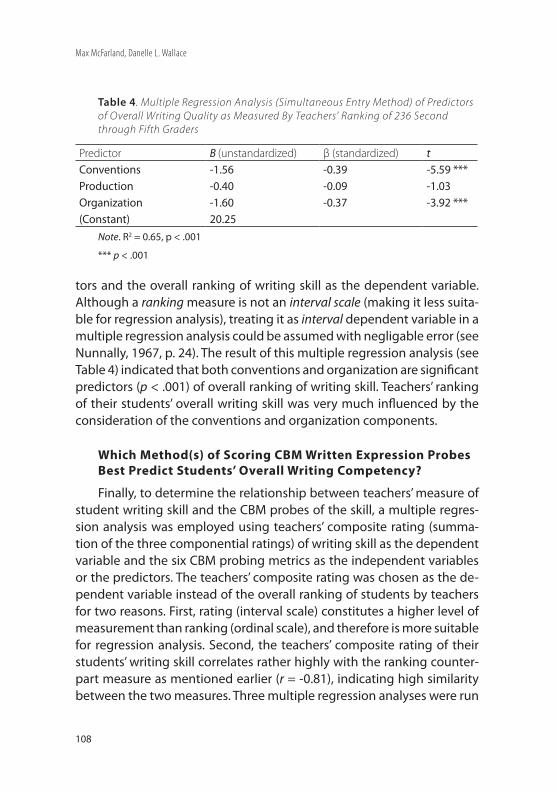
tors and the overall ranking of writing skill as the dependent variable. Although a ranking measure is not an interval scale (making it less suita-ble for regression analysis), treating it as interval dependent variable in a multiple regression analysis could be assumed with negligable error (see Nunnally, 1967, p. 24). The result of this multiple regression analysis (see Table 4) indicated that both conventions and organization are significant predictors (p < .001) of overall ranking of writing skill. Teachers’ ranking of their students’ overall writing skill was very much influenced by the consideration of the conventions and organization components.
Which Method(s) of Scoring CBM Written Expression Probes Best Predict Students’ Overall Writing Competency?
Finally, to determine the relationship between teachers’ measure of student writing skill and the CBM probes of the skill, a multiple regres-sion analysis was employed using teachers’ composite rating (summa-tion of the three componential ratings) of writing skill as the dependent variable and the six CBM probing metrics as the independent variables or the predictors. The teachers’ composite rating was chosen as the de-pendent variable instead of the overall ranking of students by teachers for two reasons. First, rating (interval scale) constitutes a higher level of measurement than ranking (ordinal scale), and therefore is more suitable for regression analysis. Second, the teachers’ composite rating of their students’ writing skill correlates rather highly with the ranking counter-part measure as mentioned earlier (r = -0.81), indicating high similarity between the two measures. Three multiple regression analyses were run
table 4. Multiple Regression Analysis (Simultaneous Entry Method) of Predictors of Overall Writing Quality as Measured By Teachers’ Ranking of 236 Second through Fifth Graders
Predictor B (unstandardized) β (standardized) tConventions -1.56 -0.39 -5.59 ***Production -0.40 -0.09 -1.03Organization -1.60 -0.37 -3.92 ***(Constant) 20.25
Note. R2 = 0.65, p < .001
*** p < .001

109
International Journal of Psychology: a Biopsychosocial ApproachTarptautinis psichologijos žurnalas: biopsichosocialinis požiūris
2008, 2, 99–119 p.
for each of the four grade levels—one using all six CBM metrics as the predictor variables, one using the three production-dependent CBM me-trics as the predictor variables, and the other using the three production-independent CBM metrics as the predictor variables. All three multiple regression analyses used teachers’ composite rating as the dependent variable.
The intercorrelations among the production-dependent CBM me-trics themselves and their correlations with the dependent variable for each of the four grade levels were shown in Table 5. The intercorrelations among the production-independent CBM metrics themselves and their correlations with the dependent variable were shown in Table 6. Note in Table 5 that there was a general trend for the intercorrelations among the three production-dependent predictors to increase from grade to grade while this trend seemed to be absent among the three production-in-dependent predictors in Table 6. On the other hand, in both Table 5 and 6, there is a strong tendency for the correlation between teacher rating and a predictor (either production-dependent or production-indepen-dent) to increase from grade to grade except for the second grade.
table 5. Intercorrelations Among Production-Dependent CBM Metrics and Teacher Composite Rating
TWS NMWC TCHRATETWW 2nd Grade 0.91 0.81 0.30 3rd Grade 0.96 0.74 0.22 4th Grade 0.96 0.81 0.36 5th Grade 0.99 0.91 0.51TWS 2nd Grade 0.66 0.48 3rd Grade 0.76 0.32 4th Grade 0.74 0.48 5th Grade 0.92 0.56NMWC 2nd Grade 0.25 3rd Grade 0.32 4th Grade 0.31 5th Grade 0.53

Max McFarland, Danelle L. Wallace
110
The results of the regression analysis using all six CBM metrics as the predictor variables were shown in Table 7. Note that the six CMB probing methods together account for about 25%-50% of the total variance of the teachers’ composite rating, depending on what grade level is being considered (see the R2’s ). Note also that while the R2 for second graders is rather high ( 0.45), it drops to a low of 0.25 in the third grade but in-creases to 0.40 in the fourth grade and goes higher to 0.50 in the fifth grade. Note further in Table 7 that while PCLS (Percent of Correct Let-ter Sequence) is the best predictor of teachers’ composite rating in the second grade (as indicated by the Beta coefficient), TWS (Total Words Spelled Correctly) is the best predictor of teachers’ composite rating in all the other grades. It seems teachers most heavily utilize correct letter sequence (part) as criterion for rating writing competency in the second grade, but then shift to whole word emphasis from the third grade on. As the students develop their skill in whole words their teachers become better at assessing their writing skill using the whole word criterion – ac-counting for larger increment of R2’s from third to fifth grade.
table 6. Intercorrelations Among Production-Independent CBM Metrics and Teacher Composite Rating
PTWSC PCWS TCHRATEPCLS
2nd Grade 0.88 0.73 0.57 3rd Grade 0.90 0.22 0.38 4th Grade 0.86 0.67 0.49 5th Grade 0.94 0.62 0.58PTWSC
2nd Grade 0.55 0.59 3rd Grade 0.18 0.34 4th Grade 0.48 0.47 5th Grade 0.55 0.50PCWS 2nd Grade 0.28 3rd Grade 0.16 4th Grade 0.51 5th Grade 0.35

111
International Journal of Psychology: a Biopsychosocial ApproachTarptautinis psichologijos žurnalas: biopsichosocialinis požiūris
2008, 2, 99–119 p.
table 7. Multiple Regression Analysis (Simultaneous Entry Method) on CBM Predictors of Students’ Overall Writing Skill as Measured By Teachers’ Composite Ratings of Second (n = 63), Third (n = 77), Fourth (n = 58), and Fifth (n = 56) Graders
Predictoraβ (standardized regression coefficients)2nd grade 3rd grade 4th grade 5th grade
TWW -0.47 -1.28 -0.97 -0.74TWS 0.54 1.49 1.16 1.10NMWC 0.30 0.16 0.14 0.06 PCLS 0.64 0.43 0.07 0.83PTWSC -0.01 -0.46 -0.03 -0.48PCWS -0.34 -0.00 0.30 -0.03
R2 = 0.45*** R2 = 0.25** R2 = 0.40*** R2 = 0.50***
Note. aTWW = Total Words Written; TWS = Total Words Spelled Correctly; PCLS = Percent of Correct Letter Sequence; PTWSC = Percent of Total Words Spelled Correctly; PCWS = Percent of Correct Word Sequences; NMWC = Number of Mature Word Choices.
** p < .01; ** *p < .001
table 8. Multiple Regression Analysis (Simultaneous Entry Method) on Production-Dependent vs. Production-Independent CBM Predictors of Students’ Overall Writing Skill as Measured By Teachers’ Composite Ratings of Second (n = 63), Third (n = 60), Fourth (n = 58), and Fifth (n = 73) Graders
Predictoraβ (standardized regression coefficients)
2nd grade 3rd grade 4th grade 5th gradeProduction-Dependent:TWW -1.13 -1.12 -1.34 -1.44TWS 1.30 1.24 1.60 1.85 NMWC 0.31 0.20 0.20 0.14R2 = 0.36*** R2 = 0.21** R2 = 0.31*** R2 = 0.37***Production-Independent:PCLS 0.50 0.35 -0.05 0.90PTWSC 0.29 0.01 0.32 -0.34PCWS -0.25 0.09 0.39 -0.01R2 = 0.39*** R2 = 0.15** R2 = 0.33*** R2 = 0.35***
** p< .01; *** p < .001

Max McFarland, Danelle L. Wallace
112
The pattern that R2 initially dropped from the second to third grade but increased thereafter remained the same when only the three pro-duction-dependent CBM metrics as predictors were used or when only the three production-independent CBM metrics as predictors were used (see Table 8). Although the pattern of the sequence of R2’s in Table 7 is similar to the two corresponding sequences is Table 8, the sizes of R2’s in Table 7 are much larger than their counterparts in Table 8. This indicates that using all six CBM metrics as predictors is better than using either the production-dependent subset or production-independent subset. Note also in Table 8 that the sizes of R2’s from the two subsets of predictors are quite comparable. The R2’s in Tables 7 and 8 are displayed graphically in Figure 1.
Figure 1. Proportion of variance ( R2 ) in teacher rating of student composite writing skill accounted for by all six CBM predictors compared with by only three production-dependent (PD) predictors, and by only three production-independent (PI) predictors.

113
International Journal of Psychology: a Biopsychosocial ApproachTarptautinis psichologijos žurnalas: biopsichosocialinis požiūris
2008, 2, 99–119 p.
DISCUSSION
The first purpose of this study was to identify common underlying factors among several Curriculum Based Measurement (CBM) methods of assessing student written expression. The factor analysis employed in the present study has identified two factors among the six CBM scoring me-trics in the sample of general education students. The two factors appe-ared to be those found in Tindal and Parker’s (1989) study of their special education and remedial program students. The production-dependent factor includes (a) total words written, (b) total words spelled correctly, and (c) number of mature word choices. The production-independent factor includes (a) percent of correct letter sequence, (b) percent of total words spelled correctly, and (c) percent of correct word sequences. The existence of these two factors suggests that using curriculum-based me-asurement to assess a student’s writing ability, in order to be complete, should include some of the production-dependent scoring metrics as well as some of the production-independent scoring metrics. Perhaps a composite CBM score, or some form of a linear combination of scores, could be constructed using metrics from both factors. The correct minus incorrect word sequences CBM metric by Espin et al. (2000) is an example or a linear combination of CBM scores although the combination inclu-des only metrics within the same factor. Future trials of combination of scores should probably include metrics from both factors.
The identification of both factors in the present study also has im-plication for the selection of CBM written expression predictors of crite-rion measures (such as student achievement in various areas) in multiple regression analyses. To maximize R2’s, CBM predictors from both factors should probably be included.
The second purpose of the present study was to determine what qu-ality writing components account most for teachers’ ranking or rating of students’ overall writing competency. Of the three writing compo-nents (conventions, production, organization), the present study found that the only two significant predictors of teachers’ overall ranking of students’ writing ability are: the convention component (e.g., punctua-tion, spelling, and capitalization), and the organization component (e.g., logical, sequential and coherent). It seems that teachers use these two criteria heavily in judging the overall writing ability of their students. Ho-

Max McFarland, Danelle L. Wallace
114
wever, generalization to higher level grades than elementary is cautio-ned. It may be possible that in secondary and post-secondary education, judgment of writing quality may rely more on the production compo-nent (generate ideas and feelings). Future studies may shed some light on this matter.
The third purpose of the present study was to determine which method(s) of scoring CBM Written Expression probes best predict stu-dents’ overall writing competency as rated by grade level (2nd through 5th grades) teachers. As indicated in Table 7, using the Beta coefficients of the multiple regression analyses as guide, the best CBM predictor for the second graders was percent of correct letter sequence—an analytic (word parts) measure. However the best CBM predictor for all the other gra-des (3rd to 5th) was total words spelled correctly—a synthetic (whole word) measure. According to this study, teachers most heavily utilize correct letter sequence (part) as criterion for rating writing competency in the se-cond grade, but then shift to whole word emphasis from the third grade on. This emphasis on word parts in the very early grades corresponds to Ehri’s (1997) alphabetic phase. Although the duration of this phase is not the same in all children, many children would advance to the more word whole or orthographic phase by the third grade (see Kirby, Parrila & Pfeiffer, 2003). Projecting from this trend, it is conceivable that CBM scoring metrics using higher linguistic units such as phrases should play a more important role in predicting teachers’ holistic rating of student writing competency in the secondary and post-secondary levels of edu-cation. Hunt’s (1968) T-Unit Length (the number of words in the finished composition divided by the number of clauses) may prove to be a better predictor of teachers’ holistic rating of student writing ability in higher grades.
It is also interesting to note in Table 7 that while the R2 for second graders is rather high ( 0.45), it drops to a low of 0.25 in the third grade but increases to 0.40 in the fourth grade and goes higher to 0.50 in the fifth grade. The initial drop of R2 from the second to third grade might be due to the shift in teacher’s emphasis from word parts (alphabetic) in the second grade to word wholes (orthographic) in later grades as men-tioned in the previous paragraph. This pattern of initial drop and later increase in R2’s was the same when only production-dependent CBM metrics were used as predictors, or when only production-independent CBM metrics were used as predictors as shown in Table 8. Also evident in

115
International Journal of Psychology: a Biopsychosocial ApproachTarptautinis psichologijos žurnalas: biopsichosocialinis požiūris
2008, 2, 99–119 p.
Table 8 is the fact that the combined predictive power (as indicated by the R2’s) of the three production-dependent CBM metrics is quite com-parable to that of the three production-independent CBM metrics for all grade levels. However, as indicated in Table 7 and Figure 1, the increase in all R2’s was quite substantial (up to 15% increase in fifth grade) when all six predictors were used—indicating that all six CMB measures should be used in predicting teacher’s rating of student’s overall writing skill.
Let’s examine Table 7 again. It seems that teachers in the second grade could judge a student’s overall writing ability quite well (as indi-cated by higher R2 ) using the correct letter sequence (part) as criterion. Much of second grade writing still focuses on letters and letter sequ-ences. However, the focus most likely shifts to whole word emphasis in the third grade. Since the whole-word skill of the students is at the initial stage, the prediction of writing ability based on whole word jud-gment suffers, resulting in smaller R2. As the students develop their skill in whole words from the third grade on, their teachers become better at assessing their writing skill using the whole word criterion—accounting for larger increment of R2’s from third grade (R2 = 0.25, or multiple corre-lation = 0.50) to fourth grade (R2 = 0.40, or multiple correlation = 0.63) to fifth grade (R2 = 0.50 or multiple correlation = 0.71). It is therefore not surprising when Espin et al. (2000) reported even higher R2’s ranging from 0.65 to 0.69 for grades 7 and 8 in their regression analyses using CBM scoring metrics to predict teachers’ holistic rating of student wri-ting proficiency.
Finally, the tendency for the CBM written expression metrics to more highly intercorrelate among themselves (especially among pro-duction-dependent measures, see Table 5; as well as Malecki & Jewell, 2003) and to better predict teacher’s rating of student writing skill (see Tables 5 & 6) as we go from lower to higher grades (with the exception of, perhaps, second grade), may also be just the result of measurement characteristics of the CBM written expression metrics. CBM writing sco-res (especially production-dependent scores) show strong tendency to increase from lower to higher grades. This was evident in Malecki and Jewell’s (2003) developmental study which showed increasing CBM wri-ting average scores from earlier elementary grades (first & second), to elementary grades(third through fifth), to middle school grades (sixth through eighth). The higher CBM writing score as a function of higher

Max McFarland, Danelle L. Wallace
116
grade is analogous to using longer test for higher grade. The fact that longer tests are more reliable (or tend to produce higher correlations) is a well known rule in the literature of Classical Test Theory (CTT). See, for example, Embretson and Reise (2000, p. 18). Thus, the increasing ability of CBM written expression metrics to predict writing achievement as the grade level increases may just be the result of CBM’s own measurement artifact, rather than the result of teachers focusing on whole word more and more in later grades. Future research could shade more light on this matter.
ReferencesBradley-Johnson, S., & Lesiak, J.L. (1989). Problems in written expression: Assessment
and remediation. New York, N.Y.: The Guilford Press.Charney, D. (1984). The validity of using holistic scoring to evaluation writing: a
critical overview. Research in the Teaching of English, 18, 65-81.Deno, S.L., Marston, D., & Mirkin, P. (1982). Valid measurement procedures for con-
tinuous evaluation of written expression. Exceptional Children, 48, 386-371.Ehri, L. C. (1997). Sight word learning in normal readers and dyslexics. In B. Blach-
man (Ed.), foundations of reading acquisition and dyslexia: Implications for early intervention (pp. 163-189). Mahwah, NJ: Laurence Erlbaum Associates.
Embretson, S. E., & Reise, S. P. (2000). Item response theory for psychologists. Mahwah, NJ: Lawrence Erlbaum Associates.
Espin, C., Shin, J., Deno, S., Skare, S., Robinson, S., & Benner, B. (2000). Indentifying indicators of written expression proficiency for middle school students. Journal of
Special Education, 34(3), 140-153.Fewster, S., & MacMillan, P. D. (2002). School-based evidence for the validity of
curriculum-based measurement of reading and writing. Remedial and Special Education, 23(3), 149-156.
Hammill, D., & Larsen, S. (1978). Test of written language. Austin, TX: PRO-ED.Hammill, D., & Larsen, S. (1988). Test of written language-2. Austin, TX: PRO-ED.Howell, K.W., Fox, S.L., & Morehead, M.K. (1993). Curriculum based evaluation: Te-
aching and decision making. Pacific Grove, CA: Brooks/Cole Publishing Com-pany.
Hunt, K., & Others. (1968). An instrument to measure syntactic maturity, preliminary version. (Report No. BR-6-2253). Tallahassee, Florida: Florida State University. (ERIC Document Reproduction No. ED 020 926)
Kirby, J. R., Parrila, R. K., & Pfeiffer, S. L. (2003). Naming speed and phonological awareness as predictors of reading development. Journal of Educational Psychology, 95(3), 453-464.

117
International Journal of Psychology: a Biopsychosocial ApproachTarptautinis psichologijos žurnalas: biopsichosocialinis požiūris
2008, 2, 99–119 p.
Lee, L., & Cantor, S. M. (1971). Developmental sentence scoring. Journal of Speech and Hearing Disorders, 36, 335-340.
Malecki, C. K., & Jewell, J. (2003). Developmental, gender, and practical considera-tions in scoring Curriculum-Based Measurement writing probes. Psychology in the Schools, 40(4), 379-390.
Millard, T. L. (1997). Moving beyond the rhetoric: Developing writing competency for global changes in higher education. Paper presented at the 15th international conference of the International Council for Innovation in Higher Education, Kobe, Japan, November 2-6, 1997. (ERIC Document Reproduction No. ED 458 611) Nebraska State Board of Education. (1998). Leading educational achieve-ment through rigorous Nebraska standards. Lincoln, NE: Nebraska Department of Education.
Nunnally, J. C. (1967). Psychometric theory. New York: McGraw-Hill.Pomplun, M., Sundbye, N., & Kelley, J. (1999). Exploring gender differences in ans-
wer to constructed-response reading items. Scientific Studies of Reading, 3(1), 55-67.
Shinn, M. (Ed.). (1998). Advanced applications of curriculum based measurement. New York, N.Y.: The Guilford Press.
Shinn, M. (Ed.). (1989). Curriculum based measurement: Assessing special children. New York, N.Y.: The Guilford Press.
Tindal, G., & Parker, R. (1989). Assessment of written expression for students in compensatory and special education programs. Journal of Special Education, 23, 169-183.
Tindal, G., & Parker, R. (1991). Identifying measures for evaluating written expres-sion. Learning Disabilities Research & Practice, 6, 211-218.
Videen, J., Deno, S. L., & Marston, D. (1982). Correct word sequence: A valid indicator of proficiency in written expression (Research Report No. 84). Minneapolis: Uni-versity of Minnesota, Institute for Research on Learning Disabilities.
RAŠYMO ĮGŪDŽIŲ VERTINIMAS MOKYMO PROGRAMA PAGRĮSTAIS METODAIS BEI MOKYTOJŲ POŽIŪRIU Į ESMINIUS RAŠYMO KOKYBĖS KOMPONENTUS
Max McFarland, Danelle L. Wallace
Santrauka. Tyrimo tikslai. Straipsnyje analizuojami II-V klasių mokinių rašymo įgūdžiai ir jų vertinimo metodai. Tyrimu buvo siekiama kelių tikslų : nustatyti bendruosius faktorius, kurie sieja keletą praktikoje naudojamų Mokymo programa pagrįstų me-todų, rašymo įgūdžiams vertinti (Curriculum-Based Measurement, CBM); atskleisti, kokie rašymo kokybės komponentai yra stipriausiai susiję su mokinių bendrosio-mis rašymo kompetencijomis ir nustatyti, kuris Mokymo programa pagrįsto rašymo

Max McFarland, Danelle L. Wallace
118
testo kodavimo būdas geriausiai prognozuoja mokytojų vertinamą mokinių rašymo kompetenciją II-V klasėse. Metodai. Straipsnyje analizuojami 274 antrų – penktų klasių mokinių rašymo įgūdžiai, kurie buvo nustatyti analizuojant mokinių rašymo pavyzdžius Mokymo programa pagrįstu vertinimo metodu. Mokinių mokytojai taip pat buvo prašomi įvertinti mokinių rašymo pavyzdžius ir išskirti esminius jų rašymo kokybės komponentus. Rezultatai, išvados. Mokymo programa pagrįstų metodų ra-šymo įgūdžiams vertinti faktorinė analizė išskyrė du su rašymo kokybe susijusius faktorius: su produkcija susijusį ir su produkcija nesusijusį. Daugialypė regresinė analizė parodė, kad mokytojų holistinį mokinių rašymo kokybės vertinimą antroje klasėje geriausiai prognozuoja teisingų raidžių sekų procentas; aukštesnėse klasėse – bendras teisingai parašytų žodžių skaičius. Daugialypė koreliacija tarp mokytojo vertinimo ir objektyvių, mokymo programa pagrįstų, rašymo rodiklių antroje klasėje buvo 0,67, trečiojoje – 0,50, 0,63 ir 0,71 vėlesnėse klasėse.
Pagrindiniai žodžiai: rašymo įgūdžiai, mokymo programa pagrįsti metodai rašymo įgū-džiams vertinti, rašymo kokybės komponentai.
Received November 4, 2008 Accepted December 10, 2008

119
International Journal of Psychology: a Biopsychosocial ApproachTarptautinis psichologijos žurnalas: biopsichosocialinis požiūris
2008, 2, 99–119 p.
APPENDIX A
Written Expression Teacher Survey
Instructions:1. Under the conventions column please circle a rating for each stu-
dent on their skill to accurately use punctuation, spelling, and capitaliza-tion within their writing.
2. Under the production column please circle a rating for each stu-dent on their skill to generate ideas and feelings with support within their writing.
3. Under the organizational column please circle a rating for each student on his or her skill to write in a logical, sequential and coherent manner.
4. In the overall ranking column please rank each student in your classroom according his or her skill in overall writing.
Student Name
(Circle One)1=Not highly developed
5=Highly developed
1=most skilled n=least skilled
Conventions Production Organization Overall Ranking1. John Doe 1 2 3 4 5 1 2 3 4 5 1 2 3 4 5 2. Suzie Cue 1 2 3 4 5 1 2 3 4 5 1 2 3 4 53. xxxxxxx 1 2 3 4 5 1 2 3 4 5 1 2 3 4 54. xxxxxxx 1 2 3 4 5 1 2 3 4 5 1 2 3 4 55. xxxxxxx 1 2 3 4 5 1 2 3 4 5 1 2 3 4 56. xxxxxxx 1 2 3 4 5 1 2 3 4 5 1 2 3 4 57. xxxxxxx 1 2 3 4 5 1 2 3 4 5 1 2 3 4 58. xxxxxxx 1 2 3 4 5 1 2 3 4 5 1 2 3 4 59. xxxxxxx 1 2 3 4 5 1 2 3 4 5 1 2 3 4 510. xxxxxxx 1 2 3 4 5 1 2 3 4 5 1 2 3 4 511. xxxxxxx 1 2 3 4 5 1 2 3 4 5 1 2 3 4 512. xxxxxxx 1 2 3 4 5 1 2 3 4 5 1 2 3 4 5...N. xxxxxxx 1 2 3 4 5 1 2 3 4 5 1 2 3 4 5