B4, Advanced use of Custom Fields in Empower - Waters · PDF fileB4, Advanced use of Custom Fields in Empower Rune Buhl Frederiksen, Manager, ... So, high resolving, high sensitivity
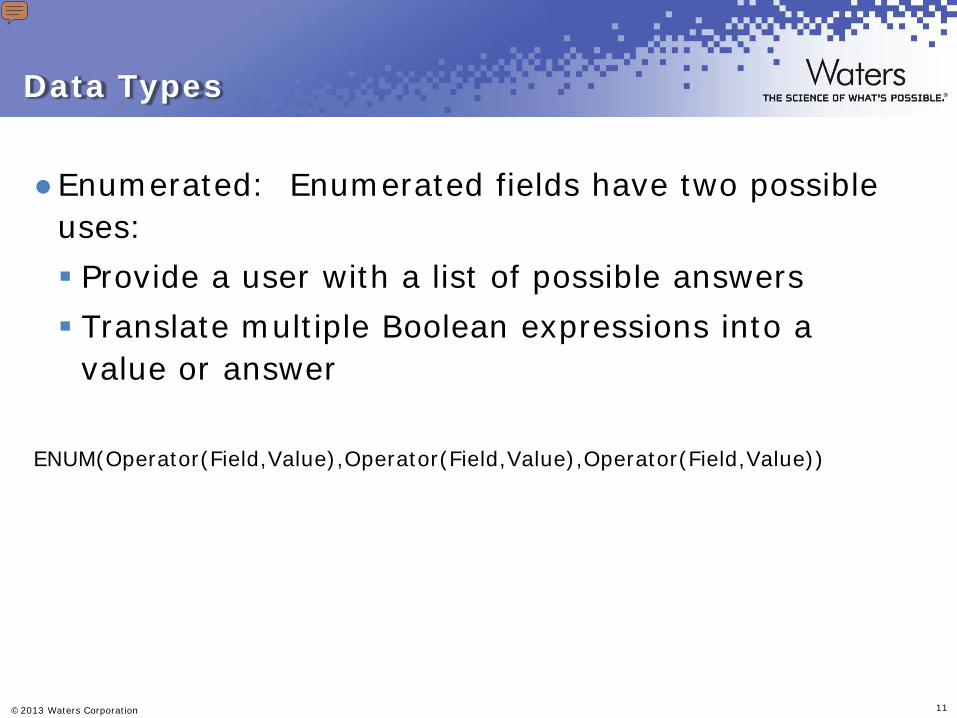
Enumerated lists offer these advantages over Text Data Type fields: They are easier to select from a list rather than type in a field. The information for each field is in a consistent and in an expected format. Spelling and naming inconsistencies errors are reduced. If the proper choice is not available, the analyst may specify a value, if allowed. Note: The translation may be a value, text, or field. The USE AS selection determines the output from the field. USE AS also translates your position into a text field. Bear in mind this important information when using enumerated data types: ENUM can be used when the data type is ENUM or in a Real type formula. ENUM must appear at the beginning of a formula if it is created for an ENUM type custom field. There cannot be more than one ENUM function in any formula. Only Boolean functions, or Boolean operators, are allowed in the first-level parentheses.
Complex samples – Many components at disparate levels
No common approach – Many times serial iterative process
– Too many experiments
Data evaluation is difficult – Information is complicated
– Large volume for manual review
– Not quantitative
Presenter
Presentation Notes
Method development is not without it’s own challenges. It can be time-consuming and difficult. So, we will be looking for ways to streamline the process and improve efficiency. Often, the analyses are complex with components present at very different levels. So, high resolving, high sensitivity methods are generally needed. In many companies and laboratories, there is no common approach for method development. Often a serial, iterative process is employed that requires many injections. Using a systematic approach will improve efficiency. As samples, become more complex, data evaluation, even assigning peaks during the development process, is difficult. Exploring a sufficient number of conditions during the process of developing a method generates very large volumes of data and without good tools, manual review is tedious.
A Quality by Design Approach to Method Development
Method Screening
Select column & solvent using quantitative Trend Responses
Formal Method Development & Optimization
Method Validation
Formal experiments to demonstrate
method robustness
Characterize and model ALL study parameter effects on ALL critical method performance attributes
Mean Method Performance Models
Method Robustness Models
• Establish ICH Design Space
• Identify Optimal Method
• Establish Operating Space
Presenter
Presentation Notes
With Fusion, the mean performance and mean robustness requirements are used to generate the Design Space. In this way, there is a consideration of robustness during development. Before going to validation the user will know where the method works and also where it works robustly. They will have much more information about the method before moving it along into validation. The method which is put forward for validation is much more likely to succeed thereby reducing the chances of having to loop back through the cycle like we saw in the previous model.
To illustrate this systematic approach to method development and some of the tools that can facilitate the process, we are going to develop a method for determining the impurities of glimepiride. Glimeperide is a Type 2 Diabetes drug. Having been on the market for awhile, there is published information on the drug; up to 5 impurities have been reported and the analysis is complicated by the presence of isomeric forms. The published methods include normal and reversed-phase methods with long run times. So, our goal is to develop a method to profile the impurities in glimepiride. We will degrade a sample of glimepiride to generate a composite sample that will be used to develop the method. We want to achieve baseline resolution of all peaks with no co-elutions to facilitate quantitation should that be necessary based on the amount of impurity present. The λmax of glimepiride is 228 nm and its mass is 490.6. It is soluble in methanol.
When planning the method scouting experiments for this case study, a logical first step is to identify the tools that we will use. To run this challenging separation, we will use four 50 mm columns of widely varying selectivity to scout for starting conditions. Without the use of these shorter columns and column manager for scouting, the amount of time to scout multiple conditions could be time prohibitive. For running the scouting experiment and acquiring the data, we will use 4 columns of selectivity and a column manager to automate the process. A photodiode array detector (PDA) will be used to establish peak purity and a single quadrupole mass detector will be used to assign and track peaks. We'll use the power of Empower 2 Software to control the system and acquire data, as well as significantly simplify the data evaluation and reporting process with custom calculations and data plots. To assist with data archival and report generation, we'll incorporate NuGenesis SDMS with Vision Publisher to capture and catalog our work.
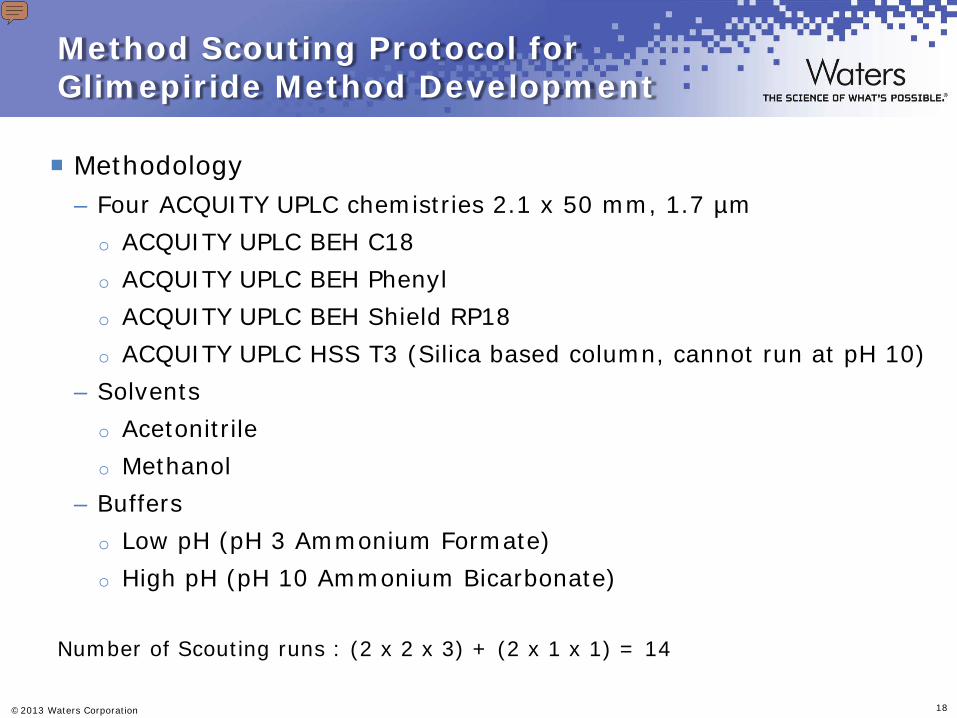
Method Scouting Protocol for Glimepiride Method Development
Methodology – Four ACQUITY UPLC chemistries 2.1 x 50 mm, 1.7 µm
o ACQUITY UPLC BEH C18
o ACQUITY UPLC BEH Phenyl
o ACQUITY UPLC BEH Shield RP18
o ACQUITY UPLC HSS T3 (Silica based column, cannot run at pH 10)
– Solvents
o Acetonitrile
o Methanol
– Buffers
o Low pH (pH 3 Ammonium Formate)
o High pH (pH 10 Ammonium Bicarbonate)
Number of Scouting runs : (2 x 2 x 3) + (2 x 1 x 1) = 14
Presenter
Presentation Notes
The specifics of the method scouting protocol are listed here. We will use the four columns listed, two solvents, methanol and acetonitrile, and two different pH buffers, one high pH, the other low pH. Our systematic scouting approach employs 4 different UPLC column chemistries, 2 organic modifiers and 2 pH values. We can use these variables to evaluate different types of chromatographic and mobile phase selectivity. You’ll recall from the earlier presentation, that pH can have a dramatic effect on the separation.
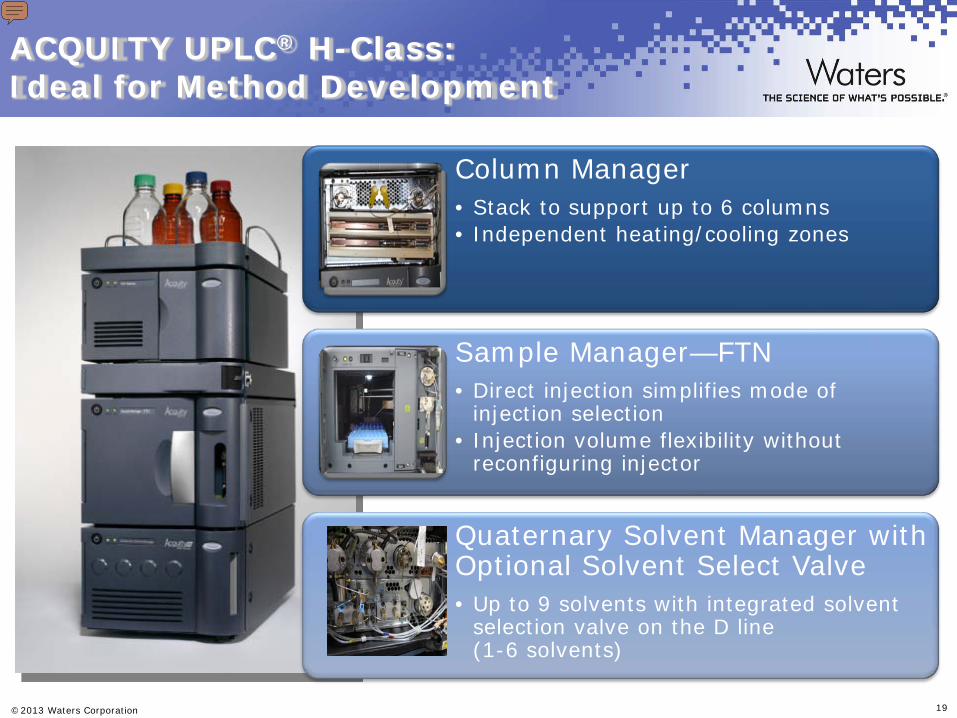
ACQUITY UPLC® H-Class: Ideal for Method Development
Column Manager • Stack to support up to 6 columns • Independent heating/cooling zones
Sample Manager—FTN • Direct injection simplifies mode of
injection selection • Injection volume flexibility without
reconfiguring injector
Quaternary Solvent Manager with Optional Solvent Select Valve • Up to 9 solvents with integrated solvent
selection valve on the D line (1-6 solvents)
Presenter
Presentation Notes
First, there’s the obvious quaternary multi-solvent mixing. This low pressure mixing capability means that in a method development group, where conditions and mobile phases are constantly changing, chemists can use the system to do some of the solvent preparation for them (Dial-a-Mix or AutoBlend). This results in saved time, lower solvent preparation variation, and lower solvent waste and maintenance (vs. premixed buffers). And with the optional internal solvent select valve on the D-line there is the potential to have 5 additional solvents, or up to 9 total. How many of you have been asked for support of more than 4 columns or heating/cooling zones to help extend column life? The H-Classes “bankable” 2-column managers facilitate the use of up to 6 columns. Usability and accessibility of the column manager has improved, as well as temperature control and consistency between a single column heater and the column manager to assist in method transfer. Finally, the design of the flow through needle means that reversed phase and HILIC separations can be run back to back, which brings exciting selectivity options to the method developer. The injection mechanism is much more similar to existing HPLC systems, so it’s also a more comfortable transition for users—not to mention simplifying transfer considerations. ___________________ Here is a model of the new column oven. This will be available very early in Q2 2010. The unit features capability of holding two columns up to 150mm in length, up to 4.6mm ID. Each column has individually controlled cooling and heating capability, with an operating temperature range of 4 ° to up to 90°C. Customers will be able to use up to three column manager modules on the same system, so they can actually run up to six columns, each with an individually controlled temperature zone. There are still by-pass and waste lines in the new design. Feedback we have received from many users of today’s column manager product indicate that while it’s the functional, they dislike having a single temperature zone. In cases where a method required elevated temperature setting on a column, all columns were exposed to this higher temperature, and they often replaced all columns even if only one were used. The new design addresses this with individually controlled temperature You can also see the two 7 port, six position valves are much easier to access in the new design. These valves are designed for easy service and are the “press in – press out” design.
Empower automatically identifies potentially impure peaks
Presenter
Presentation Notes
Within Empower 2, we'll use the PDA Peak Purity Algorithm to determine the homogeniety of a peak. Here are some examples showing a homogeneous peak vs. a non-homogeneous peak. If the purity angle, in green, is below the blue line, the purity threshold, the peak is spectrally pure, essentially meaning no co-elution. With a non-homogenous peak, the point of maximum difference in the spectra can be denoted, shown here with the “M” indicating a co-elution. Multiple purity passes will assist in determining multiple co-elutions
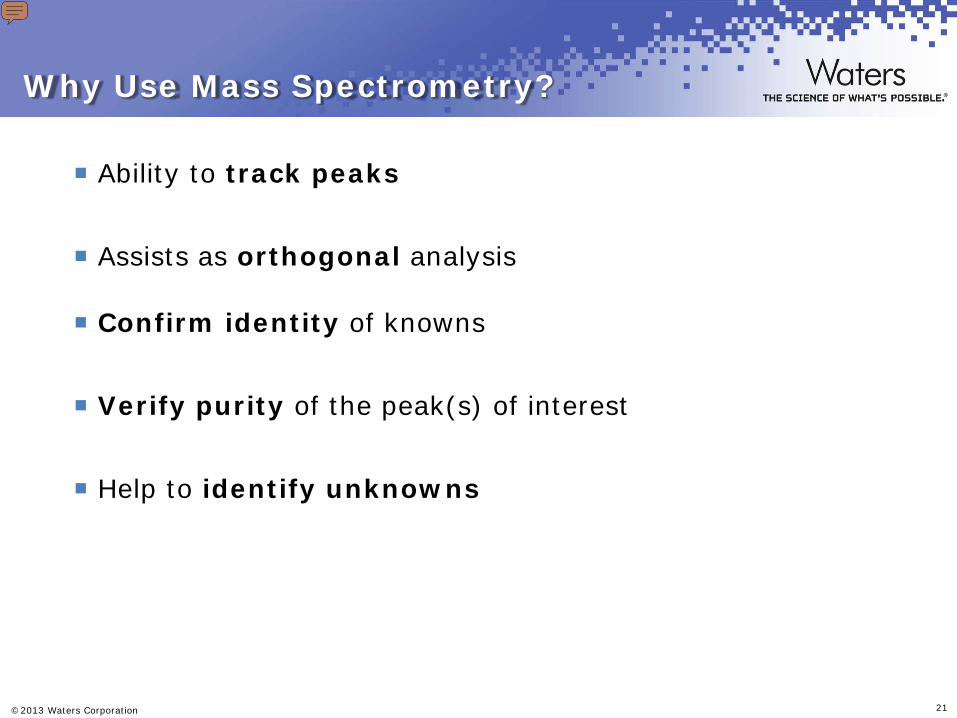
Many people believe mass spectrometry to be a technique that is too complex or costly for use in the method development laboratory. In this case study, we find it to be invaluable to efficiently track peaks, confirm identity of know compounds, verify purity, and help identify unknown peaks. Without MS, we spend much more time evaluating and comparing UV spectra and waiting for other laboratories to provide MS identification of unknowns. Tracking peaks based on their m/z ratios also saves a considerable amount of time, especially when different columns and pH's provide good selectivity differences for the method.
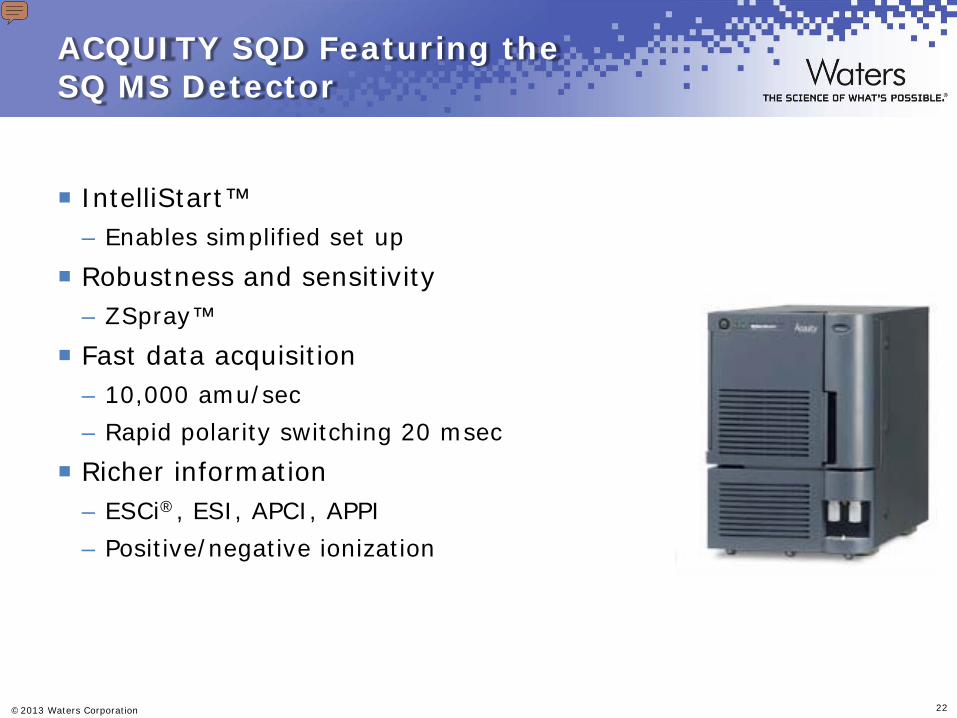
The use of MS in the method development laboratory has been simplified dramatically with the introduction of IntelliStart on the ACQUITY SQD System. If you are used to operating in an Empower or Millennium environment, you will find that with IntelliStart's automatic system setup and tuning, MS becomes as easy to use as PDA. The ACQUITY SQD Detector incorporates ZSpray, a dual orthogonal sampling ionization source design, for maximum robustness and sensitivity. The SQD has been designed with fast data acquisition capability for full compatibility with UPLC separations. Richer information is easily obtained with rapid polarity switching capability and ESCi multimode ionization for APCI or ESI in the same run. There is an optional APPI source also.
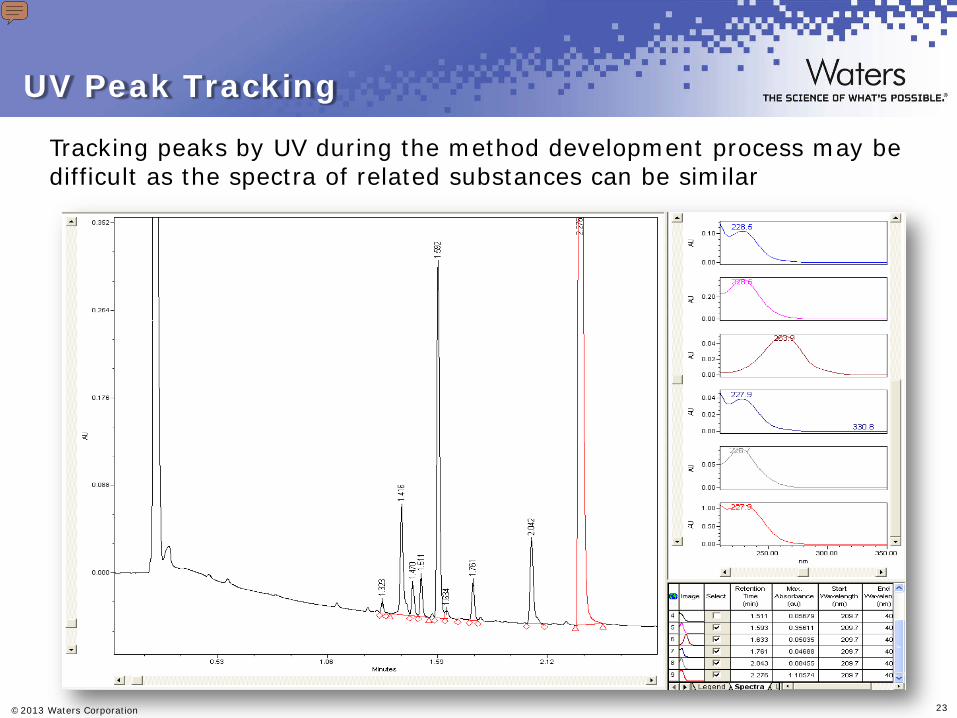
Tracking peaks by UV during the method development process may be difficult as the spectra of related substances can be similar
Presenter
Presentation Notes
Scouting Injection: BEH C18, pH 10, ACN Transition slide showing why one would rather perform MS peak tracking. Points to discuss: - Impurities have similar UV. Hence peak tracking is difficult by just UV as highlighted in red - You can review this information immediately in an Empower 2 by integrating the PDA detected peaks and selecting the spectrum index Plots can be annotated for easier viewing Since the data was collected by the PDA using Totalplot (210nm-400nm), various wavelengths can be explored an/or adjusted in the “Contour Plot” tab to pick out peaks hidden in the baseline. In this data, the contour allowed us to adjust the wavelength to a high value (360nm) to offset the absorbance from the mobile phase. It is a very useful tool to identify low absorbing peaks or peaks that absorb differently than the API. This is why the intensities are different than the ones observed at 228nm in the previous scouting chromatograms
…with MS data, the peaks can now be easily tracked as well as any additional peaks invisible to UV detection
Presenter
Presentation Notes
Scouting Injection: BEH C18, pH 10, ACN By comparison, it is easy to see the differences in the mass spectra of the individual peaks. Within Empower, treatment of MS data is the same as PDA--they both provide 3-dimensional data that allow for spectral generation by integrating the selected peak.
Using the mass spectra it is easy to track peaks even with selectivity changes and changes in elution order. In the example shown here, the m/z of peak 3 is used to track where it is in the chromatogram. The elution order is confirmed by ACQUITY SQD for all peaks throughout the scouting process as we change the scouting pH from 3 to 9. By simply integrating the detected peak, we get a m/z ratio that easily allows us to confirm the position of peak 3.
Setting Up Method Scouting Experiments with Empower Templates
Key to data visualization Essential for streamlining sequential workflow
Template Defined User Defined Custom Fields
Presenter
Presentation Notes
While you might think that setting up a scouting experiment with all of the combinations is a daunting task, but it really isn’t with Empower 2 templates. You can utilize the template as a starting point and save it. You can use the template for the future experiments. Shown here is an example sample set method for Empower custom field creation for method scouting. Column Position is defaulted in the software when connected to a column manager and helps to set up the sequential workflow. If you typically use the same solvents or set of columns, the custom field can be created as drop down menu fields with the pre-filled entries. (Note - I usually have preset drop downs for buffer type, column type for ACQUITY projects and different columns in ACQUITY projects, and then I will have pH created as a “required entry” before I run the sample set such that it reminds me to properly document everything before I run.) The custom fields for column type, solvent and pH are key and used for visualizing and mining the data after it is all acquired.
Importance of Scouting with Various Selectivity Tools
ACQUITY UPLC BEH C18
ACQUITY UPLC BEH Shield RP18
ACQUITY UPLC BEH Phenyl
ACQUITY UPLC HSS T3
Glim
epirid
e G
limep
irid
e G
limep
irid
e G
limep
irid
e
3 2 4 6
5
7
3,4
2 6
5
7
3 2 4
6
5
7
2 3,4
6
5
7
Acetonitrile pH 3.0
AU
0.00
0.14
0.28
0.42
AU
0.00
0.14
0.28
0.42
AU
0.00
0.14
0.28
0.42
Minutes0.00 1.00 2.00 3.00 4.00 5.00
Acetonitrile pH 10.0
3 2 4
6
7
Glim
epirid
e
5
3 2
4 6
7
Glim
epirid
e 5
3 2
4 6
7
Glim
epirid
e
5
Manually tracking and labeling known peaks of interest peaks (approx. 4 hours). How much time is now needed to evaluate each of the other 7 chromatogram’s various separation attributes?
Presenter
Presentation Notes
Using our selectivity tools together in our systematic approach, we can see that changing columns and pH with acetonitrile provides several opportunities for elution order changes and differing selectivities. As we'll see in the next slide (insert slide 20), tracking the movement of these peaks is greatly simplified using MS. If we hadn’t been able to use the MS data to identify the peaks, manually tracking and labeling the peaks of interest in all of this data would have taken about 4 hours. For the sake of time today, we won't show the corresponding methanol results.
Need to monitor selectivity changes Up to 14 or more injections
Data to evaluate
Resolution values per peak Retention of API Various peak widths Tailing Area%
Information can lead up to a matrix of results essential to making the proper method development decision
14 runs, 7 separate decision factors, up to 20
peaks, 2 modes of detection
Data to evaluate: 1 run = 280 resulting values 14 runs = 3920 resulting values
Then COMPARE to each other!!
Presenter
Presentation Notes
While running the scouting experiment and acquiring all of the data is completely automated, without the proper data management tools, evaluation of the data is quite burdensome and time-consuming. For example, in the scouting experiment that we ran, there were 14 injections made in which selectivity changes had to be monitored. Then, to evaluate the data, we will use 5 different performance characteristics, resolution values per peak, retention, peak widths, tailing, and area %. So, there will be a matrix of results that we will need to evaluate in order to make the proper decisions going forward. This matrix will include 14 runs, 7 decision factors, 20 peaks, and 2 modes of detection. There is an enormous amount of data that needs to be evaluated and then compared.
So, while we have an informatics platform to manage and distribute information, we still have the issue of reviewing large volumes of data from the scouting experiment. Processing and interpreting the data manually is subjective and with the complexity and volume of the data, very time consuming.
Sorting and visualization to evaluate: – Peak attributes
o Area, RT, width, number of peaks
o System suitability results
• Resolution, tailing, k’
– Purity
o Flags impure peaks
Decision Making Tools – Appropriate calculation and reporting templates
Presenter
Presentation Notes
Using Empower 2, we can use a number of different peak attributes, such as area%, retention time, resolution, k’ values, etc. to sort through and visualize the data. Flags can also be set to identify coelutions. Custom calculation fields and reporting templates can be used to make decisions and select the chromatograms representing the best separations.
*Scouting injection of Glimepiride on ACQUITY Phenyl, ACN, pH 3.0 Labeled only major peaks of interest
2
4
7 6
5
3
Glim
ep
irid
e
Presenter
Presentation Notes
Here’s an example from the scouting experiment showing system suitability results in Empower. (Note: User would need the option installed) We will use the system suitability parameters to sort and evaluate our data. Note: not available in Masslynx (in case anyone asks)
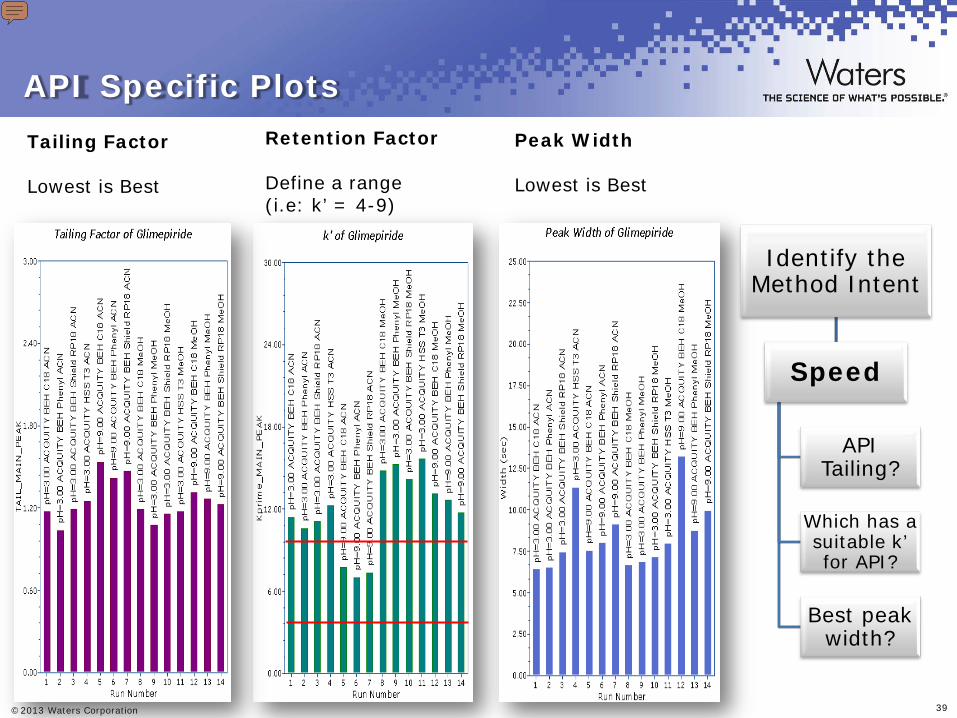
API assay identification, content uniformity intent?
Least amount of tailing for
the API?
Which has a suitable k’ for
API?
Which exhibits the best peak
width?
Presenter
Presentation Notes
To help focus us during data evaluation process, it is important to keep in mind the intent of the method. Is it resolution or speed or perhaps a combination of both with one being of higher priority. If our primary concern is resolution, then we would mine the data by greatest number peaks and then evaluate based on our predefined criteria. If our primary concern is speed for API assay for example, then we would rank the results on parameters such as API tailing, k’ and peak width.
System Suitability Summary Bar plot for Total_Peaks_GT_1pct
Required Custom Fields : Peaks_GT_1pct : GT(%Area,1.0) Boolean field Use as position all peaks with %Area>1.0 results in a 1=Significant. In subsequent CF calculations the value 1 will be used. Total_Peaks_GT_1pct : SUM(Peaks_GT_1pct) This will give the total number of peaks with %Area>1.0
One of the fastest ways to roughly mine the method scouting data is to determine the conditions that separated the most number of peaks of interest > x%
Required Custom Fields : PurityFactor : Purity Threshold – Purity Angle If peaks is pure Threshold>Angle and then PurityFactor >0 Flag_Purity : GT(PurityFactor,0) Boolean field If peak is NOT pure Flag_Purity = 1 Impure_Peaks : SUM(Flag_Purity) This will give the total number of impure peaks
System Suitability Summary Bar plot for Impure_Peaks
Required Custom Fields : Flag_Critical_Rs_GTE_1o5 : GTE(USP Resolution,1.5) Boolean field Use as position all peaks with USP Rs≥1.5 results in a 1=Yes. In subsequent CF calculations the value 1 will be used. Total_Peaks_with_Rs_GT_1o5 : SUM(Flag_Critical_Rs_GTE_1o5) This will give the total number of peaks with Rs≥1.5
How many peaks meet the Resolution Criteria ?
System Suitability Summary Bar plot for Total_Peaks_with_RS_GTE_1o5 Task : Find the number of peaks
System Suitability Summary Bar plot for Total_Peaks_with_RS_LT_1o5
Required Custom Fields : Flag_Critical_Rs_LT_1o5 : LT(USP Resolution,1.5) Boolean field Use as position all peaks with USP R<1.5 results in a 1=Yes. In subsequent CF calculations the value 1 will be used. Total_Peaks_with_Rs_LT_1o5 : SUM(Flag_Critical_Rs_LT_1o5) This will give the total number of peaks with Rs<1.5
These plots are more specific to a peak(s) of interest. Tailing, k’ (retention factor), and peak width of API are to aid in the evaluation of the main peak. Great for Content Uniformity Assays, API Identification Assay where speed is a primary requirement for the method.
The “Injection Score” is an estimation of which conditions are suitable to explore for further optimization. In this this particular example, the injection score equation included factors about: Total peaks found Total peaks above 1% area Run time Average peak width Separation space
Injection score equations are recommended to include a weighted relationship of the user’s goals and criteria
Presenter
Presentation Notes
A combination of the custom calculations used for the previous plotting reports can be used to determine injection scores to simplify the evaluation process even further. They can be created individually based on the user’s criteria for importance. And the results can be filtered criteria of importance using data filters. This is shown in the table below the plot. In this example the equations used were: [(Total Peak Number + Peaks above 1% area) / (separation space – separated peaks)]^2 Separation space = run time – SUM(widths@baseline) Separated peaks = Total peak number * AVG(width@baseline)
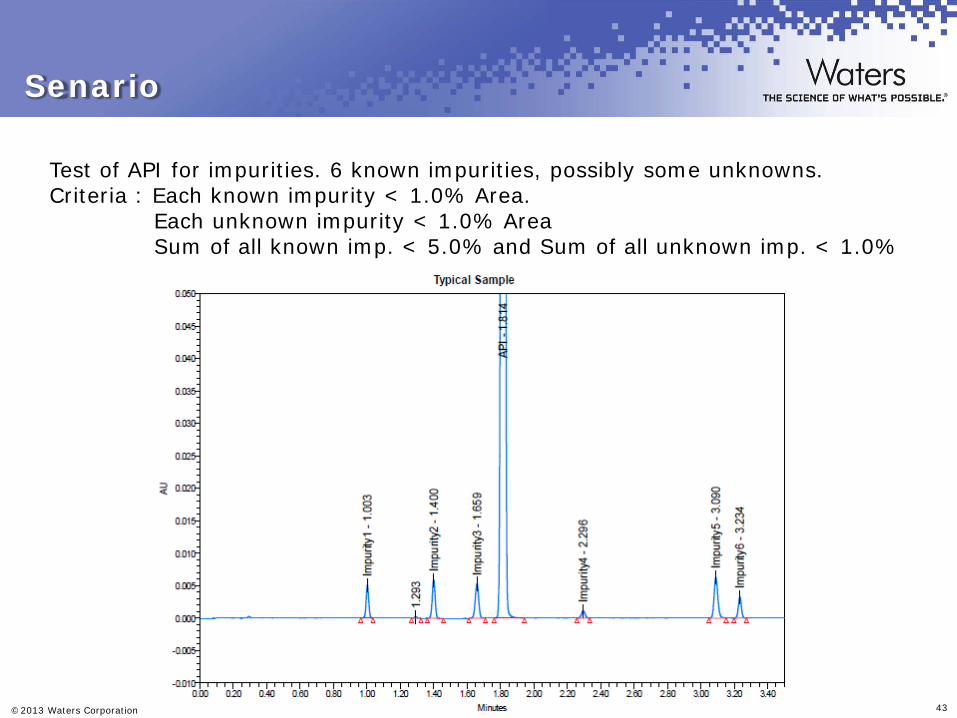
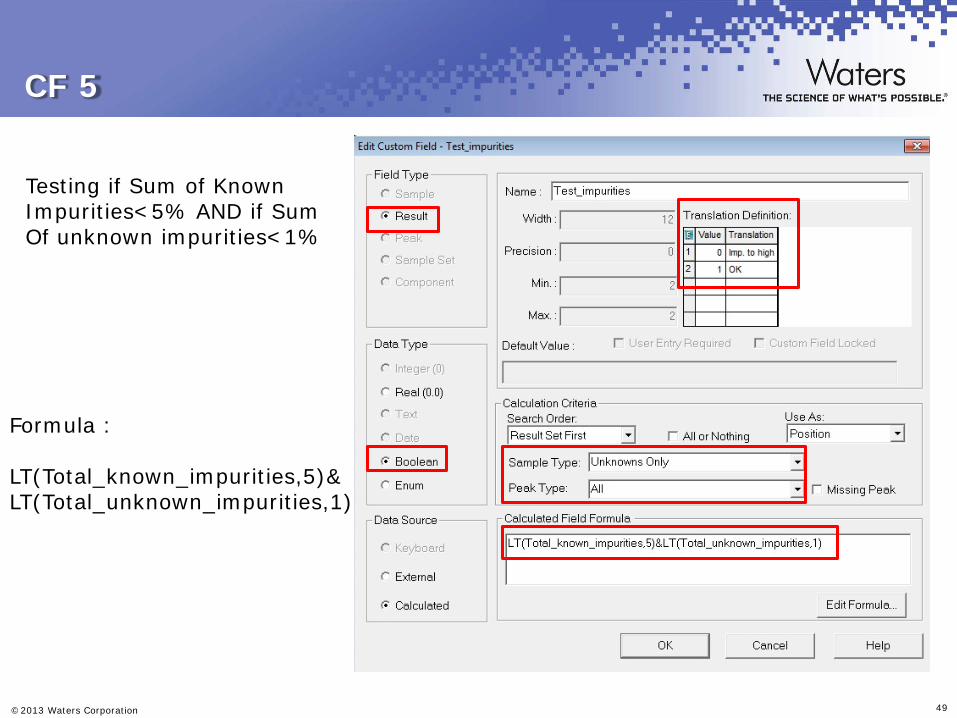
Test of API for impurities. 6 known impurities, possibly some unknowns. Criteria : Each known impurity < 1.0% Area. Each unknown impurity < 1.0% Area Sum of all known imp. < 5.0% and Sum of all unknown imp. < 1.0%