Embed Size (px)
Citation preview
Buck et al | http://dx.doi.org/10.5942/jawwa.2012.104.0054Journal - American Water Works AssociationPeer-Reviewed
E231
2012 © American Water Works Association
It is estimated that by the year 2050, 4 billion people will live in countries that are chronically short of water (Callison, 2010). It is becoming more difficult to provide an adequate supply of potable water as well as more expensive to supply water that is safe for drinking. If procuring more water is not possible or feasible, another way to provide for future demands is through conservation. Accurate metering of customer water use has the potential to improve conservation by both detecting real water loss from leaks as well as encouraging responsible water use. According to AWWA, “Accurate water measurement is the means by which water utilities produce revenue to cover expenses, charge each customer equitably, prevent waste of water and minimize the load on wastewater facilities. This con-cept is universally accepted today, but it took thousands of years for the science of water supply and distribution to reach its present state” (AWWA, 1999).
Little research has been accomplished to understand the effects of particulates on meter accuracy, yet it is generally understood that particulates can have a detrimental effect on mechanical meters. It is common for particulates to be found in municipal water supply systems. The particulates can be intro-duced in a variety of ways, including during installation of new meters or pipes, during repair of damaged pipes, or in some instances particulates can be entrained in the flow (NRC, 2006). Particulates in the flow may also come from the source water, the treatment plant, or household plumbing (Booth et al, 2005). There have been several case studies performed using pulled meters where it was difficult to differentiate among the effects
caused by particulates, time, or throughput (Arregui et al, 2003). In addition to being detrimental to accurate metering, particulates may pose a hazard to human health and may be an indicator of the integrity of the water delivery system. Under-standing how meters respond to particulates is not only useful for new meter selection, but may also be useful for determining the optimal meter replacement interval.
EXPERIMENTal METhodSBecause of the lack of published information related to meter-
ing water with particulates and meter degradation caused by particulates, a study was conducted at the Utah Water Research Laboratory at Utah State University to investigate the effects of throughput and particulates on the accuracy of various types of commercially available residential flow meters. Identical sets of three 5/8- × ¾-in. meters from various manufacturers were pur-chased for this experiment for a total of 75 meters. The following number and types of meters were tested during this study: 12 single jet, 21 multijet, 24 displacement piston, 15 nutating disc, and 3 fluidic oscillator.
New meters were tested for baseline accuracy at four flow rates (0.25, 1, 2, and 15 gpm). These same four flow rates were used for registry accuracy of the meters throughout the experiment. Each meter was tested three times at the flow rates indicated by the manufacturer, and the average of the three tests was consid-ered the accuracy of the new meter. After new-condition meter testing or baseline testing was complete, 2.5 g of quartzite sand was introduced immediately upstream of each meter at a flow
Many factors can influence the accuracy of water meters, including age, throughput, water quality, and the presence of particulates in the metered water. These factors can affect various types of meters quite differently depending on the meter’s design. This article examines the effects of particulates on various types of meters over their estimated life in a controlled environment. The intent of this study was to assess the effect of particulates on new meter performance and identify trends that may typify meter performance and longevity after
being subjected to a slug of particulates. Oscillating-piston (displacement-piston) meters were most affected by a slug of sand and multijet and fluidic-oscillator meters were best able to tolerate the sand. Nutating-disc and single-jet meters performed better than the oscillating-piston meters but not as well as the multijet or fluidic-oscillator meters. The findings of this study will benefit meter manufacturers, those who manage meter replacement programs, users, and those interested in metering water that contains particulates.
Effects of particulates on water meter accuracy through expected life
B. SkylEr Buck, 1 MichaEl c. JohnSon, 2 and StEvEn l . BarfuSS 2
1Gannett Fleming, Camp Hill, Pa.2Utah Water Research Laboratory, Utah State University, Logan
KEywoRdS: accuracy, conservation, durability, metering, particulates, performance

Buck et al | http://dx.doi.org/10.5942/jawwa.2012.104.0054Journal - American Water Works AssociationPeer-Reviewed
E232
2012 © American Water Works Association
rate of 10 gpm. That amount of dry sand is approximately the amount that can be held when pinched between the index finger and thumb. Ten minutes after the introduction of the sand par-ticulates, the flow rate was increased to 15 gpm in order to flush out any loose sand from the meter and pipe system. Quartzite sand was selected for the sand-slug test because it is found in many areas, it can be used by other researchers for replication and validation, and it most closely resembles the sand particles that are commonly found inside pulled meters. Table 1 contains the sieve analysis for the quartzite sand used in this study.
After the sand-slug injection, the meters were tested again at the flow rates indicated to identify the immediate effect of the particulates on meter accuracy. The meters were then subjected in the laboratory to full-life throughput, being tested for accuracy at 25, 50, 75, and 100% of the calculated full-life throughput. The full-life throughput of the 5/8- × ¾-in. meter size was calcu-lated using the following assumptions:
• 100 gpd/person (indoor use only)• 4 people/household• 100 gpd/person × 4 people × 365 days/year × 15 years = 2.19
mil gal (rounded to 2 mil gal)
To achieve the target flow rates, a magnetic flow meter was used to roughly set the flow, then the flow rate was fine-tuned to the precise flow desired using stopwatches and gravimetric scales. Figure 1 shows a schematic of the test apparatus. The temperature of the water was recorded and was used in the calculation flow volumes from the net weight of water collected. The registry accuracy of the meters was established by dividing the meter reading by the actual volume of water that passed through the meters and was collected using the gravimetric tanks. A minimum of 10 gal was collected for each run (except the highest flow in which 100 gal was collected), resulting in a maximum collection time of 40 min.
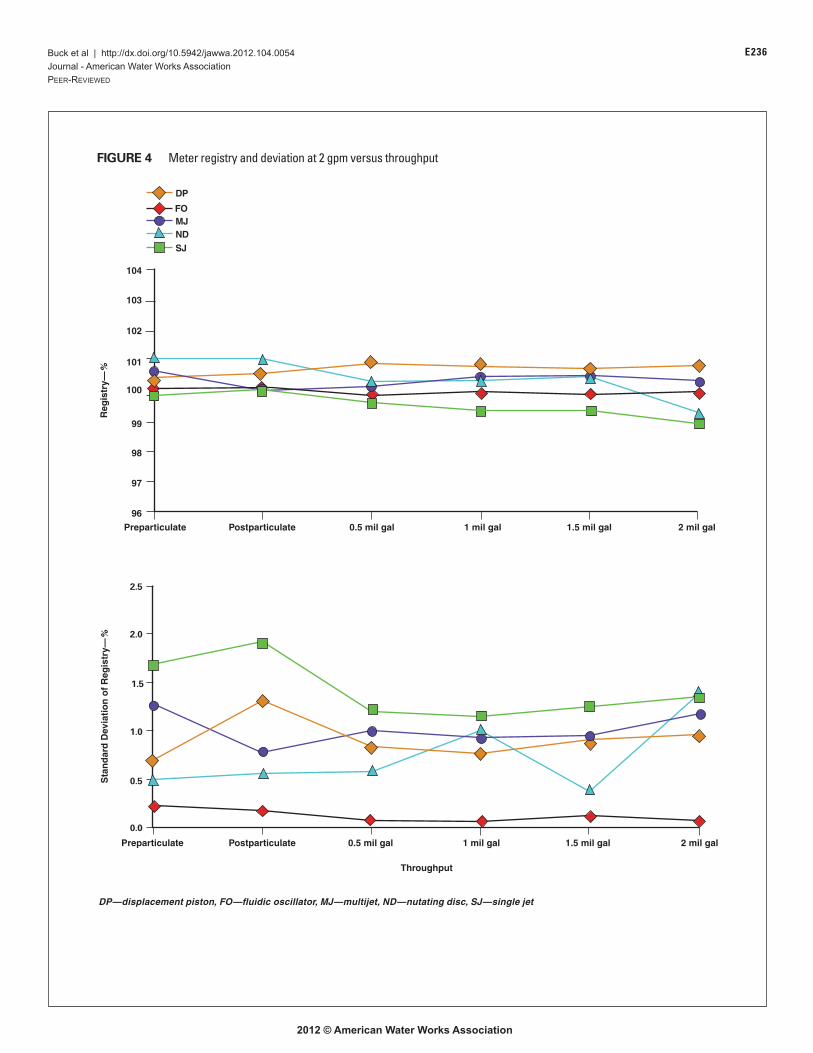
RESUlTSFigures 2–5 show the registry and standard deviation of the
registry at specified throughputs: preparticulate 0-life, post-particulate, and at throughputs of 0.5, 1, 1.5, and 2 mil gal. The presentation of the results in this manner shows specifically what happened to registry versus throughput for each meter type. The average registry accuracy of each meter was generally within the AWWA guidelines for that particular type; however, this was not true of the individual meters. The standard deviation of the reg-istry for the new meters is shown to illustrate the variability of registry associated with each meter type.
dISCUSSIoNThe primary objective of this study was to assess the reg-
istry performance of various meter types when they were subjected to a burst of quartzite sand and then operated to simulate the expected service life. The results of this study provide performance information for several meter designs that were available at the time of the study and used three identical meters of each type. Although it would be better to use more identical meters of a specific type, it was not eco-nomically feasible to do so. However, using three identical meters significantly improved the confidence in the results for a specific meter type. The research was used to identify general trends of particulates on meter performance and how the various types of meters were affected. Additionally, the
Supply
Meters being testedRegulating valve
Gravimetric tank
Scale
FIGURE 1 Gravimetric bench schematic
Table 1 Sieve analysis for the quartzite sand slug
Sieve NumberOpening Size
mmSoil Retained
gSieve Fineness
%
16 1.180 0.181 99.93
20 0.850 3.916 98.34
30 0.600 12.052 93.47
40 0.425 55.409 71.05
50 0.300 77.914 39.53
60 0.250 34.697 25.49
80 0.180 33.192 12.07
100 0.150 13.464 6.62
140 0.106 10.503 2.37
200 0.075 4.537 0.53
< 200 < 0.075 1.321 0.00

Buck et al | http://dx.doi.org/10.5942/jawwa.2012.104.0054Journal - American Water Works AssociationPeer-Reviewed
E233
2012 © American Water Works Association
research provided inspection of the meters to assess any dam-age caused by particulates and whether the damage was cor-related to the registry accuracy.
The way in which the damage caused by the quartzite sand affected meter registry was dependent on the type of meter and, more important, on where the damage was incurred. For exam-ple, the photograph above at the left shows a displacement-piston meter with considerable scarring although it had no noted effect on registry for the AWWA requirement at full life (0.25 gpm—100.26%, 2 gpm—100.43%, and 15 gpm—99.95%). In general the multijet meters performed well, having a relatively accurate registry and low deviation. However, if the bearings are damaged by particulates, as shown in the photo-graph above on the right, it can have a significant effect on performance (0.25 gpm—0.1%, 2 gpm—98.15%, and 15 gpm—99.66%). These results were not typical for this study but are simply used to illustrate that chamber or surface scar-ring is much less detrimental to accuracy than bearing wear that may be induced by particulates. Notably, the multijet meter’s intermediate and higher flow rates were not affected as severely as the low flow rate. This is principally the result of increased bearing friction caused by degradation related to particulate damage or unbalanced loading of the rotor that can result if the screen becomes partially plugged with particulates.
This study indicated that the displacement-piston meter was most affected by the quartzite sand slug as opposed to the other meter types. However, displacement-piston meters also showed increased registry accuracy between the postparticulate testing of 0-life and half-life and then they showed diminished registry accuracy. This conclusion could be somewhat misleading because most of the error and variability came from one meter type from a single manufacturer. Figures 6–9 show the same results as Fig-
ures 2–5 but with the three displacement-piston meters supplied by the manufacturer noted previously removed from the results.
This phenomenon of a particular type of meter from a single manufacturer not performing as well as meters of the same type from other manufacturers was not uncommon in this study. The significant drop in displacement-piston meter registry (with the single manufacturer removed) after the introduction of particu-lates followed by a significant registry increase at 0.5–2 mil gal of throughput indicates that most displacement-piston meters may be affected initially by particulates but then recover with additional throughput.
This study indicates that the multijet and fluidic-oscillator meters were best able to tolerate the effects of sand passing through them over the course of a full life cycle. This finding makes sense because fluidic-oscillator meters have no moving parts, and the multijet meters are an inferential meter and have an open design that facilitates particulate passage. The single-jet type is also an inferential meter with an open design; however, its performance was significantly diminished after 1 mil gal of throughput at the highest flow.
The way in which meters respond to particulates is not only a function of meter type, but also is affected by the manufac-turer’s specific design. The fact that it is not uncommon for particulates to be introduced into distribution pipes could have some effect on meter requirements in the future (NRC, 2006; Booth et al, 2005). For this reason, it would be useful to have guidelines that meters are required to meet with respect to par-ticulate passage and registry.
Wear to the lower bearing (indicated by the arrow) on this multijet meter
shows the type of damage that can affect meter accuracy.
A displacement piston used in this study shows evidence of meter chamber
scarring resulting from quartzite sand. This type of wear is not typically
detrimental to the accuracy of the meter.

Buck et al | http://dx.doi.org/10.5942/jawwa.2012.104.0054Journal - American Water Works AssociationPeer-Reviewed
E234
2012 © American Water Works Association
Buck et al | http://dx.doi.org/10.5942/jawwa.2012.104.0054Journal - American Water Works AssociationPeer-Reviewed
105
100
95
90
85
80
Preparticulate Postparticulate 0.5 mil gal 1 mil gal 1.5 mil gal 2 mil gal
Reg
istr
y—%
Preparticulate Postparticulate 0.5 mil gal 1 mil gal 1.5 mil gal 2 mil gal
35
30
25
20
15
10
5
0
Sta
nd
ard
Dev
iati
on
of
Reg
istr
y—%
Throughput
FIGURE 2 Meter registry and deviation at 0.25 gpm versus throughput
DP—displacement piston, FO—fluidic oscillator, MJ—multijet, ND—nutating disc, SJ—single jet
DP
FOMJNDSJ

Buck et al | http://dx.doi.org/10.5942/jawwa.2012.104.0054Journal - American Water Works AssociationPeer-Reviewed
E235
2012 © American Water Works Association
DP
FOMJNDSJ
Preparticulate Postparticulate 0.5 mil gal 1 mil gal 1.5 mil gal 2 mil gal
104
103
102
101
100
99
98
97
96
Reg
istr
y—%
14
12
10
8
6
4
2
0
Preparticulate Postparticulate 0.5 mil gal 1 mil gal 1.5 mil gal 2 mil gal
Sta
nd
ard
Dev
iati
on
of
Reg
istr
y—%
DP—displacement piston, FO—fluidic oscillator, MJ—multijet, ND—nutating disc, SJ—single jet
FIGURE 3 Meter registry and deviation at 1 gpm versus throughput
Throughput
Buck et al | http://dx.doi.org/10.5942/jawwa.2012.104.0054Journal - American Water Works AssociationPeer-Reviewed
E236
2012 © American Water Works Association
Preparticulate Postparticulate 0.5 mil gal 1 mil gal 1.5 mil gal 2 mil gal
104
103
102
101
100
99
98
97
96
Reg
istr
y—%
DP
FOMJNDSJ
FIGURE 4 Meter registry and deviation at 2 gpm versus throughput
DP—displacement piston, FO—fluidic oscillator, MJ—multijet, ND—nutating disc, SJ—single jet
2.5
2.0
1.5
1.0
0.5
0.0
Sta
nd
ard
Dev
iati
on
of
Reg
istr
y—%
Preparticulate Postparticulate 0.5 mil gal 1 mil gal 1.5 mil gal 2 mil gal
Throughput

Buck et al | http://dx.doi.org/10.5942/jawwa.2012.104.0054Journal - American Water Works AssociationPeer-Reviewed
E237
2012 © American Water Works Association
DP
FOMJNDSJ
105
100
95
90
85
80
Preparticulate Postparticulate 0.5 mil gal 1 mil gal 1.5 mil gal 2 mil gal
Reg
istr
y—%
Sta
nd
ard
Dev
iati
on
of
Reg
istr
y—%
40
35
30
25
20
15
10
5
0
Preparticulate Postparticulate 0.5 mil gal 1 mil gal 1.5 mil gal 2 mil gal
FIGURE 5 Meter registry and deviation at 15 gpm versus throughput
DP—displacement piston, FO—fluidic oscillator, MJ—multijet, ND—nutating disc, SJ—single jet
Throughput

Buck et al | http://dx.doi.org/10.5942/jawwa.2012.104.0054Journal - American Water Works AssociationPeer-Reviewed
E238
2012 © American Water Works Association
105
100
95
90
85
80
Preparticulate Postparticulate 0.5 mil gal 1 mil gal 1.5 mil gal 2 mil gal
Preparticulate Postparticulate 0.5 mil gal 1 mil gal 1.5 mil gal 2 mil gal
35
30
25
20
15
10
5
0
Reg
istr
y—%
Sta
nd
ard
Dev
iati
on
of
Reg
istr
y—%
Throughput
FIGURE 6 Registry and deviation at 0.25 gpm versus throughput with three displacement-piston meters from one manufacturer removed
DP—displacement piston, FO—fluidic oscillator, MJ—multijet, ND—nutating disc, SJ—single jet
DP
FOMJNDSJ

Buck et al | http://dx.doi.org/10.5942/jawwa.2012.104.0054Journal - American Water Works AssociationPeer-Reviewed
E239
2012 © American Water Works Association
104
103
102
101
100
99
98
97
96
3
2
1
0
Preparticulate Postparticulate 0.5 mil gal 1 mil gal 1.5 mil gal 2 mil gal
Preparticulate Postparticulate 0.5 mil gal 1 mil gal 1.5 mil gal 2 mil gal
DP
FOMJNDSJ
Reg
istr
y—%
Sta
nd
ard
Dev
iati
on
of
Reg
istr
y—%
DP—displacement piston, FO—fluidic oscillator, MJ—multijet, ND—nutating disc, SJ—single jet
FIGURE 7 Registry and deviation at 1 gpm versus throughput with three displacement-piston meters from one manufacturer removed
Throughput

Buck et al | http://dx.doi.org/10.5942/jawwa.2012.104.0054Journal - American Water Works AssociationPeer-Reviewed
E240
2012 © American Water Works Association
Preparticulate Postparticulate 0.5 mil gal 1 mil gal 1.5 mil gal 2 mil gal
DP
FOMJNDSJ
Preparticulate Postparticulate 0.5 mil gal 1 mil gal 1.5 mil gal 2 mil gal
104
103
102
101
100
99
98
97
96
3
2
1
0
Reg
istr
y—%
Sta
nd
ard
Dev
iati
on
of
Reg
istr
y—%
DP—displacement piston, FO—fluidic oscillator, MJ—multijet, ND—nutating disc, SJ—single jet
FIGURE 8 Registry and deviation at 2 gpm versus throughput with three displacement-piston meters from one manufacturer removed
Throughput

Buck et al | http://dx.doi.org/10.5942/jawwa.2012.104.0054Journal - American Water Works AssociationPeer-Reviewed
E241
2012 © American Water Works Association
105
100
95
90
85
80
Preparticulate Postparticulate 0.5 mil gal 1 mil gal 1.5 mil gal 2 mil gal
Preparticulate Postparticulate 0.5 mil gal 1 mil gal 1.5 mil gal 2 mil gal
Reg
istr
y—%
Sta
nd
ard
Dev
iati
on
of
Reg
istr
y—%
40
35
30
25
20
15
10
5
0
DP
FOMJNDSJ
Throughput
FIGURE 9 Registry and deviation at 15 gpm versus throughput with three displacement-piston meters from one manufacturer removed
DP—displacement piston, FO—fluidic oscillator, MJ—multijet, ND—nutating disc, SJ—single jet

Buck et al | http://dx.doi.org/10.5942/jawwa.2012.104.0054Journal - American Water Works AssociationPeer-Reviewed
E242
2012 © American Water Works Association
aboUT ThE aUThoRSB. Skyler Buck is a hydraulic and hydrologic designer in the Dams and Hydraulics Division at Gannett Fleming in Camp Hill, Pa. At the time of this study, he was a research assistant at the Utah Water Research Laboratory at Utah State University in Logan, where he received his master’s degree in engineering. Michael C.
Johnson (to whom correspondence should be addressed) is a research associate professor at the Utah Water Research Laboratory at Utah State University, 8200 Old Main Hill, Logan, UT 84322; [email protected]. Steven L. Barfuss is a research associate professor at the Utah Water Research Laboratory.
PEER REvIEwDate of submission: 05/17/2011Date of acceptance: 02/09/2012
REFERENCESArregui, F.; Cabrera Jr., E.; Cobacho, R.; & García-Serra, J., 2003. Evaluating
Domestic Water Meter Accuracy. A Case Study. Intl. Conf. Pumps, Electromechanical Devices and Systems Applied to Urban Water Management (PEDS), Valencia, Spain.
AWWA, 1999. Manual M6, Water Meters—Selection, Installation, Testing, and Maintenance. Denver.
Barfuss, S.L.; Johnson, M.C.; & Nielsen, M.A., 2011. Accuracy of In-Service Flow Meters at High and Low Flow Rates. Water Res. Fdn. and US Environmental Protection Agency, Denver.
Booth, S. & Brazos, B., 2005. Qualitative Procedures for Identifying Particles in Drinking Water. Awwa Res. Fdn., Denver.
Callison, K., 2010. Securing Fluid Resources for Geothermal Projects in a World of Water Scarcity. Energies, 3:1485:1998. http://dx.doi.org/10.3390/en3081485.
Neilsen, M.A.; Barfuss, S.L.; & Johnson, M.C., 2011. Off-the-shelf Accuracies of Residential Water Meters. Jour. AWWA, 103:9:48.
NRC (National Research Council), 2006. Drinking Water Distribution Systems—Assessing and Reducing Risks. National Academies Press, Washington.