Embed Size (px)
Citation preview

MEMORANDUM
DATE January 24, 2014 TO Efi Pagitsas, Traffic Analysis and Design Group Manager, MPO Staff FROM Beth Isler, Bicycle/Pedestrian Coordinator and Livability Program
Manager, MPO Staff RE 2013 Bicycle and Pedestrian Data Collection
This memorandum summarizes the results of the 2013 bicycle and pedestrian count program.
1 INTRODUCTION
The Boston Region Metropolitan Planning Organization (MPO) collects data about the number of people who are biking and walking at locations throughout the region. The data are used to evaluate long-term volume trends, estimate bicycle and pedestrian demand, and assess changes in usage before and after projects are implemented. This information helps transportation planners and government officials make decisions for bicycle and pedestrian programs and projects, including project prioritization and funding allocation. It also helps to justify investment in bicycle and pedestrian facilities as an integral component of the region’s transportation network.
Although the MPO organizes counts only for the Boston region, it serves as a repository for counts gathered from throughout the state. Counts are generally collected by volunteers, municipalities, and other organizations and typically occur during the months of May, July, and September. The data are publicly available in the online Bicycle/Pedestrian Count Database, which can be accessed from the MPO’s website at www.bostonmpo.org.
2 METHODOLOGY
This section describes how the count data is currently collected in the Boston region. Data are gathered for both off- and on-street users. Off-street counts record walkers and bicyclists on trails or shared-use paths. On-street counts collect the numbers of
• pedestrians on sidewalks, • bicyclists riding on streets, and • bicyclists riding on sidewalks.
Data were collected in May, July and September of 2013 according to the recommendations of the National Bicycle and Pedestrian Documentation
State Transportation Building • Ten Park Plaza, Suite 2150 • Boston, MA 02116-3968 Tel. (617) 973-7100 • Fax (617) 973-8855 • TTY (617) 973-7089 • www.bostonmpo.org
Richard A. Davey, MassDOT Secretary and CEO and MPO ChairmanKarl H. Quackenbush, Executive Director, MPO Staff
BOSTON REGION METROPOLITAN PLANNING ORGANIZATIONBOSTON REGION
METRO
POLITAN PLANNING ORGAN
IZAT
IONMPO

Efi Pagitsas, MPO Staff 2 January 24, 2014
Project (NBPD), an Institute of Transportation Engineers (ITE)-sanctioned program.
3 RESULTS
In 2013, 47 counts were conducted at 20 locations around the state, as shown in Table 1.
TABLE 1 Locations Counted in 2013
Municipality Count Location Description
1 Bedford Minuteman Trail - Between South Road and Wiggins Ave 2 Cambridge Minuteman Trail - North of Route 2 / Alewife Station
3 Lexington Minuteman Trail - Lexington Depot / East of Hancock St / Meriam St / Station Way
4 Hudson Assabet River Trail - Rte 85 Crossing 5 Boston Southwest Corridor Trail - 100 ft North of Heath St 6 Cambridge Kendall Square - Broadway / Main St / 3rd St 7 Southwick Congamond Rd and Rte 168 Crossing 8 Arlington Minuteman Trail and Swan Place 9 Salisbury Old Eastern Marsh Trail and Friedenfels Street 10 Newburyport Clipper City Rail Trail at Washington Street 11 Bedford Great Rd at South Rd 12 Bedford Shawsheen Rd at Page Rd 13 Bedford Concord Rd at Mcmahon Rd 14 Methuen Methuen Rail Trail at Railroad St Parking Lot 15 Needham Kendrick St. and Hunting Rd
16 Westfield/ Southwick Columbia Greenway Rail Trail at Southwick Border
17 Amesbury Amesbury Riverwalk/Powwow Walk 18 Quincy Hancock Street at Washington Street 19 Quincy Neponset Bridge at Quincy Shore Drive 20 Quincy Wollaston Beach at 790 Quincy Shore Drive
Of these locations, 14 are within the Boston MPO region and the remaining six are outside of the region. Eight locations are on-street while the rest are trails or shared-use paths.
The hour during which the highest volumes were observed was determined for each location; these volumes are shown in Figure 1. For the majority of weekend counts, the highest hour volumes occurred during midday (consistent with the NBPD project guidelines); during the weekday counts the highest hour

Efi Pagitsas, MPO Staff 3 January 24, 2014
volumes occurred during the afternoon (PM). Historical data and analysis of each of location counted in 2013 is provided in Appendix (attached).
FIGURE 1 2013 Volumes during Hour of Highest Observed Usage
As shown, the Minuteman Bikeway has the highest volumes of all the locations counted in 2013. However, the greatest number of all-day counts took place at locations along the Minuteman Bikeway, ensuring that the peak hour was captured. Other locations that were only counted for a couple hours may not have been recording peak usage.
Of the 11 day-long counts, nine took place on the weekend and all were on trails. The weekend data are shown in Figure 2, and the weekday data are show in Figure 3. The weekend trail data likely reflect recreational rather than commuter use.
In Figure 2, there is no obvious reason for the unique data line shown for the Minuteman Bikeway at Lexington Depot on the Sunday in May. The most likely reason would be a change in weather, although without more data there is no way of knowing.

Efi Pagitsas, MPO Staff 4 January 24, 2014
FIGURE 2 2013 Weekend Day-Long Count Results
FIGURE 3
2013 Weekday Day-Long Count Results

Efi Pagitsas, MPO Staff 5 January 24, 2014
6 CONCLUSION
The MPO plans to continue collecting bicycle and pedestrian data in 2014. Developing a more robust data-collection program is essential in order to help inform bicycling and walking planning and project prioritization.
BI/bi
ATTACHMENTS
APPENDIX. Count Data

APPENDIX. COUNT DATA
A.1 BEDFORD: MINUTEMAN TRAIL — BETWEEN SOUTH RD AND WIGGINS AVE
TABLE 1 Peak Hour Volumes
FIGURE 1
12-Hour Counts
Month-Year Day Peak Hour Period VolumeSeptember 2007 Sa 4:30-5:30 PM 121May 2008 Sa 9:45-10:45 AM 96May 2008 Tu 12:15-1:15 MID 292July 2008 Sa 9:45-10:45 AM 289September 2008 Sa 3:00-4:00 PM 286May 2009 W 11:45-12:45 MID 198May 2009 Sa 12:15-1:15 MID 314September 2009 Su 2:30-3:30 MID 399September 2009 Tu 12:00-1:00 MID 187July 2010 Sa 10:00-11:00 AM 336July 2010 Tu 12:00-1:00 MID 131September 2010 Tu 12:00-1:00 MID 144May 2011 Sa 11:15-12:15 MID 253May 2011 Tu 7:30-8:30 AM 34July 2013 Sa 9:15-10:15 AM 210

Boston Region MPO 2 January 24, 2014
FIGURE 2 Weekday Peak Hour Volumes
FIGURE 3
Weekend Peak Hour Volumes

Boston Region MPO 3 January 24, 2014
A.2 CAMBRIDGE: MINUTEMAN TRAIL — NORTH OF ROUTE 2/ALEWIFE STATION
TABLE 2 Peak Hour Volumes
FIGURE 4
12-Hour Counts
Month-Year Day Peak Hour Period VolumeMay 2008 Tu 5:30-6:30 PM 664May 2008 Sa 10:15-11:15 MID 221July 2008 Sa 10:00-11:00 MID 230May 2009 Sa 3:15-4:15 PM 241July 2009 W 5:30-6:30 PM 465July 2009 Sa 10:30-11:30 MID 312May 2013 Tu 7:45-8:45 AM 676

Boston Region MPO 4 January 24, 2014
FIGURE 5 Weekday Peak Hour Volumes
FIGURE 6
Weekend Peak Hour Volumes

Boston Region MPO 5 January 24, 2014
A.3 LEXINGTON: MINUTEMAN TRAIL — LEXINGTON DEPOT/EAST OF HANCOCK ST/MERIAM ST/STATION WAY
TABLE 3 Peak Hour Volumes
Month-Year Day Peak Hour Period VolumeSeptember 1993 Tu 5:15-6:15 PM 124May 1994 M 2:00-3:00 MID 678July 1998 Sa 1:45-2:45 MID 431July 1998 Su 2:00-3:00 MID 648September 2007 Sa 9:30-10:30 AM 311May 2008 Sa 9:15-10:15 AM 153May 2008 Tu 6:00-7:00 PM 275May 2008 Sa 3:30-4:30 PM 408July 2008 Sa 9:15-10:15 AM 348July 2008 Tu 5:30-6:30 PM 334September 2008 Sa 2:00-3:00 MID 349May 2009 Sa 2:45-3:45 MID 338May 2009 Tu 5:30-6:30 PM 275September 2009 Sa 3:00-4:00 PM 397September 2009 Tu 5:30-6:30 PM 223May 2010 Sa 1:30-2:30 MID 495May 2010 Tu 9:15-10:15 AM 150September 2010 Sa 3:30-4:30 PM 462May 2012 Sa 2:45-3:45 MID 588September 2011 Sa 2:45-3:45 MID 487September 2011 Tu 5:30-6:30 PM 294September 2012 Th 5:45-6:45 PM 232September 2012 Sa 3:00-4:00 PM 462May 2012 Tu 12:15-1:15 MID 122May 2013 Tu 6:00-7:00 PM 333May 2013 Su 4:00-5:00 PM 557September 2013 Th 5:15-6:15 PM 177September 2013 Sa 10:15-11:15 MID 371

Boston Region MPO 6 January 24, 2014
FIGURE 7 12-Hour Weekend Counts
FIGURE 8
Weekday Peak Hour Volumes

Boston Region MPO 7 January 24, 2014
FIGURE 9 Weekend Peak Hour Volumes

Boston Region MPO 8 January 24, 2014
A.4 ARLINGTON: MINUTEMAN TRAIL AND SWAN PLACE
TABLE 4 Peak Hour Volumes
FIGURE 10
12-Hour Weekday Counts
Month-Year Day Peak Hour Period VolumeMay 2011 Sa 10:45-11:45 MID 314May 2011 Tu 5:45-6:45 PM 167July 2011 Tu 6:00-7:00 PM 243July 2012 Sa 11:00-12:00 MID 383July 2012 Tu 7:30-8:30 AM 246May 2013 Sa 9:45-10:45 AM 227May 2013 Tu 5:30-6:30 PM 320July 2013 Sa 3:15-4:15 PM 358July 2013 Tu 6:00-7:00 PM 294September 2013 Sa 9:45-10:45 MID 351

Boston Region MPO 9 January 24, 2014
FIGURE 11 Weekday Peak Hour Volumes
FIGURE 12
Weekend Peak Hour Volumes

Boston Region MPO 10 January 24, 2014
A.5 HUDSON: ASSABET RIVER TRAIL — RTE 85 CROSSING
TABLE 5 Peak Hour Volumes
Month-Year Day Peak Hour Period VolumeSeptember 2007 Sa 11:15-12:15 MID 70May 2008 Tu 6:15-7:15 PM 102July 2008 Sa 11:45-12:45 MID 58July 2008 Tu 12:30-1:30 MID 41September 2008 Sa 1:30-2:30 MID 61May 2009 Sa 2:15-3:15 MID 82May 2009 W 4:15-5:15 PM 59September 2009 Su 12:00-1:00 MID 107May 2010 Sa 10:45-11:45 MID 154May 2010 W 10:45-11:45 MID 66September 2010 Sa 1:45-2:45 MID 66July 2011 Sa 1:30-2:30 MID 115July 2011 Tu 9:00-10:00 AM 46July 2012 Sa 10:30-11:30 MID 80July 2012 Tu 9:00-10:00 AM 49September 2012 Sa 2:45-3:45 MID 114July 2013 Sa 10:30-11:30 MID 48July 2013 F 6:15-7:15 PM 33September 2013 Sa 10:30-11:30 MID 107

Boston Region MPO 11 January 24, 2014
FIGURE 13 Weekday Peak Hour Volumes
FIGURE 14
Weekend Peak Hour Volumes

Boston Region MPO 12 January 24, 2014
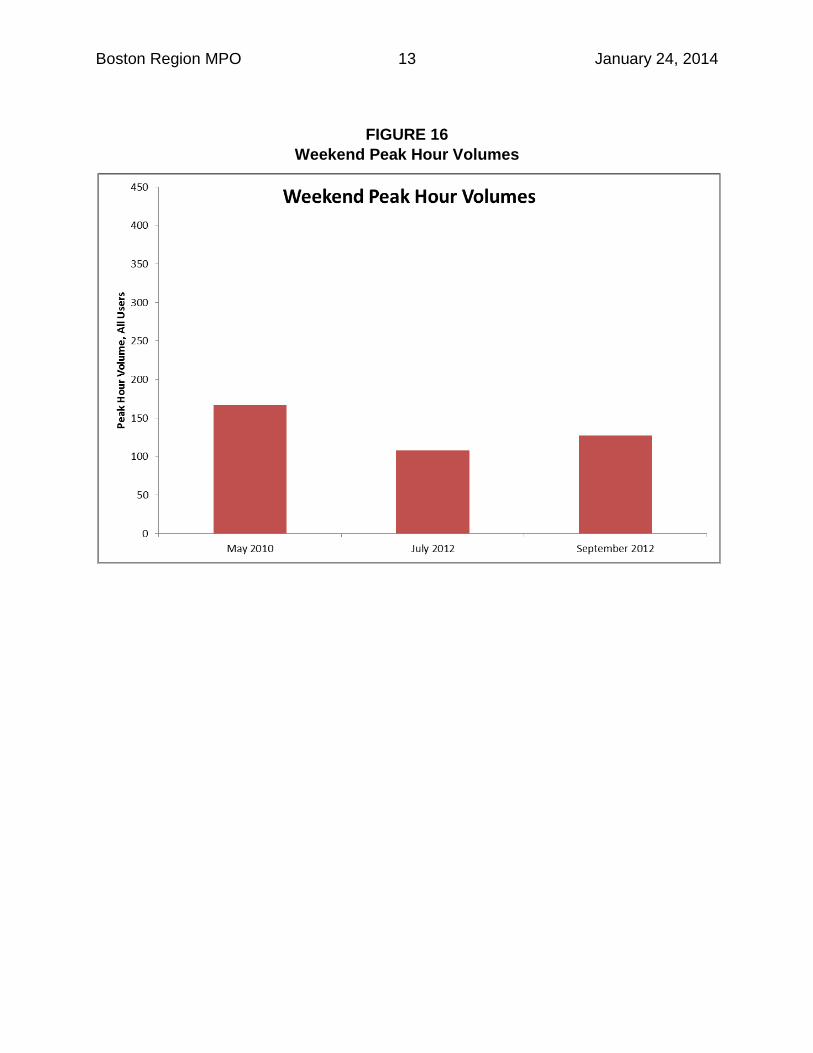
A.6 BOSTON: SOUTHWEST CORRIDOR TRAIL — 100 FT NORTH OF HEATH ST
TABLE 6 Peak Hour Volumes
FIGURE 15
Weekday Peak Hour Volumes
Month-Year Day Peak Hour Period VolumeMay 2005 Tu 8:30-9:30 AM 97May 2009 W 8:45-9:45 AM 175May 2010 Sa 1:00-2:00 MID 167May 2010 Tu 9:00-10:00 AM 199September 2010 Tu 6:15-7:15 PM 290July 2012 Th 5:45-6:45 PM 264July 2012 Sa 12:45-1:45 MID 108September 2012 W 5:45-6:45 PM 373September 2012 Th 5:45-6:45 PM 372September 2012 Sa 1:45-2:45 MID 127May 2013 W 5:45-6:45 PM 151May 2013 Th 8:45-9:45 AM 129
Boston Region MPO 13 January 24, 2014
FIGURE 16 Weekend Peak Hour Volumes

Boston Region MPO 14 January 24, 2014
A.7 CAMBRIDGE: KENDALL SQUARE — BROADWAY/MAIN ST/3RD ST
TABLE 7 Peak Hour Volumes
FIGURE 17
Peak Hour Bicycle Volumes
Day, Month-Year Peak Hour Period VolumeWeds, May 1976 9:45-10:45 AM 65Thurs, May 1981 5:15-6:15 PM 110Tues, May 1987 9:00-10:00 AM 141Weds, May 1992 9:15-10:15 AM 143Sat, July 2013 1:00-2:00 MID 69

Boston Region MPO 15 January 24, 2014
A.8 SOUTHWICK: SOUTHWICK RAIL TRAIL CONGAMOND RD & RTE 168 CROSSING
TABLE 8 Peak Hour Volumes
FIGURE 18
12-Hour Counts
Month-Year Day Peak Hour Period VolumeSeptember 2009 Su 11:30-12:30 MID 55May 2010 Sa 12:30-1:30 MID 86May 2010 Tu 9:15-10:15 AM 11July 2010 Sa 10:00-11:00 MID 79July 2011 Sa 10:45-11:45 MID 135September 2012 Tu 5:45-6:45 PM 82September 2012 Th 6:15-7:15 PM 91September 2012 Su 12:00-1:00 MID 227May 2013 Tu 5:45-6:45 PM 106May 2013 Th 4:45-5:45 PM 14May 2013 Su 1:30-2:30 MID 188September 2013 Sa 11:00-12:00 MID 141September 2013 Tu 4:00-5:00 PM 34

Boston Region MPO 16 January 24, 2014
FIGURE 19 Weekday Peak Hour Volumes
FIGURE 20
Weekend Peak Hour Volumes

Boston Region MPO 17 January 24, 2014
A.9 SALISBURY: OLD EASTERN MARSH TRAIL AND FRIEDENFELS STREET
TABLE 9 Peak Hour Volumes
FIGURE 21
12-Hour Counts
Month-Year Day Peak Hour Period VolumeMay 2011 Sa 8:45-9:45 AM 51May 2013 M 5:15-6:15 PM 40May 2013 Tu 5:30-6:30 PM 61May 2013 Sa 10:30-11:30 MID 56

Boston Region MPO 18 January 24, 2014
FIGURE 22 Weekday Peak Hour Volumes
FIGURE 23
Weekend Peak Hour Volumes

Boston Region MPO 19 January 24, 2014
A.10 NEWBURYPORT: CLIPPER CITY RAIL TRAIL AT WASHINGTON STREET
TABLE 10 Peak Hour Volumes
FIGURE 24
12-Hour Counts
Month-Year Day Peak Hour Period VolumeMay 2010 Tu 11:45-12:45 MID 62July 2013 Sa 10:15-11:15 MID 145July 2013 Su 4:00-5:00 PM 159

Boston Region MPO 20 January 24, 2014
FIGURE 25 Peak Hour Volumes

Boston Region MPO 21 January 24, 2014
A.11 BEDFORD: GREAT RD AT SOUTH RD; SHAWSHEEN RD AT PAGE RD; CONCORD RD AT MCMAHON RD
TABLE 11 Peak Hour Volumes
FIGURE 26
Weekday Peak Hour Bicycle Volumes
Location Month-Year Day Peak Hour Period Volume GREAT RD AT SOUTH RD September 2012 Tu 7:15-8:15 AM 17 GREAT RD AT SOUTH RD May 2013 M 7:15-8:15 AM 16 GREAT RD AT SOUTH RD May 2013 Tu 7:15-8:15 AM 25 SHAWSHEEN RD AT PAGE RD September 2012 W 7:30-8:30 AM 18 SHAWSHEEN RD AT PAGE RD May 2013 M 7:15-8:15 AM 6 CONCORD RD AT MCMAHON RD September 2012 W 7:30-8:30 AM 31 CONCORD RD AT MCMAHON RD May 2013 F 7:15-8:15 AM 15

Boston Region MPO 22 January 24, 2014
A.12 METHUEN: METHUEN RAIL TRAIL AT RAILROAD ST PARKING LOT
TABLE 12 Peak Hour Volumes
FIGURE 27
Weekday Peak Hour Volumes
Date Day Peak Hour Period Volume 07-MAY-2013 Tu 5:30-6:30 pm 17 09-MAY-2013 Th 4:45-5:45 pm 8 11-MAY-2013 Sa 2:00-3:00 mid 12

Boston Region MPO 23 January 24, 2014
FIGURE 28 Weekend Peak Hour Volumes

Boston Region MPO 24 January 24, 2014
A.13 NEEDHAM: KENDRICK ST AND HUNTING RD
TABLE 13 Peak Hour Volumes
FIGURE 29
Weekday Peak Hour Bicycle Volumes
Date Day Peak Hour Period Volume 07-JUL-2013 Su 9:45-10:45 AM 92 04-JUL-2013 Th 1:45-2:45 MID 37 05-JUL-2013 F 12:45-1:45 MID 16 06-JUL-2013 Sa 12:45-1:45 MID 27 11-AUG-2013 Su 9:00-10:00 AM 106 12-SEP-2013 Th 4:00-5:00 PM 62

Boston Region MPO 25 January 24, 2014
FIGURE 30 Weekend Peak Hour Bicycle Volumes

Boston Region MPO 26 January 24, 2014
A.14 WESTFIELD/SOUTHWICK: COLUMBIA GREENWAY RAIL TRAIL AT SOUTHWICK BORDER
TABLE 14 Peak Hour Volumes
FIGURE 31
12-Hour Counts
Date Day Peak Hour Period Volume 11-MAY-2013 Sa 12:00-1:00 MID 28 07-MAY-2013 Tu 5:30-6:30 PM 64 09-MAY-2013 Th 5:00-6:00 PM 15

Boston Region MPO 27 January 24, 2014
FIGURE 32 Weekday Peak Hour Volumes
FIGURE 33
Weekend Peak Hour Volumes

Boston Region MPO 28 January 24, 2014
A.15 AMESBURY: AMESBURY RIVERWALK/POWWOW WALK
TABLE 15 Peak Hour Volumes
FIGURE 34
Weekday Peak Hour Volumes
Date Day Peak Hour Period Volume 10-SEP-2013 Tu 4:15-5:15 PM 27

Boston Region MPO 29 January 24, 2014
A.16 QUINCY: HANCOCK ST AT WASHINGTON ST; NEPONSET BRIDGE AT QUINCY SHORE DRIVE; WOLLASTON BEACH AT 790 QUINCY SHORE DRIVE
TABLE 16 Peak Hour Volumes
FIGURE 35
Peak Hour Bicycle Volumes
Location Month-Year Day Peak Hour Period Volume HANCOCK STREET AT WASHINGTON STREET September 2013 W 4:00-5:00 PM 17 NEPONSET BRIDGE AT QUINCY SHORE DRIVE September 2013 W 8:00-9:00 AM 18 WOLLASTON BEACH AT 790 QUINCY SHORE DRIVE September 2013 W 5:00-6:00 PM 16 NEPONSET BRIDGE AT QUINCY SHORE DRIVE September 2013 Sa 12:00-1:00 MID 13